
Submitted:
08 August 2023
Posted:
09 August 2023
You are already at the latest version
Abstract
As the need to minimize environmental impact continues to rise, it is essential to incorporate, advance, and adopt renewable energy sources and materials to attain climate neutrality. It is established that economic growth is built upon infrastructure where cement industry plays a crucial role. However, it is also known that this industry is actively looking for ways to transition towards low-carbon practices to encourage sustainable and environmentally conscious practices. To this end, the use of refused derived fuels to substitute fossil fuels is very appealing, as these present the potential to lower the clinker production costs and CO2 emissions. Bearing this in mind, the primary objective of this work is to gain insights of the combustion behavior in an industrial rotary kiln, studying real-life scenarios and assessing the potential of substituting alternative fuels for fossil fuels to reduce CO2 emissions. A 3D CFD turbulent combustion model was formulated in Ansys® considering a Pillard NOVAFLAM® burner, where refused derived and petcoke fuels were used and different secondary air mass flows were considered. From the obtained results it was possible to conclude that the outcome of the combustion process is greatly influenced by the fuel-to-air ratio. Increasing the secondary air mass flow promotes the occurrence of a complete and efficient combustion process, leading to an enhanced fuel conversion and decreased formation of pollutants as CO, soot, and unburnt hydrocarbons.
Keywords:
CFD
; Combustion
; burners
; Clinkerization
; CO2.
1. Introduction
The current global population and technological advancements have created a pressing need for a sustainable society, where green economy plays a key role [1]. In response to the growing demand for reducing environmental impact, it has become imperative to integrate, innovate, and embrace renewable sources of energy and materials to achieve climate neutrality. Achieving climate neutrality means creating a balance between greenhouse gas emissions and their removal, primarily by reducing emissions, advancing sustainable technologies, and preserving natural ecosystems [2]. Since the foundation of economic growth is built upon infrastructure, the cement industry plays here a crucial role [1]. However, producing cement clinker is energetically intensive and poses as a significant contributor to CO2 emissions worldwide, but it is known that the industry is proactively pursuing ways to transition towards low-carbon practices to promote sustainable and environmentally conscious practices [3,4]. Additionally, the use of refused derived fuels (RDF) to substitute fossil fuels is also very appealing in cement industry, as these present the potential to lower the clinker production costs and CO2 emissions [5,6,7]. The use of RDF fuels in cement industry is actually a common practice since 1980’s. It was introduced to fight the large costs inherent to the first oil crisis and is considered ever since an efficient way of boosting industry decarbonization [3].
The increase in waste generation coupled with the inadequate management strategies currently employed mean that the co-processing of waste as an alternative fuel in cement plants offers significant advantages by avoiding landfills [3,5,8,9].
However, RDF fuels are difficult to handle due to their variable physical and chemical properties, such as density, homogeneity, moisture content and composition and, for that reason, can greatly affect the combustion behavior within a cement rotary kiln [3]. For instance, high-density particles tend to exhibit lower suspension capacities in a gas flow, implying a change in their trajectory and residence time in open flames [10]. This behavior can significantly affect particles’ burnout and, if a particle is left unburnt, it may deposit onto the clinker being produced and reduce its quality [11].
Conducting experiments in industrial facilities can be prohibitively expensive, underlining the extreme importance of modeling to simulate and optimize processes before implementing them in a real-world setting, especially using computational fluid dynamics (CFD) [10,11,12]. Some authors have used CFD modeling to predict the combustion behavior using alternative fuels, in industrial cement rotary kilns in terms of flame temperature, flow velocity, flame stability, fuel and oxidant composition, emissions and calcination reactions [7,10,11,13,14]. Liedman et al. [7] started to study the influence of operating conditions in cement rotary kilns by co-firing different mixtures of RDF and pulverized coal. The authors characterized experimentally the different constituents of RDF (2D foils, 3D plastics, paper and cardboard, textiles and fines) and studied their specific flight paths in an automated drop-shaft to obtain drag and lift coefficients and their correspondent fluctuations. With this preliminary study, the authors concluded that each type of particle fraction had different motion trajectories especially when compared to the ones of pulverized coal. Hence, it was stated that this phenomenon should be taken into consideration when modeling combustion. Later, Liedman et al. [10] continued their research and presented a simplified model approach that allow the prediction of the trajectory of each particle fraction and their combustion behavior separately. The authors concluded that the simplified model provided detailed information about each particle fraction trajectory and combustion. For the specific case of substituting 15% of the thermal heat using RDF a burnout of 83% was observed. Pieper et al. [11] studied the combustion behavior in an industrial rotary cement kiln using a mixture of pulverized coal and RDF. The authors used advanced CFD models to characterize the thermal conversion process of non-spherical RDF particles and complemented this study by coupling a simplified 1-D model to evaluate the heat and mass transfer between the clinker bed and the gas phase within the kiln. The authors concluded that having a mixture of 50% RDF with 50% lignite showed a combustion delay, a temperature increase in the direction of the fuels’ inlet and a temperature drop of 45K in the gas phase in the sintering zone. They also added that larger particles can be projected to the clinker bed or to the kiln walls showing different burnout behaviors, limiting the conversion degree to 68%. In a later work, Pieper et al. [13] extended their study to predict where were the regions inside the rotary kiln that exhibit coating layers from both RDF combustion and the clinker phase, i.e., adhesion of agglomerated particles that can decrease the process efficiency and clinker quality. The authors concluded that coating layers could decrease the residence time and the burnout of RDF particles during the gas phase being, thus, deposited unburnt in the clinker bed. The authors also stated that interaction mechanisms inside a rotary kiln are substantially more complex and that a validation of these results with the plant data is impractical, for obvious reasons. Nevertheless, predictions show good qualitative agreement when comparing these with observations made by cement plant operators. Ariyaratne et al. [14] performed 3D CFD simulations to predict the effect of fuel particle size and feeding in the combustion behavior within an industrial cement rotary kiln. The authors modeled independently different cases with the use of pulverized coal and meat and bone meal (MBM), using different excess air coefficients, fuel feeding rate and particle size distribution. The authors concluded that for the same thermal input, when coal is compared with MBM, the gas temperature is lower. This is expected due to the high content of moisture and ashes present in the MBM composition and, as a consequence, a slower devolatilization in the flame region. It was also added that combustion is more efficient for smaller particles since a higher burnout is reached.
It is well established that an industrial burner of a cement rotary kiln has different entries to receive the primary and the alternative fuels, in different states of matter [14,15,16,17]. Additionally, to achieve a self-sustained combustion, different air mass flows must be supplied (commonly, primary and pre-heated secondary air) [15,16]. Given the above, it is realizable that modeling is usually performed simplifying the geometry of the burner or the mixture of fuels,. Additionally, in most cases, only a 2D CFD turbulent combustion model is provided to describe the functioning inside the rotary kiln, which provides nonetheless significant information. However, in these cases, symmetry conditions are assumed when in real setups these do not occur. In a way of contributing to filling this gap, in the present work it will be performed a 3D CFD turbulent combustion model considering a Pillard NOVAFLAM® burner type, with multiple entries for different fuels and multiple entries for the primary air and secondary air, including swirl. The model will be formulated in Ansys® version 2022 R2, using blends of different fuels (petcoke and RDF), having as base case scenarios from an industrial cement rotary kiln. The main objective of this work will be to provide valuable knowledge about the combustion behavior occurring within the rotary kiln studying real case scenarios and, to take one step forward and evaluate how far it is possible to go with substituting alternative fuels with fossil fuels, to contribute to the mitigation of CO2 emissions. Predictions will provide information of temperature and velocity fields, flame length, position and temperature, emissions, major species devolatilization and volatiles combustion.
2. Materials and Methods
The fuels used for the simulation – and their respective properties – are presented in Table 1. These are divided into a fossil fuel, petcoke, and Refuse Derived Fuels (RDF) as the alternative one.
Kiln model geometry
Figure 1 shows the geometry of the burner and burner tip. The burner is focused on solid fuel combustion, with an annular inlet for fossil fuel (5), a larger central circular inlet for solid alternative fuels (6), and two smaller inlet nozzles for the igniter and liquid alternative fuels (7). Primary air can be seen through a combination of the outer circular inlets that feed in the axial air (1), immediately followed by the slots where radial air is fed (2). The solid alternative fuel inlet is also surrounded by small nozzles to improve the mixture of air and fuel prior to burning (4). Lastly, several small inlets constitute cooling air to prevent damage to the burner end plate (3).
Taking this geometry, the fluid volume within is extracted and combined, in order to produce a continuous solid, depicted in Figure 2. The cooling air nozzles were removed for simplification, as the amount of air injected is insignificant and does not impact flame shape.
Lastly, the kiln and burner geometries were combined with the clinker cooler hood, yielding the final simulated geometry, depicted in Figure 3. In addition to the specified burner inlets, on the right end of the geometry is the clinker cooler hood, where the preheated secondary air enters the system. The hot flue gases resulting from the combustion process then exit the domain at the leftmost boundary of the domain, which represents the boundary between the rotary kiln and the fume hood at the bottom of the preheater tower.
The volume was then discretized into a mesh, depicted in Figure 4.
The volume was processed in Fluent Meshing, yielding a mesh with 1.2 million cells and a minimum orthogonal quality of 0.2, making it adequate for CFD simulation. Figure 5 shows a cut along the kiln length. It shows a poly-hexcore mesh, with inflation near the walls and a body of influence (BOI) in the flame area. The body of influence is an important technique to improve resolution in critical areas, thus helping convergence while simultaneously keeping computational demands to an optimum value. In this case, the BOI increases the resolution in the flame area, where the complex combustion phenomena occur.
Turbulent combustion model
The turbulent flow field was modeled by employing the k-ω with shear stress transport (SST) model [18,19]. Radiative heat transfer was modeled using the Discrete Ordinates method [20,21], and the absorptivity of the flue gas mixture was modeled by the weighted-sum-of-gray-gases (WSSG) [22].
The combustion of solid fuels is a mixture of complex phenomena, with increasing complexity associated with multiple fuels. In the current model, fossil and alternative solid fuels were introduced as the main combustible species in the CFD domain. A Euler-Lagrange combined model was chosen to describe its behavior, where the gas phase is described by the Euler equations and the solid particles moving through the gas are described by the Lagrangian equation of motion. The two phases interact with each other, exchanging momentum, heat and mass.
The behavior of the discrete phase is defined by a series of physical-chemical processes that begin as soon as the particle enters the domain. Firstly, the particle is heated up by contact with the hot gases, releasing moisture in the form of water vapor. Then, a constant rate devolatilization kinetic law defines the rate of gaseous volatile component release from the particle, while simultaneously decreasing its diameter.
Fuel composition will thoroughly affect combustion performance and is obtained from a combination of ultimate and proximate analyses. These define each of the fuels as a combination of ash, volatile matter, fixed carbon and moisture.
The release of gaseous volatile components generates a model compound , whose subscripts are a result of the fuel analysis. Devolatilization was assumed to follow a constant rate model. Gas phase combustion follows the oxidation of the volatile model compound according to:
where the reaction rate is calculated between the minimum between the turbulent mixing rate () and the Arrhenius kinetic rate law (), as follows:
where is the pre-exponential factor, is the activation energy, is the concentration of reactant to the power of . The turbulent mixing rate is usually described by the Magnussen formula:
where A and B are the model coefficients and typically equal to 4 and 0.5, respectively. The overall reaction rate is chosen from the minimum value between the turbulent mixing rate and finite-rate Arrhenius kinetic.
The gaseous volatile component will then combust, generating the expected combustion products and pollutants, while an additional model governs soot formation and subsequent combustion.
Pollutant generation is also considered, namely SO2 derived from the fuels’ Sulphur content and NOX as a combined effect of fuel nitrogen and thermal mechanisms. The thermal NOx model is a postprocessing calculation performed after combustion, due to the low concentrations of NOx in the combustion system, which means that NOX chemistry usually presents a negligible effect on the flow field. It follows the extended Zeldovich mechanism, while simultaneously considering an N2O intermediate compound and interaction with turbulence and species [23].
The kinetic constants were for the reactions were obtained from a critical analysis of literature data published by Hanson and Salimian [24]. The net rate of formation of NO is given by the following equation:
Soot formation and combustion are solved by considering the one-step Khan and Greeves model [25], which details a single transport equation for the soot mas fraction, as follows:
where is the soot mass fraction, represents the turbulent Prandtl number for soot transport and represents the net rate of soot generation. The kinetics of soot combustion are given by the Magnussen and Hjertager model [26], according to:
where is a constant in the Magnussen model, are the mass fractions of oxidizer and fuel, and are the mass stoichiometries for soot and fuel combustion. Additionally, the rate of soot combustion is chosen as the minimum value obtained between and .
Finally, heat loss at the kiln walls is modeled by a combination of convection and radiation boundary conditions.
Tested scenarios
The CFD simulations performed for the kiln system are based on the principle of diagnosing the baseline operating conditions and attempting their optimization through fine-tuning operational parameters. Preliminary results suggest that there is not enough oxygen available for combustion in a critical area of the kiln (sintering zone), which prevents complete combustion from occurring. These preliminary results will be validated by simulation.
In order to attempt optimization of the solid fuel combustion, the mass flowrate of secondary air was slightly increased to better aerate the oxygen-deprived flame. Fuel composition and all other relevant parameters were kept constant, with the purpose of isolating the effect of the additional secondary air mass flowrate.
3. Results and Discussion
As previously mentioned, two case scenarios were simulated for the combustion process of petcoke and RDF within a rotary cement kiln.
Temperature and velocity profiles
Figure 6, Figure 7 and Figure 9 show the temperature and velocity average values and axial distribution fields along the rotary kiln, respectively. Since the axial distribution profiles are not easy to distinguish, Figure 8 and 10 show the absolute difference between the two case scenarios for temperature and velocity axial distribution, respectively, highlighting their main differences.
Figure 6a shows that overall, the temperature profile reaches slightly lower values when the secondary air mass flow rate increases. However, the temperature difference is not significant between the two cases, showing a maximum absolute difference of 74 ºC, at -65m that corresponds to a deviation of 3.9% and 3.8% from the maximum temperature for the baseline and optimization case scenarios, respectively. Additionally, due to the higher secondary mass flow selected for the combustion optimization the maximum temperature location is reached with a marginal delay of 0.7m (correspondent to 0.9% of the kiln length), at -53m. Hence, it can be considered that the combustion process was not negatively affected. Observing Figure 7 and Figure 8 it is possible to identify the body of the flames in the two case scenarios and the absolute difference between them, respectively. The area that denotes a higher temperature absolute difference intensity is observed between -73m and -55m, which corresponds to the main body of the flame location and kiln walls. Similar temperature trends were observed in the works of Liedmann et al. [7], Pieper et al. [11] and Huang et al. [12].
Figure 6b shows that, as expected, the velocity profile reaches higher values when the secondary air mass flow rate increases, being the maximum absolute difference of 2.85m/s located at -74m. The flow velocity for both scenarios stabilizes to some degree at approximately -65m having small oscillations between 6m/s and 8m/s. Observing Figure 9 it is possible to identify that the flow reaches higher velocities in the area where the flame is located (higher temperature location) for the two case scenarios. Similar to Figure 8, Figure 10 denotes that the higher flow velocity absolute difference intensity is observed also between -75m and -55m which, showing a higher difference located in the center of the flame and kiln walls. Similar flow velocity trends were also observed in previous works [7,11,12].
Figure 9.
Baseline and optimization attempt case scenarios for velocities (a1, a2) axial distribution fields along the rotary kiln, respectively.
Figure 9.
Baseline and optimization attempt case scenarios for velocities (a1, a2) axial distribution fields along the rotary kiln, respectively.
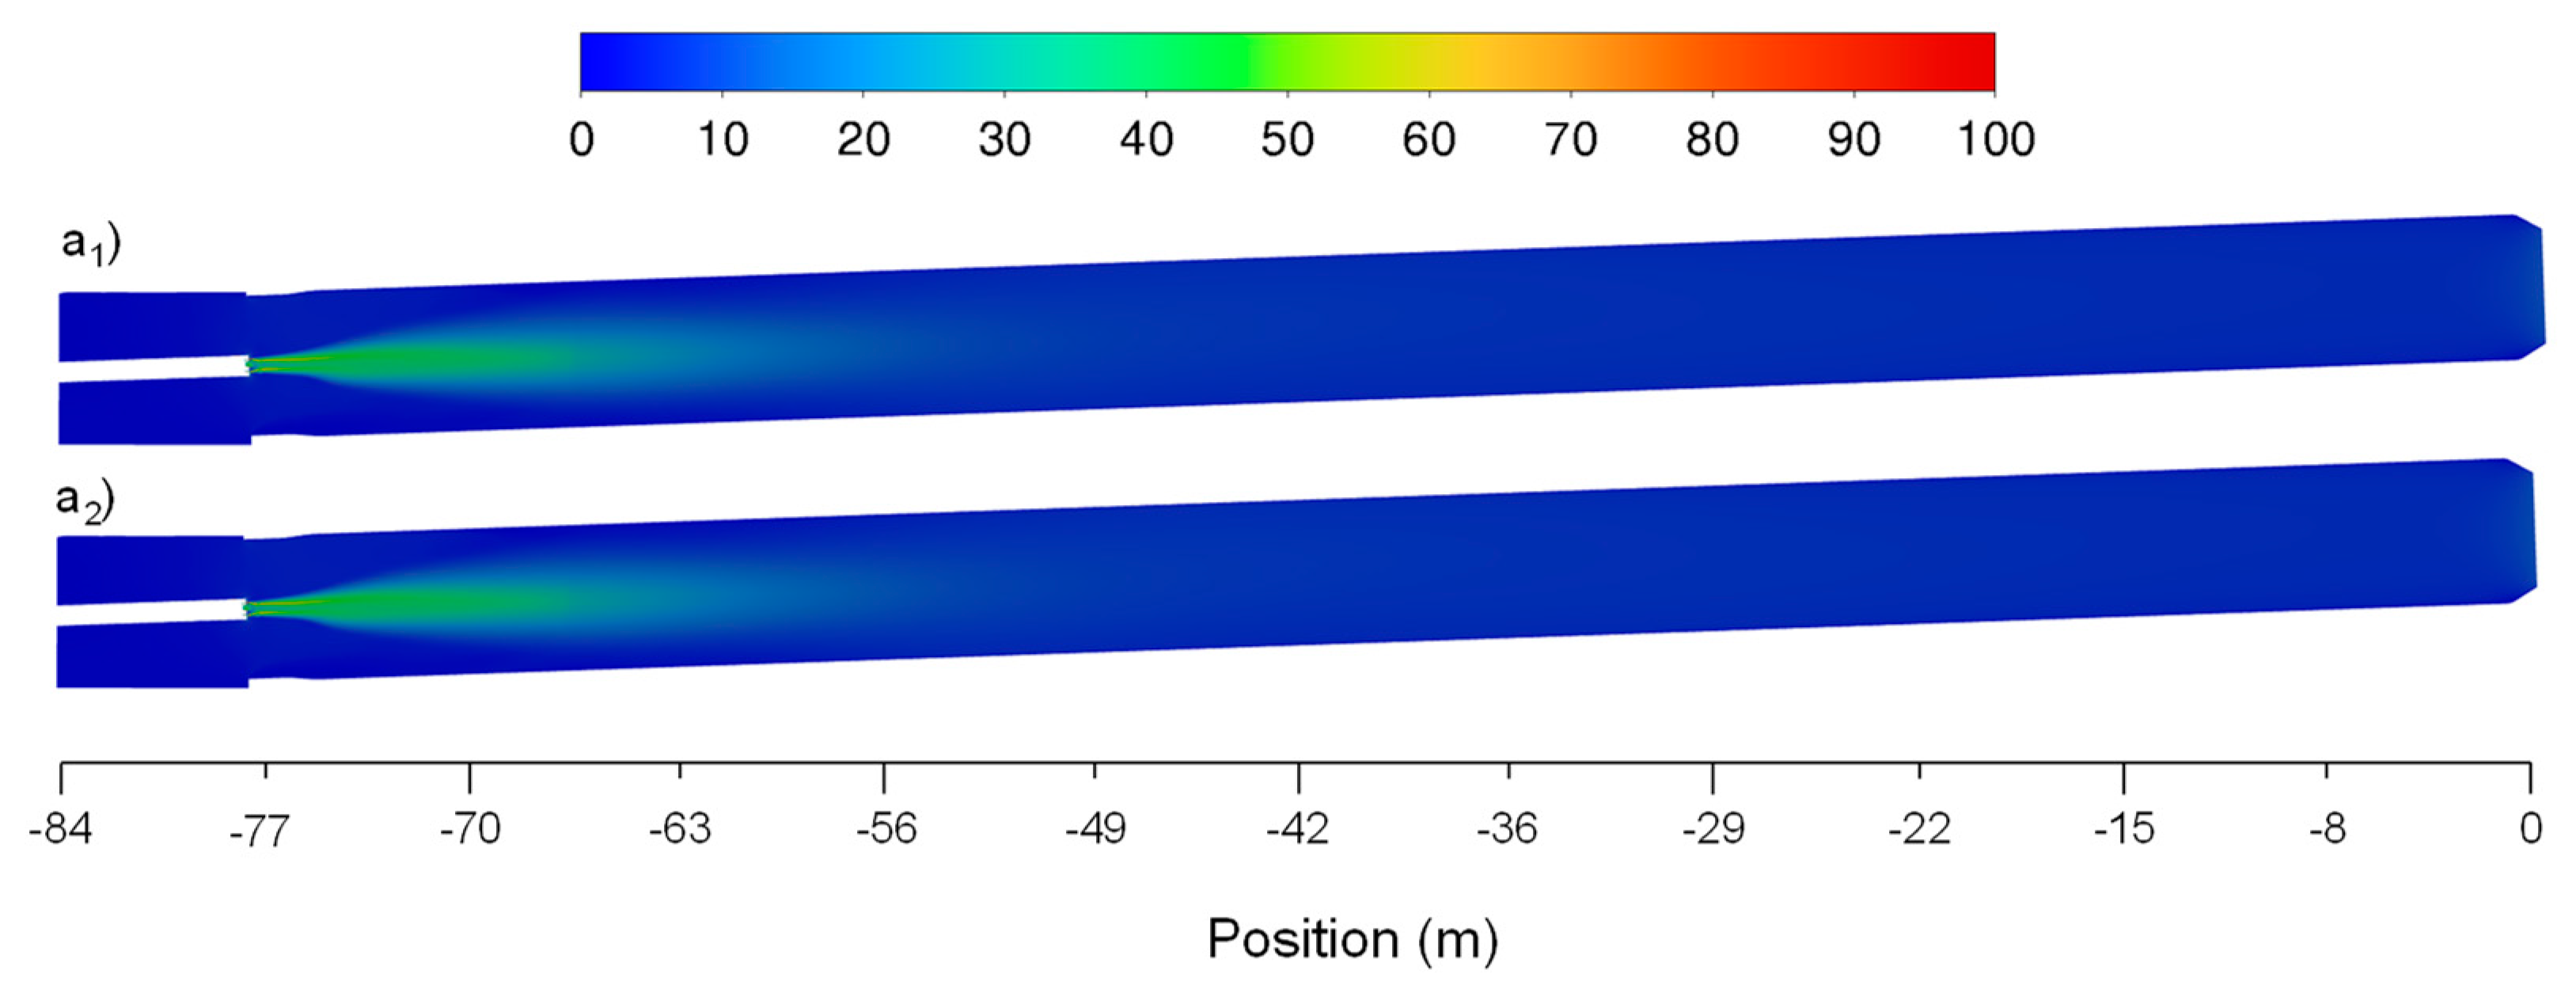
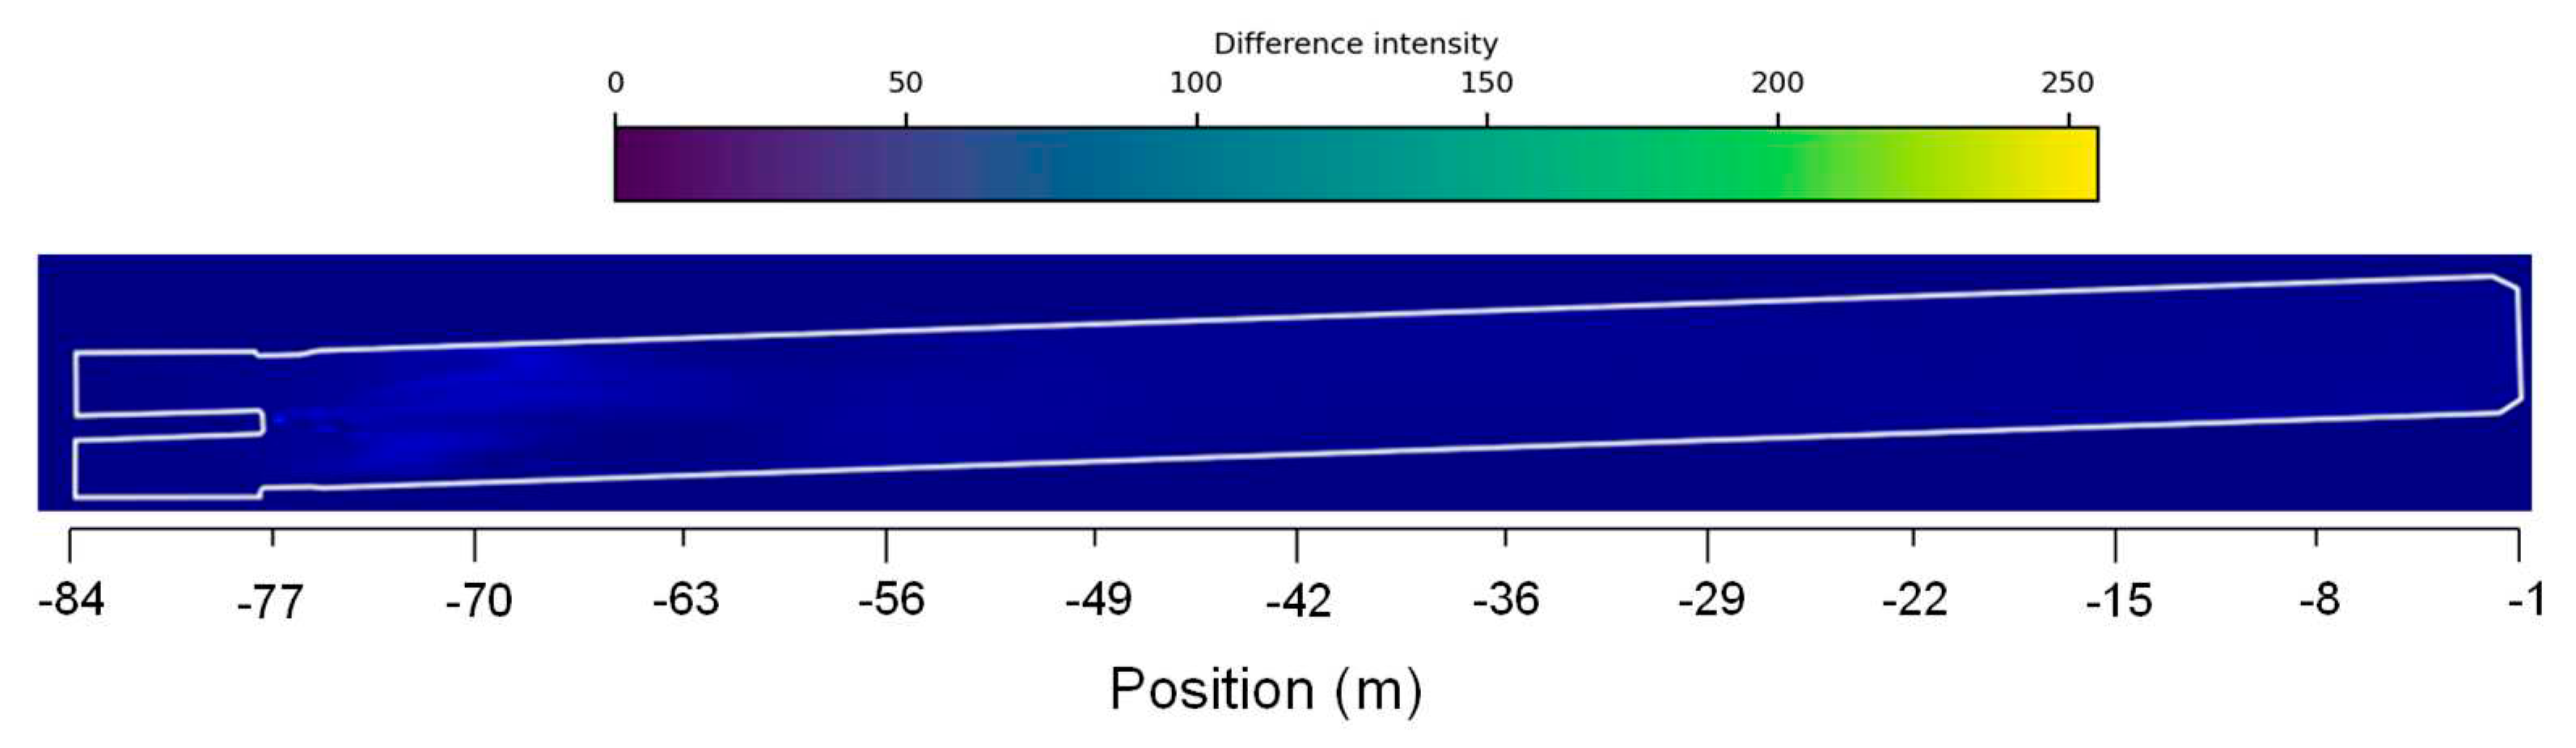
Figure 10.
Absolute difference between the two case scenarios of velocity distribution fields along the rotary kiln.
Figure 10.
Absolute difference between the two case scenarios of velocity distribution fields along the rotary kiln.
Chemical species and pollutants
Combustion is a fundamental process in the cement industry, where achieving a complete process is essential for maximizing energy efficiency and minimizing harmful emissions. When the fuels (petcoke and RDF, in the present case) burn in the presence of oxygen, the combustion process typically results in the formation of CO2 and H2O vapor as primary by-products. However, the ratio of fuel to air can significantly impact the outcome of this thermal conversion process. In a lean combustion regime, the higher amount of oxidant facilitates a more thorough and efficient combustion process. The excess air allows for the complete oxidation of the fuel, resulting in a higher conversion of the fuels and a reduced formation of pollutants such as CO, soot and unburned hydrocarbons [27]. These occurrences can be observed in Figure 11 and Figure 13 and later in Table 2.
Figure 11 shows the mass fraction axial distribution of the most important species (CO2, O2, H2O, CO, SO2, NOx and soot) during the combustion process regarding the two case scenarios.
Figure 11 shows that it is possible to distinguish two combustion stages. Initially, the increase in CO2 (Figure 11a), H2O (Figure 11c) and CO (Figure 11d) is primarily a result of the fuels devolatilization, i.e., when in contact with high temperature, the volatile matter present in the fuels starts to be immediately released and, due to the lack of O2 (Figure 11b), incomplete combustion occurs (also inherent to the presence of CO). Relating this phenomenon to Figure 6a and 7, it can be seen that between -81m and -69m the body of the flame starts to form and the temperature starts to increase. Immediately afterwards, during the second stage of combustion, a further rise in CO2 levels is observed. This phenomenon is attributed to the intense combustion of the remaining fuels and oxygen, where a greater amount of heat is released, leading to the formation of a localized high-temperature zone (flame area) at the center of the kiln (located between -69m and -41m). Finally, the consumption of oxygen reaches a state of stability, leading to a relative equilibrium in the levels of CO2, CO, H2O and the flow field (latter also observed in Figure 9). These events were also observed in the work of Huang et al. [12]. Comparing specifically the results of the simulated case scenarios, when the air mass flow increases (making the mixture leaner), more oxygen is available to achieve complete combustion. Under these conditions, there is a more complete oxidation of the fuel, resulting in an initially slightly high production of CO2 and H2O vapor while, simultaneously, the production of O2 and CO is further reduced. It is also important to note that air is composed of about 79% nitrogen (N2) by volume. Being N2 a generally inert element in the combustion reaction, it will effectively dilute the concentration of the released gaseous species in the combustion products, decreasing their concentration in the exhaust gases, as observed in Figure 11a–d. Additionally, although nitrogen is mostly inert, at high temperatures (above ~1800K) oxygen and nitrogen can react to form various nitrogen oxides (NOx). High temperature is a key factor that contributes to the formation of NOx [27]. This phenomenon can be observed relating to Figure 6, Figure 7 and Figure 11e. Overall, the higher concentration of NOx is located in the area where the temperature is higher (center of the flame) and, additionally, the case scenario with higher temperature (less available air) results in higher NOx emissions, more denoted at -61m in Figure 11e. Similar results were also observed by Huang et al. [12].
SO2 emissions primarily rely on the sulfur content within the fuel rather than the combustion regime. Regardless of whether the combustion conditions are lean or rich, sulfur is nearly entirely oxidized to SO2 during the combustion process. Therefore, altering the air-fuel ratio by augmenting the air mass flow would have minimal impact on the quantity of SO2 generated, assuming the sulfur content in the fuels remain constant [27]. Nonetheless, the concentration of SO2 in the flue gas could be lower under lean conditions, similar to the situation with the other released gaseous species, owing to the dilution effect resulting from the increased amount of nitrogen and other inert components in the excess air. The dilution effect is observed in Figure 11e.
The formation of soot, or particulate matter, is primarily influenced by the composition of the fuels and the equivalence ratio during combustion. Under lean combustion conditions, where the air mass flow is increased, the formation of soot tends to decrease. This is due to the more oxygen available to oxidize the fuels completely to CO2 and H2O vapor, reducing the formation of partially oxidized hydrocarbons and carbon particles. Also, the excess air can also oxidize any soot particles that are produced, further reducing soot emissions. Figure 11b, f show the described relation between O2 and soot particles formation.
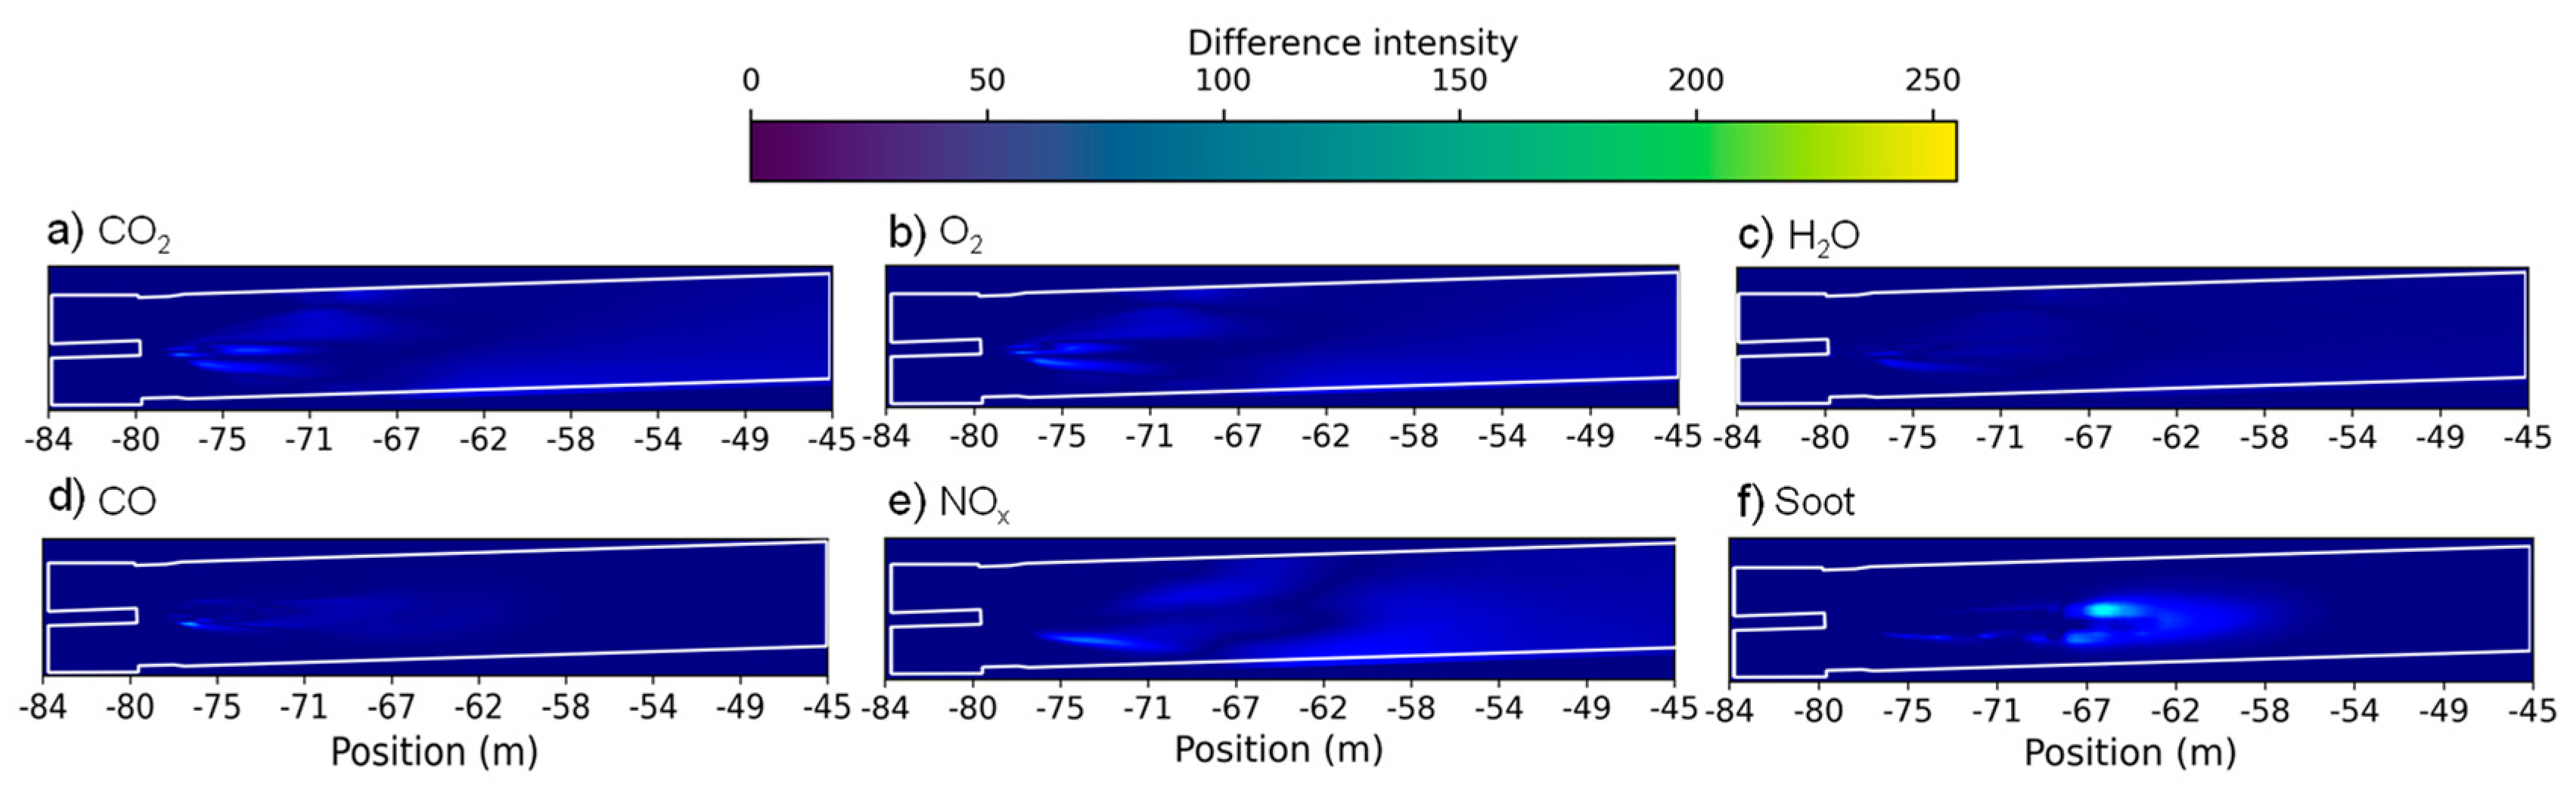
Figure 12 shows the absolute difference between the two case scenarios of CO2, O2, H2O, CO, NOx and soot distribution fields along the rotary kiln. Since the formation of SO2 depends mainly on the composition of the fuels [27], the discussion of this species on this topic was considered not relevant. Differently from what was observed for the temperature and velocity distribution fields (Figure 8 and Figure 10), and regardless of being located in the flame region, there are two defined areas that denote a higher absolute difference intensity, approximately separated at -69m. Relating this event to Figure 11, this region corresponds not only to where both case scenarios present similar results, but also to the region that separates the two combustion stages. In the region of the first combustion stage the absolute difference intensity corresponds to the lower formation of CO (where partial combustion occurs), higher consumption of O2, higher production of CO2, H2O and soot for the case scenario where the air mass flow was increase, whereas in the region of the second combustion regime the opposite trends are observed. Additionally, it is also possible to observe that complete combustion occurs, which can be easily related to the differences detected mostly in the production of CO2 and soot and absence in the production of CO. Regarding Figure 12e, since the temperature is generally lower for the referred case scenario, the absolute difference intensity corresponds to the lower formation of NOx. Once again it is also curious to observe the inverse relationship between O2 (Figure 12b) and soot (Figure 12f) formation. The regions where lacks oxygen correspond to the regions where the production soot increases.
Figure 12.
Absolute difference between the two case scenarios of a) CO2, b) O2, c) H2O, d) CO, e) NOx and f) soot distribution fields along the rotary kiln.
Figure 12.
Absolute difference between the two case scenarios of a) CO2, b) O2, c) H2O, d) CO, e) NOx and f) soot distribution fields along the rotary kiln.
Solid fuels combustion and combustion efficiency
Particle burnout refers to the complete combustion of solid fuel particles, leaving no unburned material behind. This parameter represents a crucial aspect of combustion systems, ensuring maximum energy efficiency and minimal emissions [27]. Figure 13 shows the axial distribution of the burnout rate of petcoke and RDF particles.
Figure 13.
Absolute difference between the two case scenarios of a) CO2, b) O2, c) H2O, d) CO, e) NOx and f) soot distribution fields along the rotary kiln.
Figure 13.
Absolute difference between the two case scenarios of a) CO2, b) O2, c) H2O, d) CO, e) NOx and f) soot distribution fields along the rotary kiln.
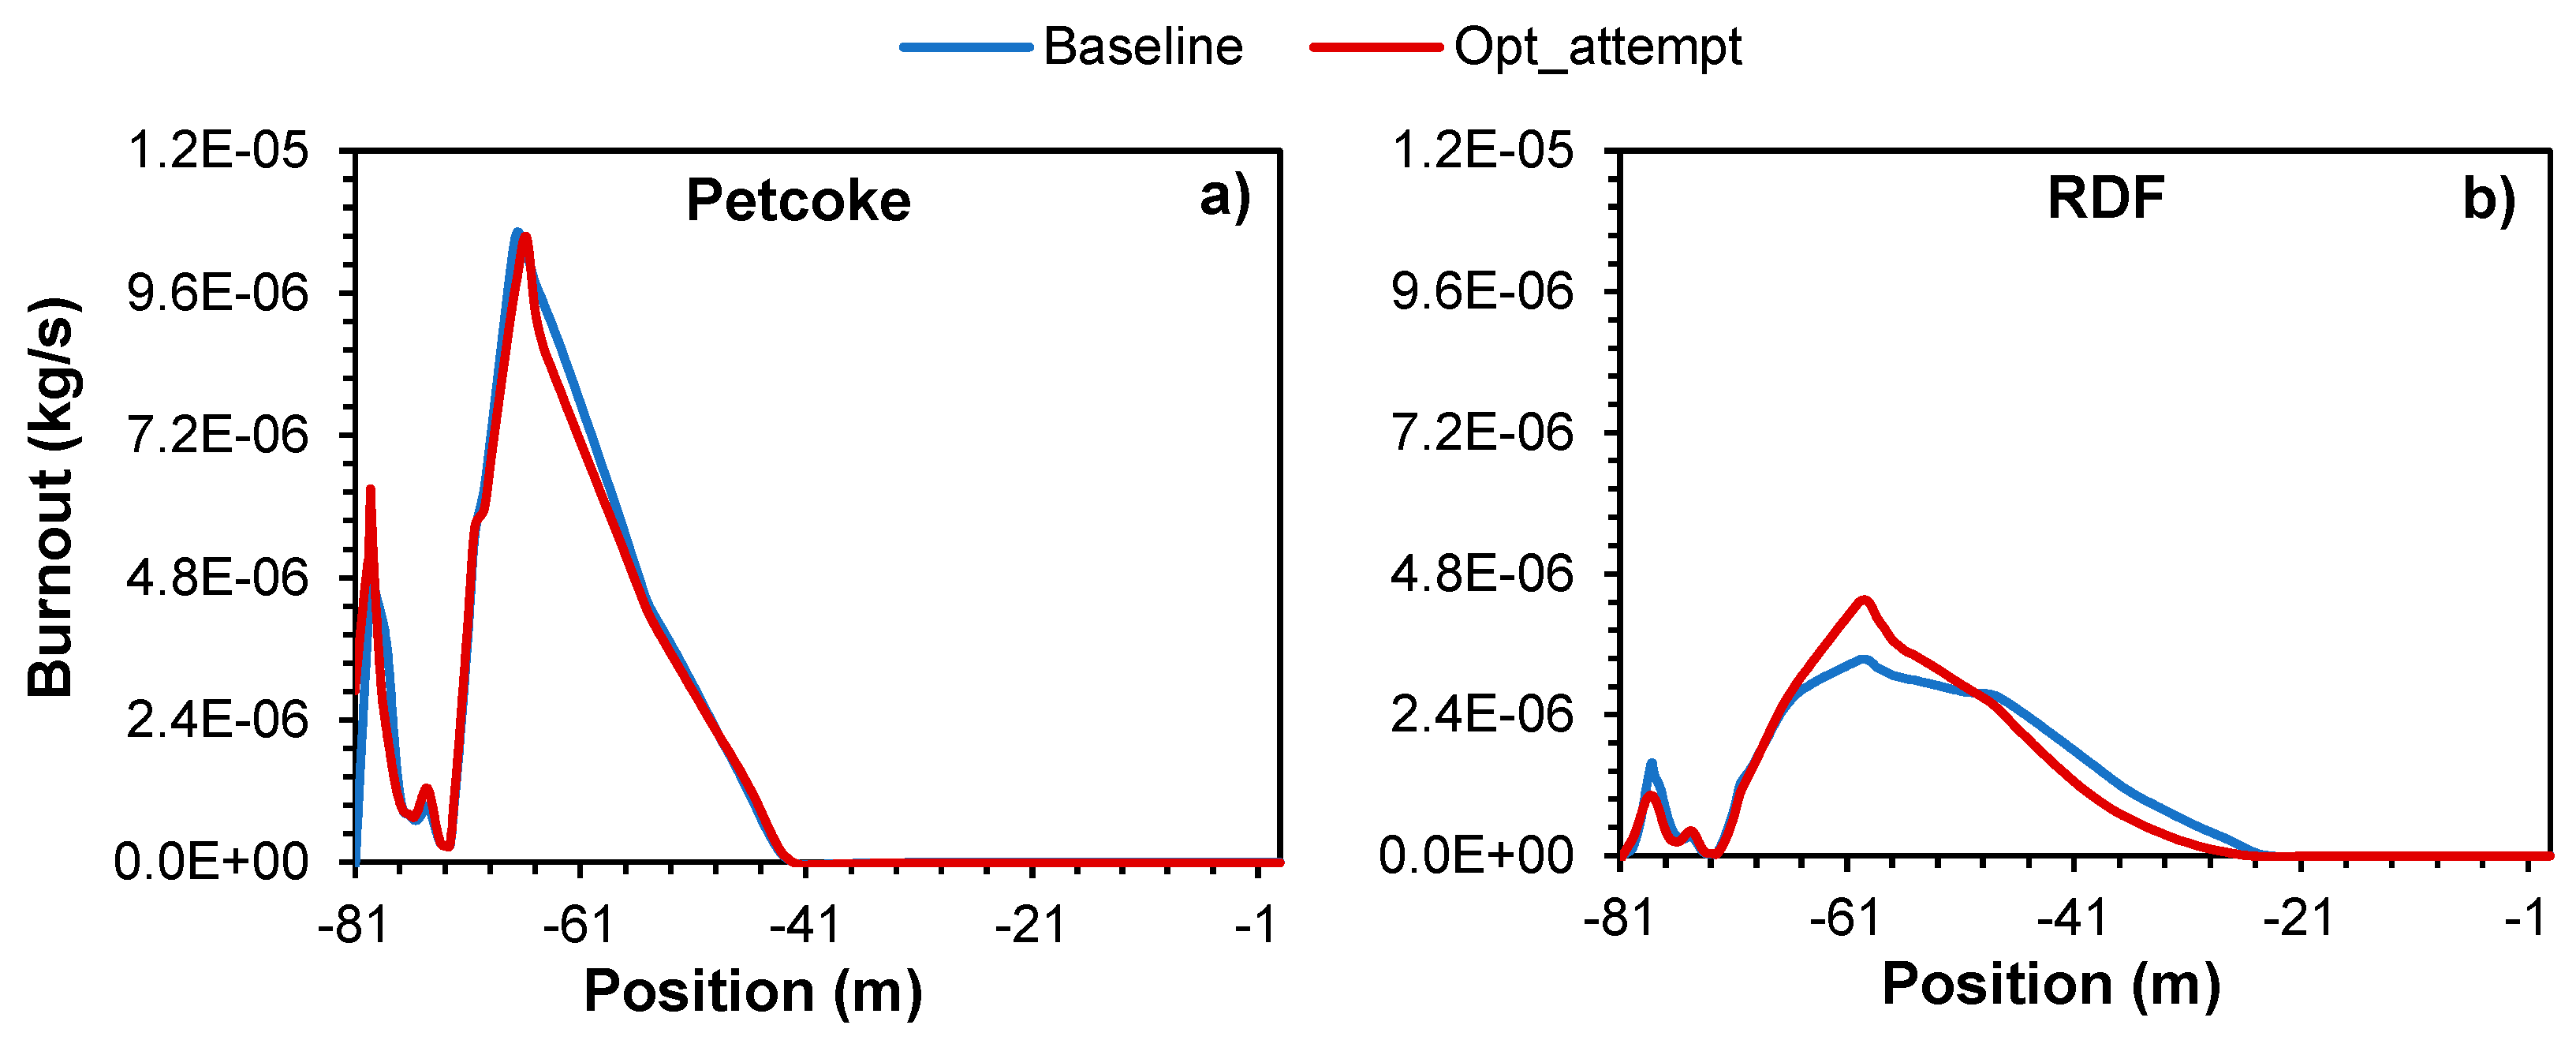
For the case of petcoke particles (Figure 13a), it can be considered that the increase of the air mass flow had little effect on the burnout, meaning that the combustion of petcoke particles process was marginally affected, regardless the slightly decrease in the temperature at around -61m. On another hand, for the case of RDF particles (Figure 13b), the excess air ensures a more efficient oxidation of the fuel particles, resulting in a higher and faster conversion of the fuel into gaseous combustion products. This leads to improved energy efficiency and reduced emissions of unburned material and pollutants by facilitating the breakdown of complex fuel molecules and promoting the complete oxidation of solid particles. The reason petcoke burnout rate ends first than RDF (around -41m and -30m, respectively) is primarily due to its higher thermal conductivity and heat content and due to the smaller particle size. Hence, when subject to a high temperature, petcoke will start to decompose and react faster than RDF. Similar results were observed in the works of Pieper et al. [11] and Ariyaratne et al. [14].
Table 2 shows the combustion process efficiency for the two simulated case scenarios. It is possible to conclude, for the tested conditions, that increasing the air mass flow by 10% improved carbon conversion efficiency by 3.25%. As a result, a lean combustion regime can lead to higher combustion efficiency as more of the fuel is oxidized. However, this must be balanced against the possibility of increasing emissions of NOx and potential impacts on the combustion operating conditions. Hence, there must be a balance between achieving efficient combustion, minimizing harmful emissions, and maintaining the reliability and performance of the combustion system.

Table 3.
Combustion process efficiency.
| Fuels inlet | ||
| RDF Mass flow (kg/s) | 2.30 | |
| CRDF yield (wt.%) | 0.63 | |
| Petcoke Mass flow (kg/s) | 0.84 | |
| CPetcoke yield (wt.%) | 0.86 | |
| C Mass flow (kg/s) | 2.17 | |
| Outlet | ||
| Gas Mass flow (kg/s) | Baseline | Optimization |
| Mass flow (kg/s) | 32.72 | 36.09 |
| CO2 yield (wt.%) | 0.19 | 0.18 |
| CO2 Mass flow (kg/s) | 6.33 | 6.55 |
| C Mass flow (kg/s) | 2.01 | 2.09 |
| Efficiency | 92.95 | 96.20 |
4. Conclusions
The findings of this investigation into the operation of a real cement plant's rotary kiln system provide valuable insights for optimizing the combustion efficiency and pollutant emissions of cement production. The CFD model developed and herein presented a high level of agreement with plant information, such as flame temperature and the temperature at the end of the kiln. Furthermore, the baseline operating conditions were verified to yield low oxygen conditions (flame starvation) at a relatively early stage in the gas flow.
The strategy for increasing secondary air flowrate was thus confirmed, and the results obtained in the simulation confirm not only an improvement in burning conditions and flame behaviour, but also an increase in combustion efficiency from 93% to 96%, combined with a slight decrease in pollutant mass fraction in the flue gas. This increase in combustion efficiency was a result of better flame aeration, which resulted in a direct improvement of RDF burnout.
Furthermore, no change was observed in the petcoke burnout, thus indicating that fossil fuel combustion is already optimal, within the proposed conditions. The temperature and velocity profiles remained stable throughout the simulations and consistent with the information provided by plant operators.
Overall, the proposed CFD model is a powerful tool for operational investigation, diagnosing of a complex system whose direct measurement is either impractical or even impossible, depending on the variables. Further model improvements can include a model for estimating heat of reaction from the clinkerization reactions, which can help improve the estimated temperature profiles along the kiln length.
Acknowledgments
The authors acknowledge the funding of the P2020 Clean Cement Line project (LISBOA-01-0247-FEDER-027500).
Conflicts of Interest
The authors declare no conflict of interest.
References
- Khoshnava, S.M., Rostami, R., Zin, R. M., Kamyab, H., Majid, M. Z. A., Yousefpour, A., Mardani A. Green efforts to link the economy and infrastructure strategies in the context of sustainable development. Energy 2020;193:116759. [CrossRef]
- Directorate-General for Climate Action. european climate law n.d. Available online: https://climate.ec.europa.eu/ (accessed on 18 April 2023).
- Kahawalage AC, Melaaen MC, Tokheim L-A. Opportunities and challenges of using SRF as an alternative fuel in the cement industry. Cleaner Waste Systems 2023;4:100072. [CrossRef]
- Antunes M, Santos RL, Pereira J, Rocha P, Horta RB, Colaço R. Alternative clinker technologies for reducing carbon emissions in cement industry: A critical review. Materials 2022;15. [CrossRef]
- Sharma P, Sheth PN, Mohapatra BN. Recent Progress in Refuse Derived Fuel (RDF) Co-processing in Cement Production: Direct Firing in Kiln/Calciner vs Process Integration of RDF Gasification. Waste and Biomass Valorization 2022;13:4347–74. [CrossRef]
- Rahman A, Rasul M, Khan MMK, Sharma S. Assessment of Energy Performance and Emission Control Using Alternative Fuels in Cement Industry through a Process Model. Energies 2017;10:1996. [CrossRef]
- Liedmann B, Wirtz S, Scherer V, Krüger B. Numerical Study on the Influence of Operational Settings on Refuse Derived Fuel Co-firing in Cement Rotary Kilns. Energy Procedia 2017;120:254–61. [CrossRef]
- Hemidat S, Saidan M, Al-Zu’bi S, Irshidat M, Nassour A, Nelles M. Potential Utilization of RDF as an Alternative Fuel to be Used in Cement Industry in Jordan. Sustainability 2019;11:5819. [CrossRef]
- Wojtacha-Rychter K, Smoliński A. Multi-Case Study on Environmental and Economic Benefits through Co-Burning Refuse-Derived Fuels and Sewage Sludge in Cement Industry. Materials 2022;15:4176. [CrossRef]
- Liedmann B, Arnold W, Krüger B, Becker A, Krusch S, Wirtz S, et al. An approach to model the thermal conversion and flight behaviour of Refuse Derived Fuel. Fuel 2017;200:252–71. [CrossRef]
- Pieper C, Liedmann B, Wirtz S, Scherer V, Bodendiek N, Schaefer S. Interaction of the combustion of refuse derived fuel with the clinker bed in rotary cement kilns: A numerical study. Fuel 2020;266. [CrossRef]
- Huang Y, Guan J, Kao H. Numerical simulation of pulverized coal combustion in rotary kilns with different oxygen concentrations. Energy Sources, Part A: Recovery, Utilization and Environmental Effects 2022;44:4510–24. [CrossRef]
- Pieper C, Wirtz S, Schaefer S, Scherer V. Numerical investigation of the impact of coating layers on RDF combustion and clinker properties in rotary cement kilns. Fuel 2021;283:118951. [CrossRef]
- Ariyaratne WKH, Malagalage A, Melaaen MC, Tokheim L-A. CFD modelling of meat and bone meal combustion in a cement rotary kiln – Investigation of fuel particle size and fuel feeding position impacts. Chemical Engineering Science 2015;123:596–608. [CrossRef]
- Ryan J, Bussmann M, DeMartini N. CFD Modelling of Calcination in a Rotary Lime Kiln. Processes 2022;10. [CrossRef]
- Mikulčić H, Cerinski D, Baleta J, Wang X. Improving Pulverized Coal and Biomass Co-Combustion in a Cement Rotary Kiln by Computational Fluid Dynamics. Chemical Engineering and Technology 2019;42:2539–45. [CrossRef]
- Lahaye D, Juretić F, Talice M. Modelling a Turbulent Non-Premixed Combustion in a Full-Scale Rotary Cement Kiln Using reactingFoam. Energies 2022;15. [CrossRef]
- Menter, F. Zonal Two Equation k-w Turbulence Models For Aerodynamic Flows. 23rd Fluid Dynamics, Plasmadynamics, and Lasers Conference, American Institute of Aeronautics and Astronautics; n.d. [CrossRef]
- Menter, FR. Two-equation eddy-viscosity turbulence models for engineering applications. AIAA Journal 1994;32:1598–605. [CrossRef]
- Raithby GD, Chui EH. A Finite-Volume Method for Predicting a Radiant Heat Transfer in Enclosures With Participating Media. Journal of Heat Transfer 1990;112:415–23. [CrossRef]
- Chui EH, Raithby GD. Computation of Radiant Heat Transfer on a Nonorthogonal Mesh Using the Finite-Volume Method. Numerical Heat Transfer, Part B: Fundamentals 1993;23:269–88. [CrossRef]
- Hottel HC, Sarofim AF. Radiative Transfer. McGraw-Hill; 1967.
- The Oxidation of Nitrogen in Combustion and Explosions. Selected Works of Yakov Borisovich Zeldovich, vol. 1, Princeton University Press; 2014, p. 364–403. [CrossRef]
- Hanson RK, Salimian S. Survey of Rate Constants in the N/H/O System. In: Gardiner WC, editor. Combustion Chemistry, New York, NY: Springer; 1984, p. 361–421. [CrossRef]
- Khan I, Greeves G. A method for calculating the formation and combustion of soot in diesel engines. Heat Transfer in Flames 1974;25.
- Magnussen BF, Hjertager BH. On mathematical modeling of turbulent combustion with special emphasis on soot formation and combustion. Symposium (International) on Combustion 1977;16:719–29. [CrossRef]
- Coelho, P., Costa M. Combustão. Amadora: 2007.
Figure 1.
Mesh cut plane in the center of the kiln, highlighting the body of influence in the flame area.
Figure 1.
Mesh cut plane in the center of the kiln, highlighting the body of influence in the flame area.
Figure 2.
Mesh cut plane in the center of the kiln, highlighting the body of influence in the flame area.
Figure 2.
Mesh cut plane in the center of the kiln, highlighting the body of influence in the flame area.
Figure 3.
Mesh cut plane in the center of the kiln, highlighting the body of influence in the flame area.
Figure 3.
Mesh cut plane in the center of the kiln, highlighting the body of influence in the flame area.
Figure 4.
Mesh cut plane in the center of the kiln, highlighting the body of influence in the flame area.
Figure 4.
Mesh cut plane in the center of the kiln, highlighting the body of influence in the flame area.
Figure 5.
Mesh cut plane in the center of the kiln, highlighting the body of influence in the flame area.
Figure 5.
Mesh cut plane in the center of the kiln, highlighting the body of influence in the flame area.
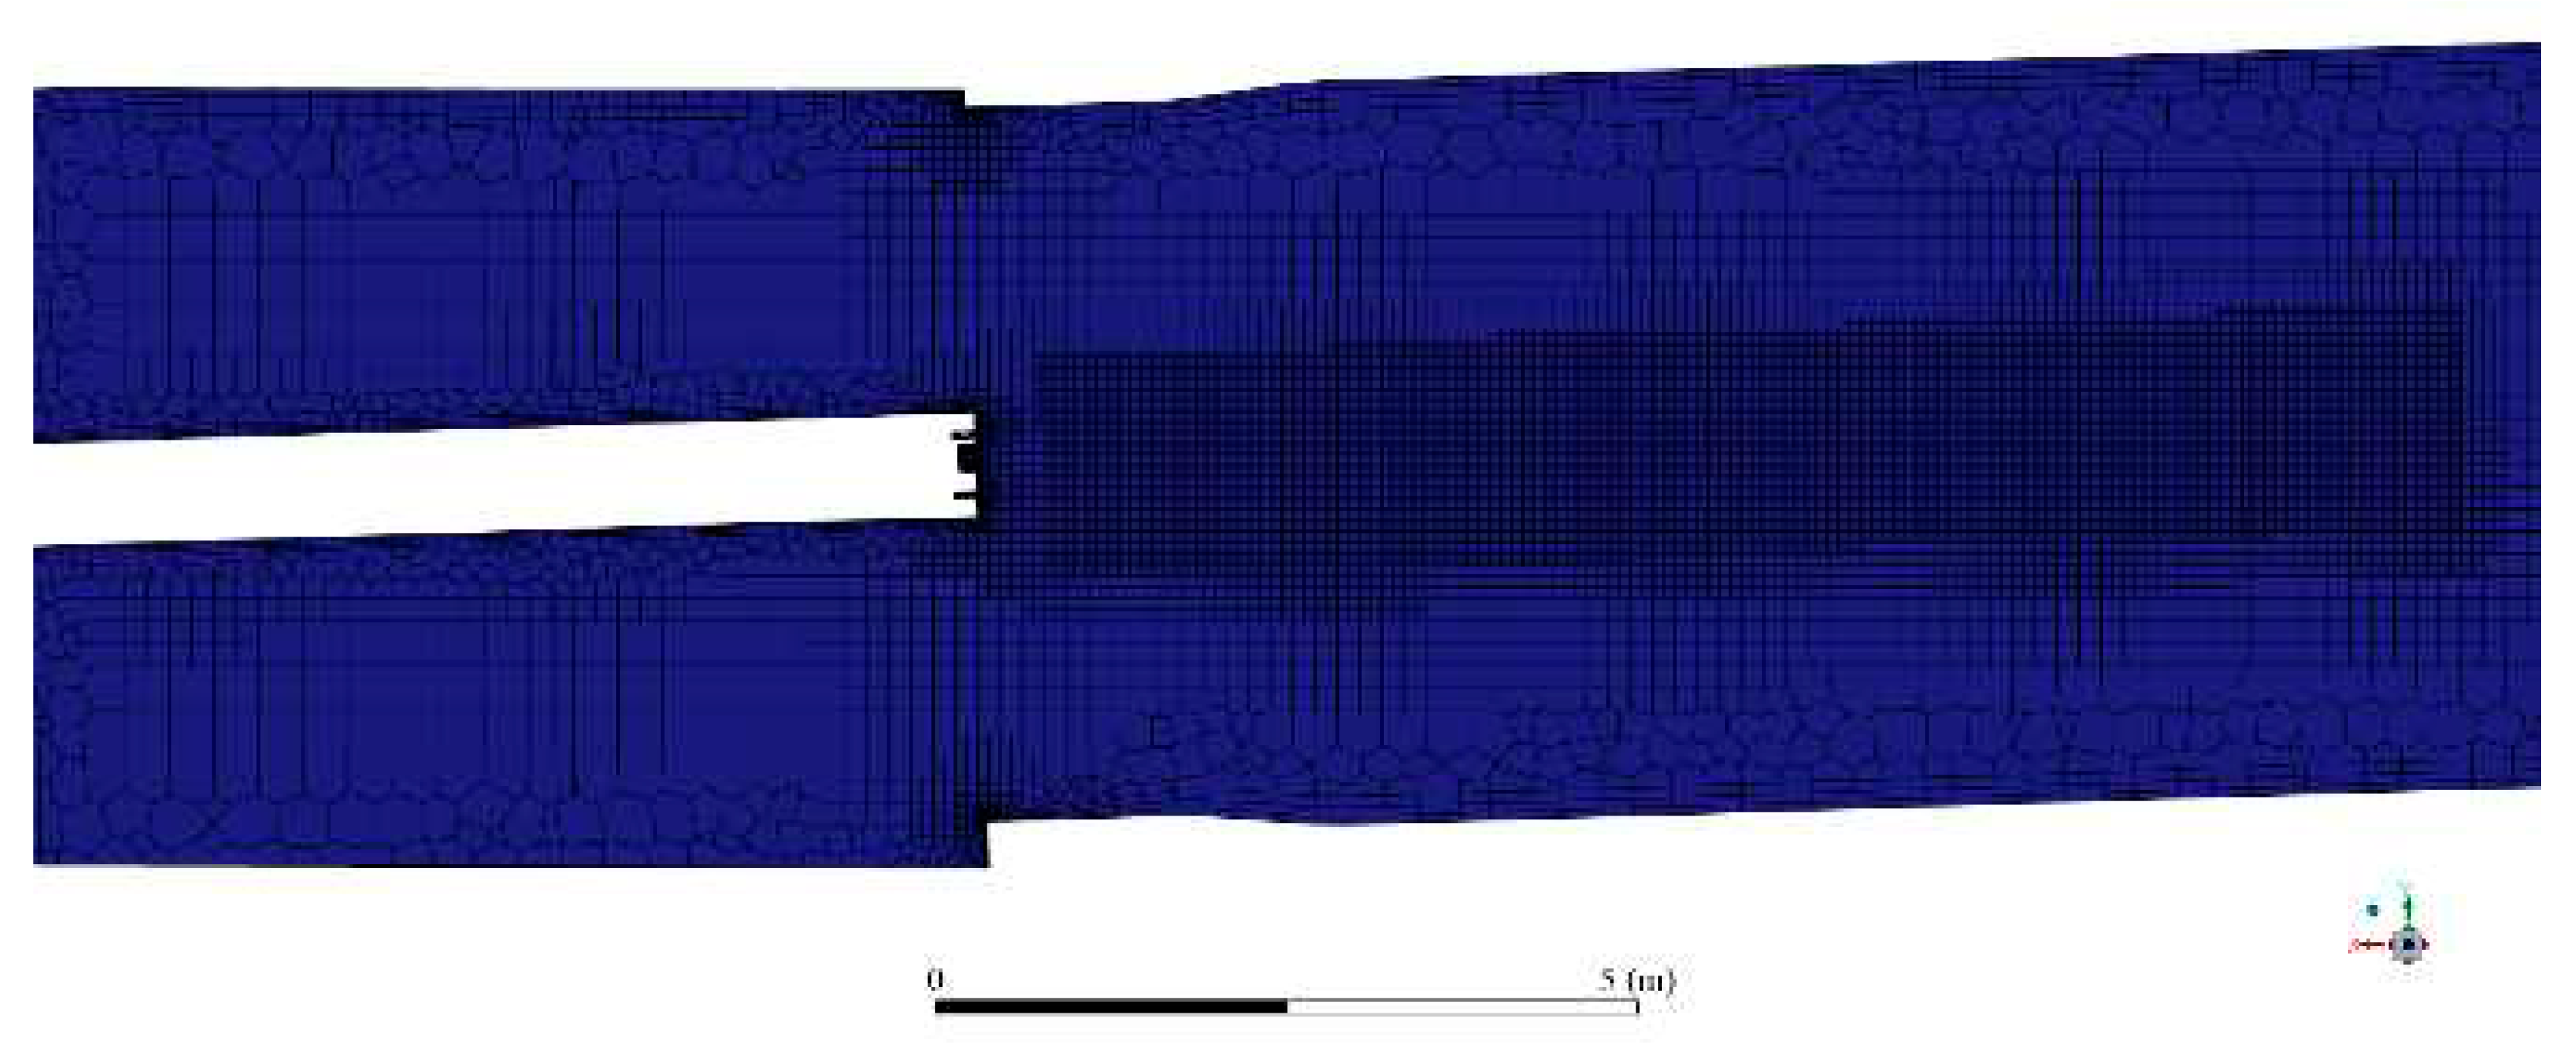
Figure 6.
a) Temperature and b) velocity average values along the rotary kiln.
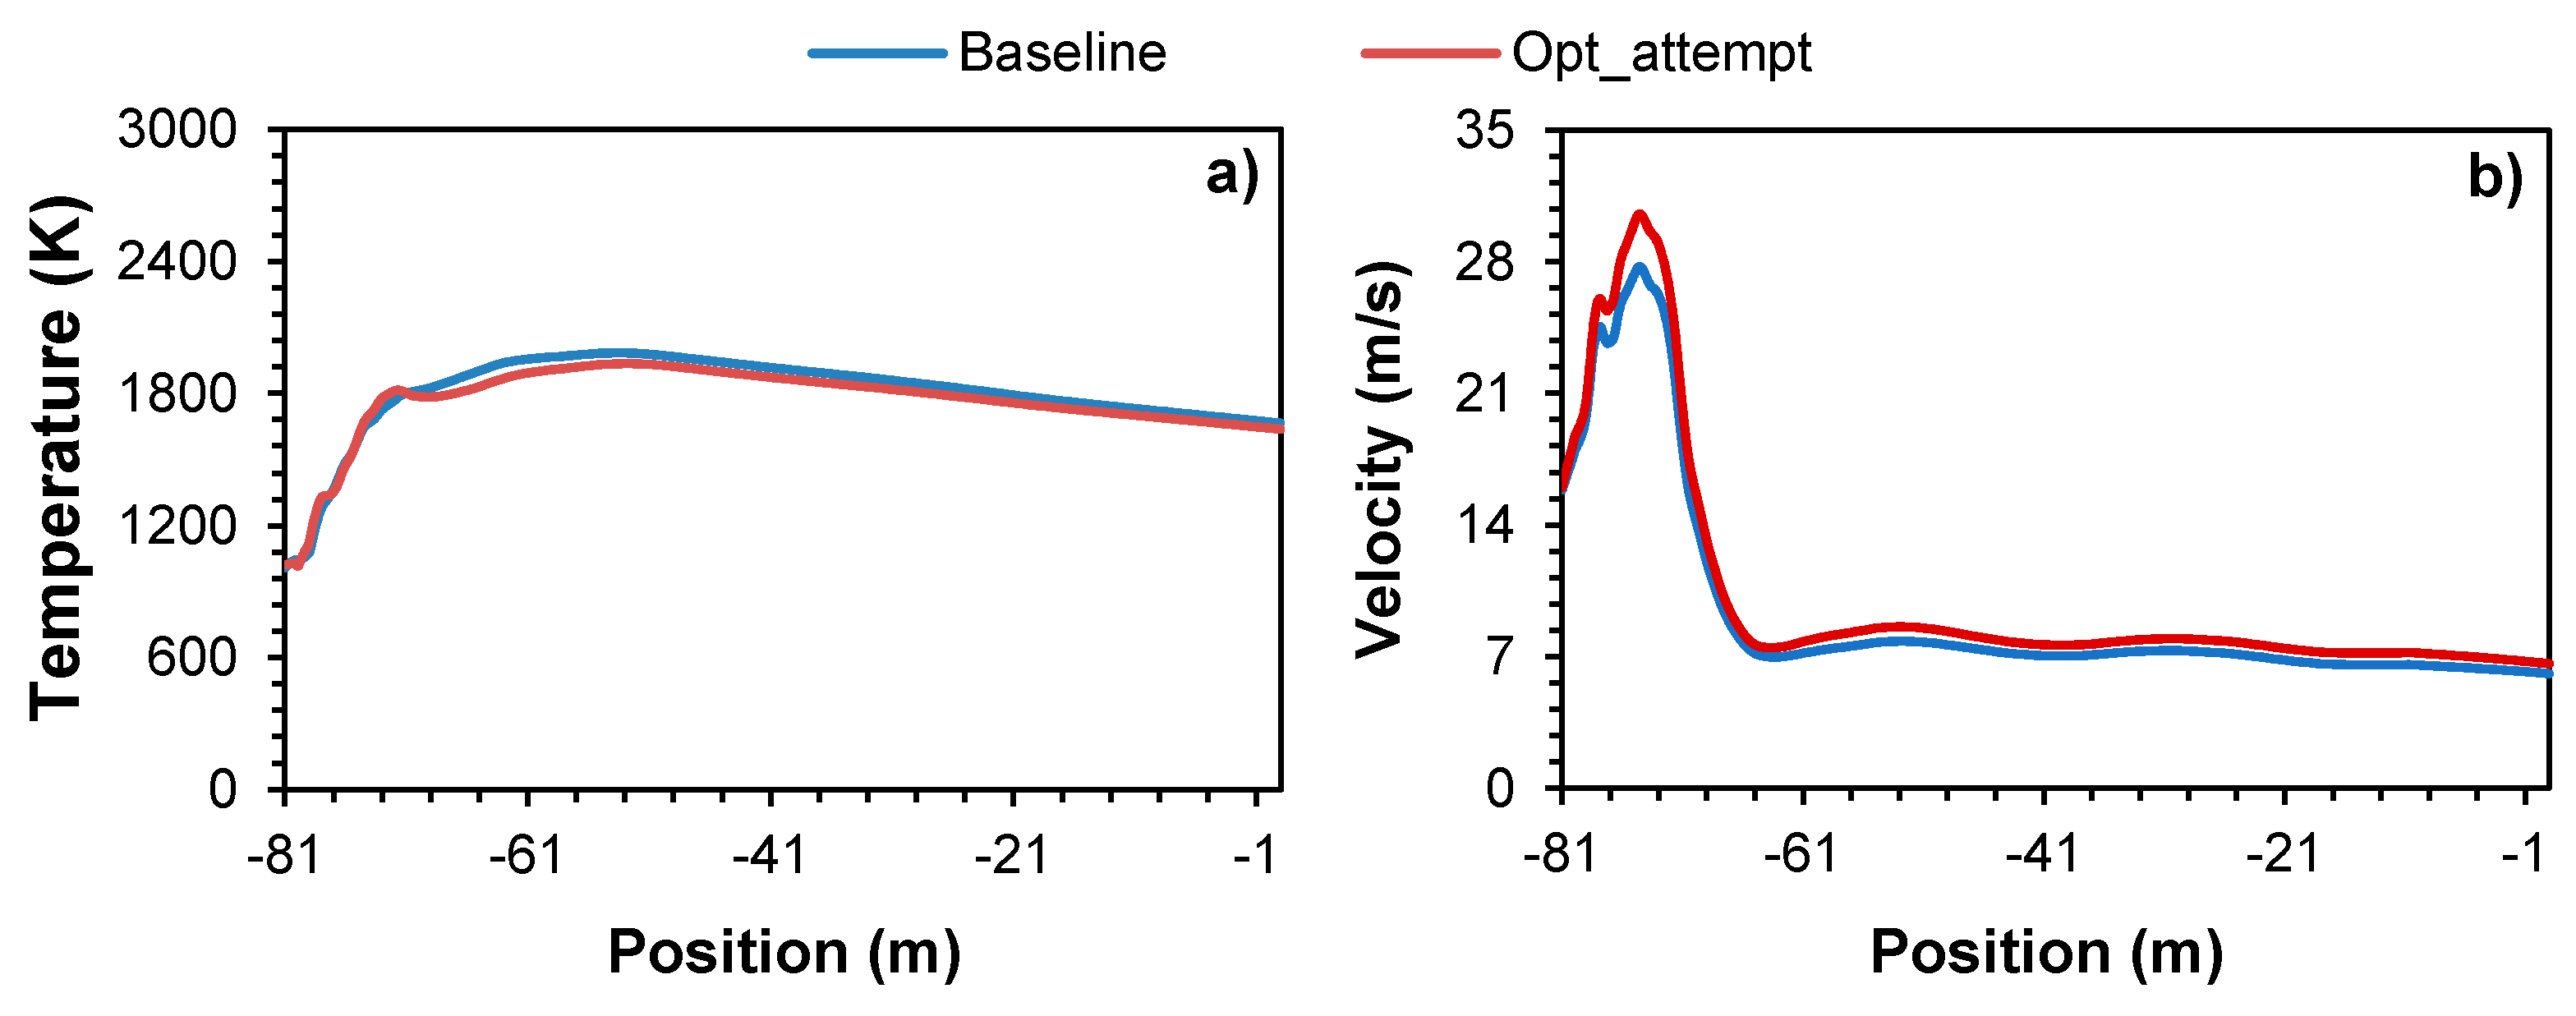
Figure 7.
Baseline and optimization attempt case scenarios for temperatures (a1, a2) axial distribution fields along the rotary kiln, respectively.
Figure 7.
Baseline and optimization attempt case scenarios for temperatures (a1, a2) axial distribution fields along the rotary kiln, respectively.
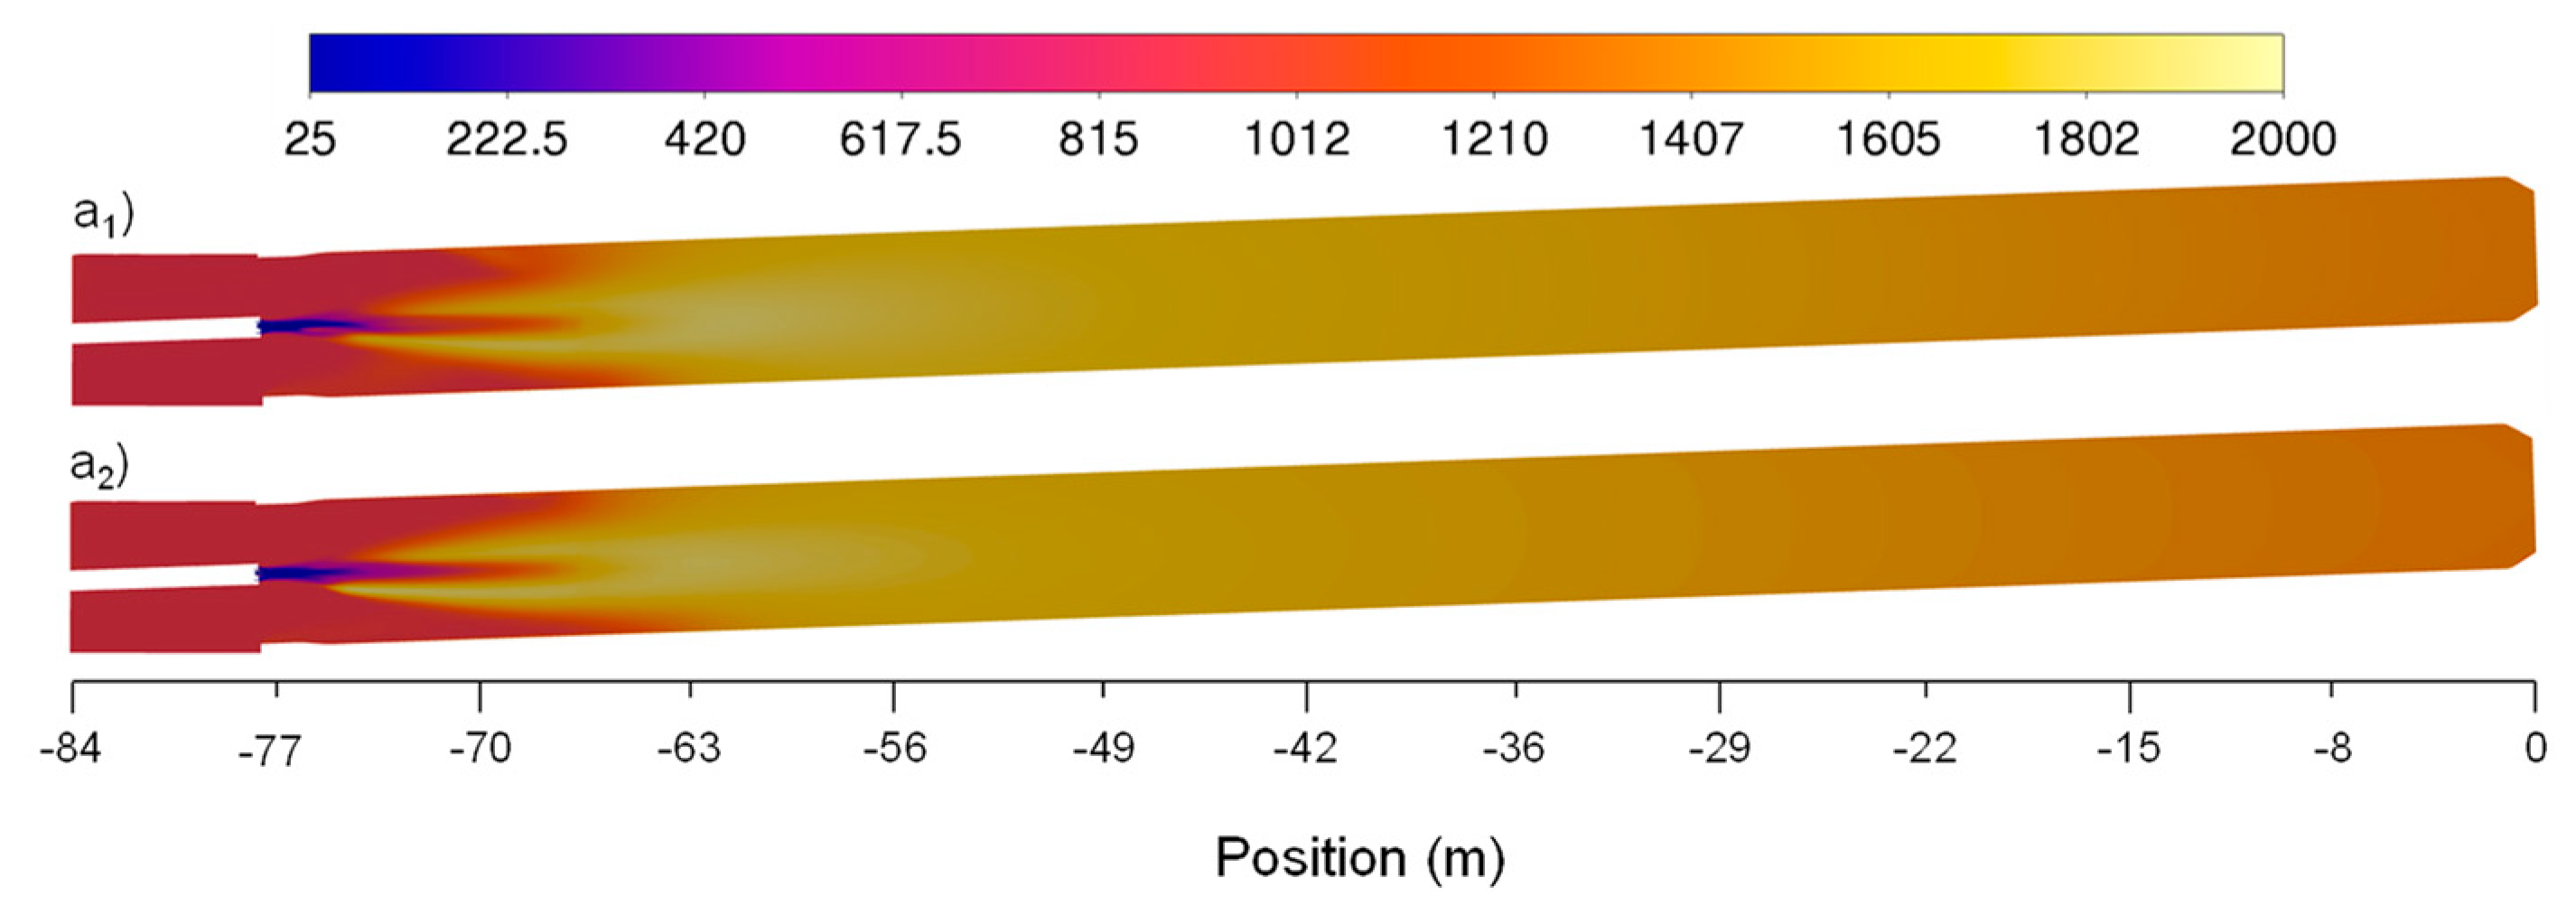
Figure 8.
Absolute difference between the two case scenarios of the temperature distribution field along the rotary kiln.
Figure 8.
Absolute difference between the two case scenarios of the temperature distribution field along the rotary kiln.
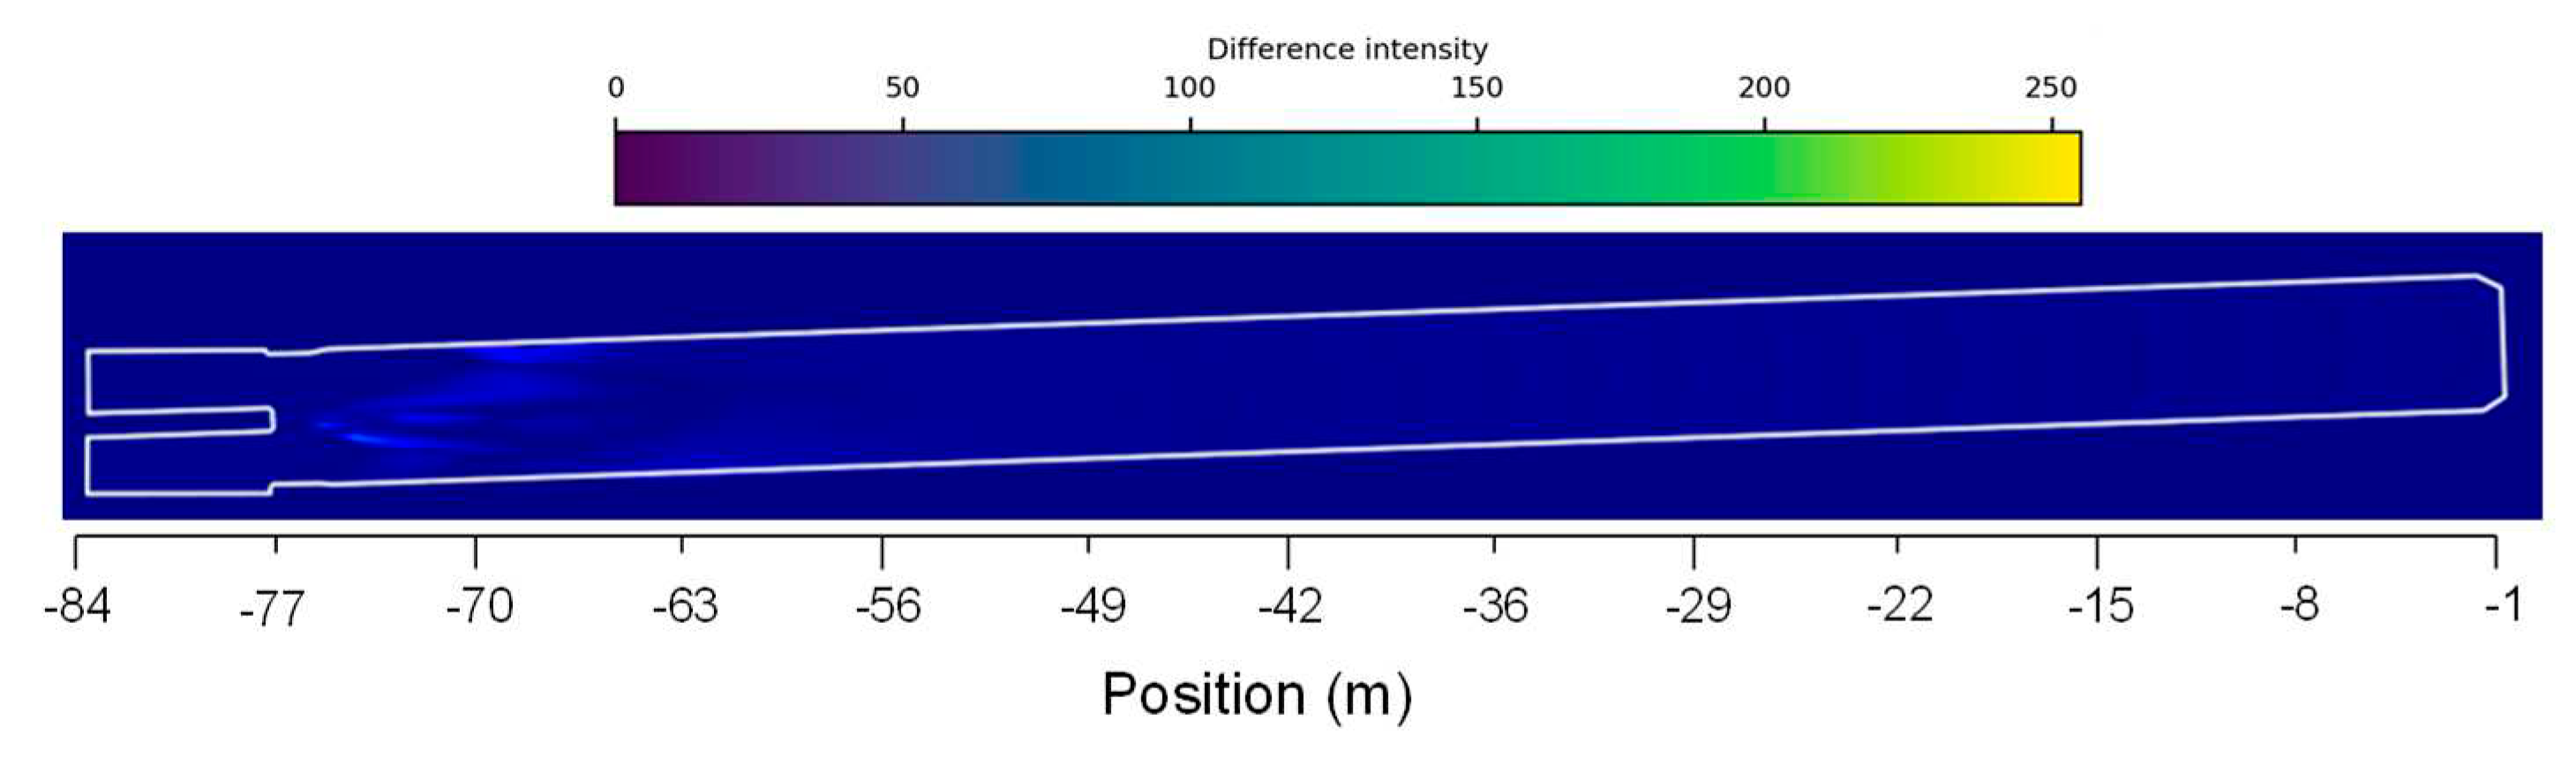
Figure 11.
Mass fraction axial distribution of a) CO2, b) O2, c) H2O, d) CO, e) NOx and f) soot.
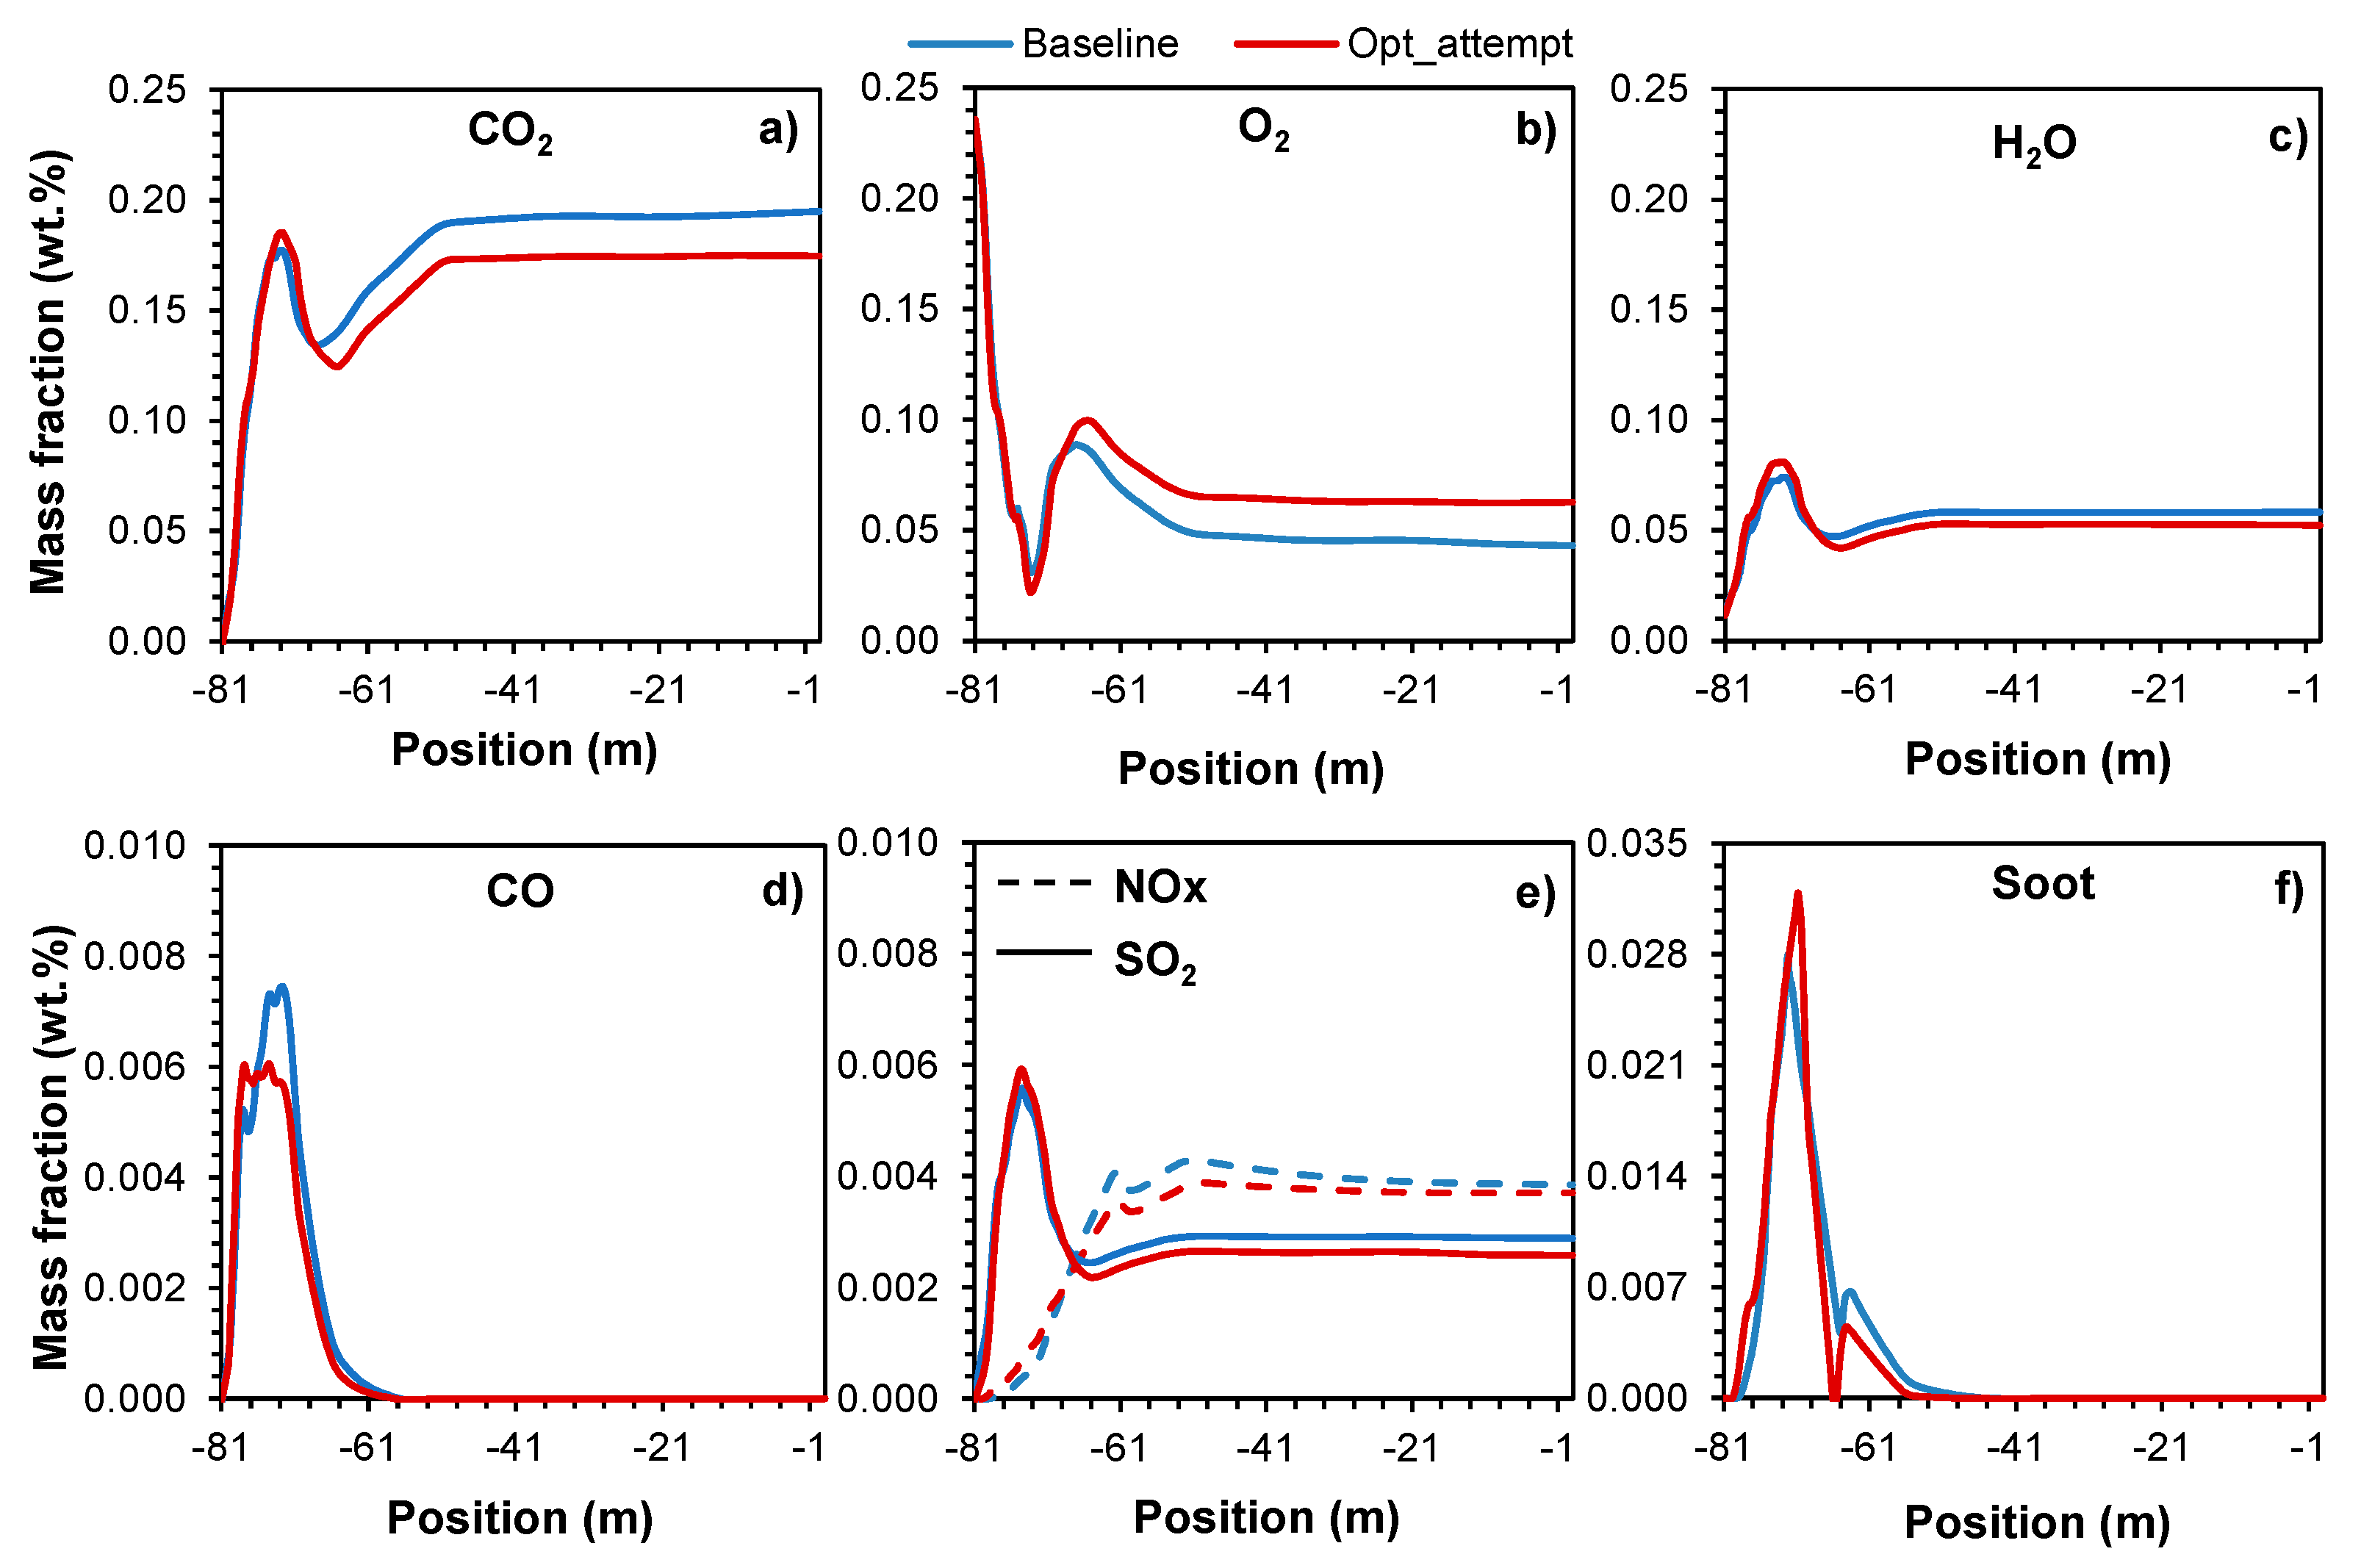
Table 1.
Properties of the fuels employed in the simulations.
| Parameter | Petcoke | RDF |
|---|---|---|
| Total moisture (wt. %) | 0.077 | 0.169 |
| Ash (wt. %) | 0.007 | 0.124 |
| Fixed carbon (wt. %) | 0.805 | 0.113 |
| Volatile content (wt. %) | 0.111 | 0.594 |
| Carbon (wt. %) | 0.865 | 0.626 |
| Hydrogen (wt. %) | 0.039 | 0.081 |
| Nitrogen (wt. %) | 0.000 | 0.019 |
| Sulphur (wt. %) | 0.062 | 0.000 |
| Oxygen (wt. %) | 0.034 | 0.273 |
| Lower Heating Value (MJ/kg) | 23.00 | 19.40 |
| Dry density (kg/m3) | 1200 | 300 |
| Max. diameter (µm) | 90 | 3 |
| Mean diameter (µm) | 40 | 300 |
| Min. diameter (µm) | 10 | 100 |
Table 2.
Boundary conditions for the CFD simulations.
| Parameter | Baseline case | Optimization Attempt |
|---|---|---|
| Petcoke flowrate (t/h) | 3.0 | 3.0 |
| RDF flowrate (t/h) | 8.3 | 8.3 |
| Axial air (Nm3/h) | 4200 | 4200 |
| Radial air (Nm3/h) | 4300 | 4300 |
| Petcoke transport air (Nm3/h) | 2800 | 2800 |
| RDF transport air (Nm3/h) | 3000 | 3000 |
| Secondary air (Nm3/h) | 68000 | 78000 |
Disclaimer/Publisher’s Note: The statements, opinions and data contained in all publications are solely those of the individual author(s) and contributor(s) and not of MDPI and/or the editor(s). MDPI and/or the editor(s) disclaim responsibility for any injury to people or property resulting from any ideas, methods, instructions or products referred to in the content. |
© 2023 by the authors. Licensee MDPI, Basel, Switzerland. This article is an open access article distributed under the terms and conditions of the Creative Commons Attribution (CC BY) license (http://creativecommons.org/licenses/by/4.0/).
Copyright: This open access article is published under a Creative Commons CC BY 4.0 license, which permit the free download, distribution, and reuse, provided that the author and preprint are cited in any reuse.


