

Submitted:
20 November 2023
Posted:
21 November 2023
You are already at the latest version
Abstract
This study aimed to investigate the impact of incorporating Refuse Derived Fuel (RDF) into a production brick mixture in order to mitigate difficulties encountered in the production environment. Three distinct tests were conducted to assess the preparation process. The first test served as a reference, utilizing 100% clay material without RDF. The second test involved the inclusion of 10% RDF, obtained from a waste factory, with a grain size less than 20mm. In the third test, the RDF was mixed with silica sand after undergoing hammer milling with a 2mm sieve, followed by a 10% incorporation into the mixture. The primary objective was to comprehend the behavior of these mixtures in two critical stages: extrusion and drying. Extrusion performance was evaluated by examining the shaping process from the mold, vacuum conditions within the extruder, and the cutting of wet sample bricks. Furthermore, the drying procedure was assessed in terms of shrinkage, drying sensitivity, and appearance. Comparisons were made among the three test scenarios to identify the influence of RDF on these key parameters. Preliminary results indicate that the inclusion of RDF impacted the extrusion process. The addition of RDF resulted in variations in the flow characteristics of the mixture, affecting the shape formation from the mold and the vacuum conditions within the extruder. Additionally, the cutting of wet sample bricks exhibited some differences compared to the reference test. Concerning the drying phase, the presence of RDF influenced shrinkage behavior and drying sensitivity. The mixture with RDF showed different shrinkage patterns compared to the reference, and its drying sensitivity was altered. Moreover, the appearance of the bricks after drying exhibited notable variations due to the incorporation of RDF. In conclusion, incorporating RDF in the brick mixture introduces changes in both the extrusion and drying stages. The alteration in flow characteristics and vacuum conditions during extrusion, as well as the variations in shrinkage, drying sensitivity, and appearance during drying, suggest that further investigation is necessary to optimize the incorporation of RDF for improved brick production. These findings contribute to the understanding of the challenges and opportunities associated with the utilization of RDF in brick manufacturing processes.
Keywords:
brick production
; sustainable materials
; material incorporation
1. Introduction
Bricks, one of the oldest known building materials, have long stood the test of time, demonstrating remarkable resistance to the most challenging weather conditions. This inherent resilience has made them the cornerstone of construction, heralding bricks as the most dependable building material in the industry. Bricks come in various types and possess distinctive properties rooted in their size, composition, weight, and shape. Ceramic bricks, in particular, exhibit a set of key characteristics including strength, durability, dimensional stability, longevity, as well as fire and weather resistance. These attributes render them versatile and indispensable in numerous aspects of building construction, from cladding, partitions, and structural walls to pavements and chimneys. Globally, an astounding 1,600 billion bricks are produced annually, underscoring their paramount role in the construction landscape [1].
The manufacturing process of ceramic products shares a commonality, regardless of the materials employed or the intended final product. This process unfolds through several well-defined stages: the extraction of raw materials, the transportation and storage of these materials, the preparation of raw materials, shaping, drying, and ultimately, firing [2].
This work aims to showcase that the integration of Refuse-Derived Fuel (RDF) into the ceramic mass of clay blocks can effectively enhance their thermal insulation characteristics [3]. The primary focus is on assessing the impact of this incorporation on the production process and the final product, with a particular emphasis on the extrusion and drying phases. By enhancing the thermal insulation properties of these clay blocks, we anticipate a reduction in heat loss, which in turn offers improved temperature maintenance. This improvement has the potential to yield energy savings and financial benefits. Bricks are a fundamental element in construction, and enhancing their thermal insulation properties carries substantial economic and environmental implications, particularly when utilizing RDF as a recycled waste material to achieve this enhancement.
Furthermore, integrating RDF into the ceramic body mass on an industrial scale proves feasible without exorbitant expenses or substantial modifications to existing production environment. As depicted in Figure 1, RDF is a lightweight material and can be seamlessly introduced into the production line via a dedicated system [4]. The transportation of RDF from production facilities to brick manufacturing sites poses no logistical challenge, as RDF's inherent lightness and compressibility allow for its cost-effective and secure transit via various means of transportation.
In an era characterized by sustainable practices and heightened environmental awareness, this study embarks on an exploration of innovative approaches within the realm of construction and manufacturing. Our investigation centers on the behavior of three distinctive brick mixtures throughout the production process, encompassing pre-crushing, extrusion-forming, and drying stages. The first mixture, consisting of unadulterated clay, serves as a control for comparative analysis. The second mixture blends non-hazardous RDF with clay in varying 10% to 90% volume ratios, while the third introduces a pioneering element—a 10% milled RDF content. The leaching process of RDF is executed through a hammer mill, intimately mixing RDF with silica sand. Our overarching objective is to comprehensively unravel the behavior of the wet and dry brick products at each production stage [5].
This study aspires to shed light on the potential advantages and challenges associated with the incorporation of RDF into clay-based products, ultimately contributing to sustainability and waste reduction in construction and manufacturing [6]. Our findings promise to furnish valuable insights into the performance and feasibility of these mixtures, offering crucial information for industries striving to adopt eco-conscious production methods.
This article will not only unveil the applied methodology and the experimental setup but also present the results pertaining to the behavior of these RDF-inclusive clay block mixtures in the production environment [7]. We anticipate that this research will wield a considerable influence on future practices and policies, contributing to the growing body of knowledge regarding eco-friendly and sustainable manufacturing processes.
In summary, this study endeavors to address fundamental questions concerning the behavior and viability of RDF-enhanced clay block mixtures in the production realm. By doing so, it actively participates in the ongoing endeavor to minimize environmental impact within the construction and manufacturing sectors [8].
The prepared mixtures underwent a systematic labeling process, as outlined in Table 1. Subsequently, a comprehensive series of tests was conducted to evaluate their performance across various stages, encompassing preparation, extrusion, shaping, and drying properties. The results of these tests are meticulously documented in Table 2, providing a detailed insight into the characteristics and behaviors of the constructed mixtures throughout the production process.
The primary objective of this study was to delve into the intricate relationship between the grain size of Refuse-Derived Fuel (RDF) and its impact on various pivotal aspects of the brick manufacturing process. Specifically, the research aimed to elucidate how RDF grain size influences the molding of wet bricks during vacuum extrusion and the precision of cutting the extruded wet bodies into standardized dimensions [9]. Furthermore, the study sought to assess the sensitivity of the drying process within RDF-infused mixtures and provide a comprehensive comparative analysis of drying-related metrics, including weight losses, linear drying shrinkage, densities of the final dried samples, bending strength, and the reabsorption of moisture from the surrounding atmosphere. The results of these meticulously conducted experiments offer profound insights, shaping our understanding of the feasibility and implications of integrating RDF into ceramic mass, particularly concerning the development of environmentally friendly "green bricks."
This comprehensive analysis not only enhances our comprehension of how RDF grain size impacts each stage of brick manufacturing but also sheds light on the multifaceted potential of these materials in the construction industry. By scrutinizing these key parameters, this study contributes essential knowledge to the ongoing discourse surrounding sustainable building practices. The findings have the potential to usher in a new era of eco-conscious brick production, redefining industry standards and advancing the cause of sustainable construction.
2. Materials and Methods
2.1. Materials
To comprehensively assess the impact of Refuse-Derived Fuel (RDF) on the ceramic mass and experimentally validate its potential to enhance the thermal insulation properties of clay blocks, a meticulous laboratory simulation of the entire production process was conducted. The objective was to investigate the effects of RDF incorporation from the initial processing of raw clay material to the final firing of the samples, accompanied by essential tests on the fired specimens. While the laboratory tasks adhere to standard clay material testing procedures, the unique nature of the RDF additive necessitated a modified approach.
Three distinct mixtures were formulated and evaluated in this study. The first mixture, designated as "TZ," consisted solely of plain clay material. The second mixture, labeled "TZRDF10," combined clay material with 10% raw RDF, while the third mixture, identified as "TZRDF10 P," integrated clay with 10% processed RDF. In all mixtures, the requisite amount of water was added to facilitate uniform blending. It's noteworthy that the clay material utilized in all three cases originated from the same quarry to isolate the impact of RDF exclusively. The clay material, sourced from CHALKIS S.A. in the Vasiliko Evia region, has been employed for tile production at the factory for over two decades and falls under the classification of inorganic clay with moderate plasticity, according to ISO 14688-2:2017.
The chemical composition of the clay was determined and is detailed in Table 4. The analysis was conducted using Atomic Absorption Spectrometry (AAS), adhering to ISO 26845:2016 standards. Furthermore, the granular characteristics of the TZ material were examined in accordance with ASTM D422-63 (2007), as it can be seen in Table 5. The clay's average density, assessed following ASTM D698-12, stands at approximately 1781 Kg/m3. Upon transportation from the manufacturing site to the laboratory, the clay exhibited an average moisture content of 8.15%. Table 3 provides a comprehensive overview of the fundamental characteristics of the TZ material [10]. In accordance with ISO 14688-2:2017 classification, TZ can be described as an inorganic clay with a medium level of plasticity.
The RDF employed in this study was procured from one of the largest waste management companies in the Mediterranean. Differentiating between raw and processed RDF was crucial, primarily due to their influence on the production process. The physical attributes of the acquired non-hazardous RDF are detailed in Table 6. Furthermore, Table 7 presents the metal content, while Table 8 offers insights into the presence of halides and sulfur. Lastly, Table 9 provides an analysis of the organic content, as indicated by the Total Organic Carbon (TOC) measurement [11].
Raw RDF refers to its original form when added to the mix, whereas processed RDF undergoes grinding and shredding before integration [12]. This differentiation was deemed necessary due to the heterogeneous nature of RDF, comprising biodegradable materials, primarily paper and plastics, with occasional wood and varying types of plastic pieces, ranging from soft bag fragments to rigid components from packaging or even razor handles. The inclusion of processed RDF was chosen to ensure more consistent results and to address any potential issues arising from the raw form.
The laboratory procedures encompassed both quality control, focusing on material properties and the extrusion process, and technological control, which involved tests simulating factory conditions and processes. Quality control included the calculation of calcium carbonate content (calcimetry) and grain size estimation (granulometry) and was conducted solely on the pure clay material mixture, as RDF addition did not affect these results. Technological testing comprised the calculation of Pfefferkorn plasticity, the manufacture of specimens in a high-pressure press under vacuum, evaluation of the drying cycle, determination of bending strength for dried specimens, assessment of re-absorption capacity in dried specimens, evaluation of specimen properties and density calculation for dried specimens.
This comprehensive methodological approach allowed for a rigorous examination of how RDF incorporation impacts each stage of the brick manufacturing process and its potential for enhancing the production environment in a brick plant [13]. The results obtained from these tests form the basis for drawing meaningful conclusions regarding the utilization of RDF in ceramic mass, particularly in the context of environmentally friendly brick production.
In the course of these experiments, silica sand was employed in conjunction with RDF, with the primary objective of reducing the size of the RDF particles through the use of a hammer mill. Silica sand primarily consists of two main elements: oxygen and silica. More specifically, silica sand is primarily composed of silicon dioxide (SiO2). Quartz, a crystalline mineral constituted by silicon dioxide, is known for its chemical inertness and relatively high hardness, rating 7 out of 10 on the Mohs hardness scale [14]. The selection of this particular type of sand, denoted as ZK, was driven by its finer texture and its absence of unwanted additives, making it a preferable choice over sea sand or sandy clays All the tested materials can be seen in Figure 2.
One notable challenge encountered in this process arises from the composition of RDF, which predominantly includes plastic and paper materials. These components, owing to their lightweight nature, cannot be effectively ground within the hammer mill, especially given the elevated temperatures generated inside the mill. Furthermore, the RDF particles are unable to pass through the metallic screen with a 2mm mesh size. To overcome this issue and facilitate the study, a 1:1 mixture of RDF and sand was adopted, streamlining the grinding process for the RDF component. The grain size of the sand can be seen in Table 10.
2.2. Methods
The initial phase of this study involved the drying of all the aforementioned materials in a laboratory electric dryer of the SCN/400/DG model, maintaining a temperature of 105°C for a duration of twenty-four (24) hours. Subsequently, the clay and sand materials were subjected to preliminary crushing using a jaw crusher, specifically model A92, featuring jaws with a 2mm clearance. In the case of the clay material and the RDF-sand mixture, intended for the formulation of mixture no.3 (TZRDF10 P), these materials underwent further processing through a laboratory hammer mill, designated as Mod. HM/530 Series. This mill utilized a 1mm mesh screen to facilitate the comminution process.
The materials were meticulously weighed according to their respective mixing ratios, taking into account their prevailing moisture content. Subsequently, these materials were thoroughly blended according to the specific formulation for each mixture. This blending process occurred within a kneading mixer, where the requisite amount of water was carefully introduced. The addition of water was meticulously controlled until achieving an optimal plasticity index, determined through the Pfefferkorn's test.
The Pfefferkorn plasticity method hinges on the observation of the sample's deformation in response to the calibrated plate's descent onto the underlying test body, shaped with the aid of an auxiliary shaping tool [15]. This test employs two distinct reading scales, one measuring the deformation in millimeters, and the other determining the deformation in line with the Pfefferkorn theory. For our study, the Pfefferkorn plasticity tester employed was Ceramic Instruments 01CI4540, and we adopted the calculation method described by Andrade et al [16]. It is crucial to emphasize that the amount of water added is unique to each premixture and is contingent upon the clay material's absorbent properties and the specific extrusion process employed for a given type and final product.
The uniformly blended mixture for each test underwent extrusion through a vacuum-extrusion process to form rectangular samples of standardized dimensions [17]. The laboratory extruder, specifically the HANDLE KHS-Type: PZVM8b model, was employed for this purpose. The wet material, post-mixing, was loaded into the feeding chamber, equipped with an upper porch for material input, followed by a pre-extruder mixer incorporating a screw mixer responsible for propelling the material through an air vacuum chamber and out of the extruder's outlet, Figure 3. The extrusion process was carefully monitored, including pressure levels, through a pressure gauge. The extruder's outer section allowed for the incorporation of interchangeable molds, facilitating the production of extruded products in various sizes and shapes. All the extruded samples were solid, lacking any hollow spaces within their mass, and conformed to a standardized size of 120 × 20 × 20 mm (length × width × height). Notably, the vacuum pressure applied during the extrusion process remained consistent and uniform across all tested mixtures, consistently registering at 0.8 kp/cm2. The plasticity, as assessed by the Pfefferkorn method, fell within the range of 0.7 to 0.9 for all mixtures, achieved by carefully adjusting the water content. In total, each test involved the construction of fifteen (15) individual samples. Consequently, across all three (3) mixtures examined, a total of 45 samples were meticulously prepared (3 mixtures × 15 samples).
2.3. Drying procedure
The drying process for all extruded specimens was conducted systematically within a laboratory electric oven of SCN/400/DG type. This drying cycle comprised three distinct phases [18], each demanding meticulous attention to address potential issues related to the samples, as can be seen in Figure 5.
The initial "humidity" phase was characterized by maintaining a high ambient humidity within the dryer, an essential step to keep the surface pores of the bricks open. This phase is particularly critical, as any mismanagement may result in the development of cracks, deformations, or fragility in the bricks.
Subsequently, during the "shrinkage critical point phase," it was imperative to ensure that the drying shrinkage was completed before the temperature increased significantly for the final drying phase. It was crucial to manage the temperature rise gradually to prevent any cracking issues.
In the last phase, the primary objective was to minimize the remaining body humidity within the bricks as much as possible. All regulations and settings during these phases were tailored to the specific production mixture and its unique behavior.
The initial focus of the drying process was to keep the surface pores of the samples open to facilitate the gradual loss of humidity from the internal body. This phase represented the most critical juncture. In the subsequent phase, as the temperature rose and dryer humidity decreased, any mishandling could lead to the occurrence of cracks, deformations, or increased fragility in the bricks. The dried samples resulting from this carefully orchestrated drying process are illustrated in Figure 4.
2.4. Drying sensitivity of samples
Drying sensitivity assessment for the formulated mixtures involved the individual application of Bigot's curve method [19]. Under controlled conditions, the test samples were exposed to a temperature of 25°C within the laboratory dryer, with the humidity level maintained at a stable 75% inside the dryer. Bigot's curve, a graphical representation, illustrated the fluctuations in water content relative to linear shrinkage over a 24-hour period.
Bigot's curve method divides the drying process into two distinct phases. The initial phase, characterized by a constant and rapid drying rate, is indicated by a high linear correlation coefficient. This phase remains consistent until the critical point is reached. Subsequently, in the second phase, the drying rate gradually decreases, and shrinkage approaches its conclusion [20].
The laboratory dryer, a crucial component of this study, was equipped with the necessary instruments to analyze the drying shrinkage behavior of the green brick samples. Comprising three essential sections – the tunnel dryer unit, the air preparation unit, and the control system incorporating measurement sensors and data acquisition – the dryer had a volume of approximately 125 cm3 and was thoughtfully insulated to minimize heat loss to the surroundings.
Within the air preparation unit, an adjustable centrifugal fan and an adjustable electrical heater played key roles. The centrifugal fan drew drying air from the ambient surroundings. The temperature of the drying air was precisely controlled through a PID-regulated system (Jumo Dtron 304). The drying air, initially passing through an electrical heating zone, then flowed over the sample, maintaining a parallel trajectory to the surface of the sample positioned on a wire mesh. The distance between the hot air inlet and outlet within the tunnel dryer unit was 75 cm, with a 35 cm separation from the air inlet to the sample holder.
To establish steady-state testing conditions, the air fan and electrical heater were initially engaged. Subsequently, a green brick sample was placed on the metallic carrier. Throughout the experiments, the humidity level of the drying air was meticulously monitored. Relative humidity within the dryer was measured every 5 minutes using a humidity sensor (TMI Orion—CeriDry), adhering to the precise measurement procedures and methodology outlined by Makrygiannis and Karalis [21]. The drying sensitivity level was determined by the CSB index, an indicator of drying sensitivity according to Bigot. The classification of sensitivity levels is presented in Table 11.
2.5. Measurements
The determination of weight losses was executed using the Kern FKB 36K0.2 laboratory scale. Linear drying shrinkage and firing linear shrinkage measurements followed the standards outlined in ASTM C326-09. Bending strength evaluations for the dried samples were conducted using test specimens sized at 120 × 20 × 20 mm. A three-point bending test device, with a 100 mm distance between the support points, was employed for this purpose. Each composition and production method was represented by 3 test specimens.
To calculate the water content after drying, a set of 15 test samples from each preparation procedure, each measuring 120 × 20 × 20 mm, were weighed immediately after shaping. Subsequently, these samples underwent a 24-hour drying cycle within the laboratory oven, as previously described. The preparation water content was derived from the wet and dry weight using the formula specified below:
In order to avoid any misunderstandings, the weight of the dry specimens was used as a reference throughout.
3. Results
The results came out from the constructed mixtures, of which the same number of constructed samples were tested through the same process environment.
The study involved testing fifteen samples, all constructed from mixtures of TZ clay and RDF (Recycled Demolition Waste). In these mixtures, RDF was added to TZ clay at a ratio of 10 wt.%, the maximum allowable quantity for lightweight additives in a brick and tile factory. Exceeding this limit can negatively impact the final product's strength and quality, which is discouraged. The clay and additives were thoroughly mixed for 40 minutes using a conical rotated mixer model MI/10.
A comprehensive set of experimental tests, encompassing preparation, extrusion, and drying phases, was conducted to assess variations in mechanical and physical properties and their relationship with the production environment. To differentiate between the different mixtures, each one was labeled with specific abbreviations. For instance, mixtures of TZ clay with unprocessed RDF were denoted as TZRDF10, while mixtures with processed RDF were labeled as TZRDF10P. The study placed significant emphasis on three critical aspects of the production process, with particular attention to seven key parameters, as detailed in Table 12.
3.1. Preparation
One of the most challenging aspects of this study was the need to break down the RDF (Recycled Demolition Waste) into pieces smaller than 3mm. This step was crucial to ensure that the RDF could be effectively mixed with the clay material, preventing any issues related to an uneven grain size distribution that might affect the homogenization of the mixture with water. It was also essential to avoid potential problems arising from stresses during extrusion and difficulties encountered when cutting the wet body into standard samples measuring 120mm in length.
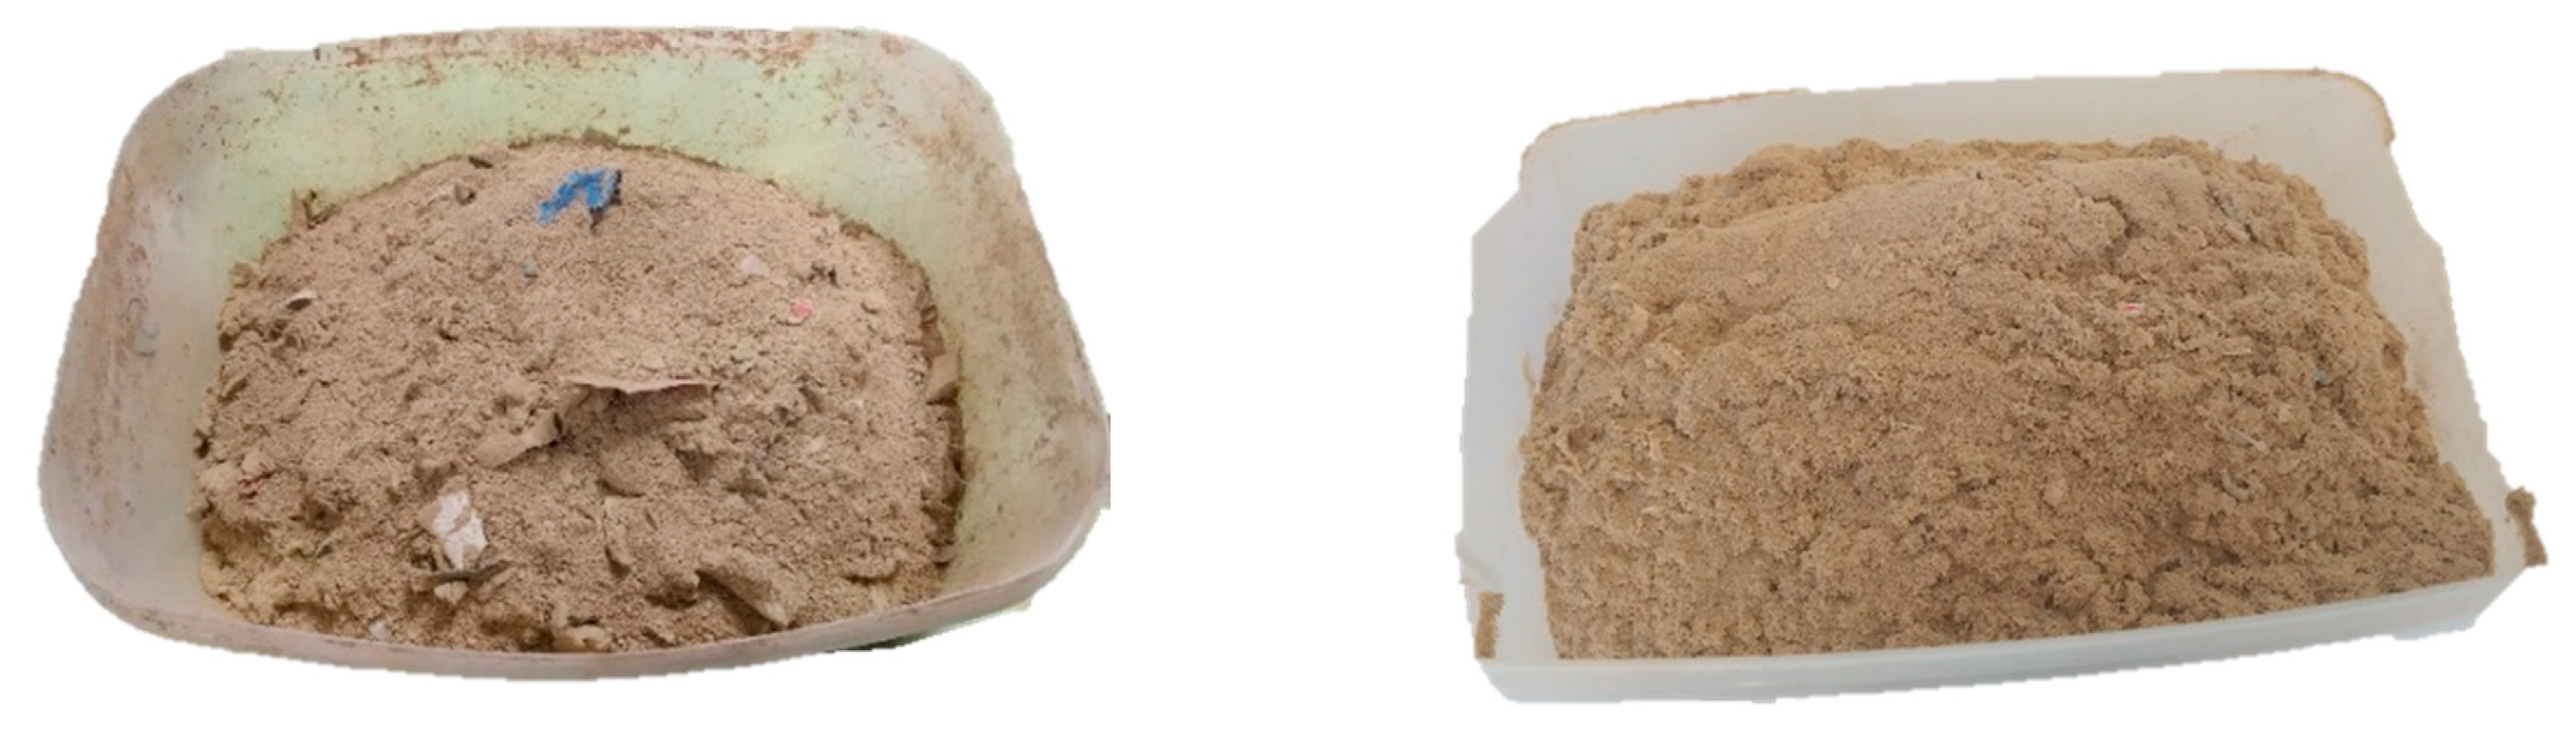
In the brick industry, it is not common to employ grinding machines for lightweight materials like RDF. This is primarily due to concerns related to the capacity of such machinery and the associated electricity costs. In this study, an innovative approach was adopted to address this challenge. Instead of using a conventional grinding machine, the research team utilized a standard piece of equipment commonly found in the dry preparation process of brick and tile production, known as a hammer mill. The key innovation was mixing the RDF with sand at a 1:1 ratio within the hammer mill, as can be seen in Figure 5.
This approach proved highly effective for several reasons [22]. Firstly, it eliminated issues related to the melting of the RDF inside the mill, as the combination with sand helped maintain a stable processing environment. Secondly, the hardness of the sand prevented excessive wear and tear on the mill's sieves. Importantly, this method yielded exceptional results and ensured that no complications arose during subsequent procedures, such as extrusion and drying.
Figure 5.
Left: mixture with unprocessed RDF (TZRDF10), Right: mixture of processed RDF (TZRDF10P).
3.2. Extruding
During the extrusion process, it was observed that the mixture containing processed RDF exhibited a noticeable increase in the plasticity of the wet mixture, requiring approximately 1% more extrusion water compared to the 100% clay mixture. Conversely, the mixture containing unprocessed RDF (TZRDF10) displayed better plasticity, requiring nearly the same amount of water as the reference mixture (100% clay - TZ mix) for extrusion. However, challenges emerged during the subsequent cutting phase, where the wet product was shaped into samples [23].
The difficulties encountered during cutting were primarily attributed to the size of the RDF particles. The cutter wire tended to catch and drag the larger RDF pieces, resulting in elevated pressure on the loam material. This, in turn, led to significant stresses, hindered the cutting of specimens, and even caused the detachment of material along the cutting edges. These issues highlighted the unique challenges posed by the presence of unprocessed RDF within the mixture, particularly when it came to the precision of the cutting process (Figure 7). The plasticity and the necessary water for all mixtures can be seen in detail in Figure 6.
3.3. Drying
The drying results of the study revealed a reduction in sensitivity when RDF (Recycled Demolition Waste) was incorporated into the mixtures. The decrease in sensitivity, as shown in Figure 8, was more pronounced in the case of mixtures containing unprocessed RDF, although it was not significantly different compared to the mixtures with processed RDF. This indicates that both types of RDF had a mitigating effect on sensitivity during the drying process.
The drying shrinkage results paralleled the sensitivity findings, with the lowest decrease observed in the mixture containing unprocessed RDF (TZRDF10). This suggests that the unprocessed RDF had a more prominent impact on reducing drying shrinkage, further supporting the overall reduction in sensitivity [24].
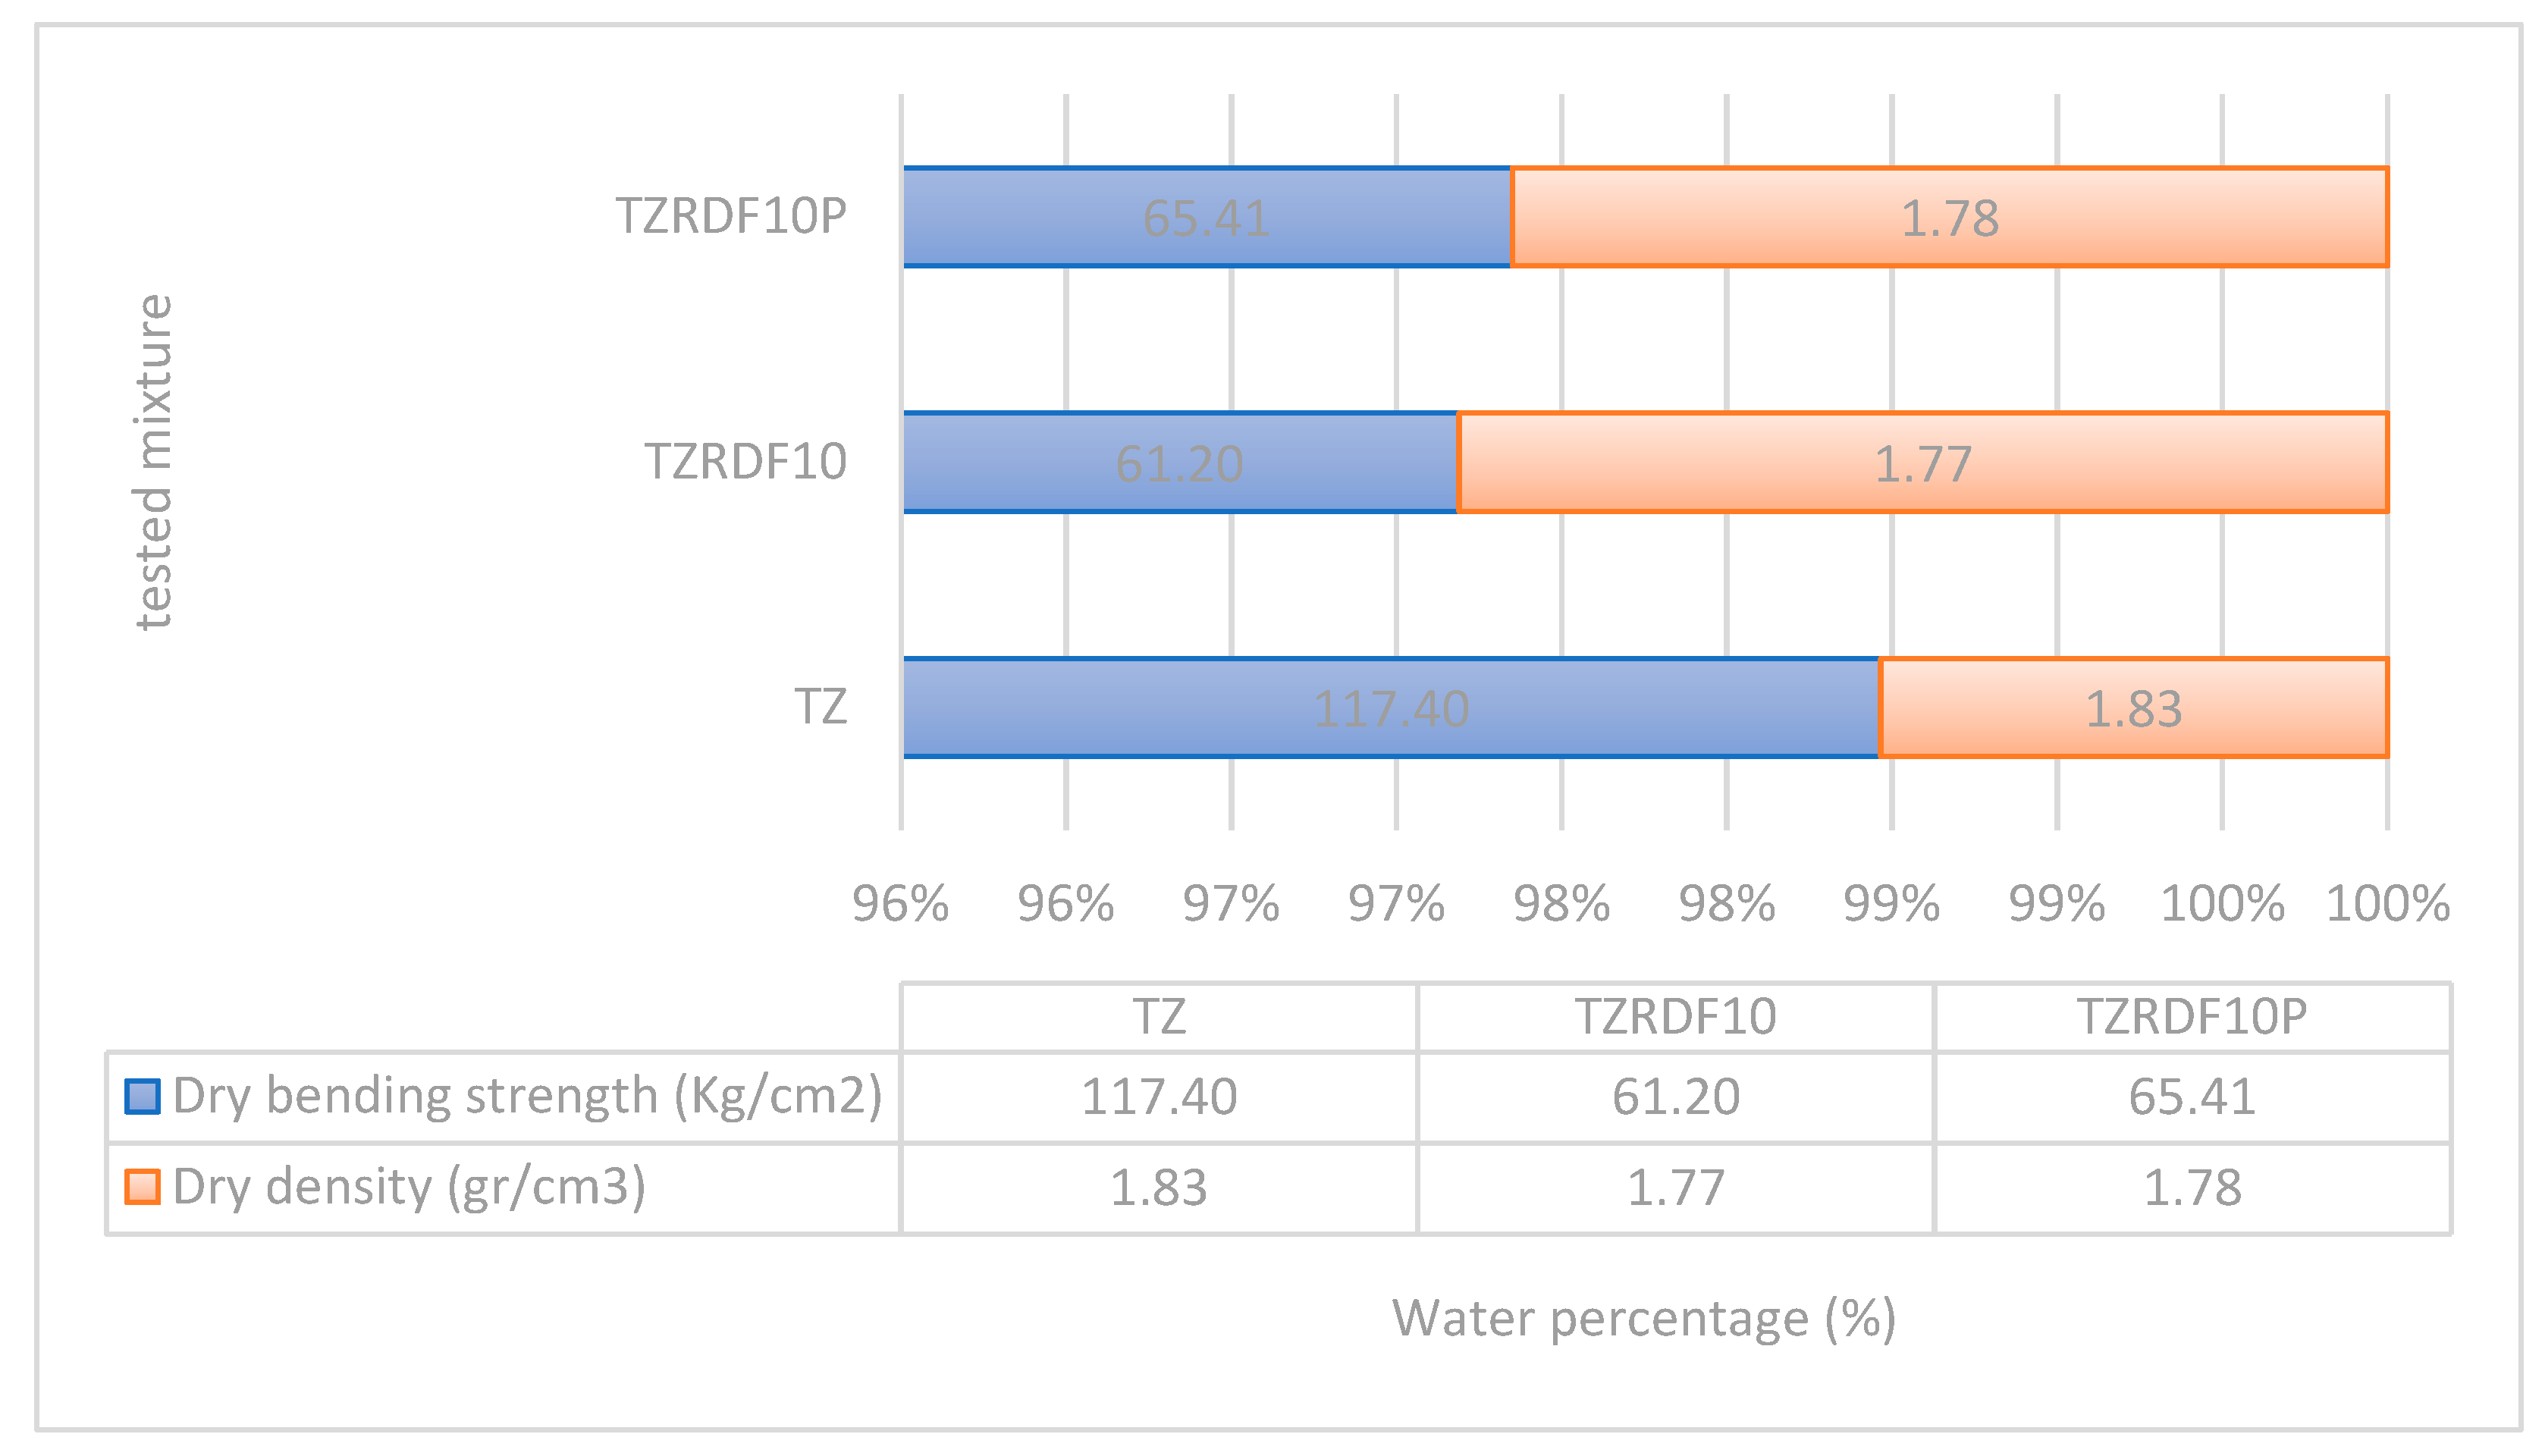
However, it's noteworthy that the inclusion of RDF had a significant adverse effect on the bending strength of the dry product, as illustrated in Figure 9. This reduction in bending strength is an important consideration in the context of brick and tile production, as it may affect the structural integrity of the final product.
Moreover, RDF incorporation also resulted in a decrease in the dry product's density. This decrease in density implies that the product became lighter, which can be a crucial factor in a brick and tile factory, especially when considering the overall weight and handling of the final product. The reduction in density, while beneficial in terms of weight, should be balanced with the potential impact on the product's structural strength, as highlighted by the decrease in bending strength.
Figure 8.
Drying linear shrinkage and drying sensitivity of the dried samples.
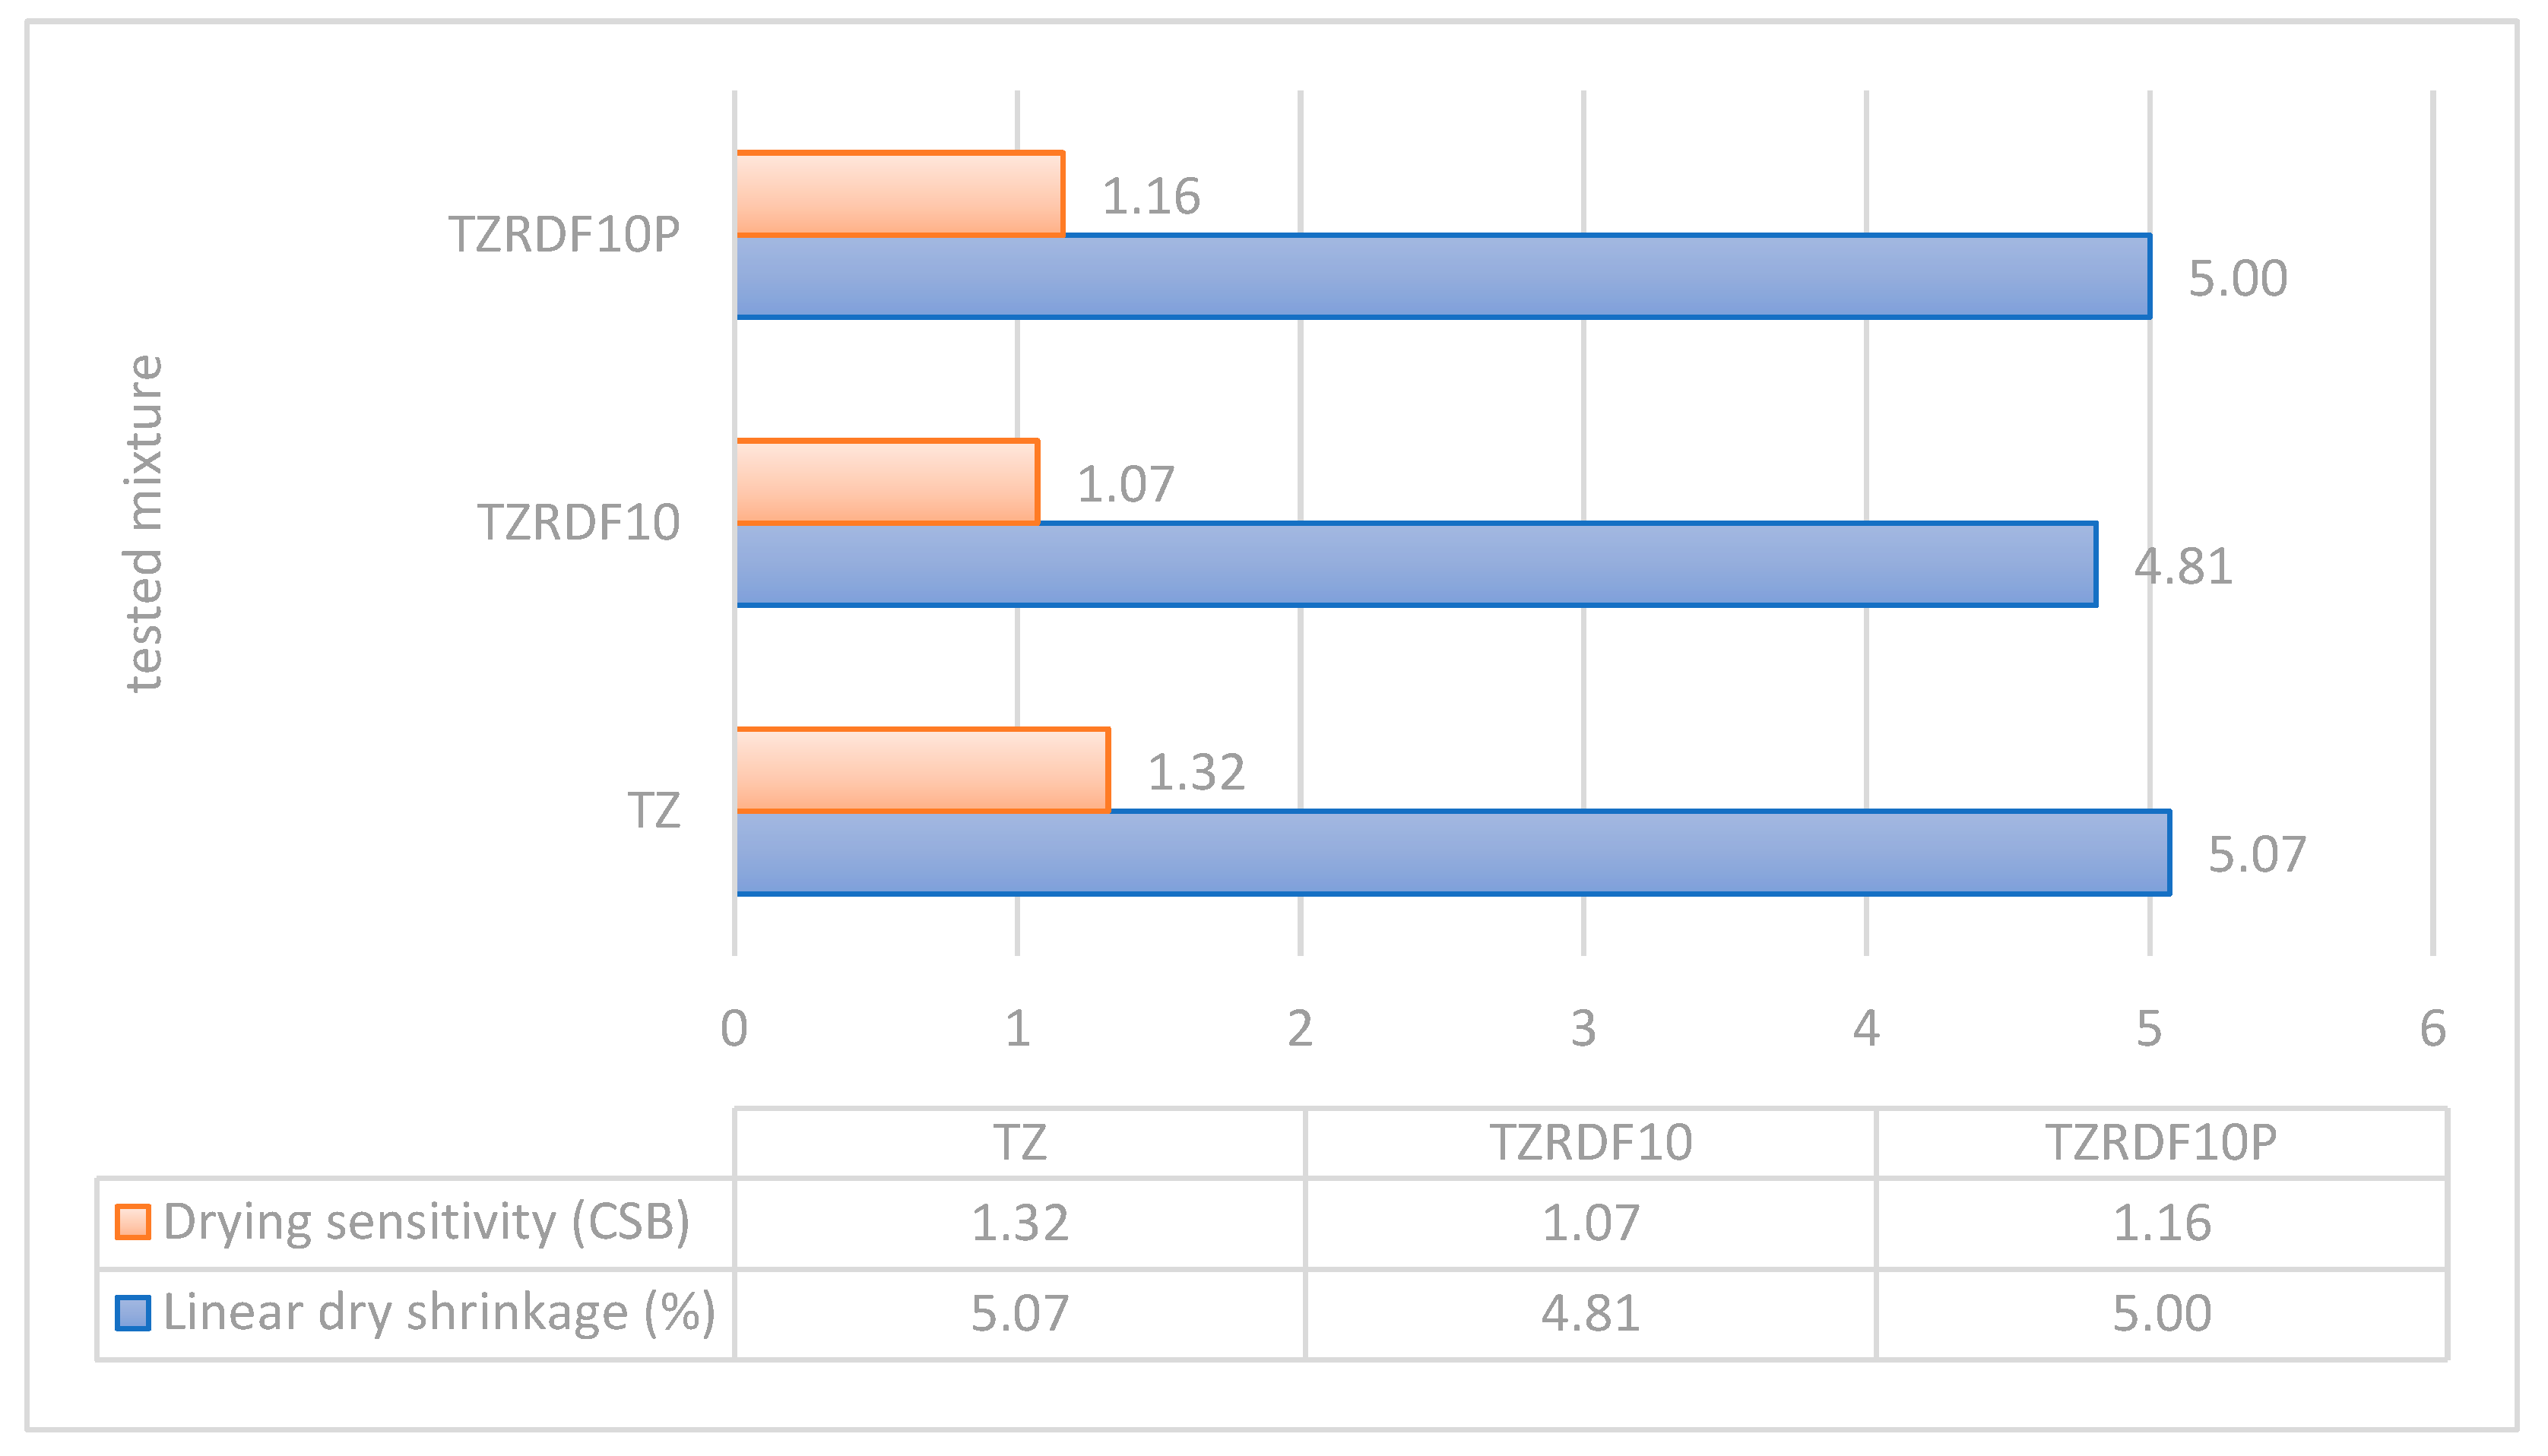
Figure 9.
Drying Bending strength and density of the dried samples.
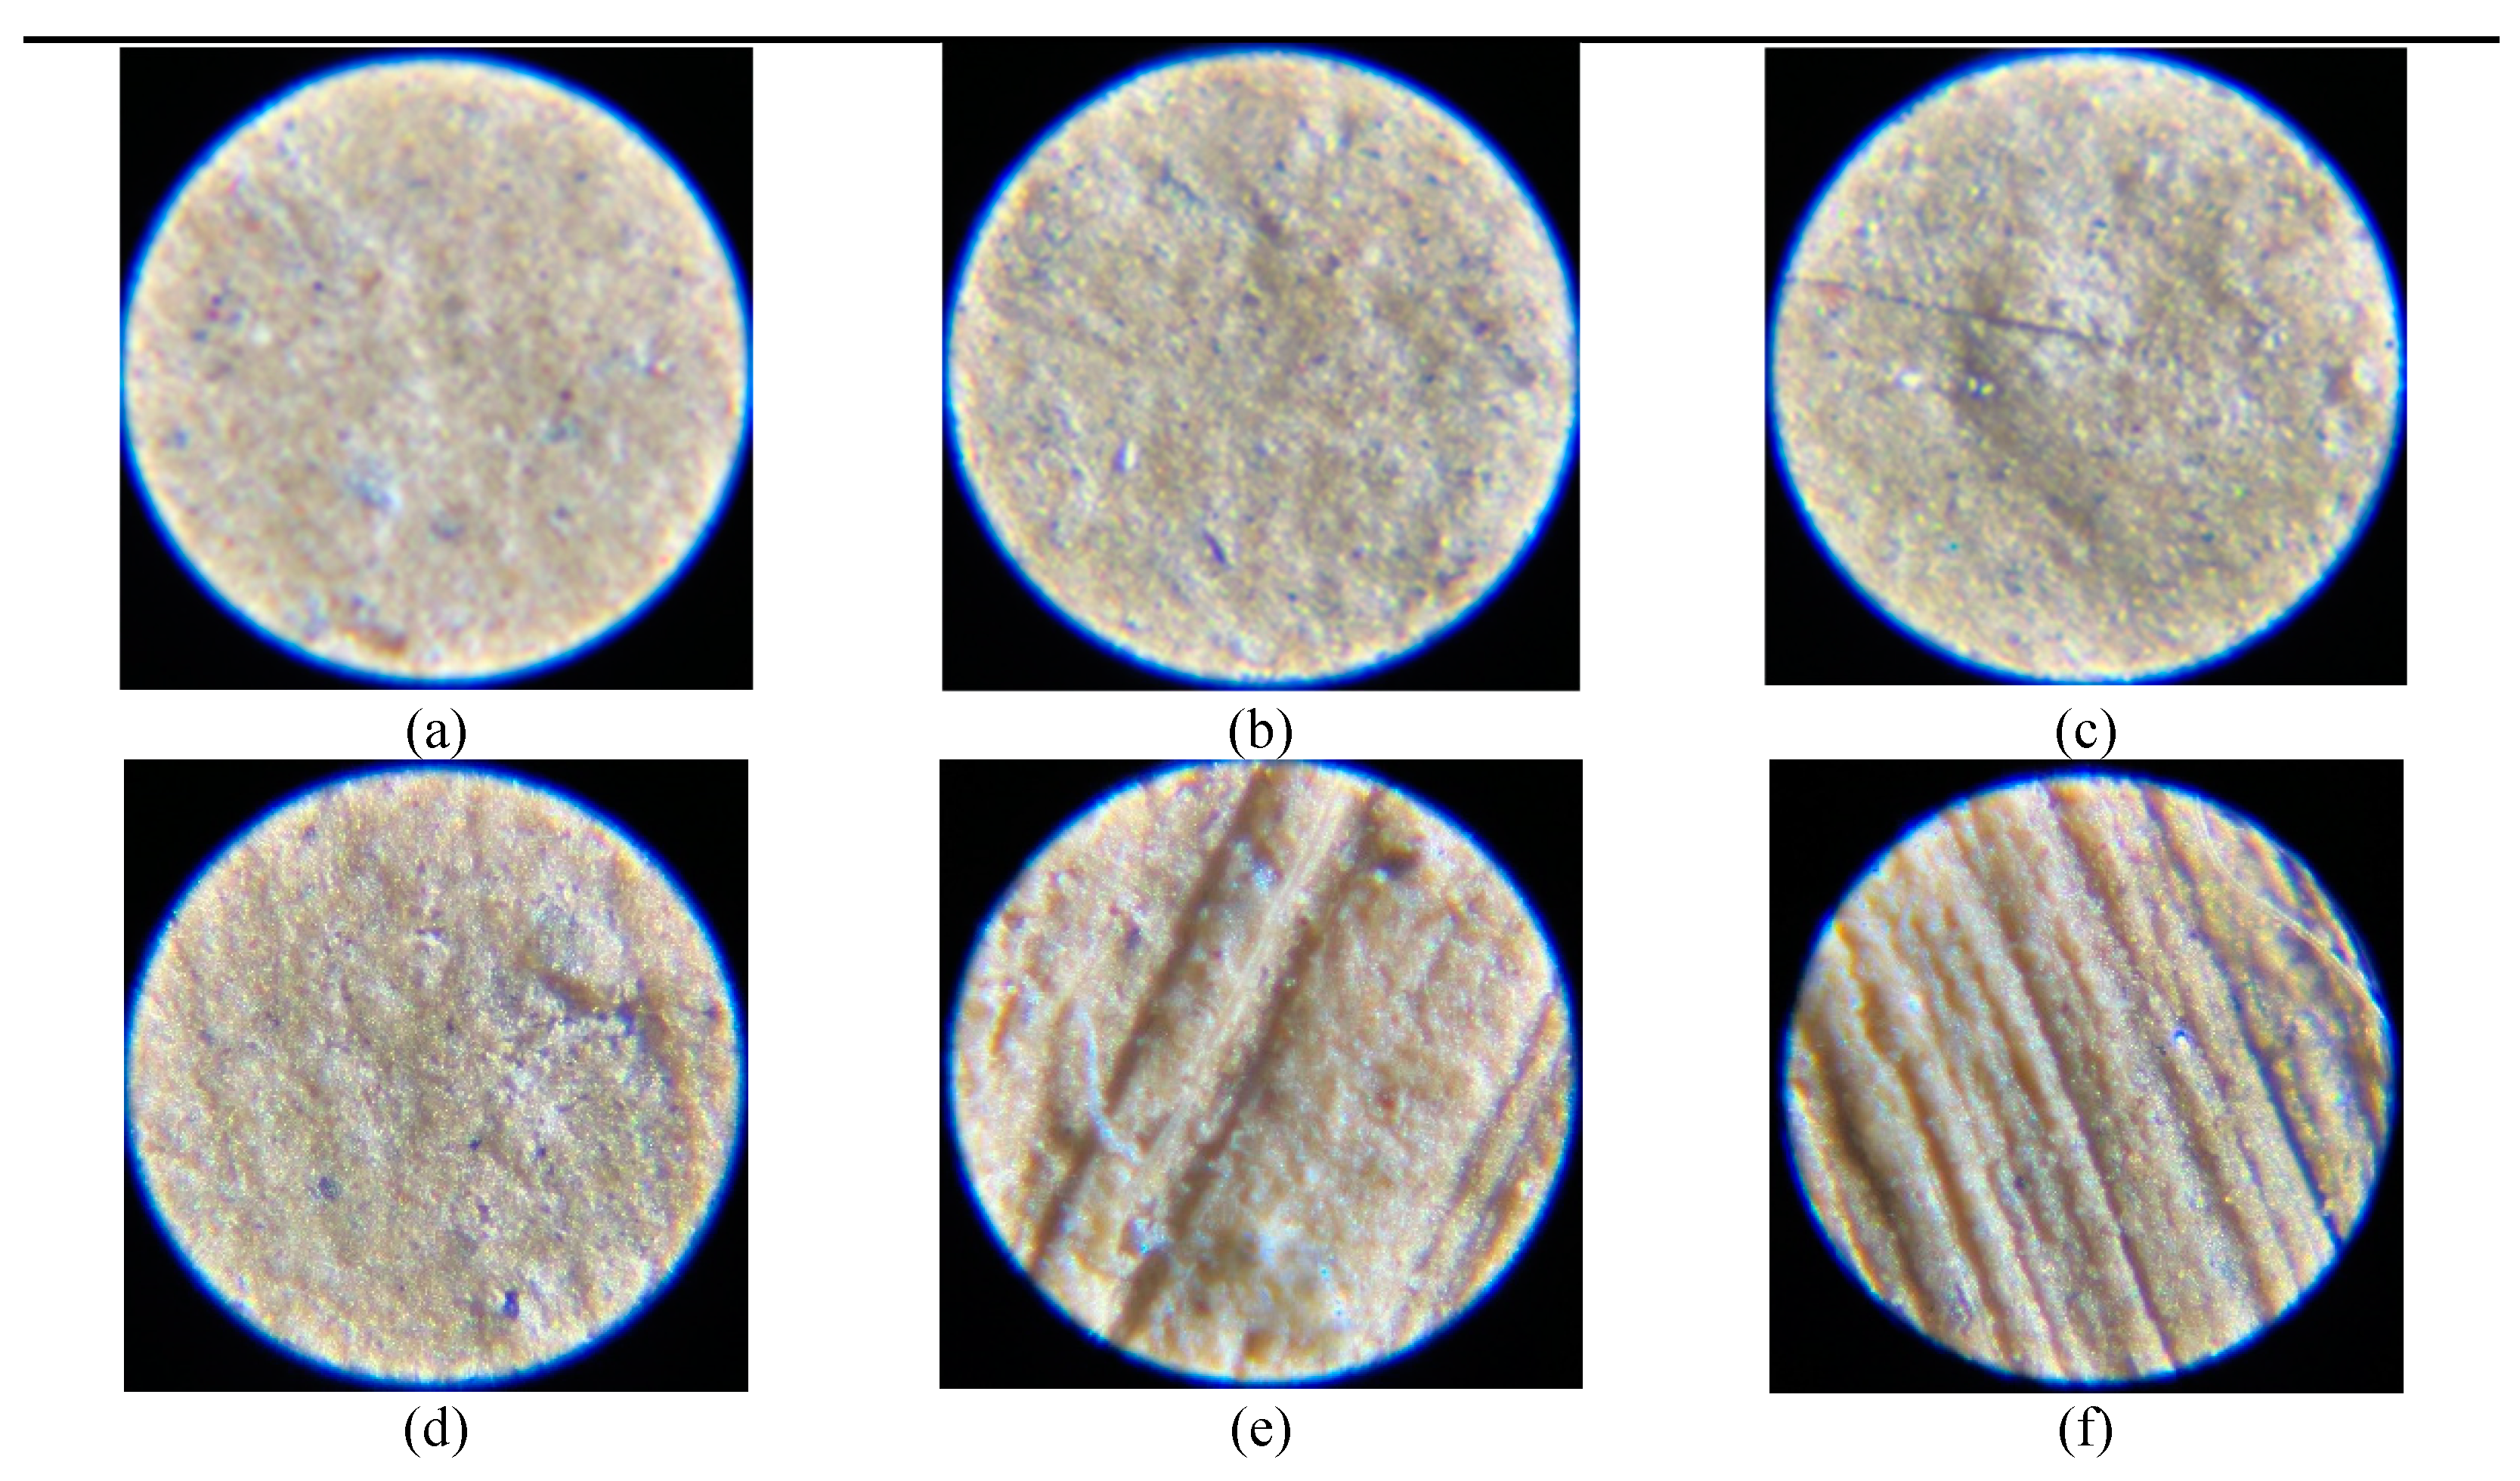
In order to highlight the value of incorporating the tested RDF (Recycled Demolition Waste) into the clay ceramic mass, an extensive compilation of results obtained from the research's process environment was undertaken. These findings have been meticulously documented and are available for review in Table 13. Furthermore, for a visual representation of these results, detailed microphotographs can be found in Figure 10. These visual aids provide a more comprehensive understanding of the impact of RDF integration on the clay ceramic mass, shedding light on the microscopic aspects of the material and further enhancing the study's comprehensiveness [25].

Table 13.
Mixture proportions and gathered results.
| Mixture | TZ | TZRDF10 | TZRDF10P | |
|---|---|---|---|---|
| wt.-% | wt.-% | wt.-% | ||
| Material 1 - Clay TZ | TC1 | 100 | 90 | 90 |
| Material 2 - RDF (as obtained) | TC2 | - | 10 | - |
| Material 3 - RDF (processed) | TC3 | - | - | 10 |
| Plasticity by Pfefferkorn | 0.79 | 0.77 | 0.73 | |
| Added initial water | wt.-% | 17.44 | 18.71 | 19.05 |
| Linear dry shrinkage | % | 5.07 | 4.81 | 5.00 |
| Drying sensitivity (Bigot's curve) | CSB | 1.32 | 1.07 | 1.16 |
| Bending strength / dry | Kg/cm2 | 117.40 | 61.20 | 65.41 |
| Re-absorprtion of dry product | MPa | 2.48 | 2.71 | 2.63 |
| Remaining water on dry program | % | 1.35 | 1.24 | 1.28 |
| Body density of dry material | gr/cm3 | 1.83 | 1.77 | 1.78 |
Figure 10.
(a) Surface of dry sample from 100%. (b) Surface of dry sample from TZRDF10 (unprocessed RDF). (c) Surface of dry sample from TZRDF10P. (d) side view from the cutting area of dry sample from TZ. (e) side view from the cutting area of dry sample from TZRDF10. (f) side view from the cutting area of dry sample from TZRDF10P.
Figure 10.
(a) Surface of dry sample from 100%. (b) Surface of dry sample from TZRDF10 (unprocessed RDF). (c) Surface of dry sample from TZRDF10P. (d) side view from the cutting area of dry sample from TZ. (e) side view from the cutting area of dry sample from TZRDF10. (f) side view from the cutting area of dry sample from TZRDF10P.
4. Discussion
The utilization of RDF (Recycled Demolition Waste) plays a pivotal role in diverting waste from landfills, consequently alleviating the demand for new landfill space. This sustainable approach contributes to environmental protection and promotes responsible waste management practices. Notably, components such as carbides and inorganic elements within RDF undergo combustion at temperatures exceeding 550 °C. This quality prompted our investigation into the feasibility of incorporating RDF as an additive in ceramic mass intended for brick production, where firing temperatures often surpass 850°C.
Our study is divided into two distinct phases. The first part, which we discuss in this work, focuses on the preparation of RDF, its incorporation into ground clay materials, and its impact on the extrusion and drying processes. The second part, concerning the firing procedure for RDF as an additive in brick mass, will be the subject of future research. In this current study, we concentrate on the initial phase, where we developed methods for efficiently utilizing RDF as an additive and successfully grinding it without encountering any issues. Furthermore, we delve into how the size of RDF particles influences the quality of vacuum-extruded bricks and their drying properties.
Initially, we crafted two mixtures by incorporating RDF into the clay mass, which were subsequently mixed, extruded, cut into specified dimensions, and dried using a simulated drying program mimicking a real brick plant [26]. We compared the results to those of a 100% clay mixture, which was used as a reference to showcase how RDF and its particle size impact crucial parameters during extrusion and drying. These parameters include:
- The amount of water required for extrusion and the plasticity of the wet mixture.
- Drying sensitivity, as illustrated by Bigot's curve.
- Drying linear shrinkage and strength.
- The density of the dry samples and their reabsorption from the environment.
The results of our study indicate that our innovative process for RDF implementation, involving grinding methods and mixing with clay materials using brick and tile industry machinery, yielded promising results for the production mixture of RDF and clay materials. Incorporating sand, as explained in the results section, facilitated the hammer mill's ability to grind materials to particle sizes smaller than 2mm. This enhanced the mixing process, stabilizing it and reducing operational costs by safeguarding the machine from wear and tear caused by the hard grains of sand [27]. Importantly, this process did not generate excessive heat within the hammer mill's grinding chamber due to the presence of sand.
Extrusion tests revealed that the mixture containing unprocessed RDF material posed challenges during extrusion and the brick cutting process. The large RDF particles were difficult to cut efficiently with the wire cutter, resulting in numerous specimens exhibiting cracks, stress, and unstable dimensions. In contrast, using ground RDF demonstrated considerable improvements, reducing these issues by nearly 95%. Additionally, the inclusion of RDF enhanced the plasticity of the mixture, requiring less extrusion water. This not only conserved water resources but also reduced energy consumption during the drying of samples, translating to cost savings for brick plant operations [28].
In terms of drying behavior, the samples displayed reduced sensitivity, as indicated by Bigot's curve, which correlated with decreased drying linear shrinkage. The RDF acted as an inert additive within the ceramic mass [29]. Another significant finding from this study was the 5% reduction in the density of the dried products in the RDF-containing mixture. This suggests that, following the firing procedure, the target of achieving a 10% reduction in density is attainable. A lower density implies increased porosity in the mass, which contributes to improved thermal insulation properties for the final products.
5. Conclusions
In conclusion, our study has demonstrated the potential of incorporating RDF (Recycled Demolition Waste) as an additive in ceramic mass for use in the brick industry, including products like thermoblocks. By diverting waste from landfills, we not only contribute to sustainable waste management practices but also protect the environment by reducing the need for additional landfill space. The combustion of carbides and inorganic elements in RDF at temperatures above 550°C makes it a valuable candidate for enhancing clay-based materials, especially in the brick production process, where firing temperatures often exceed 850°C.
Our research was conducted in two phases, with the first part focusing on the preparation of RDF and its integration with clay materials, as well as its impact on the extrusion and drying phases. We found that the innovative process we employed, using brick and tile industry machinery and incorporating sand, yielded promising results. Grounding RDF particles to less than 1mm particle size not only facilitated the mixing process but also reduced operational costs by protecting the machinery from excessive wear and tear. This approach also helped maintain stable grinding temperatures within the hammer mill.
During extrusion, it became evident that the presence of unprocessed RDF material led to numerous issues, including difficulties during cutting, which negatively affected the quality and dimensions of the specimens. However, the use of ground RDF significantly mitigated these problems, leading to a more efficient and cost-effective process with improved plasticity and reduced water requirements. These findings have practical implications for brick plant operations, as they can lead to resource and energy savings.
The drying behavior of the samples further supported the benefits of RDF integration, showing reduced sensitivity, decreased drying linear shrinkage, and improved density properties. The RDF acted as an inert additive within the ceramic mass, contributing to the desired reduction in density by 5%. Lower density translates to increased porosity, which enhances the thermal insulation properties of the final products, a crucial factor in applications such as thermoblocks.
In the brick industry, where durability, thermal performance, and cost-efficiency are paramount, our findings underscore the potential benefits of incorporating RDF into clay-based materials. While further research is needed to address the second part of our study, which concerns the firing procedure of RDF as an additive in brick mass, the results from this initial phase emphasize the promise of this approach for sustainable and environmentally responsible brick production. By harnessing the advantages of RDF, the brick industry can create products that meet both performance and sustainability goals, setting the stage for a more efficient and environmentally friendly future.
Author Contributions
Conceptualization, O.P. and Κ.Κ.; methodology, A.T. and I.M.; validation, I.M., A.T. and K.K.; formal analysis, I.M. and K.K.; investigation, O.P.; resources, O.P. and K.K.; data curation, A.T. and I.M.; writing—original draft preparation, I.M.; writing—review and editing, A.T., I.M. and K.K.; supervision, A.T. All authors have read and agreed to the published version of the manuscript.
Data Availability Statement
The data presented in this study are available on request from the corresponding author.
Acknowledgments
This study was performed as a part of RES.U.REC.T Project no Τ2ΕΔΚ-03668. The authors are grateful to SABO S.A. staff for providing details for a brick and tile industry operation. Special acknowledges to the XALKIS S.A. company for providing the clay material with the code TZ.
References
- Almssad, A., Almusaed, A., Homod, R.Z. Masonry in the Context of Sustainable Buildings: A Review of the Brick Role in Architecture, 2022, Sustainability 14. [CrossRef]
- Fernandes, F.M. Clay bricks, in: Long-Term Performance and Durability of Masonry Structures. Elsevier, 2019, pp. 3–19. [CrossRef]
- Shehata, N., Obaideen, K., Sayed, E.T., Abdelkareem, M.A., Mahmoud, M.S., El-Salamony, A.-H.R., Mahmoud, H.M., Olabi, A.G. Role of refuse-derived fuel in circular economy and sustainable development goals. Process Safety and Environmental Protection, 2022 163, 558–573. [CrossRef]
- Sarc, R., Lorber, K.E. Production, quality and quality assurance of Refuse Derived Fuels (RDFs). Waste Management 33, 2033, 1825–1834. [CrossRef]
- Brownell, W.E. Forming of Structural Clay Products, in: Structural Clay Products, Applied Mineralogy. Springer Vienna, Vienna, 1976, pp. 63–100. [CrossRef]
- Makrygiannis, I., Tsetsekou, A. Efficient Recovery of Solid Waste Units as Substitutes for Raw Materials in Clay Bricks. Recycling, 2022, 7, 75. [CrossRef]
- Demir, I. Effect of organic residues addition on the technological properties of clay bricks. Waste Management 28, 2008, 622–627. [CrossRef]
- Eliche-Quesada, D., Martínez-García, C., Martínez-Cartas, M.L., Cotes-Palomino, M.T., Pérez-Villarejo, L., Cruz-Pérez, N., Corpas-Iglesias, F.A. The use of different forms of waste in the manufacture of ceramic bricks. Applied Clay Science 52, 2011, 270–276. [CrossRef]
- Gałko, G., Mazur, I., Rejdak, M., Jagustyn, B., Hrabak, J., Ouadi, M., Jahangiri, H., Sajdak, M. Evaluation of alternative refuse-derived fuel use as a valuable resource in various valorised applications. Energy 263, 2023, 125920. [CrossRef]
- Makrygiannis, I., Tsetsekou, A. Effect of Expanded Perlite in the Brick Mixture on the Physicochemical and Thermal Properties of the Final Products. J. Compos. Sci., 2022, 6, 211. [CrossRef]
- Paolo, M., Paola, M. RDF: From Waste to Resource – The Italian Case. Energy Procedia 81, 2015, 569–584. [CrossRef]
- Rotter, V.S., Kost, T., Winkler, J., Bilitewski, B. Material flow analysis of RDF-production processes. Waste Management, 2004. 24, 1005–1021. [CrossRef]
- Junge, K. Additives in the brick and tile industry. Ziegelindustrie International, 2000, 53, 25–39.
- Guzlena, S., Sakale, G., Certoks, S., Grase, L. Sand size particle amount influence on the full brick quality and technical properties. Construction and Building Materials. 2019, 220, 102–109. [CrossRef]
- Modesto, C. de O., Bernardin, A.M. Determination of clay plasticity: Indentation method versus Pfefferkorn method. Applied Clay Science. 2008, 40, 15–19. [CrossRef]
- Andrade, F.A.D., Al-Qureshi, H.A., Hotza, D. Measuring and Modeling the Plasticity of Clays. Mat. Res. 2010, 13, 395–399. [CrossRef]
- Händle, F. (Ed.). Extrusion in Ceramics, Engineering Materials and Processes. 2007, Springer Berlin Heidelberg, Berlin, Heidelberg. [CrossRef]
- Atcholi, K.-E., Padayodi, E., Vantomme, J., Kadja, K., Perreux, D. Experimental study of the drying and modelling of the humidity migration in a clay matrix. Int. J. Simul. Multidisci. Des. Optim. 2008, 2, 91–97. [CrossRef]
- Mancuhan, E., Özen, S., Sayan, P., Sargut, S.T. Experimental investigation of green brick shrinkage behavior with Bigot’s curves. Drying Technology. 2016, 34, 1535–1545. [CrossRef]
- Nascimento, J.J.S., Belo, F.A., de Lima, A.G.B. Experimental Drying of Ceramics Bricks Including Shrinkage, in: Diffusion in Solids and Liquids X, Defect and Diffusion Forum. Trans Tech Publications Ltd, 2015, pp. 106–111. [CrossRef]
- Makrygiannis, I.; Karalis, K. Optimizing Building Thermal Insulation: The Impact of Brick Geometry and Thermal Coefficient on Energy Efficiency and Comfort. Ceramics 2023, 6, 1449-1466. [CrossRef]
- Hossain, S.S., Roy, P.K. Sustainable ceramics derived from solid wastes: a review. Journal of Asian Ceramic Societies. 2020, 8, 984–1009. [CrossRef]
- Su, S.-L. Modeling of multi-phase moisture transfer and induced stress in drying clay bricks. Applied Clay Science. 1997, 12, 189–207. [CrossRef]
- Čáchová, M., Koňáková, D., Vejmelková, E., Keppert, M., Polozhiy, K., Černý, R. Pore Structure and Thermal Characteristics of Clay Bricks. AMR. 2014, 982, 104–107. [CrossRef]
- Gualtieri, A.F., Ricchi, A., Lassinantti Gualtieri, M., Maretti, S., Tamburini, M. Kinetic study of the drying process of clay bricks. J Therm Anal Calorim. 2016, 123, 153–167. [CrossRef]
- Kocserha, I., Kristály, F. Effects of Extruder Head’s Geometry on the Properties of Extruded Ceramic Products. MSF. 2010, 659, 499–504. [CrossRef]
- Hameed, A., Haider, U., Qazi, A.-U., Abbas, S. Effect of Waste Glass on Properties of Burnt Clay Bricks, 2018, 22.
- 28. Galitskov, Stanislav, Nazarov, Maxim, Galitskov, Konstantin. Reducing energy consumption for shaping raw ceramic bricks with coordinated control of auger vacuum extruder. MATEC Web Conf. 2016, 86, 04010. [CrossRef]
- Romualdas Mačiulaitis, J.M., Kičaite, A. The regulation of physical and mechanical parameters of ceramic bricks depending on the drying regime. Journal of Civil Engineering and Management. 2008, 14, 263–268. [CrossRef]
Figure 1.
Flow chart of the procedures in brick and tile industry for the construction of bricks.
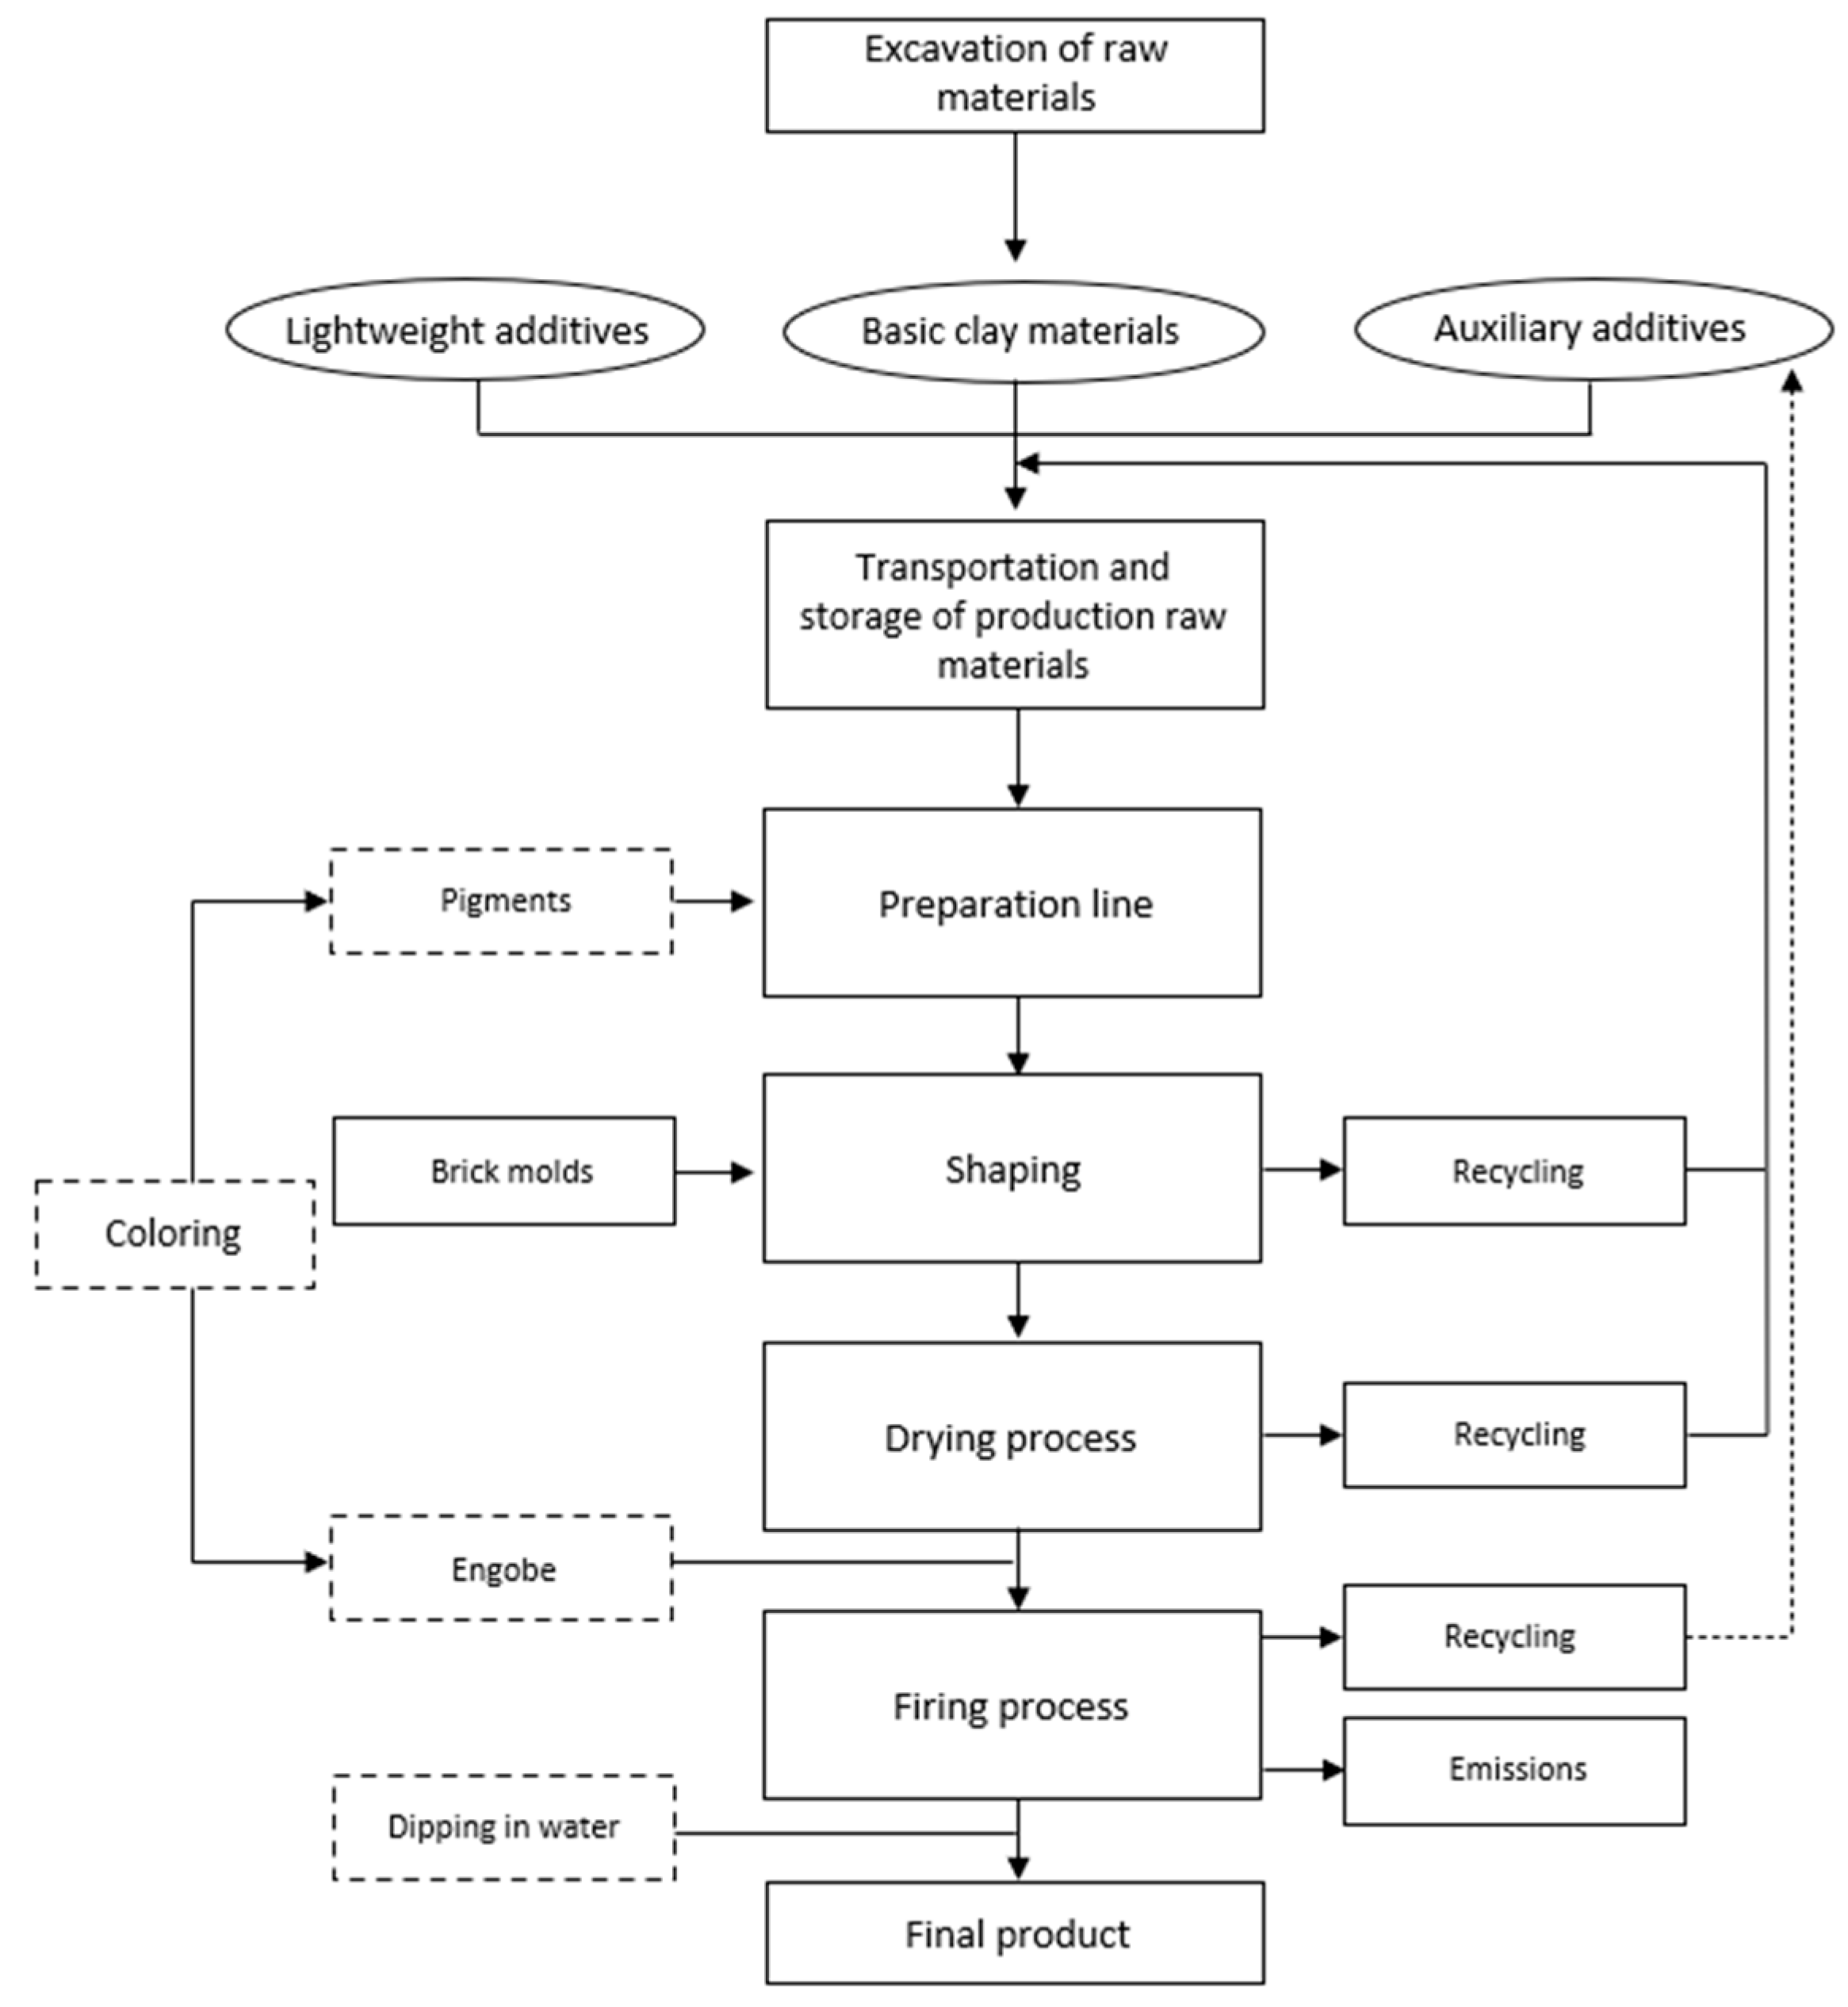
Figure 2.
Materials used in the current study.
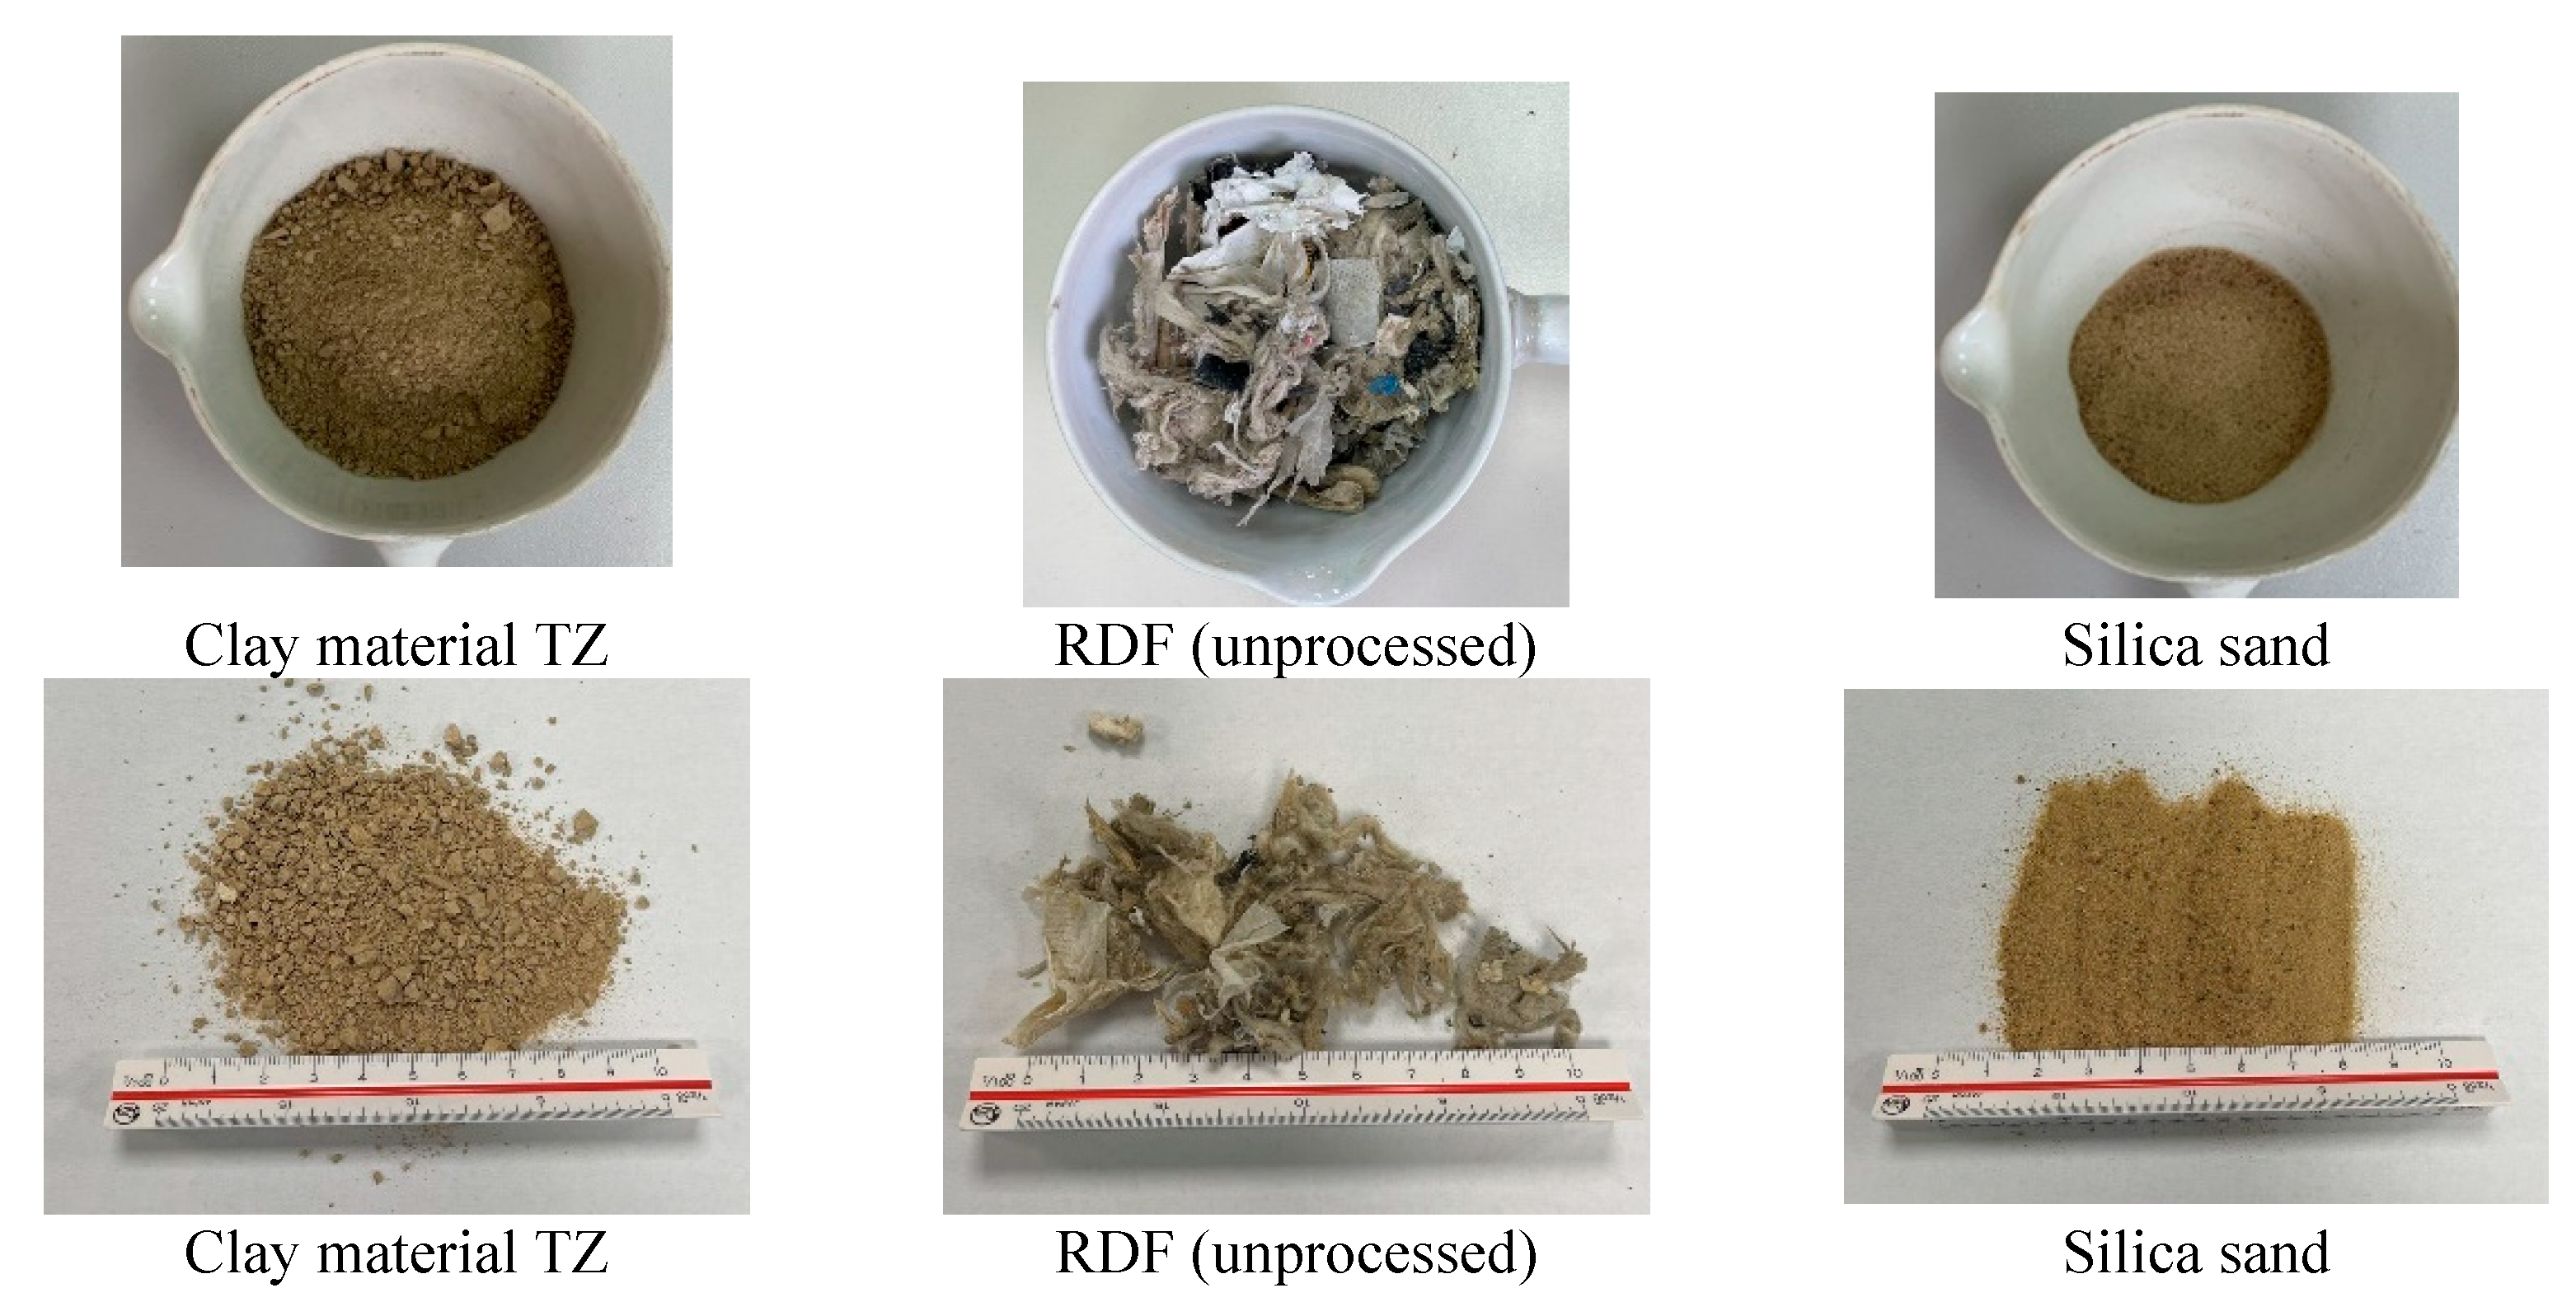
Figure 3.
Extruder and cutter used for the shaping of mixtures’ samples.
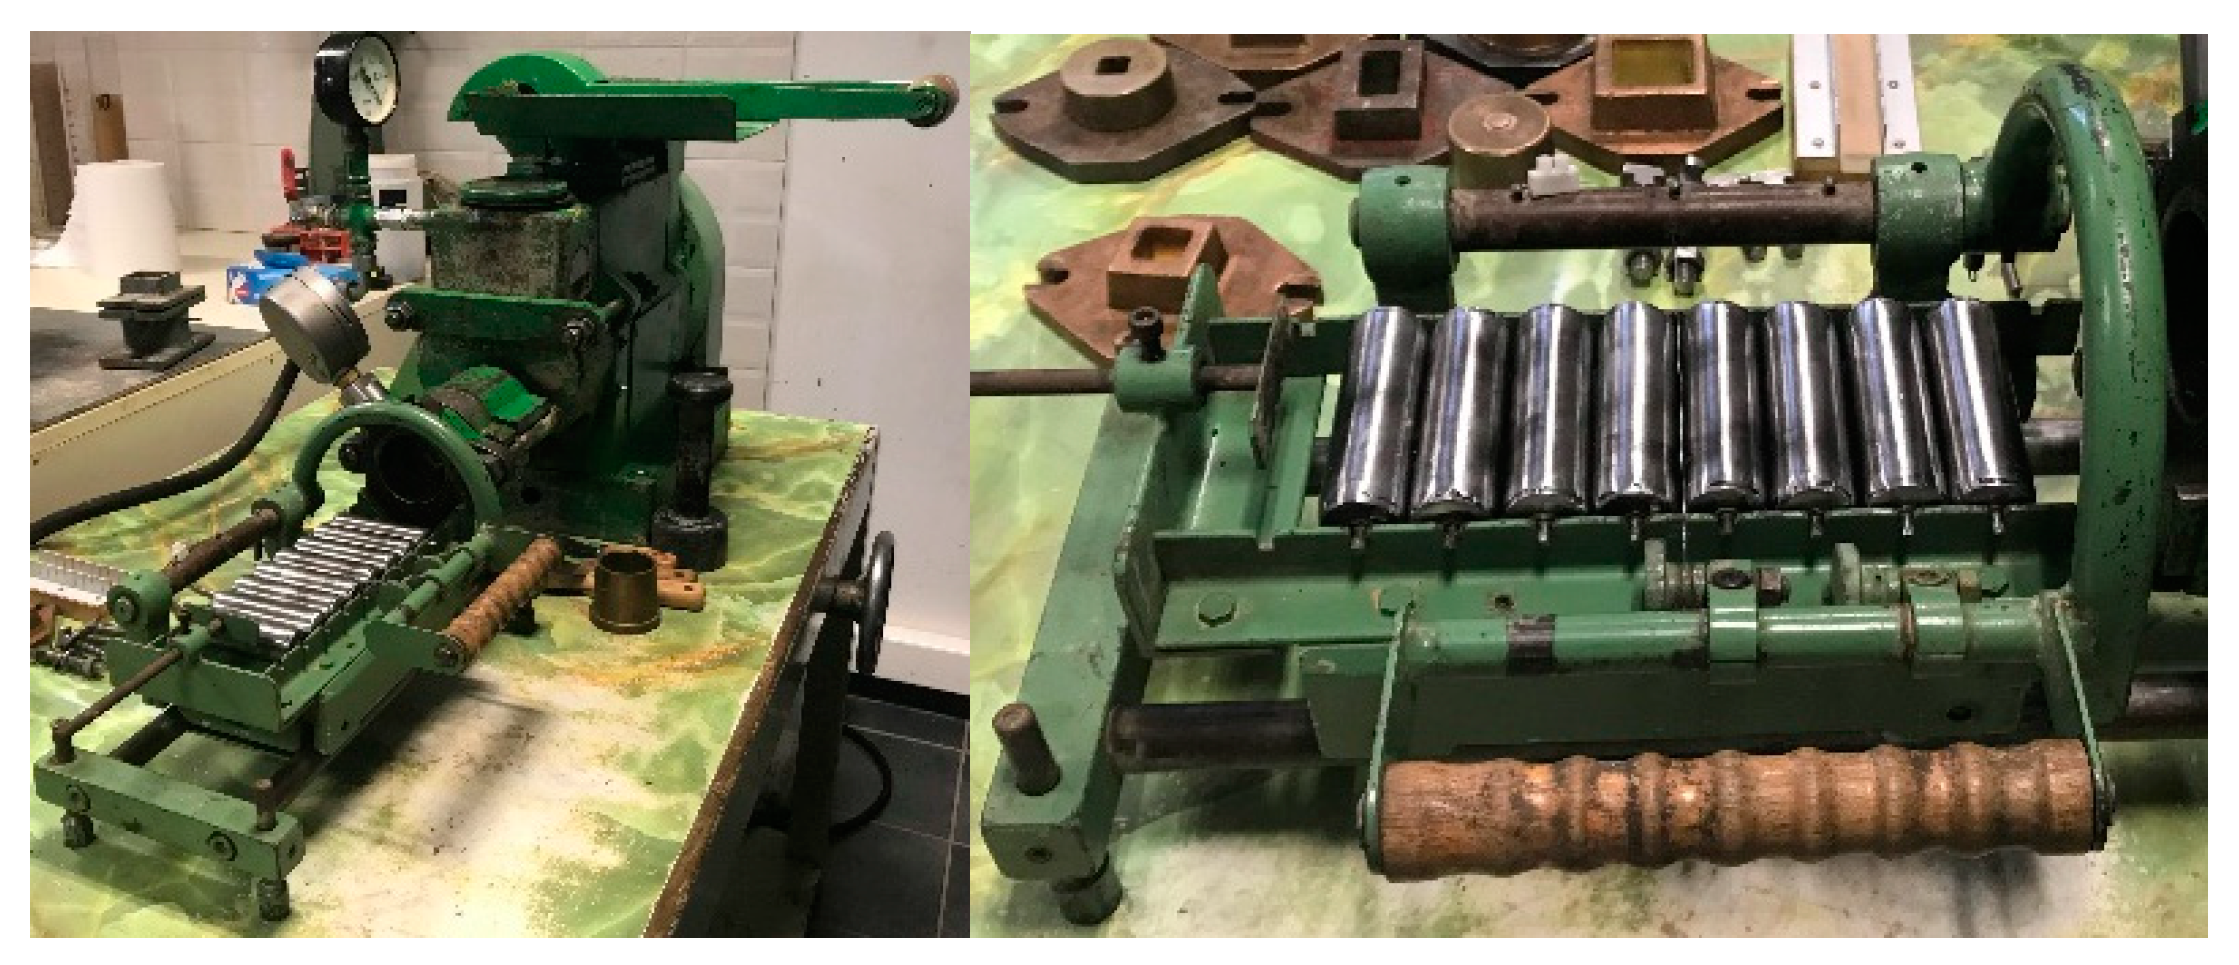
Figure 4.
Drying circle and each of three (3) phases followed for the tests.
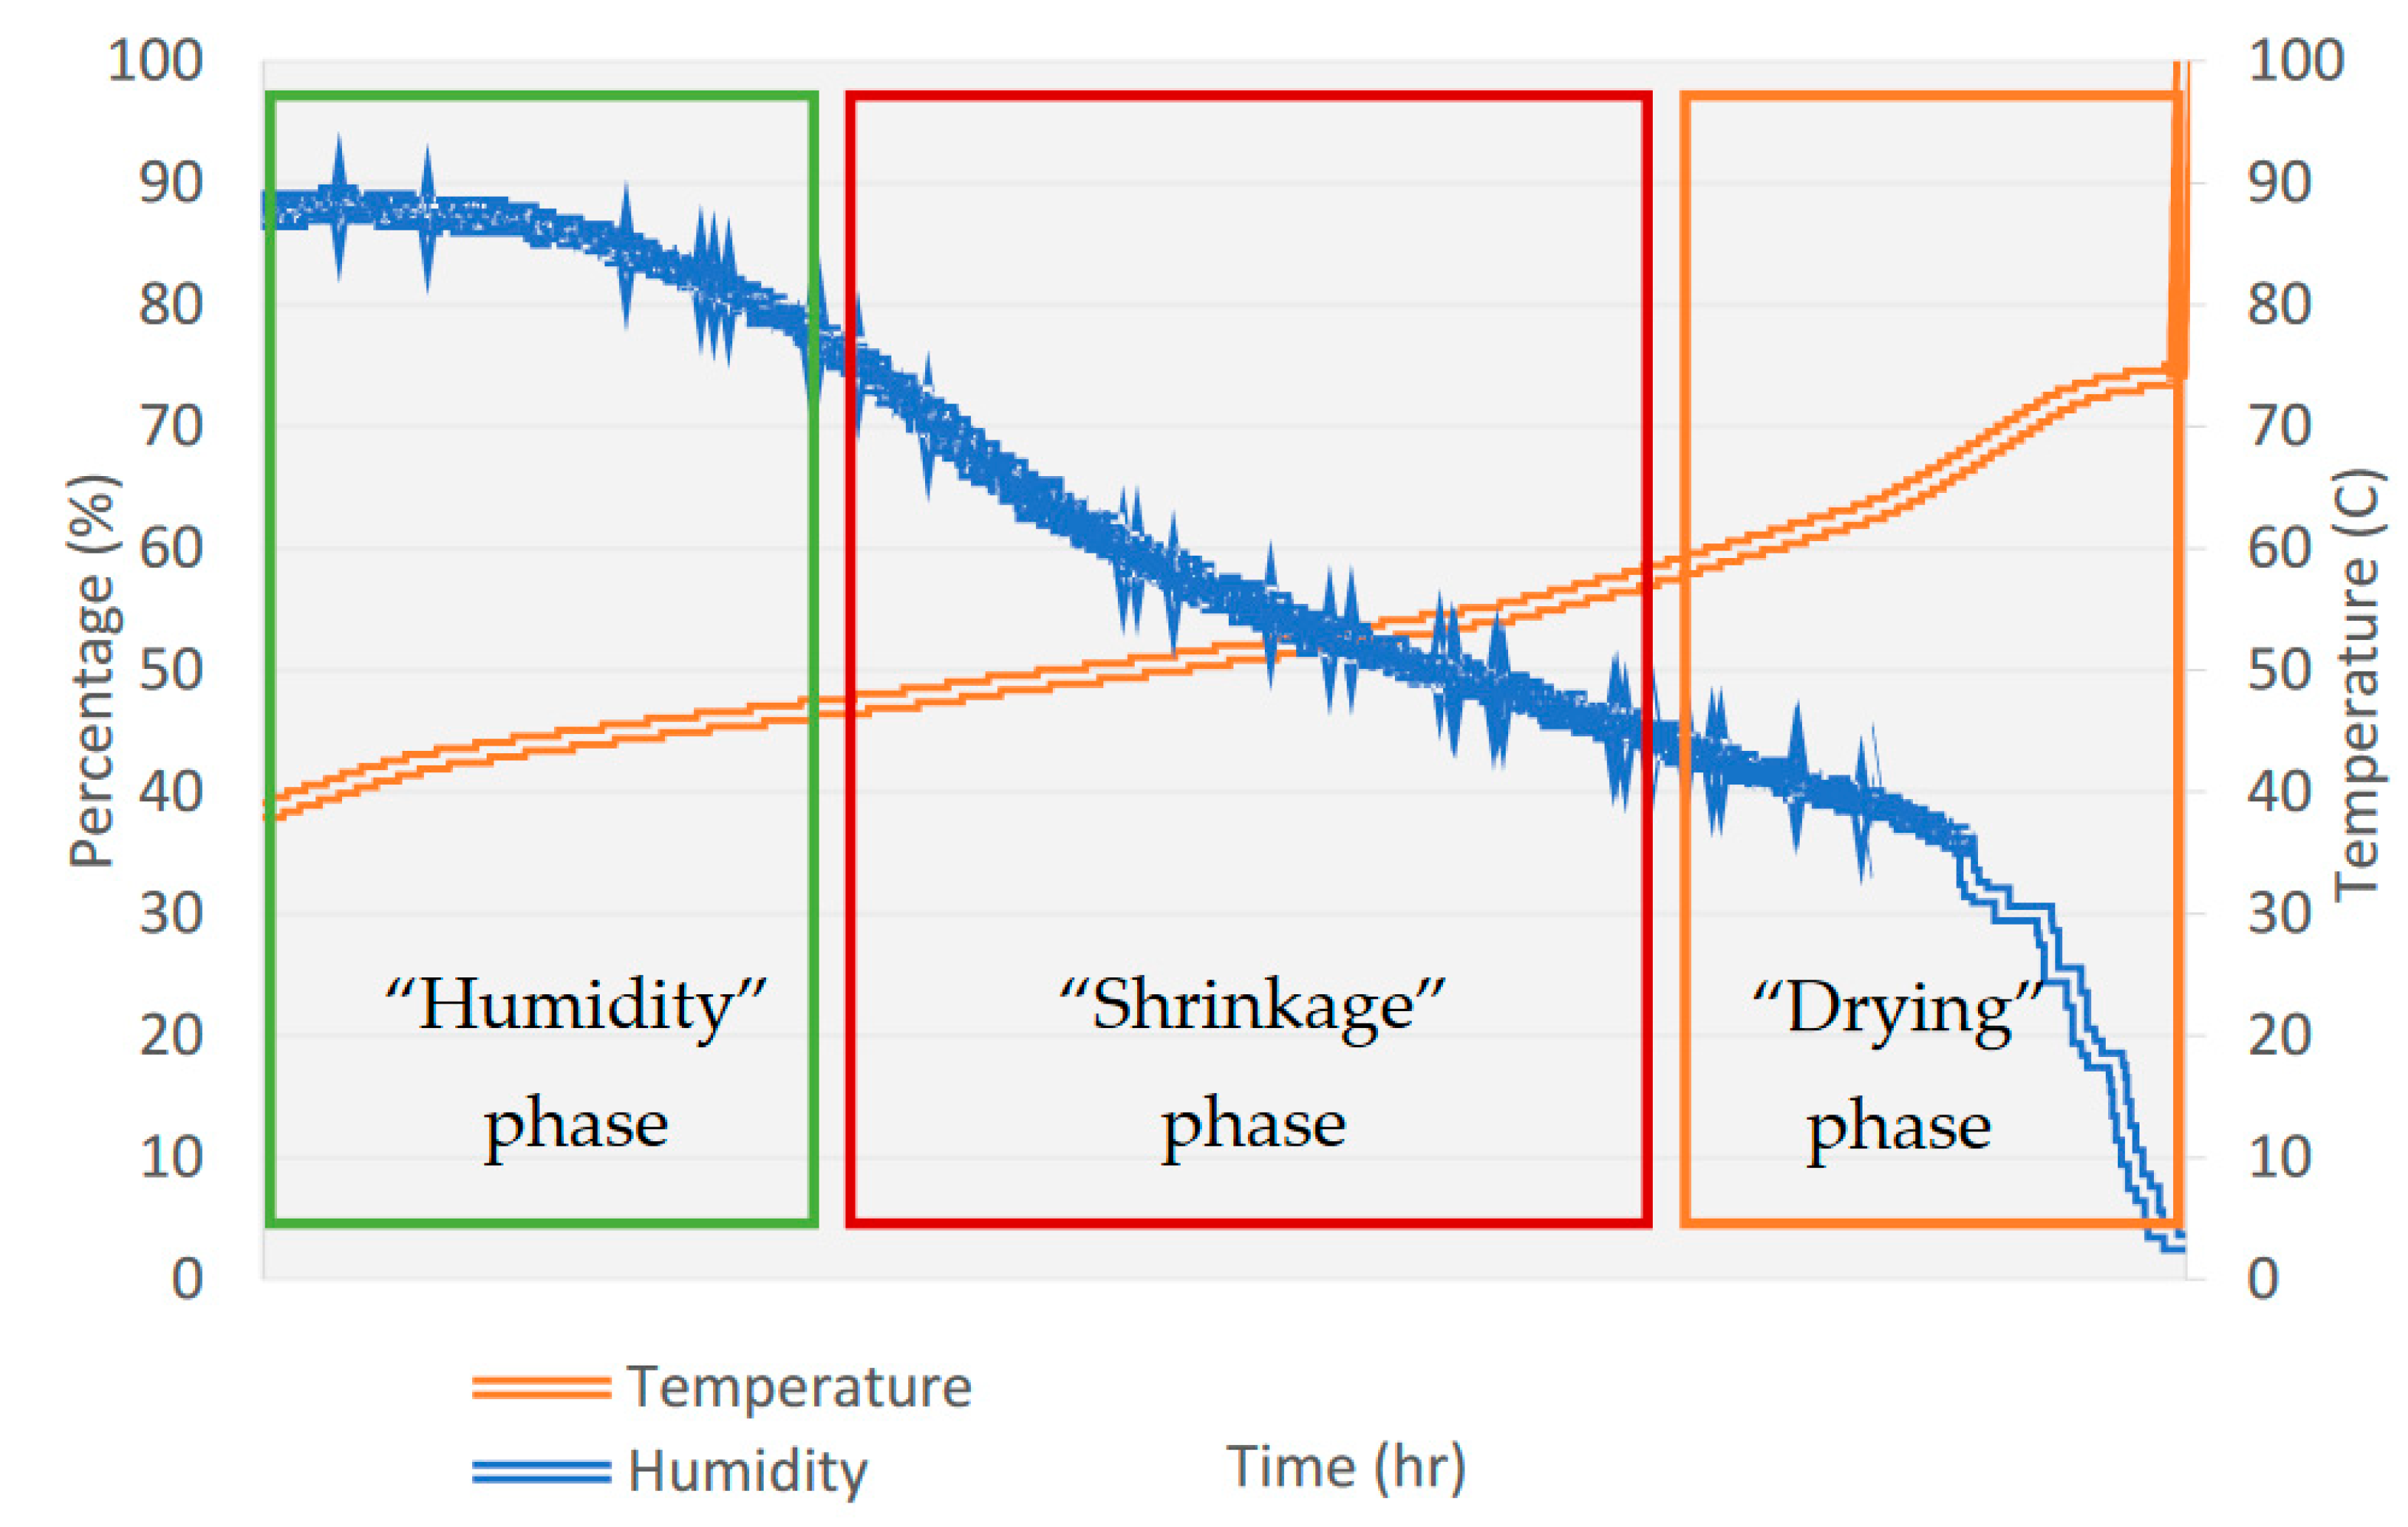
Figure 6.
Plasticity by Pfefferkorn and necessary extrusion water for all mixtures.
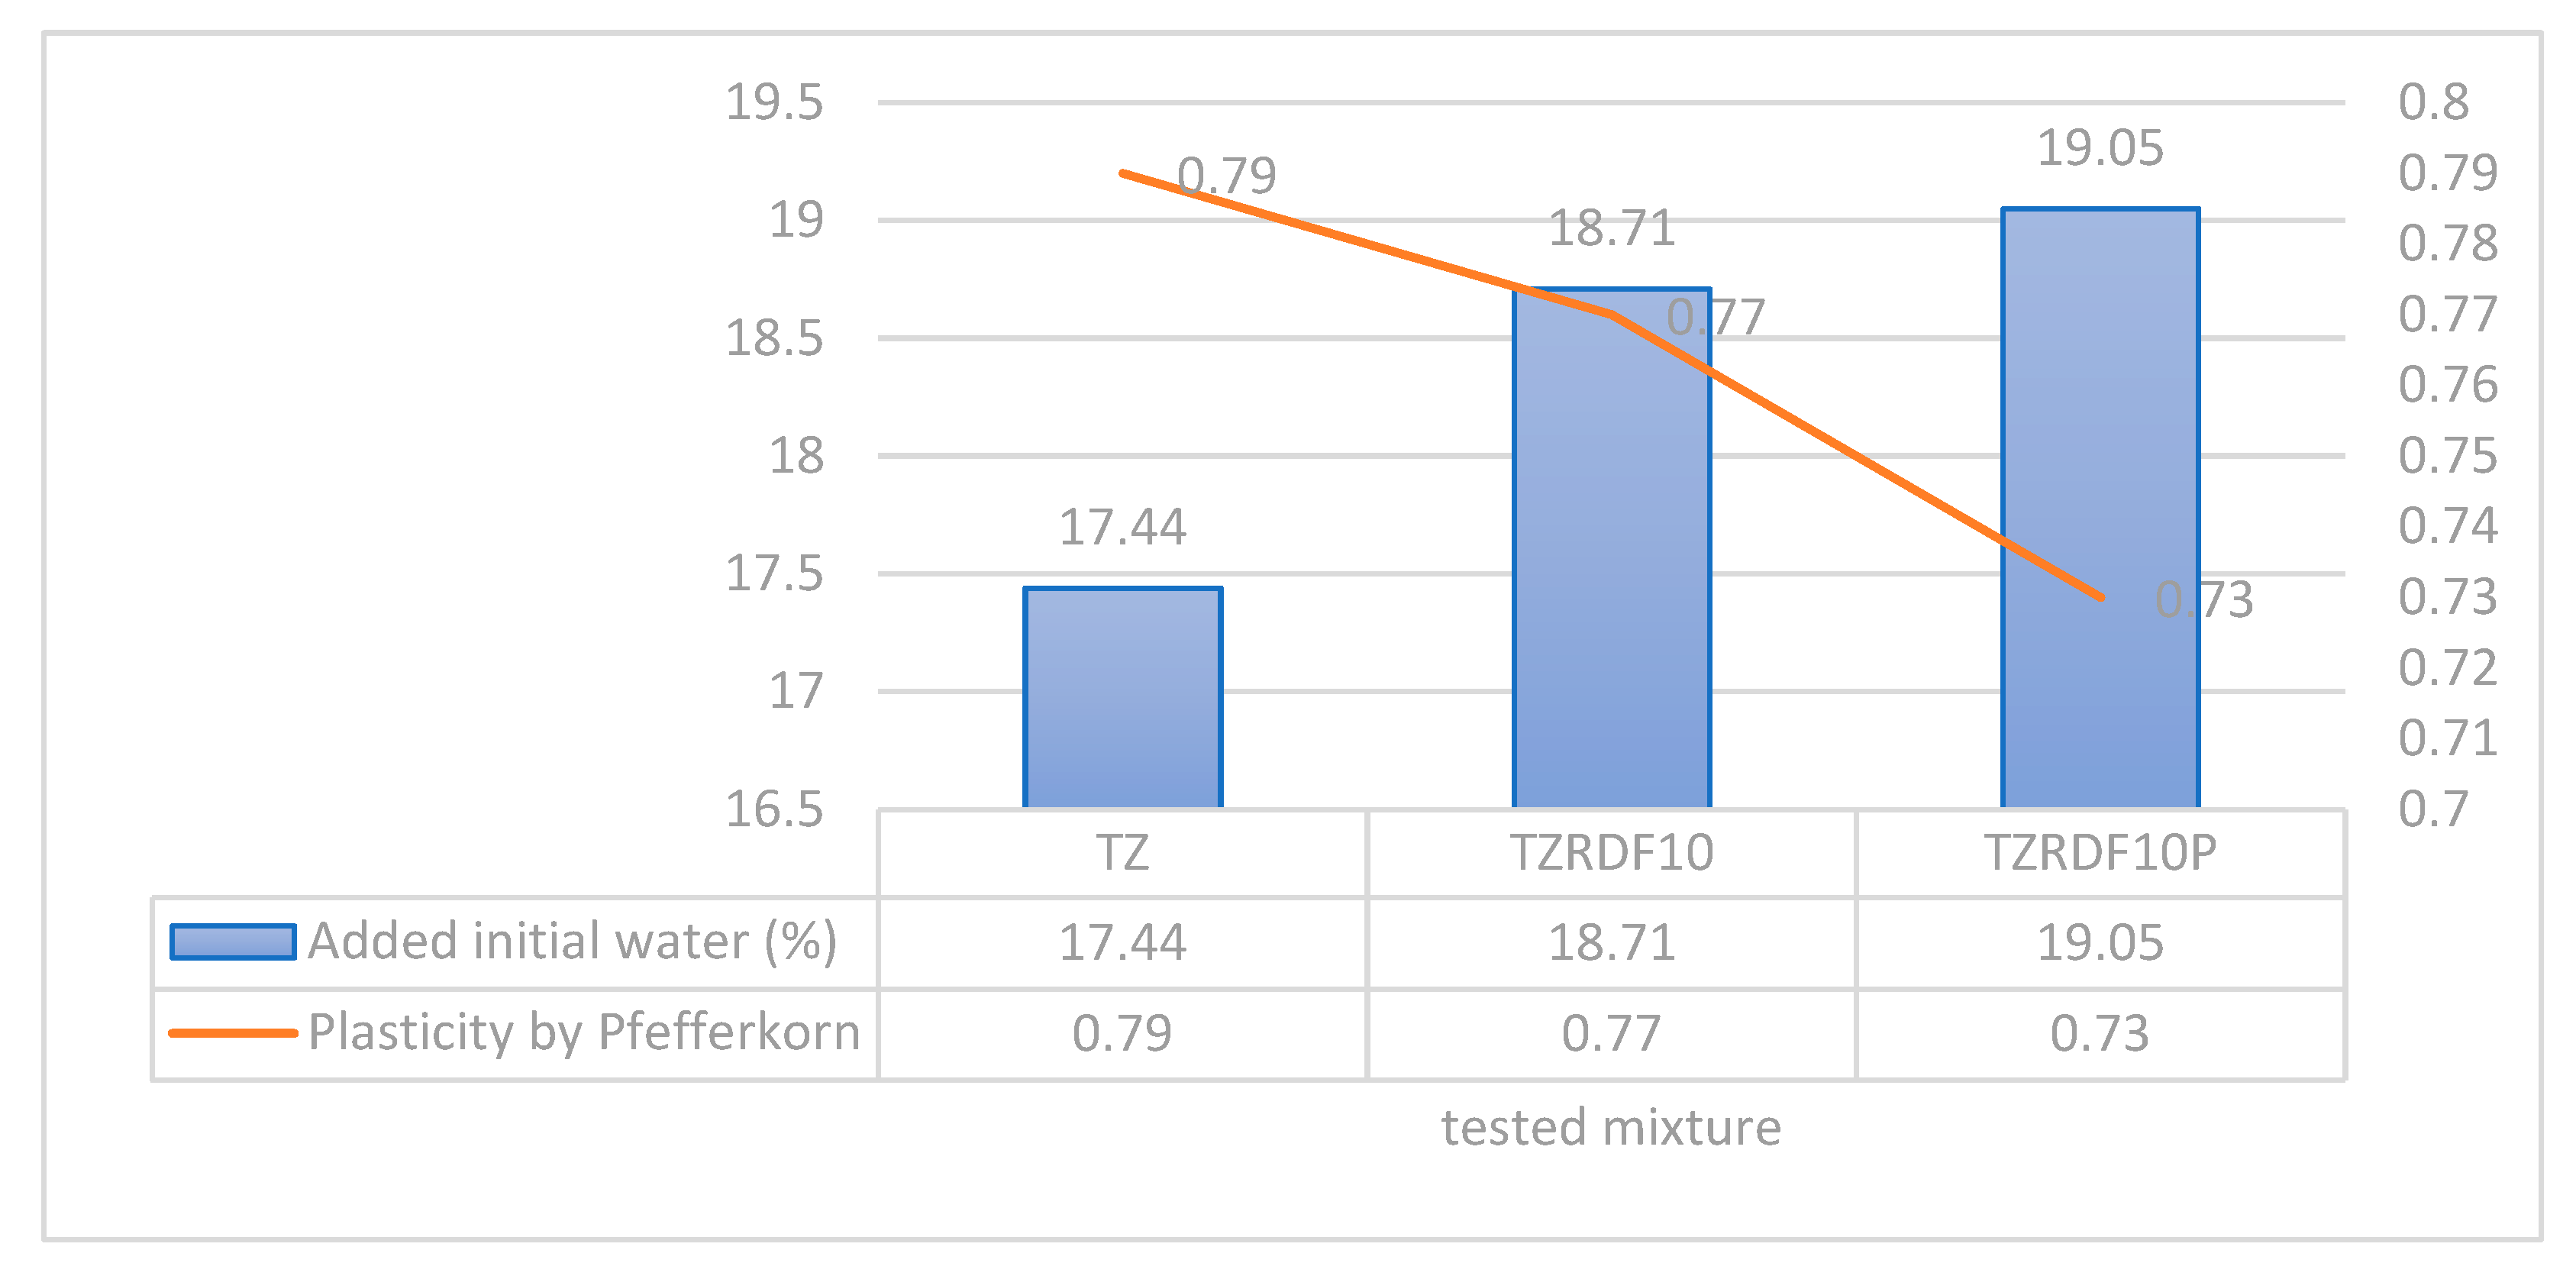
Figure 7.
Left: 100% clay after cutting, Middle: unprocessed RDF mix after cutting, Right: Processed RDF mix after cutting.
Figure 7.
Left: 100% clay after cutting, Middle: unprocessed RDF mix after cutting, Right: Processed RDF mix after cutting.

Table 1.
Mixtures constructed during study.
| Clay material | RDF as obtained | RDF (milled) | |
|---|---|---|---|
| Wt.% | Wt% | Wt% | |
| TZ | 100 | - | - |
| TZRDF10 | 90 | 10 | - |
| TZRDF10 P | 90 | - | 10 |
Table 2.
Qualitative and technological tests that took place in this study.
| Qualitative tests | Technological tests |
|---|---|
| Calcium carbonate | Plasticity / necessary water for extrusion |
| Grain size | Extruding |
| Drying sensitivity | |
| Drying results |
Table 3.
Physical properties of TZ clay.
| Physical Properties | Unit | Values |
|---|---|---|
| Plastic limit | % | 20.76 |
| Liquid limit | % | 42.00 |
| Plasticity | % | 24.23 |
| Density | Kg/m3 | 1781 |
Table 4.
Oxide composition of TZ clay.
| Oxides (%) | SiO2 | Al2O3 | CaO | Fe2O3 | MgO | K2O | Na2O | LOI |
| TZ clay | 56.45 | 16.72 | 5.65 | 5.08 | 2.73 | 1.64 | 0.55 | 9.34 |
Table 5.
Particle size distribution of clay.
| Grain Size | Coarse Sand | Fine sand | Silt | Clay |
| >63 μm | 63–20 μm | 20 to 2 μm | <2 μm | |
| TZ clay | 6.00 % | 9.35 % | 40.37 % | 44.28 % |
Table 6.
Physical properties of RDF.
| Parameter | Unit | LOQ | Method | Result |
|---|---|---|---|---|
| Ash 550 oC | Mass % d | 0.1 | DIN EN 15403 | 16.1 |
| Ash 815 oC | Mass % d | 0.1 | DIN EN 15403 | 15.2 |
| Moisture | Mass % ar | 0.1 | DIN EN 15414-2 | 9.2 |
| Volatile matter | Mass % ar | 0.1 | DIN EN 15402 | 58.7 |
| Volatile matter | Mass % d | 0.1 | DIN EN 15402 | 64.6 |
| Fixed Carbon | Mass % d | 0.1 | DIN 51734 | 20.2 |
| Dry mass (105 oC) | Mass % ar | 0.1 | DIN EN 15414-2 | 90.8 |
| Carbon | Mass % d | 0.1 | DIN EN 15407 | 50.0 |
| Hydrogen | Mass % d | 0.1 | DIN EN 15407 | 5.76 |
| Nitrogen | Mass % d | 0.1 | DIN EN 15407 | 1.74 |
| Oxygen | Mass % d | 0.1 | DIN EN ISO 16993 | 26.1 |
| Net CV | MJ/kg ar | 0.1 | DIN EN 15400 | 17.77 |
| Net CV | MJ/kg d | 0.1 | DIN EN 15400 | 19.81 |
| Net CV | Kcal/kg ar | 120 | DIN EN 15400 | 4244 |
| Net CV | Kcal/kg d | 120 | DIN EN 15400 | 4732 |
| Total EF | t CO2/TJ ar | 1 | Calculated | 93.6 |
| Biomass content by carbon ratio | Mass % d | - | DIN EN 15440 14C method | 74 |
Table 7.
Metals content of RDF.
| Parameter | Unit | LOQ | Method | Result |
|---|---|---|---|---|
| Arsenic | mg/kg d | 2 | DIN EN 15411 | 16 |
| Lead | mg/kg d | 3 | DIN EN 15411 | 140 |
| Cadmium | mg/kg d | 0.3 | DIN EN 15411 | 3.5 |
| Chromium | mg/kg d | 1 | DIN EN 15411 | 330 |
| Copper | mg/kg d | 2 | DIN EN 15411 | 520 |
| Nickel | mg/kg d | 1 | DIN EN 15411 | 310 |
| Zinc | mg/kg d | 1 | DIN EN 15411 | 1700 |
| Mercury | mg/kg d | 0.1 | DIN EN 15411 | 2.1 |
| Thallium | mg/kg d | 0.4 | DIN EN 15411 | 0.6 |
| Antimony | mg/kg d | 6 | DIN EN 15411 | 27 |
| Cobalt | mg/kg d | 1 | DIN EN 15411 | 70 |
| Vanadium | mg/kg d | 1 | DIN EN 15411 | 200 |
| Potassium | mg/kg d | 50 | DIN EN 15410 | 920 |
| Sodium | mg/kg d | 50 | DIN EN 15410 | 1100 |
| Phosphorus | mg/kg d | 10 | DIN EN 15410 | 1400 |
| Tin | mg/kg d | 10 | DIN EN ISO 11885 | 74 |
| Manganese | mg/kg d | 5 | DIN EN 15411 | 280 |
| Sum Cd, TI | mg/kg d | - | Calculated | 4.1 |
| Sum Sb, As, Pb, Cr, Co, Ni, V | mg/kg d | - | Calculated | 1093 |
Table 8.
Halides and Sulphur content of RDF.
| Parameter | Unit | LOQ | Method | Result |
| Organic Chlorine | Mass % d | 0.05 | DIN 38414-4 DIN EN ISO 10304 DIN EN 15408 |
0.2 |
| Bromine total | Mass % d | 0.025 | DIN EN 15408 | < 0.025 |
| Iodine total | Mass % d | 0.025 | DIN EN 15408 | < 0.025 |
| Fluorine total | Mass % d | 0.005 | DIN EN 15408 | 0.02 |
| Sulphur total | Mass % d | 0.01 | DIN EN 15408 | 0.9 |
| Chlorine total | Mass % d | 0.05 | DIN EN 15408 | 0.26 |
Table 9.
Organics content of RDF.
| Parameter | Unit | LOQ | Method | Result |
| TOC | Mass % d | 0.1 | DIN EN 13137 | 49.8 |
Table 10.
Particle size of the sand grains, fractions 0.063 to 2 mm.
| >2 mm | ASTM 10 | 0.00% |
| 0.71 mm | ASTM 25 | 0.15% |
| 0.60 mm | ASTM 30 | 0.15% |
| 0.50 mm | ASTM 35 | 0.90% |
| 0.40 mm | DIN 16-1171 | 4.80% |
| 0.30 mm | ASTM 50 | 19.64% |
| 0.20 mm | DIN 30-1171 | 53.82% |
| 0.10 mm | DIN 60-1171 | 19.80% |
| 0.063 mm | ASTM 230 | 0.65% |
Table 11.
Classification of drying sensitivity according to Bigot’s CSB index.
| Classification of CSB | |
|---|---|
| <1.0 | Insensitive |
| 1.0–1.5 | Medium sensitive |
| 1.5–2.0 | Sensitive |
| >2.0 | Highly sensitive |
Table 12.
Seven key parameters of the production process that emphasis was given to.
| Preparation | Extruding | Drying |
|---|---|---|
| Grinded the materials to mixed with homogeneity | Extrusion water | Sensitivity |
| Plasticity | Shrinkage | |
| Bending Strength | ||
| Density |
Disclaimer/Publisher’s Note: The statements, opinions and data contained in all publications are solely those of the individual author(s) and contributor(s) and not of MDPI and/or the editor(s). MDPI and/or the editor(s) disclaim responsibility for any injury to people or property resulting from any ideas, methods, instructions or products referred to in the content. |
© 2023 by the authors. Licensee MDPI, Basel, Switzerland. This article is an open access article distributed under the terms and conditions of the Creative Commons Attribution (CC BY) license (http://creativecommons.org/licenses/by/4.0/).
Copyright: This open access article is published under a Creative Commons CC BY 4.0 license, which permit the free download, distribution, and reuse, provided that the author and preprint are cited in any reuse.


