
Submitted:
03 August 2023
Posted:
04 August 2023
You are already at the latest version
Abstract
As an important organelle in eukaryotic cells, Golgi apparatus is responsible for processing and transporting proteins and lipids in cells. Precise monitoring the status of Golgi apparatus by targeting fluorescence imaging technology is of enormous importance but remains an attractive yet dramatically challenging task. In this study, we report the construction of the first Golgi apparatus targeted sensor with bright near-infrared fluorescence, termed as Golgi-Pdots. As a start point of our investigation, hydrophobic CDs with bright NIR fluorescence at 674 nm (fluorescence quantum yield : 12.18%), narrow emission band of 23 nm, and excellent stability were facilely prepared from Magnolia Denudata flowers through an ultrasonic method. Incorporating the CDs into a polymer matrix modified with Golgi-targeting molecules can produce the water-soluble Golgi-Pdots, which showed high colloidal stability and similar optical properties as compared to CDs. Further studies revealed that the Golgi-Pdots showed good biocompatibility and Golgi-targeting ability. Based on these fascinating properties, Golgi-Pdots have been successfully used for long term bioimaging of Golgi apparatus inside live cells.
Keywords:
Golgi apparatus
; carbon nanodots
; polymer dots
; Near infrared fluorescence
; High photostability
1. Introduction
As one of the vital organelles in eukaryotic cells, Golgi apparatus primarily participates in receiving, processing, and modifying diverse proteins and lipids synthesized by endoplasmic reticulum, and then precisely packaging and delivering them to specific regions in the cell or secreting them outside the cell [1,2,3]. Since implicated in such important intracellular activities, subtle pH, viscosity, or morphological changes of Golgi apparatus would interrupt the biosystem and affect cell survival, contributing to various of diseases, such as hypertension, acute liver injury, vascular disease, and cancer [4,5,6,7]. As such, it is of great significance to develop specialized probes to Golgi apparatus for real-time visualization of the intracellular dynamic process and figuring out the pathogenesis of Golgi-associated disease.
By virtue of its various intrinsic characteristics such as superb sensitivity, high temporal resolution, real-time and in-situ responsiveness, and noninvasiveness, fluorescence imaging technique has turned out to be a powerful tool for in-situ dynamic visualization and monitoring of subcellular organelles [8,9,10,11,12,13]. Although some types of Golgi apparatus-targeting molecular probes, such as Golgi Tracker Red or Green derived from boron-dipyrromethene, have been commercialized, the present situation is still far from ideal, as they often hinder from poor photostability at working concentration [14]. Recently, Tsukiji and coworkers reported a series of Golgi-localizing fluorescent molecular probes by modularly linking tri-N-methylated myristoyl-Gly-Cys lipopeptide to fluorophores of interest [15]. Choi et al. synthesized blue and yellow emissive two-photon probes derived from 6-(benzo[d]oxazol-2-yl)-2-naphthalylamine and 2,5-bis(benzo[d]oxazol-2-yl)pyrazine derivatives as the fluorophores and trans-Golgi network peptide (SDYQRL) as the Golgi apparatus targeting ligand for Golgi apparatus detection [16]. These works are helpful for understanding of Golgi function and changes. Unfortunately, these probes are derived from organic fluorophores, which severely restricted their further applications.
Carbon nanodots (CDs) with the merits of tunable optical properties, excellent stability, and favorable biocompatibility have achieved enormous advances in the imaging of organelles [17,18,19]. For example, Paul et al. synthesized yellow-emitting CDs with lipophilic character for selective imaging of lipid droplets [17]. Tang’s group produced CDs with green fluorescence from rose bengal and branched polyethylenimine for lysosome imaging [18]. Han and coworkers prepared amphiphilic CDs with red fluorescence for super-resolution imaging of endoplasmic reticulum [20]. However, to the best of our knowledge, no Golgi-targeted CDs with near infrared (NIR) fluorescence has been reported up to now.
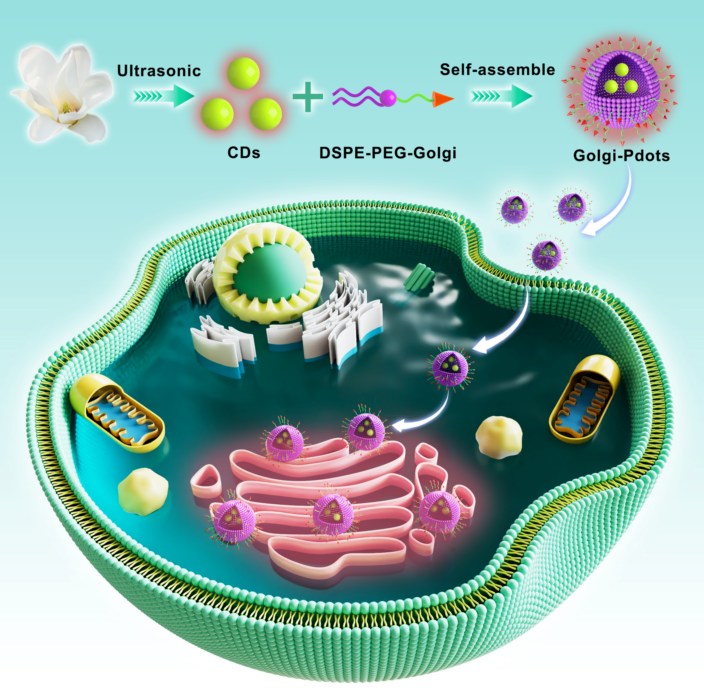
In this work, Golgi apparatus targeted NIR fluorescent polymer dots (Golgi-Pdots), incorporated with NIR hydrophobic CDs, were constructed for specific and long-term bioimaging of Golgi apparatus (Scheme 1). As a start point of our investigation, hydrophobic CDs with bright NIR fluorescence at 674 nm (fluorescence quantum yield : 12.18%), narrow emission band of 23 nm, and excellent stability were facilely prepared from Magnolia Denudata flowers through an ultrasonic-assisted method. Incorporating the CDs into a polymer matrix modified with Golgi-targeting molecules can produce the water-soluble Golgi-Pdots, which showed high colloidal stability and similar optical properties as compared to CDs. Further studies revealed that the Golgi-Pdots showed superior photostability, excellent biocompatibility and Golgi-targeting ability. Based on these fascinating properties, Golgi-Pdots have been successfully used for long term bioimaging of Golgi apparatus inside live cells.
2. Experimental section
2.1. Materials
Magnolia Denudata flowers were purchased from local market. Before using, the flowers were rinsed carefully with distilled water and dehydrated in a vacuum oven. 1,2-distearoyl-sn-glycero-3-phosphoethanolamine-N-(polyethylene glycol)-2000 (DSPE-PEG) modified with phenylsulfonamide was received from Hangzhou Xinqiao Biotechnology Co., Ltd. Golgi-Tracker Green was bought from Beyotime Biotech. High glucose Dulbecco’s modified Eagle’s media (DMEM) and human cervical carcinoma cells (HeLa cells) were purchased from KeyGEN Biotech. Co. Ltd. 3-(4,5-Dimethylthia-zol-2-yl)-2,5-diphenyltetrazolium bromide (MTT) were received from Sigma-Aldrich. All the chemicals and solvents were of analytical grade and applied directly.
2.2. Preparation of NIR fluorescent CDs
CDs with red fluorescence were prepared via a facile, simple ultrasonic method [21]. In a typical synthesis, 20 g dried flower of Magnolia Denudata and 800 mL of dichloromethane (DCM) were introduced into a 1000 mL beaker, and ultrasonic treatment was conducted at 600 W output with a sonicator (Scientz-IID, Ningbo Scientz Biotechnology Co., Ltd., China) for 3 h, using a pulse mode (10 s ON / 10 s OFF). Then, the resulting solution of a clear yellow color was filtered via a syringe-driven filter (0.22 μm) and centrifuged for 10 min at 12000 g to discard large particles. Then, the supernatant was collected and concentrated, and the obtained crude product was further purified by silica gel with column (petroleum ether/ethyl acetate = 10:1, v/v) to afford the oily CDs (0.18 g).
2.3. Fabrication of NIR emissive CDs-encapsulated Golgi-Pdots
NIR emissive CDs-encapsulated Golgi-Pdots were prepared by a nanoprecipitation method, according to the reported literature [22]. Briefly, 0.5 mg of CDs and 2 mg of DSPE-PEG-Golgi were dissolved in 6 mL of DCM and stirred for 1 h at room temperature. Then, the solvent was evaporated under nitrogen atmosphere and the product was dried in a vacuum oven. Following, 6 mL of 1× phosphate buffered saline (PBS) was quickly injected and stirred for another 1 h. The generated aqueous solution was filtrated with a 0.22 μm polyethersulfone filter and washed three times with 50 K centrifugal filter units under centrifugation at 5000 g for 10 min. Thus obtained solution of Golgi-Pdots was concentrated to 1 mL by ultrafiltration and stored at 4 °C for future use.
2.4. Fluorescent imaging
Before performing bioimaging experiments, cells were passaged, replanted into confocal dishes with 4 wells and allowed to adhere for about 12 h. Then, the growth media in the dishes were substituted with new one that contains Golgi-Pdots (10 μg·mL-1) and incubated for 1 h. Subsequently, the attached cells were rinsed thrice with pure DMEM. Confocal fluorescence imaging of Golgi-Pdots labelled cells was collected in the wavelength range of 630 to 710 nm (Excitation wavelength: 405 nm).
The subcellular location of Golgi-Pdots was assessed by co-localization bioimaging experiments, in which cells were sequentially labelled with Golgi-Pdots (10 μg·mL-1) for 1 h and Golgi-Tracker Green (500 nM) for 0.5 h [23]. Afterwards, the labelled cells were rinsed for three times with pure DMEM before being subjected to confocal imaging. The emission siganl of Golgi-Pdots was collected in the range of 630-710 nm (excitation wavelength: 405 nm), while for Golgi-Tracker Green, fluorescence signal was acquired between 500 to 580 nm (excitation wavelength: 488 nm).
3. Results and discussions
3.1. Preparation and characterization of NIR emissive CDs
As illustrated in Figure 1A, NIR emissive CDs can be simply prepared at room temperature from Magnolia Denudata flowers through an ultrasonic method. It is worthy to note that the ultrasonic technique has recently become an increasingly popular method for nanomaterials synthesis because of its appealing merits, such as rapid reaction rate, ease to operate, and controllable reaction conditions [24,25,26,27,28,29]. Ultrasonic waves generate acoustic cavitation within an aqueous solution, and this is the main reason for creation, growth, and collapsing of micro bubbles [30]. During the above process, instantaneous high temperature (> 5000 K) and pressure environment (> 20 MPa) are created, which is beneficial for the fabrication of nanodots [31]. The as-generated CDs were purified via silica gel column chromatography to wipe off impurities.
The morphology and size of the CDs were investigated by STEM and AFM. From the STEM image depicted in Figure 1B, we can see that the CDs with a dot-shape are randomly and uniformly distributed, along with a sharp particle size distribution in the range from 1.9 to 2.7 nm and a mean value of 2.3 nm (Figure 1C), as calculated from about 150 individual nanodots. This size is comparable to other biomass-derived NIR emissive CDs [32,33], and no larger nanoparticles were noticeable, revealing that the developed methodology had good control on size. The AFM image in Figure 1D shows that the CDs were monodispersed with a height of 2.3 nm (inset of Figure 1D), which is in good line with STEM data.
To analyze the functional groups on the surfaces of the CDs, FTIR spectroscopy experiment was conducted. As shown in the FTIR spectrum (Figure 1E), the absorption band at approximately 3436 cm-1 arises from the -OH group [34,35] and the strong peaks at 2917 and 2847 cm-1 can be attributed to the stretching vibrations of -CH3 and -CH2, respectively [36,37]. Besides, the merged peaks at 1705, 1460, 1369, and 1289 cm-1 were respectively ascribed to the stretching vibrations of C=O, C=C, symmetric carboxylate and C-O groups [31,38,39,40,41].
Meanwhile, XPS spectroscopy was also applied to characterize the chemical composition of the CDs. According to the XPS survey result (Figure S1), only C1s (284.4 eV) and O1s (531.9 eV) signals can be observed [42], suggesting the CDs were comprised of C (77.1%) and O (22.9%). High-resolution XPS curves of C1s and O1s are deconvoluted for further analyses. The high-resolution XPS spectra of C1s in Figure 1F exhibited four peaks at 284.1, 284.7, 285.5, and 288.2 eV, corresponding to the presence of C=C/C–C, C-O, C-O-C/C-OH, and C=O bonds, respectively [43,44,45]. The O1s band was deconvoluted into two typical peaks at 531.6 and 532.7 eV (Figure 1G), which were respectively attributed to C-OH/C-O-C and C=O [46,47,48]. Together, these results inferred the existence of carboxyl, amide, ether as well as hydrocarbon groups (-CH2 and -CH3) on the surface of CDs.
Subsequently, the optical features of the CDs were explored by UV-visible absorption and fluorescence spectroscopy in ethanol solution. The solution of CDs showed a clear yellowish green colour in the room light and emitted bright red fluorescence under 365 nm UV irradiation (Figure 2A). As can be seen from the absorption spectrum in Figure 2B, the CDs had a very broad absorption band covering UV to visible regions, with two intense absorption peaks at 409 and 667 nm, which possibly stem from the n-π* transitions of aromatic C=O structrues [49].
The fluorescence spectra plotted in Figure 2C shows that the CDs exhibited a fluorescence emission maximum at 674 nm when excited at 406 nm, with a large Stokes shift of 268 nm and a full width at half maximum (FWHM) of 23 nm. Such a narrow near-infrared emission is similar to that of CDs made from taxus leaves [32], but our preparation procedure is time-saving and thus has high efficiency. The excitation-emission contour plot of the CDs showed that the emission center of the CDs was actually unshifted over a wide excitation range, revealing that the excitation-independent emission character of the CDs (Figure 2D). The absolute quantum yield of the CDs in ethanol was measured to be 12.18%, mainfesting its promising application for NIR imaging. In addition, we found that the CDs displayed intense NIR fluorescence in various organic solvents (Figure S2). However, when introducing water into the orgainc solution of the CDs, its emission intensity progressively weakened and was completely quenched as the water proportion increased from 0% to 100% (volume ratio), suggesting the hydrophobic nature of our obtained CDs (Figure 2E). This result was confirmed by water contact angle experiment, showing a static contact angle value of 106.0° (Figure 2F). The hydrophobicity of the CDs is due to the fact that hydrophobic long alkyl chains are existed on its surface, as veried by XPS and FTIR characterizations.
3.2. Fabrication and characterization of Pdots incorporated with CDs
In order to realize the potential applications of the hydrophobic CDs with bright near-infrared fluorescence in biosystem, nanoprecipitation experiments were carried out to transfer the hydrophobic CDs from organic phase to aqueous phase with the help of an amphiphilic polymer, 1,2-distearoyl-sn-glycero-3-phosphoethanolamine-N-(polyethylene glycol)-2000 (DSPE-PEG). Because of its high biocompatibility, DSPE-PEG derivatives are widely utilized as matrix to encapsulate hydrophobic components to afford water-soluble nanoparticles with tiny size (< 100 nm) and good colloidal stability [50,51,52,53,54]. Here, to endow the DSPE-PEG assembled nanoparticles with subcellular targeting ability, DSPE-PEG-Golgi, which was prepared from DSPE-PEG with a terminal carboxyl group and phenylsulfonamide, an effective Golgi apparatus-targetable molecule [5], was used in the nanoprecipitation experiment (Figure S3).
The hydrophobic CDs were incorporated into DSPE-PEG-Golgi via a nanoprecipitation method to prepare water-soluble Golgi-Pdots (Figure 3A). TEM image in Figure 3B demonstrates that the resultant Golgi-Pdots are quasi-spherical spheres and monodispersed with an average particle size of 60 nm (Figure 3C). Like the CDs in ethanol, the Golgi-Pdots in PBS solution showed a yellowish green color and emitted bright red fluorescence under 365 nm irradiation (Figure 3D). Fluorescence measurements demonstrated that the Golgi-Pdots in PBS solution also showed a maximum emission at 674 nm when being excited at 406 nm (Figure 3E), and a fluorescence quantum yield of 11.98%. Figure 3F showed the excitation-independent feature of the prepared Golgi-Pdots. Moreover, fluorescence lifetime data in Figure 3G revealed that Golgi-Pdots had a single fluorescence decay with a lifetime of 2.94 ns, very close to that of bare CDs (3.01 ns). Collectively, these experimental data demonstrated that encapsulating CDs into a polymer matrix showed almost no adverse effect on its optical properties.
Next, the fluorescence stabilities of the Golgi-Pdots under different circumstances were examined. Figure 4A showed the fluorescence intensities of Golgi-Pdots at various pH values. There were no obvious variations in the fluorescence intensities from pH 5 to pH 10, which could make Golgi-Pdots usable in the physiological pH range. The stability of Golgi-Pdots in a high ionic context using KCl salt was also studied. As shown in Figure 4B, the fluorescence intensity of Golgi-Pdots kept unvaried with increasing KCl concentrations up to 1 M, indicating good stability of the Golgi-Pdots in high ionic strength environments. Photostability is another critical feature for sensors to be applied for long term bioimaging. In this regard, the photostability of Golgi-Pdots in PBS solution was explored. As depicted in Figure 4C, the Golgi-Pdots possessed excellent photostability, as nearly no photobleaching in the emission intensity was noticeable after continuous irradiation at 406 nm for 1 h. All the above data demonstrated that the Golgi-Pdots maintained a stable fluorescence, which is significantly beneficial for their practical applications.
3.3. Cellular imaging
The inherent toxicity of Golgi-Pdots to living cells was evaluated through a standard MTT assay. As illustrated in Figure 5, the cells still had viability values higher than 90% after exposed to Golgi-Pdots of a high concentration (up to 80 μg·mL-1) for 48 h. This result indicates the as-prepared Golgi-Pdots are biocompatible to be used in biological field.
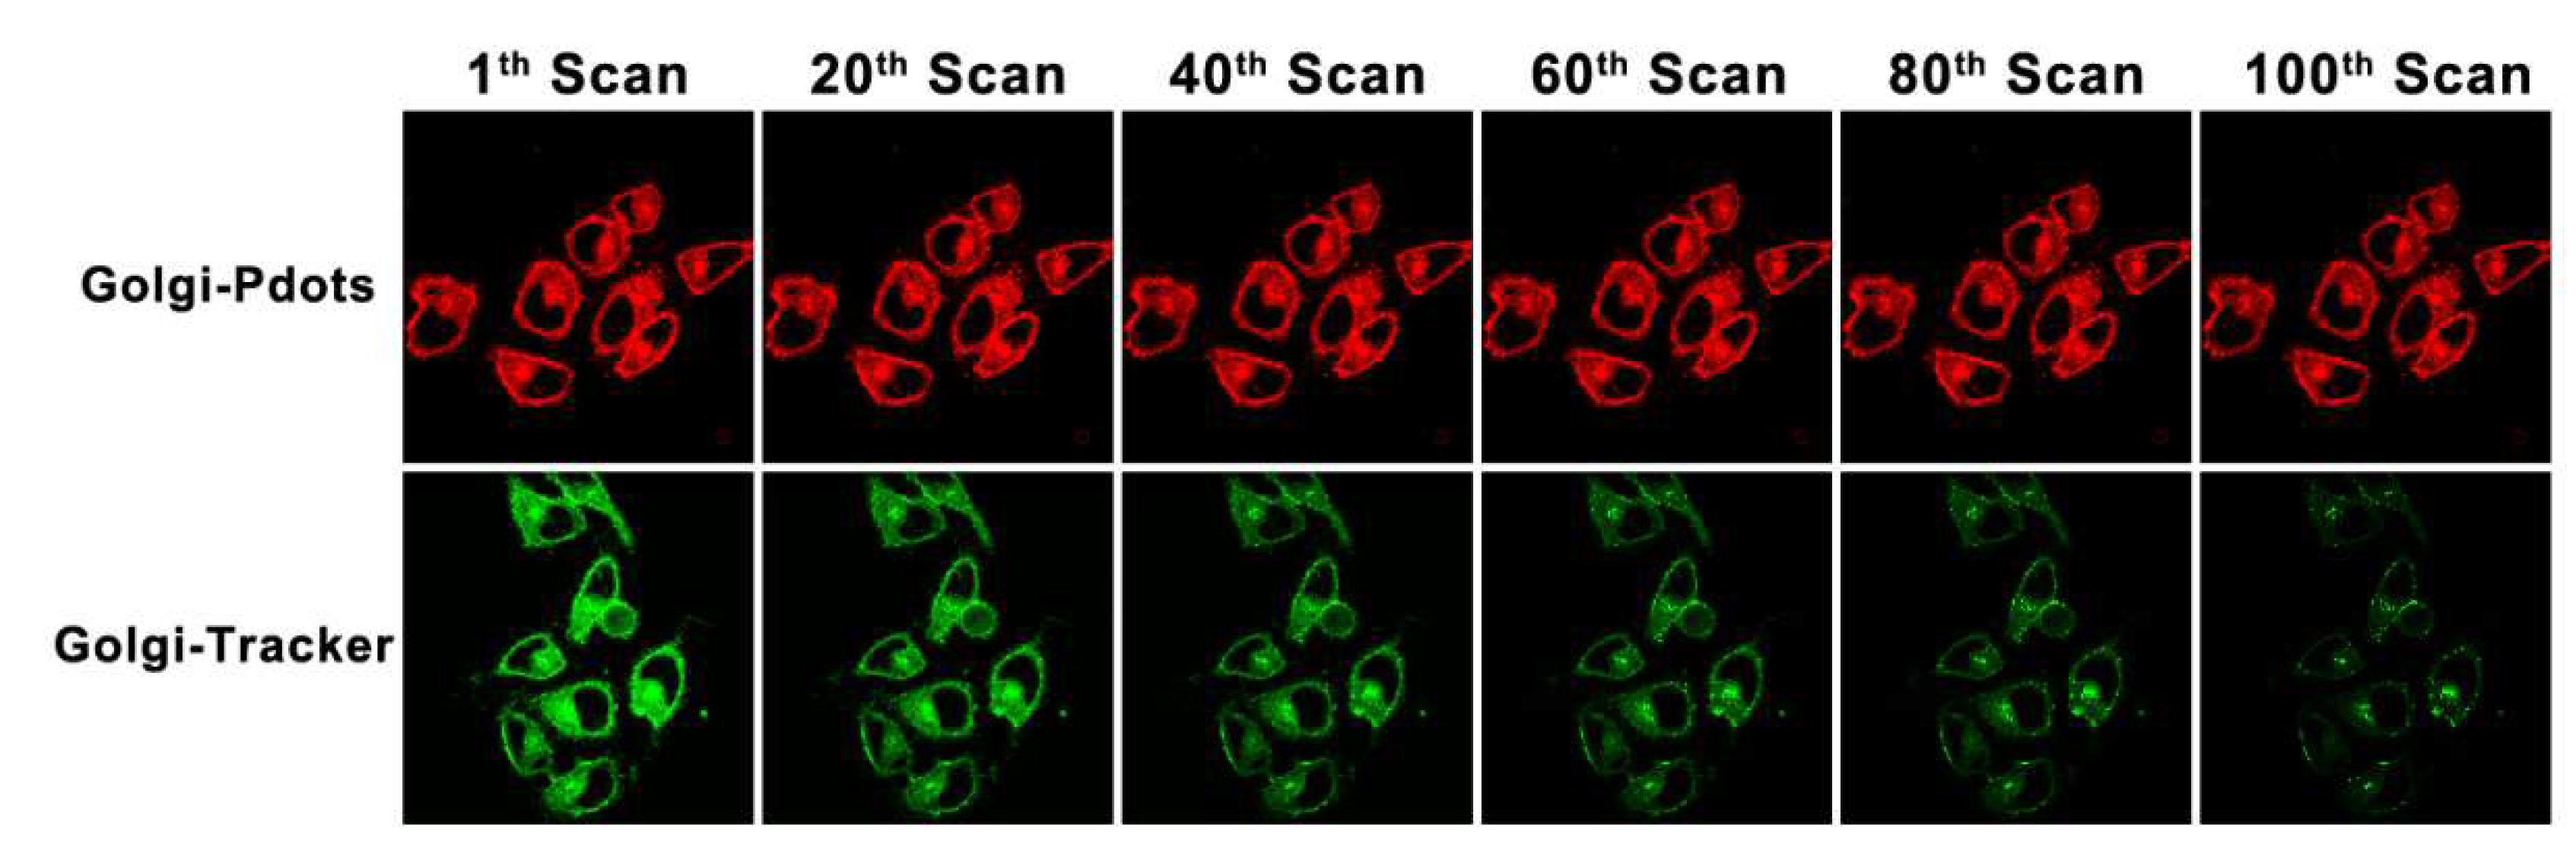
Using Golgi-Pdots as a fluorescent sensor, bioimaging investigations were in vitro carried out by confocal laser fluorescence microscopy. Considering the surface of Golgi-Pdots was functionalized with Golgi apparatus-targeting ligand, the probability of Golgi-Pdots to specifically enter in Golgi apparatus of live cells was assessed. For this reason, colocalization experiments were carried out in HeLa cells by co-staining Golgi-Pdots with a commercial Golgi apparatus-specific dye, Golgi-Tracker Green. As expected, an intense red fluorescence was observed from Golgi-Pdots labelled cells (Figure 6A), which overlapped very well with the green fluorescence from Golgi-Tracker Green (Figure 6B), as clearly observed from the bright yellow signals in Figure 6C (the merged image). Of note, the variations in the intensity profiles of the linear region of interest (the white line in Figure 6A,B) are synchronous in the two channels (Figure 6F). This result solidly established the fact that Golgi-Pdots can localize to Golgi apparatus with high specificity. Moreover, in contrast to the commercial Golgi-tracker Green, Golgi-Pdots are far more tolerant to photobleaching.
As shown in Figure 7, signals from Golgi-Tracker Green quenched nearly totally at the 100th scan, whereas the red fluorescence from Golgi-Pdots witnessed no significant change. These observations manifested that Golgi-Pdots can selectively enter Golgi apparatus and be utilized for long term imaging of Golgi apparatus in live cells.
4. Conclusion
In conclusion, hydrophobic CDs with bright NIR fluorescence and narrow emission band were prepared from Magnolia Denudata flowers via an ultrasonic-assisted method and purified via silica gel column chromatography. To endow the CDs with good water dispersibility and Golgi-targeting ability, we encapsulated the CDs into a polymer matrix to fabricate the desired water-soluble polymer dots. The obtained Golgi-Pdots showed high colloidal stability and similar optical properties as compared to CDs. Moreover, due to the presence of PEG and Golgi targeting molecules on surface, the Golgi-Pdots showed excellent biocompatibility and can be used for long-term bioimaging of Golgi apparatus inside living cells. This study provides a novel strategy for the synthesis of Golgi-targetable fluorescent probe and reveals their promising applications in biology and medicine.
Acknowledgments
This work was financially support by Natural Science Foundation of Zhejiang Province (Grant No. LQ20B050003) and the Scientific Research Start-up Project Foundation of Jiaxing University (CD70519012).
Declaration of Competing Interest
No competing financial interests exist in this work.
References
- Chen, J.; Liu, H.; Yang, L.; Jiang, J.; Bi, G.; Zhang, G.; Li, G.; Chen, X. Highly selective and efficient synthesis of 7-aminoquinolines and their applications as Golgi-localized probes. ACS Med. Chem. Lett. 2019, 10, 954–959. [Google Scholar] [CrossRef]
- Liu, M.; Chen, Y.; Guo, Y.; Yuan, H.; Cui, T.; Yao, S.; Jin, S.; Fan, H.; Wang, C.; Xie, R.; He, W.; Guo, Z. Golgi apparatus-targeted aggregation-induced emission luminogens for effective cancer photodynamic therapy. Nat. Commun. 2022, 13, 2179. [Google Scholar] [CrossRef]
- Liu, C.; Zhu, H.; Zhang, Y.; Su, M.; Liu, M.; Zhang, X.; Wang, X.; Rong, X.; Wang, K.; Li, X.; Zhu, B. Recent advances in Golgi-targeted small-molecule fluorescent probes. Coord. Chem. Rev. 2022, 462, 214504. [Google Scholar] [CrossRef]
- Zhu, H.; Liu, C.; Rong, X.; Zhang, Y.; Su, M.; Wang, X.; Liu, M.; Zhang, X.; Sheng, W.; Zhu, B. A new isothiocyanate-based Golgi-targeting fluorescent probe for Cys and its bioimaging applications during the Golgi stress response. Bioorg. Chem. 2022, 122, 105741. [Google Scholar] [CrossRef]
- Wang, H.; He, Z.; Yang, Y.; Zhang, J.; Zhang, W.; Zhang, W.; Li, P.; Tang, B. Ratiometric fluorescence imaging of Golgi H2O2 reveals a correlation between Golgi oxidative stress and hypertension. Chem. Sci. 2019, 10, 10876–10880. [Google Scholar] [CrossRef] [PubMed]
- Zhang, X.; Chen, L.; Wei, Y.-Y.; Du, J.-L.; Yu, S.-P.; Liu, X.-G.; Liu, W.; Liu, Y.-J.; Yang, Y.-Z.; Li, Q. Cyclooxygenase-2-targeting fluorescent carbon dots for the selective imaging of Golgi apparatus. Dyes Pigments 2022, 201, 110213. [Google Scholar] [CrossRef]
- Liu, C.; Zhou, L.; Zheng, Y.; Man, H.; Ye, Z.; Zhang, X.; Xie, L.; Xiao, Y. A Golgi-targeted viscosity rotor for monitoring early alcohol-induced liver injury. Chem. Commun. 2022, 58, 10052–10055. [Google Scholar] [CrossRef]
- Chen, B.; Mao, S.; Sun, Y.; Sun, L.; Ding, N.; Li, C.; Zhou, J. A mitochondria-targeted near-infrared fluorescent probe for imaging viscosity in living cells and a diabetic mice model. Chem. Commun. 2021, 57, 4376–4379. [Google Scholar] [CrossRef] [PubMed]
- Zhang, J.; Han, W.; Zhou, X.; Zhang, X.; Zhang, H.; Li, T.; Wang, J.; Yuan, Y.; He, Y.; Zhou, J. A lipid droplet-specific NIR fluorescent probe with a large stokes shift for in vivo visualization of polarity in contrast-induced acute kidney Injury. Anal. Chem. 2023. [Google Scholar] [CrossRef] [PubMed]
- Liu, Z.; Tian, Y. Recent advances in development of devices and probes for sensing and imaging in the brain. Sci. China Chem. 2021, 64, 915–931. [Google Scholar] [CrossRef]
- Liu, Z.; Zhu, Y.; Zhang, L.; Jiang, W.; Liu, Y.; Tang, Q.; Cai, X.; Li, J.; LH, W.; Tao, C.; Yin, X.; Li, X.; Hou, S.; Jiang, D.; Liu, K.; Zhou, X.; Zhang, H.; Liu, M.; Fan, C.; Tian, Y. Structural and functional imaging of brains. Sci. China Chem. 2023, 66, 324–366. [Google Scholar] [CrossRef] [PubMed]
- Gao, P.; Pan, W.; Li, N.; Tang, B. Fluorescent probes for organelle-targeted bioactive species imaging. Chem. Sci. 2019, 10, 6035–6071. [Google Scholar] [CrossRef]
- Huang, H.; Tian, Y. A ratiometric fluorescent probe for bioimaging and biosensing of HBrO in mitochondria upon oxidative stress. Chem. Commun. 2018, 54, 12198–12201. [Google Scholar] [CrossRef]
- Xiao, P.; Ma, K.; Kang, M.; Huang, L.; Wu, Q.; Song, N.; Ge, J.; Li, D.; Dong, J.; Wang, L.; Wang, D.; Tang, B.Z. An aggregation-induced emission platform for efficient Golgi apparatus and endoplasmic reticulum specific imaging. Chem. Sci. 2021, 12, 13949–13957. [Google Scholar] [CrossRef]
- Sawada, S.; Yoshikawa, M.; Tsutsui, K.; Miyazaki, T.; Kano, K.; Mishiro-Sato, E.; Tsukiji, S. Palmitoylation-dependent small-molecule fluorescent probes for live-cell Golgi imaging. ACS Chem. Biol. 2023, 18, 1047–1053. [Google Scholar] [CrossRef] [PubMed]
- Choi, J.-W.; Hong, S.T.; Kim, M.S.; Paik, K.C.; Han, M.S.; Cho, B.R. Two-photon probes for Golgi apparatus: Detection of Golgi apparatus in live tissue by two-photon microscopy, Anal. Chem. ( 2019. [CrossRef] [PubMed]
- Paul, S.; Bhattacharya, A.; Hazra, N.; Gayen, K.; Sen, P.; Banerjee, A. Yellow-emitting carbon dots for selective fluorescence imaging of lipid droplets in living cells. Langmuir 2022, 38, 8829–8836. [Google Scholar] [CrossRef] [PubMed]
- Tong, L.; Wang, X.; Chen, Z.; Liang, Y.; Yang, Y.; Gao, W.; Liu, Z.; Tang, B. One-step fabrication of functional carbon dots with 90% fluorescence quantum yield for long-term lysosome imaging. Anal. Chem. 2020, 92, 6430–6436. [Google Scholar] [CrossRef] [PubMed]
- Jiang, L.; Cai, H.; Zhou, W.; Li, Z.; Zhang, L.; Bi, H. RNA-targeting carbon dots for live-cell imaging of granule dynamics. Adv. Mater. 2023, 35, 2210776. [Google Scholar] [CrossRef]
- Li, J.; Zhang, L.; Chen, J.; Zhang, R.; Liu, Z.; Zhao, J.; Liu, B.; Han, M.-Y.; Han, G.; Zhang, Z. One-step synthesized amphiphilic carbon dots for the super-resolution imaging of endoplasmic reticulum in live cells. RSC Adv. 2022, 12, 19424–19430. [Google Scholar] [CrossRef]
- Zhao, W.; Wang, Y.; Liu, K.; Zhou, R.; Shan, C. Multicolor biomass based carbon nanodots for bacterial imaging. Chinese Chem. Lett. 2022, 33, 798–802. [Google Scholar] [CrossRef]
- Long, Z.; Dai, J.; Hu, Q.; Wang, Q.; Zhen, S.; Zhao, Z.; Liu, Z.; Hu, J.J.; Lou, X.; Xia, F. Nanococktail based on AIEgens and semiconducting polymers: a single laser excited image-guided dual photothermal therapy. Theranostics 2020, 10, 2260–2272. [Google Scholar] [CrossRef]
- Feng, Z.; Wu, J.; Jiang, M.; Sha, J.; Liu, W.; Ren, H.; Zhang, W.; Lee, C.-S.; Wang, P. A rhodamine derivative-based fluorescent probe for visual monitoring of pH changes in the Golgi apparatus. Sens. Actuators B: Chem. 2022, 366, 131963. [Google Scholar] [CrossRef]
- Zhang, Y.; Li, K.; Ren, S.; Dang, Y.; Liu, G.; Zhang, R.; Zhang, K.; Long, X.; Jia, K. Coal-derived graphene quantum dots produced by ultrasonic physical tailoring and their capacity for Cu(II) detection. ACS Sustain. Chem. Eng. 2019, 7, 9793–9799. [Google Scholar] [CrossRef]
- Huang, H.; Cui, Y.; Liu, M.; Chen, J.; Wan, Q.; Wen, Y.; Deng, F.; Zhou, N.; Zhang, X.; Wei, Y. A one-step ultrasonic irradiation assisted strategy for the preparation of polymer-functionalized carbon quantum dots and their biological imaging. J. Colloid Interf. Sci. 2018, 532, 767–773. [Google Scholar] [CrossRef] [PubMed]
- Xu, J.; Cui, K.; Gong, T.; Zhang, J.; Zhai, Z.; Hou, L.; Zaman, F.U.; Yuan, C. Ultrasonic-assisted synthesis of N-doped, multicolor carbon dots toward fluorescent inks, fluorescence sensors. and logic gate operations, Nanomaterials 2022, 12, 312. [Google Scholar] [CrossRef]
- Zhao, W.-B.; Liu, K.-K.; Song, S.-Y.; Zhou, R.; Shan, C.-X. Fluorescent nano-biomass dots: ultrasonic-assisted extraction and their application as nanoprobe for Fe3+ detection. Nanoscale Res. Lett. 2019, 14, 130. [Google Scholar] [CrossRef] [PubMed]
- Kang, J.; Gao, P.; Zhang, G.; Shi, L.; Zhou, Y.; Wu, J.; Shuang, S.; Zhang, Y. Rapid sonochemical synthesis of copper nanoclusters with red fluorescence for highly sensitive detection of silver ions. Microchem. J. 2022, 178, 107370. [Google Scholar] [CrossRef]
- Huang, H.; Li, S.; Chen, B.; Wang, Y.; Shen, Z.; Qiu, M.; Pan, H.; Wang, W.; Wang, Y.; Li, X. Endoplasmic reticulum-targeted polymer dots encapsulated with ultrasonic synthesized near-infrared carbon nanodots and their application for in vivo monitoring of Cu2+. J. Colloid Interf. Sci. 2022, 627, 705–715. [Google Scholar] [CrossRef] [PubMed]
- Gedanken, A. Using sonochemistry for the fabrication of nanomaterials. Ultrason. Sonochem. 2004, 11, 47–55. [Google Scholar] [CrossRef] [PubMed]
- Dang, H.; Huang, L.-K.; Zhang, Y.; Wang, C.-F.; Chen, S. Large-scale ultrasonic fabrication of white fluorescent carbon dots. Ind. Eng. Chem. Res. 2016, 55, 5335–5341. [Google Scholar] [CrossRef]
- Liu, J.; Geng, Y.; Li, D.; Yao, H.; Huo, Z.; Li, Y.; Zhang, K.; Zhu, S.; Wei, H.; Xu, W.; Jiang, J.; Yang, B. Deep red emissive carbonized polymer dots with unprecedented narrow full width at half maximum. Adv. Mater. 2020, 32, 1906641. [Google Scholar] [CrossRef] [PubMed]
- Liu, J.; Kong, T.; Xiong, H.-M. Mulberry-leaves-derived red-emissive carbon dots for feeding silkworms to produce brightly fluorescent silk. Adv. Mater. 2022, 34, 2200152. [Google Scholar] [CrossRef]
- Zhao, X.; Li, J.; Liu, D.; Yang, M.; Wang, W.; Zhu, S.; Yang, B. Self-enhanced carbonized polymer dots for selective visualization of lysosomes and real-time apoptosis monitoring. iScience 2020, 23, 100982. [Google Scholar] [CrossRef] [PubMed]
- Wang, B.; Song, H.; Tang, Z.; Yang, B.; Lu, S. Ethanol-derived white emissive carbon dots: the formation process investigation and multi-color/white LEDs preparation. Nano Res. 2022, 15, 942–949. [Google Scholar] [CrossRef]
- Deng, Y.; Shen, C.; Zhao, W.; Zheng, G.; Jiao, F.; Lou, Q.; Liu, K.; Shan, C.-X.; Dong, L. Biosynthesis of the narrowband deep-red emissive carbon nanodots from eggshells. ACS Sustainable Chem. Eng. 2023, 11, 6535–6544. [Google Scholar] [CrossRef]
- Zhao, W.-B.; Wang, R.-T.; Liu, K.-K.; Du, M.-R.; Wang, Y.; Wang, Y.-Q.; Zhou, R.; Liang, Y.-C.; Ma, R.-N.; Sui, L.-Z.; Lou, Q.; Hou, L.; Shan, C.-X. Near-infrared carbon nanodots for effective identification and inactivation of Gram-positive bacteria. Nano Res. 2022, 15, 1699–1708. [Google Scholar] [CrossRef]
- Zhou, D.; Huang, H.; Wang, Y.; Wang, Y.; Hu, Z.; Li, X. A yellow-emissive carbon nanodot-based ratiometric fluorescent nanosensor for visualization of exogenous and endogenous hydroxyl radicals in the mitochondria of live cells. J. Mater. Chem. B 2019, 7, 3737–3744. [Google Scholar] [CrossRef]
- Zhao, W.-B.; Chen, D.-D.; Liu, K.-K.; Wang, Y.; Zhou, R.; Song, S.-Y.; Li, F.-K.; Sui, L.-Z.; Lou, Q.; Hou, L.; Shan, C.-X. Near-infrared I/II emission and absorption carbon dots via constructing localized excited/charge transfer state for multiphoton imaging and photothermal therapy. Chem. Eng. J. 2023, 452, 139231. [Google Scholar] [CrossRef]
- Yu, X.-W.; Liu, X.; Jiang, Y.-W.; Li, Y.-H.; Gao, G.; Zhu, Y.-X.; Lin, F.; Wu, F.-G. Rose bengal-derived ultrabright sulfur-doped carbon dots for fast discrimination between live and dead cells. Anal. Chem. 2022, 94, 4243–4251. [Google Scholar] [CrossRef]
- Wang, B.; Wei, Z.; Sui, L.; Yu, J.; Zhang, B.; Wang, X.; Feng, S.; Song, H.; Yong, X.; Tian, Y.; Yang, B.; Lu, S. Electron–phonon coupling-assisted universal red luminescence of o-phenylenediamine-based carbon dots. Light Sci. Appl. 2022, 11, 172. [Google Scholar] [CrossRef] [PubMed]
- Zheng, Y.; Li, X.; Wei, C.; Gao, Y.; Han, G.; Zhao, J.; Zhang, C.; Zhang, K.; Zhang, Z. Long-lived phosphorescent carbon dots as photosensitizers for total antioxidant capacity assay. Anal. Chem. 2023, 95, 8914–8921. [Google Scholar] [CrossRef] [PubMed]
- Wang, Z.-X.; Hu, L.; Wang, W.-J.; Kong, F.-Y.; Wei, M.-J.; Fang, H.-L.; Li, Q.-L.; Wang, W. One-pot green preparation of deep-ultraviolet and dual-emission carbon nanodots for dual-channel ratiometric determination of polyphenol in tea sample. Microchim. Acta 2022, 189, 241. [Google Scholar] [CrossRef] [PubMed]
- Liu, K.-K.; Song, S.-Y.; Sui, L.-Z.; Wu, S.-X.; Jing, P.-T.; Wang, R.-Q.; Li, Q.-Y.; Wu, G.-R.; Zhang, Z.-Z.; Yuan, K.-J.; Shan, C.-X. Efficient red/near-infrared-emissive carbon nanodots with multiphoton excited upconversion fluorescence. Adv. Sci. 2019, 0, 1900766. [Google Scholar] [CrossRef]
- Yang, L.; Huang, H.; Wang, T.; Zhou, D.; Chen, Q.; Li, D.; Chen, S.; Lin, P. Endoplasmic reticulum-targetable selenium-doped carbon nanodots with redox-responsive fluorescence for in situ free-radical scavenging in cells and mice. Arab. J. Chem. 2023, 16, 105036. [Google Scholar] [CrossRef]
- Li, L.; Shi, L.; Jia, J.; Eltayeb, O.; Lu, W.; Tang, Y.; Dong, C.; Shuang, S. Dual photoluminescence emission carbon dots for ratiometric fluorescent GSH sensing and cancer cell recognition. ACS Appl. Mater. Interfaces 2020, 12, 18250–18257. [Google Scholar] [CrossRef] [PubMed]
- Khan, W.U.; Qin, L.; Alam, A.; Zhou, P.; Peng, Y.; Wang, Y. Water-soluble green-emitting carbon nanodots with enhanced thermal stability for biological applications. Nanoscale 2021, 13, 4301–4307. [Google Scholar] [CrossRef]
- Xu, Y.; Wang, B.; Zhang, M.; Zhang, J.; Li, Y.; Jia, P.; Zhang, H.; Duan, L.; Li, Y.; Li, Y.; Qu, X.; Wang, S.; Liu, D.; Zhou, W.; Zhao, H.; Zhang, H.; Chen, L.; An, X.; Lu, S.; Zhang, S. Carbon dots as a potential therapeutic agent for the treatment of cancer-related anemia. Adv. Mater. 2022, 34, 2200905. [Google Scholar] [CrossRef]
- Zhang, L.; Wang, Y.; Jia, L.; Zhang, X.; Xu, J. Dynamic anti-counterfeiting and reversible multi-level encryption-decryption based on spirulina derived pH-responsive dual-emissive carbon dots. J. Lumin. 2023, 257, 119727. [Google Scholar] [CrossRef]
- Li, K.; Liu, B. Polymer-encapsulated organic nanoparticles for fluorescence and photoacoustic imaging. Chem. Soc. Rev. 2014, 43, 6570–6597. [Google Scholar] [CrossRef]
- Che, W.; Zhang, L.; Li, Y.; Zhu, D.; Xie, Z.; Li, G.; Zhang, P.; Su, Z.; Dou, C.; Tang, B.Z. Ultrafast and noninvasive long-term bioimaging with highly stable red aggregation-induced emission nanoparticles. Anal. Chem. 2019, 91, 3467–3474. [Google Scholar] [CrossRef] [PubMed]
- Wu, Y.; Han, H.-H.; He, L.; Li, L.; Zang, Y.; Li, J.; He, X.-P.; Ding, Y.; Cao, W.; James, T.D. Selective detection of peroxynitrite using an isatin receptor and a naphthalimide fluorophore. Chem. Commun. 2023, 59, 5051–5054. [Google Scholar] [CrossRef] [PubMed]
- Wang, P.; Wang, Y.; Xia, X.; Huang, W.; Yan, D. Redox-responsive drug-inhibitor conjugate encapsulated in DSPE-PEG2k micelles for overcoming multidrug resistance to chemotherapy. Biomater. Sci. 2023, 11, 4335–4345. [Google Scholar] [CrossRef] [PubMed]
- Lin, Y.-X.; Wang, Y.; An, H.-W.; Qi, B.; Wang, J.; Wang, L.; Shi, J.; Mei, L.; Wang, H. Peptide-based autophagic gene and cisplatin co-delivery systems enable improved chemotherapy resistance. Nano Lett. 2019, 19, 2968–2978. [Google Scholar] [CrossRef]
Scheme 1.
Schematic illustration of the preparation of NIR emissive Golgi-Pdots and its application in Golgi apparatus targeted imaging.
Scheme 1.
Schematic illustration of the preparation of NIR emissive Golgi-Pdots and its application in Golgi apparatus targeted imaging.
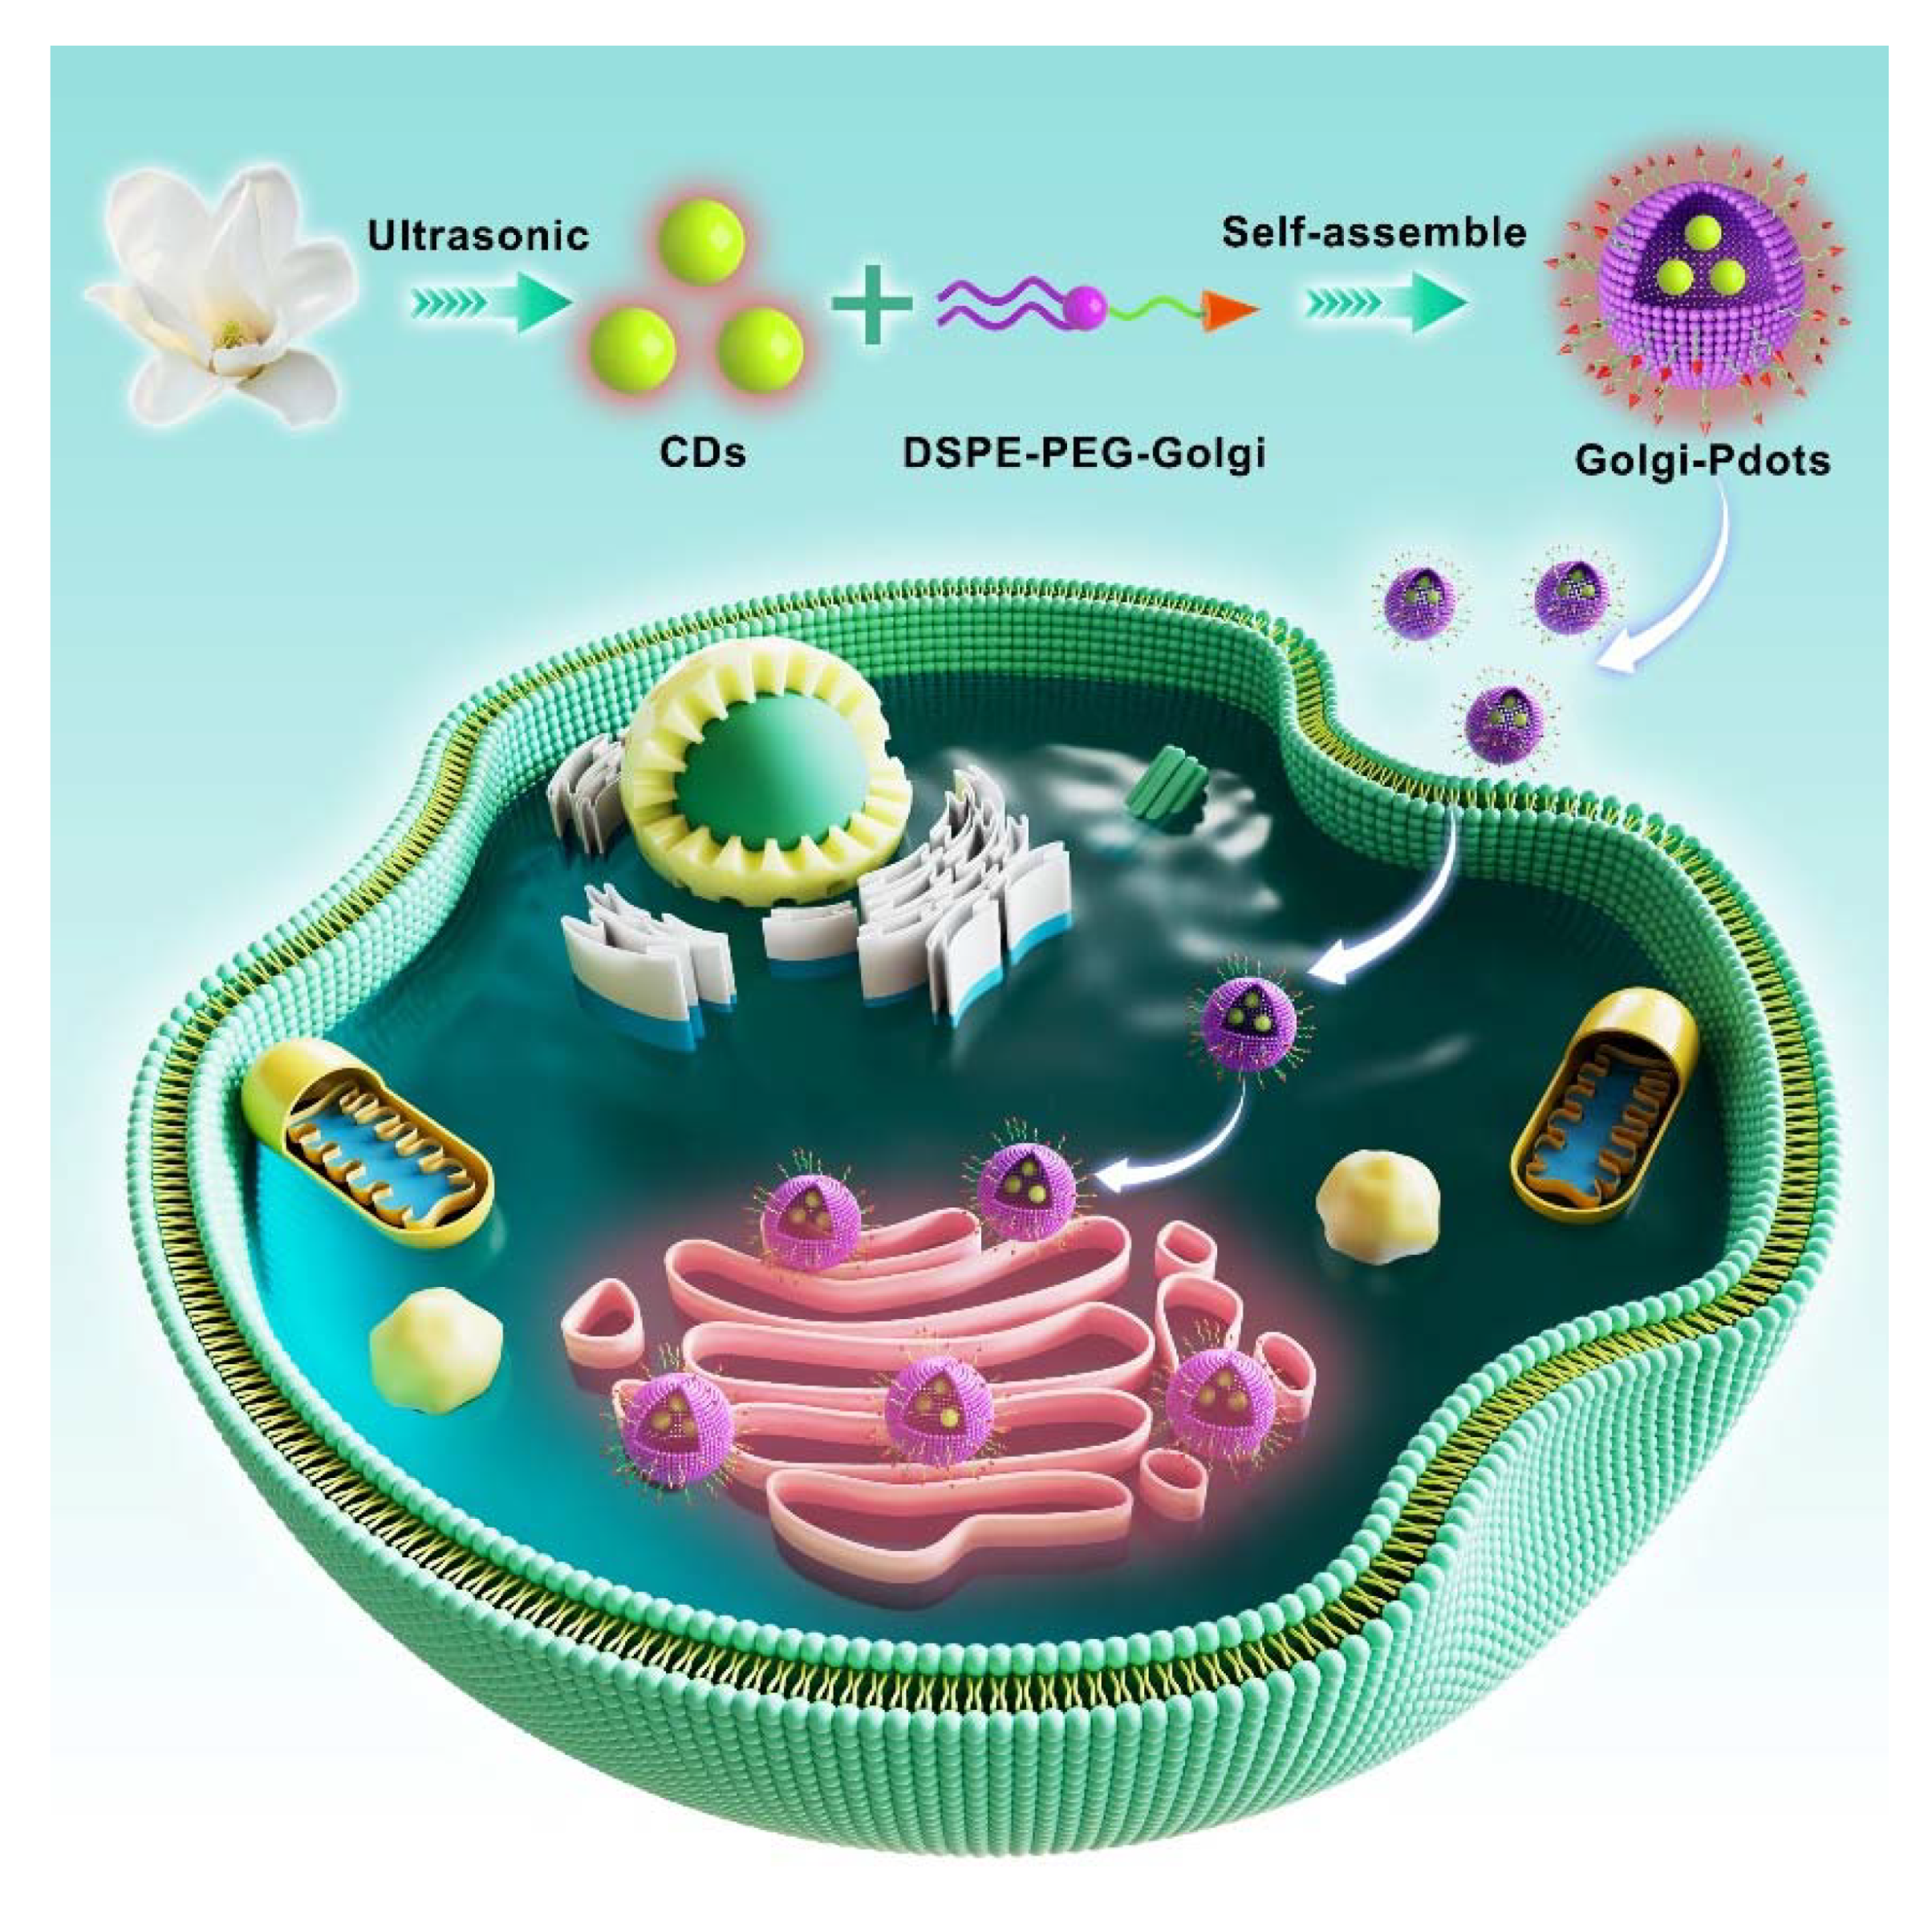
Figure 1.
(A) Schematic illustration of the fabrication of NIR emissive CDs. (B) STEM image of the CDs. (C) Size distribution of the CDs. (D) AFM image of the CDs. Inset: the corresponding height profile analysis along the green line. (E) FTIR spectrum of the CDs. (F) High resolution XPS spectrum of C1s. (G) High resolution XPS spectrum of O1s.
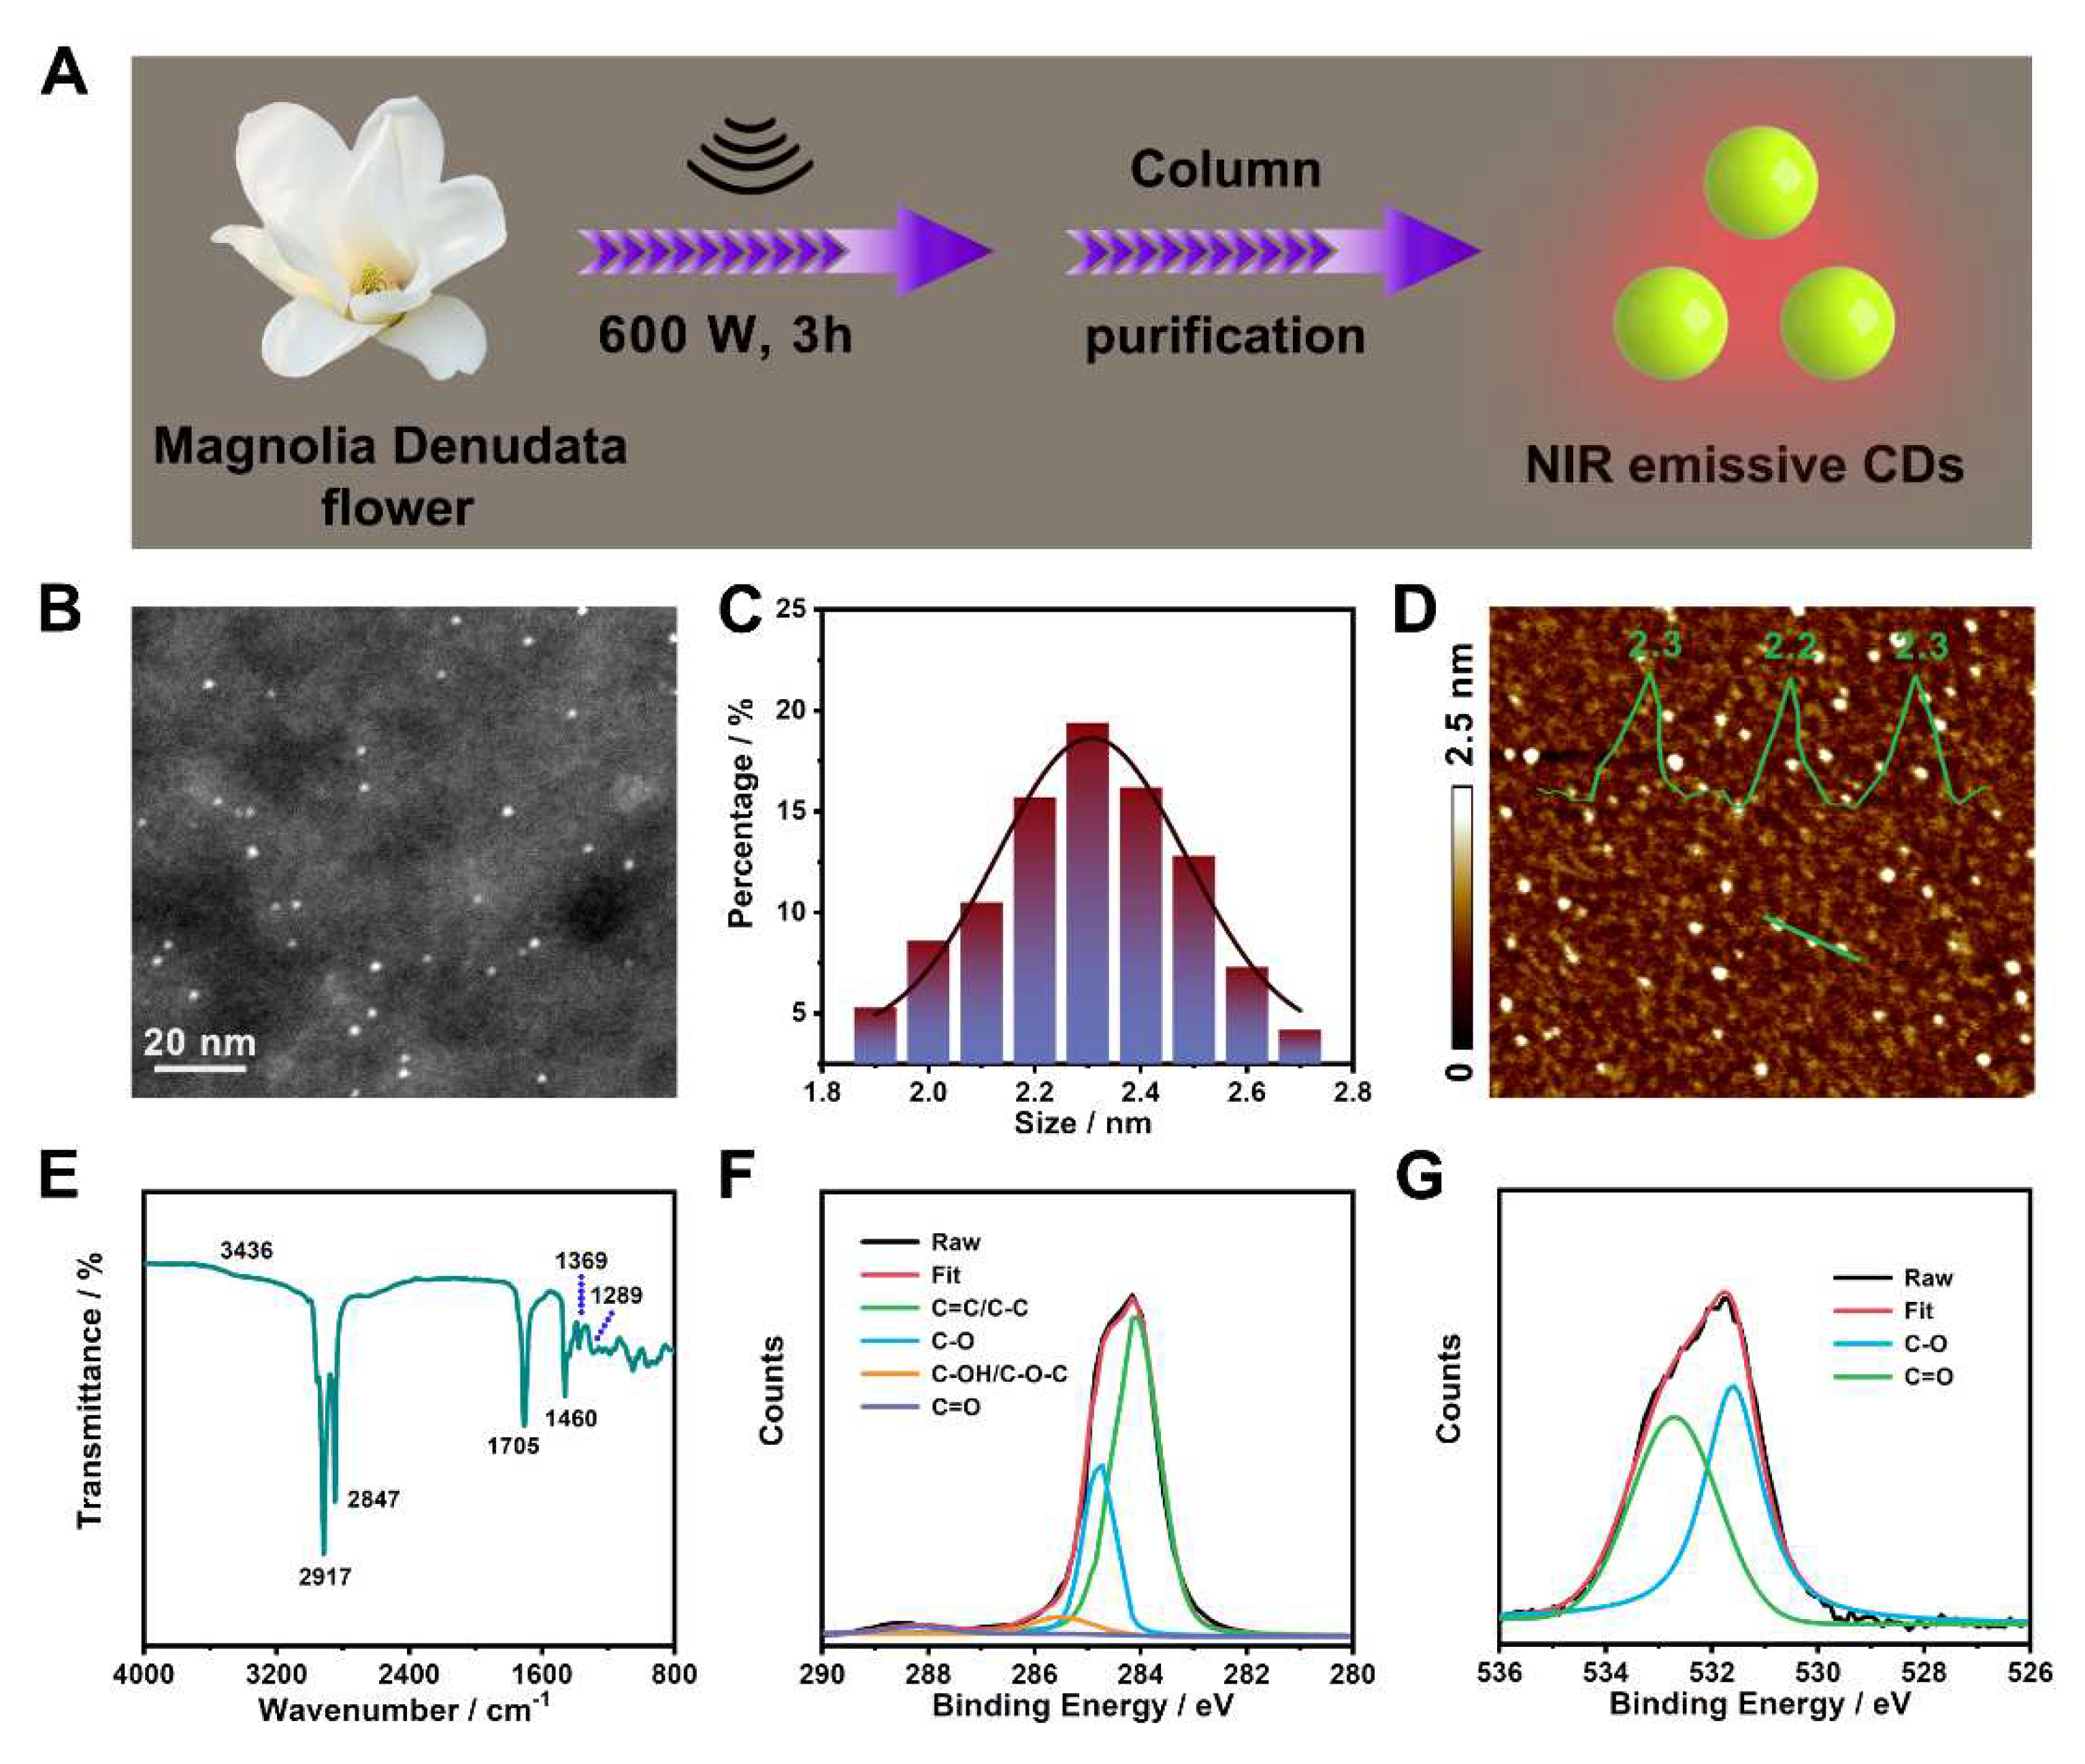
Figure 2.
(A) The ethanol solution of the CDs under (left) nature light and (right) 365 nm UV light. (B) Absorption spectrum of the CDs. (C) Fluorescence spectra of the CDs (a: excitation wavelength; b: emission wavelength). (D) Excitation-emission contour plot of the CDs in ethanol. (E) Fluorescence spectra of the CDs in ethanol-water mixtures with different water fractions (fw). (F) Contact angle of water on a CD film.
Figure 3.
(A) Schematic illustration of the preparation of NIR emissive Golgi-Pdots. (B) TEM image of Golgi-Pdots. (C) Corresponding size distribution of the Golgi-Pdots. (D) The PBS solution of Golgi-Pdots under (left) visible light and (right) 365 nm UV light. (E) Fluorescence spectra of Golgi-Pdots (a: excitation wavelength; b: emission wavelength). (F) Excitation-emission matrix of Golgi-Pdots in PBS solution. (G) Fluorescence decay curve of (black curve) the CDs and (pink curve) Golgi-Pdots upon excitation at 406 nm. The fluorescence decay was fitted to a single exponential decay.
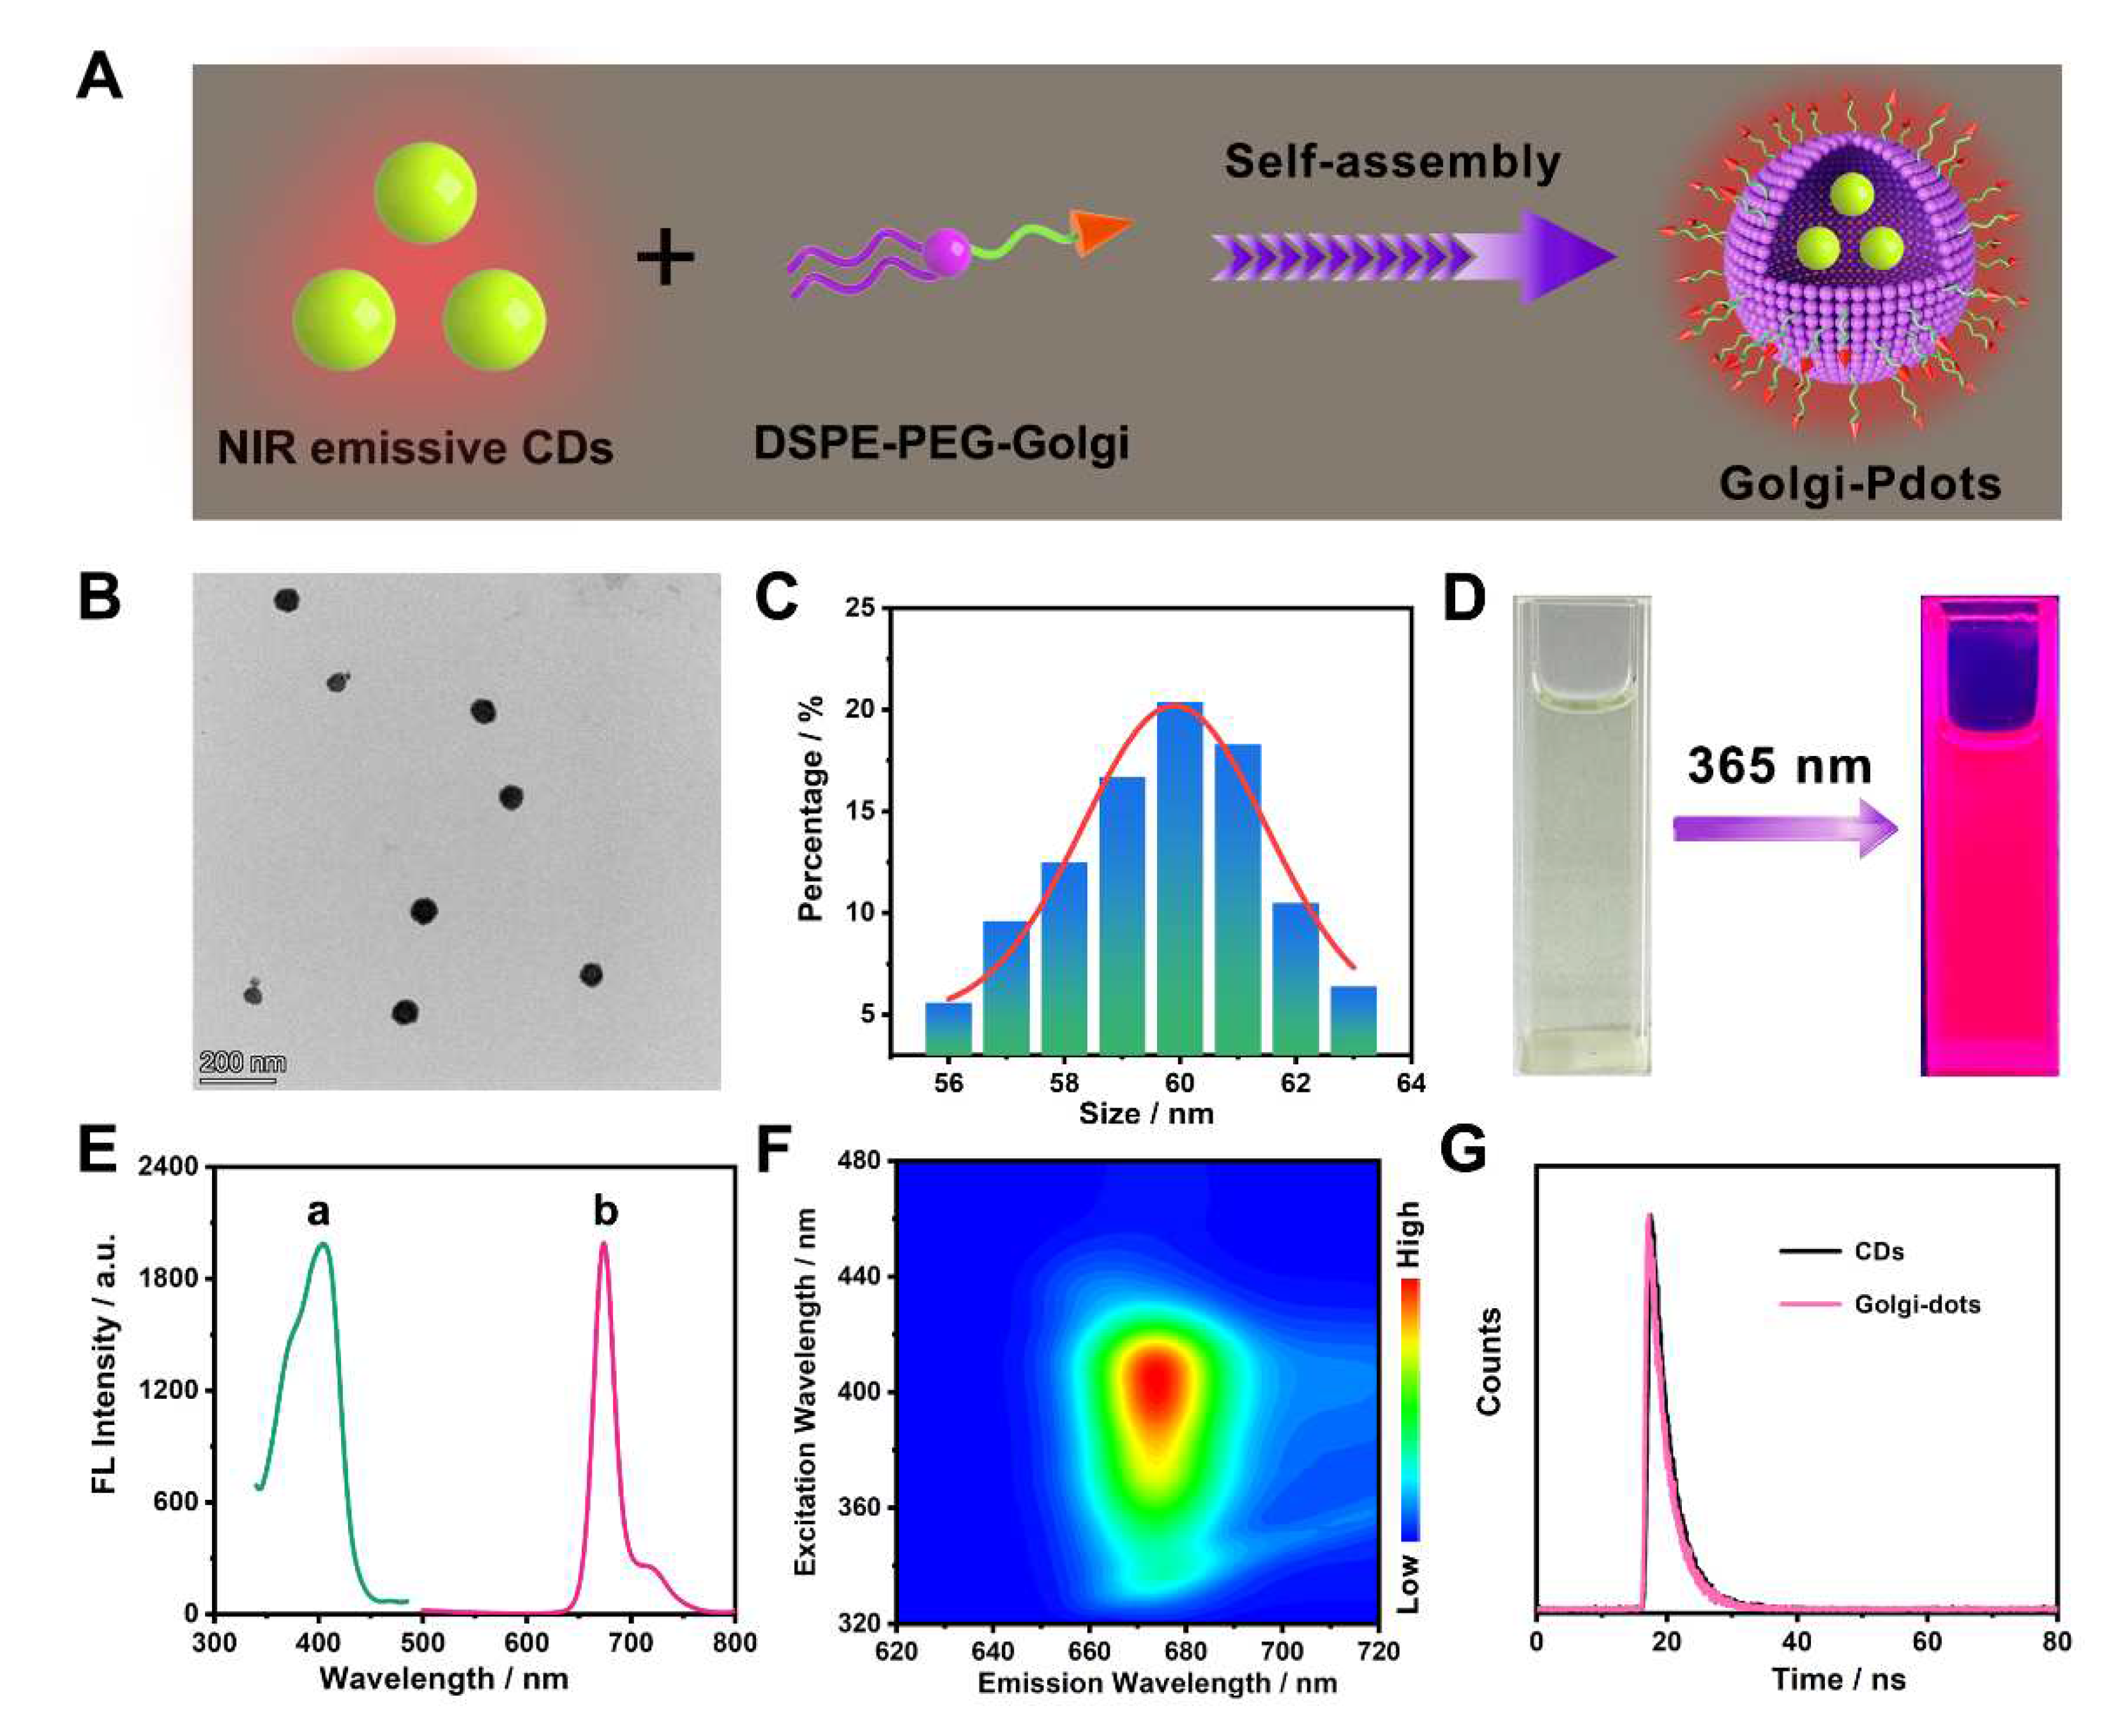
Figure 4.
(A) The influence of pH values on the fluorescence intensity of Golgi-Pdots. (B) Effect of ionic strengths on the fluorescence intensity of Golgi-Pdots. (C) Dependence of fluorescence intensity on excitation time for Golgi-Pdots under 406 nm.
Figure 4.
(A) The influence of pH values on the fluorescence intensity of Golgi-Pdots. (B) Effect of ionic strengths on the fluorescence intensity of Golgi-Pdots. (C) Dependence of fluorescence intensity on excitation time for Golgi-Pdots under 406 nm.
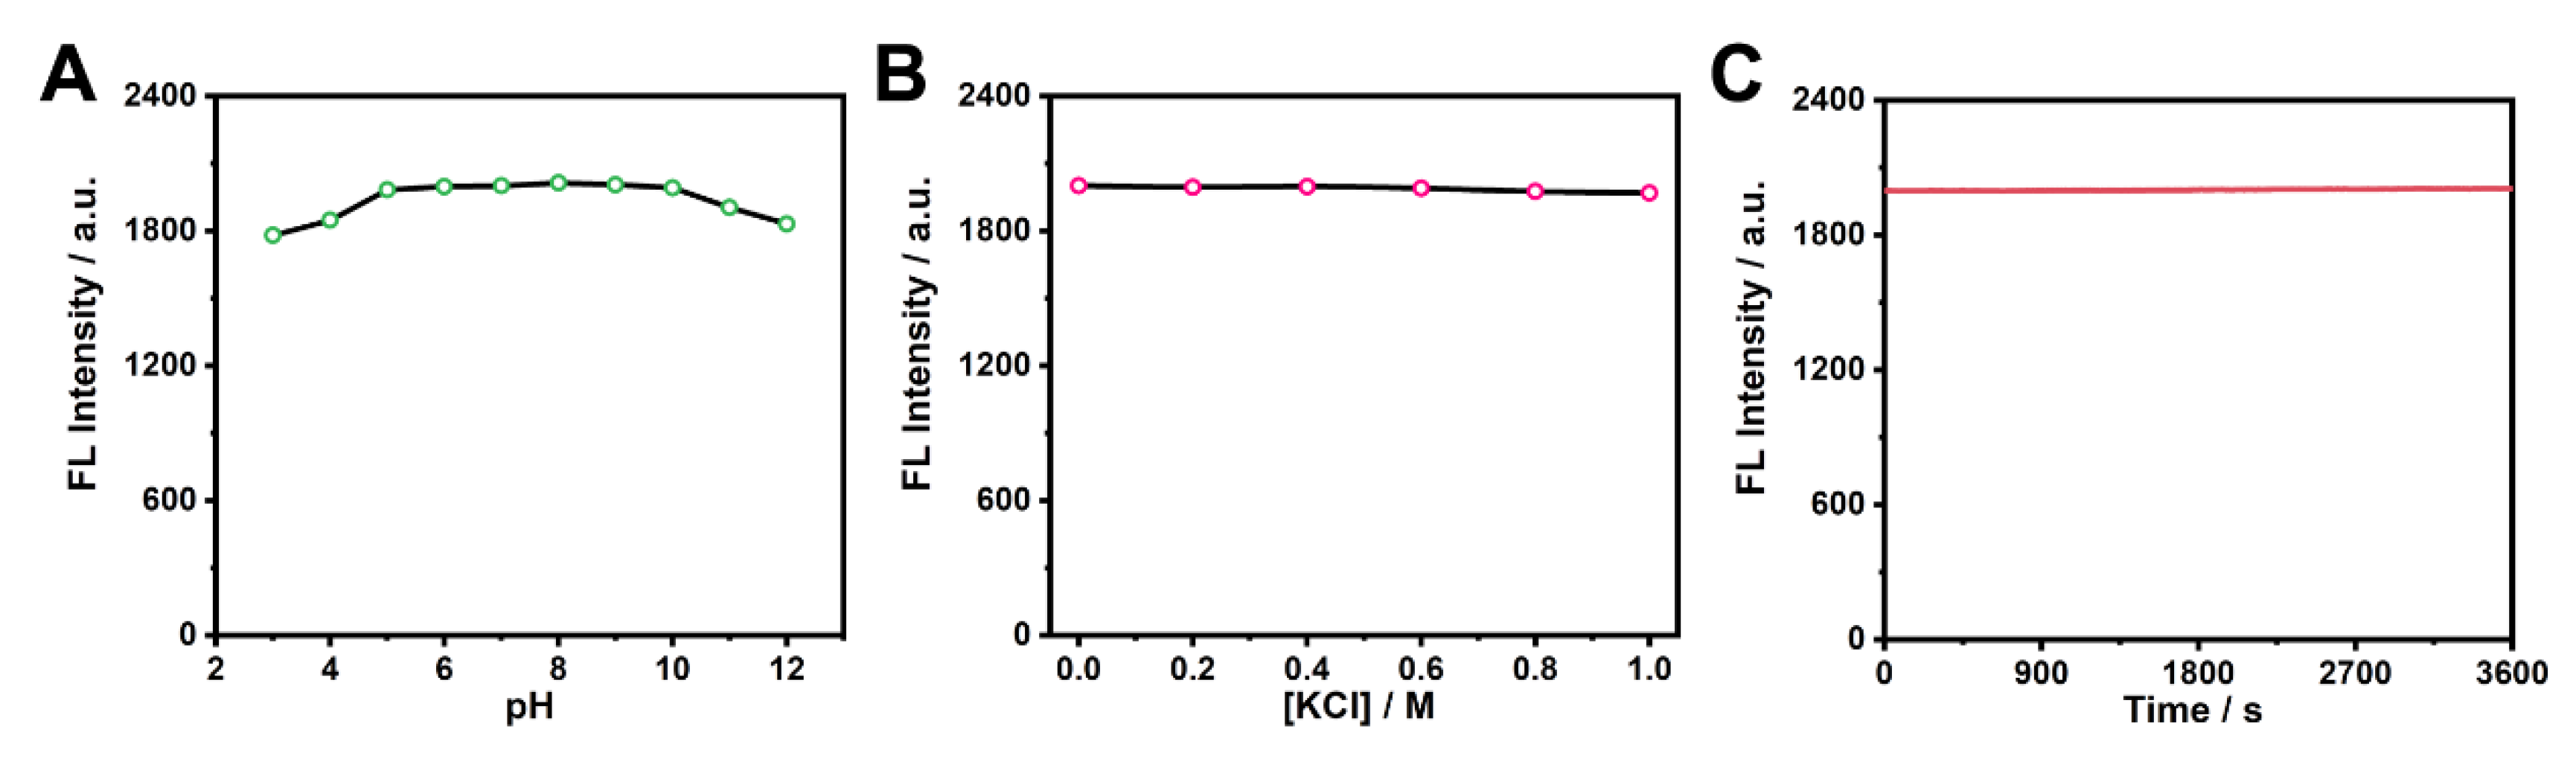
Figure 5.
MTT assay of HeLa cells incubated with different concentrations of Golgi-Pdots for 48 h.
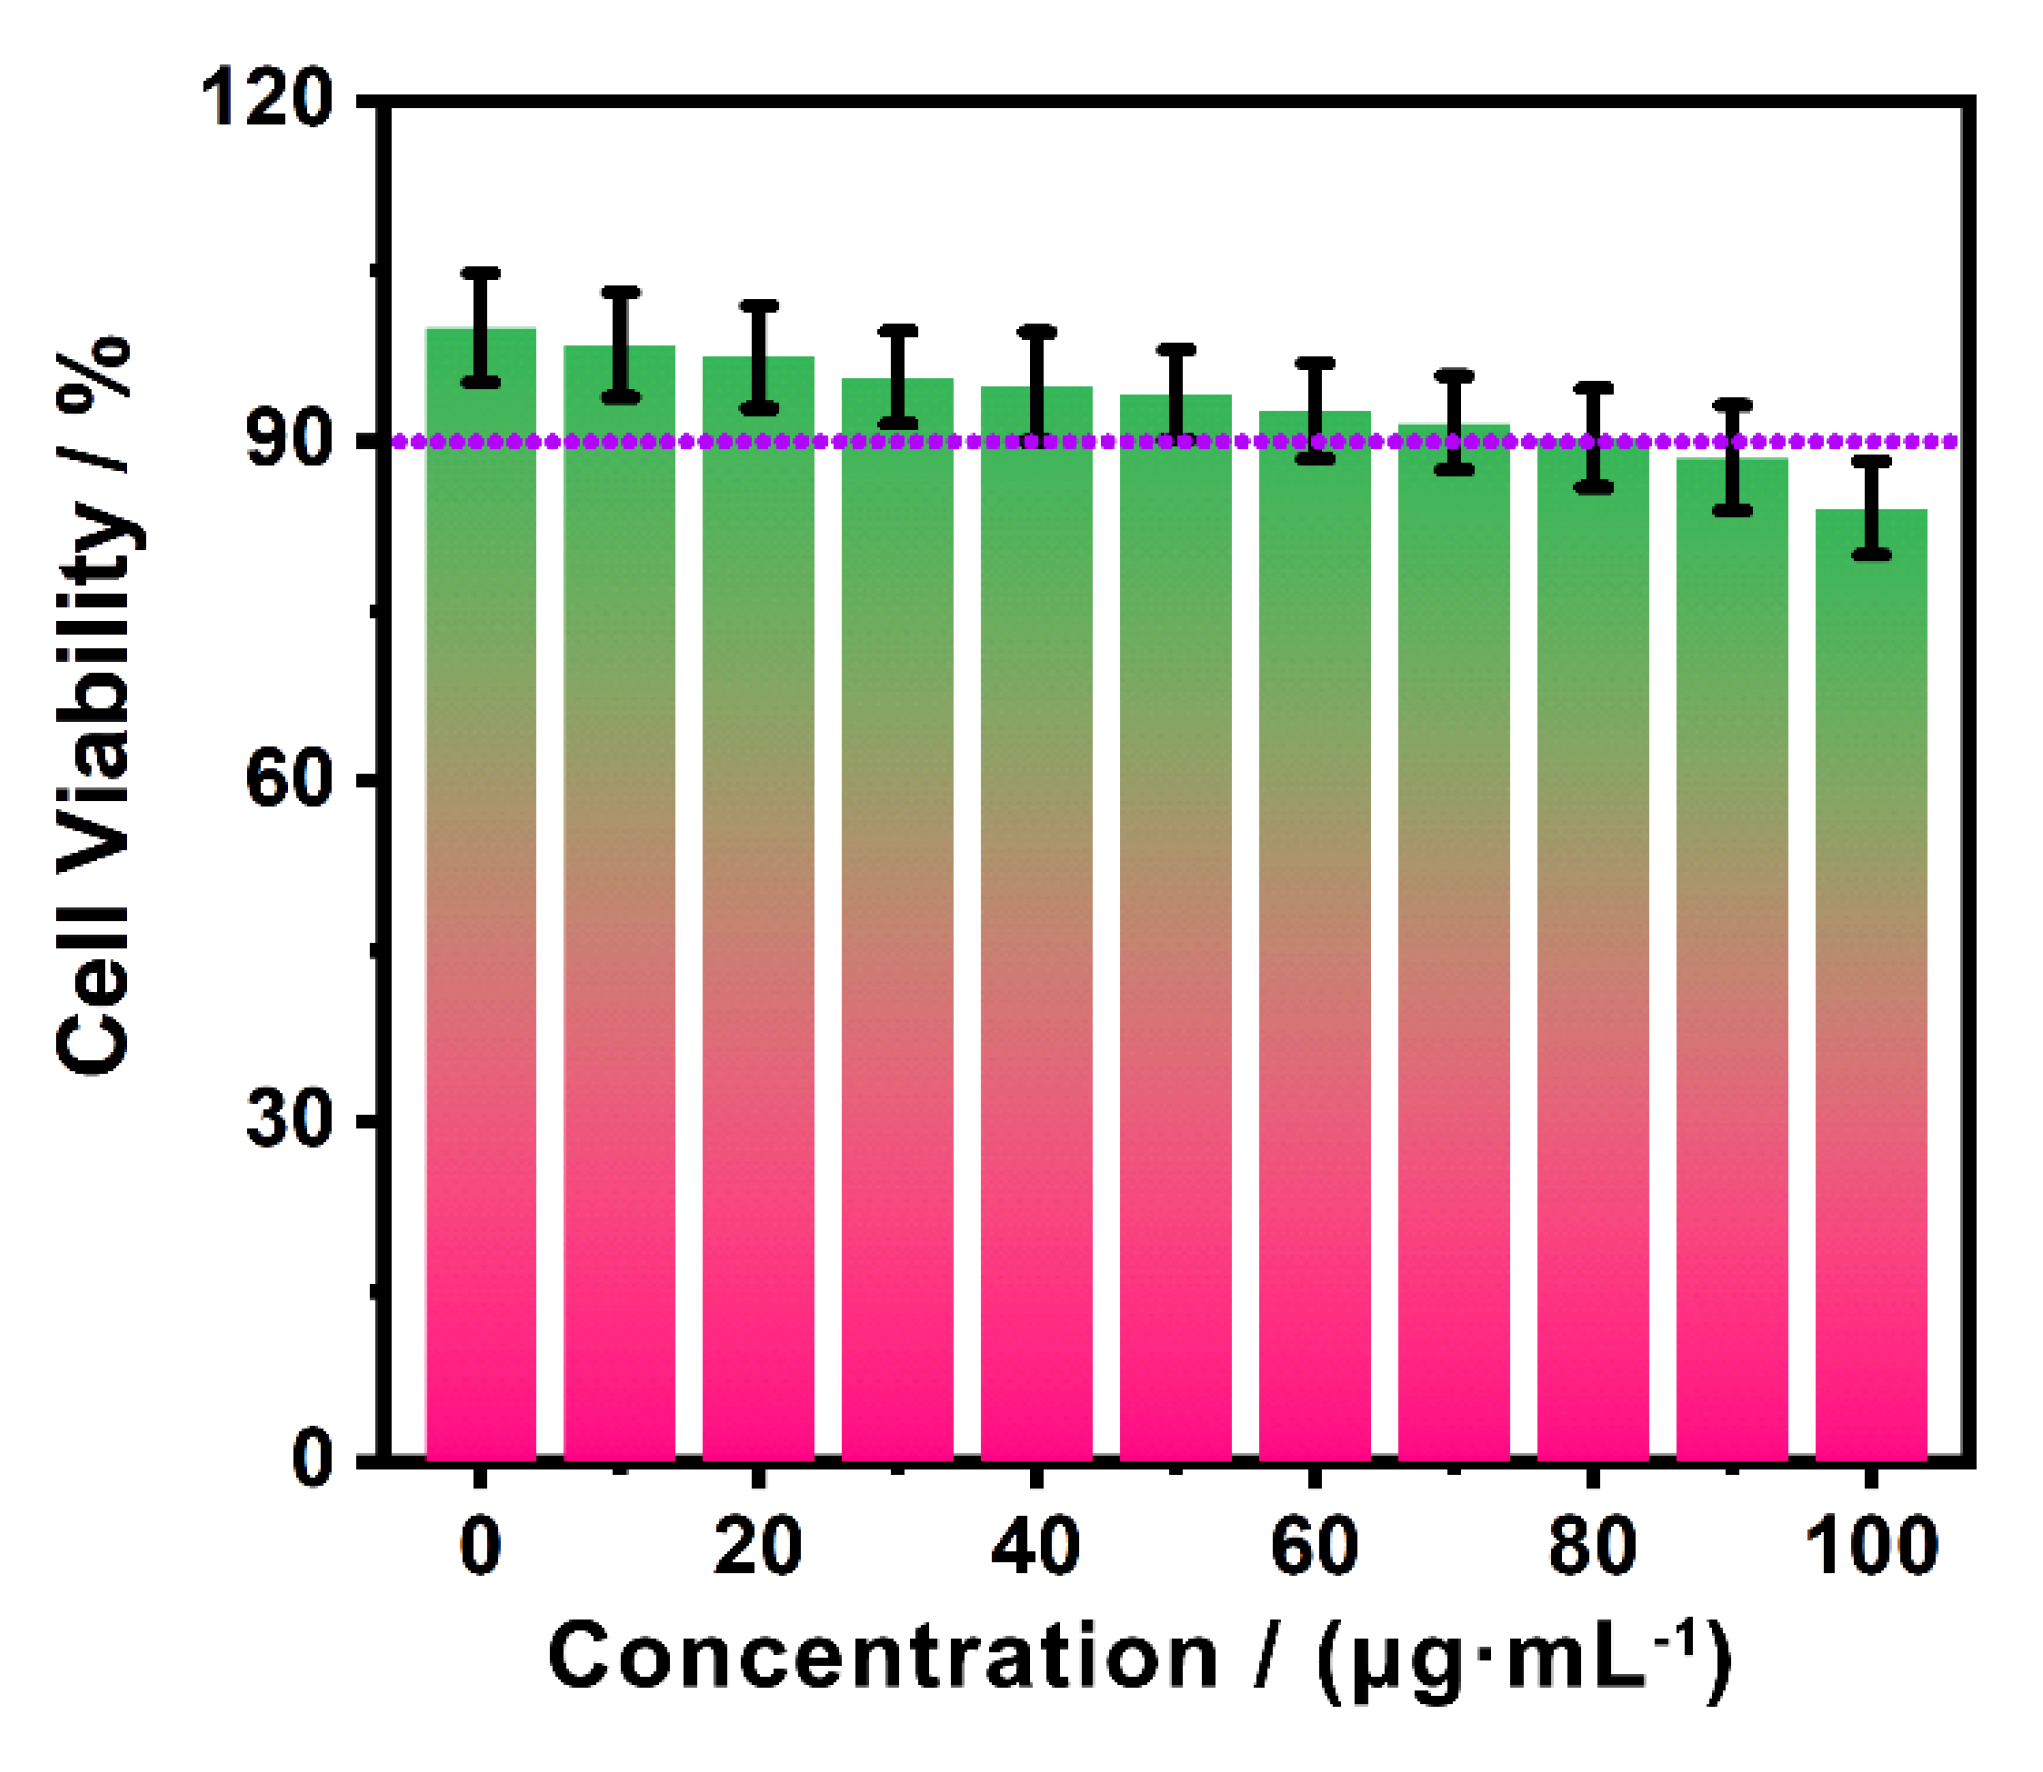
Figure 6.
Subcellular localization investigations in HeLa cells that were co-labeled with Golgi-Pdots (10 μg mL-1) and Golgi-Tracker Green (50 nM)). A: red fluorescence from Golgi-Pdots (λem = 630-710 nm); B: green fluorescence from Golgi-Tracker Green (λem = 500-580 nm); C: the merged image of A with B; D: bright-field image; E: the merged image of C with D; F: intensity profiles of Golgi-Pdots and Golgi-Tracker Green along the white line in A and B across the HeLa cell.
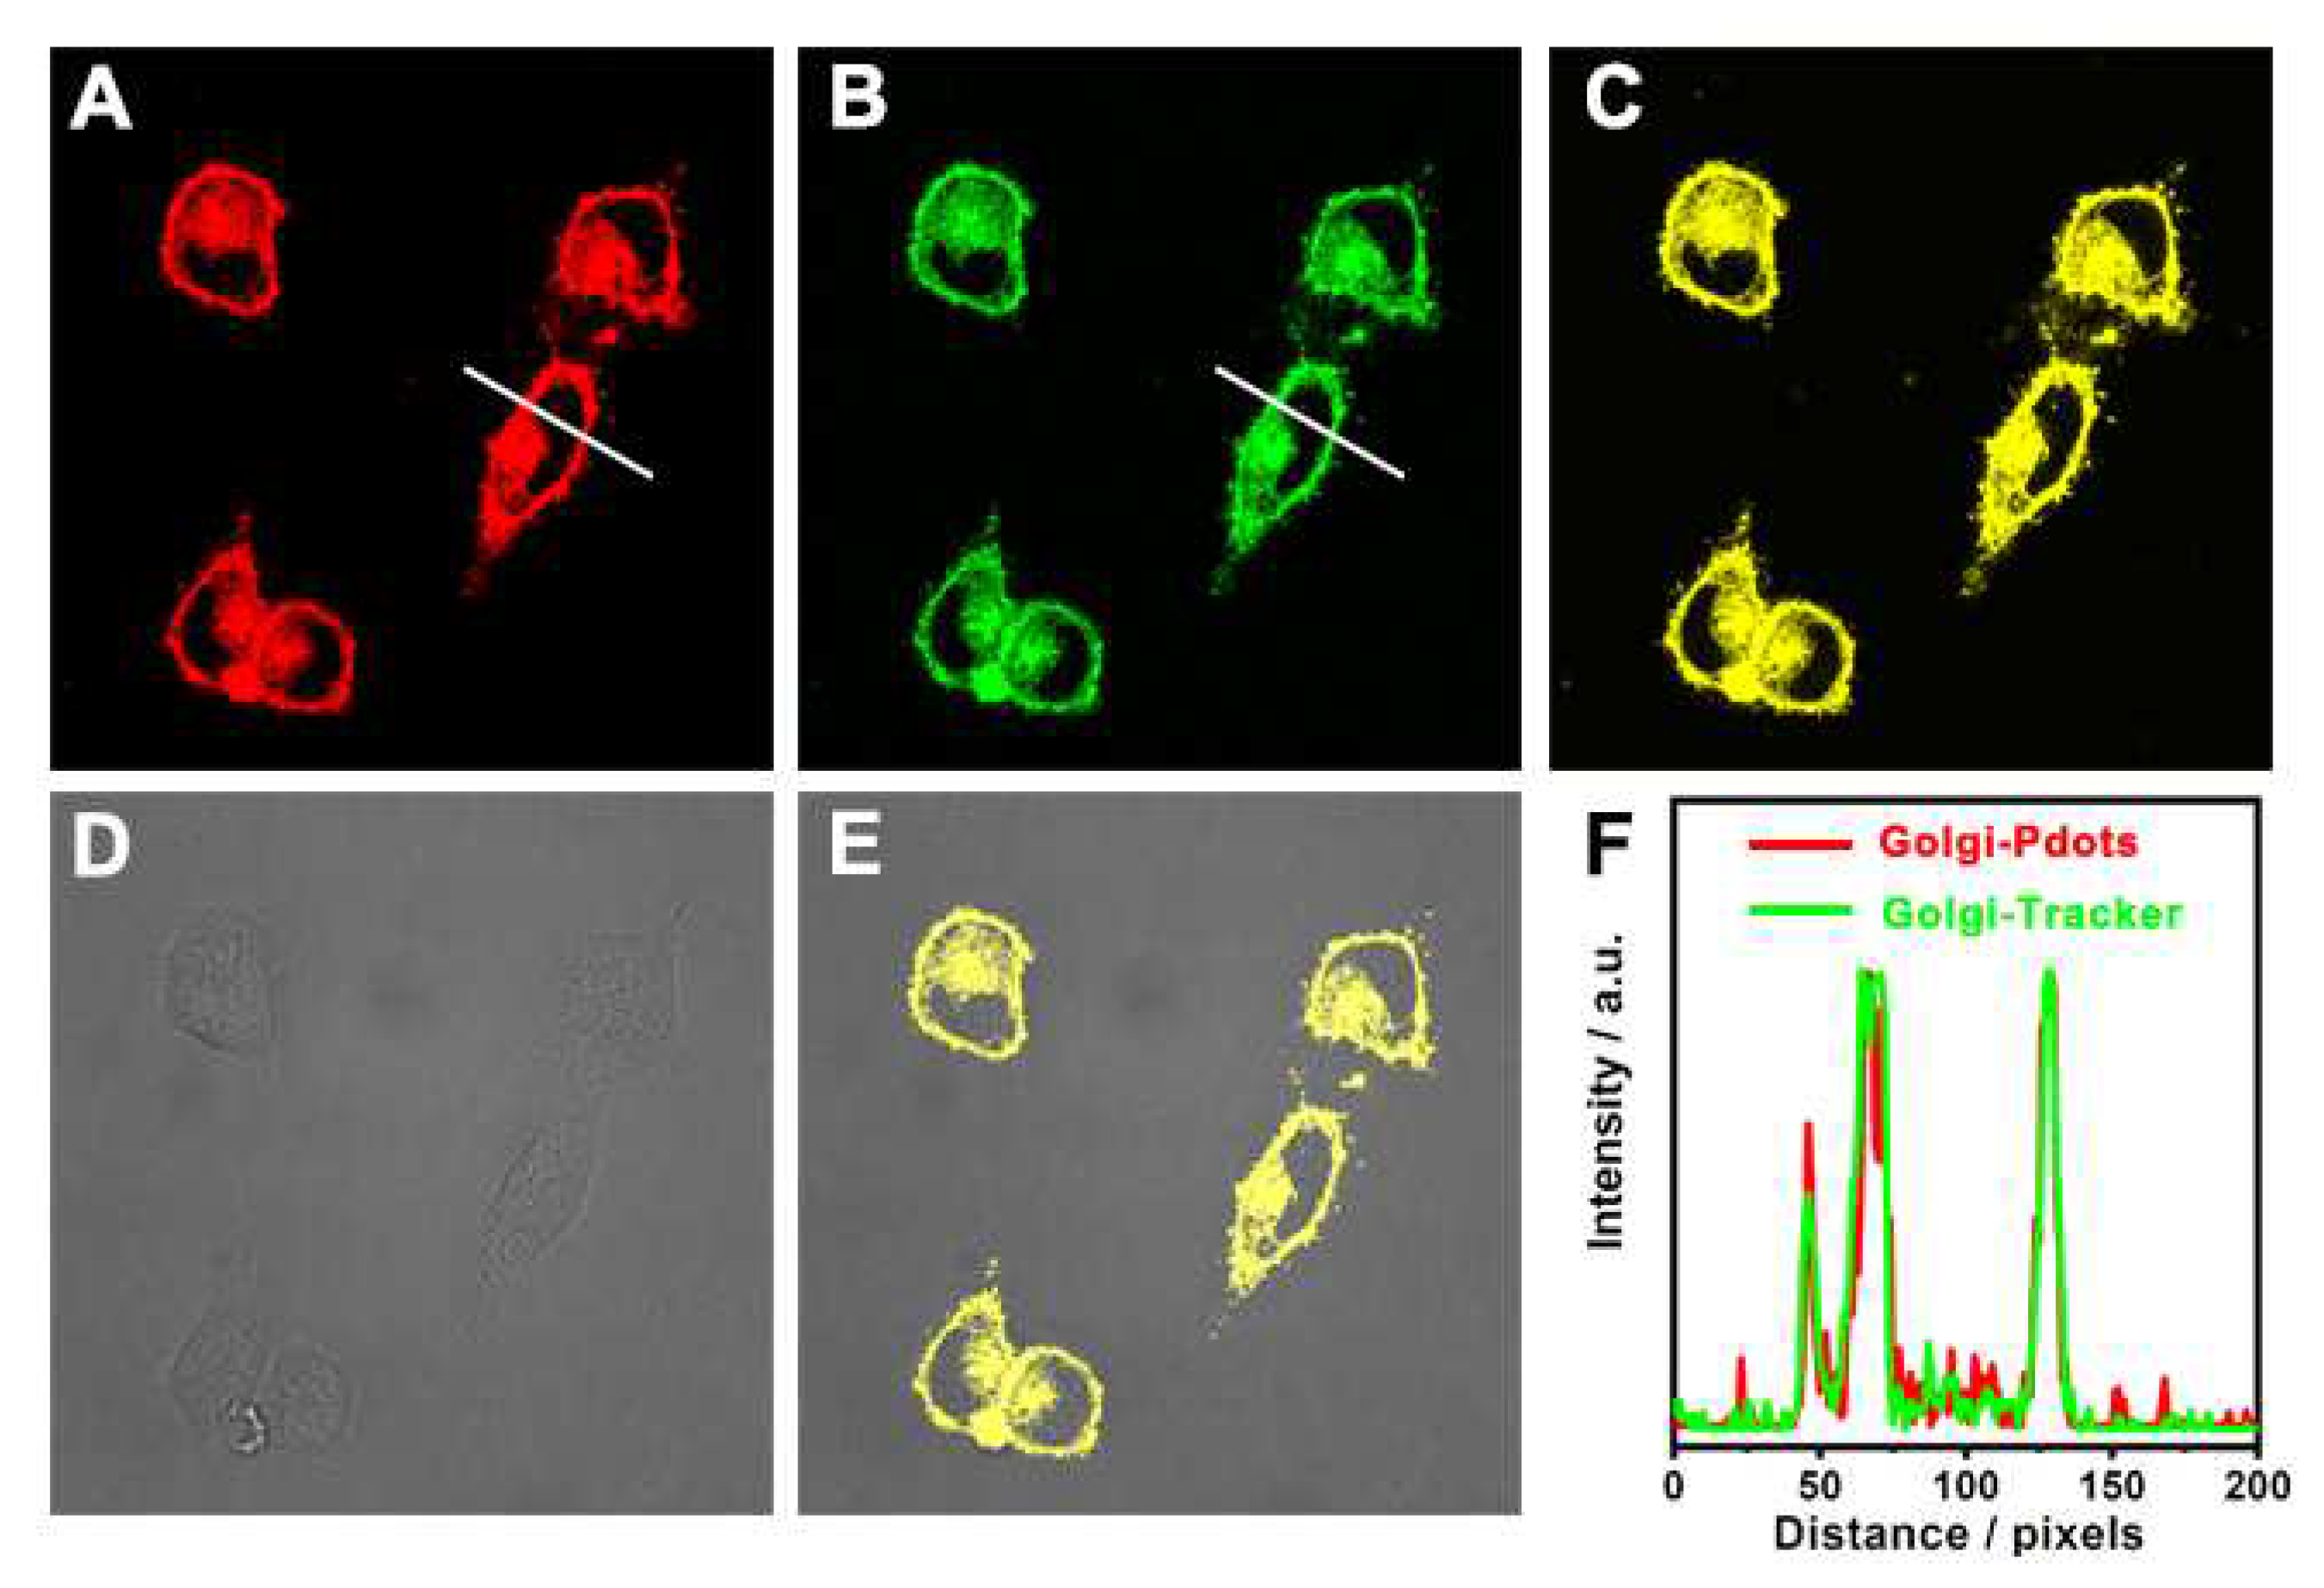
Figure 7.
Photostability studies on Golgi-Pdots and Golgi-Tracker Green in cells. Fluorescence images of HeLa cells stained with Golgi-Pdots (λem = 630-710 nm) and ER-Tracker Green (λem = 500-580 nm) after being scanned for varied times.
Figure 7.
Photostability studies on Golgi-Pdots and Golgi-Tracker Green in cells. Fluorescence images of HeLa cells stained with Golgi-Pdots (λem = 630-710 nm) and ER-Tracker Green (λem = 500-580 nm) after being scanned for varied times.
Disclaimer/Publisher’s Note: The statements, opinions and data contained in all publications are solely those of the individual author(s) and contributor(s) and not of MDPI and/or the editor(s). MDPI and/or the editor(s) disclaim responsibility for any injury to people or property resulting from any ideas, methods, instructions or products referred to in the content. |
© 2023 by the authors. Licensee MDPI, Basel, Switzerland. This article is an open access article distributed under the terms and conditions of the Creative Commons Attribution (CC BY) license (http://creativecommons.org/licenses/by/4.0/).
Copyright: This open access article is published under a Creative Commons CC BY 4.0 license, which permit the free download, distribution, and reuse, provided that the author and preprint are cited in any reuse.


