
Submitted:
02 August 2023
Posted:
03 August 2023
You are already at the latest version
Abstract
Shrubland and forestland covers are highly prone to fire. The Normalized Difference Vegetation Index (NDVI) has been widely used for biomass quantitative assessment. This study aims were the following: (1) to compute the NDVI annual curve for two types of land cover eucalypts and shrubland areas; (2) to collect field data in these two types of land cover to estimate aboveground biomass (AGB); and (3) to produce AGB maps for eucalypts and shrubland areas by modelling AGB with NDVI and validate them with other data sources. A study area in the central inland Portugal was considered. The Sentinel-2 MSI imagery for the year of 2022 and 2023 were used to compute the NDVI. The NDVI annual curve for 2022 showed a minimum observed between July and August, in accordance with the climatological data, and allowed differentiating eucalypts from shrubland areas. Spectral signatures also confirmed this differentiation. The fitted linear models for AGB prediction using the NDVI imagery showed good fitting performances (R2 of 0.76 and 0.69). The AGB maps provide a relevant decision support tool for forest management and for fire hazard and fire severity mitigation. Further research is needed using more robust data sets for models’ independent validation.
Keywords:
Biomass components
; Carbon sequestration
; NDVI-CV method
; Spectral signatures
; Fire hazard
; Fire potential severity
1. Introduction
In most developed countries land use area assessment is based on field measurement and biomass stock is estimated from the national forest inventory [1]. Despite of field data collection being the most accurate technique, it is costly, time-consuming, and impractical at large scale when destructive data collection is needed for biomass quantification [2,3]. Therefore, forest biomass is commonly estimated by allometric functions by biomass components (e.g., stem, bark, branches, leaves, seeds, and roots) and describes the total dry weight of live trees per unit area by relating them to structural metrics such as stand composition and density, tree diameter at breast height, and tree total height [4,5].
Forest aboveground biomass estimation (AGB—e.g., stem, bark, branches, leaves, and seeds) serves as a basic component in studies to estimate forest ecosystems carbon stocks and their changes which mainly includes trees as the most important element of and the largest living biomass reserves in forests [2,3,4,6]. Thus, forest AGB maps are important tools to monitor global carbon cycle and for climate studies. But also to identify areas of high conservation priority or with high intraspecific competition having a potential need of management treatments [4,6,7] and to estimate forest residues for biomass energy production [8].
During the past decades remote sensing has been widely used for biomass estimation due to its wide-area coverage capability responding to the limitations of field data collection on large scales. Nevertheless, field data remain indispensable to both remotely sensed data calibration and biomass estimation validation. To improve forest AGB estimation accuracy the integration of field data with various remotely sensed data sources are being essayed (including optical, SAR—synthetic aperture radar, and LiDAR—light detection and ranging) [6,7].
Forest AGB can be mapped over an area of interest by linking plot-level forest inventories with remote sensing measurements related to forest canopy cover, structure, and composition [5]. Indeed a strong statistical relationship is observed between several spectral vegetation indices (VIs) obtained by remotely sensing data and the AGB obtained from ground plots [2,3]. For instance, the Normalized Difference Vegetation Index (NDVI) has been widely used for a quantitative assessment of vegetation and biomass [7,9,10]. Indeed, the NDVI measures vegetation greenness and is related to structural properties of plants (e.g., leaf area index and green biomass) but also to properties of vegetation productivity (e.g., absorbed photosynthetic active radiation and foliar nitrogen) [11]. For instance, the NDVI has been used with forest inventory data to model wood production and biomass [2,12,13,14].
The Portuguese territory is very rich in raw materials that can be used as sources of biomass. More than 60% of the mainland territory is occupied by forests (around 3.2 Mha) and by shrubland and pastures (around 2.8 Mha) [8,15]. According to the last National Forest Inventory (NFI 2015) eucalypts are the most abundant species (Eucalyptus sp.; 26%; 845,000 ha) followed by cork oak (Quercus suber L.; 22%; 719,900 ha), maritime pine (Pinus pinaster Aiton; 22%; 713,300 ha), and holm oak (Quercus rotundifolia Lam.; 11%; 349,400 ha) [15].
In Portugal eucalyptus are an exotic, light-demanding and fast-growing species, mostly planted and managed through a coppice system of three short harvesting cycles (e.g., 10–12-year rotations) for high wood production and removal [16]. In eucalypts industrial plantations a high concentration of the main nutrients in each biomass component is observed thus raising concerns about the removal of P, K, Ca and Mg from sites during logging and in post-logging burns [17,18]. In order to minimize soil nutrients removal impact it is highly recommended to retain both foliage and bark at the felling site [19,20].
Regarding the NFI 2015 statistics eucalypts areas represented a biomass of 34.71 Gg in live trees (aboveground and roots) and shrubland and pastures areas a live biomass of 17.36 Gg, corresponding to a carbon sequestration of 63.64 Gg and 24.74 Gg CO2e, respectively. Eucalyptus plantations (e.g., pure stands) represented an AGB of 21.70 Gg (39.78 Gg CO2e) with an average of 31.51 Mg ha−1 (57.76 Mg ha−1 CO2e) [15].
Shrubland and forest land covers are highly prone to fire. Portuguese forest stands are differentially prone to fire, with mature forests of broadleaved deciduous and mixed forests having a lower fire hazard compared to pure pine forests, eucalyptus plantations, or mixed pine and eucalyptus stands [21,22,23]. Four groups of fire hazards were identified by [21] for Portuguese forests based on increasing order of fire potential risk: (1) open and tall forest types, and closed and tall Quercus suber and diverse forests; (2) closed, low woodlands of deciduous oaks, Q. suber and diverse forests, closed and tall Pinus pinaster woodland and tall Eucalyptus globulus plantations; (3) open and low forest types; (4) and dense, low stands of P. pinaster, E. globulus and Acacia. Thus, the fire severity generally decreases as the species flammability decreases, the stand height increases (less fuel vertical continuity) and the stand density decreases (less fuel load) [21,24].
Currently, the official national fire hazard map is based on a multiplicative model of the annual fire probability (annual burned areas maps) and fire susceptibility (slope, and land cover) [25]. Although fire susceptibility defines the fire potential severity this model does not consider fuel loads. In general, tall, open stands have lower fire severity than short, close stands [21,23].
Thus, this research hypothesis was that the NDVI is a reliable predictor for mapping eucalypts and shrubland areas AGB to provide a decision support tool for forest management and for fire hazard and fire severity mitigation. The aims of this study were the following: (1) to compute the NDVI annual curve for two types of land cover (eucalypts and shrubland areas); (2) to collect field data in these two types of land cover to estimate AGB; and (3) to produce AGB maps for eucalypts and shrubland areas by modelling AGB with NDVI and validate them with other data sources. A study area in the central inland Portugal was considered. The Sentinel-2 MSI imagery for the year of 2022 and 2023 were used to compute the NDVI. Field data allowed to estimate AGB and to model this variable with NDVI. AGB maps were produced and validated.
2. Materials and Methods
2.1. Study area
The study area is in the central inland Portugal and is included in the inter-municipal community of Beira Baixa (CIMBB; 493,056 ha), that integrates six municipalities namely: Oleiros (47,109 ha), Proença-a-Nova (39,540 ha), Vila Velha de Rodão (32,991 ha), Castelo Branco (143,819 ha), Idanha-a-Nova (141,633 ha) and Penamacor (56,370 ha) [26] (Figure 1a).
The latest National Forest Inventory data (NFI6—2015) indicates that the CIMBB’s region was mainly occupied by shrubland and pastures 2186,890 ha (40.5%) and forests 185,770 ha (40.3%), namely forests of maritime pine 72,540 ha (39.0%) eucalypts 65,240 ha (35.1%) and cork oak 20,900 ha (11.3%) (Figure 1b) [15].
2.2. Data
2.2.1. Land Cover and Land Use data (COS 2018)
In this study, eucalypts forests cover and shrubland cover maps were extracted from the latest (2018) national reference thematic map for Land Cover and Land Use (LCLU) in Portugal named as COS (Carta de Ocupação do Solo) (COS2018) [27] (Figure 1b).
The COS2018 map has a scale of 1:25,000, one ha of minimum cartographic unit, a four-level hierarchical classification with 83 classes in the most detailed level [28].
Only pure forests of the species were considered, that is forests where the dominant species represents more than 75% of the total number of trees and the ground cover is higher than 10%.
Shrubland is defined as natural areas of spontaneous vegetation, little or very dense, in which the shrub cover is greater than or equal to 25% (includes abandoned olive groves if less than 45 trees/ha) [28].
2.2.2. Climatological data—local station (2022)
The climatological station of Castelo Branco is roughly located at the center of the study area (Figure 1b) and therefore was used to evaluate climatological data regarding the year of 2022. The monthly climatological reports were download from the national official portal of Instituto Português do Mar e da Atmosfera (IPMA) [29] to obtain the evolution of the monthly average temperatures (minimum and maximum, °C) and total monthly precipitation (mm) in the study area (Figure 2).
2.2.3. Remote sensing data—Sentinel2A imagery
The Sentinel2A imagery data was downloaded from the European Union’s earth observation program called Copernicus website (https://sentinels.copernicus.eu/web/sentinel/missions/sentinel-2). The Sentinel-2 is one of the various missions of the Copernicus. Currently, two twin Sentinel-2 satellites (A and B) offer a coverage with high spatial resolution (up to 10 m) and temporal resolution (5 days) [30]. The Sentinel-2 MSI imagery has 13 spectral bands covering the spectral range of 440–2180 nm, with spatial resolutions of 10, 20, and 60 m (Table 1).
In this study, the Sentinel-2 Multispectral Instrument (MSI) imagery, level 2A (atmospherically, radiometrically, and geometrically corrected), were downloaded for 12 monthly dates for the last year of 2022. Additionally, field dates imagery for June 2023 were also downloaded (Table 2).
2.3. Methods
2.3.1. Sentinel2A imagery—vegetation index NDVI
A Geographical Information System (GIS) software, the free open-source software SAGA (System for Automated Geoscientific Analyses) (https://saga-gis.sourceforge.io/en/index.html) was used to perform all the computations with the Sentinel2A imagery. The Coordinate System [EPSG 32629]: WGS84/UTM zone 29N was used.
The false colour composition and the Normalized Difference Vegetation Index (NDVI—Figure A1) were computed for the 16 dates in 2022 and for the three field dates in 2023 using the spatial resolution of 10 m imagery (Table 3).
As it is known, the NDVI values they also range from −1 to 1, where water surfaces, manmade structures, rocks, clouds, and snow correspond to negative values; bare soil usually falls within the 0.1–0.2 range and plants will always have positive values between 0.2 and 1. Particularly, a healthy, dense vegetation canopy should be above 0.5, and sparse vegetation will most likely fall within the 0.2 to 0.5 range [32].
A grid of 1 km was used to overlaid CIMBB’s COS 2018 eucalypts layer and shrubland layer (Figure 1b). Regarding the study area a total of 197 sample points in COS 2018 eucalypts layer (blue) and a total of 227 sample points in shrubland (pink) layer were obtained (Figure 3). The NDVI values computed from the Sentinel-2 imagery for the 12 months in 2022 were extracted for the sample points to obtain the NDVI annual curve for eucalypts and shrubland areas, respectively. The NDVI-CV method by Yang et al. [33] was also applied to differentiate the two types of land cover (eucalypts and shrubland).
Additionally, the nine spectral bands (e.g., B, G, R, R-edge 1, R-edge 2, R-edge 3, NIR narrow, SWIR 1, and SWIR 2) with a spatial resolution of 20 m for the date of 23 June 2023 were use to extract the correspondent reflectances for the sample points in eucalypts areas and for the sample points in shrubland areas to produce the spectral signatures for these two land covers.
2.3.2. Field sample plots—AGB
To collect field data for AGB evaluation, a systematic sampling was applied to the 197 sample points in eucalypts areas (Figure 4a) to select 30 field samples (Figure 4c). Again, a systematic sampling was applied to the 227 sample points in shrubland areas (Figure 4b) and 30 field samples in shrubland areas (Figure 4d).
It should be stressed that, due to the COS2018 map having a minimum cartographic unit of 1 ha, some field sample plots were relocated as they did not fall into the specific land cover under analysis. Therefore, field sample points coordinates were updated. Google Earth imagery was used to navigate and locate and install field sample plots (Figure A2).
Field data was collected between 30 of May to 21 of June 2023. Inventory data in eucalypts areas and in shrubland were collected in circular sample plots of 100 m2 of area. The breast diameter (d in cm) and height (h in m) were measured in all trees in eucalypts sample plots. The shrubs average height (hs in m) and its ground cover (GC in %) was collected in shrubland sample plots.
2.3.3. AGB maps production and validation
The NDVI was computed from the Sentinel2A imagery available (without clouds) regarding the field data collection period (30 of May–21 of June 2023). After the NDVI values on 3, 13 and 23 of June 2023 were extracted for the 30 field sample plots in eucalypts and for the 30 field sample plots in shrubland areas, respectively.
The AGB values evaluated in eucalypts sample plots were modelled with the corresponding NDVI values for the three dates. The same procedure was used regarding the AGB evaluated in shrubland sample plots and the corresponding NDVI values for the three dates. To assess model fitting and prediction performances the following statistics were considered: the coefficient of determination (R2), model bias was evaluated with the mean prediction errors (e), model precision with the mean of the absolute value of the prediction errors (ae) and the prediction error variance (σ2e), and the modelling efficiency (R2e), a measure equivalent to the coefficient of determination but computed with the prediction errors [36].
The NDVI imagery was used as input to compute the AGB for eucalypts and shrubland by using the respective fitted models Wa = f(NDVI). After, the COS2018 regarding eucalypts and shrubland areas were used to clip the AGB in those specific areas. For validation purposes the AGB values were extracted for the 30 field sample points in eucalypts and the 30 field sample points in shrubland areas. Finally, the AGB values were also extracted for eucalypts and shrubland areas and compared to other data sources.
3. Results
3.1. NDVI annual curve (2022)
The values extracted from the NDVI imagery for 2022 (Figure A1) regarding the sample points (Figure 5; eucalypts areas n = 197 and shrubland areas n = 227)) and the field sample points in eucalypts areas and in shrubland areas (n = 30 for eucalypts and shrubland areas, respectively) are summarized in Table 5.

Table 5.
NDVI—summary statistics: sample points in eucalypts areas (n = 197) and in shrubland areas (n = 227); and field sample points in eucalypts areas (n = 30) and in shrubland areas (n = 30).
Table 5.
NDVI—summary statistics: sample points in eucalypts areas (n = 197) and in shrubland areas (n = 227); and field sample points in eucalypts areas (n = 30) and in shrubland areas (n = 30).
| NDVI | Eucalypts areas (n = 197) | Shrubland areas (n = 227) | Eucalypts areas (n = 30) | Shrubland areas (n = 30) | |||||||||||||||
|---|---|---|---|---|---|---|---|---|---|---|---|---|---|---|---|---|---|---|---|
| Date | Min. | Max. | Mean | SD | Min. | Max. | Mean | SD | Min. | Max. | Mean | SD | Min. | Max. | Mean | SD | |||
| 29Jan22 | 0.098 | 0.517 | 0.339 | 0.082 | 0.131 | 0.488 | 0.315 | 0.065 | 0.186 | 0.507 | 0.371 | 0.067 | 0.253 | 0.442 | 0.350 | 0.052 | |||
| 28Feb22 | 0.072 | 0.459 | 0.311 | 0.077 | 0.103 | 0.479 | 0.303 | 0.061 | 0.090 | 0.435 | 0.329 | 0.075 | 0.230 | 0.412 | 0.328 | 0.045 | |||
| 30Mar22 | 0.069 | 0.433 | 0.285 | 0.062 | 0.066 | 0.425 | 0.289 | 0.053 | 0.033 | 0.403 | 0.296 | 0.074 | 0.207 | 0.366 | 0.306 | 0.036 | |||
| 29Apr22 | 0.086 | 0.478 | 0.280 | 0.059 | 0.116 | 0.440 | 0.296 | 0.051 | 0.197 | 0.443 | 0.296 | 0.057 | 0.213 | 0.385 | 0.299 | 0.040 | |||
| 29May22 | 0.061 | 0.531 | 0.279 | 0.079 | 0.103 | 0.546 | 0.296 | 0.080 | 0.158 | 0.408 | 0.279 | 0.061 | 0.172 | 0.409 | 0.284 | 0.061 | |||
| 28Jun22 | 0.061 | 0.478 | 0.265 | 0.075 | 0.091 | 0.500 | 0.271 | 0.080 | 0.141 | 0.372 | 0.263 | 0.060 | 0.119 | 0.372 | 0.269 | 0.066 | |||
| 28Jul22 | 0.043 | 0.446 | 0.253 | 0.079 | 0.063 | 0.492 | 0.243 | 0.082 | 0.115 | 0.391 | 0.253 | 0.068 | 0.103 | 0.364 | 0.254 | 0.070 | |||
| 27Aug22 | 0.062 | 0.447 | 0.257 | 0.075 | 0.075 | 0.476 | 0.237 | 0.074 | 0.133 | 0.383 | 0.259 | 0.064 | 0.114 | 0.364 | 0.255 | 0.067 | |||
| 26Sep22 | 0.066 | 0.467 | 0.291 | 0.082 | 0.071 | 0.491 | 0.276 | 0.080 | 0.148 | 0.417 | 0.303 | 0.072 | 0.120 | 0.390 | 0.286 | 0.077 | |||
| 5Nov22 | 0.082 | 0.495 | 0.340 | 0.083 | 0.128 | 0.482 | 0.310 | 0.068 | 0.151 | 0.455 | 0.358 | 0.079 | 0.214 | 0.424 | 0.335 | 0.066 | |||
| 25Nov22 | 0.097 | 0.511 | 0.350 | 0.077 | 0.133 | 0.479 | 0.321 | 0.067 | 0.170 | 0.508 | 0.372 | 0.073 | 0.262 | 0.482 | 0.362 | 0.059 | |||
| 4Jan23 | 0.100 | 0.521 | 0.357 | 0.079 | 0.134 | 0.516 | 0.317 | 0.069 | 0.260 | 0.529 | 0.389 | 0.060 | 0.285 | 0.481 | 0.370 | 0.054 | |||
Legend: n—sample size; Min.—minimum; Max.—maximum; Std. dev.—standard deviation.
The analysis of the average monthly NDVI values for 2022 for the sample points and the field sample points in eucalypts areas and in shrubland areas (Table 5; Figure 6a) showed that the values in the field sample points are slightly higher (Figure 6a; E_ and S_) compared to the sample plots (Figure 6a; E and S). That may me explained as the field sample points were validated by ground-truth as corresponding to that specific land cover. Conversely, due to COS2018 minimum cartographic unit of 1 ha some sample points may have been classified as belonging to that land cover class but “in loco” are a different land cover that was aggregate to the dominant class resulting in some “noise” as the NDVI imagery spatial resolution is of 10 m × 10 m (0.01 ha).
Overall, the minimum annual NDVI was observed between July and August in accordance with the climatological data (Figure 2). The NDVI-CV method allowed differentiating eucalypts from shrubland areas (Figure 6b). Field sample points showed a lower coefficient of variation (CV; %) and higher NDVI annual minimum (Figure 6b; E_ and S_). The signature curves also showed a differentiation between the two types of land cover particularly on the NIR band (Figure 6c).
3.2. AGB maps production and validation
The AGB estimated from the 30 field sample plots in eucalypts areas and 30 sample field sample plots in shrubland areas (Table 6) showed for eucalypts areas an average AGB of 78.7 Mg ha−1 and for shrubland areas an average AGB of 107.3 Mg ha−1.
Eucalypts field sample plots offered a good coverage of stands age classes variability. Regarding shrubland areas the dominant species observed in the field were: gum rockrose, lavender, brooms, heather, and gorse flower tea (Cistus ladanifer; Lavandula spp.; Cytisus spp., Genista spp. or Spartium spp.; Erica spp. or Calluna spp.; and Pterospartum tridentatum, respectively) (Figure 7).
The analysis of the NDVI values for the three field dates in 2023 extracted for the 30 sample field sample plots in eucalypts areas and 30 sample field sample plots in shrubland areas (Figure 8) are summarized in Table 7.
A linear correlation between the estimated AGB in the field sample plots and the correspondent NDVI values extracted for the plots was obtained with the best fitting efficiency on 23 June 2023 for both for eucalypts plots (R2 = 0.76; Figure 9a) and for shrubland plots (R2 = 0.69; Figure 9b). Prediction statistics for AGB estimation (Wa predicted) showed smaller bias, better precision and smaller prediction errors variance for eucalypts field sample points compared to shrubland field sample points (Figure 9c,d, respectively).
The COS2018 regarding eucalypts areas and shrubland areas and the correspondent AGB maps are present in Figure 10. The AGB values extracted for eucalypts areas presented an average of 78.76 Mg ha−1 and for shrubland areas an average of 102.00 Mg ha−1, thus consistent to the average estimated field values (Table 7).
Table 8.
AGB—summary statistics eucalypts areas (n = 2773 polygons) and in shrubland areas (n = 2905 polygons).
Table 8.
AGB—summary statistics eucalypts areas (n = 2773 polygons) and in shrubland areas (n = 2905 polygons).
| AGB | Min. | Max. | Mean | SD | |
|---|---|---|---|---|---|
| Eucalypts areas | Wa (Mg ha−1) | 16.31 | 141.82 | 78.76 | 15.85 |
| Shrubland areas | Was (Mg ha−1) | 26.66 | 197.21 | 102.00 | 23.48 |
Legend: n—sample size; Min.—minimum; Max.—maximum; Std. dev.—standard deviation.
A detailed insight of the AGB maps outputs is shown using zoom areas with eucalypts (Figure 11) and with shrubland (Figure 12) wherein the AGB maps outputs are overlayed with the FCC and NDVI imagery. The AGB maps showed a good consistency with the observed detail in the FCC and NDVI imagery.
Finally, a joint map of AGB for both eucalypts and shrubland areas provided an overall perspective of fuel loads throughout the study area (Figure 13). Higher loads were observed at the left side compared to the right side (Figure 13a) which are mountainous areas (Figure 13b) wherein slope and fuel loads will have a multiplicative increasing effect on fire potential severity evaluation.
4. Discussion
This research hypothesis was that the NDVI is a reliable predictor for mapping AGB in eucalypts and shrubland areas to provide a decision support tool for forest management and for mitigate fire hazard and fire severity mitigation. Firstly, the NDVI time curve for 2022 showed a minimum observed between July and August for both eucalypts and shrubland areas being in accordance with the climatological data for that same year. The NDVI-CV allowed differentiating eucalypts from shrubland areas. The spectral signatures curves also showed a differentiation between the two types of land cover, particularly on the NIR band. These results are consistent to the theoretical knowledge that broadleaved forests (e.g., eucalypts) have high NIR reflectance, thus consequently higher NDVI values than other types of vegetation [38]. Some studies also confirm this result when comparing coniferous (e.g., maritime pine) and broadleaved (e.g., eucalypts) [33,39]. Some observed inversions throughout the NDVI time curve may be explained by the species phenology such as the flowering season, particularly concerning shrubs species. In young eucalypts plantations low NDVI values have also to be considered as at the plantation stage substantial bare soil is exposed (spatial resolution 10 × 10 m).
Secondly, it should be stressed that the circular plots of 100 m2 of area for field data collection matched the spatial resolution of the NDVI imagery computed from the Sentinel2A imagery (cell size 10 × 10 m) which provided a perfect correspondence between field estimates and the computed NDVI values. Moreover, the Sentinel2A imagery date used to compute the NDVI had no clouds and was very close to the field dates.
Thirdly, it was proved that the NDVI imagery computed from the Sentinel2A imagery with a spatial resolution of 10 m was found to be a reliable predictor for mapping AGB in eucalypts and shrubland areas for the study area. Indeed, the fitted linear models for AGB prediction using the NDVI imagery showed good fitting performances (R2 of 0.76 and 0.69, respectively). Regarding AGB maps prediction performances, smaller bias, better precision, and smaller prediction errors variance were observed for eucalypts when compared to shrubland. The results obtained in this study are consistent with other studies, for other species and regions, where biomass maps were produced using allometric equations of NDVI that were computed from a variety of satellite imagery (e.g. SPOT-6, Indian Remote Sensing Satellite (IRS-ID) LISS III, and Sentinel2) and similar fitting performances (R2 from 0.56 to 0.89%) were achieved [2,3,5,6,10,39,40,41].
According to the NFI2015 statistics eucalypts areas in CIMBB represented a biomass of 1654 Mg in live trees (aboveground and roots) (3032 Mg CO2e) [15]. In this study, field data estimation resulted in an average AGB of 78.7 Mg ha−1 in eucalypts areas and an average AGB of 107.3 Mg ha−1 in shrubland areas. The AGB maps provided an average estimation for AGB production of 78.8 Mg ha−1 in eucalypts areas and an average AGB production of 102.0 Mg ha−1 in shrubland areas. Therefore, very consistent to the field estimates. The result for eucalypts is consistent with a study performed in this region where an average AGB production between 52.0 to 75.8 Mg ha−1 at the harvest age was obtained (e.g., three 14-year coppices) [18]. Overall, bark and leaves biomass represented 18% of the AGB and was recommended to be retained at the felling site after harvest/commercial thinning to mitigate the update of soil nutrients [18].
Finally, the eucalypts AGB map can be very useful to support this species management and to forecast its environmental impact. Both eucalypts and shrubland AGB map can be critical to support fuel loads management in these areas to mitigate fire hazard and fire severity. As the species, stand variables (e.g., stand density and stand height) and topographic variables (e.g., slope and aspect) of contiguous patches can be used to predict fire severity [23], hence, the AGB maps can also provide a valuable input regarding fire potential severity assessment.
5. Conclusions
This study proved to be possible to produce AGB maps for eucalypts and shrubland areas by using the NDVI imagery as the sole predictor with good prediction performances. The AGB maps provide a relevant decision support tool for forest management and for fire hazard and fire severity mitigation. But further research is needed using more robust data sets for models’ independent validation. The AGB maps should be integrated in the Portuguese fire hazard model to obtain a more reliable and updated fire severity assessment in near-real time by using the Sentinel2A imagery.
Author Contributions
Not applicable.
Funding
This study was funded by CERNAS-IPCB [UIDB/00681/2020] funding from the Foundation for Science and Technology (Fundação para a Ciência e Tecnologia—FCT).
Data Availability Statement
Not applicable.
Acknowledgments
To Carlos Grácio and Natália Roque, our colleagues at the Polytechnic University/ Instituto Politécnico de Castelo Branco (IPCB), for the technical support regarding the field data collection. To the students Thais Ismael and Ângelo Semedo the field data collection under our supervision for their thesis in Renewable Energy Engineering Graduation course of the IPCB.
Conflicts of Interest
The author declares no conflict of interest. The funders had no role in the design of the study.
Appendix A
Figure A1.
Study area—Sentinel2A imagery clip: NDVI imagery (January 2022 to January 2023).
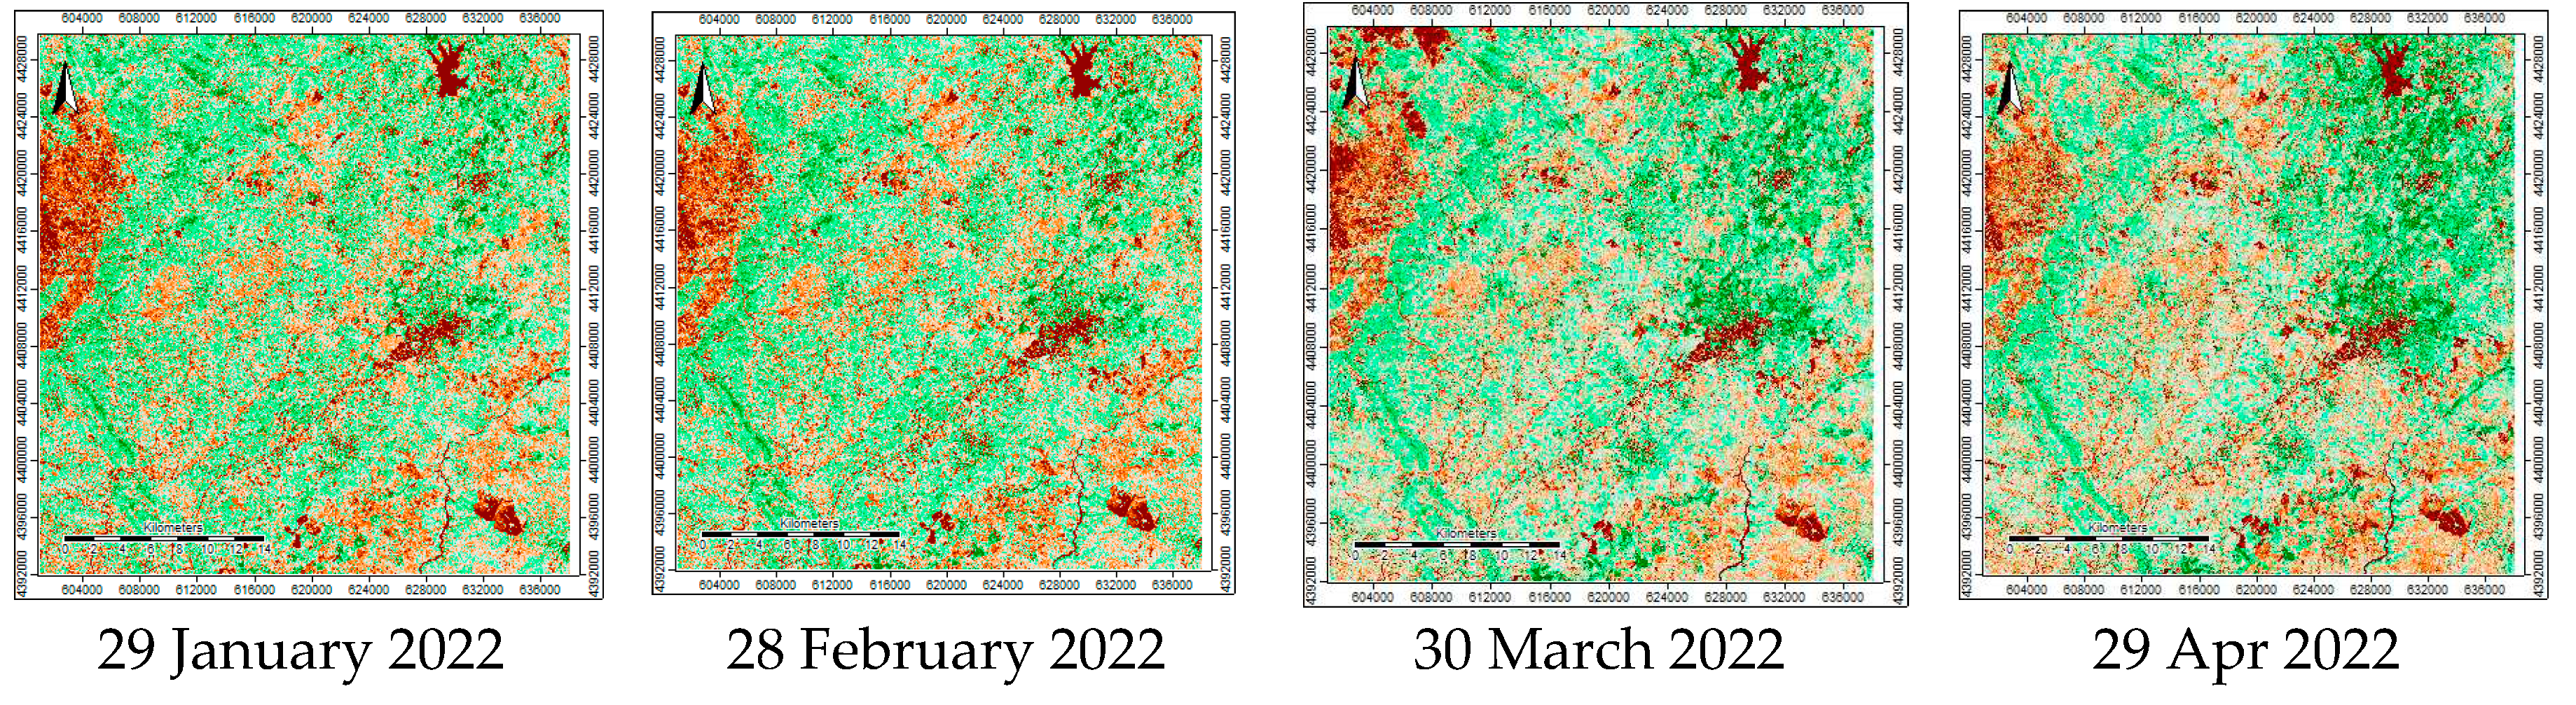
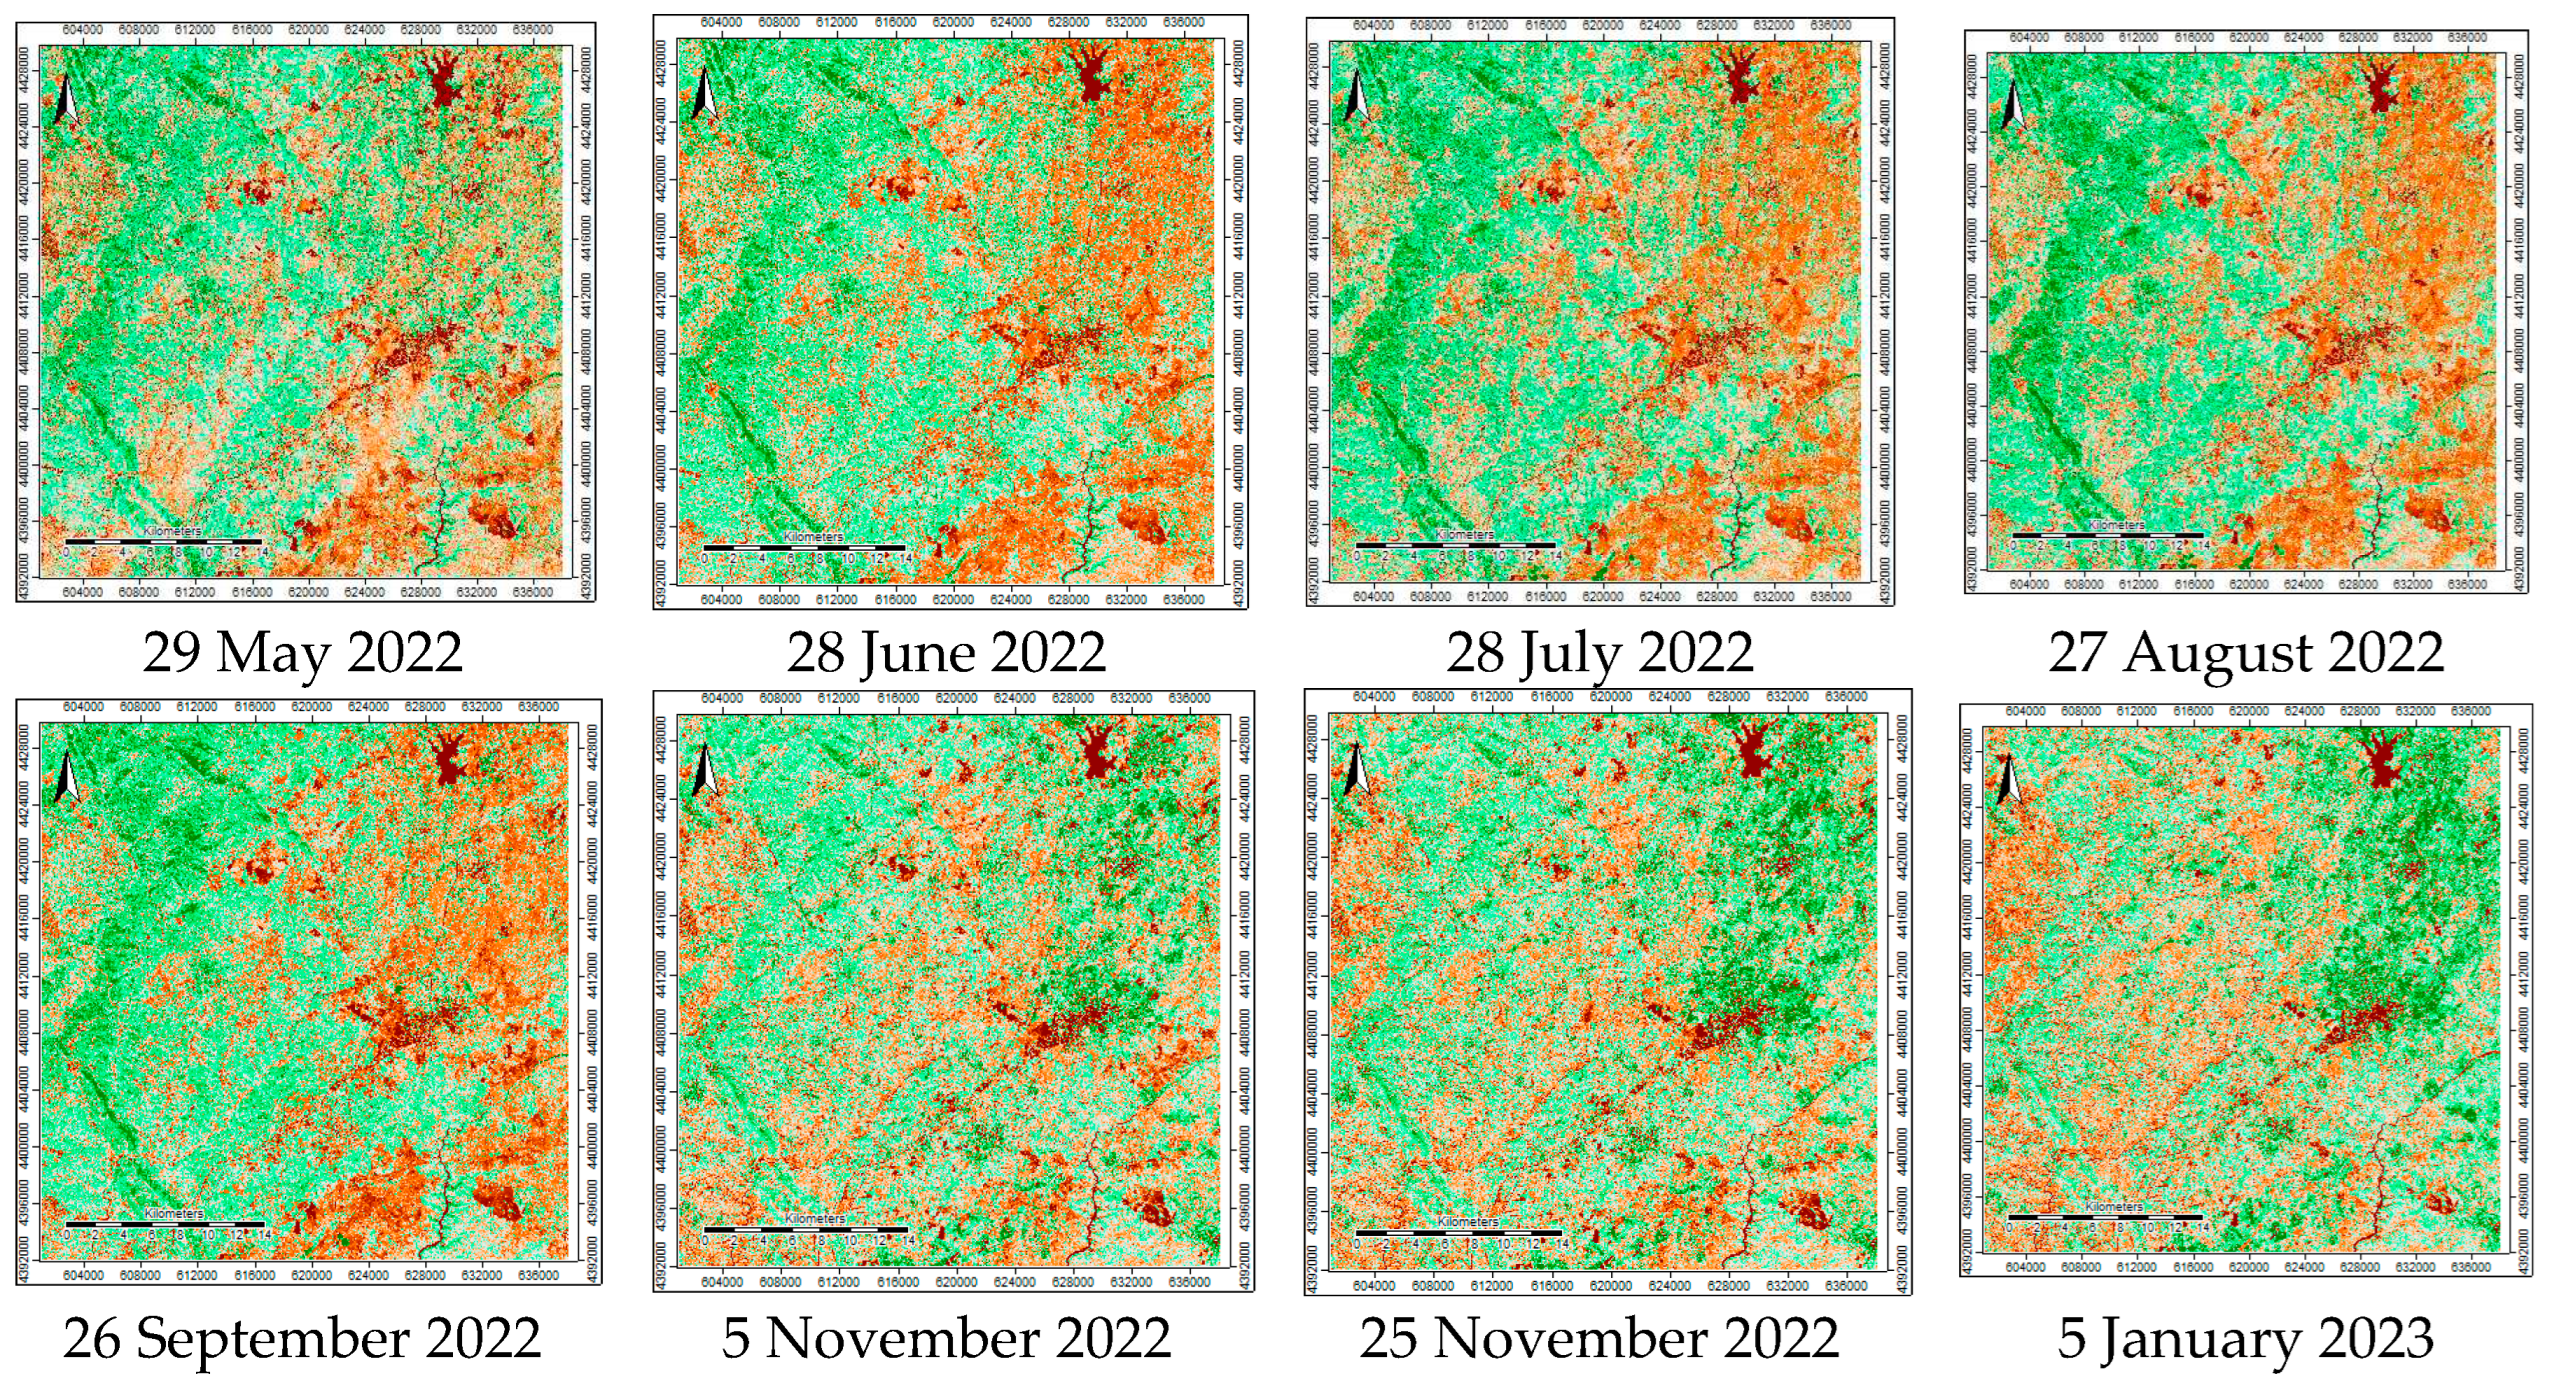
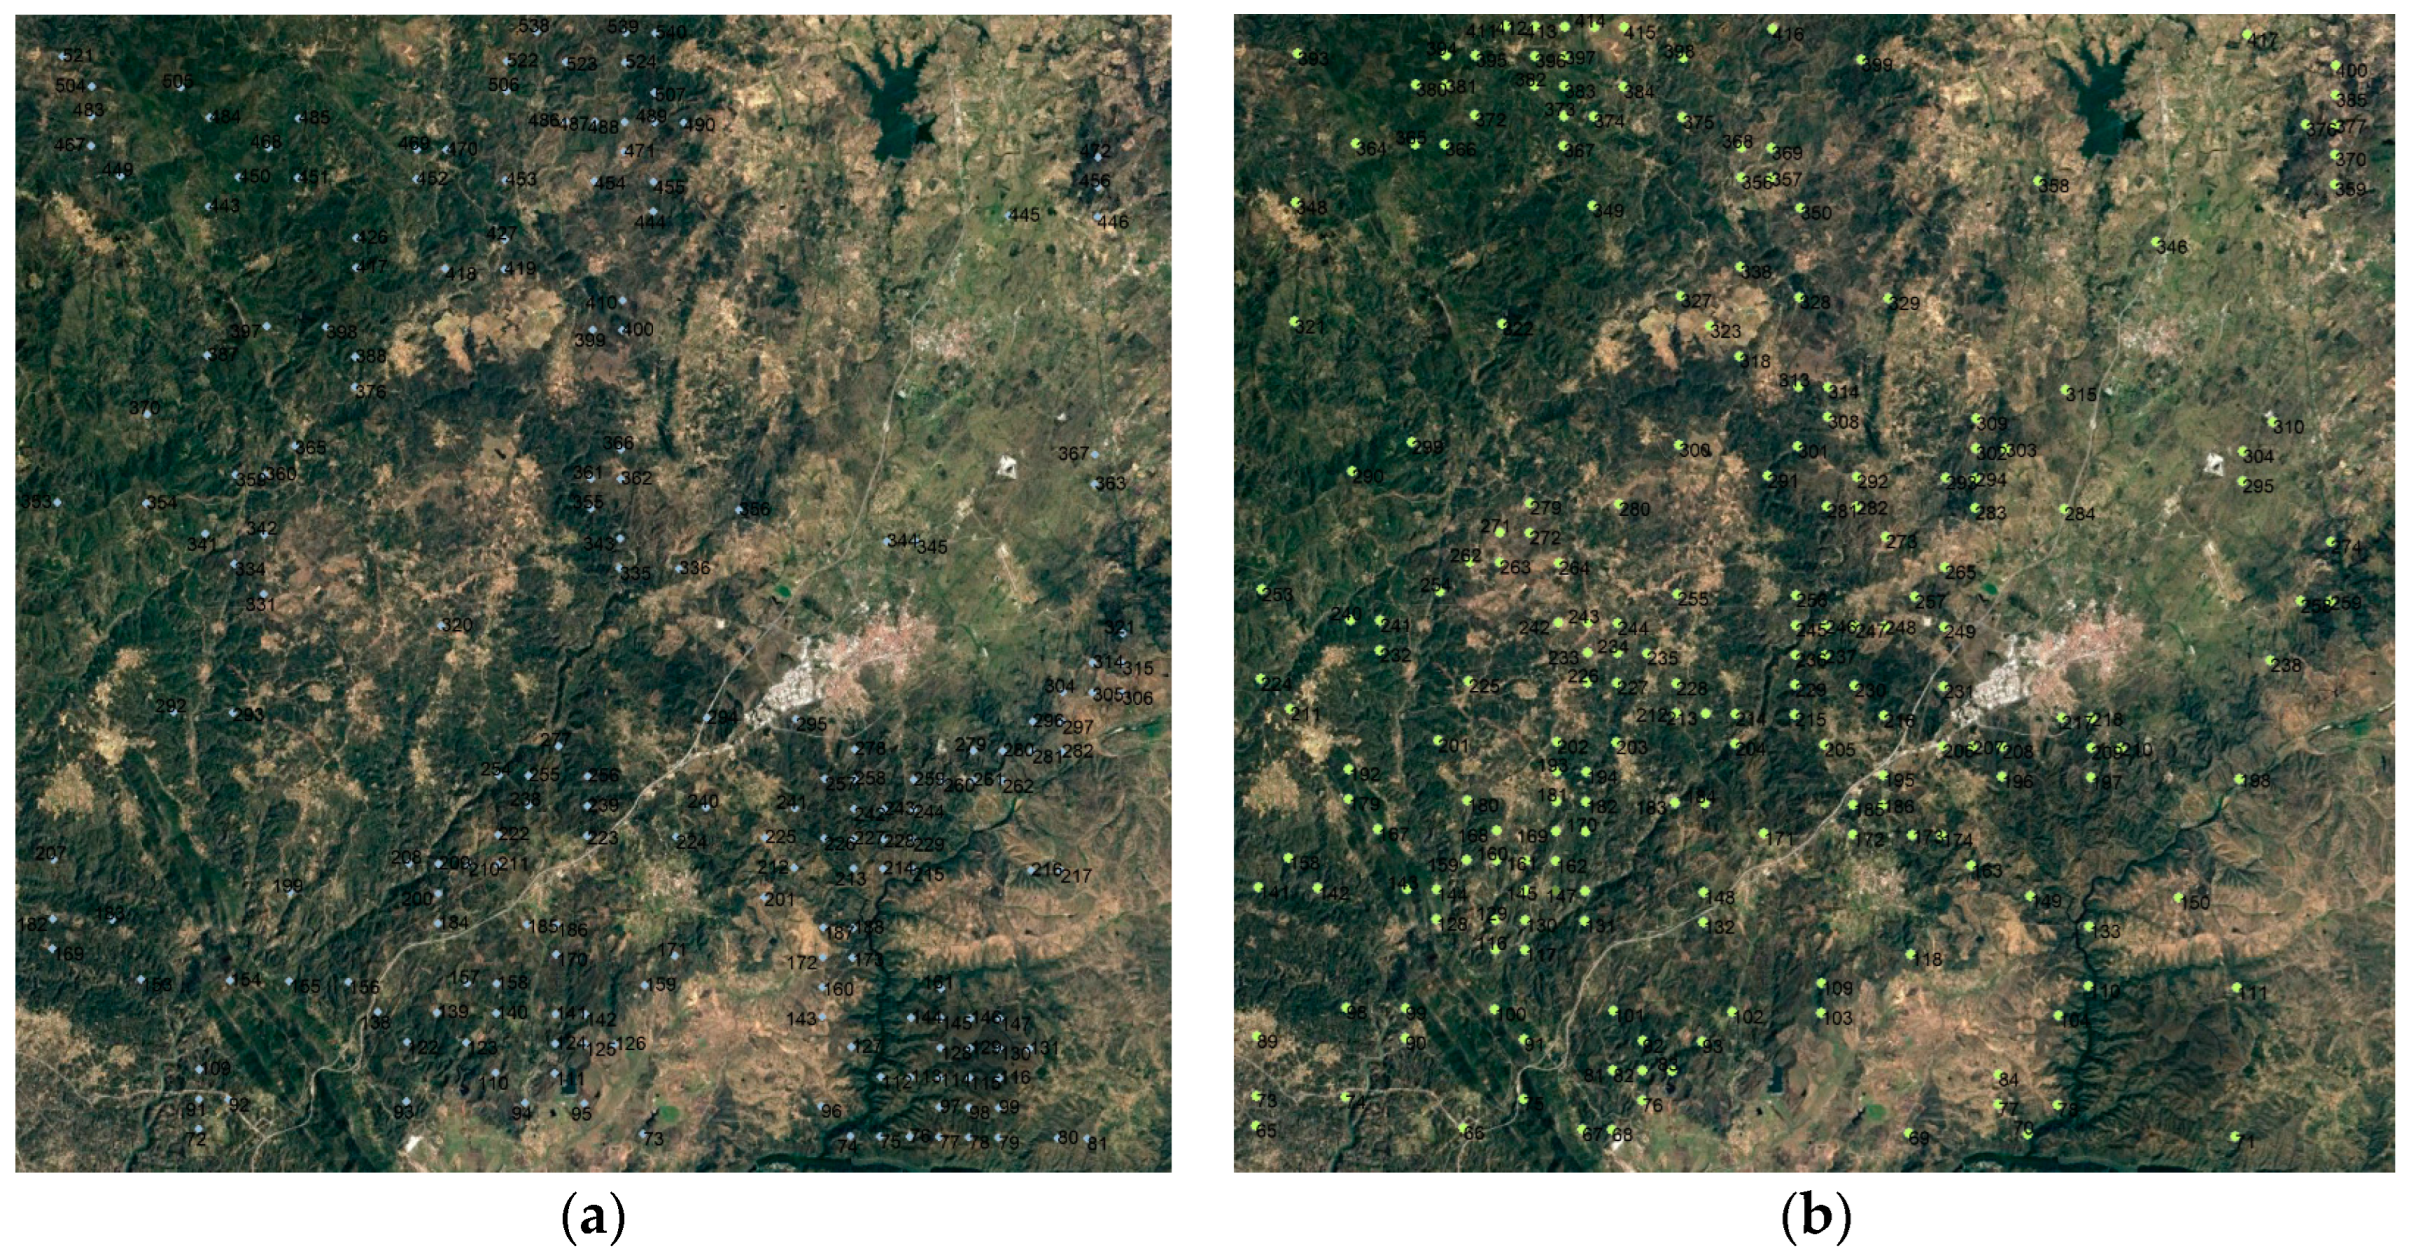
Figure A2.
Study area: (a) Google Earth imagery (26 May 2023) with samples points in eucalypts areas (n = 197) and shrubland areas (n = 227).
Figure A2.
Study area: (a) Google Earth imagery (26 May 2023) with samples points in eucalypts areas (n = 197) and shrubland areas (n = 227).
References
- Avitabile, V.; Herold, M.; Henry, M.; Schmullius, C. Mapping biomass with remote sensing: A comparison of methods for the case study of Uganda. Carbon Balance Manag. 2011, 6, 7. [Google Scholar] [CrossRef]
- Motlagh, M.G.; Kafaky, S.B.; Mataji, A.; Akhavan, R. Estimating and mapping forest biomass using regression models and Spot-6 images (case study: Hyrcanian forests of north of Iran). Environ. Monit. Assess. 2018, 190. [Google Scholar] [CrossRef] [PubMed]
- Thakur, T.K.; Swamy, S.L.; Bijalwan, A.; Dobriyal, M.J.R. Assessment of biomass and net primary productivity of a dry tropical forest using geospatial technology. J. For. Res. 2019, 30, 157–170. [Google Scholar] [CrossRef]
- Massey, R.; Berner, L.T.; Foster, A.C.; Goetz, S.J.; Vepakomma, U. Remote sensing tools for monitoring forests and tracking their dynamics BT—Boreal forests in the face of climate change: Sustainable management; Girona, M.M., Morin, H., Gauthier, S., Bergeron, Y., Eds.; Springer International Publishing: Cham, 2023; pp. 637–655. ISBN 978-3-031-15988-6. [Google Scholar]
- Thuy, H.L.T.; Tan, M.T.; Van, T.T.T.; Bien, L.B.; Ha, N.M.; Nhung, N.T. Using sentinel image data and plot survey for the assessment of biomass and carbon stock in coastal forests of Thai Binh Province, Vietnam. Appl. Ecol. Environ. Res. 2020, 18, 7499–7514. [Google Scholar] [CrossRef]
- Araza, A.; Herold, M.; de Bruin, S.; Ciais, P.; Gibbs, D.A.; Harris, N.; Santoro, M.; Wigneron, J.P.; Yang, H.; Málaga, N.; et al. Past decade above-ground biomass change comparisons from four multi-temporal global maps. Int. J. Appl. Earth Obs. Geoinf. 2023, 118, 103274. [Google Scholar] [CrossRef]
- Zhang, Y.; Liang, S.; Yang, L. A review of regional and global gridded forest biomass datasets. Remote Sens. 2019, 11, 2744. [Google Scholar] [CrossRef]
- Ferreira, S.; Monteiro, E.; Brito, P.; Vilarinho, C. Biomass resources in Portugal: Current status and prospects. Renew. Sustain. Energy Rev. 2017, 78, 1221–1235. [Google Scholar] [CrossRef]
- Kumar, L.; Sinha, P.; Taylor, S.; Alqurashi, A.F. Review of the use of remote sensing for biomass estimation to support renewable energy generation. J. Appl. Remote Sens. 2015, 9, 097696. [Google Scholar] [CrossRef]
- Ónodi, G.; Kertész, M.; Kovács-Láng, E.; Ódor, P.; Botta-Dukát, Z.; Lhotsky, B.; Barabás, S.; Mojzes, A.; Kröel-Dulay, G. Estimating aboveground herbaceous plant biomass via proxies: The confounding effects of sampling year and precipitation. Ecol. Indic. 2017, 79, 355–360. [Google Scholar] [CrossRef]
- Forkel, M.; Carvalhais, N.; Verbesselt, J.; Mahecha, M.D.; Neigh, C.S.R.; Reichstein, M. Trend change detection in NDVI time series: Effects of inter-annual variability and methodology. Remote Sens. 2013, 5, 2113–2144. [Google Scholar] [CrossRef]
- Berra, E.F.; Fontana, D.C.; Kuplich, T.M. Tree age as adjustment factor to NDVI. Rev. Árvore 2017, 41. [Google Scholar] [CrossRef]
- Gizachew, B.; Solberg, S.; Næsset, E.; Gobakken, T.; Bollandsås, O.M.; Breidenbach, J.; Zahabu, E.; Mauya, E.W. Mapping and estimating the total living biomass and carbon in low-biomass woodlands using Landsat 8 CDR data. Carbon Balance Manag. 2016, 11. [Google Scholar] [CrossRef] [PubMed]
- Santos, L.H.O.; Ramirez, G.M.; Roque, M.W.; Chaves e Carvalho, M.P.d.L.; Ruiz Diaz, L.M.G.; Chaves e Carvalho, S.P. Correlação entre uniformidade e NDVI em povoamentos de Tectona grandis L. f. BIOFIX Sci. J. 2019, 4, 130. [Google Scholar] [CrossRef]
- ICNF. 6o Inventário Florestal Nacional—IFN6. 2015. Relatório final; Instituto da Conservação da Natureza e das Florestas: Lisboa, Portugal, 2019; Available online: https://www.icnf.pt/api/file/doc/c8cc40b3b7ec8541 (accessed on 25 May 2023).
- Águas, A.; Ferreira, A.; Maia, P.; Fernandes, P.M.; Roxo, L.; Keizer, J.; Silva, J.S.; Rego, F.C.; Moreira, F. Natural establishment of Eucalyptus globulus Labill. in burnt stands in Portugal. For. Ecol. Manage. 2014, 323. [Google Scholar] [CrossRef]
- Turnbull, J.W. Eucalypt plantations. New For. 1999, 17, 37–52. [Google Scholar] [CrossRef]
- Alegria, C.; Pedro, N.; do Carmo Horta, M.; Roque, N.; Fernandez, P. Ecological envelope maps and stand production of eucalyptus plantations and naturally regenerated maritime pine stands in the central inland of Portugal. For. Ecol. Manage. 2019, 432, 327–344. [Google Scholar] [CrossRef]
- FAO Group reports. Group reports. Group I: Bio-physical and environmental impacts of eucalyptus plantations. In Regional Expert Consultation on Eucalyptus; White, K., Ball, J., Kashio, M., Eds.; FAO Regional Office for Asia and the Pacific: Bankok, 1993; Volume I. [Google Scholar]
- Davidson, J. Ecological aspects of eucalyptus plantations. 1993, I, 1–20. [Google Scholar]
- Fernandes, P.M. Combining forest structure data and fuel modelling to classify fire hazard in Portugal. Ann. For. Sci. 2009, 66, 415. [Google Scholar] [CrossRef]
- Silva, J.; Moreira, F.; Vaz, P.; Catry, F.; Ferreira, P. Assessing the relative fire proneness of different forest types in Portugal. Plant Biosyst. 2009, 143, 597–608. [Google Scholar] [CrossRef]
- Fernandes, P.M.; Luz, A.; Loureiro, C. Changes in wildfire severity from maritime pine woodland to contiguous forest types in the mountains of northwestern Portugal. For. Ecol. Manage. 2010, 260, 883–892. [Google Scholar] [CrossRef]
- Gil, A.; Yu, Q.; Lobo, A.; Lourenço, P.; Silva, L.; Calado, H.; Jaume, T. Assessing the effectiveness of high resolution satellite imagery for vegetation mapping in small islands protected areas. 2011, 1663–1667. [Google Scholar]
- AFN. Plano Municipal de Defesa da Floresta contra Incêndios (PMDFCI)—Guia Técnico; 2012. [Google Scholar]
- DGT Carta Administrativa Oficial de Portugal. Available online: https:/www.dgterritorio.gov.pt/search/dgt?keys=CAOP.
- DGT. Carta de uso e ocupação do solo. Registo nacional de dados geográficos. SNIG. Direção-Geral do Território. Lisboa. Portugal. Available online: https://snig.dgterritorio.gov.pt/rndg/srv/search?keyword=Carta%20de%20ocupa%C3%A7%C3%A3o%20do%20solo (accessed on 13 September 2022).
- DGT. Especificações técnicas da carta de uso e ocupação do solo de Portugal Continental para 2018. Relatório técnico; Direção-Geral do Território: Lisboa, Portugal, 2018. Available online: https://www.dgterritorio.gov.pt/sites/default/files/documentos-publicos/2019-12-26-11-47-32-0__ET-COS-2018_v1.pdf (accessed on 13 September 2022).
- IPMA. Boletins Climatológicos de Portugal Continental. Instituto Português do Mar e da Atmosfera. Available online: https://www.ipma.pt/pt/publicacoes/boletins.jsp?cmbDep=cli&cmbTema=pcl&idDep=cli&idTema=pcl&curAno=-1 (accessed on 23 June 2023).
- Navarro, G.; Caballero, I.; Silva, G.; Parra, P.-C.; Vázquez, Á.; Caldeira, R. Evaluation of forest fire on Madeira Island using Sentinel-2A MSI imagery. Int. J. Appl. Earth Obs. Geoinf. 2017, 58, 97–106. [Google Scholar] [CrossRef]
- Llorens, R.; Sobrino, J.A.; Fernández, C.; Fernández-Alonso, J.M.; Vega, J.A. A methodology to estimate forest fires burned areas and burn severity degrees using Sentinel-2 data. Application to the October 2017 fires in the Iberian Peninsula. Int. J. Appl. Earth Obs. Geoinf. 2021, 95, 102243. [Google Scholar] [CrossRef]
- EOS NDVI FAQ: All you need to know about index. Available online: https://eos.com/blog/ndvi-faq-all-you-need-to-know-about-ndvi/ (accessed on 13 September 2022).
- Yang, Y.; Wu, T.; Wang, S.; Li, J.; Muhanmmad, F. The NDVI-CV method for mapping evergreen trees in complex urban areas using reconstructed landsat 8 time-series data. Forests 2019, 10, 139. [Google Scholar] [CrossRef]
- Tomé, M.; Barreiro, S.; Paulo, J.A.; Faias, S.P. Selecção de equações para estimação de variáveis da árvore em inventários florestais a realizar em Portugal; Publicações FORCHANGE PT 9/2007; Universidade Técnica de Lisboa, Instituto Superior de Agronomia, Centro de Estudos Florestais: Lisboa, Portugal, 2007; Available online: https://www.isa.ulisboa.pt/cef/forchange/fctools/sites/default/files/pub/docs/equacoes-if_em_portugal.pdf (accessed on 23 May 2023).
- Viana, H.; Aranha, J.; Lopes, D.; Cohen, W.B. Estimation of crown biomass of Pinus pinaster stands and shrubland above-ground biomass using forest inventory data, remotely sensed imagery and spatial prediction models. Ecol. Modell. 2012, 226, 22–35. [Google Scholar] [CrossRef]
- Huang, S.; Yang, Y.; Wang, Y. A critical look at procedures for validating growth and yield models. In Modelling forest systems; Amaro, A., Reed, D., Soares, P., Eds.; CAB international: Wallingford, UK, 2003; pp. 271–293. [Google Scholar]
- NASA JPL. NASA Shuttle Radar Topography Mission Global 1 arc second [Data set].
- Lillesand, T.; Kiefer, R. Remote Sensing and Image Interpretation; Sons, J.W., Ed.; New York, Chichester, Brisbane, Toronto, Singapore, 1994. [Google Scholar]
- Alegria, C. Vegetation monitoring and post-fire recovery: A case study in the Centre Inland of Portugal. Sustainability 2022, 14, 12698. [Google Scholar] [CrossRef]
- Chapungu, L.; Nhamo, L.; Gatti, R.C. Estimating biomass of savanna grasslands as a proxy of carbon stock using multispectral remote sensing. Remote Sens. Appl. Soc. Environ. 2020, 17, 100275. [Google Scholar] [CrossRef]
- Aranha, J.; Enes, T.; Calvão, A.; Viana, H. Shrub biomass estimates in former burnt areas using sentinel 2 images processing and classification. Forests 2020, 11, 555. [Google Scholar] [CrossRef]
Figure 1.
Study area: (a) Portugal, the Sentinel2A imagery tile (29 May 2022), the CIMBB municipalities (red) and the study area (yellow); and (b) CIMBB’s COS 2018 eucalypts areas (brown) and shrubland areas (green).
Figure 1.
Study area: (a) Portugal, the Sentinel2A imagery tile (29 May 2022), the CIMBB municipalities (red) and the study area (yellow); and (b) CIMBB’s COS 2018 eucalypts areas (brown) and shrubland areas (green).
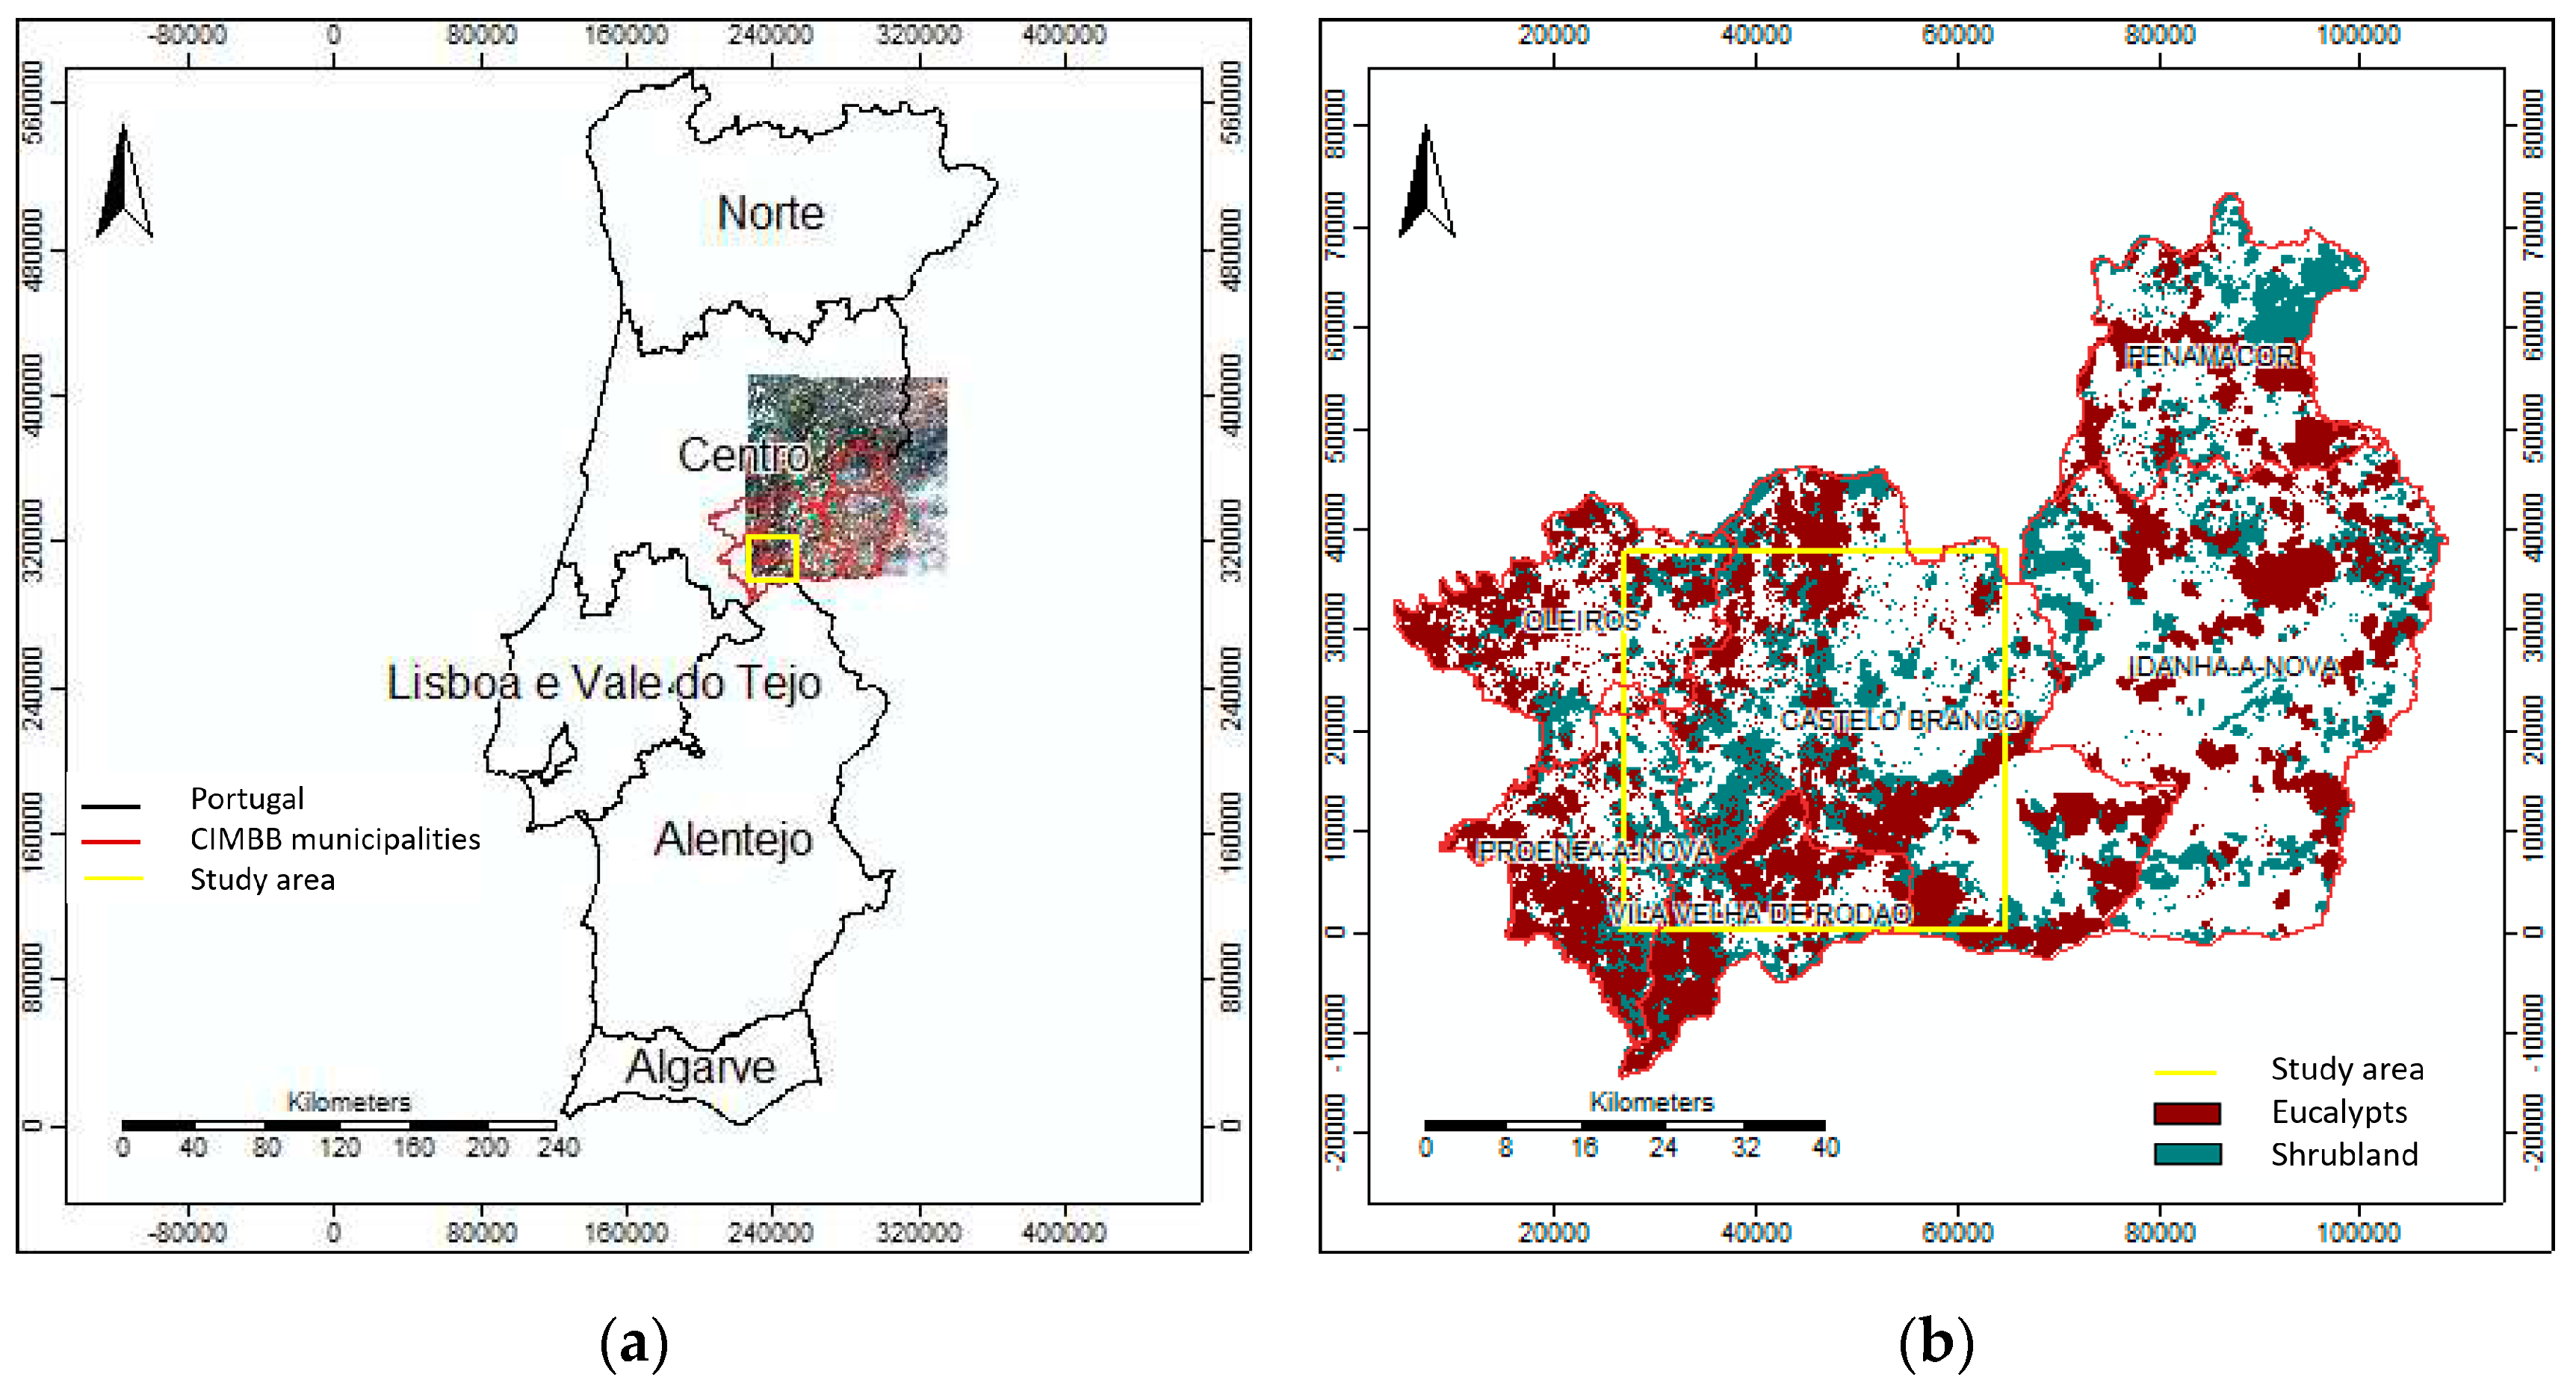
Figure 2.
Climatological data: Castelo Branco station (2020-2022)—monthly average temperatures (minimum and maximum, °C) and total monthly precipitation (mm) [29].
Figure 2.
Climatological data: Castelo Branco station (2020-2022)—monthly average temperatures (minimum and maximum, °C) and total monthly precipitation (mm) [29].
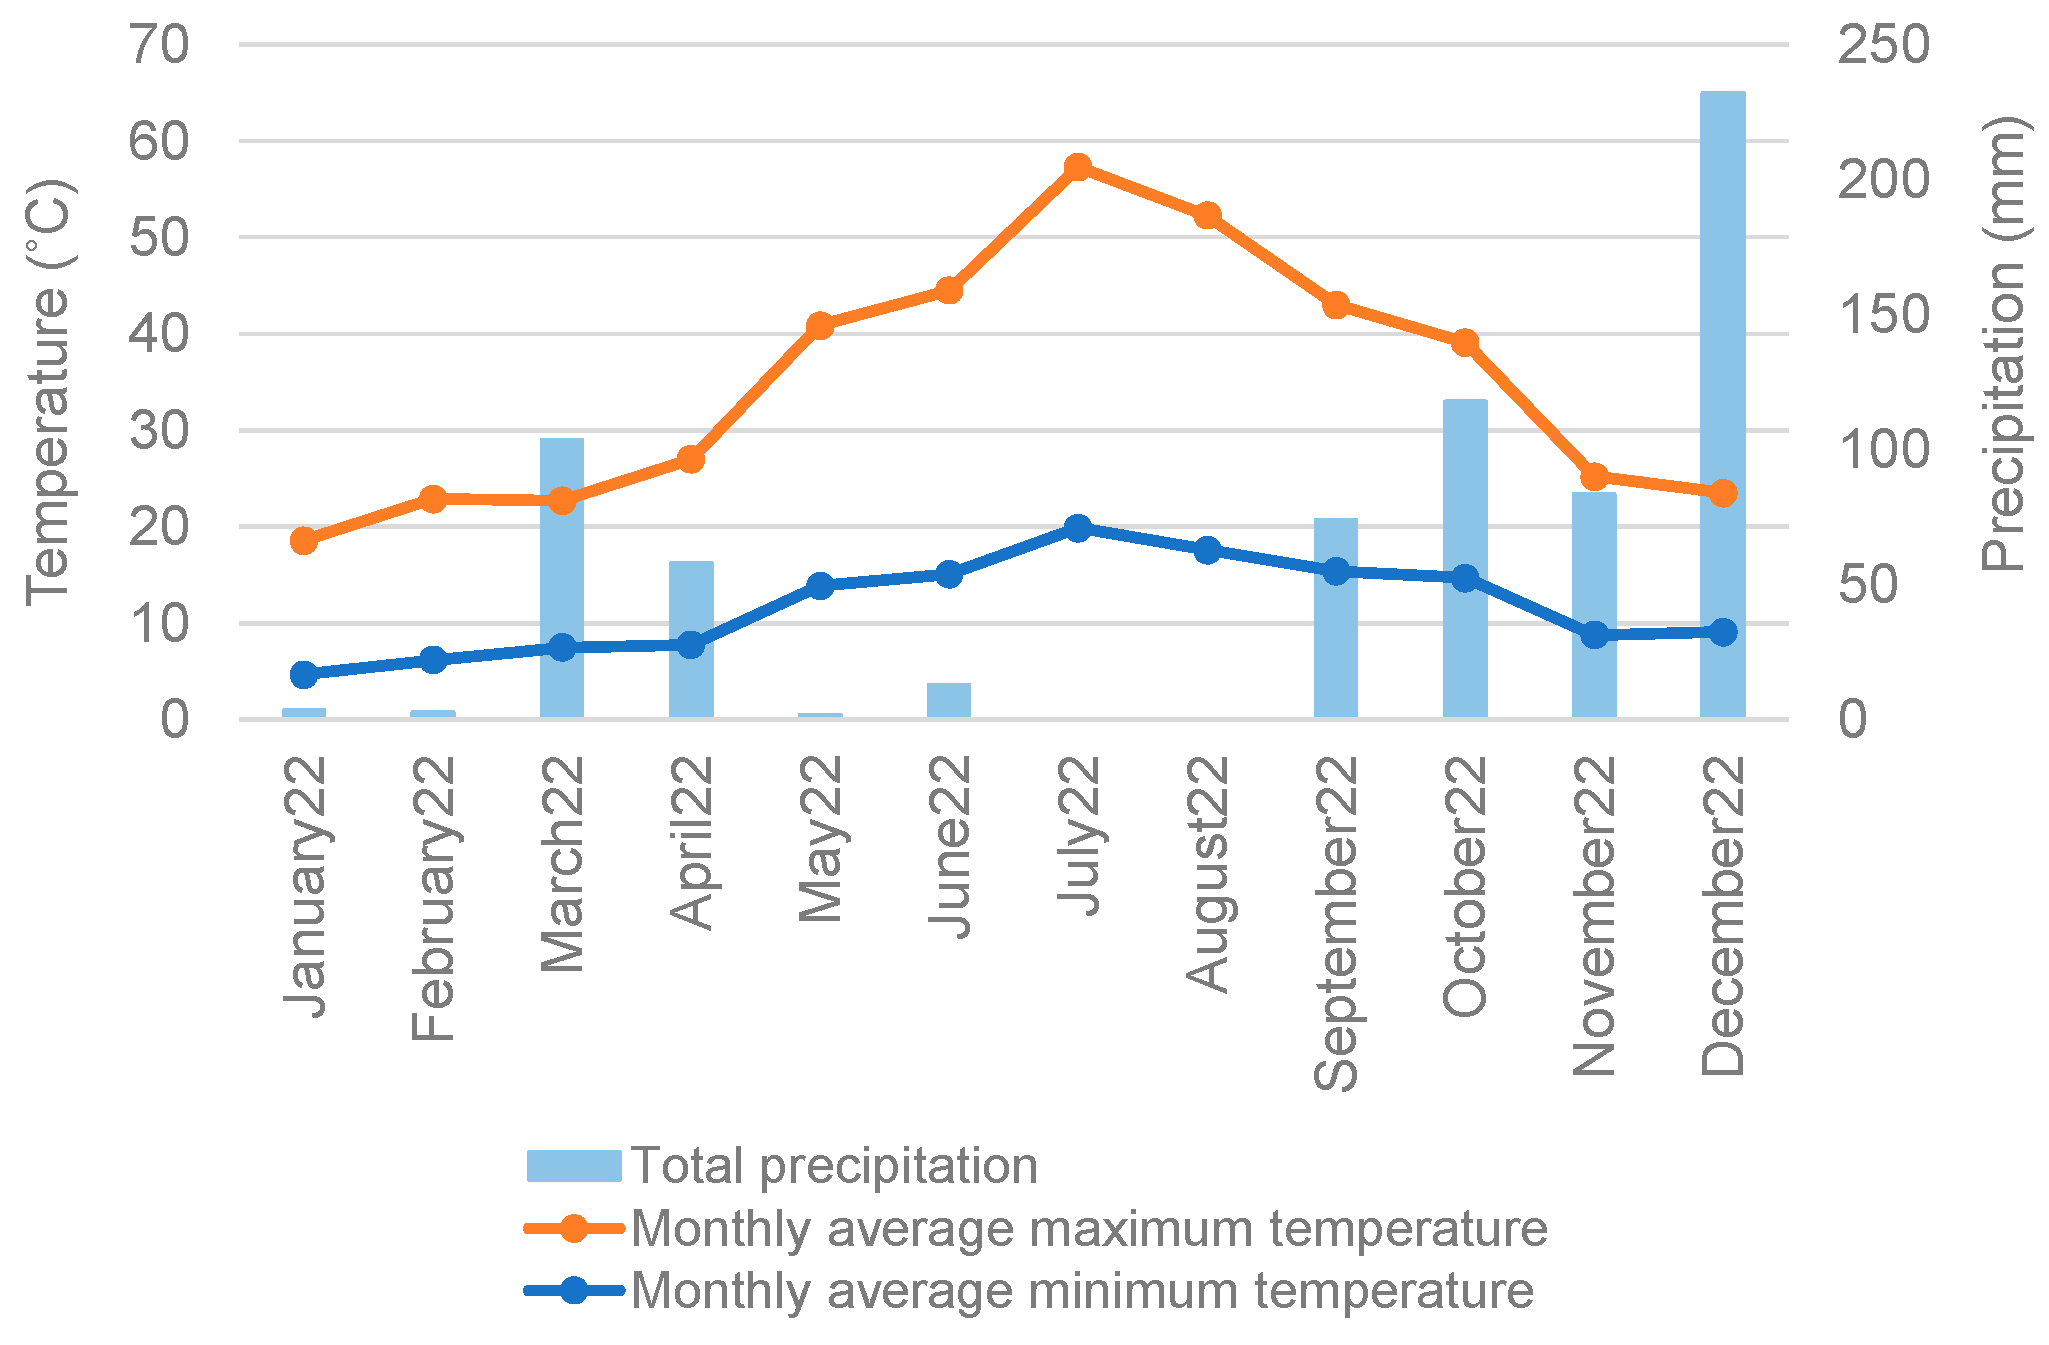
Figure 3.
Study area—Sentinel2A imagery (29 May 2022) with the sample points: (a) in eucalypts areas (blue, n = 197); and (b) in shrubland areas (pink, n = 227).
Figure 3.
Study area—Sentinel2A imagery (29 May 2022) with the sample points: (a) in eucalypts areas (blue, n = 197); and (b) in shrubland areas (pink, n = 227).
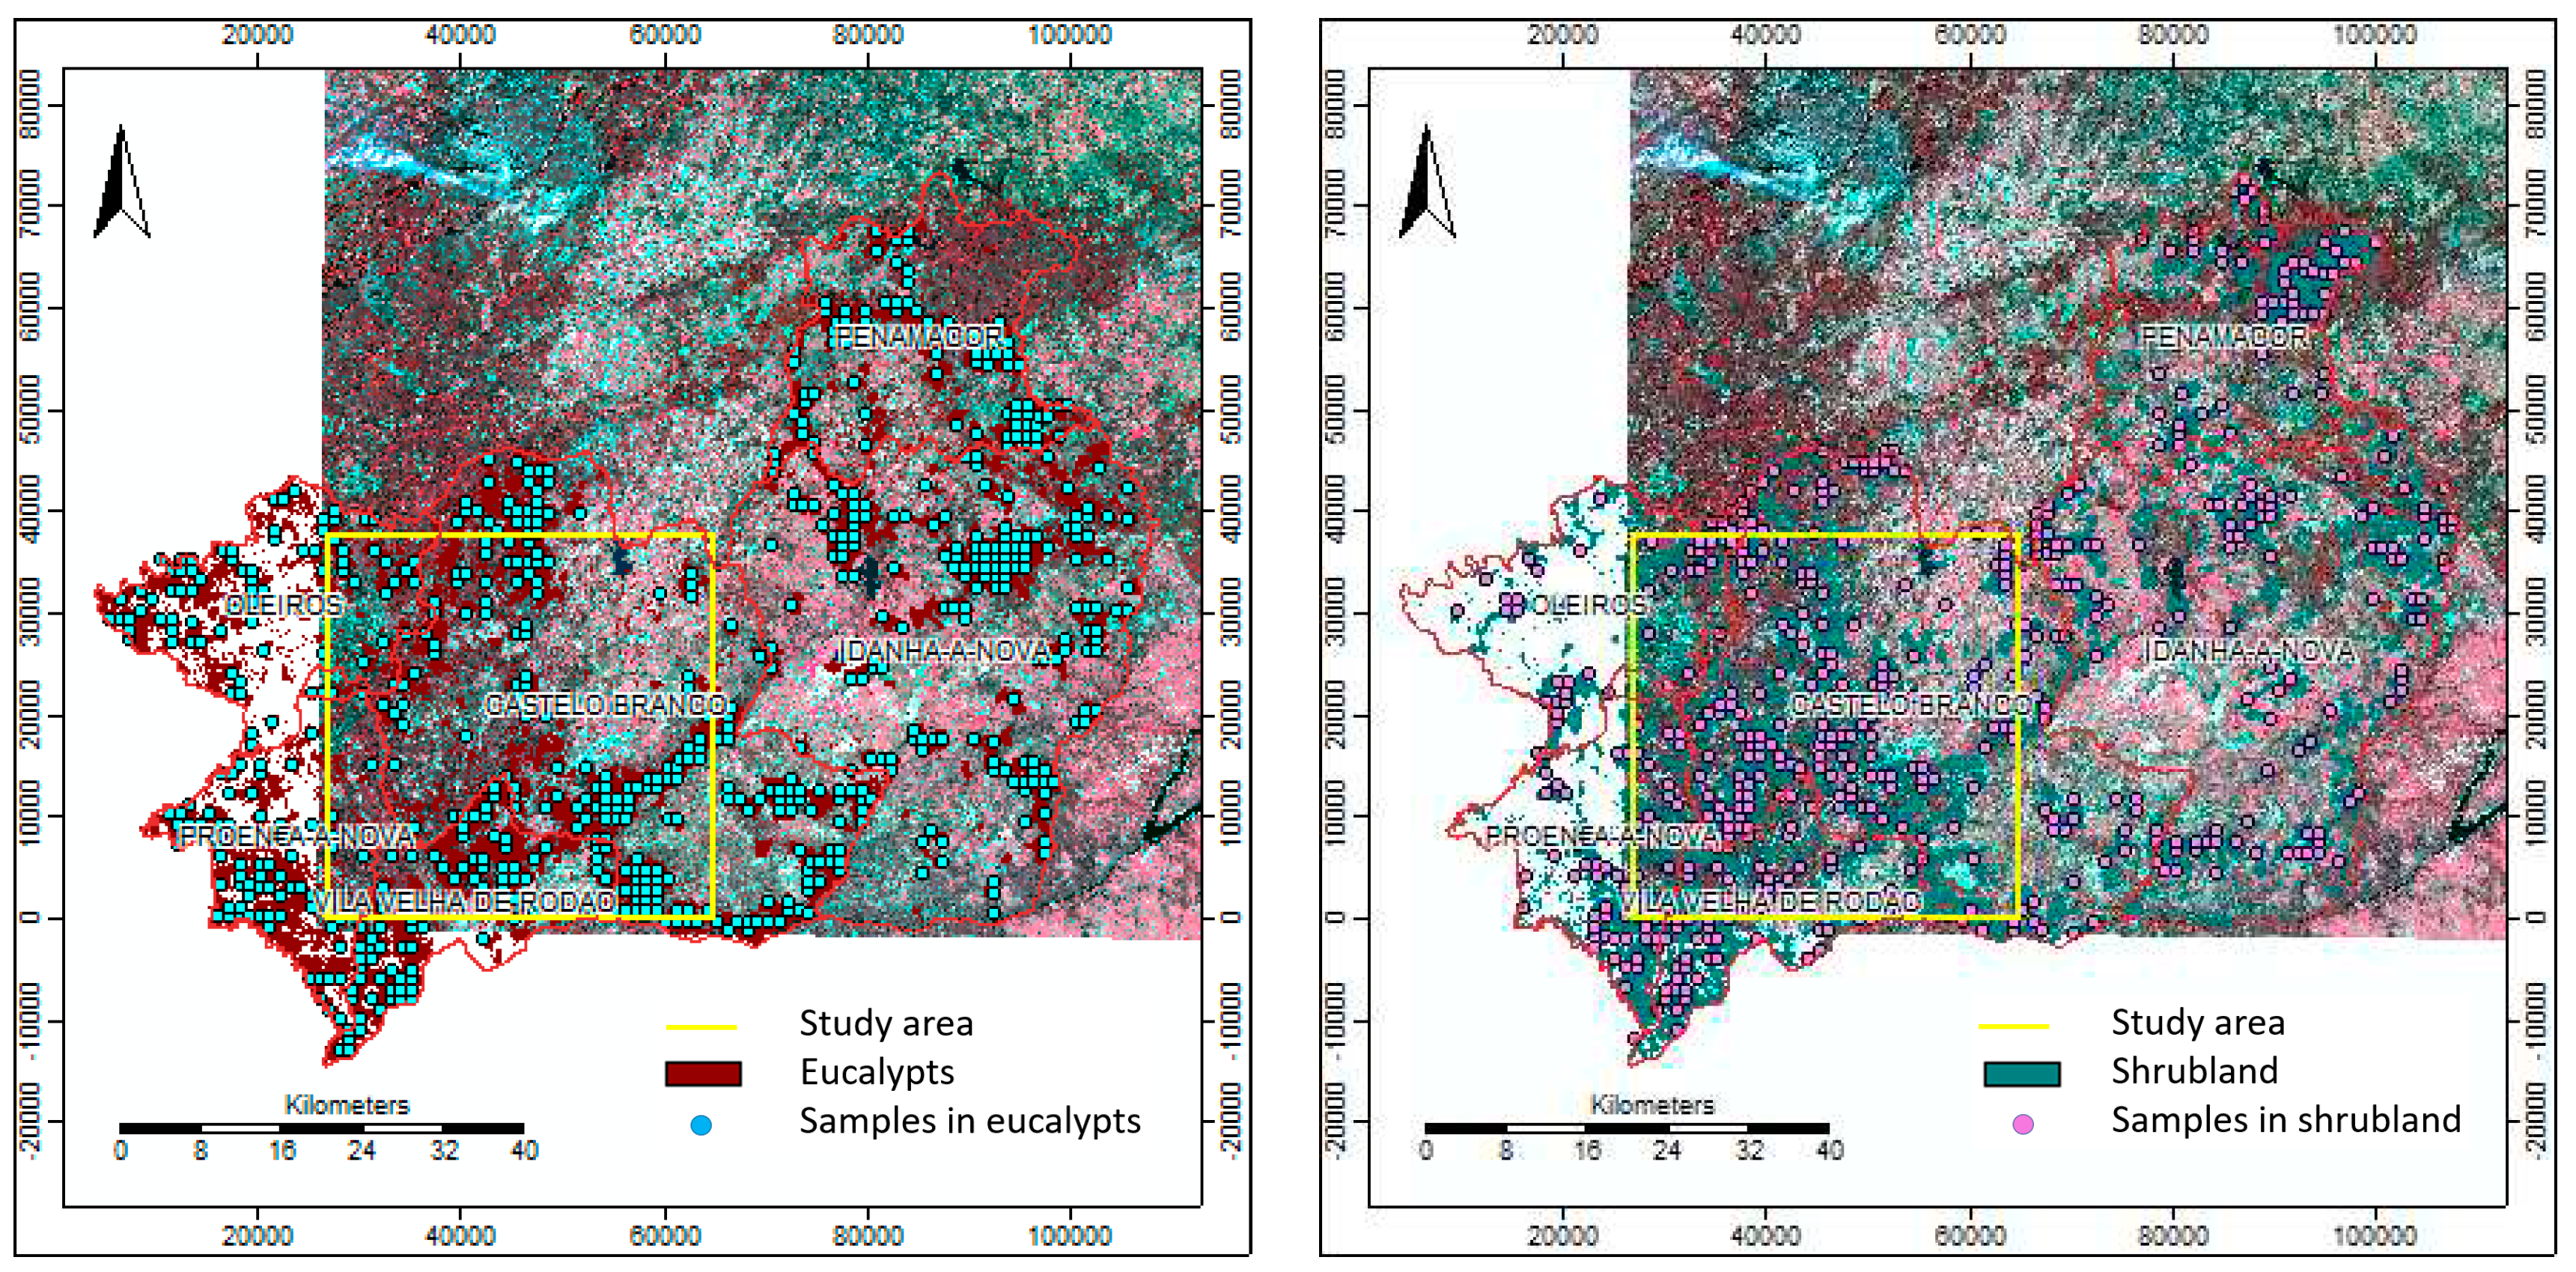
Figure 4.
Study area—Sentinel2A imagery (23 June 2023) with the sample points and the field sample plots: (a) in eucalypts areas (blue, n = 197); (b) in shrubland areas (pink, n = 227); (c) in eucalypts areas (blue, n = 30); and (d) in shrubland (pink, n = 30).
Figure 4.
Study area—Sentinel2A imagery (23 June 2023) with the sample points and the field sample plots: (a) in eucalypts areas (blue, n = 197); (b) in shrubland areas (pink, n = 227); (c) in eucalypts areas (blue, n = 30); and (d) in shrubland (pink, n = 30).
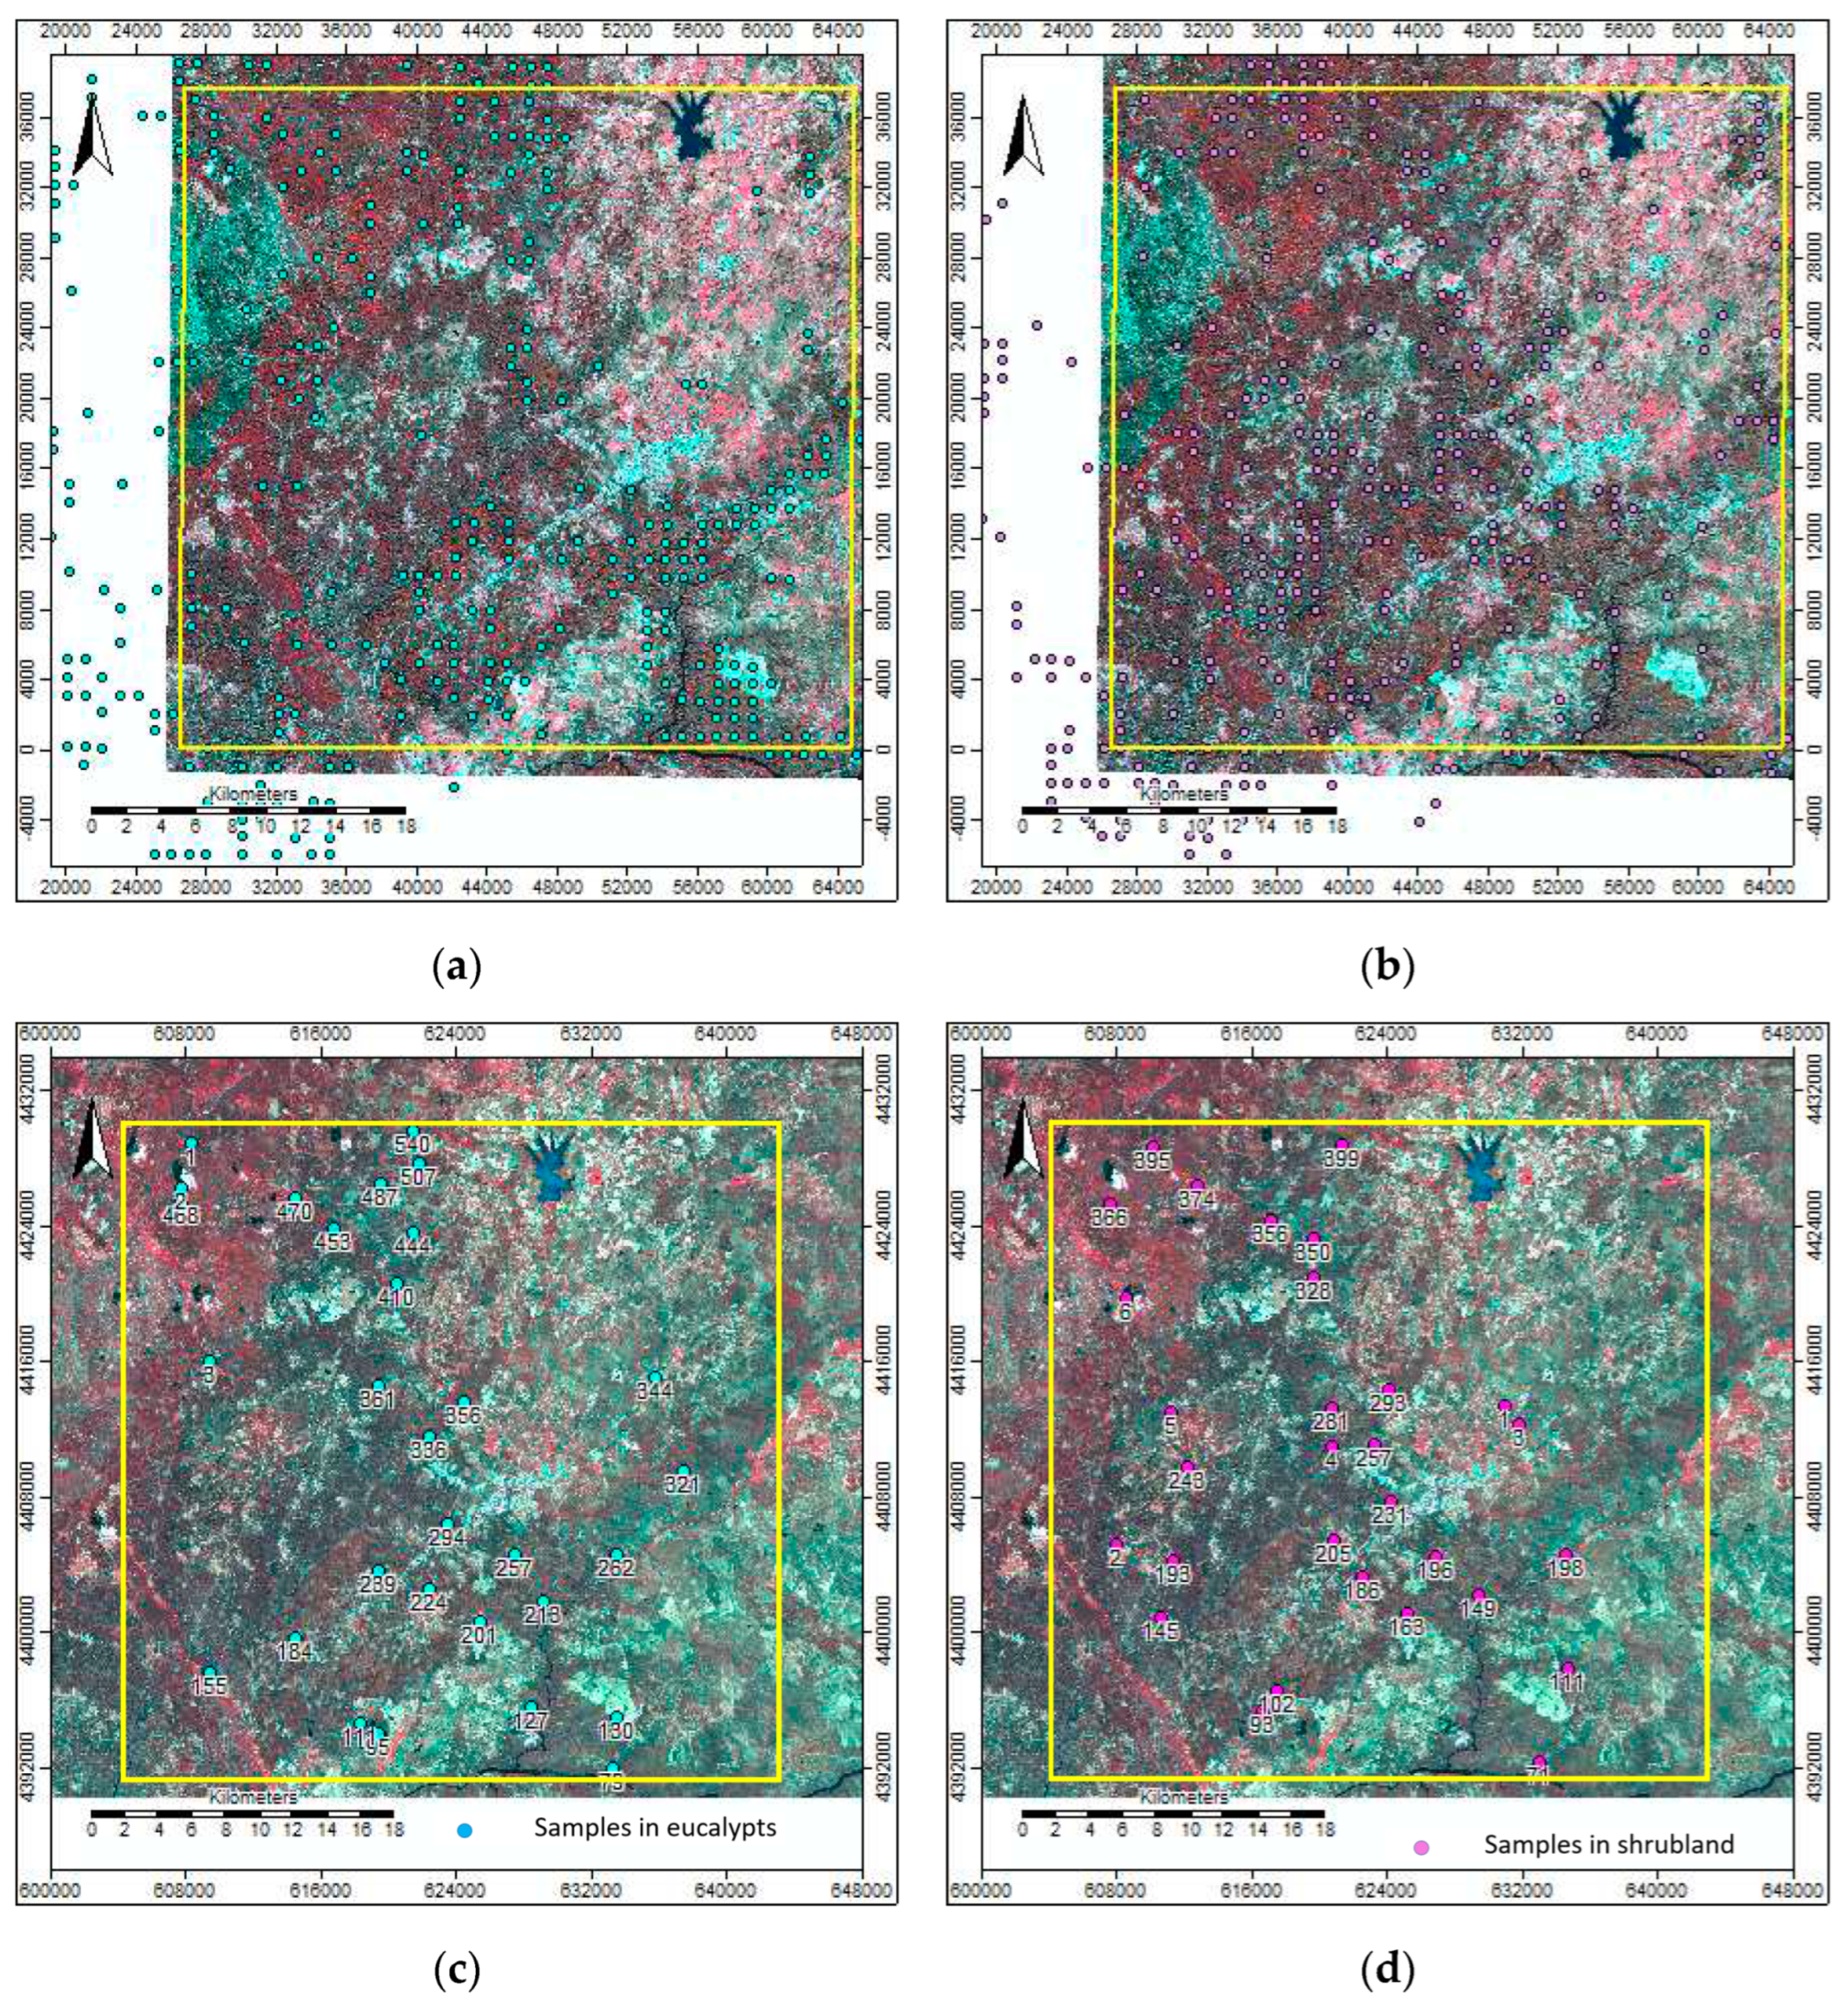
Figure 5.
Study area—NDVI imagery (29 May 2022) with the sample points: (a) in eucalypts areas (blue, n = 197); and (b) in shrubland areas (pink, n = 227).
Figure 5.
Study area—NDVI imagery (29 May 2022) with the sample points: (a) in eucalypts areas (blue, n = 197); and (b) in shrubland areas (pink, n = 227).
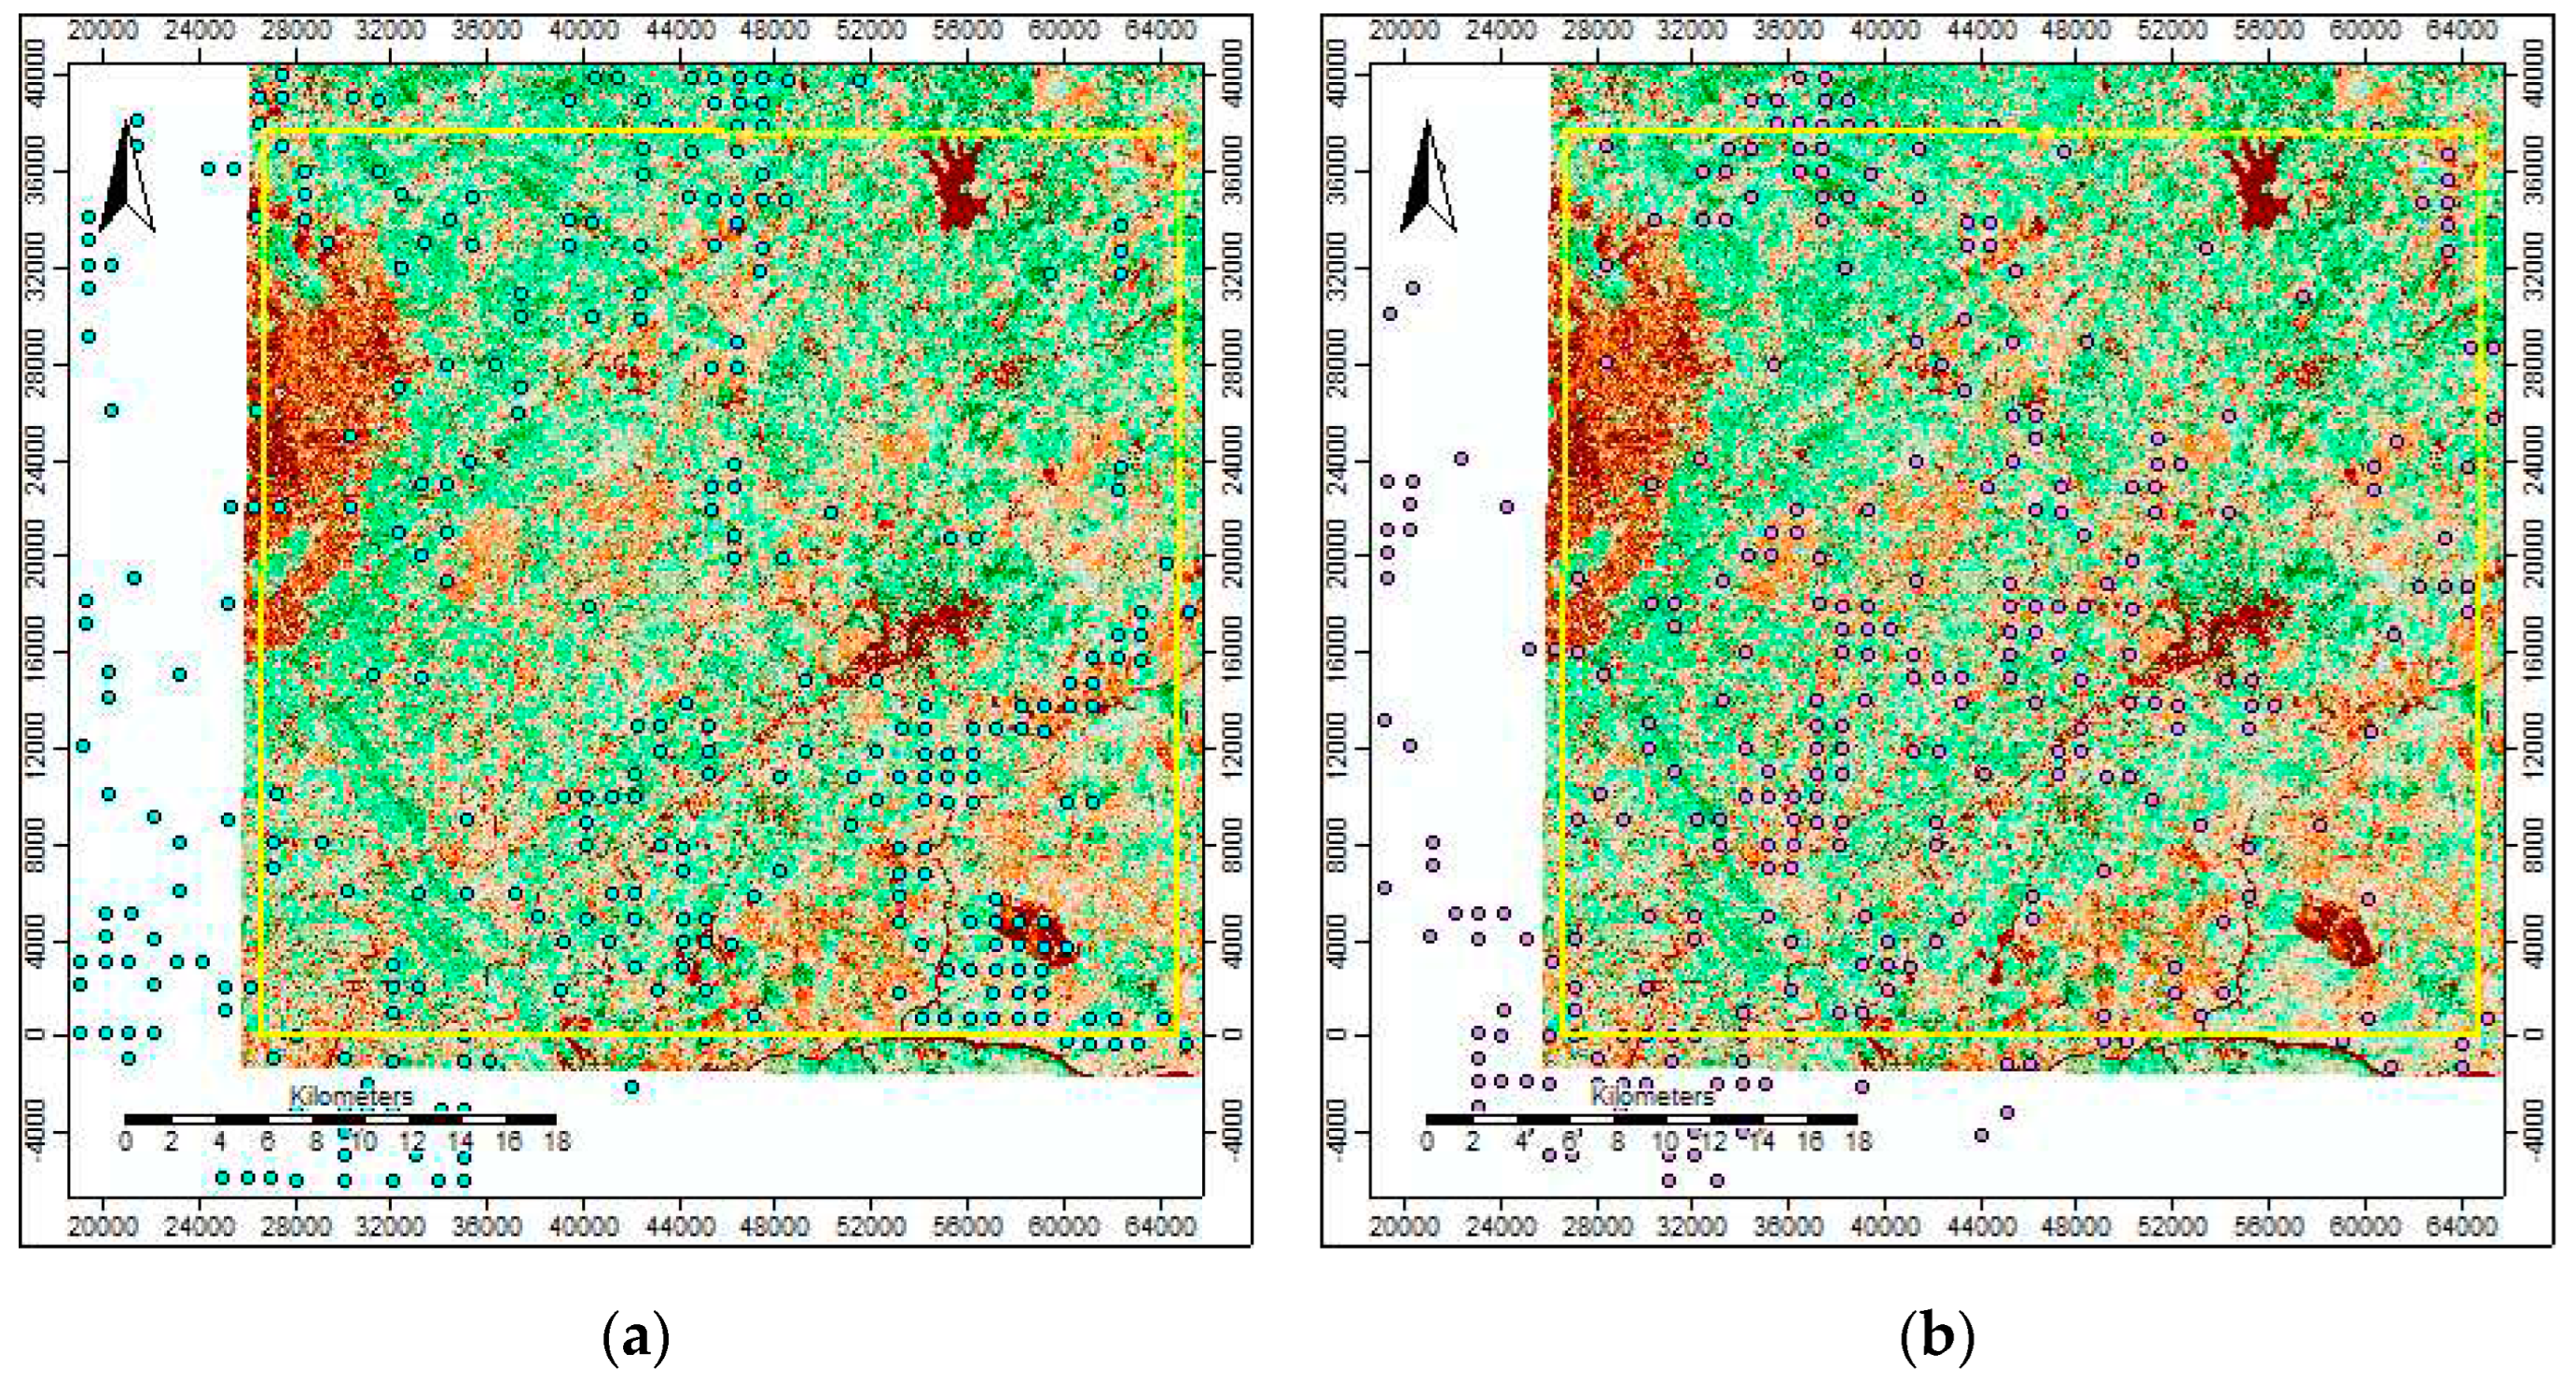
Figure 6.
Study area—sample points and field sample points for eucalypts and shrubland areas (E; n = 197; S; n = 227; E_; n = 30; S_; n = 30): (a) NDVI annual curve (2022); and (b) NDVI-CV method (2022); and (c) spectral signatures (23 June 2023).
Figure 6.
Study area—sample points and field sample points for eucalypts and shrubland areas (E; n = 197; S; n = 227; E_; n = 30; S_; n = 30): (a) NDVI annual curve (2022); and (b) NDVI-CV method (2022); and (c) spectral signatures (23 June 2023).
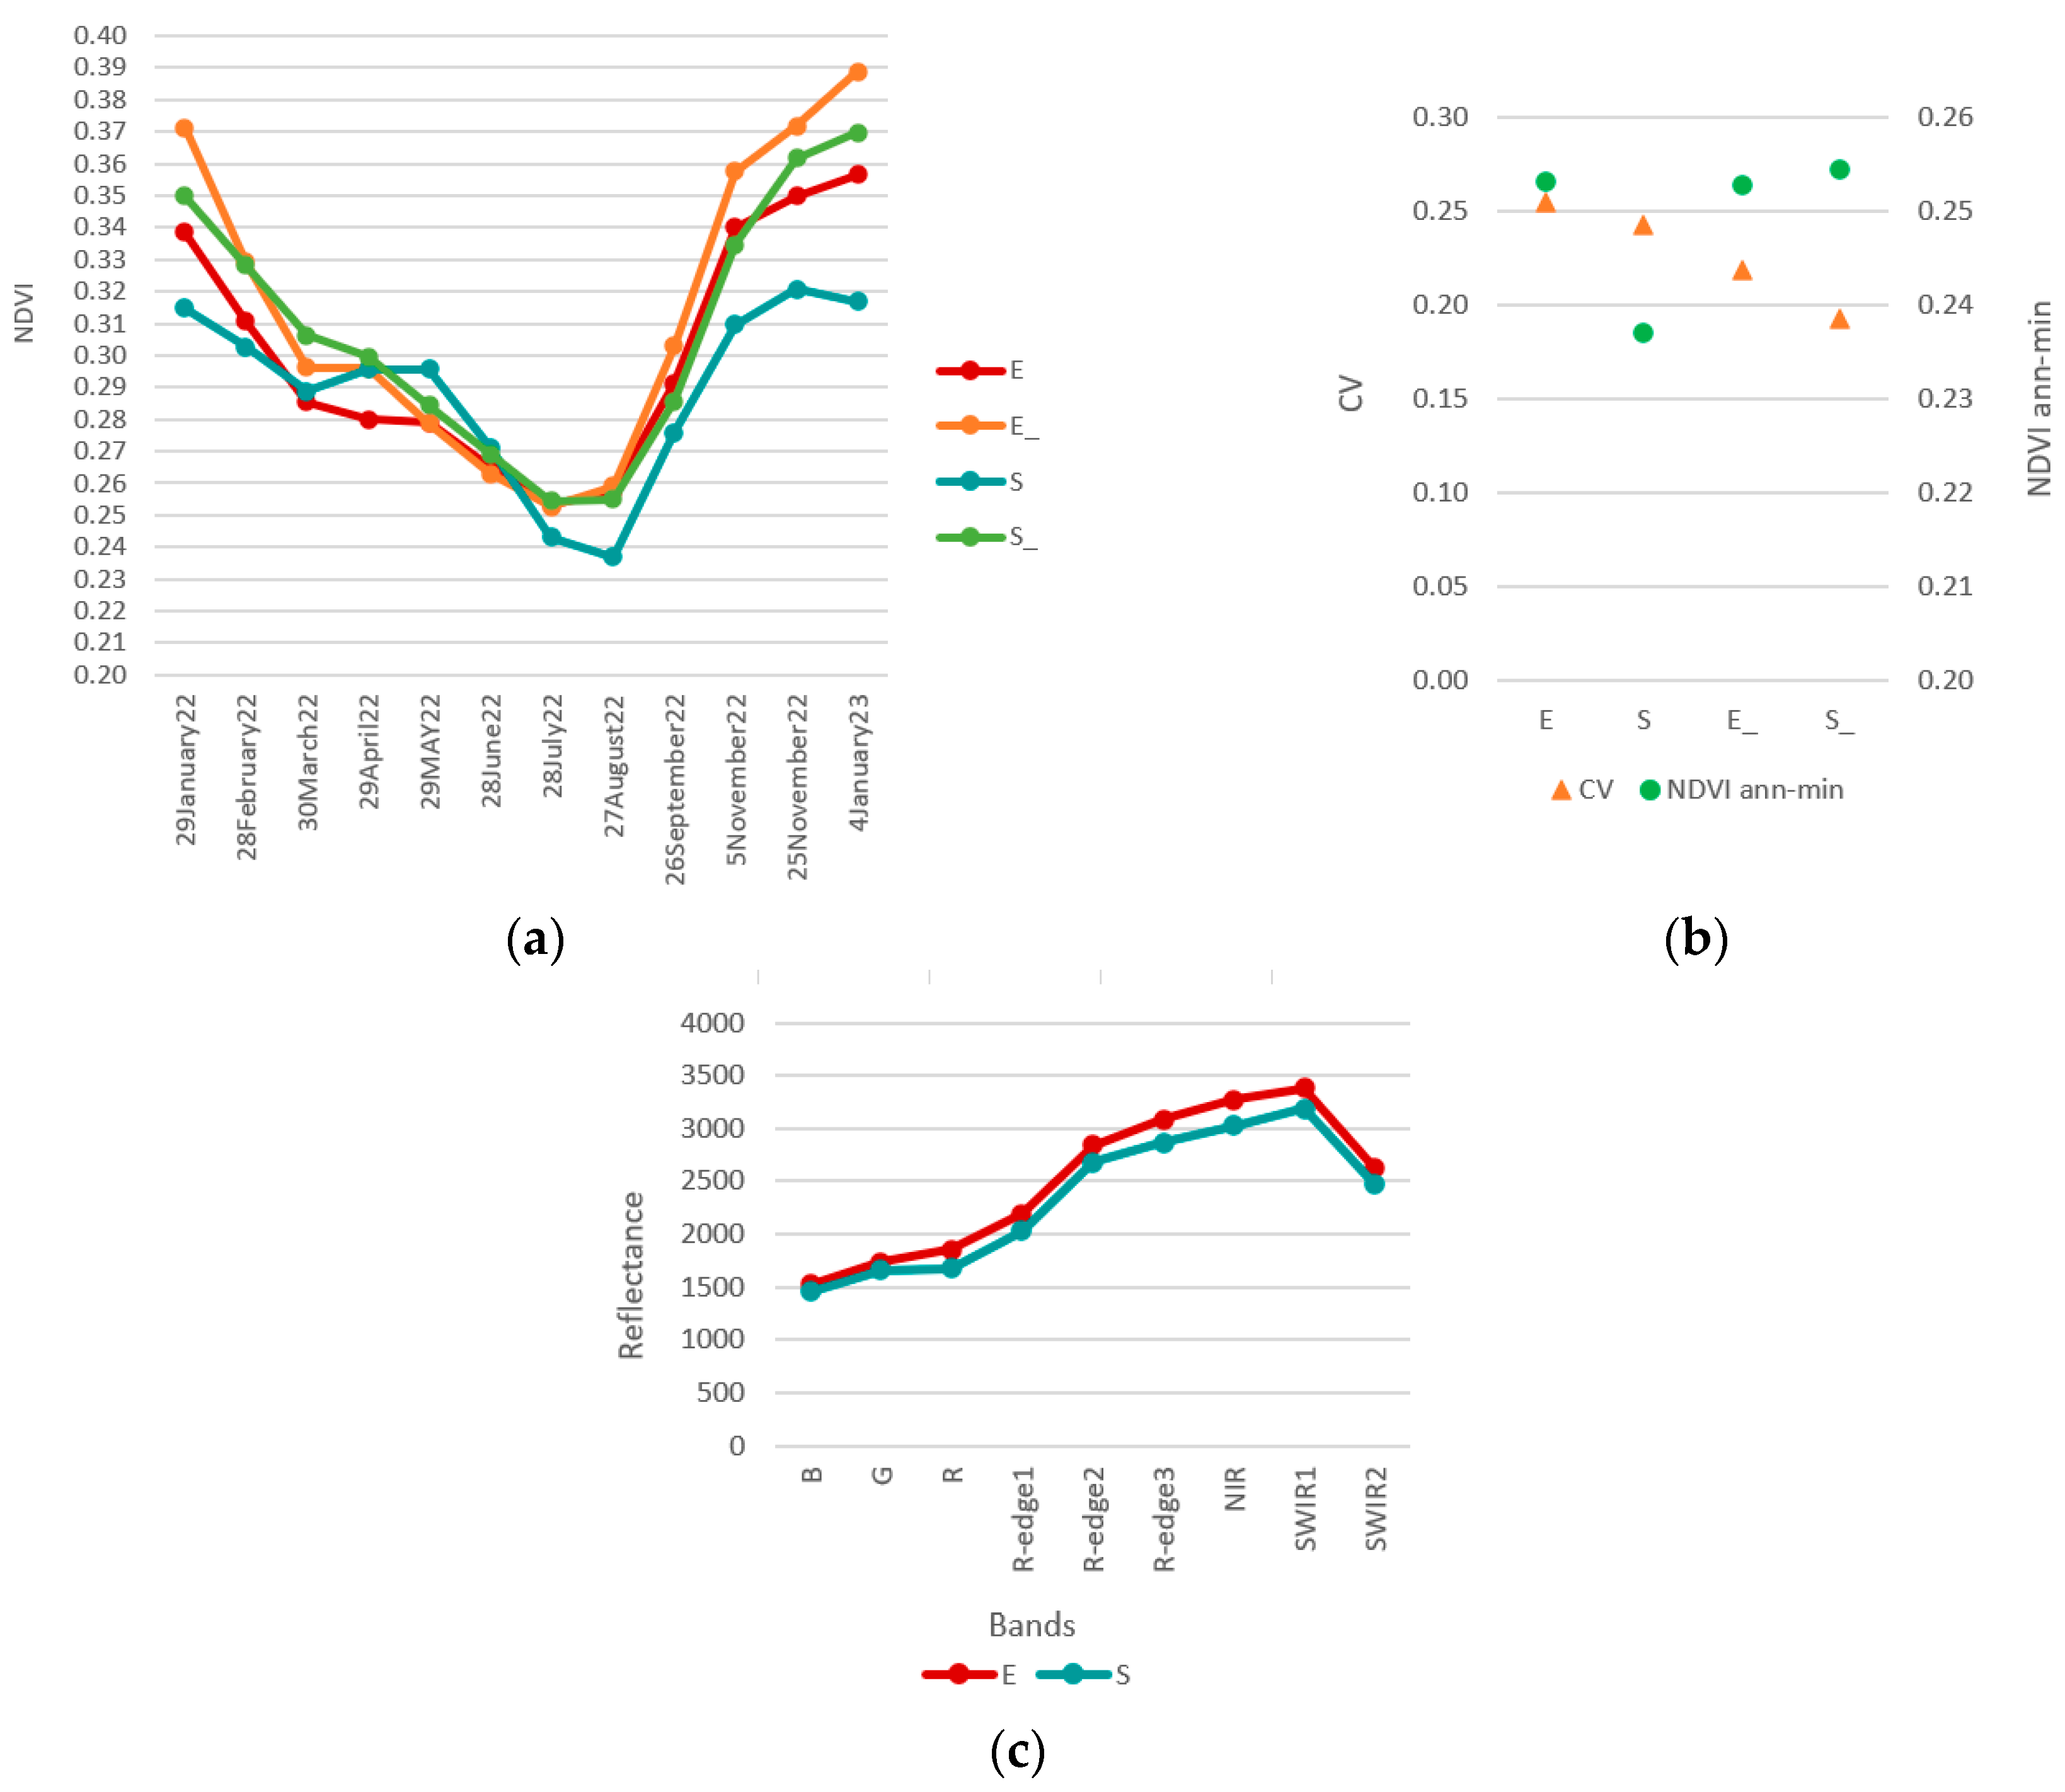
Figure 7.
Study area—shrubland areas species composition.
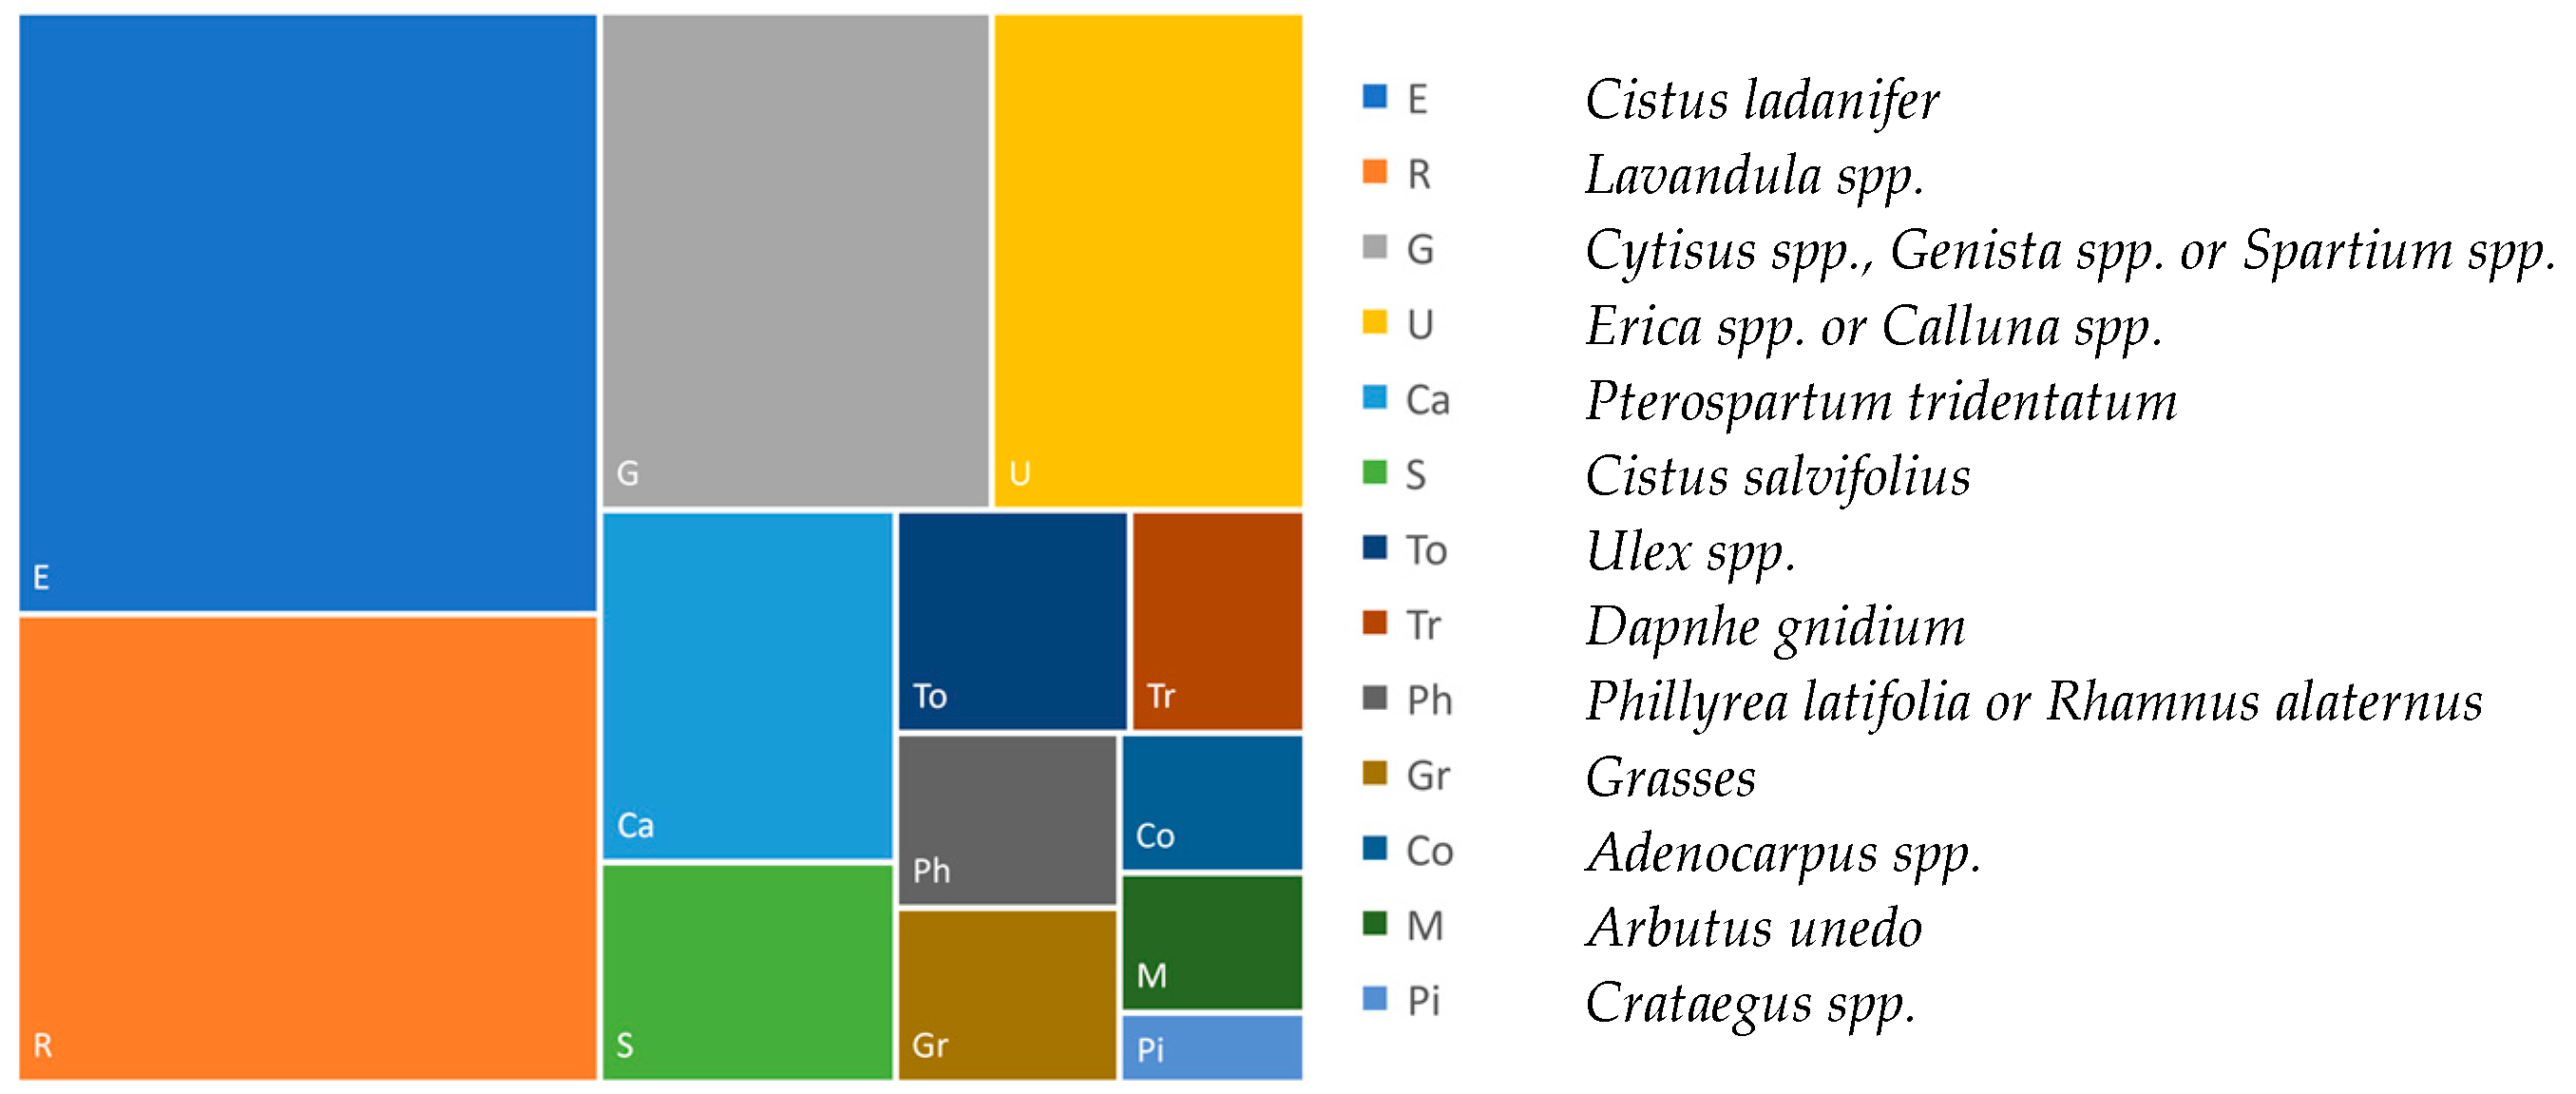
Figure 8.
Study area—NDVI imagery (23 June 2023) with the field sample plots: (a) in eucalypts areas (blue, n = 30); and (b) in shrubland (pink, n = 30).
Figure 8.
Study area—NDVI imagery (23 June 2023) with the field sample plots: (a) in eucalypts areas (blue, n = 30); and (b) in shrubland (pink, n = 30).
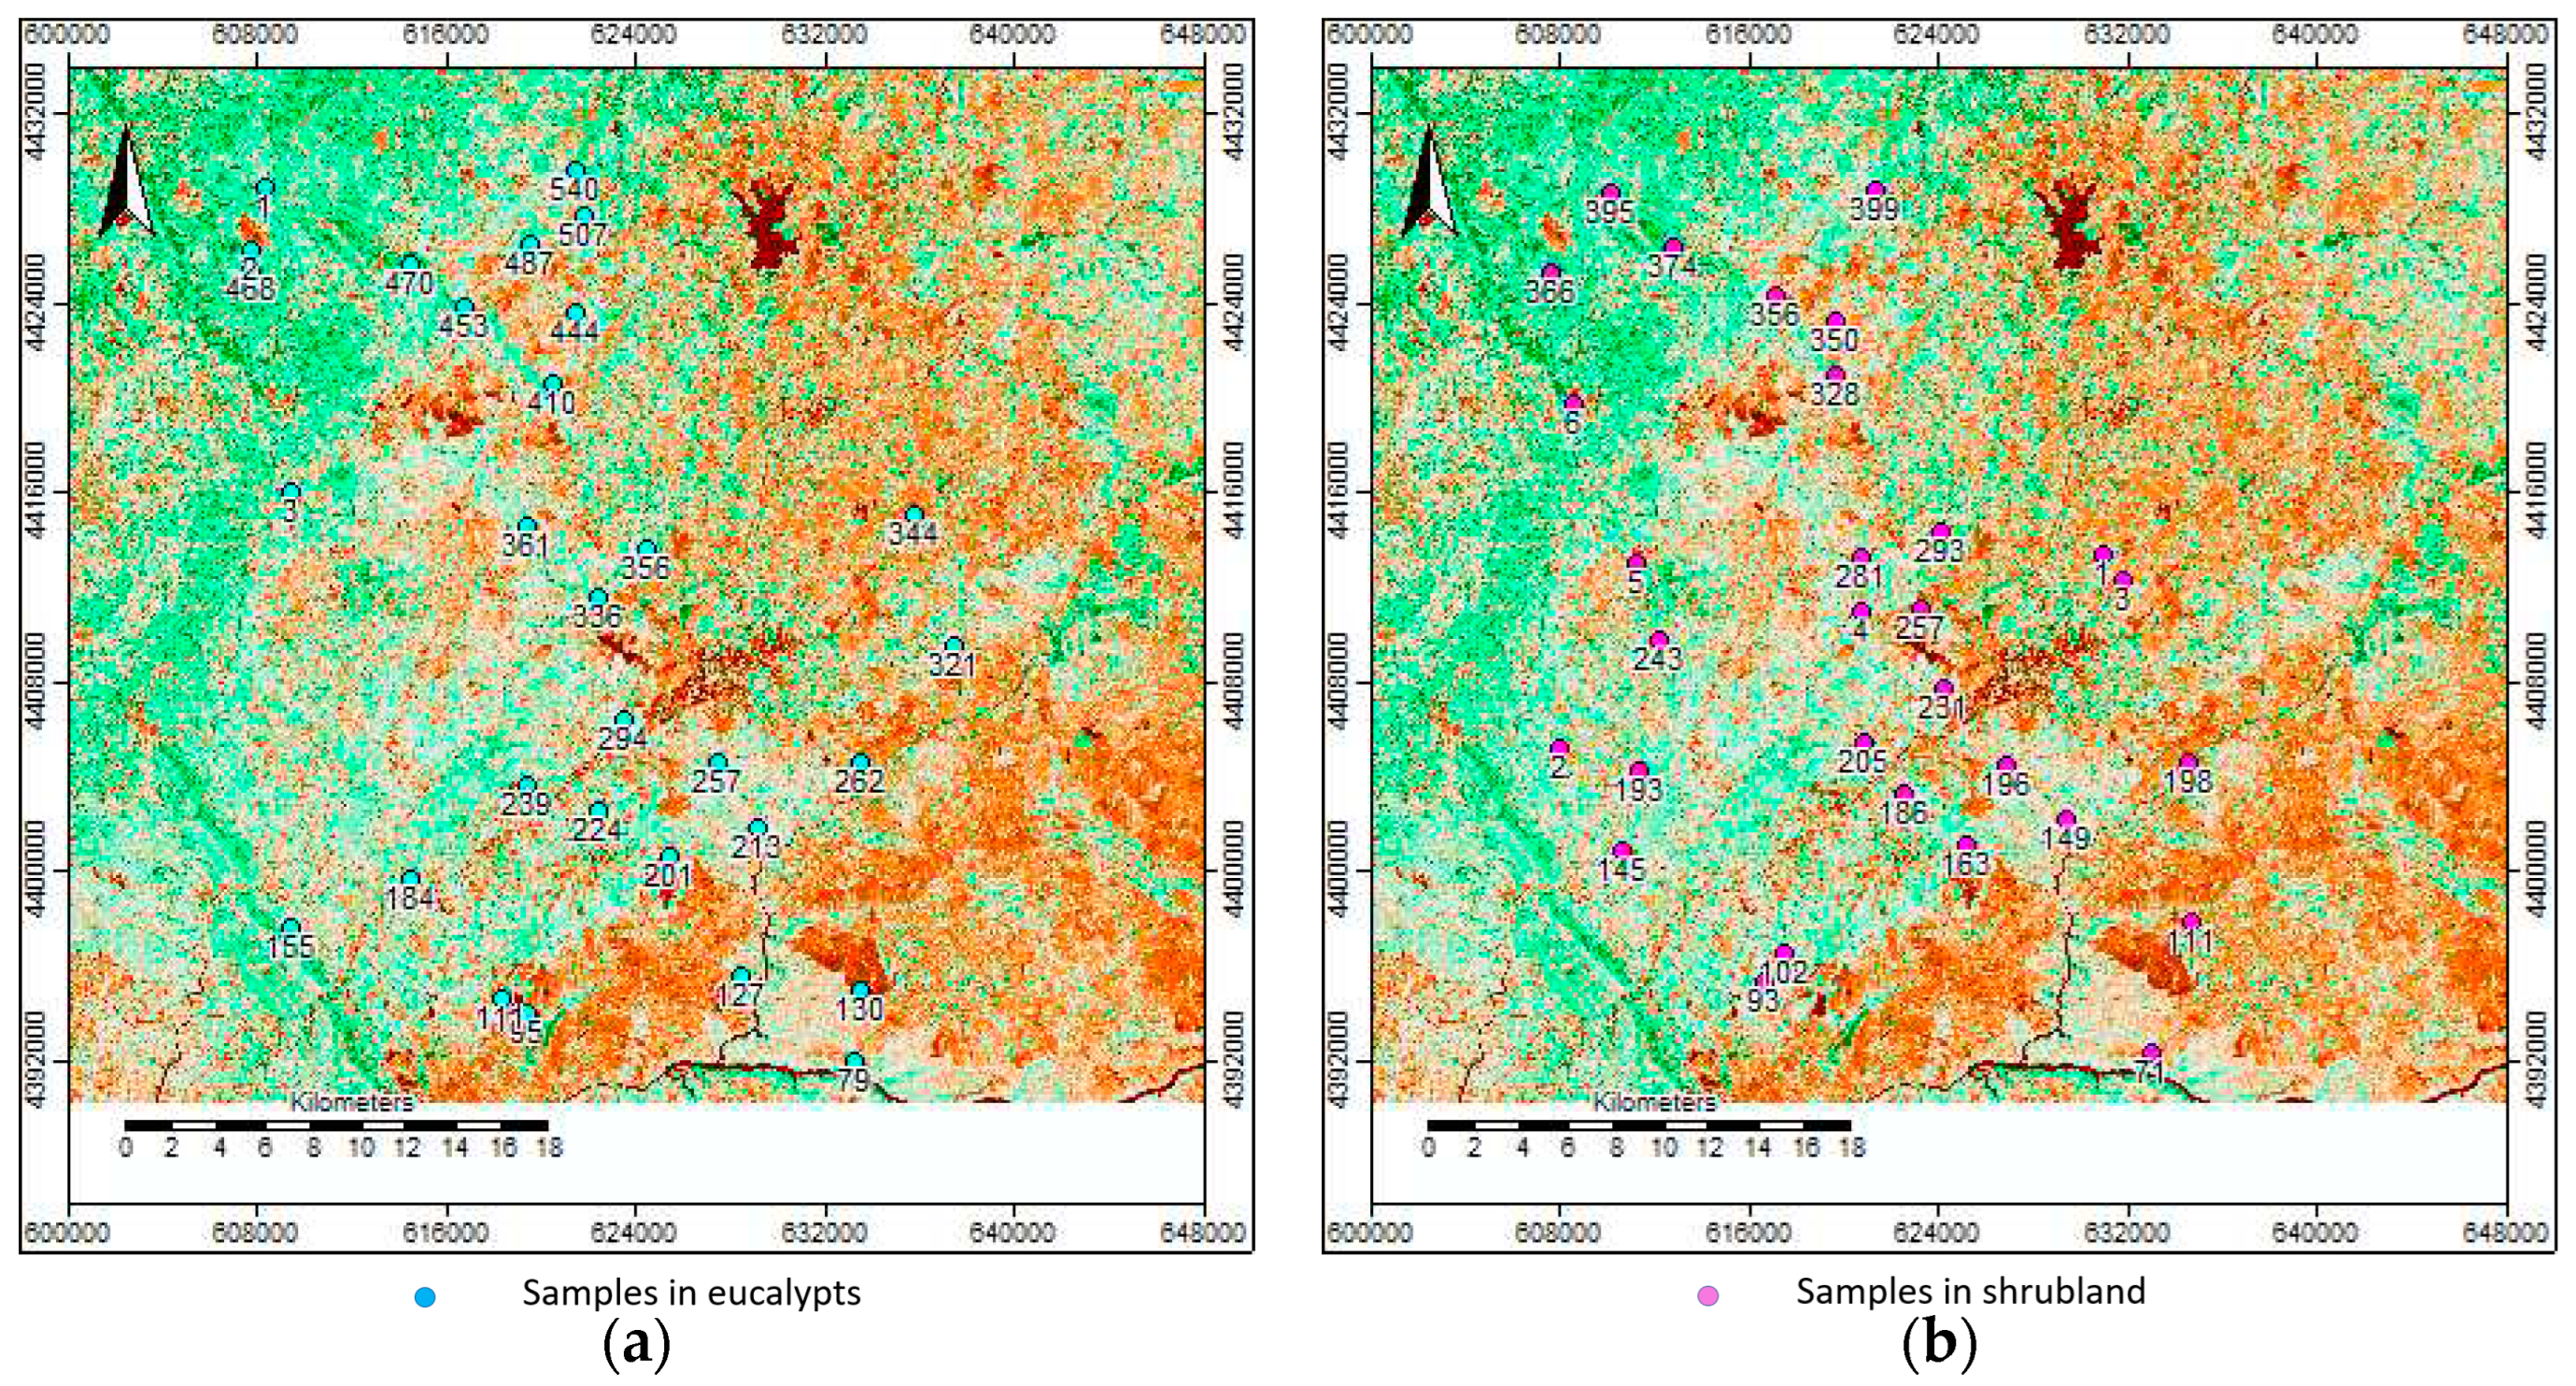
Figure 9.
Study area—modelling and validation: (a) Wa=f(NDVI) for eucalypts plots; (b) Wa = f(NDVI) for shrubland plots; (c) prediction residuals for eucalypts plots; and (d) prediction residuals for shrubland plots. Legend: R2—model coefficient of determination; e—model bias; ae—model precision; σ2e—prediction error variance; and R2e—modelling efficiency.
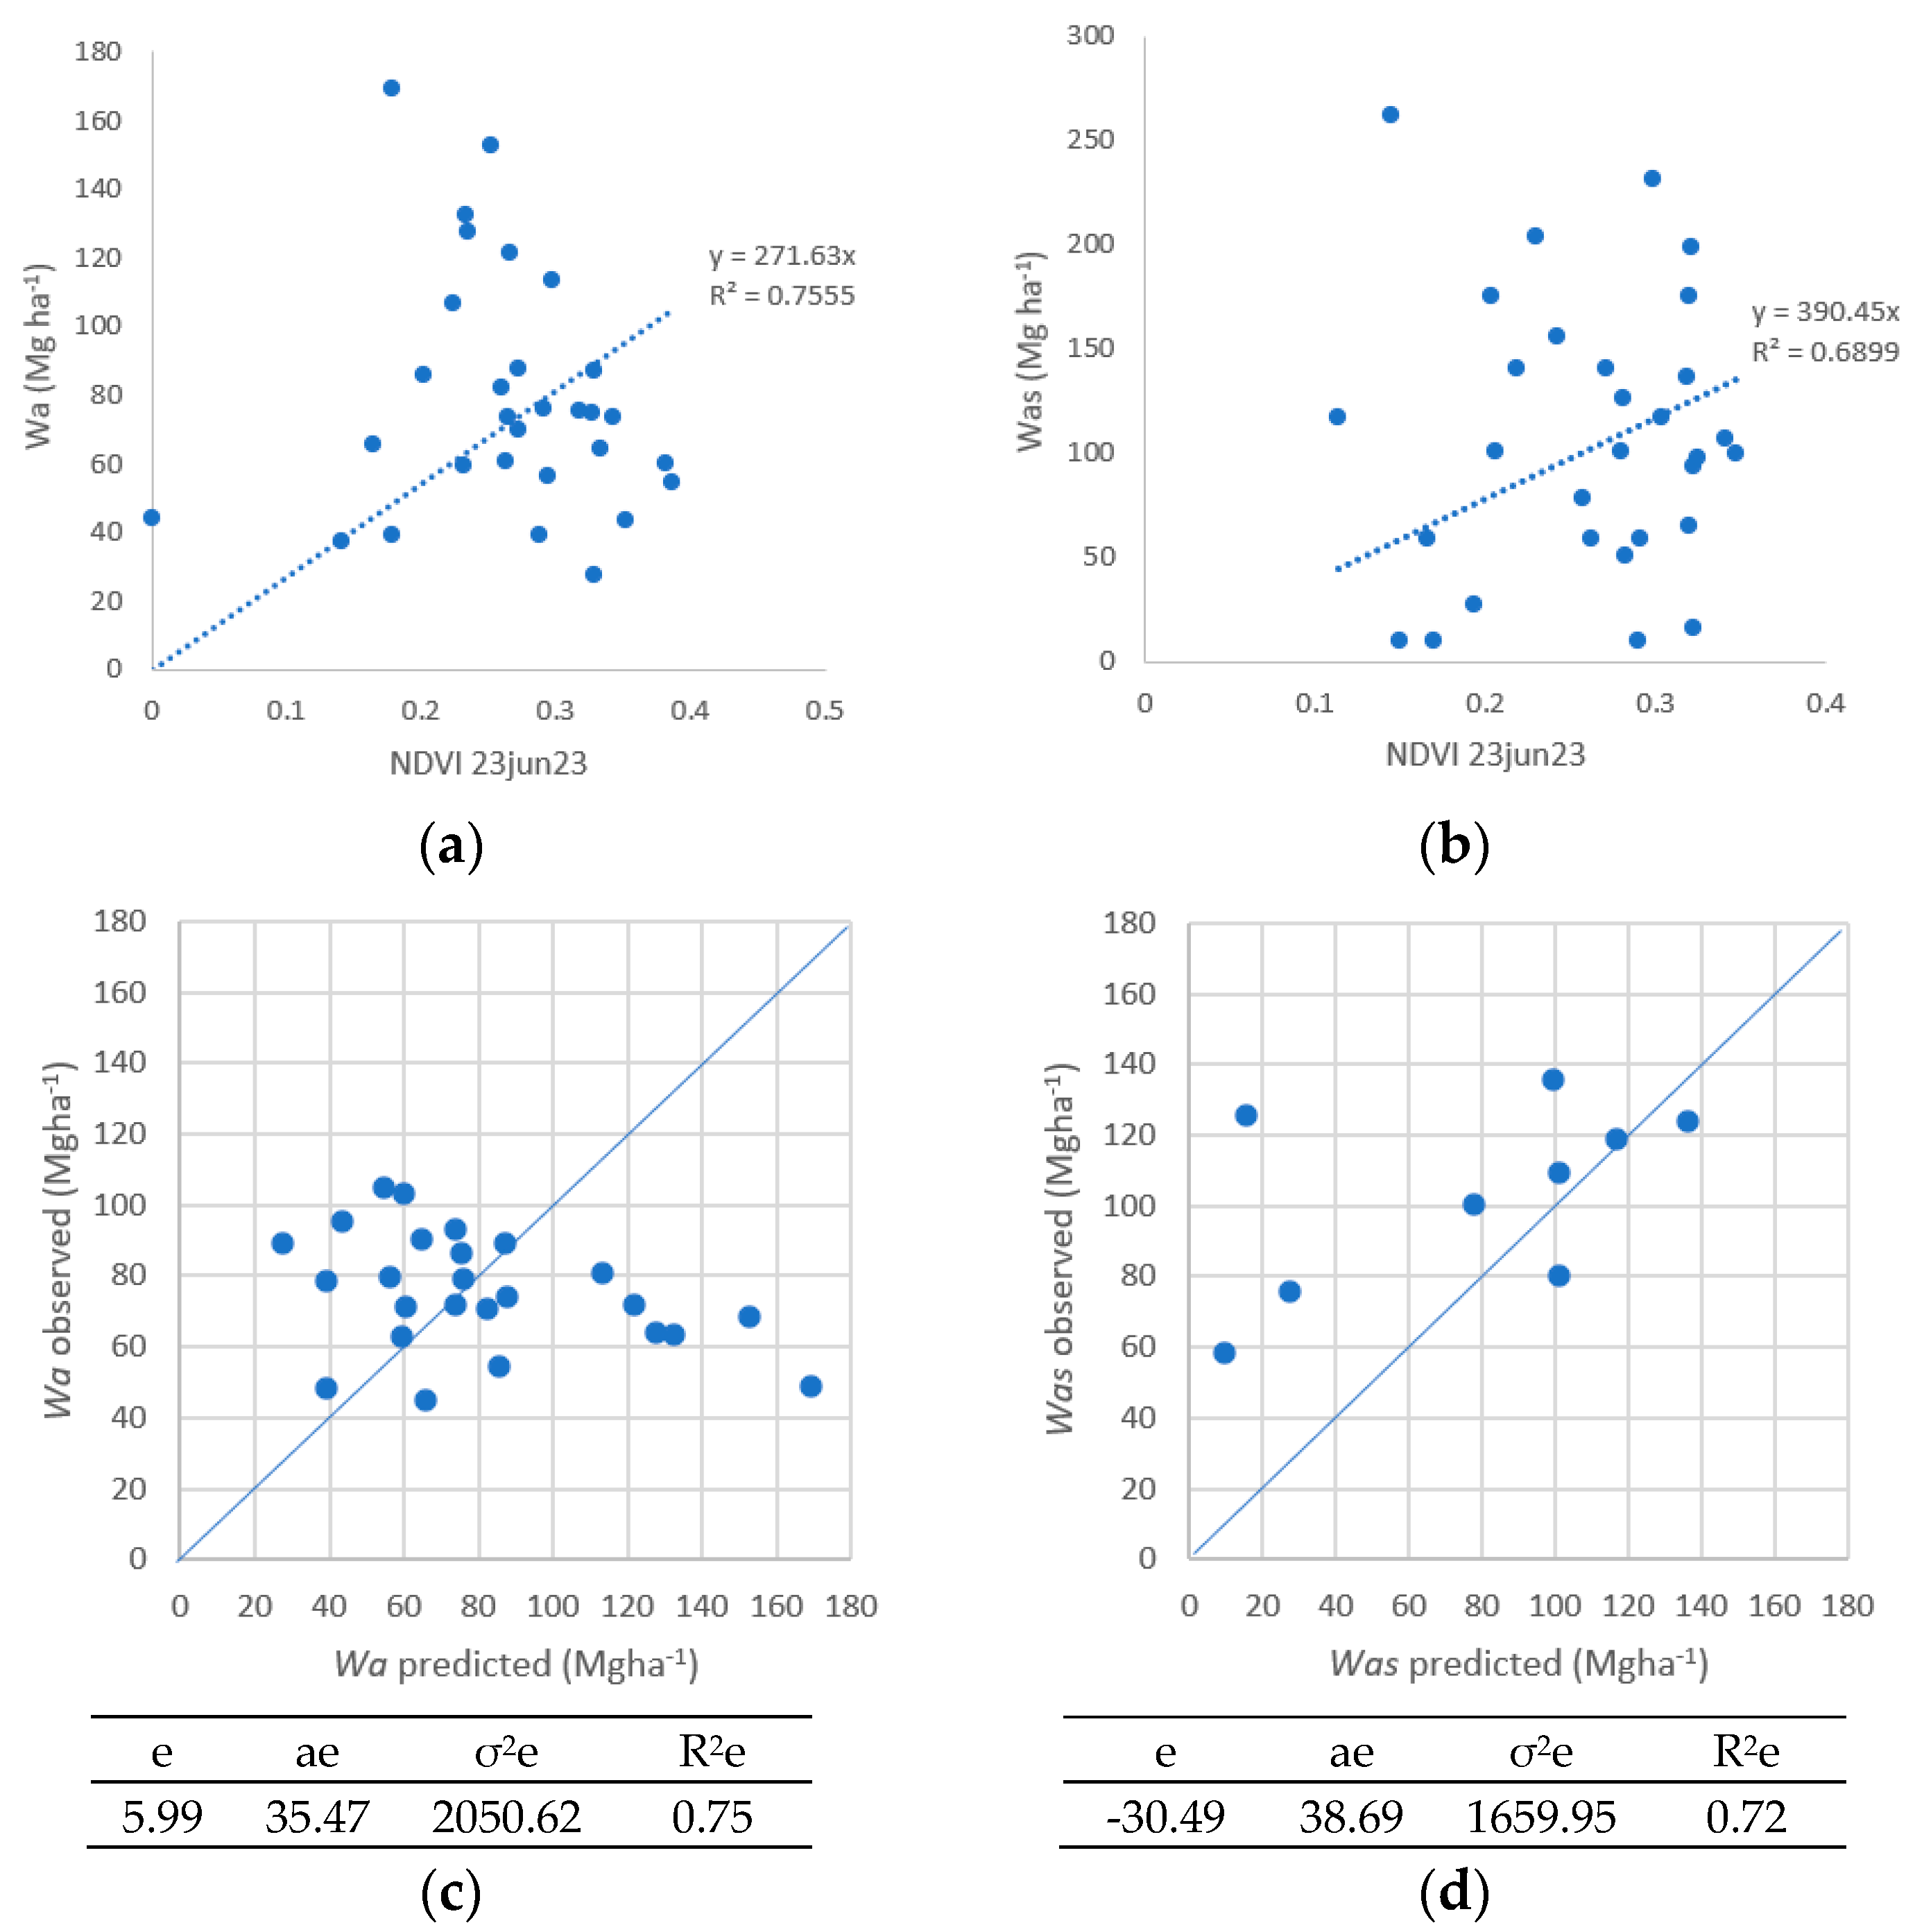
Figure 10.
Study area: (a) COS 2018—eucalypts areas; (b) COS 2018—shrubland areas; (c) AGB—eucalypts areas; and (d) AGB—shrubland areas.
Figure 10.
Study area: (a) COS 2018—eucalypts areas; (b) COS 2018—shrubland areas; (c) AGB—eucalypts areas; and (d) AGB—shrubland areas.
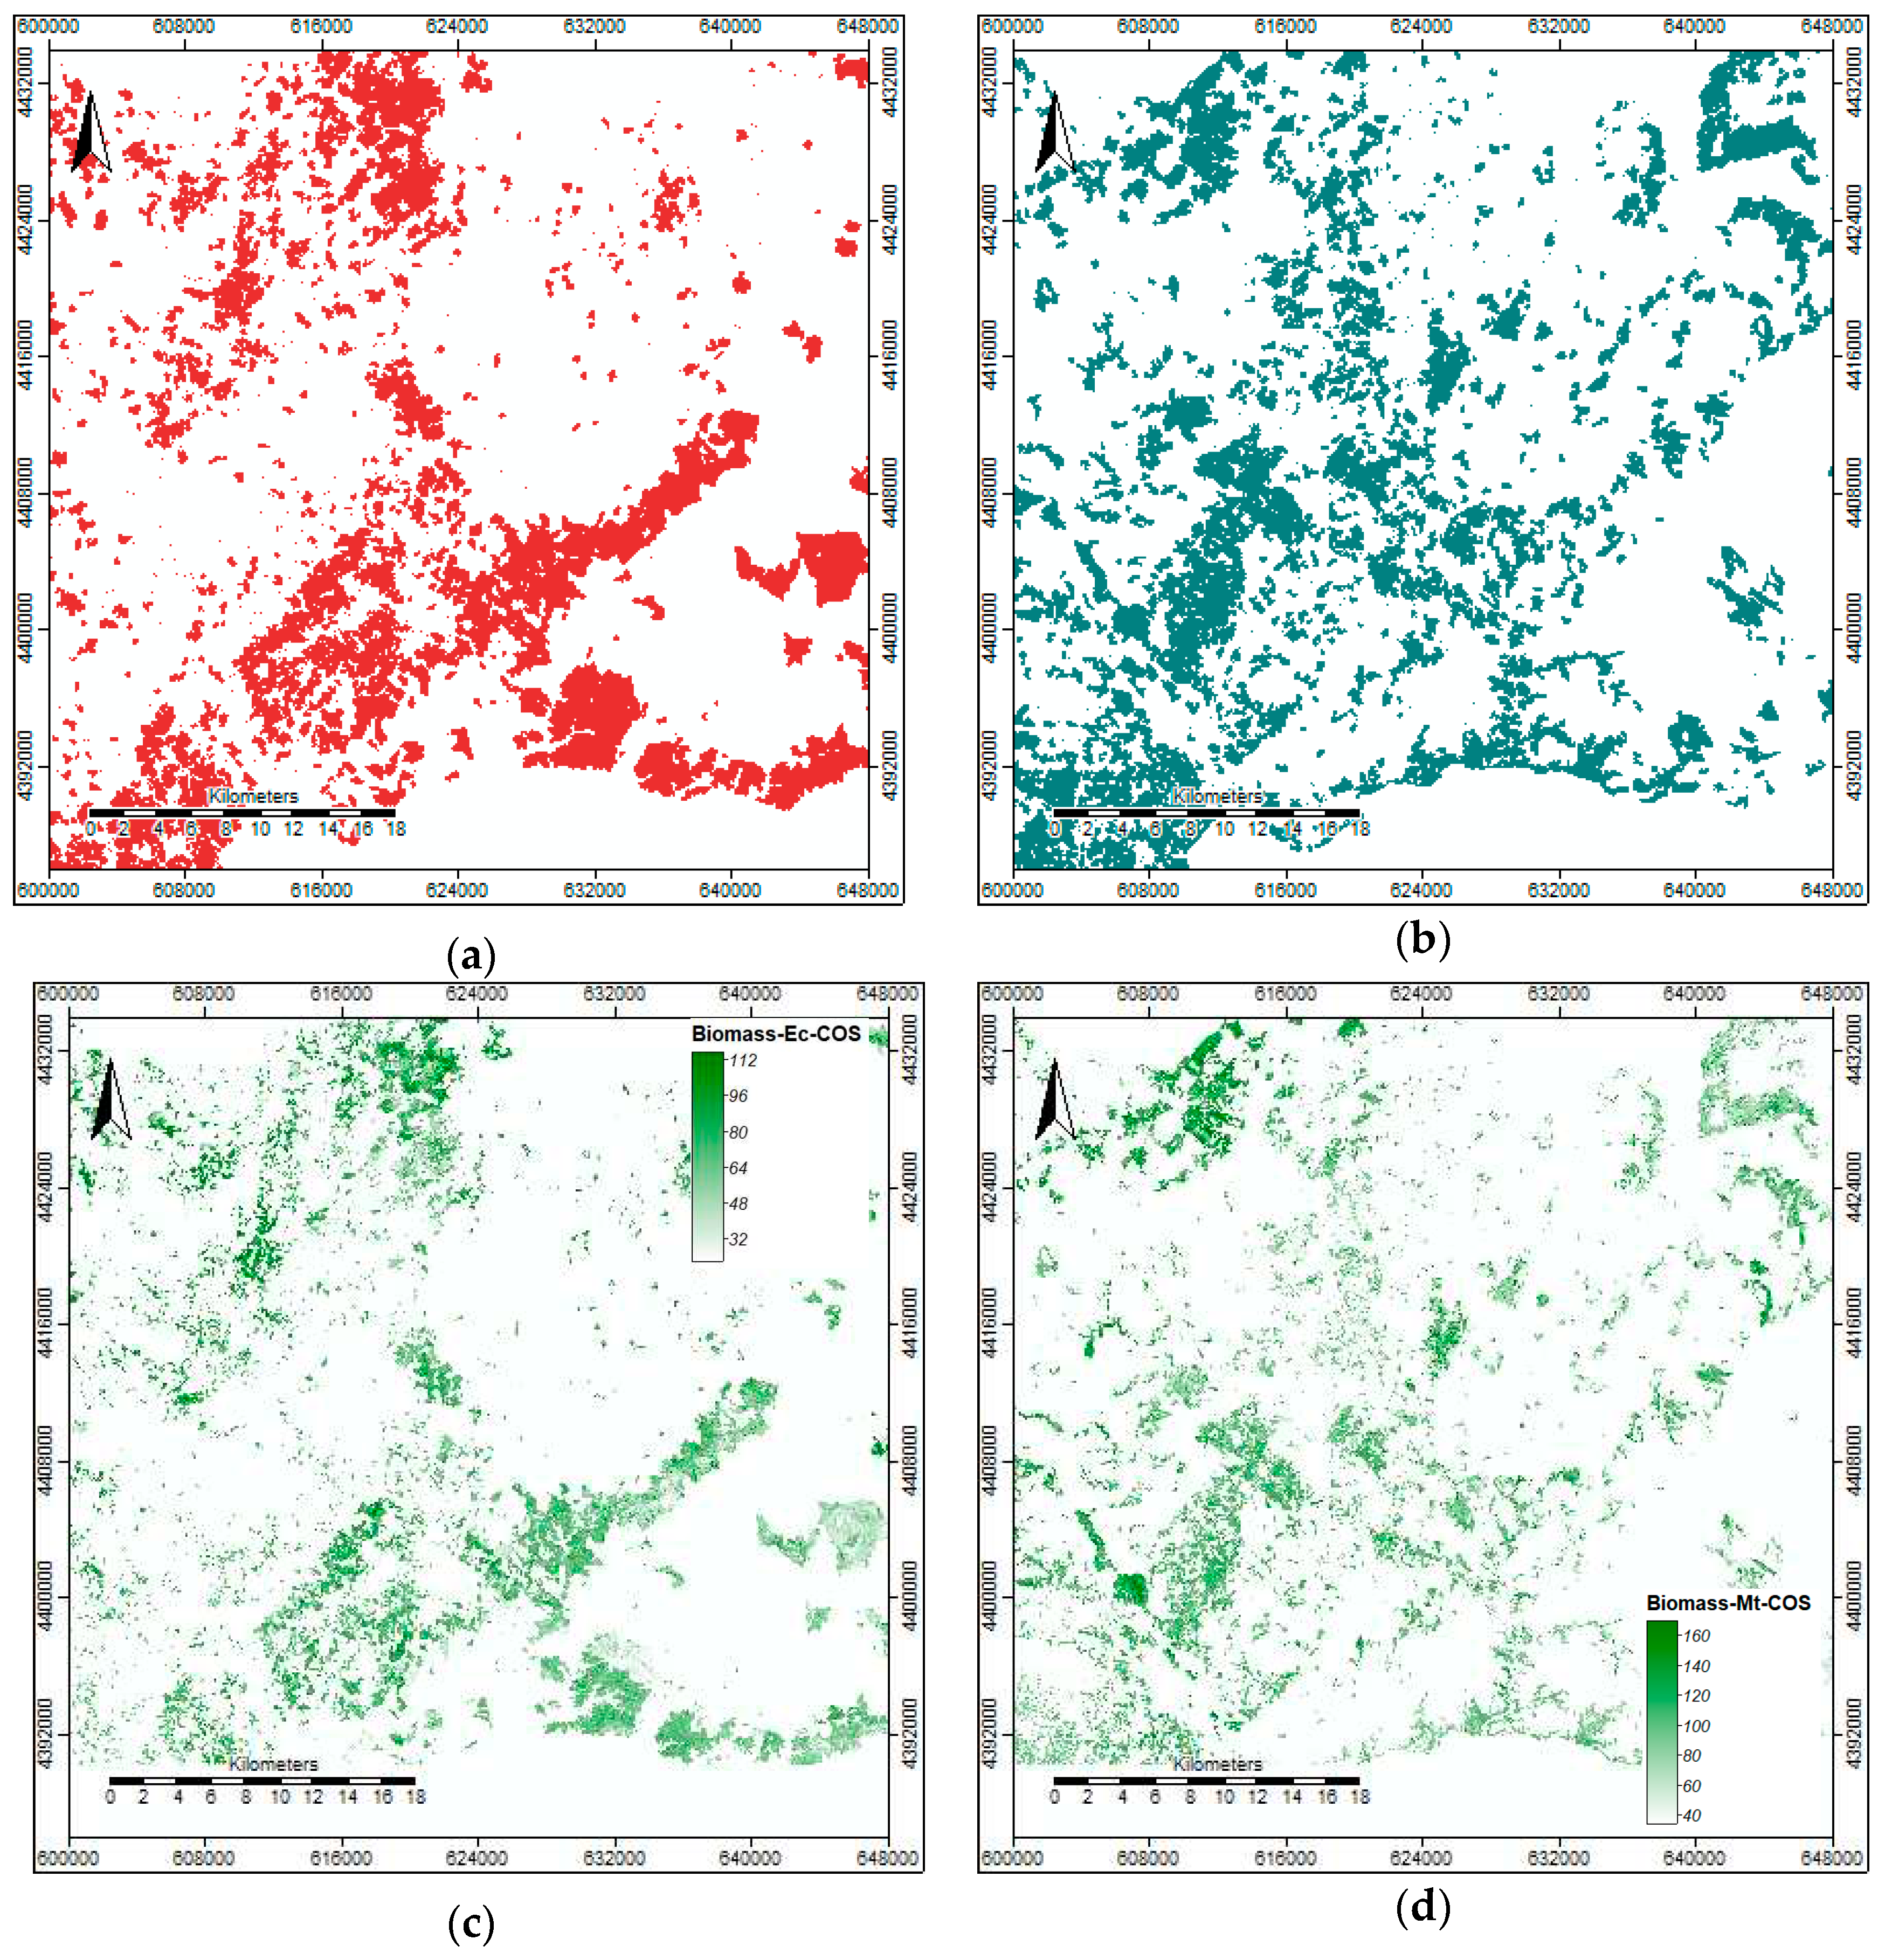
Figure 11.
Study area: (a) Eucalypts AGB map; (b) AGB map–zoom; (c) FCC–zoom; (d) NDVI–zoom; (e) AGB overlay FCC–zoom; (f) AGB overlay NDVI–zoom.
Figure 11.
Study area: (a) Eucalypts AGB map; (b) AGB map–zoom; (c) FCC–zoom; (d) NDVI–zoom; (e) AGB overlay FCC–zoom; (f) AGB overlay NDVI–zoom.
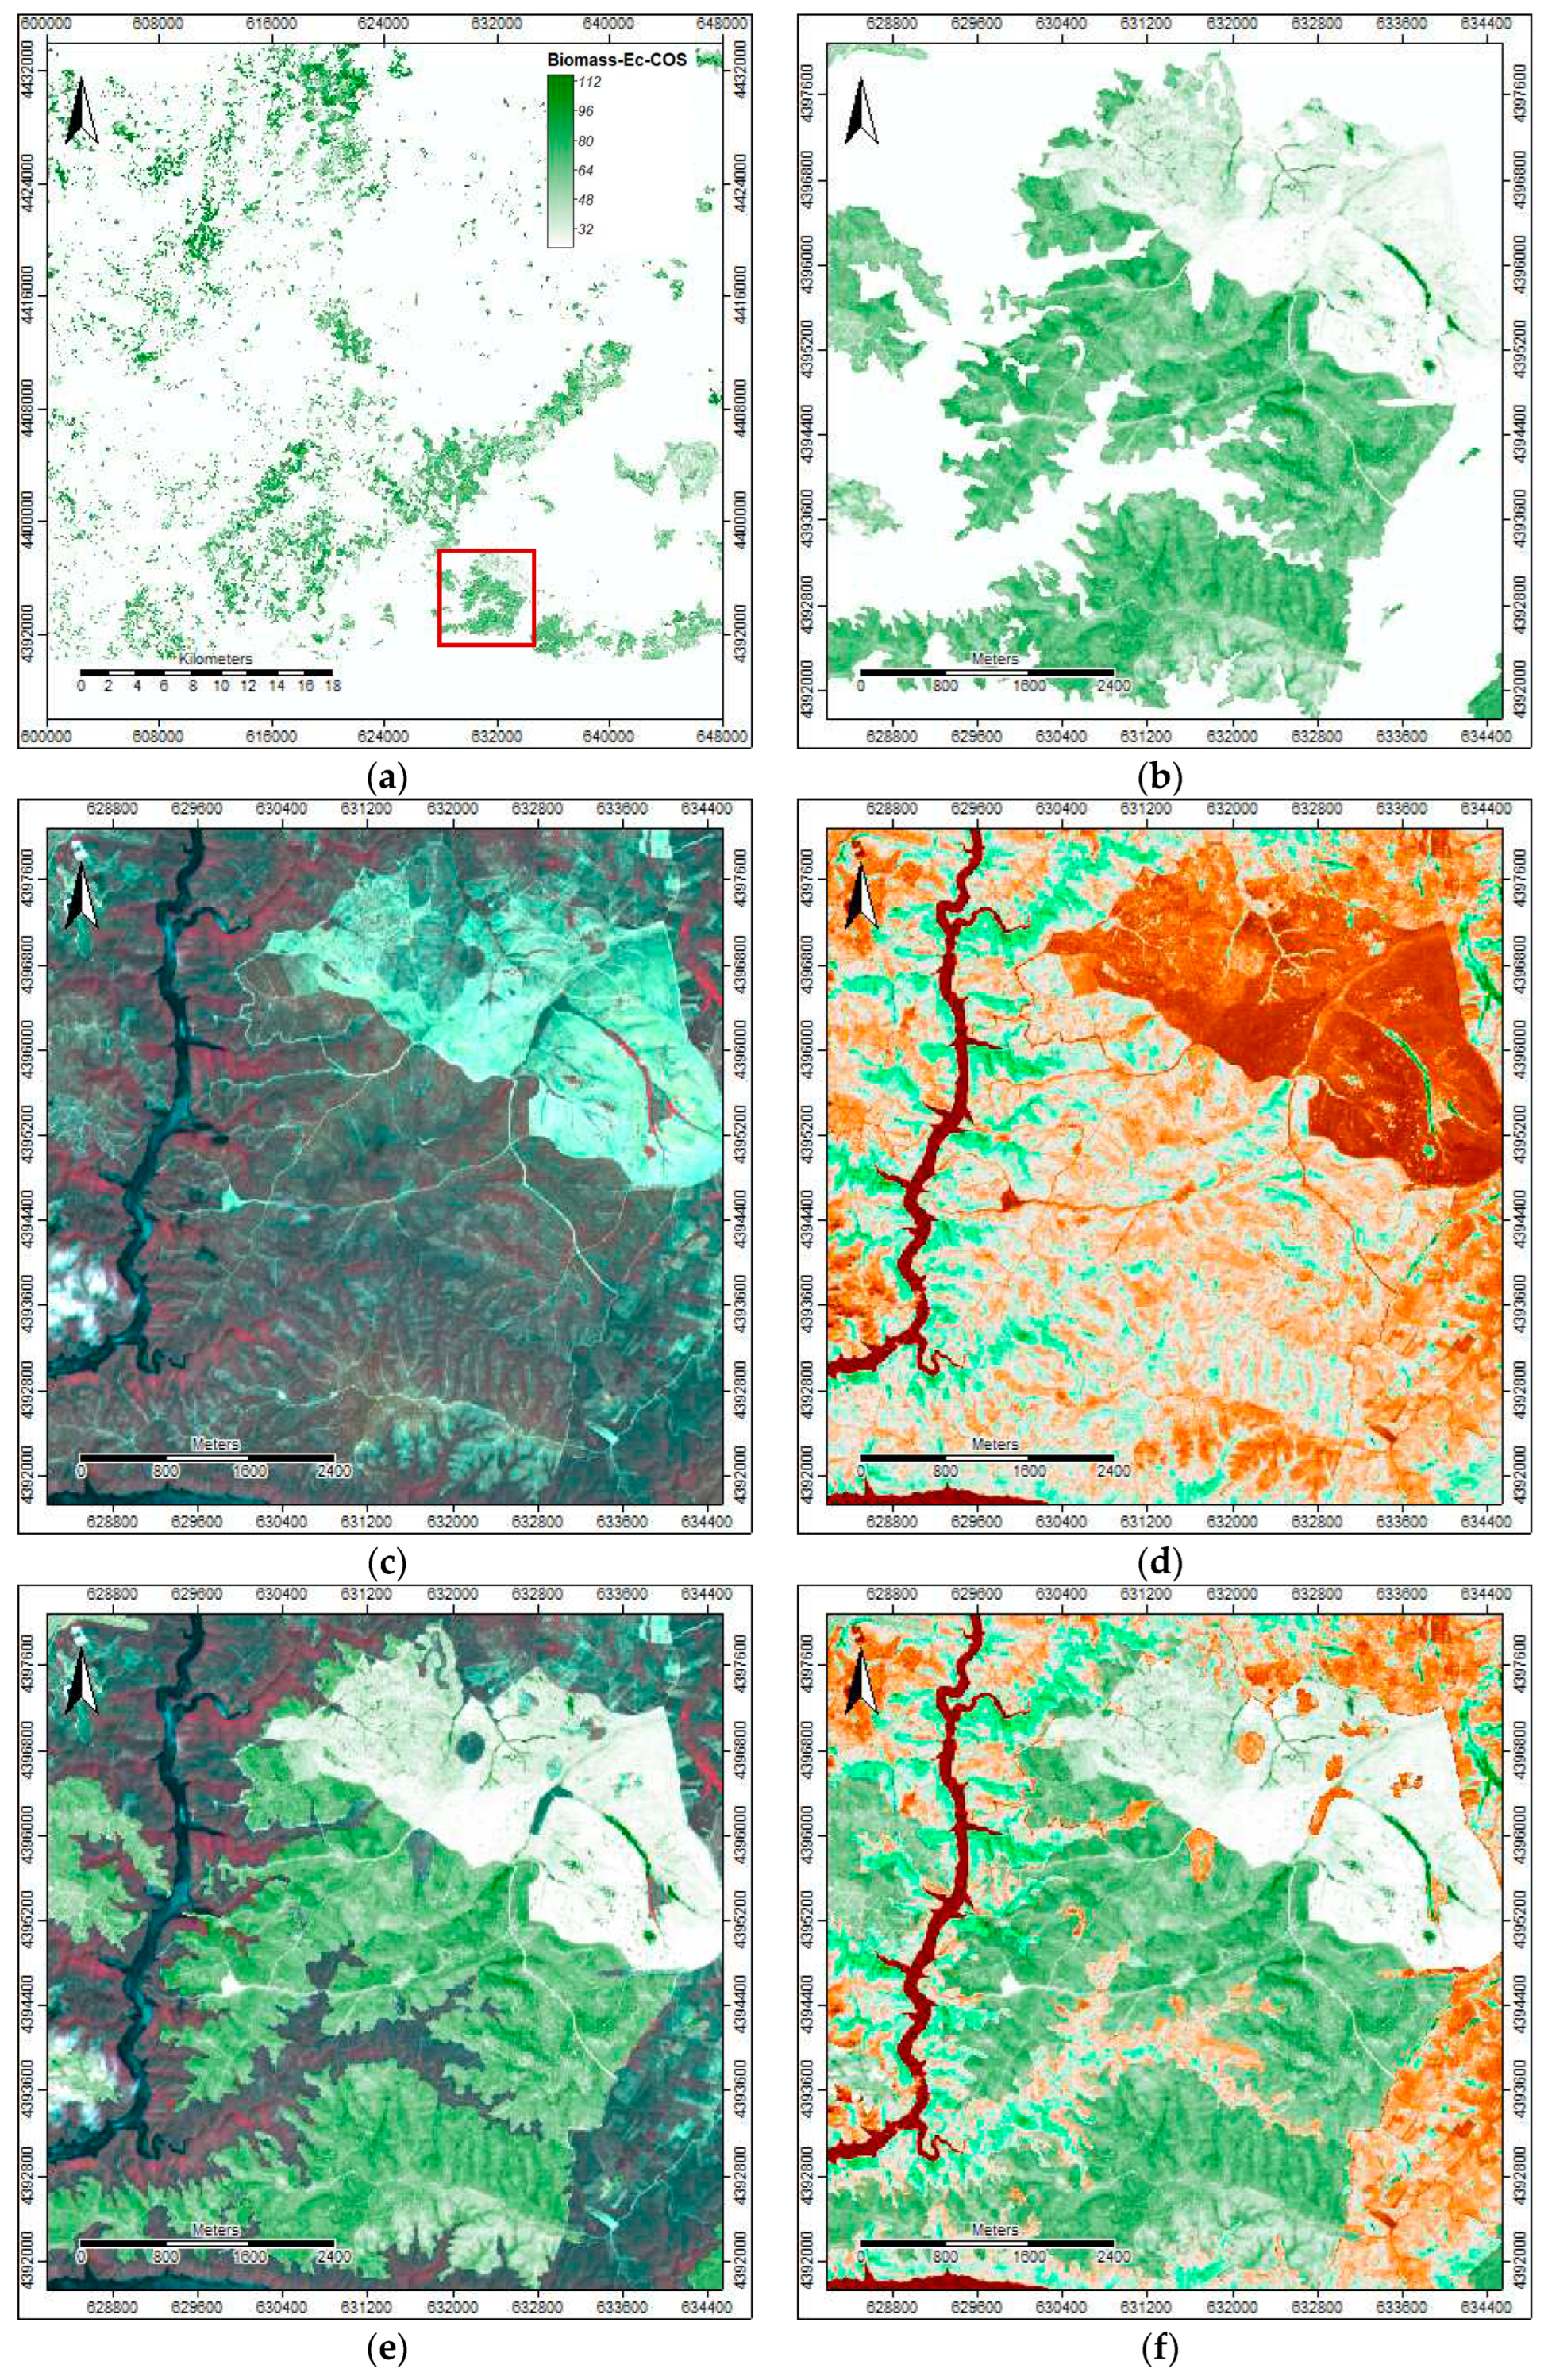
Figure 12.
Study area: (a) Shrubland AGB map; (b) AGB map–zoom; (c) FCC–zoom; (d) NDVI–zoom; (e) AGB overlay FCC–zoom; (f) AGB overlay NDVI–zoom.
Figure 12.
Study area: (a) Shrubland AGB map; (b) AGB map–zoom; (c) FCC–zoom; (d) NDVI–zoom; (e) AGB overlay FCC–zoom; (f) AGB overlay NDVI–zoom.
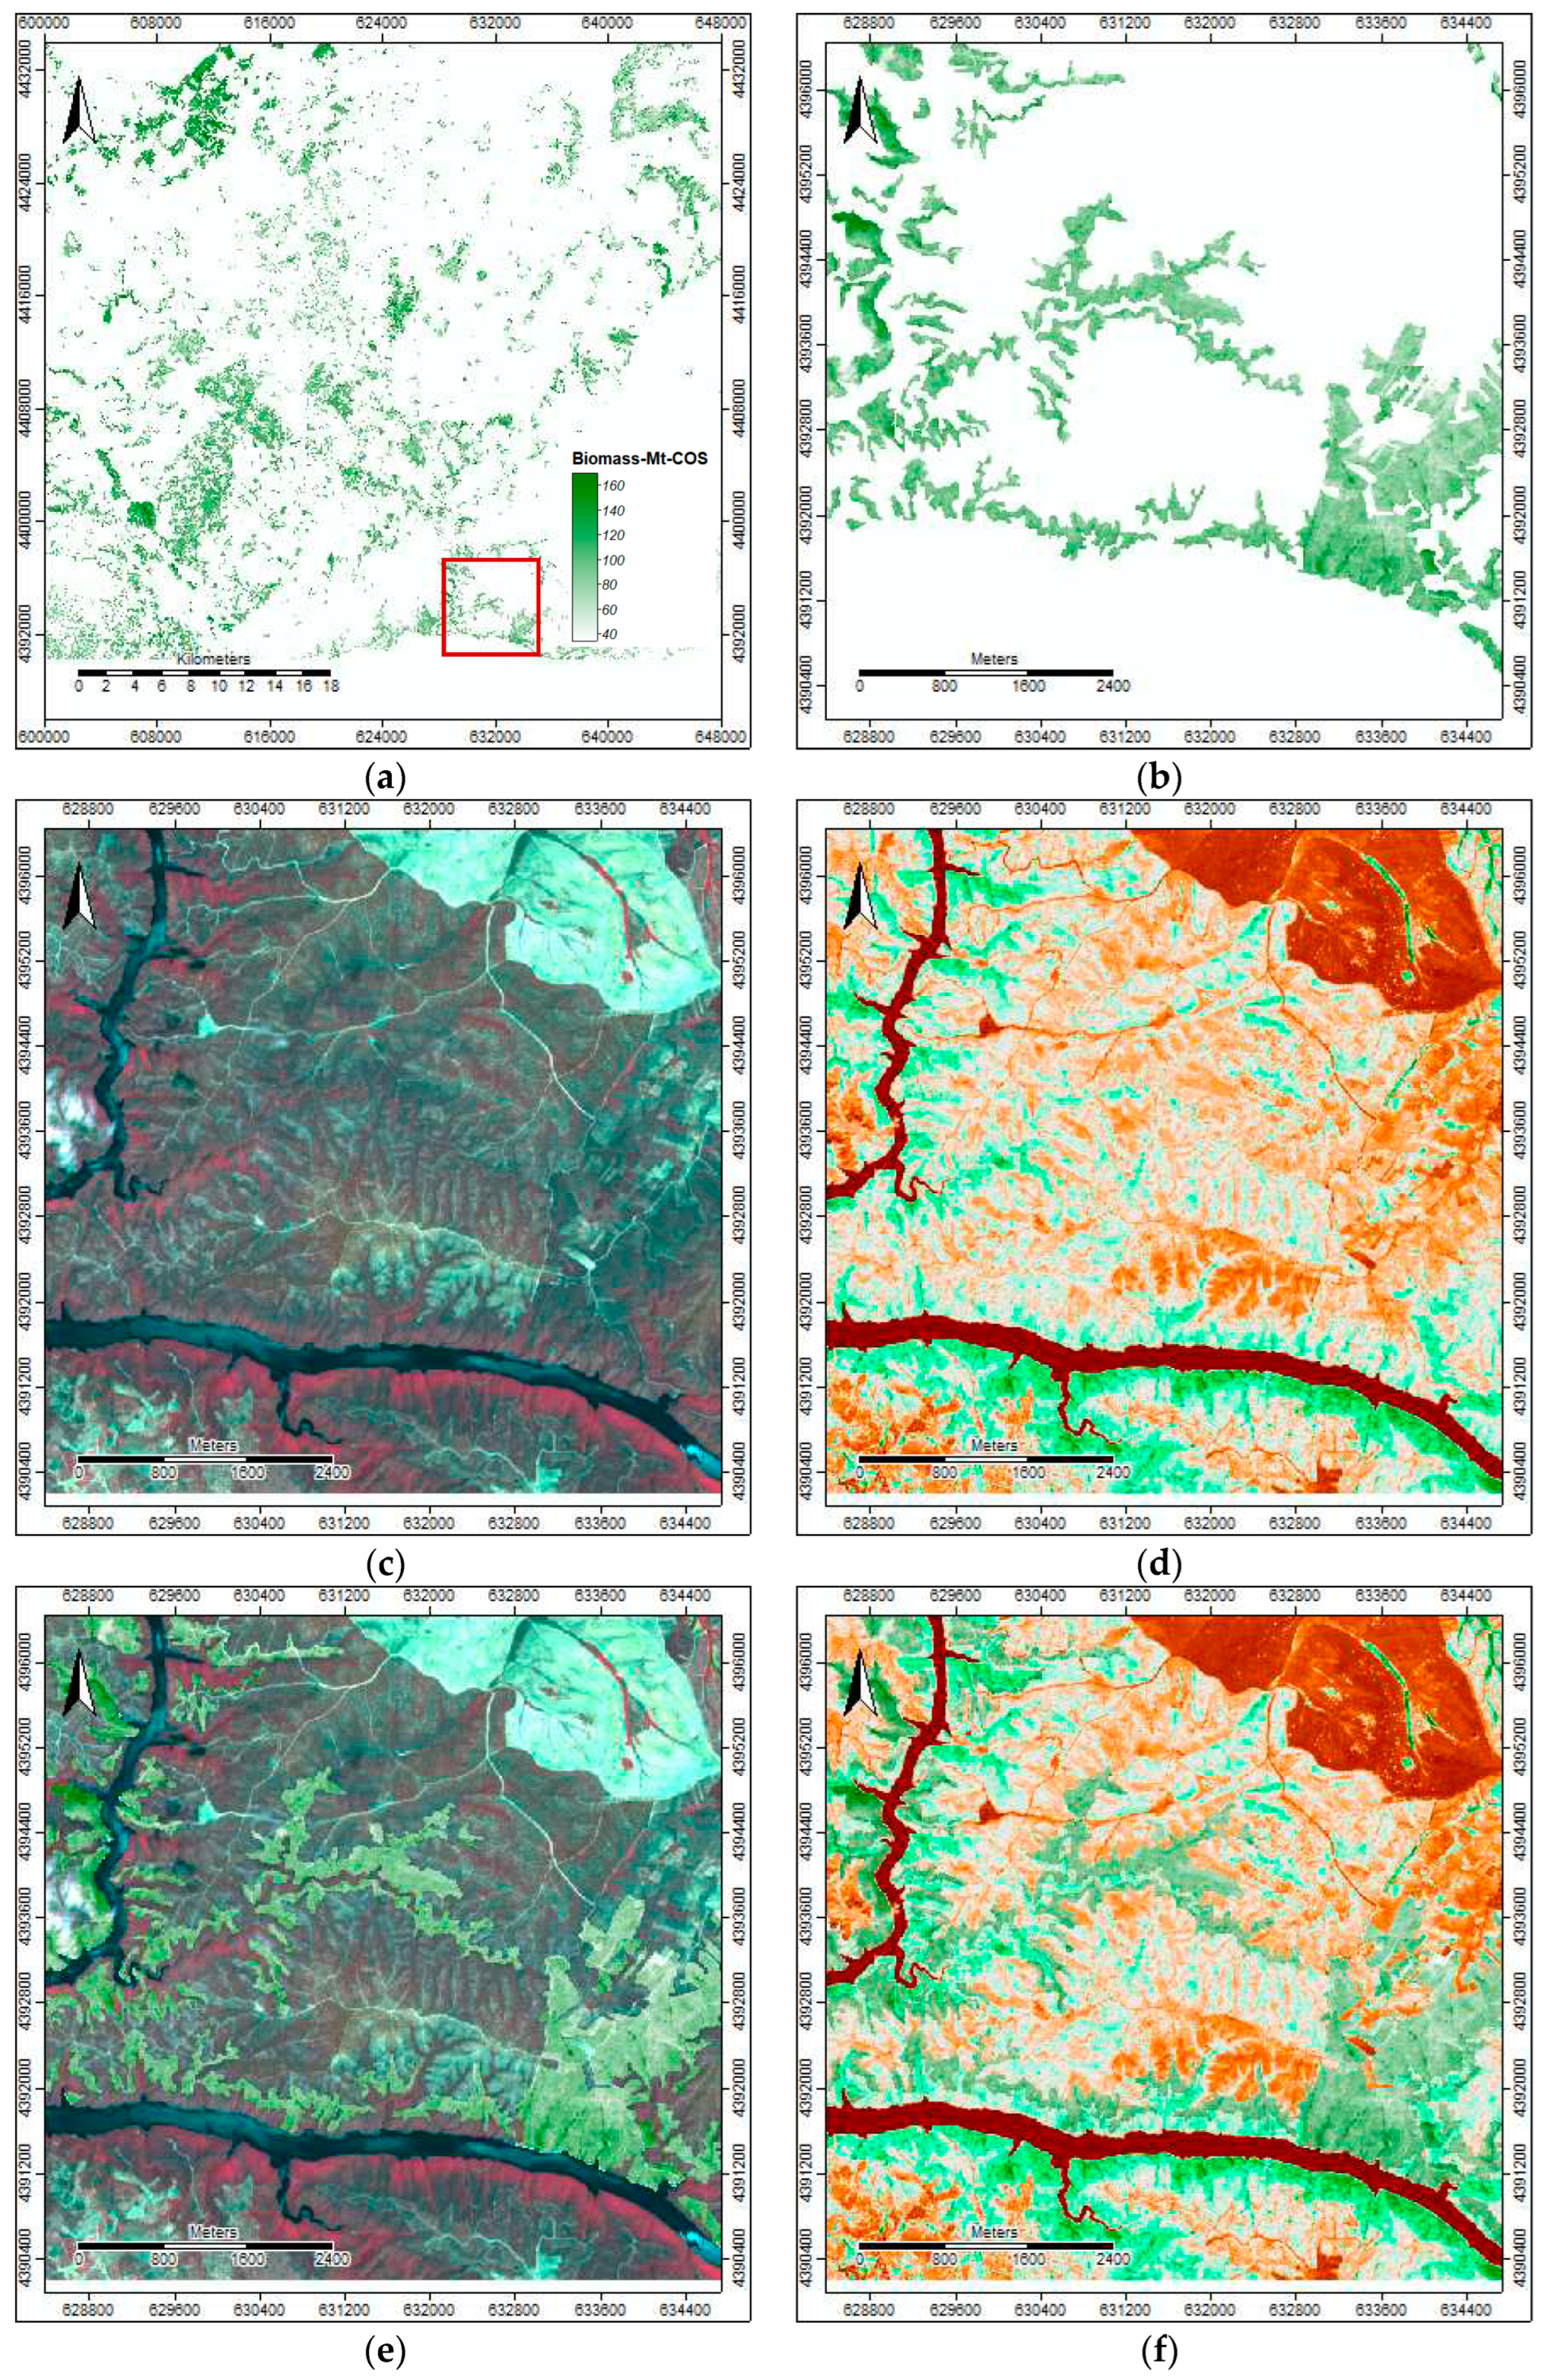
Figure 13.
Study area—fuel loads: (a) AGB—eucalypts and shrubland areas; and (b) AGB map overlaid to the elevation map (25 m spatial resolution) [37].
Figure 13.
Study area—fuel loads: (a) AGB—eucalypts and shrubland areas; and (b) AGB map overlaid to the elevation map (25 m spatial resolution) [37].
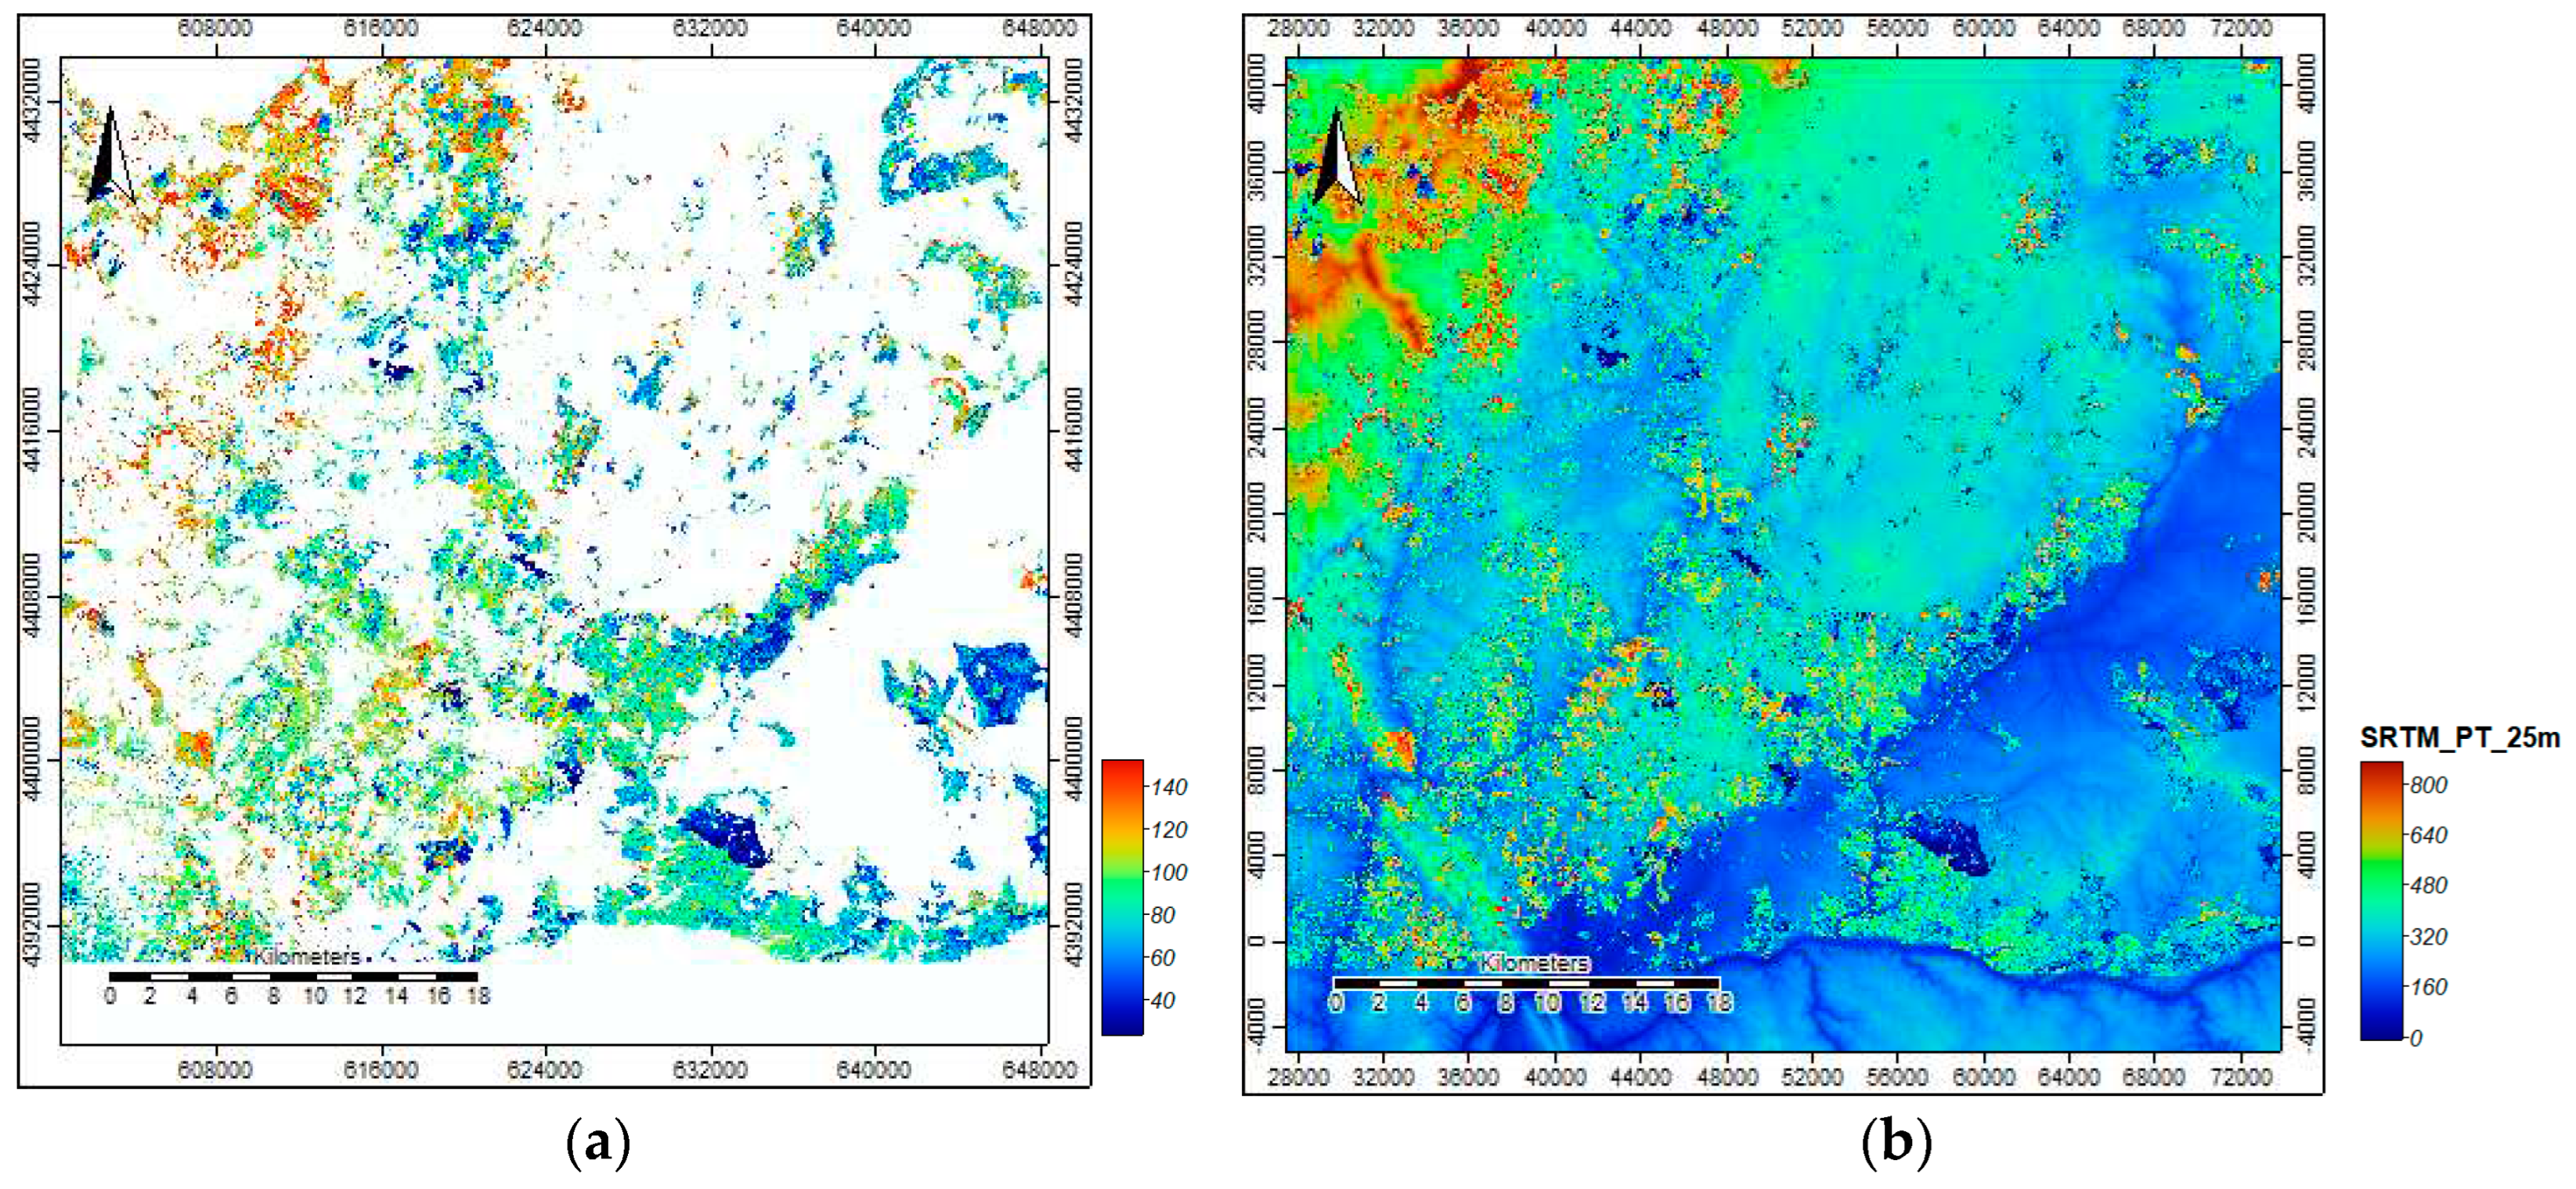
Table 1.
Sentinel-2 MSI—spectral bands and spatial resolution [31].
Table 1.
Sentinel-2 MSI—spectral bands and spatial resolution [31].
| Band | Name | Central wavelength (nm) |
Spatial resolution (m) |
|---|---|---|---|
| 1 | Coastal aerosol | 443 | 60 |
| 2 | Blue | 490 | 10 and 20 |
| 3 | Green | 560 | 10 and 20 |
| 4 | Red | 665 | 10 and 20 |
| 5 | Red-edge 1 | 705 | 20 |
| 6 | Red-edge 2 | 740 | 20 |
| 7 | Red-edge 3 | 783 | 20 |
| 8 | NIR | 842 | 10 |
| 8a | NIR narrow | 865 | 20 |
| 9 | Water vapour | 945 | 60 |
| 10 | Cirrus | 1375 | 60 |
| 11 | SWIR 1 | 1610 | 20 |
| 12 | SWIR 2 | 2190 | 20 |
Table 2.
Sentinel-2A MSI imagery—dates of acquisition.
| Year | Date of acquisition | |||||||||||
|---|---|---|---|---|---|---|---|---|---|---|---|---|
| Jan | Feb | Mar | Apr | May | Jun | Jul | Aug | Sep | Oct | Nov | Dec | |
| 2022 | 29 | 28 | 30 | 29 | 29 | 28 | 28 | 27 | 26 | 5 and 25 | ||
| 2023 | 4 | 3, 13 and 23 | ||||||||||
Table 3.
Spectral indices and ratios (spatial resolution 10 m).
| Acronym | Spectral bands | Formula | Equation |
|---|---|---|---|
| NDVI | R—red band NIR—near infrared band |
Table 4.
Individual tree biomass prediction equations for eucalypts and shrubland in Portugal [34,35].
| Variable | Equation |
| Eucalypts | |
| Stem under bark | If hdom ≤ 10.71 If hdom > 10.71 |
| Bark | If hdom ≤ 18.2691 If hdom > 18.2691 |
| Branches | |
| Leaves | |
| Aboveground | |
| Shrubland | |
| Aboveground |
Legend: d—individual tree diameter, over bark, at breast height (1.30 m above ground) (cm); h—tree total height (m); ws—stem biomass under bark (Kg); wb—bark biomass (Kg); wbr—branch biomass (Kg); wl—leaves biomass (Kg); wa—aboveground biomass (Kg); GC—shrubs ground cover (%); hs—shrub average height (cm); and Was—aboveground biomass (Mg ha−1).
Table 6.
Forest inventory—summary statistics for field sample plots in eucalypts areas (n = 30) and in shrubland areas (n = 30).
Table 6.
Forest inventory—summary statistics for field sample plots in eucalypts areas (n = 30) and in shrubland areas (n = 30).
| Variables | Min. | Max. | Mean | SD | |
|---|---|---|---|---|---|
| Eucalypts field sample plots (n = 30) | |||||
| Number of trees per ha | N (trees ha−1) | 800 | 4500 | 1923 | 799 |
| Mean diameter | dg (cm) | 3.5 | 20.6 | 9.1 | 3.2 |
| Mean height | h (m) | 6.6 | 19.2 | 12.6 | 3.3 |
| Dominant diameter | ddom (cm) | 6.0 | 26.6 | 14.1 | 4.8 |
| Dominant height | hdom (m) | 10.0 | 25.0 | 16.5 | 4.5 |
| Aboveground biomass | Wa (Mg ha−1) | 27.7 | 169.0 | 78.7 | 35.0 |
| Shrubland field sample plots (n = 30) | |||||
| Ground cover | GC (%) | 10.0 | 90.0 | 43.0 | 20.9 |
| Shrub average height | hs (m) | 50.0 | 180.0 | 117.7 | 36.5 |
| Aboveground biomass | Was (Mg ha−1) | 9.7 | 262.6 | 107.3 | 66.7 |
Legend: n—sample size; Min.—minimum; Max.—maximum; Std. dev.—standard deviation.
Table 7.
NDVI—summary statistics for the field sample plots in eucalypts areas (n = 30) and in shrubland areas (n = 30).
Table 7.
NDVI—summary statistics for the field sample plots in eucalypts areas (n = 30) and in shrubland areas (n = 30).
| NDVI | Eucalypts field sample plots (n = 30) | Shrubland field sample plots (n = 30) | ||||||||
|---|---|---|---|---|---|---|---|---|---|---|
| Date | Min. | Max. | Mean | SD | Min. | Max. | Mean | SD | ||
| 3Jun23 | 0.000 | 0.344 | 0.192 | 0.098 | 0.043 | 0.369 | 0.219 | 0.101 | ||
| 13Jun23 | 0.000 | 0.437 | 0.243 | 0.110 | 0.006 | 0.372 | 0.227 | 0.105 | ||
| 23Jun23 | 0.000 | 0.386 | 0.264 | 0.079 | 0.114 | 0.348 | 0.260 | 0.065 | ||
Legend: n—sample size; Min.—minimum; Max.—maximum; Std. dev.—standard deviation.
Disclaimer/Publisher’s Note: The statements, opinions and data contained in all publications are solely those of the individual author(s) and contributor(s) and not of MDPI and/or the editor(s). MDPI and/or the editor(s) disclaim responsibility for any injury to people or property resulting from any ideas, methods, instructions or products referred to in the content. |
© 2023 by the authors. Licensee MDPI, Basel, Switzerland. This article is an open access article distributed under the terms and conditions of the Creative Commons Attribution (CC BY) license (http://creativecommons.org/licenses/by/4.0/).
Copyright: This open access article is published under a Creative Commons CC BY 4.0 license, which permit the free download, distribution, and reuse, provided that the author and preprint are cited in any reuse.


