
Submitted:
09 April 2025
Posted:
10 April 2025
You are already at the latest version
Abstract
Wildfires serve both ecological and destructive roles—supporting biodiversity and nu-trient cycling while also threatening ecosystems and economies, especially as climate change drives increases in fire frequency and intensity. This study investigates the impact of wildfires and subsequent vegetation recovery in the Bosco Difesa Grande forest in southern Italy, focusing on the 2017 and 2021 fire events. Using Google Earth Engine (GEE), remote sensing techniques were applied to assess burn severity and post-fire re-growth. The analysis utilized Normalized Burn Ratio (NBR) and Normalized Difference Vegetation Index (NDVI) derived from Sentinel-2 imagery. Burn severity was classified through differenced NBR (dNBR), while vegetation recovery was monitored via differ-enced NDVI (dNDVI) and multi-year NDVI time series. Results show that low-severity zones recovered more quickly than high-severity areas, which often failed to regain pre-fire vegetation levels. These findings suggest a potential shift from forested areas to shrubland or mixed vegetation in severely burned zones. Key recovery influencers in-clude climate variability, soil erosion, and repeated fire exposure. This study highlights the value of remote sensing for post-fire assessment and emphasizes the need for adaptive land management and ecological restoration strategies to support long-term ecosystem resilience in Mediterranean fire-prone landscapes.
Keywords:
wild fire
; burn severity
; vegetation recovery
; google earth engine
; vegetation indexes
; bosco difesa grande
1. Introduction
Wildfires serve an important function in many ecosystems, helping to maintain ecological balance, promote biodiversity, and aid in natural regeneration. In ecosystems predisposed to recurrent fire, such as certain woods and grasslands, flames sweep out dead matter, reduce competition, and recycle nutrients, providing circumstances that stimulate new growth [1,2]. Although vegetation fires are an important part of the Earth’s ecosystem, they can also result in significant economic losses, severe air pollution, human fatalities, and environmental harm. Human activities and climate change are having an increasing impact on fire regimes [3,4]. Anthropogenic climate change is significantly increasing the frequency, intensity, and size of wildfires. Warmer temperatures and drier conditions lead to more extreme fire weather, which includes higher temperatures, lower humidity, and stronger winds. These conditions facilitate faster and more intense fire spread[5]
Fire patterns have historically been influenced by climate variability, with fires being more common in drier-warmer climates [6]. Fire pattern refers to the spatial and temporal distribution of wildfires, including their frequency, size, intensity, and spread dynamics, which are affected by elements such as climate, vegetation, and topography[7]. Recent research based on sedimentary charcoal data in central Italy demonstrates the presence of high-frequency fire periods, lasting 300-500 years, related to dry summers through the Holocene[8]. The Mediterranean region has historically experienced significant wildfires, accounting for 90% of Europe’s total burned area[9]. The Mediterranean climate’s extended drought and high summer temperatures are distinguishing factors that define the temporal and spatial limitations of the major fire season [10]. Many plant species in fire-prone habitats are adapted to specific fire regimes that correlate to historical conditions, and movements beyond these limits can have serious consequences for vegetative regrowth and long-term species persistence[11]. The rate of vegetation regeneration following a wildfire differs greatly depending on the severity of the fire, ecosystem type, and other factors such as climate and soil conditions[12]. Landscapes and vegetation are naturally variable over time, constantly adjusting to variations in climate and other factors [13]. High-severity wildfires cause extreme alterations in vegetation cover and land surface properties [14,15].
Monitoring vegetation conditions and functioning with remote sensing is key to a wide range of disciplines, from precision agriculture to global carbon cycle research[16]. Earth observation through satellite remote sensing allows monitoring of current or real-time terrestrial vegetation status, phenology, and its health globally, by deriving spatially explicit and temporally resolved data[17]. Although RS-derived spectrum metrics offer no information on post-fire vegetation structural changes, they are a useful tool for tracking spectral vegetation changes and contributing to time-series analysis of post-fire vegetation recovery[18].
Vegetation indices, particularly NDVI, generally act as indicators of vegetation growth and ecosystem change [19,20] NDVI is widely used for various practical applications, including burn and vegetation regrowth monitoring [21] and it is the most widely used index for evaluating vegetation health and density[20]. However, there is evidence in some places that NDVI can capture vegetation post-fire trends [20], however in other locales, such as Mediterranean or boreal forests, additional satellite analysis and field data are needed to test its accuracy and applicability deeper[22]. The NDVI is susceptible to the first signs of canopy greening and the early stages of vegetation recovery; nevertheless, it saturates when a dense grass cover dominated by herbaceous pioneer species establishes on newly burned soil, causing it to be less effective as an alternative for post-fire vegetation structure and tree cover in some regions[23]. The post-fire vegetation recovery duration can vary depending on a variety of factors such as vegetation type, fire severity, post-fire weather events, and ecoregion. Recovery times typically range from a couple of years for Mediterranean shrublands with resprouting potential to decades in boreal forests [24]. NBR is another common vegetation index that can be used to locate and analyze burned areas, NBR is specifically intended for post-fire assessments, emphasizing the contrast between NIR and SWIR, which NDVI cannot capture in severely burned regions[25]. These two indices are the most commonly used indices for determining fire severity levels and vegetation regrowth[25,26,27,28,29,30].
The objective of this research is to examine post-wildfire vegetation burn and recovery using remote sensing techniques and Google earth engine platform, comparing the NDVI and NBR in various burn zone The study aims to detect post-fire plant changes using NDVI and NBR, as well as analyze regrowth patterns across varied fire severity and ecosystem types. This can help shape future wildfire recovery studies and land management policies.
2. Materials and Methods
2.1. Study Area
This study focuses on the "Difesa Grande" forest in southern Italy, roughly 6 km south of Gravina. Covering around 1890 hectares (Figure 1), it is one of Apulia’s most important woodland complexes, a Site of Community Importance (SCI) rich in ecosystems, flora, and fauna species of conservation concern[31]. Morphologically, the forest is situated in a hilly landscape within the Bradano River’s catchment area, bordered by the Basentello and Gravina tributaries to the west and east, respectively [32]. The elevation ranges from 245 to 466 meters above sea level. This area represents a remnant of the vast mesophytic forest that once covered much of Puglia during the early middle Holocene. Due to its significant ecological value, Bosco Difesa Grande has been designated as a Site of Community Importance, as indicated by the Ministerial Decree of 2000[32,33] (Bosco Difesa Grande, Site of Community Importance of Gravina - Puglia.com). The Ministerial Decree of 2000 designates Bosco Difesa Grande as a Site of Community Importance (SCI) due to its significant ecological value. This classification highlights the area’s rich biodiversity, conservation importance, and protected status within the European Union’s Natura 2000 network. The decree likely imposes regulations to protect the forest from environmental threats, including wildfires, deforestation, and land degradation, while promoting sustainable management and restoration efforts.
The study area frequently experiences fires, with several recent small to large burning events impacting the region. Table 1 shows the number and dates of fire incidents in the research area, including the two most recent fire events.
The most recent fires, in 2017 and 2021, have affected many hectares of forest, resulting in significant post-fire consequences for vegetation recovery, therefore these events have been selected as the focus of our analysis.
Climate unpredictability has grown more obvious in Gravina, Puglia, Italy, a region known for its Mediterranean climate. Rising temperatures, altered precipitation patterns, and more extreme weather events all reflect the broader effects of climate change in Southern Italy[34].
In Figure 3, the top graph depicts the temperature anomaly for each month from 1979 and the present, comparing recorded temperatures to the 30-year climatic mean (1980-2010). The red-shaded months have higher temperatures than the blue-shaded months. Warmer months have increased over time, mirroring the overall warming trends related with climate change in Southern Italy. The bottom graph depicts the precipitation anomaly for the same time period, displaying monthly rainfall differences from the 30-year average. Green-shaded months reflect wetter-than-average circumstances, whereas brown-shaded months represent drier seasons. These changes emphasize altering precipitation patterns, which, together with rising temperatures, add to the region’s climate unpredictability[34,35]. To investigate the effect of fire on vegetation burn and regeneration in the region, we separated the entire forest area into four unique regions. Figure 2 depicts the four regions in the study area; NDVI time series analysis is performed for each of them with no fire, one fire in 2017 and one fire in 2021, and a region overlapped with two incidents of fire in both 2017 and 2012(Figure 2).
2.2. Burned severity and Vegetation Recovery
To effectively evaluate the extent of fire damage and assess the potential for future destruction, a detailed survey of the region is essential[30,36]. Various mapping techniques have been explored and tested[37], relying on the spectral signature variations of fire-impacted surfaces. Typically, short-wave infrared (SWIR) reflectance increases while red and near-infrared (NIR) reflectance decreases in burned areas [38]. Several reflectance indices derived from digital satellite data are utilized to describe the phytosociological characteristics of vegetation[39]. Recently, cloud-based resources like Google Earth Engine have garnered global attention due to their ability to provide rapid and accurate analysis on several RS images referred to time stacks[29,40]. Therefore, GEE is used to detect post-fire vegetation burn and recovery in fire-prone environments. For this purpose, we calculated the two most commonly applied indices: normalized difference vegetation index (NDVI and dNDVI), normalized difference burn ratio (NBR and dNBR) [37,41](Table 2). In particular, NDVI can be used to assess vegetation health and dNDVI to measure post-fire vegetation loss and recovery, while NBR and dNBR are more effective for assessing burn severity by capturing fire-induced changes in vegetation and soil properties. Together, these indices provide a comprehensive view of fire impact and post-fire regeneration. Furthermore, this study looks at the temporal correlations between fire episodes and post-fire vegetation recovery in the Bosco Difesa Grande region, utilizing zonal statistics for each burn severity class in the first, second, and third years after the fire.
One of the most popular change detection approaches is the differentiation of single band indices obtained from multispectral pre- and post-fire images. The change detection analyses examine how to map the impacts of wildland fire on plants using NDVI and NBR. Burn severity can be estimated by subtracting the post-fire value from the pre-fire value (22,37,38). This yields a measure of absolute change. The difference between the NDVI and the NBR images are calculated so that it can be seen which regions have changed in which direction. In addition, the dNDVI and dNBR indexes can also provide information on vegetation regeneration. The dNBR index is very useful to identify burned surfaces and determine burn severity levels [44,45]. One of the most often utilized algorithms for change detection is the distinction of single band indices from multispectral images before and after a fire event. The NBR index considers the NIR and SWIR spectral areas, which are less sensitive to atmospheric influences and may effectively predict the damaged vegetation and the canopy moisture loss (a decrease in NIR regions and an increase in SWIR region in the post-fire scenario)[45]. Additionally, this index might include details on vegetation regeneration. The fire scar will start to reflect a stronger signal in the near-infrared (NIR) section of the spectrum once vegetation regeneration has started since healthy plants reflect significantly in this area of the spectrum because of the characteristics of chlorophyll. As a result, negative dNBR values suggest vegetation regeneration[46,47].
The NDVI classification pixel range indicates different levels of vegetation density. In general, its values are negative for water bodies, close to zero for rocks, sands, or concrete surfaces, and positive for vegetation, including crops, shrubs, grasses, and forests. In other words, greater NDVI values mean stronger implications for vigorous vegetation greenness[48]. NDVI always ranges from -1 to +1. But there isn’t a distinct boundary for each type of land cover. For example, when you have negative values, it is highly likely that it is water. On the other hand, if you have an NDVI value close to +1, there’s a high possibility that it’s dense green leaves [30]. But when NDVI is close to zero, there are likely no green leaves and it could even be an urbanized area[18].
NBR is a different band ratio that uses the near-infrared and short-wave infrared bands and is similar to the NDVI. Higher NBR values imply healthy vegetation cover in a given area, whereas Lower NBR levels indicate bare ground or recently burned areas [31], NBR is a significant and well-respected method for identifying burned areas in large fire zones [32,33]. The near-infrared (NIR) and short-wave infrared (SWIR) bands are combined in this method.
The spectral bands of the Near Infrared (NIR) and Shortwave Infrared (SWIR) are important for identifying burned areas. NIR emphasizes variations in leaf burn brightness and canopy cover while SWIR identifies variations in landscape dryness [34]. After a fire, the NIR reflectance sharply drops, as a result of the vegetation being destroyed; nevertheless, the SWIR reflectance rises as a result of the fire removing water-retaining plant cover [35]. The Differenced Normalized Burn Ratio (dNBR) was used to assess burn severity. Thresholds for severity classification were adapted from the European Forest Fire Information Service (EFFIS)[49](Table3). According to previous studies, the dNDVI index is divided into six classes to measure burn severity [50](Table3). dNBR is more successful at determining burn severity shortly following a fire. dNDVI is beneficial for monitoring post-fire vegetation recovery, however it may be less effective for discriminating between severe burns. Thus, we applied dNBR for burn severity analysis and dNDVI for vegetation recovery. Creating Burn Severity Maps is critical for successful wildfire management and ecological restoration. These maps give essential information about the immediate and long-term effects of fires on different ecosystems. For example, the National Park Service emphasizes that satellite-derived burn severity maps are vital tools for both fire and resource management, particularly in remote regions [51].

Table 3.
Approximate dNBR and dNDVI Burn Severity levels.
| dNBR < 0.100 | dNDVI < 0.07 | Very Low/ Unburened |
| 0.100 ≤ dNBR ≤ 0.255 | 0.08 ≤ dNDV ≤ 0.13 | Low |
| 0.256 ≤ dNBR ≤ 0.419 | 0.13 ≤ dNDV ≤ 0.20 | Moderate |
| 0.420 ≤ dNBR ≤ 0.660 | 0.33 ≤ dNDV ≤ 0.44 | High |
| dNBR > 0.660 | dNDV > 0.45 | Very High |
3. Results and Discussion
To gain a comprehensive understanding of vegetation changes across the four distinct zones in the study forest, we utilized Google Earth Engine to generate time-series analyses of NDVI and NBR for each section.
3.1. Time Series of Mean NDVI and NBR
A time series analysis of mean NDVI (Normalized Difference Vegetation Index) and NBR (Normalized Burn Ratio) provides information about vegetation health and changes over time [52], [53]. The burn zone has a significant decline in NDVI and NBR shortly after the fire, followed by a gradual recovery. Figure 4a, b and d show a severe reduction in both indices; mean NBR values dropped below zero during fire events. Figure 4a further shows that the region underwent one fire incident in August 2017 and vegetation recovered well three years later, although there was a tiny reduction in 2022 that hadn’t been caused directly by wildfire and may be the impact of other factors like climate variability.
Figure 4b displays two distinct sharp declines in both NDVI and NBR, corresponding to two fire events. Following each fire, both indices gradually recover, with NDVI rebounding more quickly. NDVI remains consistently higher than NBR, indicating post-fire vegetation regrowth. The second fire appears to be more severe, as the NBR value drops below zero, and its recovery is notably slower, remaining around zero even a year after the fire. Figure 4c represents the unburned zone over the research period, whereas the time series demonstrates seasonal and annual changes. The time series chart in 2018 shows a reduction that could be attributed to indirect fire effects: Even though this area was not directly burned, surrounding fires may have had an impact on vegetation health due to variables such as smoke, ash deposition, or heat stress, all of which can affect photosynthetic activity and moisture[54]. High-severity burns caused higher daily maximum temperatures and vapor pressure deficits in nearby unburned areas, affecting the local microclimate[55]. Figure 4d shows the region that was burned in 2021. Following the fire, the NDVI progressively increases, indicating a sluggish but persistent vegetation recovery process. The persistent rise in NDVI implies vegetation regeneration, which is most likely being driven by post-fire biological succession, seed germination, and resprouting of surviving plants. However, the recovery rate appears to be slower than before the fire, which could be attributable to burn severity, soil degradation, or environmental circumstances that affect regeneration[56].
3.2. Burn Severity
Burn severity for the two fire events was assessed using the dNBR and dNDVI indices. The final burn severity map was classified based on the thresholds outlined in Table 3.
3.3. Burn Severity and Vegetation Regrowth
The post-fire vegetation recovery has been assessed by evaluating NDVI trends using time series analysis[18,52]. Indices were calculated for periods before and after each fire event and the median values were aggregated into a single raster layer. The timeframe is determined by the availability of sentinel data beginning in 2015.
In order to comprehend the vegetation recovery process among distinct burn severity classifications, the responses of spectral indices throughout a three-year post-fire period were examined using zonal statistics (Figure9).
One year after the 2017 fire (Figure 9a), NDVI begins to increase at all burn severity levels, however the rate of recovery varies. Areas with extremely low and low severity recover faster, with NDVI values approaching pre-fire levels. Moderate severity zones exhibit a gradual increase while remaining below their original values. High and very high severity zones have a delayed recovery, with NDVI remaining much lower. Vegetation recovery is progressing at all severity levels, with low and very low severity areas approaching pre-fire NDVI levels, moderate severity improving but lagging, and high to very high severity recovering the slowest.
We expect a similar trend for the 2021 fire event. Recovery speed diminishes with burn severity; very low and low-severity areas recover quickly, approaching pre-fire NDVI levels, but moderate zones show consistent improvement. High and extremely high severity areas show protracted recovery, with NDVI still lagging three years later. A slight decrease in NDVI across all burn severity classifications after three years could be ascribed to a variety of variables and requires further research. The decline in NDVI across all burn severity classes after three years could be attributed to climatic variability (e.g., drought or seasonal shifts), post-fire soil degradation that reduces nutrient availability, natural vegetation succession where early colonizers decline, or secondary disturbances such as pests, disease, or human activities (e.g., grazing or logging). These factors cumulatively impede long-term vegetation regrowth, resulting in the observed NDVI reduction[58,59].
3.4. Vegetation Recovery Evaluation in Burn and Nonburn Regions
Before the fire in August 2017, NDVI values were high, suggesting dense and healthy vegetation, with the peak in the higher NDVI range. In the event of a fire, the peak changes to the lower NDVI range, representing fire-damaged vegetation. One year after the fire, NDVI remained low, with modest recovery and varying regrowth over the area. NDVI gradually increased over 2-6 years, however values remain below 0.7, indicating that recovery was incomplete. Instead, NDVI stabilized between 0.4 and 0.6, indicating a shift from dense forest to mixed vegetation. This shift suggests that following major fires, forests may not fully rebound, potentially resulting in long-term vegetation change (Figure10a). Several factors could explain the change in NDVI after big fires. Fire severity and frequency are important, as recurrent or high-intensity burns can change species composition, favoring fire-resistant shrubs and grasses over thick forests[60].Soil deterioration and nutrient availability changes following a fire can further hinder forest recovery[61].Furthermore, climate change-induced alterations in temperature and precipitation patterns may make circumstances less conducive for forest regrowth, resulting in chronic mixed vegetation states[62].Hydrological changes, such as decreased soil moisture retention, can also lead to delayed or incomplete forest regeneration[63]. Finally, human activities such as land use change, logging, and grazing can stymie natural regeneration efforts. These combined considerations indicate that, in certain circumstances, forests may not fully recover from severe wildfires, potentially leading to long-term ecological shifts.
Before the fire in July 2021, NDVI measures are high, with a peak over 0.7, indicating dense, robust vegetation, most likely a mature forest. The NDVI values drop to the lower range (0.2-0.4), indicating serious vegetation loss and degradation. One year after the fire, the NDVI stays low but gradually increases. The peak is broader, implying that recovery rates vary across locations. Two years after the fire, the NDVI climbs further, reaching a peak of 0.5-0.6, suggesting moderate regeneration. Three years post-fire the NDVI peak remains between 0.4 and 0.5, indicating that vegetation is stabilizing in the lower NDVI range. The absence of NDVI readings above 0.7 indicates that the forest has not completely recovered (Figure10b).
Figure 10.
Yearly Frequency Distribution of NDVI Values (2016–2024) in region hit by fire in 2017 (a), Yearly. Frequency Distribution of NDVI Values (2016–2024) in region hit by fire in 2021 (b).
Figure 10.
Yearly Frequency Distribution of NDVI Values (2016–2024) in region hit by fire in 2017 (a), Yearly. Frequency Distribution of NDVI Values (2016–2024) in region hit by fire in 2021 (b).
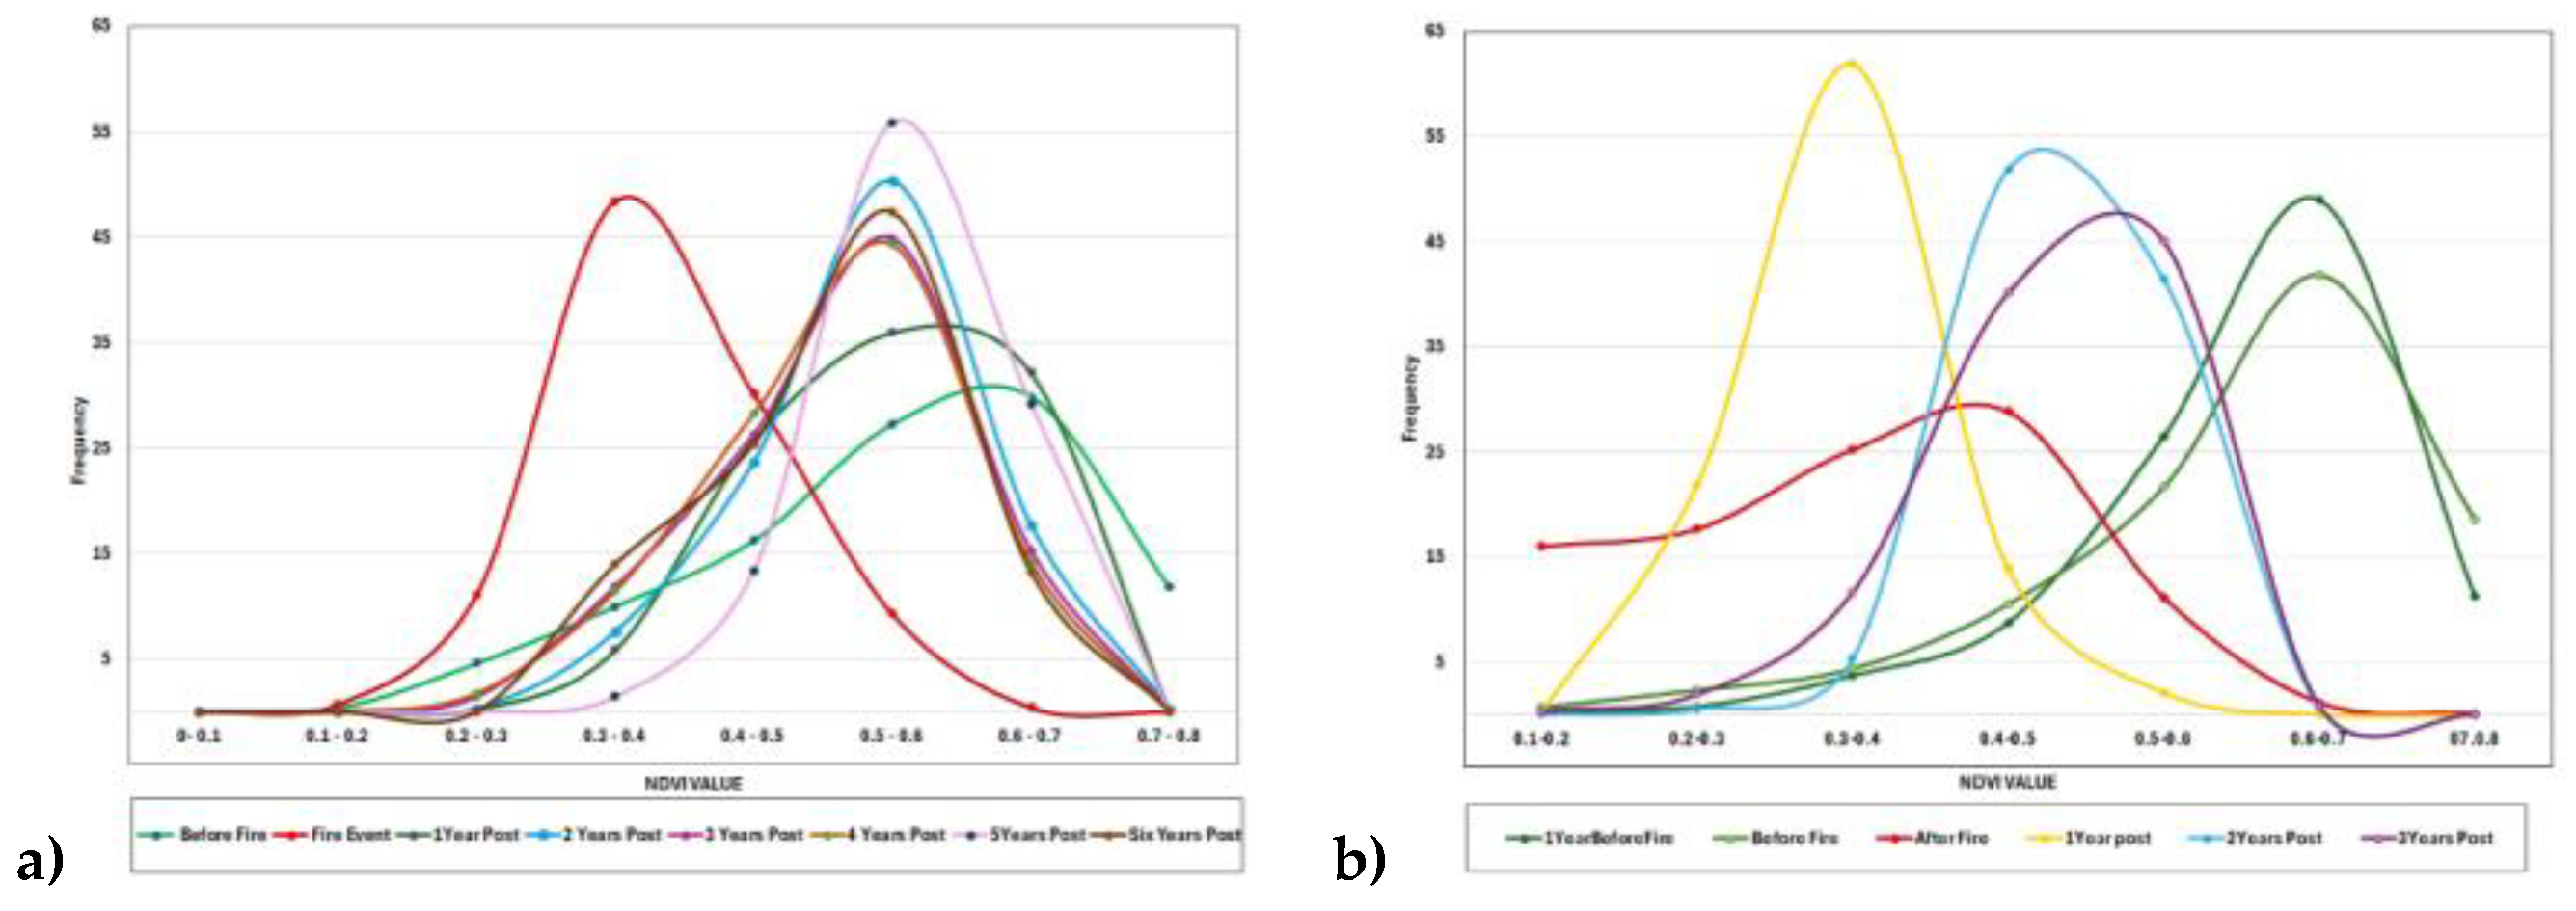
Overlapped burned areas from August 2017 and 2021 are shown in two separate charts for each fire occurrence (Figure11a, b), in this area before the fire in 2017, NDVI values were high, peaking at 0.6-0.7, suggesting dense growth and a healthy forest. After the fire, NDVI readings changed dramatically to the left (below 0.4), indicating significant plant loss and increasing bare ground. One year after the fire, NDVI levels begin to recover, drifting rightward toward 0.5.
Two years post-fire, NDVI continues to rise, with a peak at 0.55-0.6, indicating considerable vegetation recovery. NDVI values three years after fire peaks around 0.6, bringing it closer to pre-fire conditions but still lacking readings above 0.7. The greatest NDVI values (above 0.7) remain absent after the fire, indicating that the canopy has not fully recovered. The shift in peak NDVI values suggests a change in vegetation type, such as shrubland or open woodland, rather than dense forest. If this pattern continues, the post-fire ecology may stabilize with lower vegetation density than before the fire (Figure11a). After the July 2021 fire in this same area (Figure 11b), similar trends were observed across both fire events, reinforcing the idea that high-severity fires can hinder full forest recovery. This pattern suggests that repeated intense fires may alter ecosystem dynamics, potentially leading to long-term shifts in vegetation structure and composition.
The NDVI values are divided into three groups: 0.4-0.6, 0.6-0.7, and 0.7-0.8. Most years have a bell-shaped distribution, peaking in the 0.6-0.7 NDVI range, indicating that the majority of vegetation falls into this category (Figure12a), the highest value of NDVI (0.7-0.8) which represents the densest and healthiest vegetation occurs in 2016, 2017 and 2020 and after 2020 it declines to almost to zero for the rest of the period (Figure12b). The 0.4-0.6 NDVI class rises in some years (2018 2022 and 2024), which may indicate periods of vegetative stress, degradation, or environmental disturbances. The chart illustrates that high NDVI levels (0.7-0.8) are decreasing while moderate NDVI values (0.6-0.7) are increasing. A decline in high NDVI values (0.7-0.8) combined with an increase in moderate NDVI values (0.6-0.7) may suggest a transition from a tree-dominated ecosystem to one that includes more shrubs or mixed vegetation. This pattern indicates a decrease in thick, healthy vegetation and an increase in thinner or stressed vegetation [11,52].
Figure 12.
Yearly frequency distribution of NDVI values (a) Temporal trends in NDVI frequencies in three value classes (b) both charts for non-burned region in period of (2016–2024).
Figure 12.
Yearly frequency distribution of NDVI values (a) Temporal trends in NDVI frequencies in three value classes (b) both charts for non-burned region in period of (2016–2024).
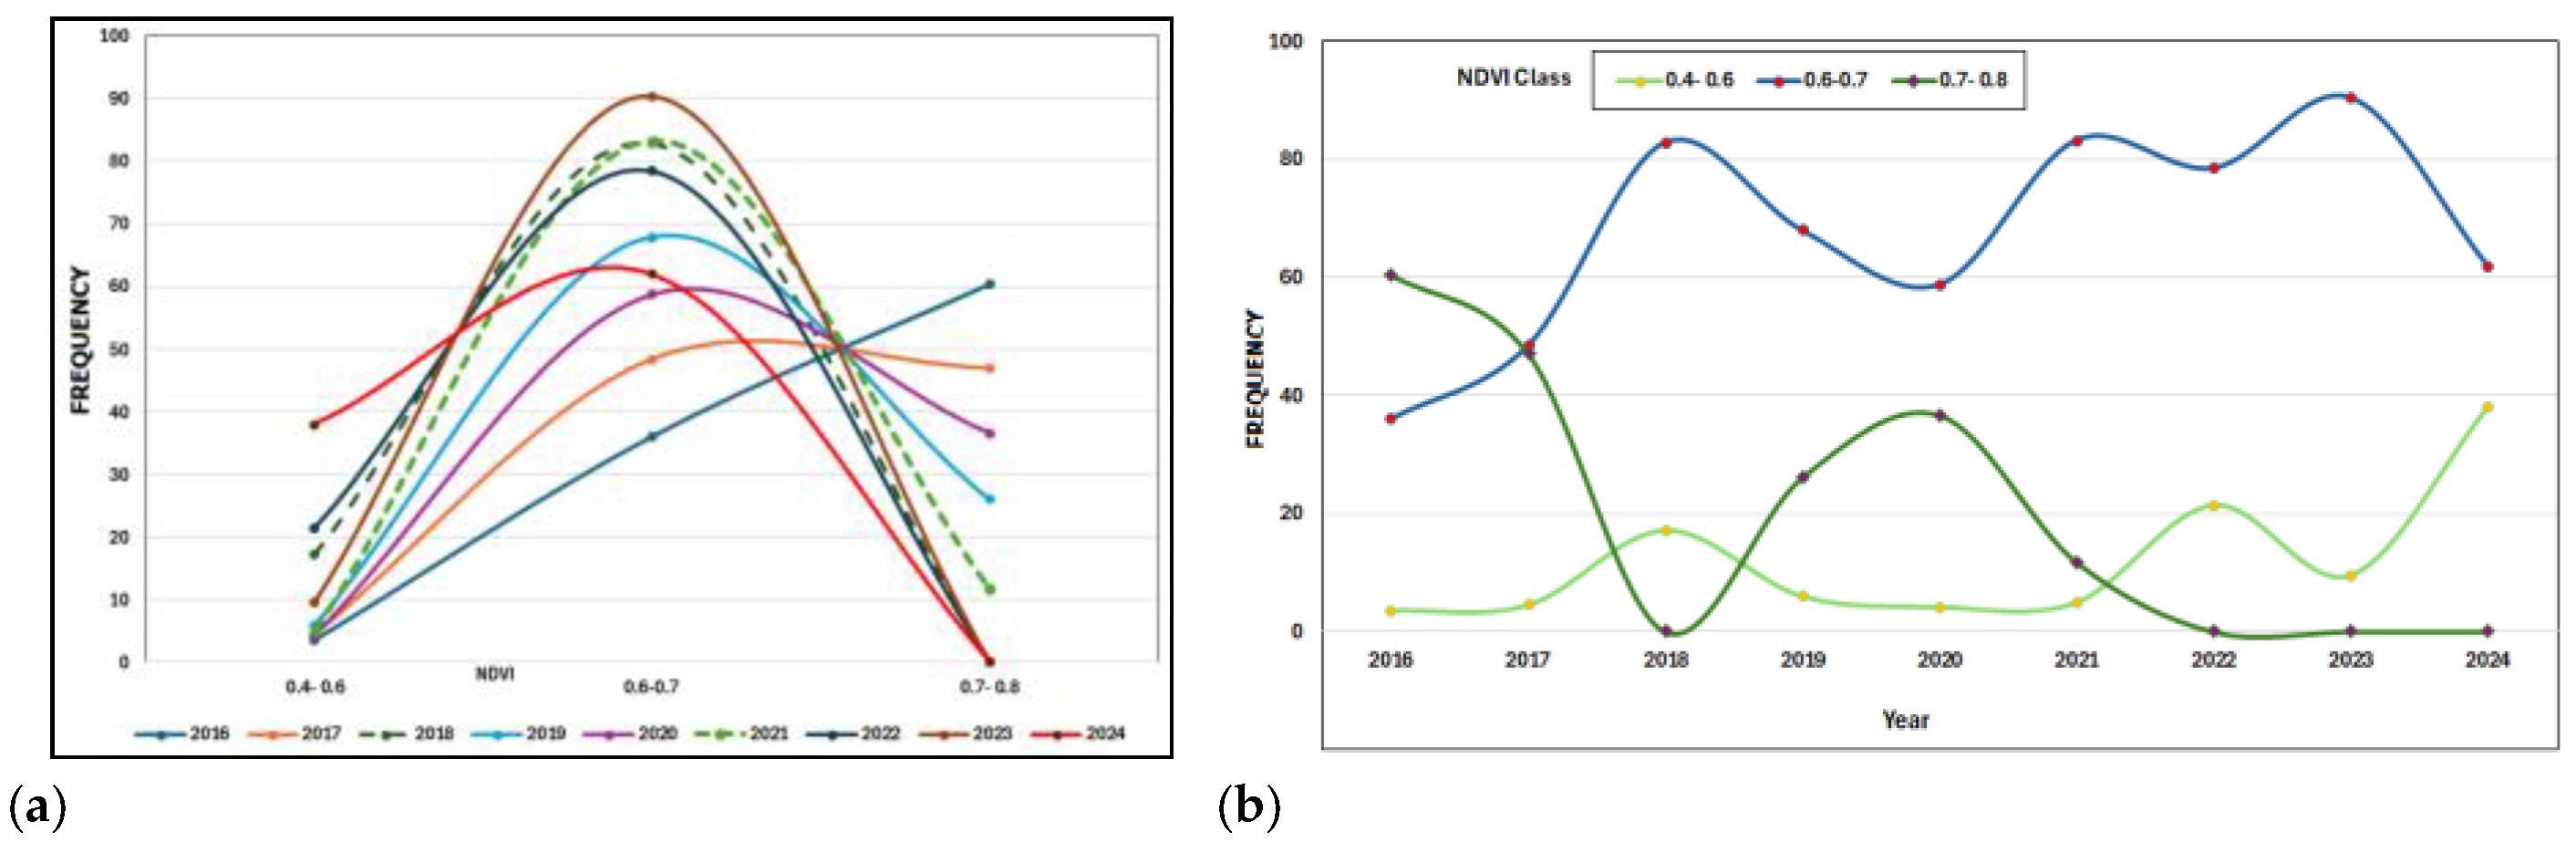
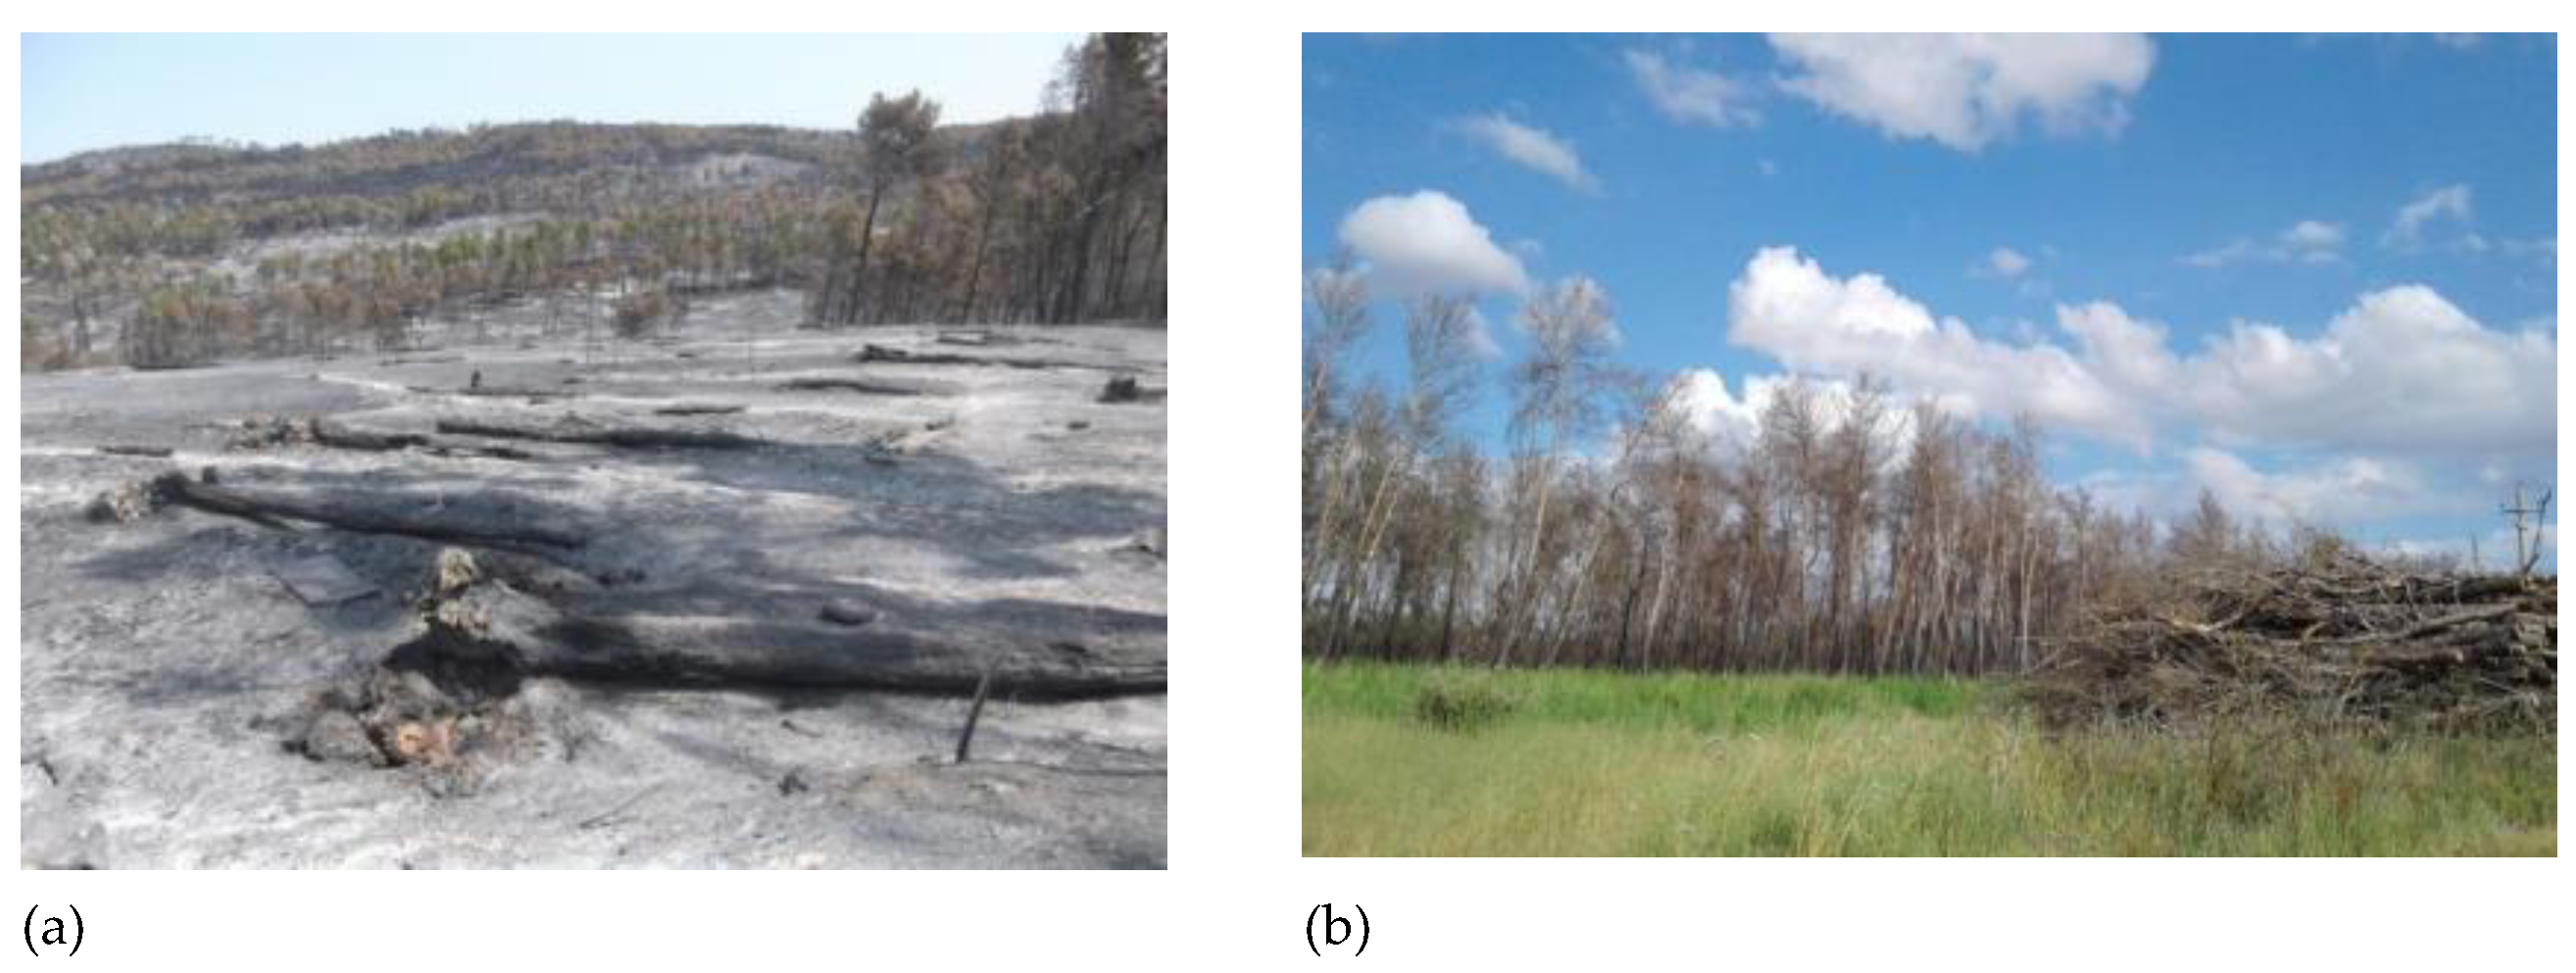
Figure 13.
After fire event in 2017 (a), and two years after fire in burned area (b).
4. Conclusions
Fire is essential for vegetation regeneration because it removes dead material, recycles nutrients, and creates circumstances conducive to new plant growth. However, human activities like as fire suppression and land-use changes have altered natural fire cycles, resulting in thicker forests with higher fuel loads and an increased risk of catastrophic wildfires[64]. The negative impression of fire might overshadow the importance of better forest management methods, such as planned burns and sustainable land use, which contribute to ecological balance[65]. As a result, changing the narrative about fire from exclusively destructive to biologically required can lead to more successful fire and forest management practices. Many plant species in fire-prone locations have evolved to withstand specific fire regimes, and deviations from these circumstances can have a severe influence on their long-term survival and regeneration. In the Apulian and Basilicata region, negative changes in NDVI, such as forest cover loss, are mostly driven by forest fires.
Our study in Bosco Difesa Grande provides valuable insights into the impact of wildfires on vegetation by analyzing dNBR and dNDVI for burn severity and NDVI time series for vegetation recovery. NDVI time series analysis offers crucial insights into post-fire vegetation dynamics. Immediately after a fire, NDVI values drop sharply, reflecting severe vegetation destruction. One year later, initial signs of regrowth appear, with NDVI values gradually increasing. However, full recovery to pre-fire conditions is not always achievable. When NDVI values fail to return to pre-fire levels (>0.7), this may indicate a long-term shift in vegetation structure, from dense forest to shrubland or open woodland. This underscores the importance of continued monitoring to assess potential ecosystem transformation over time. Our study’s NDVI analysis revealed recovery rates comparable to those observed in other studies in Mediterranean ecosystems, where early regrowth was noted within the first year after fire [66,67].
A comparison of NDVI time series reveals a consistent trend of vegetation loss, partial recovery, and potential ecosystem shifts. While some regrowth occurs, pre-fire forest conditions are not fully restored in any case. This highlights the necessity of long-term post-fire monitoring, adaptive land management, and targeted replanting efforts to enhance ecosystem resilience.
This study demonstrates the effectiveness of remote sensing techniques in assessing post-wildfire vegetation recovery in Bosco Difesa Grande. NDVI and NBR analyses provided valuable insights into vegetation dynamics. However, remote sensing alone cannot fully capture species composition shifts or forest structural changes. Future research incorporating field observations and ecological assessments would enhance the accuracy of vegetation response evaluations and provide essential data for targeted restoration planning. Integrating remote sensing with ground-based methods will yield a more comprehensive understanding of ecosystem resilience and recovery pathways following wildfire disturbances.
These findings emphasize the importance of accurate post-fire vegetation assessment, which directly informs land management strategies such as reforestation efforts, fire prevention planning, and ecosystem restoration in fire-prone areas.
Funding
This research received no external funding.
Conflicts of Interest
“The authors declare no conflicts of interest.
References
- J. Pausas. and J. E. Keeley, “Wildfires as an ecosystem service,” Front. Ecol. Environ., 2019. [CrossRef]
- L. T. Kelly, K. M. Giljohann, A. Duane, and etal, “Fire and biodiversity in the Anthropocene,” Science, vol. 370, no. 6519, 2020. [CrossRef]
- D. M. J. S. Bowman, K. Crystal A, J. T. Abatzoglou, F. H. Johnston, G. R. van der Werf, and M. Flannigan, “Vegetation fires in the Anthropocene,” Nat. Rev. Earth Environ., pp. 500–515, 2020. [CrossRef]
- T. N. Wasserman and S. E. Mueller, “Climate influences on future fire severity: a synthesis of climate-fire interactions and impacts on fire regimes, high-severity fire, and forests in the western United States,” Fire Ecol., vol. 19, no. 43, 2023. [CrossRef]
- IPCC, “Climate Change 2021: The Physical Science Basis. Contribution of Working Group I to the Sixth Assessment Report of the Intergovernmental Panel on Climate Change,” Camb. Univ. Press, 2021.
- J. E. Halofsky, D. L. Peterson, and B. J. Harvey, “Changing wildfire, changing forests: the effects of climate change on fire regimes and vegetation in the Pacific Northwest, USA,” Fire Ecol, 2020. [CrossRef]
- J. G. Pausas and J. E. Keeley, “A burning story: The role of fire in the history of life.,” BioScience, vol. 59, no. 7, pp. 593–601, 2009. [CrossRef]
- B. Vannière, D. Colombaroli, E. Chapron, A. Leroux, W. Tinner, and M. Magny, “Climate versus human-driven fire regimes in Mediterranean landscapes: the Holocene record of Lago dell’Accesa (Tuscany, Italy),” Quat. Sci. Rev., vol. 27, pp. 1181–1196, 2008. [CrossRef]
- Camia. and G. Amatulli, “Weather Factors and Fire Danger in the Mediterranean. In: Chuvieco, E. (eds) Earth Observation of Wildland Fires in Mediterranean Ecosystems,” Springer Berl. Heidelb., 2009. [CrossRef]
- D. Salesa, M. J. Baeza, and W. M. Santana, “Fire severity and prolonged drought do not interact to reduce plant regeneration capacity but alter community composition in a Mediterranean shrubland,” Santana, vol. 20, no. 61, 2024. [CrossRef]
- R. Tangney, R. Paroissien, T. Le Bret, and etal, “Success of post-fire plant recovery strategies varies with shifting fire seasonality,” Commun Earth Env., vol. 3, no. 126, 2022. [CrossRef]
- H. Xu, H. Chen, and etal, “Global patterns and drivers of post-fire vegetation productivity recovery,” Nat. Geosci., no. 17, pp. pages874-881, 2024. [CrossRef]
- S. Zahabnazouri, P. Wigand, and A. Jabbari, “Biogeomorphology of mega nebkha in the Fahraj Plain, Iran: Sensitive indicators of human activity and climate change,” Aeolian Res., vol. 49, 2021. [CrossRef]
- L. Shirzadi, M. Hosseinzadeh, K. Nosrati, S. M. Beyranvand, S. Zahabnazouri, and D. Capolongo, “An evaluation of sheet erosion using dendrogeomorphological methods on Quercus brantii roots in the northern catchment of Zarivar Lake (Western Iran).,” 2022. [CrossRef]
- M. Linares and W. Ni Meister, “Impact of Wildfires on Land Surface Cold Season Climate in the Northern High-Latitudes: A Study on Changes in Vegetation, Snow Dynamics, Albedo, and Radiative Forcing,” Remote Sens., vol. 16, no. 8, 2024. [CrossRef]
- R. P. Sishodia, R. Ray, and S. K. Singh, “Applications of Remote Sensing in Precision Agriculture: A Review,” Remote Sens., vol. 12, no. 19, 2020. [CrossRef]
- D. G. Neary, K. C. Ryan, and L. F. DeBano, “Wildland Fire in Ecosystems: Effects of Fire on Soil and Water,” 2005. [Online]. [CrossRef]
- W. Qiang, Á. Moreno-Martínez, M.-M. Jordi, M. Campos-Taberner, and G. Camps-Valls, “Estimation of vegetation traits with kernel NDVI,” J. Photogramm. Remote Sens., vol. 195, pp. 408–417, 2023. [CrossRef]
- R. R. Nemani., C. D. Keeling, and H. Hashimoto, “Climate-driven increases in global terrestrial net primary production from 1982 to 1999,” vol. 300, pp. 1560–1563, 2003. [CrossRef]
- N. Pettorelli, The Normalized Difference Vegetation Index. Oxford University Press, 2025.
- S. Goward, C. Tucker, and D. Dye, “North American vegetation patterns observed with the NOAA-7 advanced very high resolution radiometer,” Vegetatio, vol. 64, pp. 3–14, 1985. [CrossRef]
- L. Lopes, F. Dias, O. Fernandes, and etal, “A remote sensing assessment of oak forest recovery after postfire restoration,” Eur J For. Res, vol. 143, pp. 1000–1014, 2024. [CrossRef]
- Hao., X. Xu, W. Fei, and L. Tan, “Long-Term Effects of Fire Severity and Climatic Factors on Post-Forest-Fire Vegetation Recovery,” Forests, vol. 13, no. 6, 2022. [CrossRef]
- Banskota, N. Kayastha, M. J. Falkowski, M. A. Wulder, R. E. Wulder, and J. C. White, “Forest Monitoring Using Landsat Time Series Data: A Review,” Can. J. Remote Sens., vol. 40, no. 5, pp. 362–384, 2014. [CrossRef]
- M. J. Van Gerrevink. and S. Veraverbeke, “Evaluating the Hyperspectral Sensitivity of the Differenced Normalized Burn Ratio for Assessing Fire Severity,” Remote Sens., vol. 13, no. 22, 2021. [CrossRef]
- S. Escuin, R. Navarro, and P. Fernández, “Fire severity assessment by using NBR (Normalized Burn Ratio) and NDVI (Normalized Difference Vegetation Index) derived from LANDSAT TM/ETM images,” Int. J. Remote Sens., vol. 29, no. 4, pp. 1053–1073, 2007. [CrossRef]
- P. Phinn and P. D. Erskine, “Fire Severity and Vegetation Recovery on Mine Site Rehabilitation Using WorldView-3 Imagery,” Fire, vol. 1, no. 2, 2018. [CrossRef]
- F. Morante-Carballo, L. Bravo-Montero, P. Carrión-Mero, A. Velastegui-Montoya, and E. Berrezueta, “26. Morante-Carballo,” Remote Sens., vol. 14, no. 8, 2022. [CrossRef]
- Y. Zhao., Y. Huang, Y. Sun, G. Dong, Y. Li, and M. Ma, “Forest Fire Mapping Using Multi-Source Remote Sensing Data: A Case Study in Chongqing,” Remote Sens., vol. 15, no. 9, 2023. [CrossRef]
- R. Meng and F. Zhao, “Remote sensing of fire effects: A review for recent advances in burned area and burn severity mapping. In Remote Sensing of Hydrometeorological Hazards,” in Remote Sensing of Hydrometeorological Hazards, George P. Petropoulos, Tanvir Islam., Taylor & Francis Group, 2017.
- s Vicario, m Adamo, D. Alcaraz-Segura, and C. Tarantino, “Bayesian Harmonic Modelling of Sparse and Irregular Satellite Remote Sensing Time Series of Vegetation Indexes: A Story of Clouds and Fires,” Remote Sens., vol. 12, no. 1, 2020. [CrossRef]
- L. Forte, in Forte, Luigi. “Flora e vegetazione del bosco comunale “Difesa Grande” di Gravina in Puglia., 2001, pp. 183–228.
- R. P. Manicone, F. Mannerucci, N. Luisi, and p Lerario, “The Spontaneous Flora and Vegetation in Puglia in Science, Art and History". Bari,” Influ. Environ. Anthropog. Factors Decay Oak For. South. Italy Conf. Proc., pp. 163–171, 1993.
- Kapur, P. Steduto, and T. Mladen, “Prediction of climatic change for the next 100 years in Southern Italy,” Ital. J. Agron., vol. 2, no. 4, pp. 365–371, 2007. [CrossRef]
- “https://www.meteoblue.com/,” Climate change. [CrossRef]
- Avetisyan, E. Velizarova, and L. Filchev, “Post-Fire Forest Vegetation State Monitoring through Satellite Remote Sensing and In Situ Data,” Remote Sens., vol. 14, no. 24, 2022. [CrossRef]
- V. Kumar, A. Sharma, and A. Kumar Thukral, Remote Sens. Appl. Soc. Environ., 2018. [CrossRef]
- V. Anke, A. Sharma, R. BhMcKennaardwaj, and A. Kumar Thukral, “Comparison of different reflectance indices for vegetation analysis using Landsat-TM data,” Remote Sens. Appl. Soc. Environ., vol. 12, pp. 70–77, 2018. [CrossRef]
- H. Tamiminia, B. Salehi, M. Mahdianpari, L. Quackenbush, S. Adeli, and B. Brisco, “Google Earth Engine for geo-big data applications: A meta-analysis and systematic review,” Photogramm. Remote Sens, vol. 164, pp. 152–170, 2020. [CrossRef]
- Shafeian, B. J. Mood, K. W. Belcher, and C. P. Laroque, “Assessing spatial distribution and quantification of native trees in Saskatchewan’s prairie landscape using remote sensing techniques,” Eur. J. Remote Sens., vol. 58, no. 1, 2025. [CrossRef]
- L. Mohammad et al., “Estimation of agricultural burned affected area using NDVI and NBR satellite-based empirical models,” J. Environ. Manage., vol. 343, 2023. [CrossRef]
- R. Llorens, J. Antonio Sobrino, C. Fernández, J. M. Fernández-Alonso, and J. Antonio Vega, “A methodology to estimate forest fires burned areas and burn severity degrees using Sentinel-2 data. Application to the October 2017 fires in the Iberian Peninsula,” Int. J. Appl. Earth Obs. Geoinformation, vol. 95. [CrossRef]
- Alcaras, D. Costantino, F. Guastaferro, C. Parente, and M. Pepe, “Normalized Burn Ratio Plus (NBR+): A New Index for Sentinel-2 Imagery,” Remote Sens., vol. 14, no. 1727, 2022. [CrossRef]
- L. B. Leigh et al., “Post-fire burn severity and vegetation response following eight large wildfires across the Western United States,” Fire Ecol., vol. 3, no. 1, pp. 91–108, 2007.
- C. Teodoro and S. Amaral, “Algorithms for change detection using NIR and SWIR spectral areas: Assessing post-fire vegetation and canopy moisture loss,” J. Appl. Remote Sens., vol. 13, no. 4, 2019. [CrossRef]
- H. Key and N. C. Benson, “Landscape Assessment: Ground measure of severity, the Composite Burn Index; and Remote sensing of severity, the Normalized Burn Ratio,” Ogden, UT, Report RMRS-GTR-164-CD: LA 1-51, 2006. [Online]. Available: https://pubs.usgs.gov/publication/2002085.
- R. Llorens, J. A. Sobrino, C. Fernández, J. M. Fernández-Alonso, and J. A. Vega, “A methodology to estimate forest fires burned areas and burn severity degrees using Sentinel-2 data. Application to the October 2017 fires in the Iberian Peninsula,” Int J Appl Earth Obs Geoinf, vol. 95, no. 102243, 2021. [CrossRef]
- S. Jones and R. Vaughan, “Understanding NDVI values: implications for vegetation assessment,” J. Remote Sens., vol. 15, no. 3, pp. 123–135, 2010. [CrossRef]
- E. Keeley, “Fire intensity, fire severity and burn severity: a brief review and suggested usage,” Nternational J. Wildland Fire, vol. 18, no. 1, pp. 116–126, 2009. [CrossRef]
- Morante-Carballo, L. Bravo-Montero, P. Carrión-Mero, A. Velastegui-Montoya, and E. Berrezueta, “Forest fire assessment using remote sensing to support the development of an action plan proposal in Ecuador,” p. 1783, 2022. [CrossRef]
- J. Eidenshink, B. Schwind, K. Brewer, Z. Zhu, B. Quayle, and S. Howard, Fire Ecol., vol. 3, no. 3, 2007. [CrossRef]
- B. C. Bright, A. T. Hudak, R. E. Kennedy, J. D. Braaten, and A. Henareh Khalyani, “Examining post-fire vegetation recovery with Landsat time series analysis in three western North American forest types,” Fire Ecol., vol. 15, no. 8, 2019. [CrossRef]
- R. Lai and T. Oguchi, “Evaluating Spatiotemporal Patterns of Post-Eruption Vegetation Recovery at Unzen Volcano, Japan, from Landsat Time Series,” Remote Sens., vol. 14, no. 21, 2022. [CrossRef]
- E. J. Bowd et al., “Direct and indirect effects of fire on microbial communities in a pyrodiverse dry-sclerophyll forest,” J. Ecol., vol. 110, no. 7, pp. 1687–1703, 2022. [CrossRef]
- K. D. Wolf, P. E. Higuera, K. T. Davis, and S. Z. Dobrowski, “Wildfire impacts on forest microclimate vary with biophysical context,” Ecosphere, vol. 12, no. 5, 2021. [CrossRef]
- T. Chu, X. Guo, and K. Takeda, “Effects of Burn Severity and Environmental Conditions on Post-Fire Regeneration in Siberian Larch Forest,” Forests, vol. 8, no. 3, 2017. [CrossRef]
- S. Escuin, R. Navarro, and P. Fernández, “Fire severity assessment by using NBR (Normalized Burn Ratio) and NDVI (Normalized Difference Vegetation Index) derived from LANDSAT TM/ETM images,” Int. J. Remote Sens., vol. 29, no. 4, pp. 1053–1073, 2007. [CrossRef]
- B. Hao, X. Xu, F. Wu, and L. Tan, “Long-Term Effects of Fire Severity and Climatic Factors on Post-Forest-Fire Vegetation Recovery,” Forests, vol. 13, no. 6, 2022. [CrossRef]
- J. V. Jo Celebrezzee, M. C. Franz, R. A. Andrus, A. T. Stahl, M. Steen-Adams, and A. J. H. Meddens, “A fast spectral recovery does not necessarily indicate post-fire forest recovery.,” Fire Ecol., vol. 20, no. 54, 2024. [CrossRef]
- J. F. Johnstone, F. S. Chapin, J. Foote, S. Kemmett, K. Price, and L. Viereck, “Decadal observations of tree regeneration following fire in boreal forests,” Ecol. Monogr., vol. 80, no. 1, pp. 1–16, 2016.
- C. Certini, “Effects of fire on properties of forest soils: a review,” Oecologia, vol. 143, no. 1, pp. 1–10, 2005.
- V. H. Dale, L. A. Joyce, S. McNulty, and R. P. Neilson, “Climate change and forest disturbances,” BioScience, vol. 51, no. 9, pp. 723–734, 2001.
- R. A. Shakesby and S. H. Doerr, “Wildfire as a hydrological and geomorphological agent,” Earth-Sci. Rev., vol. 74, no. 3–4, pp. 269–307, 2006.
- S. L. Stephens et al., “Managing forests and fire in changing climates,” Science, vol. 342, no. 6154, pp. 41–42, 2013.
- M. North, B. M. Collins, and H. D. Safford, “Resilience of forest ecosystems to climate change,” US Dep. Agric. For. Serv., 2015.
- E. Carrari, P. Biagini, and F. Selvi, “Early vegetation recovery of a burned Mediterranean forest in relation to post-fire management strategies,” Int. J. For. Res., vol. 95, no. 4, pp. 548–561, 2022. [CrossRef]
- M. Peris-Llopis, M. Vastaranta, N. Saarinen, J. Ramon, G. Olabarria, and B. Mola-Yudego, “Post-fire vegetation dynamics and location as main drivers of fire recurrence in Mediterranean forests,” For. Ecol. Manag., vol. 568. [CrossRef]
Figure 1.
Puglia Region(a), Bosco Difesa Grande location in Puglia(b), landuse map of the study area using Dynamic World V1 (2023).
Figure 1.
Puglia Region(a), Bosco Difesa Grande location in Puglia(b), landuse map of the study area using Dynamic World V1 (2023).
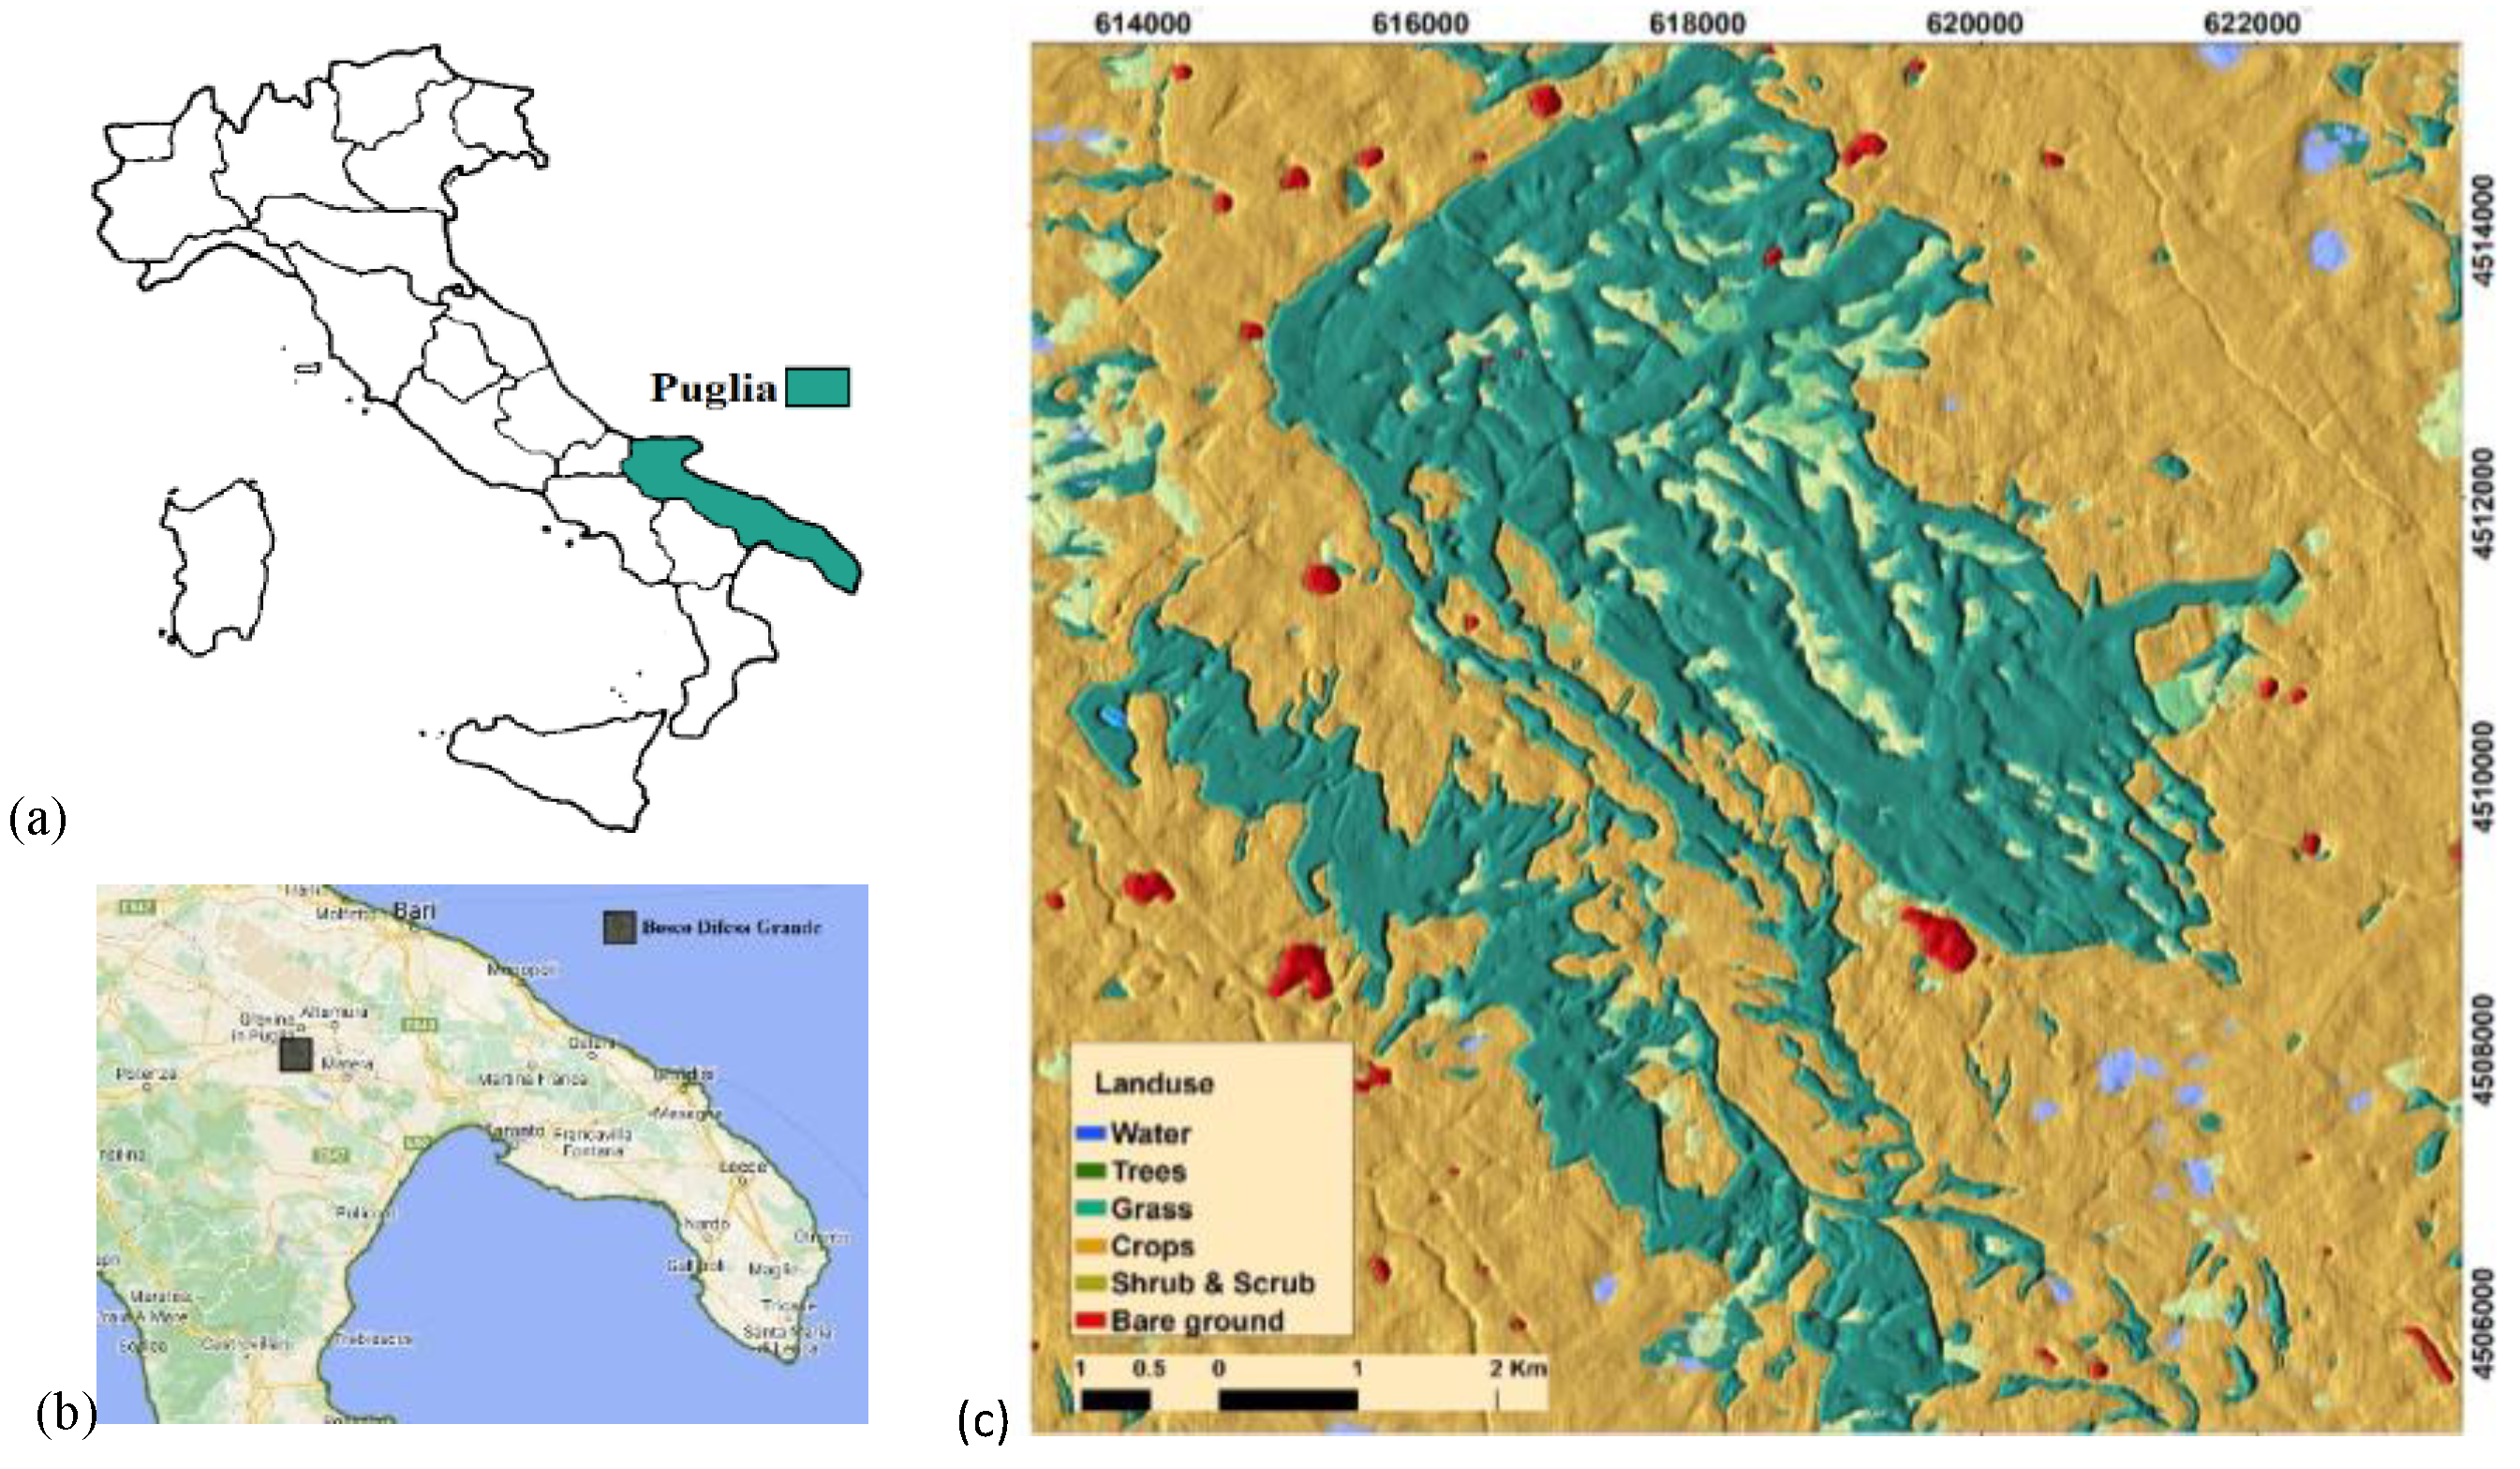
Figure 2.
Study Area Classification according to Burn History for Vegetation Recovery Evaluation.
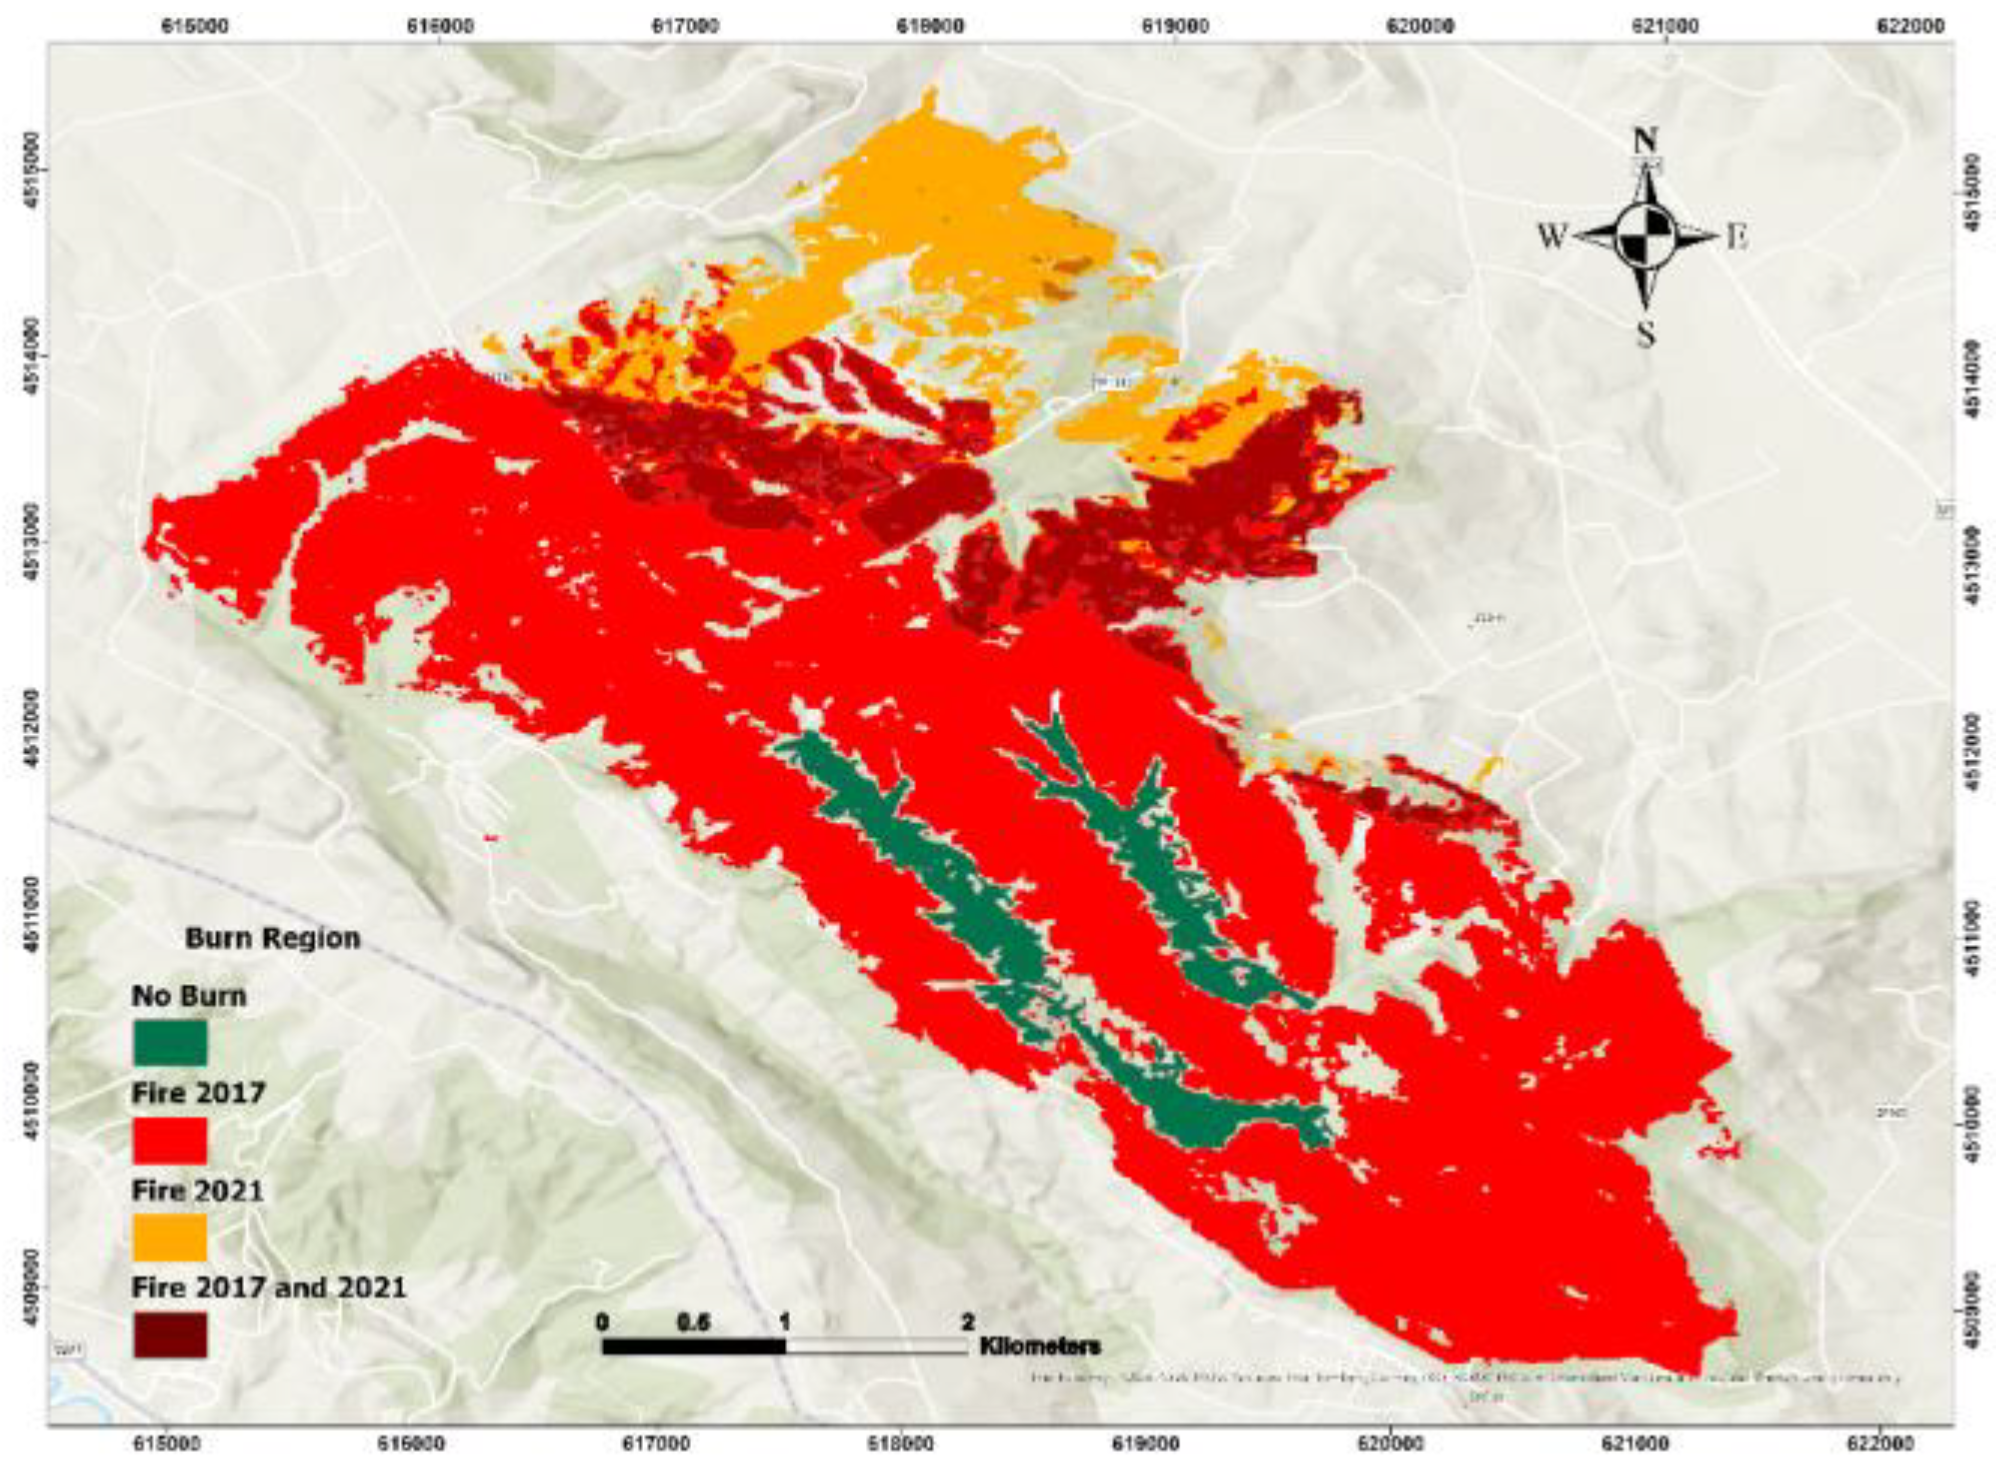
Figure 3.
Monthly temperature (C) and precipitation anomalies (mm)- Climate Change Gravina in Puglia.
Figure 3.
Monthly temperature (C) and precipitation anomalies (mm)- Climate Change Gravina in Puglia.
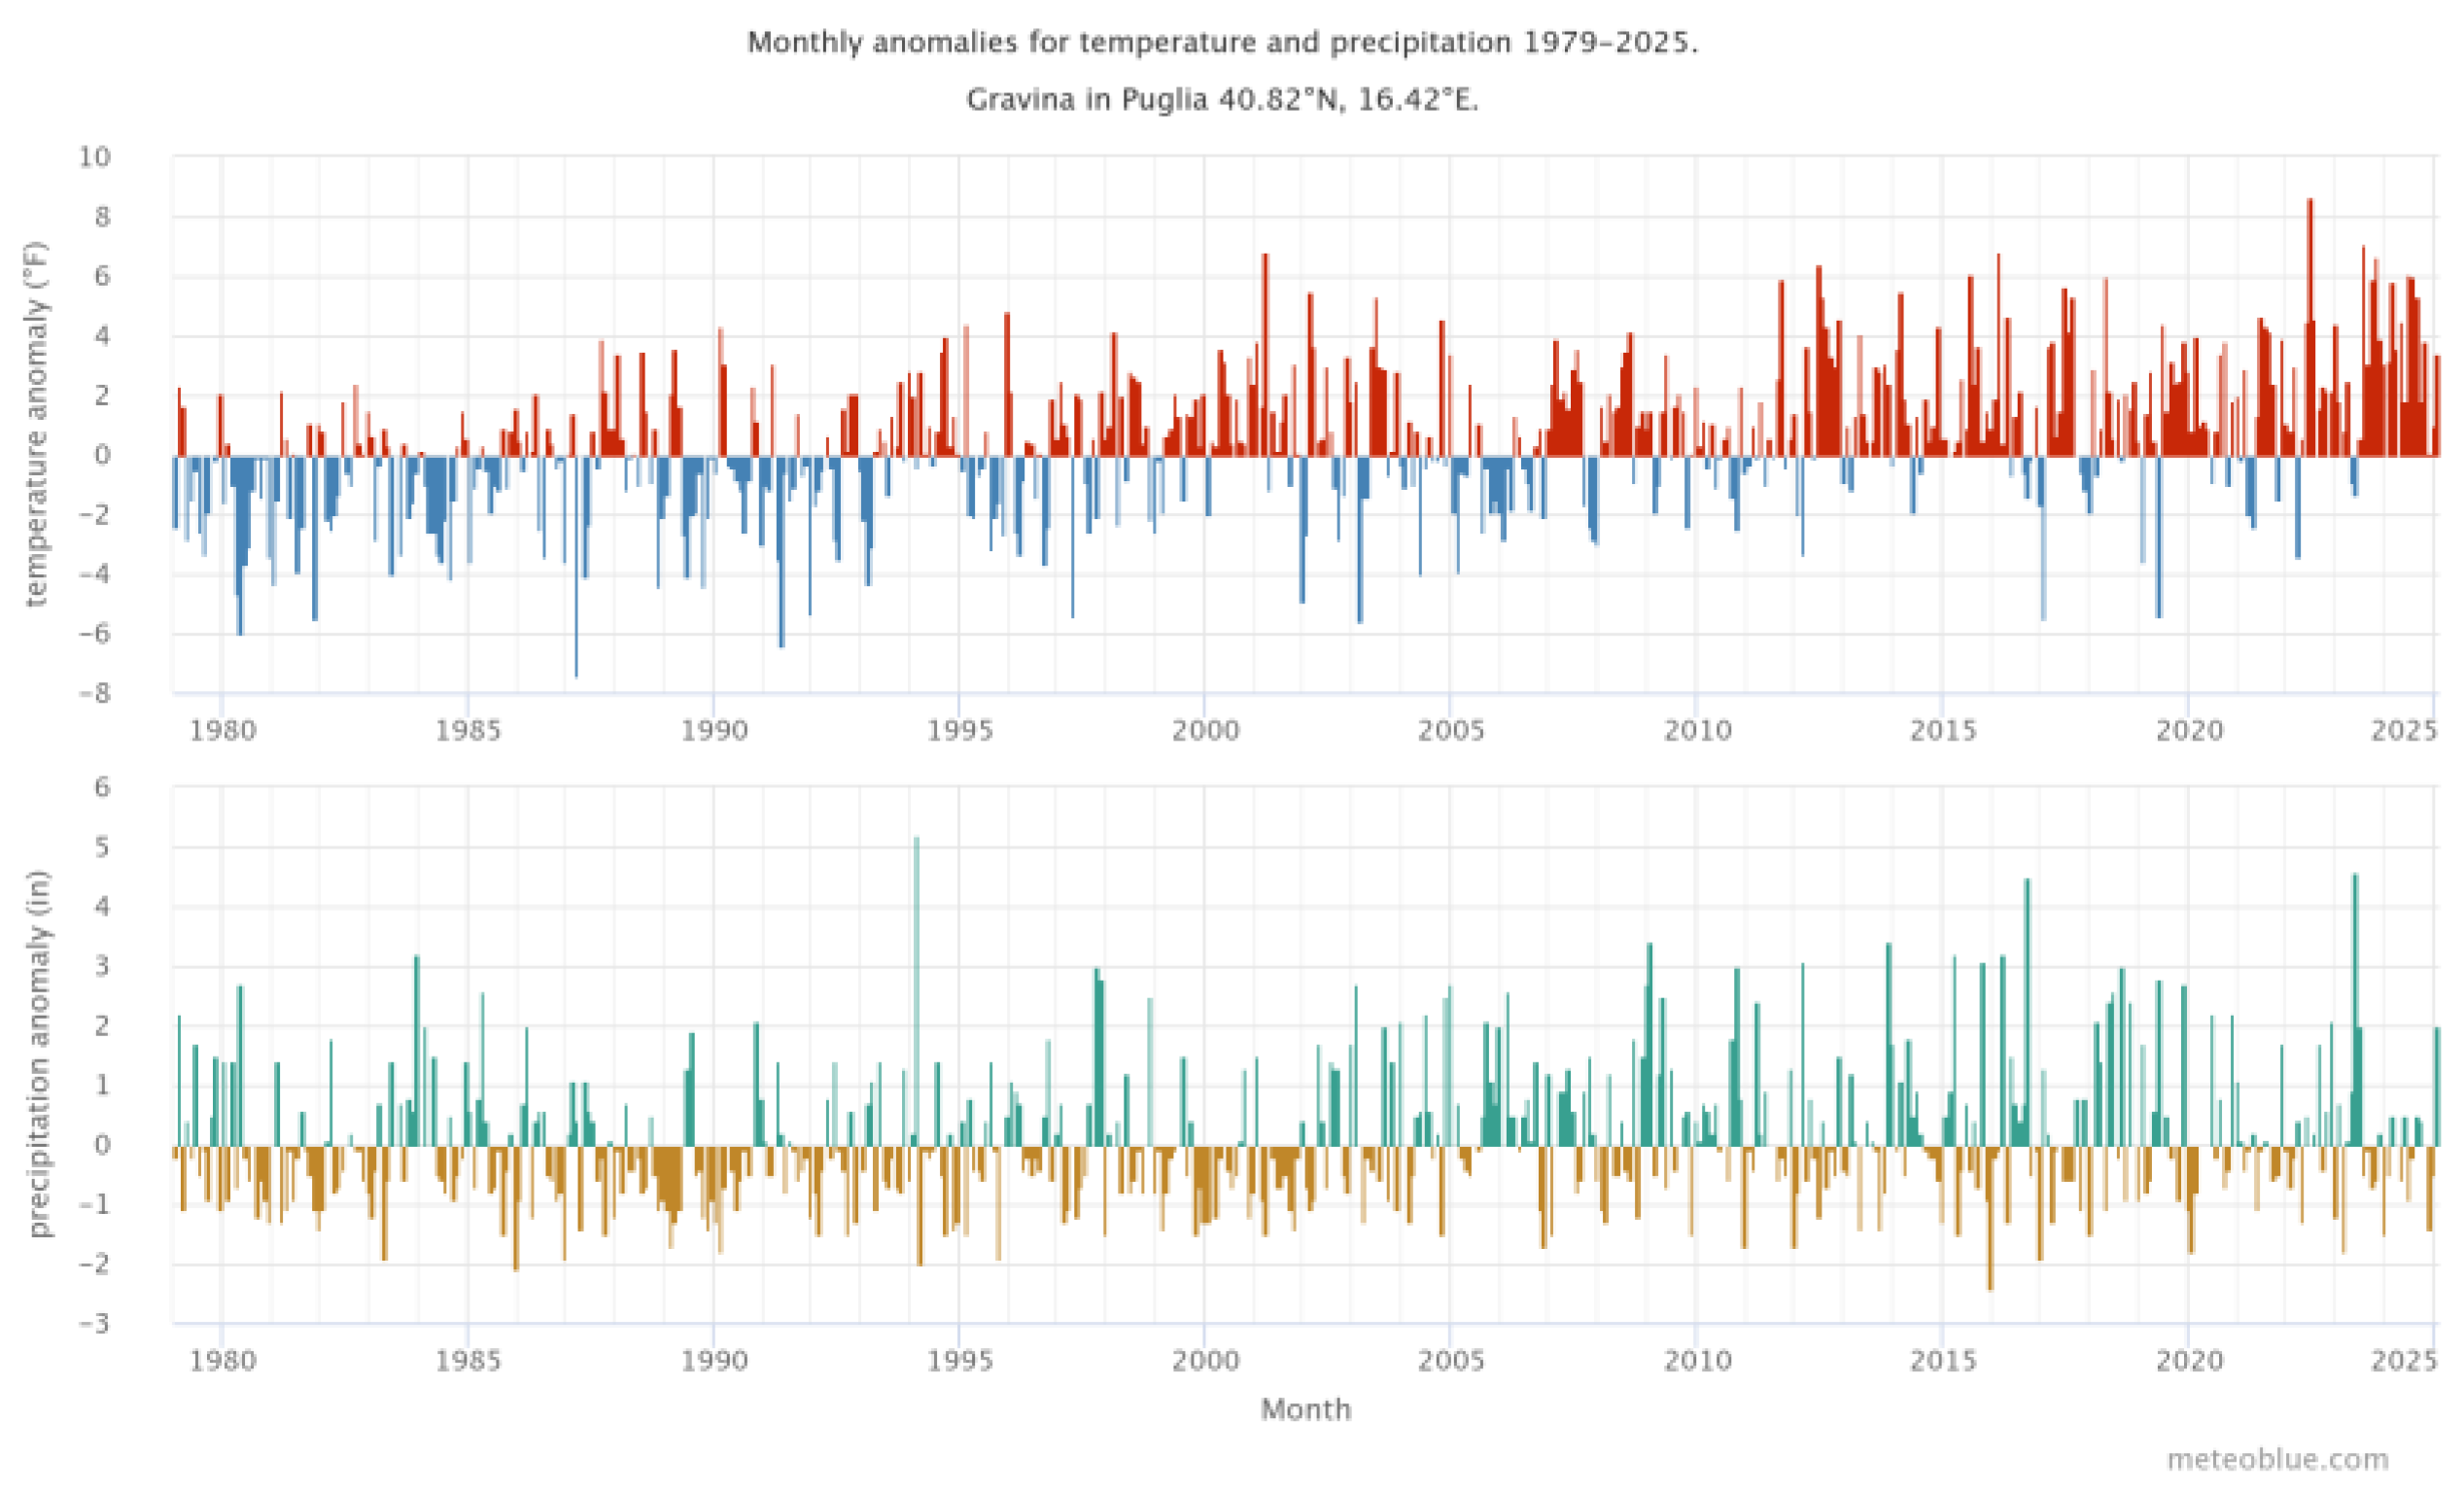
Figure 4.
Region with fire event in August 2017 (a), overlapped region in fire 2017 and 2021 (b), non-burn region (c), region with fire in 2021 (d).
Figure 4.
Region with fire event in August 2017 (a), overlapped region in fire 2017 and 2021 (b), non-burn region (c), region with fire in 2021 (d).
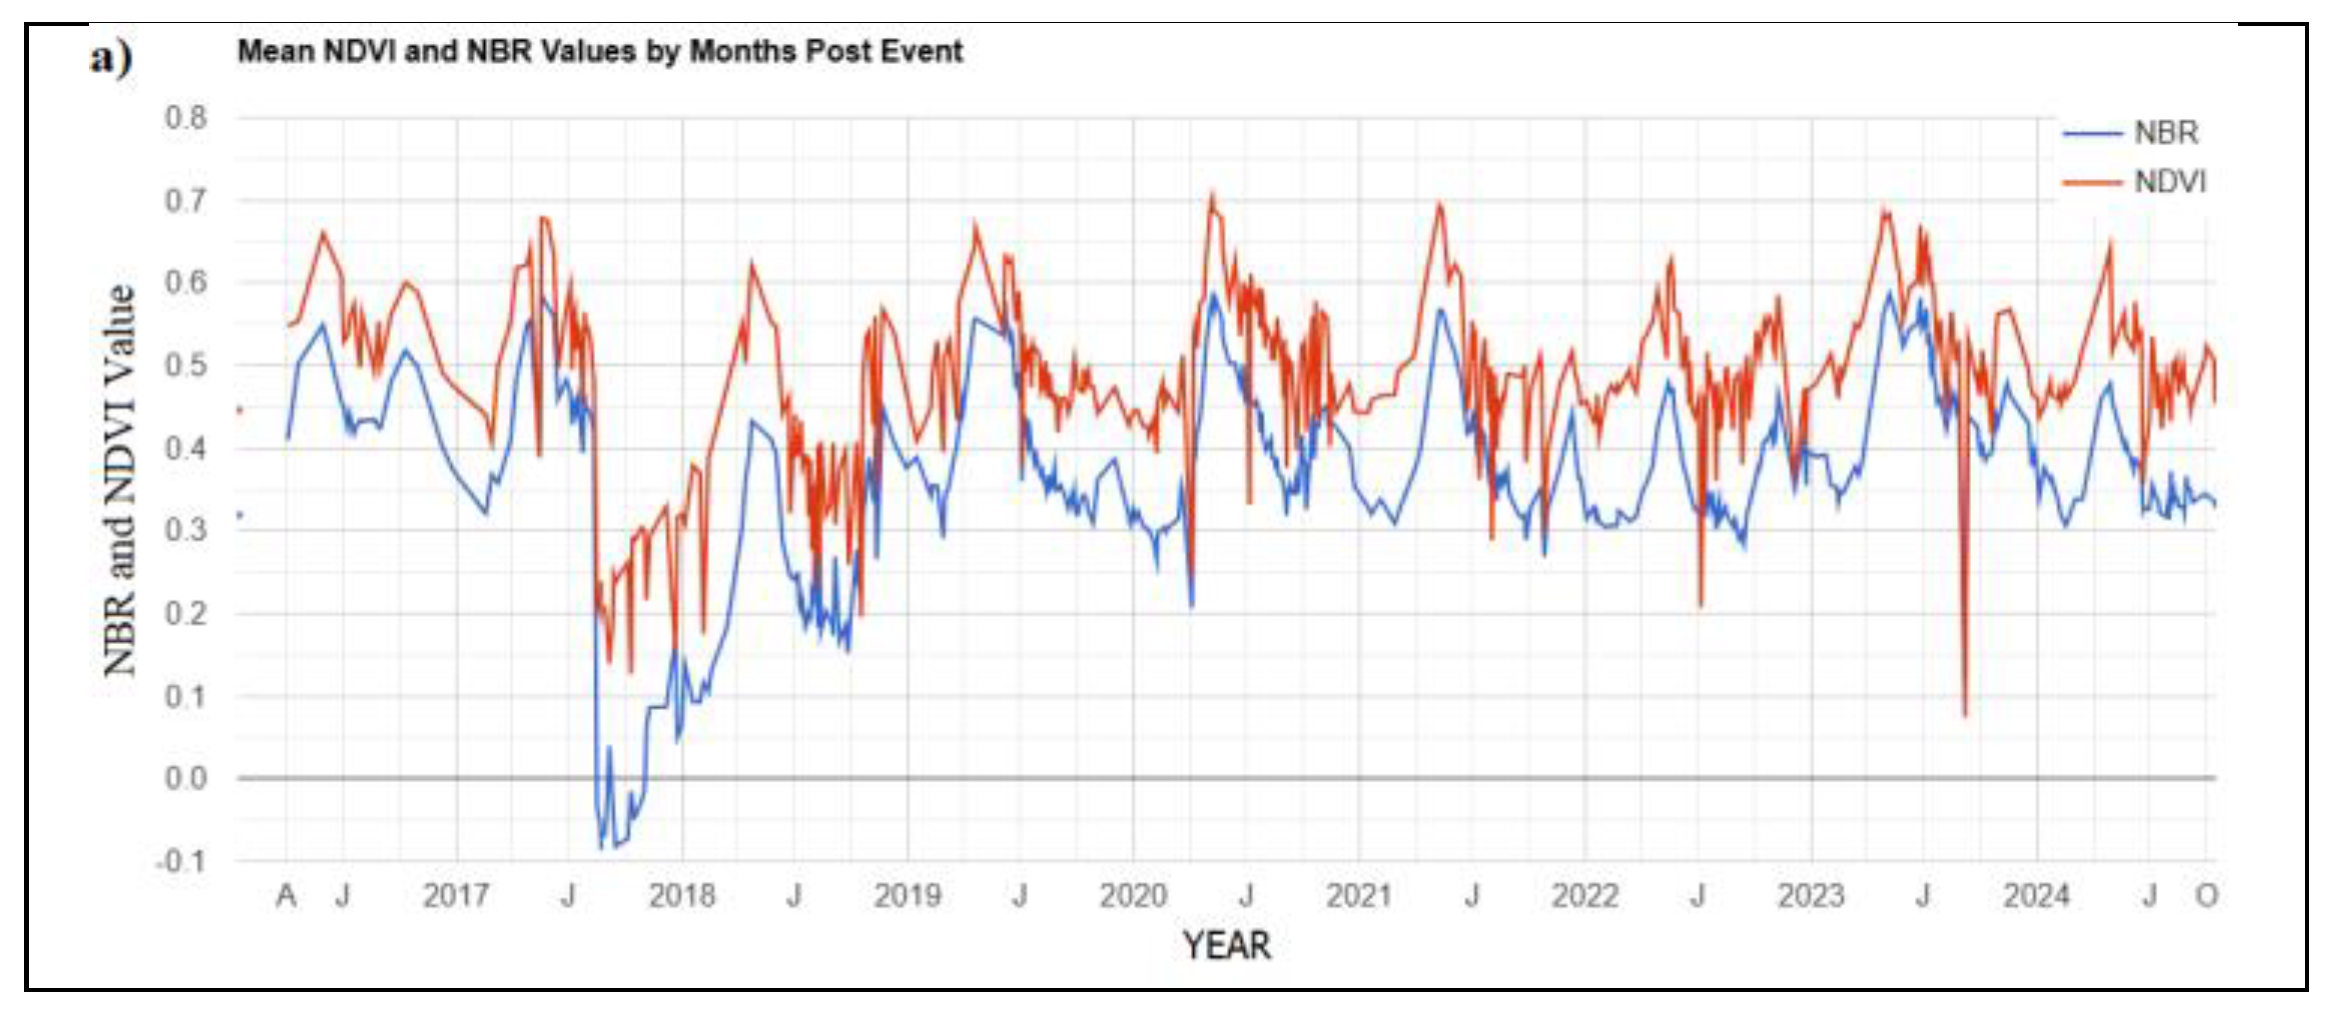
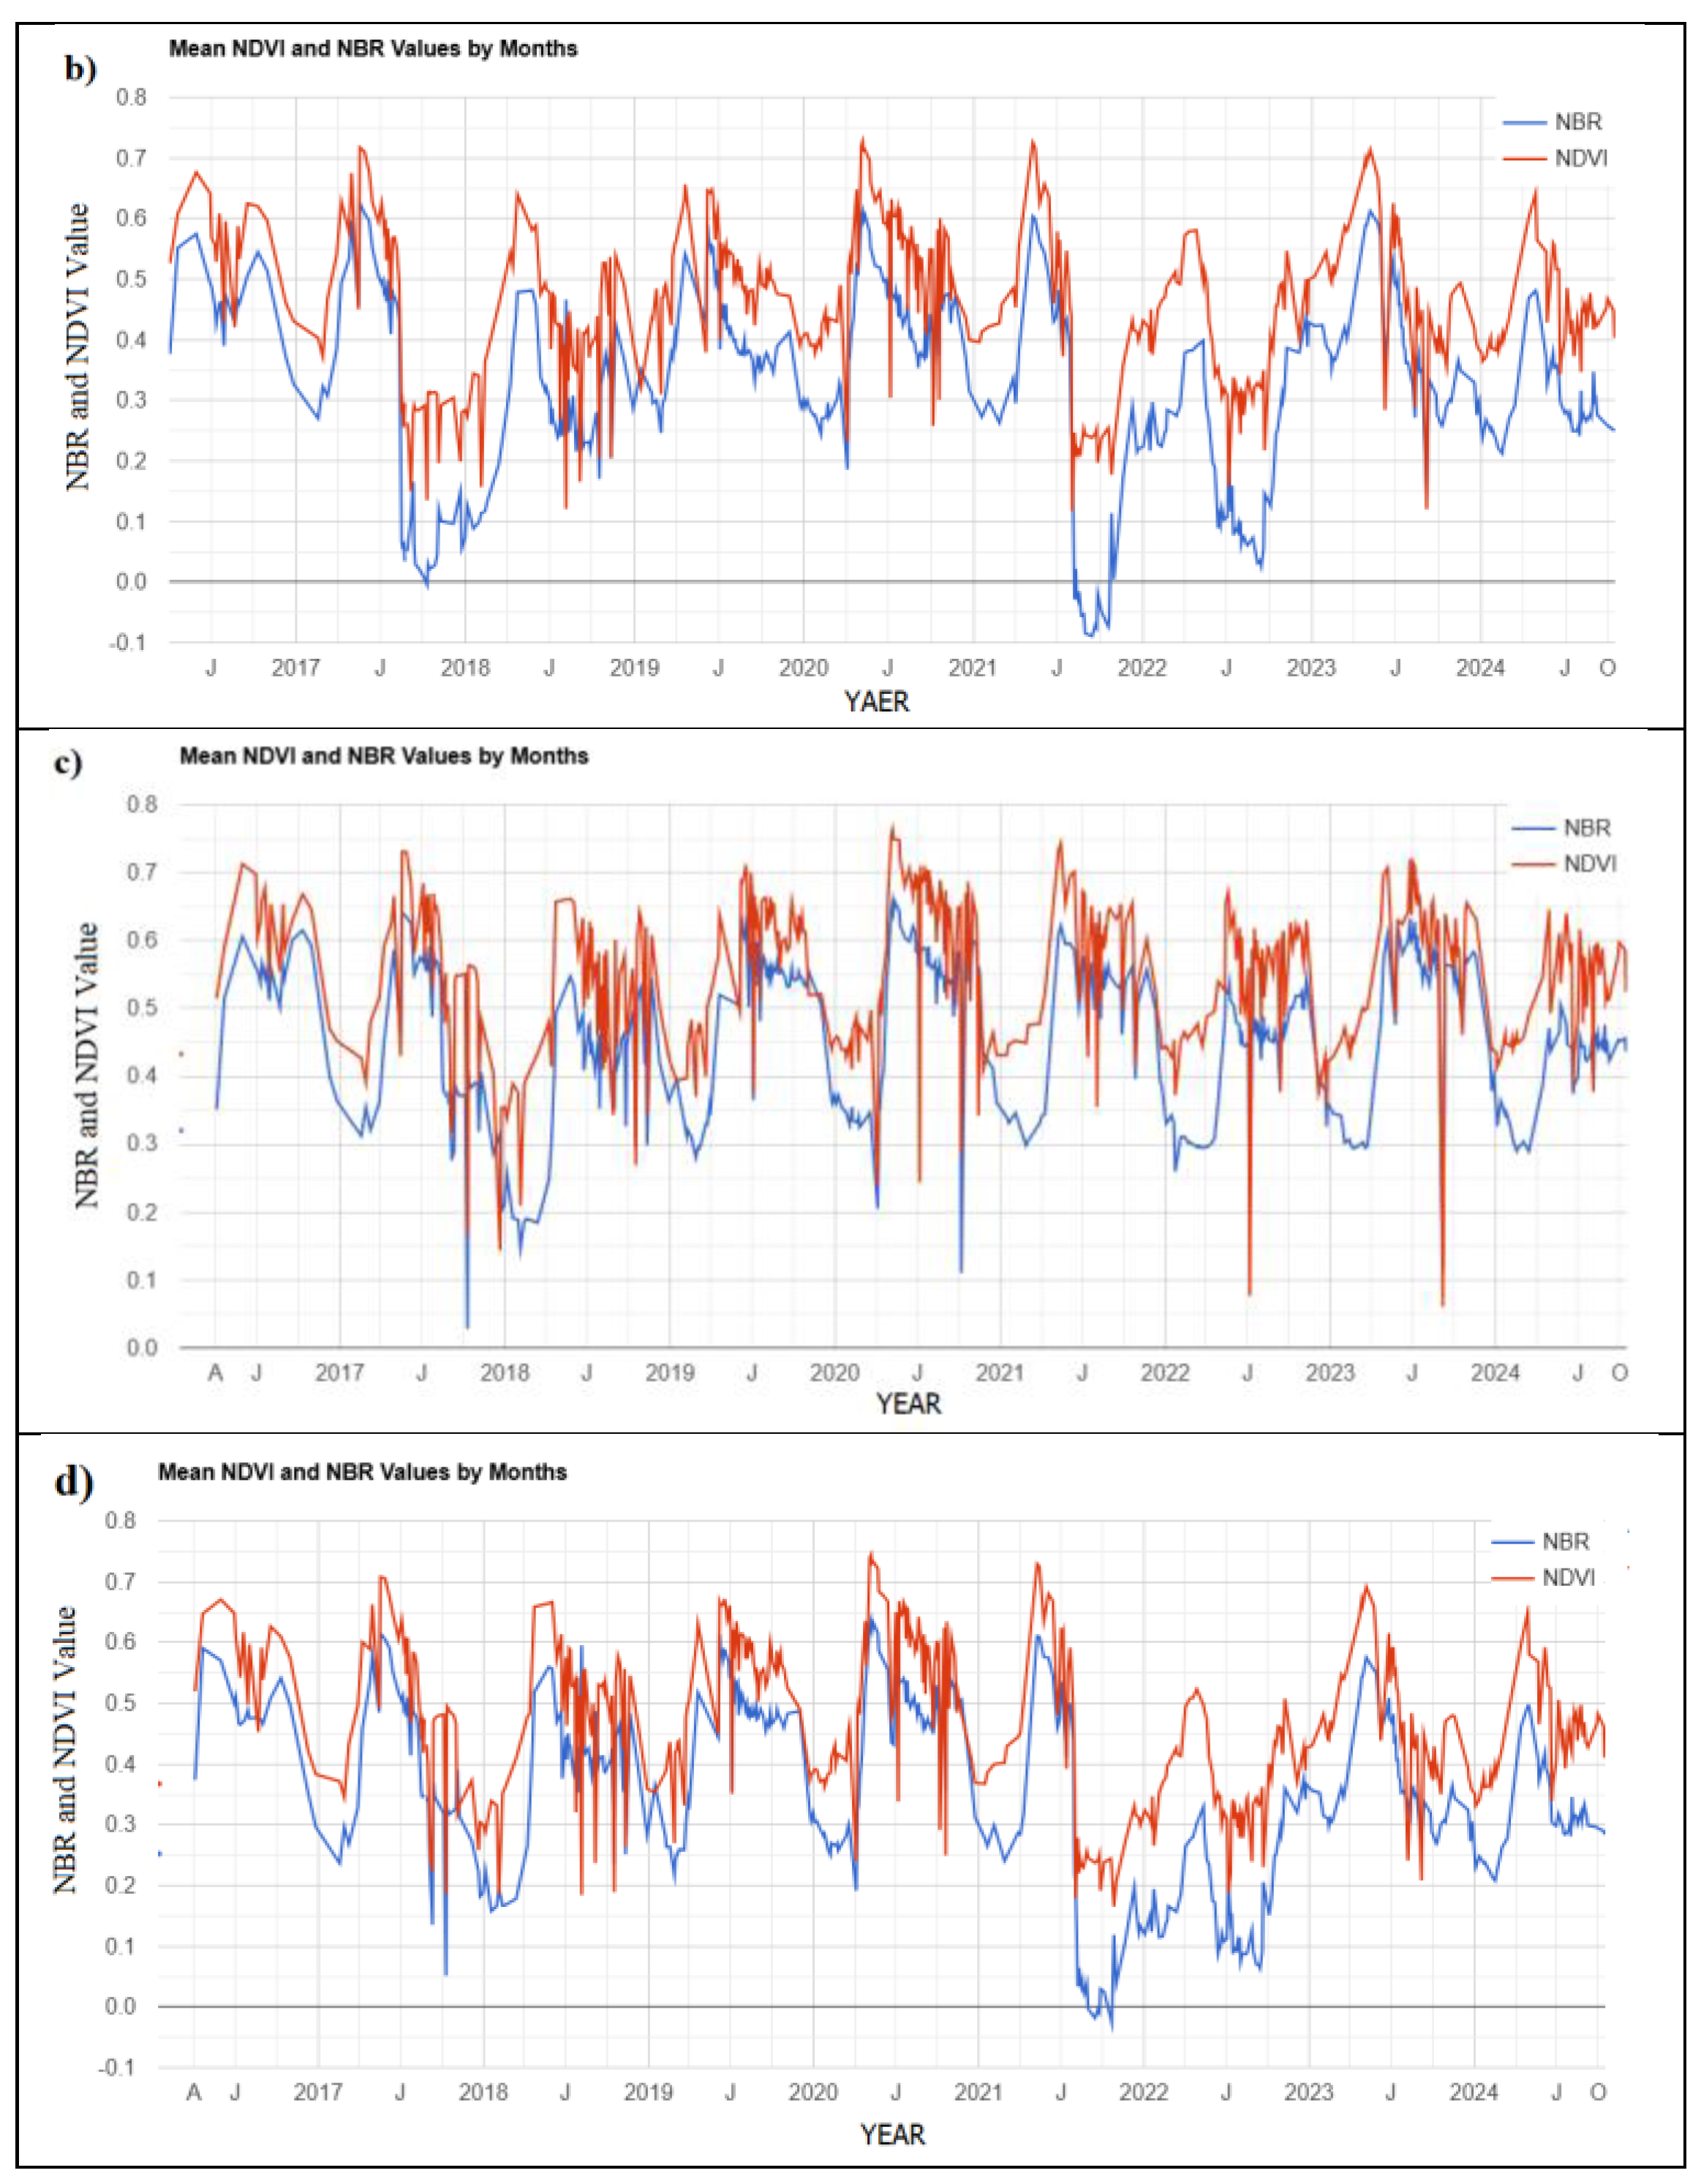
Figure 5.
NBR before fire (a), NBR post fire (b), dNBR (c) and Burn severity classification (d) for fire event in august 2017.
Figure 5.
NBR before fire (a), NBR post fire (b), dNBR (c) and Burn severity classification (d) for fire event in august 2017.
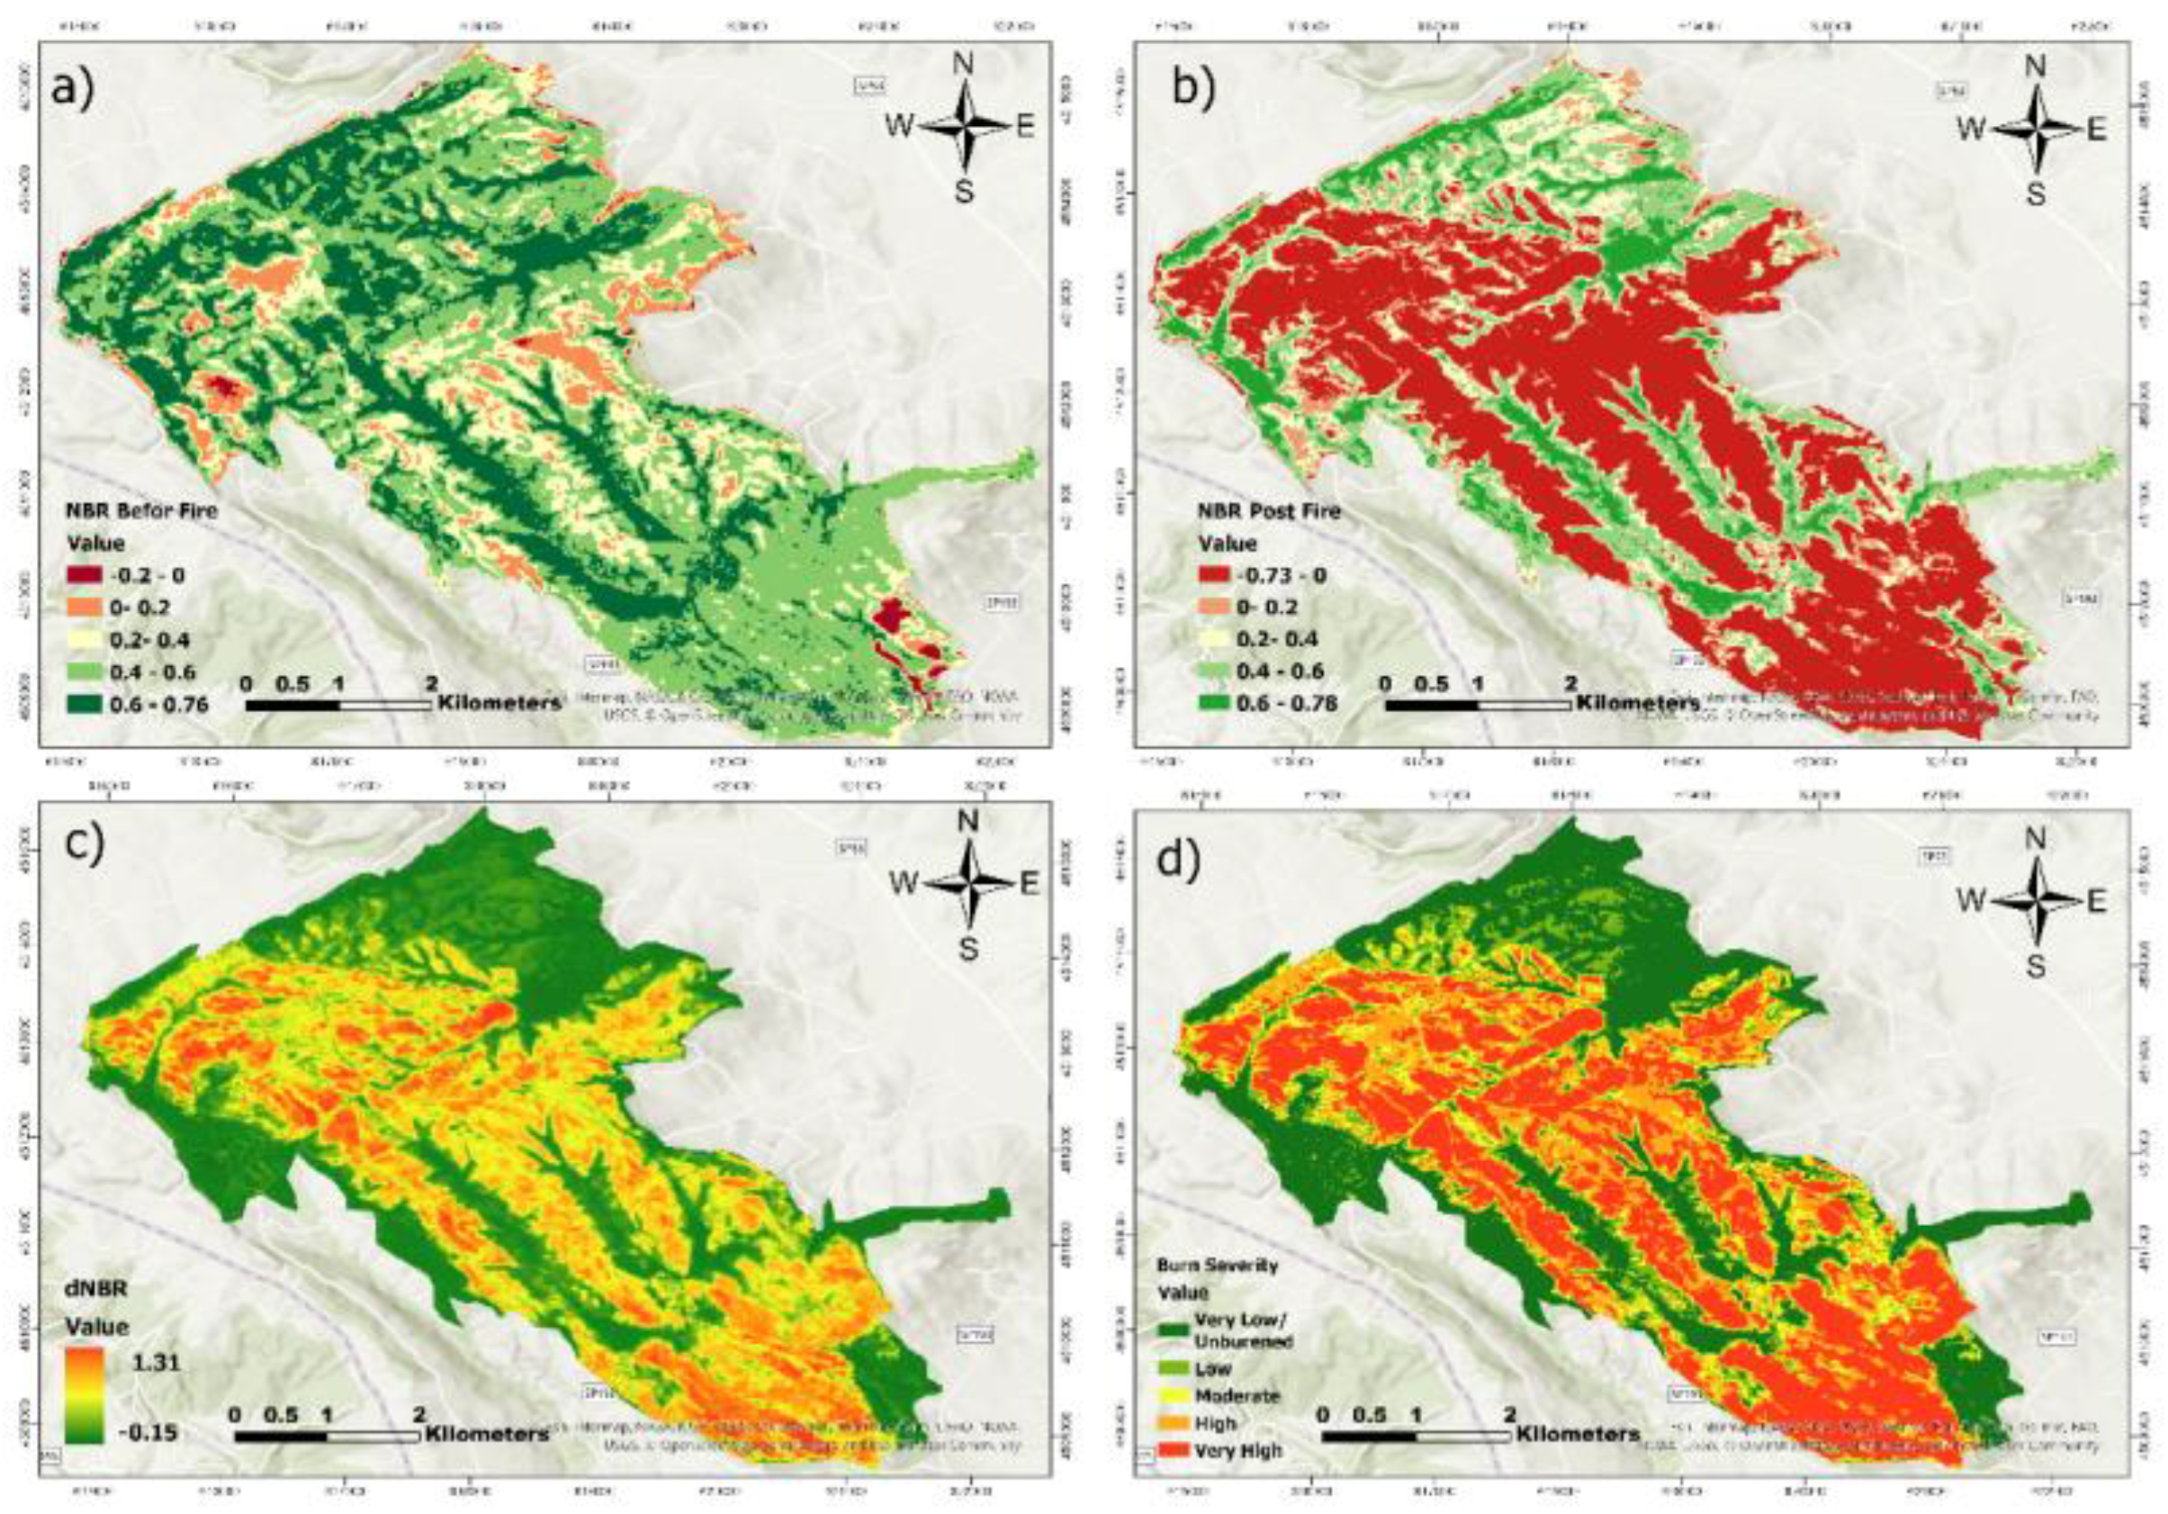
Figure 6.
NDVI before fire (a), NDVI post fire (b), d NDVI (c) and Burn severity classification (d) for fire event in august 2017.
Figure 6.
NDVI before fire (a), NDVI post fire (b), d NDVI (c) and Burn severity classification (d) for fire event in august 2017.
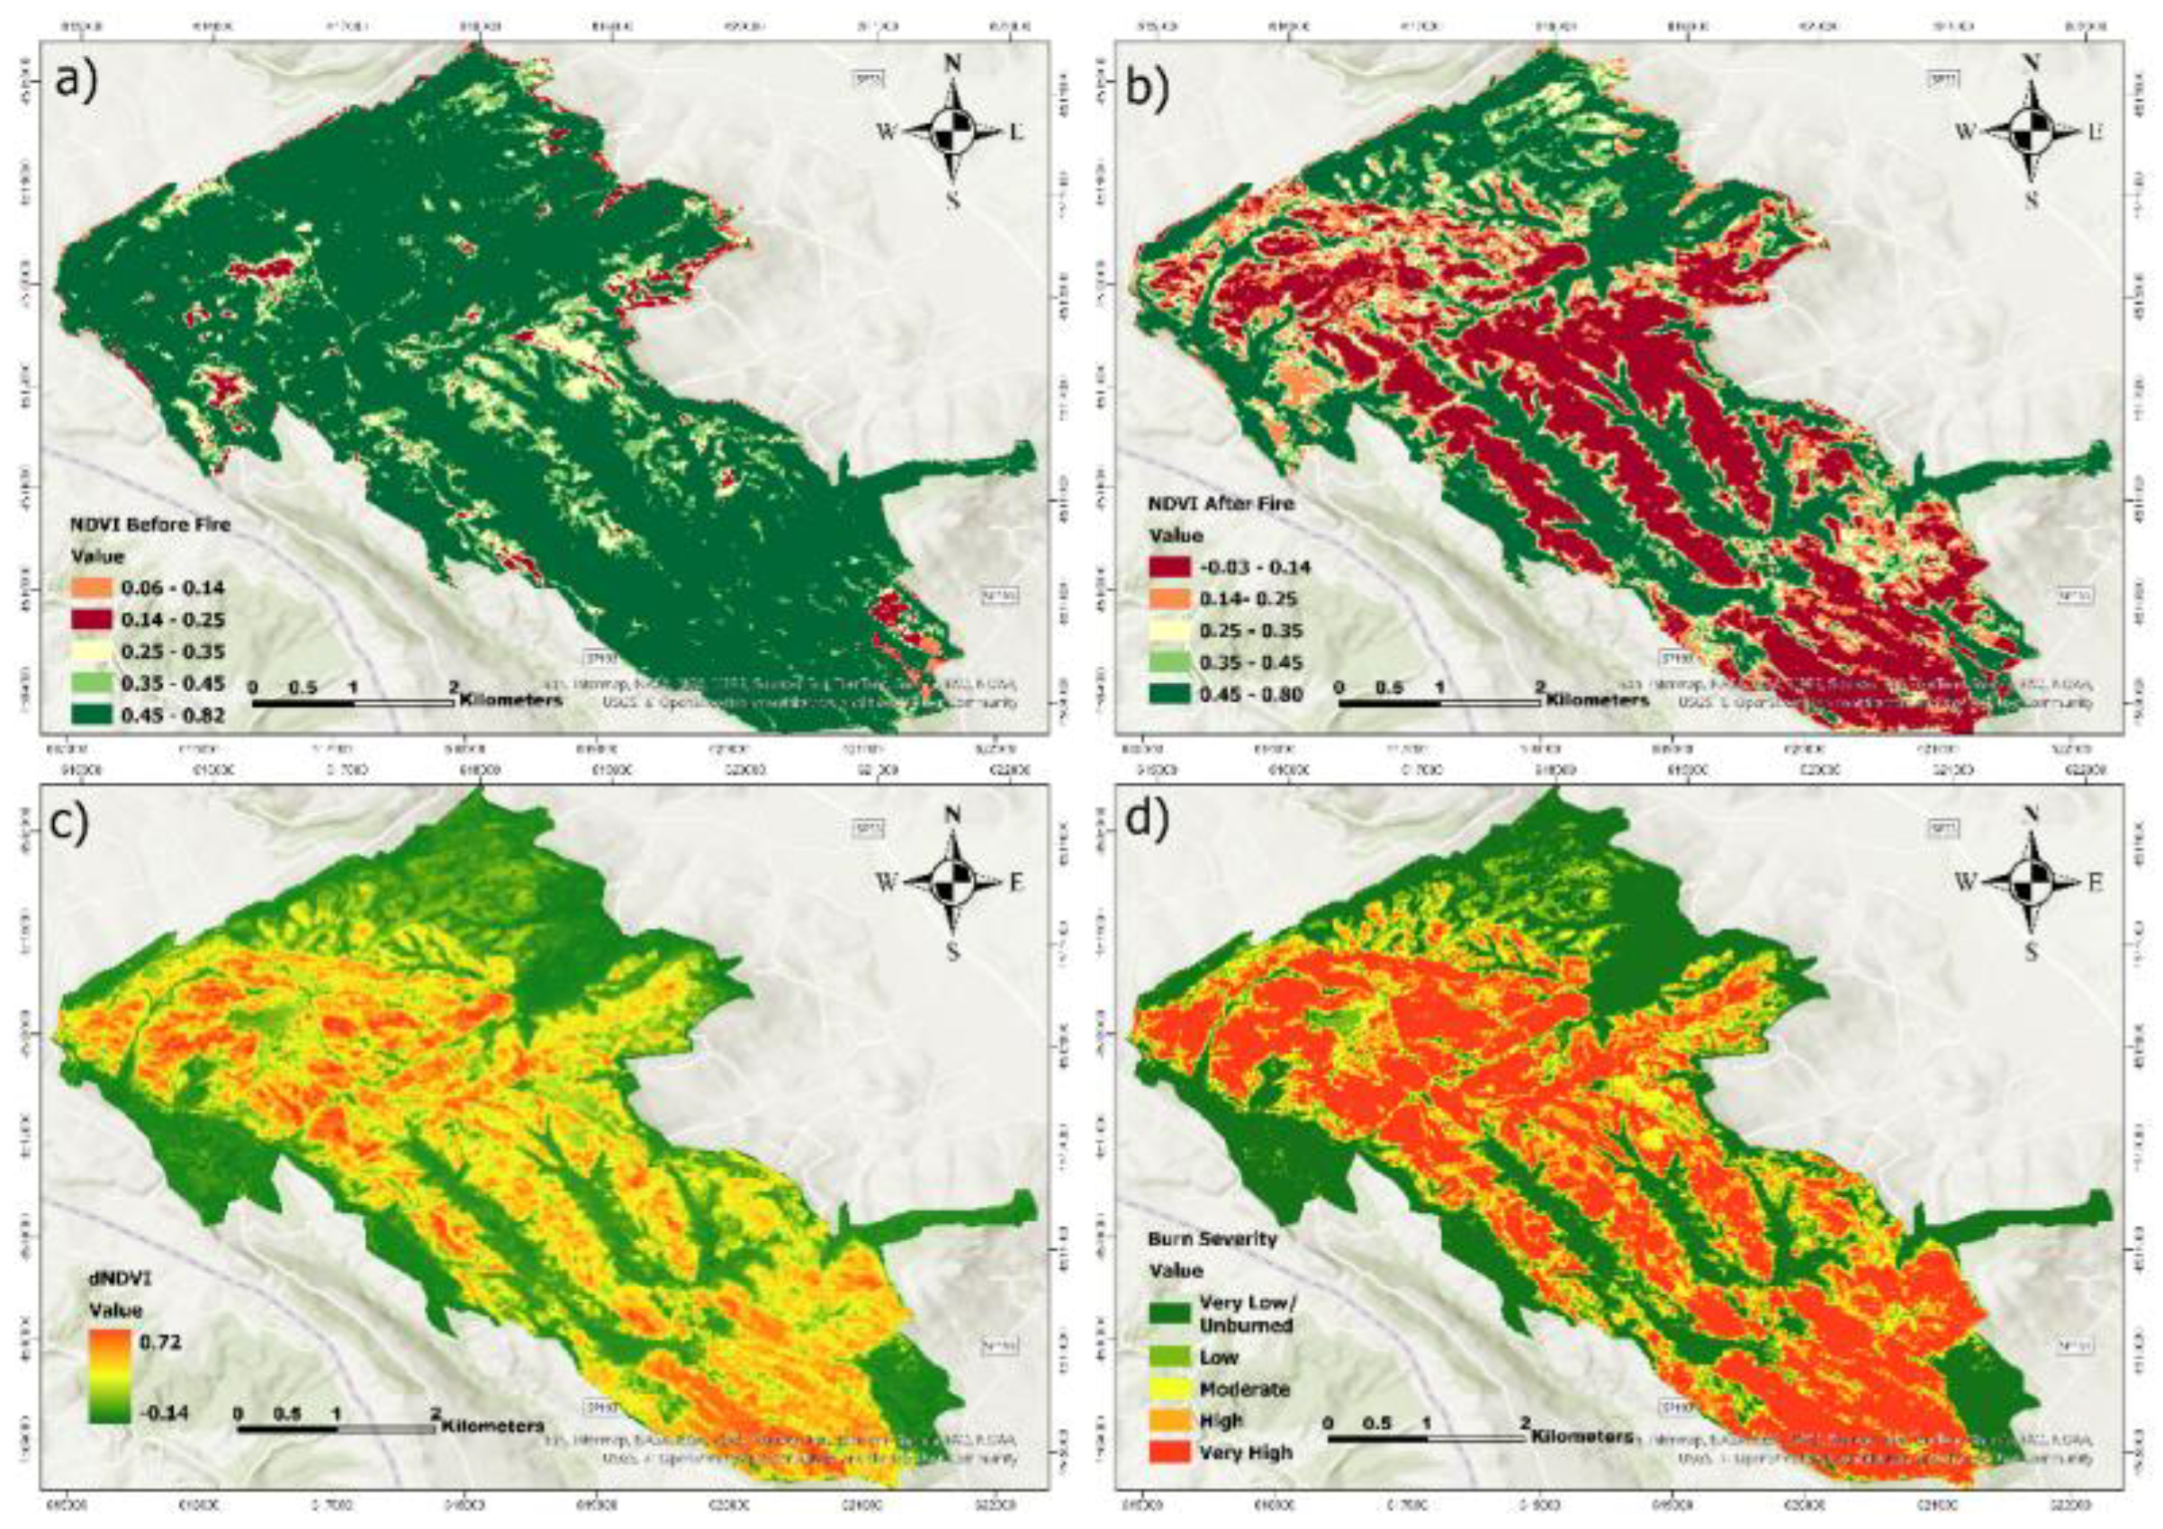
Figure 7.
NBR before fire (a), NBR post fire (b), dNBR (c) and Burn severity classification (d) for fire event in July 2021.
Figure 7.
NBR before fire (a), NBR post fire (b), dNBR (c) and Burn severity classification (d) for fire event in July 2021.
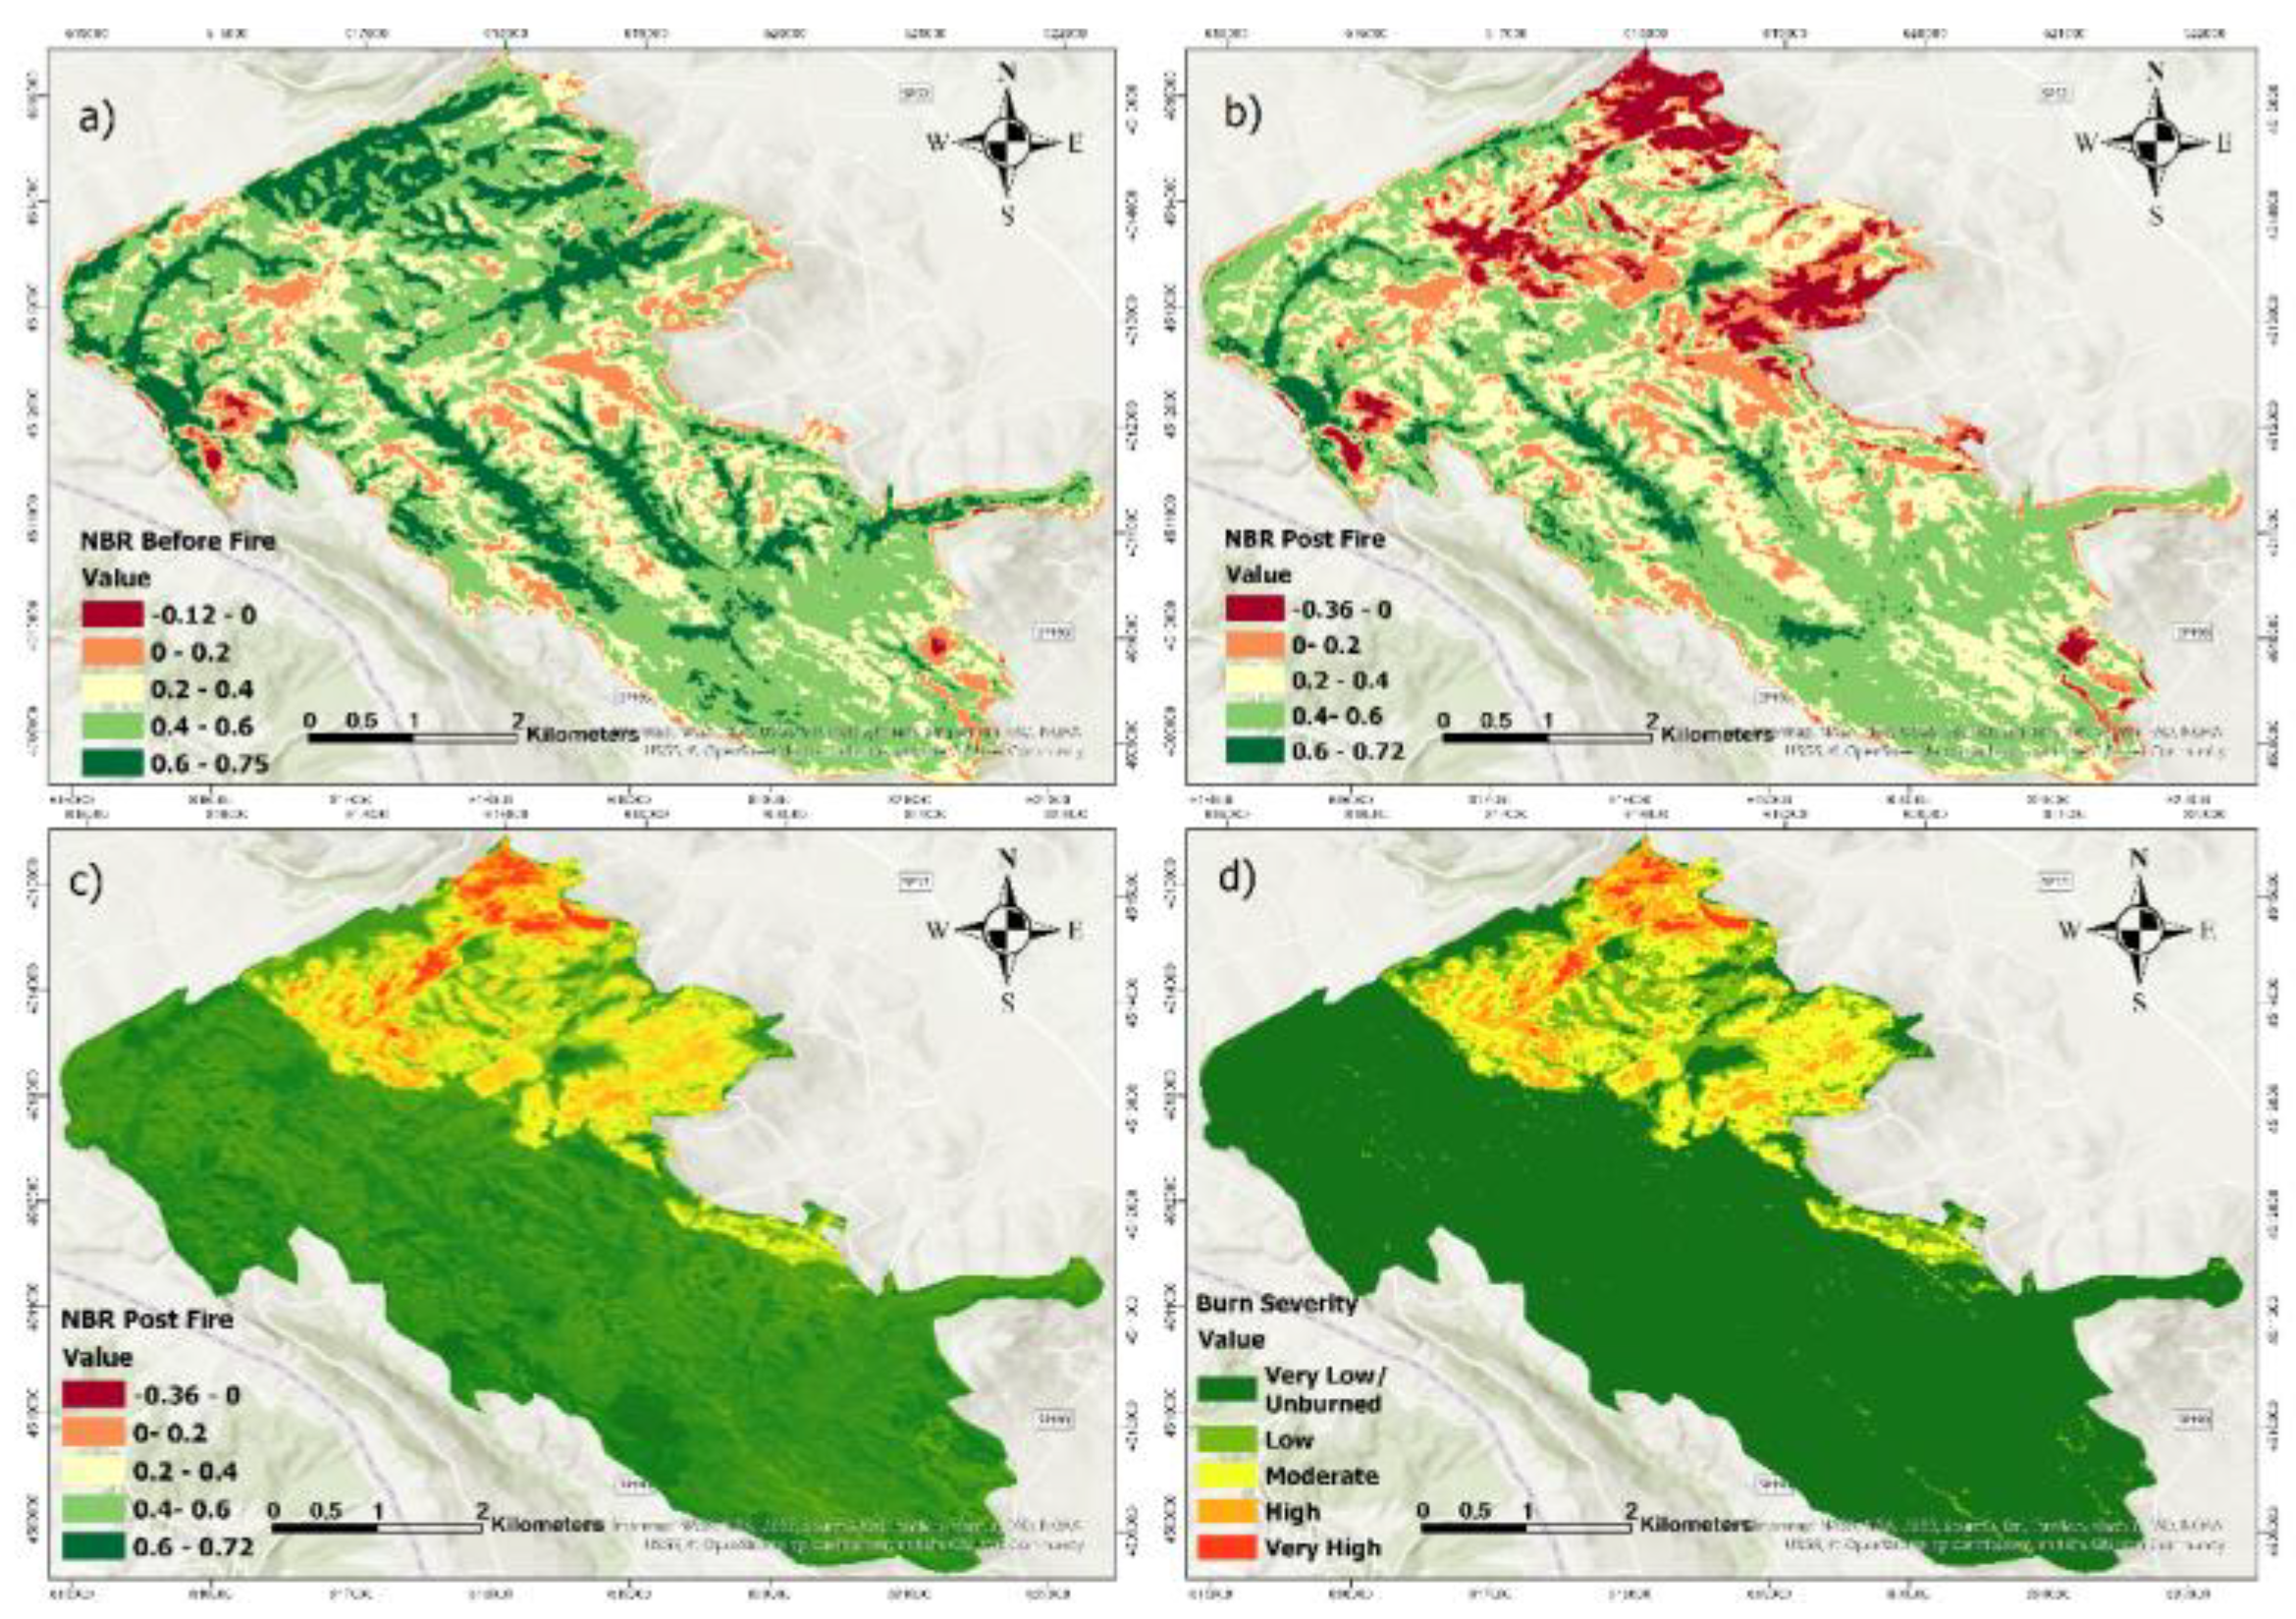
Figure 8.
NDVI before fire (a), NDVI post fire (b), d NDVI (c) and Burn severity classification (d) for fire event in July 2021.
Figure 8.
NDVI before fire (a), NDVI post fire (b), d NDVI (c) and Burn severity classification (d) for fire event in July 2021.
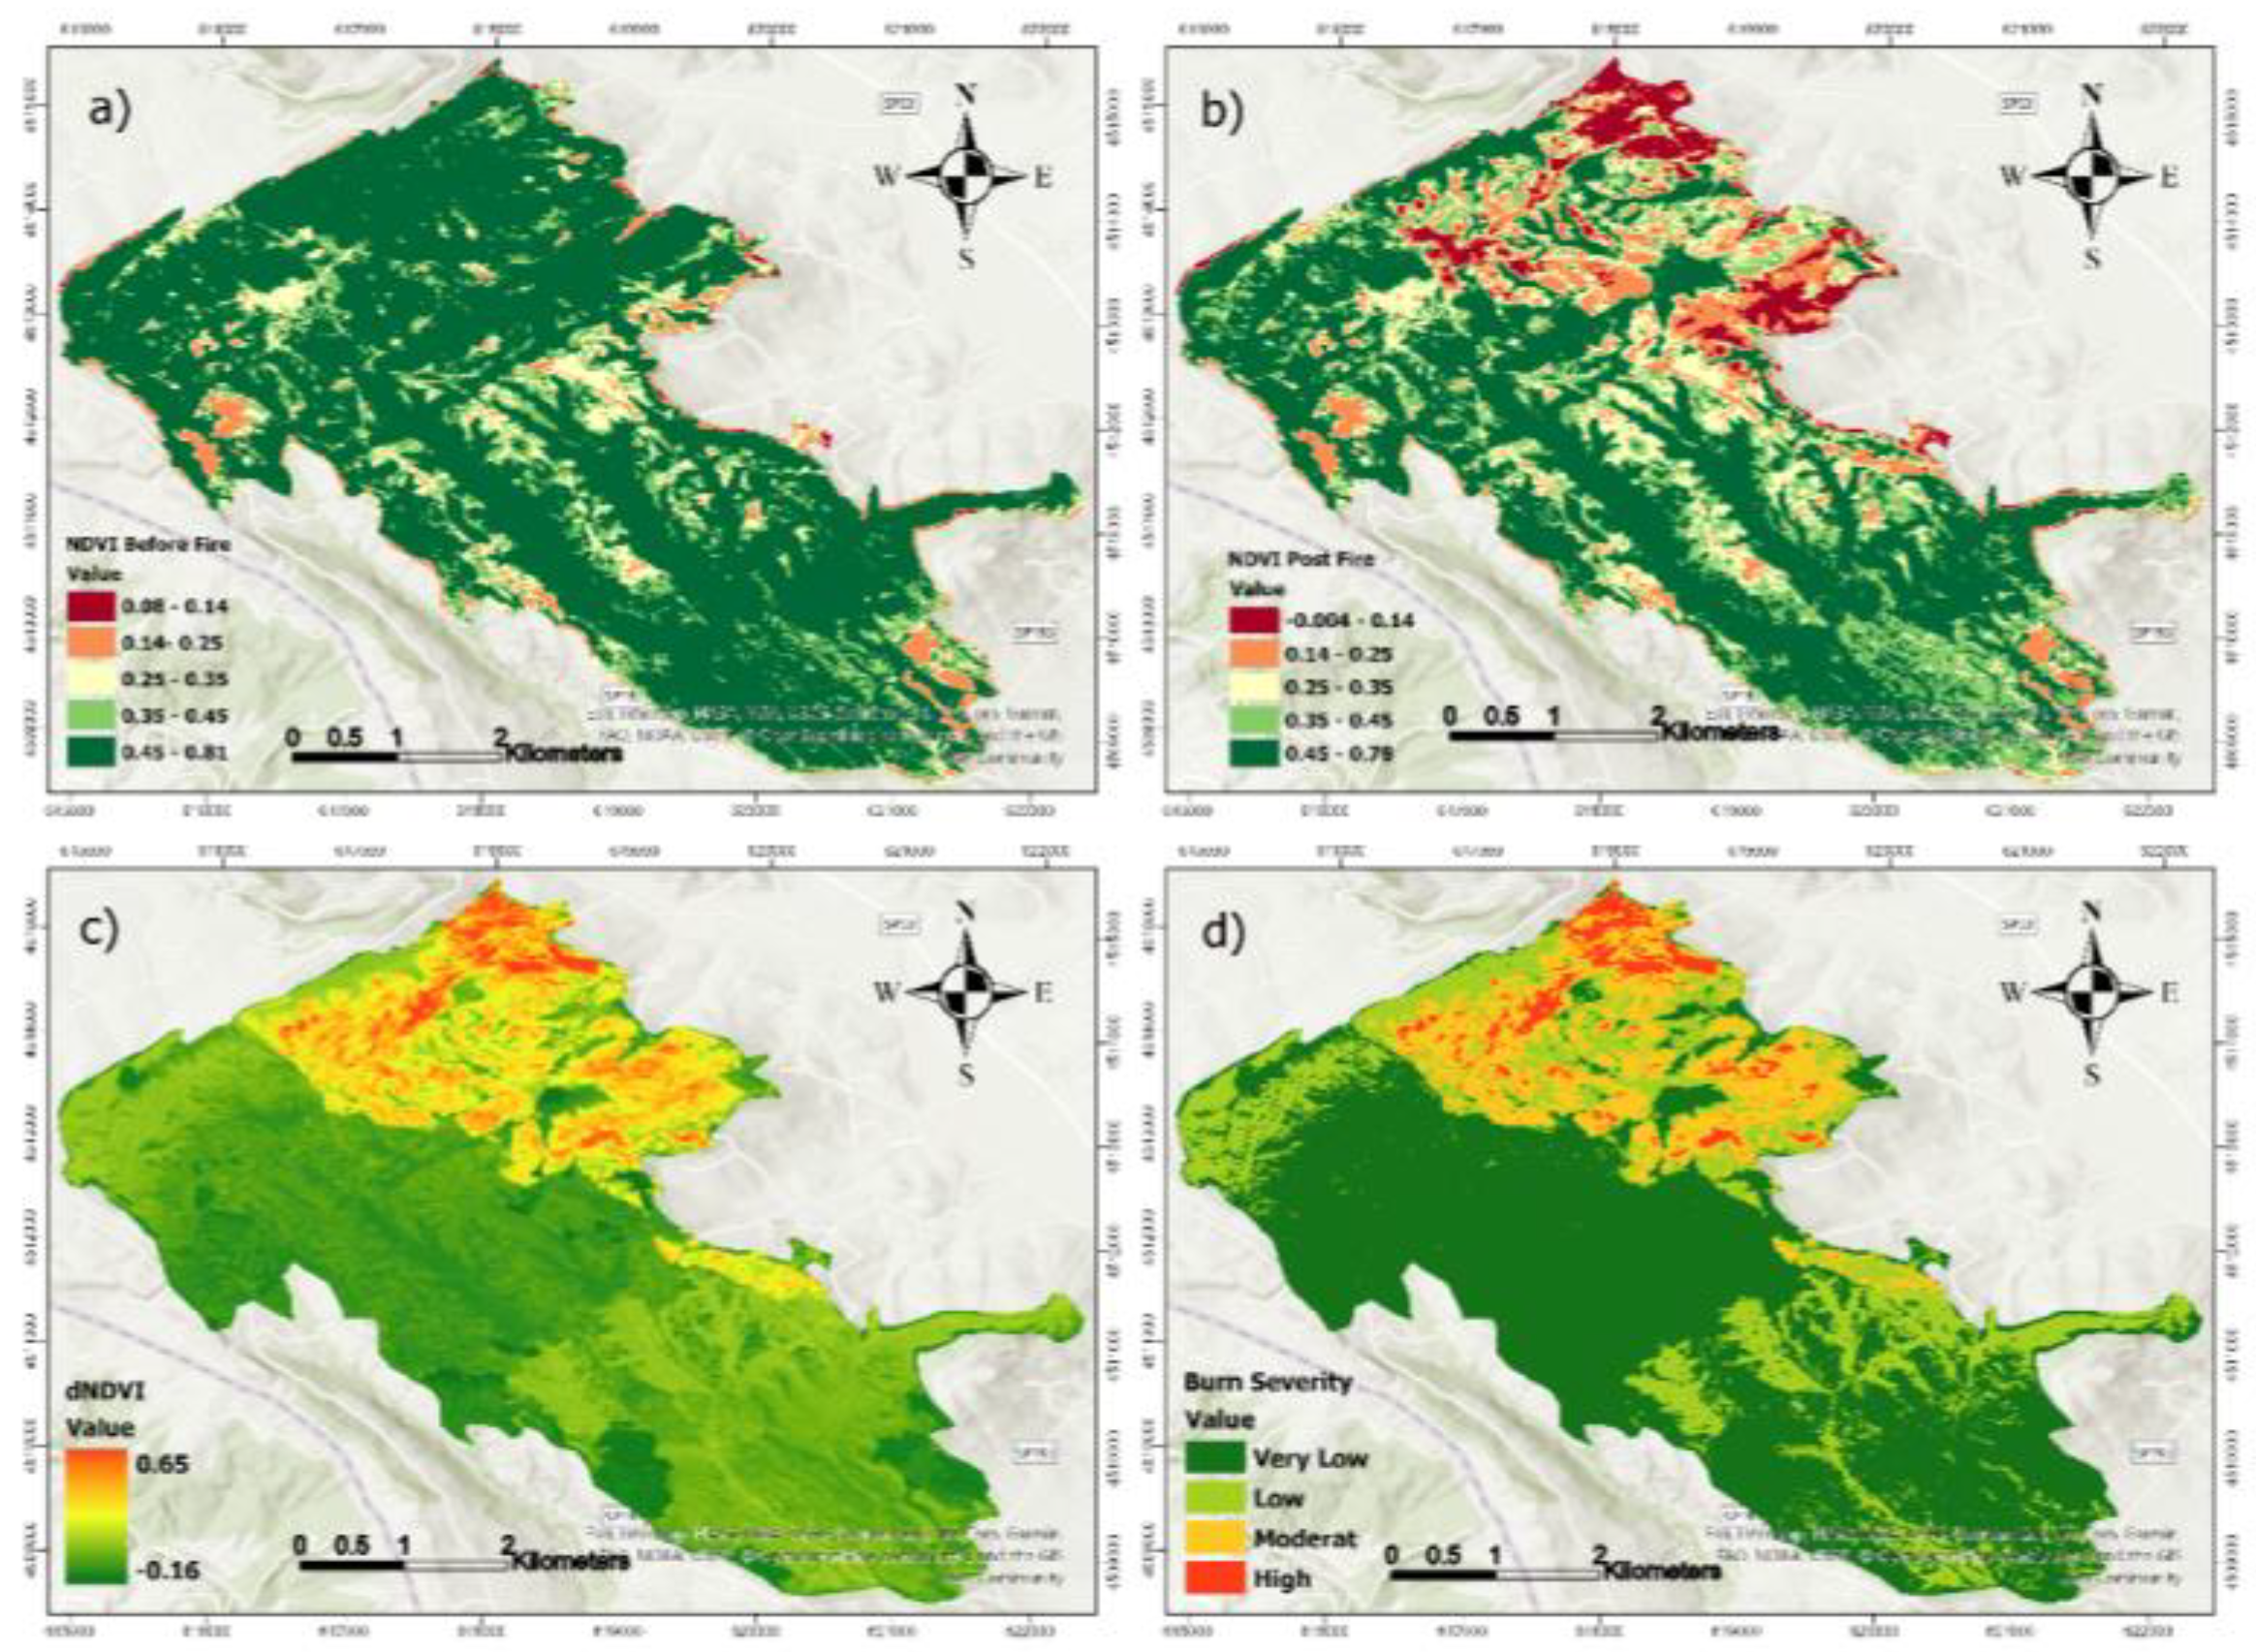
Figure 9.
Vegetation recovery in each burn zone after one year, two years and three years of fire in area burned on August 2017 (a) and area burned on July 2021 (b).
Figure 9.
Vegetation recovery in each burn zone after one year, two years and three years of fire in area burned on August 2017 (a) and area burned on July 2021 (b).
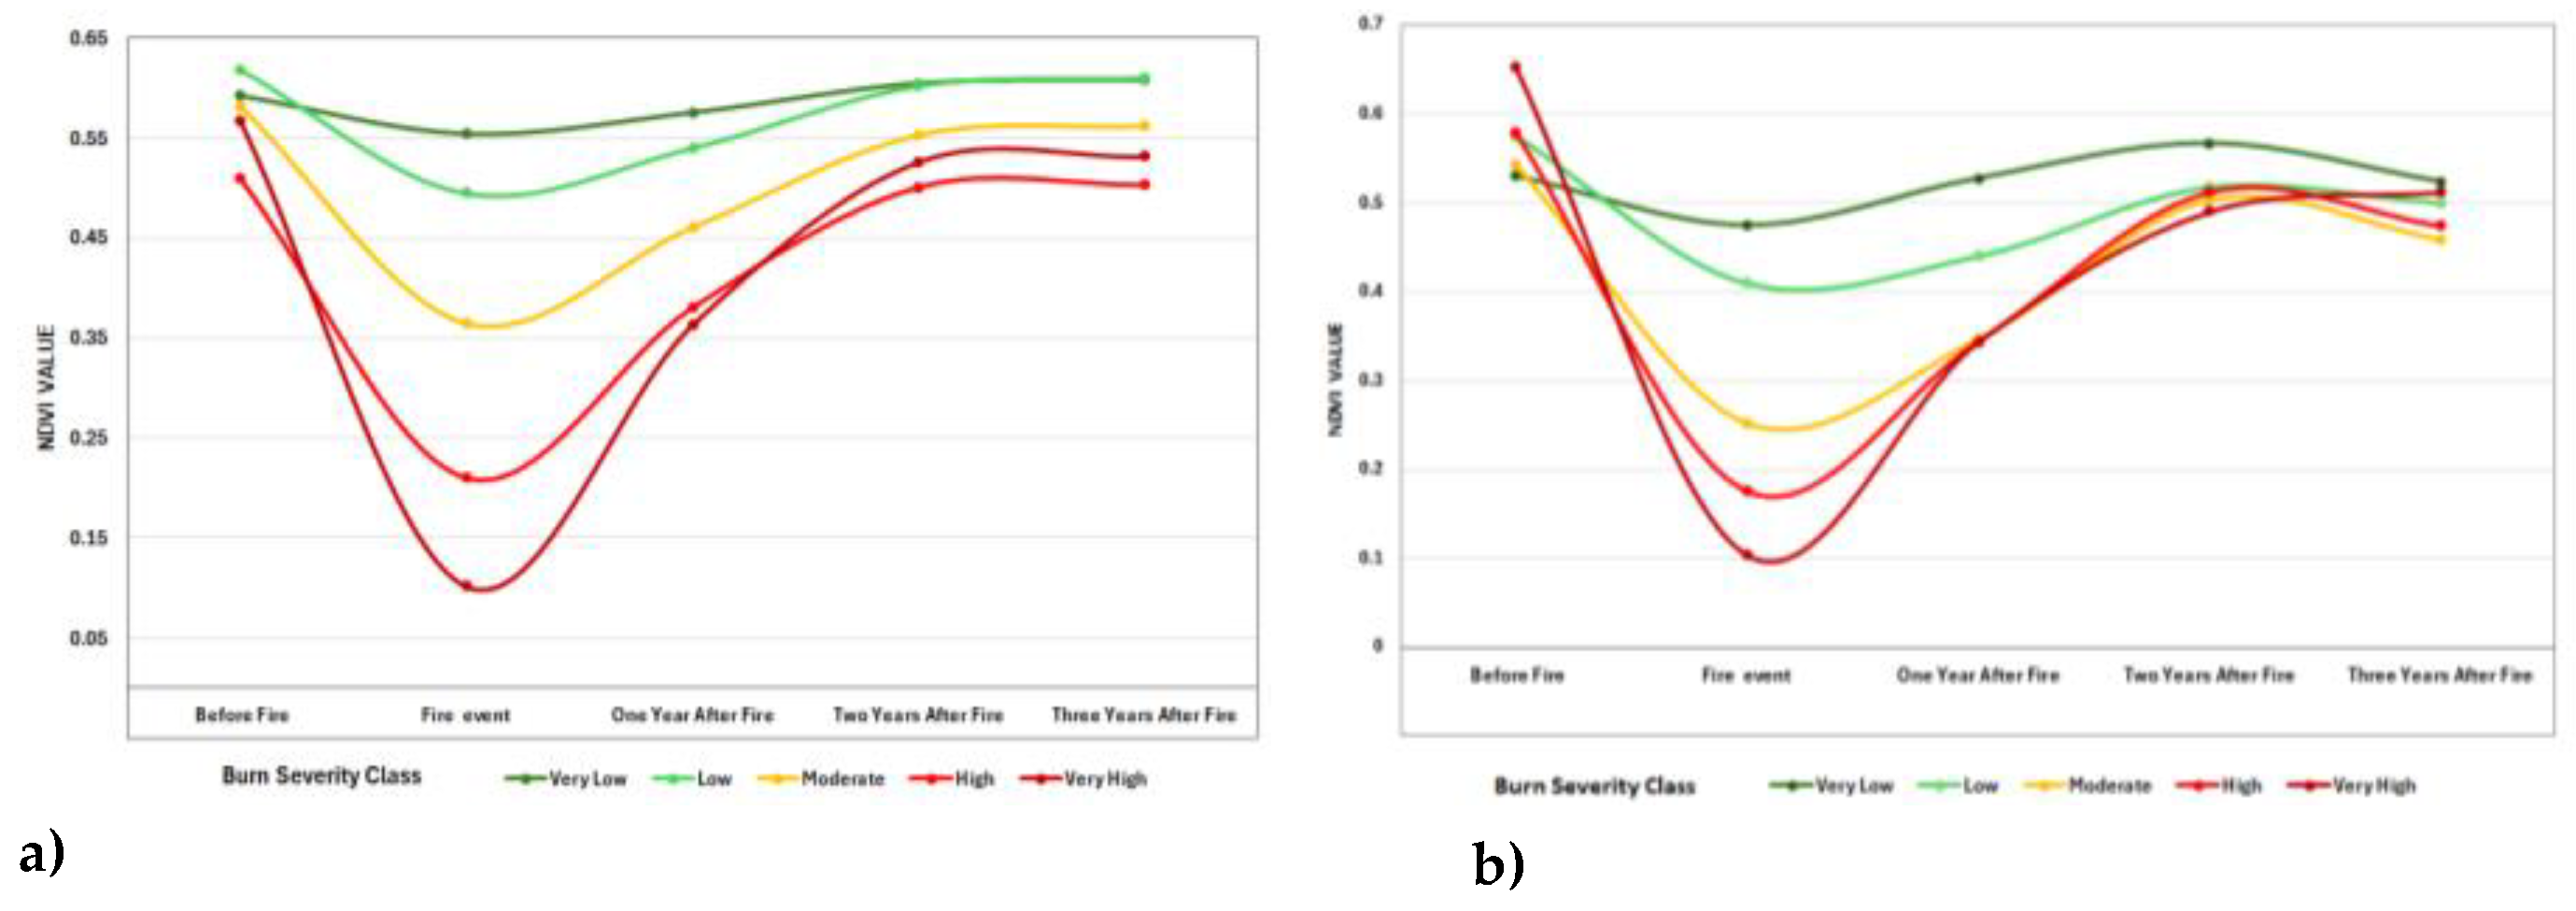
Figure 11.
NDVI time series for Overlapped burned area on August 2017(a) and 2021 (b).
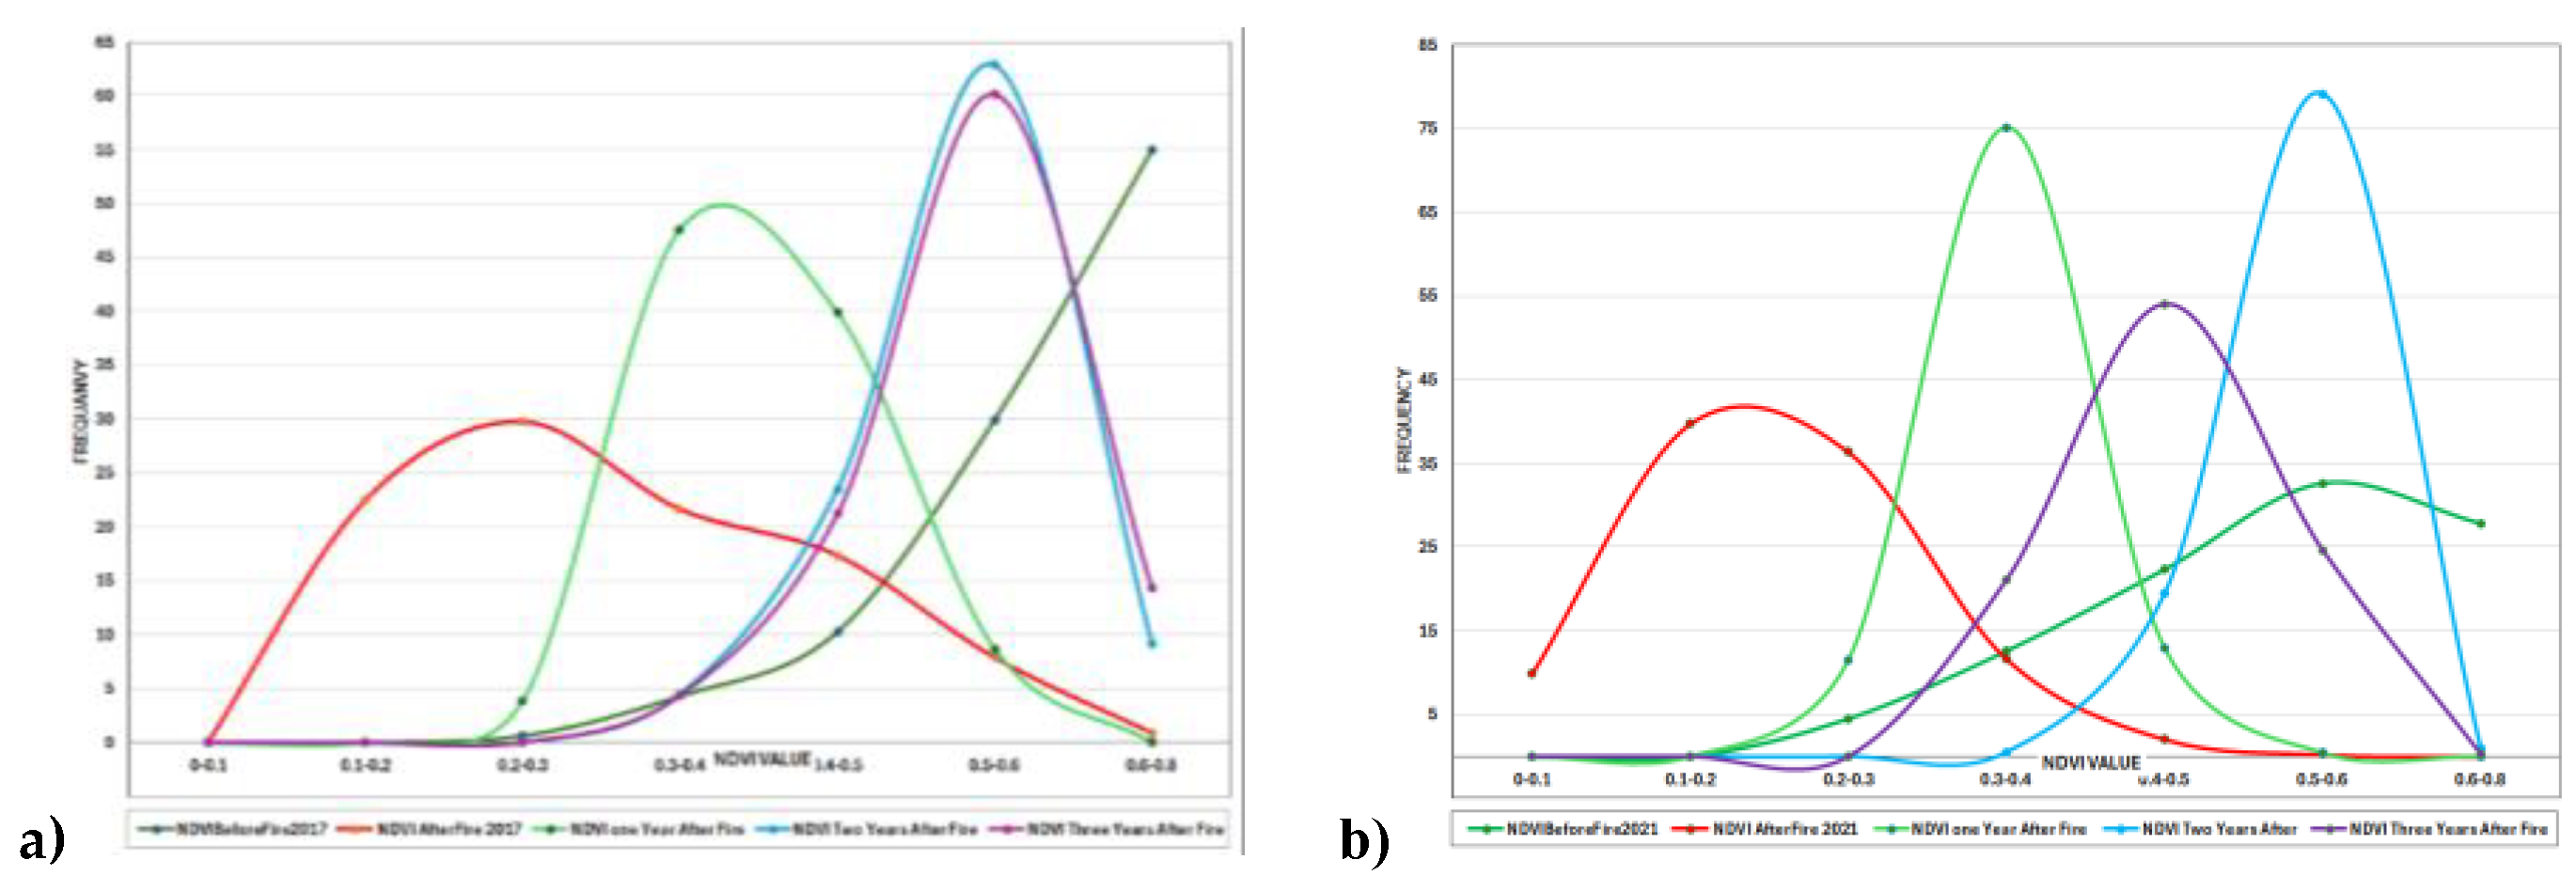
Table 1.
The fire events in the study area.
| Fire | Date | AREA (ha) |
|---|---|---|
| Bosco Difesa Grande | 23/07/2007 | 372.47 |
| Bosco Difesa Grande - Rifessa Pantone | 12/7/2010 | 0.39 |
| Bosco Difesa Grande - Rifessa Pantone | 12/7/2010 | 0.918 |
| Bosco Comunale | 25/06/2011 | 1.63 |
| Bosco Comunale Difesa Grande | 29/06/2011 | 19.93 |
| Bosco Comunale Difesa Grande | 10/7/2011 | 27.80 |
| Bosco Comunale Difesa Grande | 30/06/2012 | 12.95 |
| Bosco Comunale Difesa Grande | 30/06/2012 | 16.34 |
| Bosco Difesa Grande | 15/08/2013 | 7.14 |
| Difesa Grande | 12/8/2017 | 24.13 |
| Difesa Grande | 12/8/2017 | 44.30 |
| Difesa Grande | 12/8/2017 | 1240.25 |
| Difesa Grande | 28/07/2021 | 935.67 |
Table 2.
Index Formula.
| Index | Name | Equations | Reference |
|---|---|---|---|
| NBR | Normalized Burn Ratio | (NIR- SWIR)/(NIR + SWIR) NBR = (B08 – B12)/(B08 + B12) |
Keeley, J. E. 2009 |
| NDVI | Normalized Difference Vegetation Index | (NIR−RED)/(NIR+RED) | Rouse et al. 1973 |
| dNBR | Differenced Normalized Burn Ratio | dNBR = NBRpre-fire − NBRpost-fire | Key& Benson. 2006 |
| dNDVI | Differenced Normalized Difference Vegetation Index | dNDVI = NDVIpre-fire − NDVIpost-fire | Escuin et al, 2007 |
Disclaimer/Publisher’s Note: The statements, opinions and data contained in all publications are solely those of the individual author(s) and contributor(s) and not of MDPI and/or the editor(s). MDPI and/or the editor(s) disclaim responsibility for any injury to people or property resulting from any ideas, methods, instructions or products referred to in the content. |
© 2025 by the authors. Licensee MDPI, Basel, Switzerland. This article is an open access article distributed under the terms and conditions of the Creative Commons Attribution (CC BY) license (http://creativecommons.org/licenses/by/4.0/).
Copyright: This open access article is published under a Creative Commons CC BY 4.0 license, which permit the free download, distribution, and reuse, provided that the author and preprint are cited in any reuse.


