
Submitted:
05 August 2025
Posted:
07 August 2025
You are already at the latest version
Abstract
(1) The Spanish Mediterranean is the destination of millions of tourists, blessed by the absence of rain in summer, the holiday period par excellence. Yet two major natural threats loom over this area: flooding and wildfires. It is precisely the summer drought, a climatic feature that is rare on a global scale, which helps them to start and spread. Mediterranean vegetation adapts to climate and wildfires. (2) This study analyses one of these adaptations: its regenerative capacity following wildfires that occurred in the Spanish province of Castellon. It examines changes in NDVI in the affected areas using Landsat images processed with the Climate Engine application, as well as NBR values calculated from Landsat imagery in GEE. (3) The analysis reveals a downward trend in fires and burned area. The NDVI values also indicate the strong regenerative capacity of well-adapted Mediterranean vegetation, with values rising to above the threshold of 75% of the pre-fire NDVI in all cases within five years, regardless of the type of vegetation cover or environmental factors such as precipitation. Conversely, the NBR percentages are less impressive. (4) Howeveronly partially reflect the actual situation since, as shown by field photographs and the Google Earth application, although the vegetation cover has recovered, its structure has not, as this process takes a longer period of time.
Keywords:
wildfires
; Climate Engine
; NDVI
; NBR
; Google Earth
; recovery
; time series
; R
1. Introduction
Wildfires are not important merely because of their connection to climate change: they are an integral part of ecosystems across the planet [1], including forests, savannahs, grasslands, steppes and mountainous areas [2]. As a clear illustration of their significance, wildfires have a profound impact on ecosystems, their flora, fauna and functionalities [3]; they damage infrastructures and properties and threaten the wellbeing of people [4]. Along with earthquakes, hurricanes, volcanic eruptions and icebergs, they are among the five most significant natural phenomena [5]. Around 400 million hectares are burned globally each year in wildfires [6], 90% of which are started by humans, with the remainder caused mainly by lightning [7]. Although wildfire figures may vary from year to year, in 2023, around half (over 200 million hectares), occurred in Africa, whilst two additional quarters, in equal measure, happened on two other continents with tropical regions: South America and Oceania. The remainder was spread across Asia (35 million), North America (almost 30 million, its worst figure since 2012) and Europe (11 million hectares) [6]. Only ecosystems dominated by cold, wet and dry conditions, such as tundra, rain forests and deserts, are spared from wildfires. This means their prevalence extends across many northern, temperate and tropical forests, including most vegetation types found in Mediterranean climates [8].
While well below the figures reported in tropical regions or large northern countries (in 2023, 10 million hectares were burned in Russia, 15 million in Canada, and 4.5 million in the United States), in that same year, 140,000 hectares were burned in Spain, 172,000 in Italy and 169,000 in Greece. These figures are much higher than for the rest of Europe [6]. Unlike less exploited regions such as the forests in North America and Siberia, the Mediterranean area experiences intense human pressure on its forests and fire develops in close association with this [9].
Indeed, wildfires are the primary natural hazards in the Mediterranean, together with floods [10]. They are the main natural disturbance for Mediterranean vegetation [11], and are especially relevant in many forest and shrub ecosystems [3]. They are helped by the fact that the Mediterranean climate is the only one whose dry season falls during the hottest period of the year. From a social and economic perspective, what is a major draw for millions of tourists poses a significant challenge for its long-suffering yet hardy vegetation, while another of its attractions, its warm sea, favours the formation of storms and increases the likelihood of lightning strikes. Moreover, this Mediterranean climate is also bound up with mountains, a compartmentalised relief which exacerbates winds and fuels wildfires [12]. In conditions of heat and low humidity, wind becomes a key meteorological factor, especially the high-speed offshore winds of summer, known for their intense drying effect [9].
Mediterranean plant species adapt to these harsh summer droughts with a high content of resins or essential oils, which are more concentrated in summer, making them highly combustible [9,13]. While these species are adapted to drought, they are also well-equipped to withstand fire—through traits such as thick bark, numerous dormant buds, cones and fruits that open under intense heat, seeds with thick insulating tegument, and the presence of rhizomes or creeping roots [9]. Following a wildfire, they have other strategies such as resprouting capacity, persistence of the seed bank and greater dispersal capacity [11]. Even with these defences, the high recurrence of wildfires completely transforms the ecosystem’s floristic composition by diminishing its richness and diversity, as well as its architecture by simplifying the strata. The dominance of scrubland with an abundance of sclerophyllous species increases [14], leaving broadleaved species in the less affected areas [9].
In addition to natural factors, human influences such as densely populated areas, recreational use of mountains and changes in the landscape resulting from rural depopulation also play a significant role [15]. Strikingly, human impact extends beyond causing fires to also include their prevention. In the 20th century, fire suppression lessened forest heterogeneity, biodiversity potential and fuel build-up [16]. Yet, there is no shortage of cases where fire is essential to preserve ecosystem health [17].
Though wildfires are part and parcel of many ecosystems, they lead to degradation and soil erosion [2,13] and, thus the loss of nutrients [18], increasing gas and soot emissions. They worsen air quality and biodiversity as well as damaging soil structure and its water retention capacity [2]. As they affect vegetation, they interfere with the water and carbon cycles of most ecosystems [19]. Smoke particles are a major source of aerosols which influence atmospheric radiative transfer by scattering and absorbing solar radiation and altering cloud microphysics. Wildfires can thus change clouds, precipitation and even atmospheric circulation [8]. They have consequently been studied from many standpoints.
Satellite-based remote sensing, for example, has analysed vegetation dynamics, invasive species and changes in land use to assess crop conditions, drought severity and wildfires [20]. In the latter, satellites have been harnessed to investigate wildfires, their risks, potential and management, detection, severity and recovery by assessing and quantifying the spatial and time-based variations of changes in vegetation cover in fire-affected areas [2]. Wildfires bring about a number of changes by devouring vegetation, destroying chlorophyll, leaving bare soil, charring roots and altering soil moisture, all of which alter the electromagnetic response of the surface and mean they can be spotted by remote sensors [21]. Remote sensing's contributions to wildfire science and management are almost never-ending [22].
This study utilized Normalized Difference Vegetation Index (NDVI) and Normalized Burn Ratio (NBR) data to analyse the recovery capacity following large-scale wildfires in a region of eastern Spain. NDVI has already been used in similar studies based on Landsat, AVHRR, SPOT/VEGETATION and MODIS images for the Spanish Mediterranean area [3,13,14,18,23,24,25], in an aim to understand the resilience of Mediterranean vegetation to fire [26]. Our study extends the analysis to a total of 25 large-scale wildfires and, far from being restricted to specific pixels, it gathers the NDVI of the entire burned area. It also expands the volume of data well beyond the analysis of one Landsat image per year, thereby circumventing the problem of comparing NDVI data taken in different phenological periods.
2. Materials and Methods
2.1. Study Area
The second most important administrative division in Spain is the province. Our study area is Castellon province, the northernmost of the three making up the Valencian Region. It lies between 0o50’46.45’’ W and 0o41’26.50’’ E longitude and between 39o42’53.01’’ N and 40o47’19.16’’ N latitude. It features coastal plains and a mountainous inland presided over by Penyagolosa Mountain, its highest elevation (1,813 metres). Indeed, geographically speaking it is known as the second most mountainous province in Spain. Although this reputation is not deserved, it does have a mountainous relief with 75.10% of its territory having slopes above 10o [27]. Between 1990 and 2024, its 6,638 km2 experienced up to 25 large-scale wildfires affecting a surface area of over 500 hectares (Figure 1 y Table 1).
The province's climate is very much shaped by latitude, yet especially by altitude and distance from the Mediterranean, a warm-water sea which is a source of potential convective processes. Accordingly, the climate contrasts in the province are more marked along its east-west axis as altitudes increase in step with the distance from the sea. Temperatures decrease in this direction, especially in winter, thus increasing thermal amplitude, which is unambiguous proof of its more continental character. As for rainfall, once again, altitude and distance from the sea create a contrast between the typical coastal Mediterranean regime, below 500-600 metres in altitude with a peak in autumn and a very pronounced summer low (July) which exceeds the secondary winter minimum, and the less defined Iberian Mediterranean regime where the summer low diminishes until it is surpassed by the winter minimum. The north-western sector dominates, home to the Iberian mountain range: Gudar, Maestrazgo, Penyagolosa and Els Ports, where the hallmark of the Mediterranean climate, summer drought, disappears. Here, annual totals can top 800 mm which, while not exceptional, are far better than the little more than 400 mm in most coastal areas. The decline on the coast is coupled with the reduction and virtual disappearance of snowfall and frosts [28].
This east-west staggering of climate components enables a distinction to be drawn between three climate types: the coastal plain climate, characterized by predominantly autumnal rainfall—accounting for around 50% of the annual total—and notably mild temperatures throughout the year; a transitional climate, where the autumn rainfall peak gradually gives way to a spring maximum, summer dryness becomes less pronounced, and annual and winter temperatures decline, although summer temperatures remain relatively high; and finally, the mountain climate, found above 800 metres in elevation, where spring and autumn rainfall peaks are of similar magnitude, and summers are cooler and more humid due to the frequent occurrence of convective storms. This is one of the stormiest areas of the peninsula [29], specifically Maestrazgo in Teruel and Castellon in a quadrilateral bounded by the Teruel towns of Mosqueruela, Valdelinares and La Iglesuela del Cid and the Castellon town of Villafranca [30]. In fact, Castellon province registered a record number of lightning strikes in a single day in Spain: 16,548 on 17 August 2003 [31]. Based on the Köppen-Geiger classification, the province is divided diagonally: the south and coast correspond to Csa, a temperate Mediterranean climate with a hot, dry summer, and the Csb variant with a cooler summer at higher elevations in the south. To the west of the diagonal, an inland area widening towards the north hosts the domains of Cfa with no dry summer, which morphs into a Cfb featuring a temperate summer at higher elevations [30].
In terms of Land Use and Land Cover (LULC) (Figure 2), and based on CORINE Land Cover data [32,33], four land uses exceeded 5% in 2018. Scrub and/or herbaceous vegetation associations led the way at 2,783 km2 (41.6%), followed by forests which accounted for a quarter of the terrain at 1,697 km2. Natural areas were rounded off by open spaces with little or no vegetation at 80.3 km2, barely 1.21%. The other two major land uses were agricultural: 1,116 km2 (16.8%) taken up by permanent crops and 543 km2 (8.19%) in heterogeneous agricultural areas. CORINE Land Cover identifies three types of forests in the province at its more specific level 3 [34], where conifers predominate at over 1,114 km2 compared to 470 km2 and 114 km2 in broadleaved forests and mixed forests, respectively. The study territory thus conforms to the Mediterranean pattern in which pines are the most extensive forests. Specifically, the Aleppo pine (Pinus halepensis) is the most widespread on the coasts of Spain, France, Italy, Greece, Turkey and Morocco [9].
Notwithstanding the large-scale wildfires which have affected the territory, changes in LULCs between 1990 and 2018 showed a net increase of 384 km2 in forested area, up from 1,313 to 1,697 km2. Forests gained 246 km2 net from scrub and/or herbaceous vegetation associations, gaining 565 km2 whilst losing 319 km2. However, scrub and/or herbaceous vegetation associations rose by 129 km2, gaining ground from agricultural areas. Indeed, the other significant figure is the loss of heterogeneous agricultural areas, 649 km2 or 10% of the provincial territory, which have been converted into permanent crops, scrub and/or herbaceous vegetation associations and open spaces with little or no vegetation.
2.2. Materials
The first of the datasets used in this study was the wildfire database in Castellon province [35], provided by the Integrated Wildfire Management System run by the Valencian Regional Government. This database goes back to 1968 and is considered definitive until 2016. Data from subsequent years are provisional. It consists of the date and time, municipality and comarca (a traditional territorial division in Spain, similar to a county) where the fire started; forested, cleared and totally burned areas in hectares, and the cause of the fire. The database was reviewed to check for mistakes in the names of municipalities and their assignment to comarcas. In 2023, five municipalities in the province (Atzeneta del Maestrat, Benafigos, La Serratella, Villafranca del Cid and Vistabella del Maestrat) changed comarca,following the regional government’s approval of their relevant and justified requests [36]. In fact, within the database, wildfires originating in these municipalities had been assigned to different comarcas depending on the year of the fire. These inconsistencies have now been corrected. Additionally, the geographical coordinates of the municipalities where the fires began have been added, along with new columns indicating the month and year based on the fire date.
Wildfire data are supplemented by additional information provided by the Ministry of Ecological Transition and Demographic Challenge which, like the regional figures, are divided into definitive statistics [37] and preliminary information [38].
CORINE Land Cover is another database used. It has five versions: 1990 [32], 2000 [39], 2006 [40], 2012 [41] y 2018 [33]. The next 2024 update is to begin in the first four-month period of 2025 and is set to be completed in the first four-month period of 2026, with publication expected in the following four-month period [42]. This database has furnished information on the LULC of burned areas.
CORINE classifies the terrain into various land covers with a degree of detail at three levels, from the most generic (Level 1) to the most detailed (Level 3). Level 1 has four categories: artificial surfaces, agricultural surfaces, forest and seminatural areas and wetlands, which are expanded into 15 subcategories at Level 2 and 44 at Level 3 [34].
The next crucial database for the study was the Normalized Difference Vegetation Index (NDVI) derived from Landsat satellite imagery [43]. Although not without its limitations [19], after been defined by Rouse in 1974, NDVI is the most popular of the spectral vegetation indices [3,19,44], and commonly employed to track changes in LULC [2]. It is calculated by:
where NIR is spectral reflectance in the near-infrared red channel and RED is spectral reflectance in the red channel [44,45]. NDVI ranges from -1 to +1. Values below 0 indicate water, clouds or snow, while those slightly above 0 represent bare soil. NDVI values increase with vegetation density and the strength of its phenological state [3]. NDVI is a robust indicator of the amount of green biomass and numerous studies show that it is the most widely used tool to assess vegetation recovery after a wildfire [24,46].
Landsat, which has provided most of the technology used in today's remote sensing satellites, was the first civilian satellite program designed for global land resource monitoring. It was started in 1967 under the name Earth Resources Technology Satellite (ERTS) [47], and although it was not launched until 1972 [47,48], subsequent satellites Landsat 5,7,8,9 (after the failed launch of Landsat 6 [47]) enabled the completion of an NDVI database with a resolution of 30 metres (which is reduced to 60-120 metres depending on satellites and sensors in the thermal band [47]). This represents the largest active time series of medium resolution data ever obtained by remote sensing [49]. This study utilized Landsat images directly to define burned areas and indirectly to extract NDVI values.
NDVI data have been available since April 1984 through the Climate Engine (CE) project [50,51]. This is an application embedded in Google Earth Engine (GEE) and constitutes an outstanding instrument for climate monitoring [52]. GEE, which was set up in 2010, is a cloud-based platform providing easy access to large collections of geospatial data [53,54]. Landsat imagery is among the most prominent [55,56]. It has been used to perform studies as varied as mapping burned land in Cape Province (South Africa) [57], assessing the effects of wildfires in Yosemite National Park [58], land degradation in South Africa [59], fire propensity in forests in India [60], changes in wildfire patterns in countries including Australia, Canada, Chile, China, Russia, the USA and in southern Europe [17], and studies of droughts, water resources and forest alteration [61]. It delivers computational capacity for data preparation and enables the creation and training of classifiers and algorithms, as exemplified by Climate Engine (CE) [50], a web portal that provides global satellite time series data.
Four smaller databases, limited to the location map (Figura 1), complete the data used. The relief data came from a digital elevation model, ALOS World 3D [62]. This is a global database generated from images gathered using a remote sensor called PRISM (an acronym for Panchromatic Remote-Sensing Instrument for Stereo Mapping), on board ALOS, the Advanced Land Observation Satellite. The Japan Aerospace Exploration Agency (JAXA) releases the database with a horizontal accuracy of 30 metres [63]. The basic hydrographic network [64] is derived from the 100 x 100 digital terrain model of the Army Geographic Service [65]. The provincial boundaries were obtained with the R geodata package. The same package facilitates the comarca boundaries but does not include the changes indicated above in the Valencian Region comarca map. Therefore, the vector file was downloaded from the Regional Government website [66].
2.3. Methods
The first step in the study was to compile a list of the large-scale wildfires, i.e., those affecting a surface area of over 500 hectares, in Castellon province (Table 1), by utilizing regional and national statistics [35,37,38].
Next, the areas affected by large-scale wildfires were defined. The GEE application was used to search for Landsat images taken before and after each wildfire analysed. NBR, which has been proven effective in detecting fires, was calculated based on these images [16]. The Normalized Burn Ratio, which was proposed in 1991 [68], is a spectral index that normalises the reflectance of near infrared (NIR, Landsat band 4) and mid-infrared (Landsat band 7) to monitor areas affected by wildfires [49]. The spectral behavior of burned areas is characterized by a sharp drop in near-infrared reflectance due to the destruction of leaf cell structure, and, conversely, by a significant increase in SWIR reflectance caused by the reduction in water content absorbed in that region [68]. Since 2001, the switch in NBR between two images (dNBR) has been used to map burned areas [49] and assess fire severity [17]. Similarly, the affected areas of large-scale wildfires in Castellon were successfully delineated using the GEE application and exported as shapefiles. The only exception to this procedure was the wildfire which broke out in Andilla on 29 June 2012. This is the only wildfire for which Landsat 7 images had to be used as it fell within the time interval between 5 May 2012, when Landsat 5 ended, and 18 March 2013, when Landsat 8 began. Landsat 7 generates images with bands of pixels with no data due to an error in the operation of the scan line corrector, an issue which was resolved using a focal mean filter [69].
The GEE application includes a “draw shape” tool which was used to delimit the burned area. The figure created is closed and its geometry included in the script. Its configuration was switched from “Geometry” to “Feature Collection”. The top of the script includes the code for “Imports” and a “Show generated code” option, displaying the generated code which is copied into another script with the command to save the geometry. The task created runs by changing the output to shp, shapefile. The result opens in Google Drive from where it can be exported to a computer and used in a GIS. These areas, one for each wildfire, were used to retrieve NDVI data from the Climate Engine (CE) application which were then read, analysed and displayed with various R software packages (Table 2).
The first step was to download and read the files with the information obtained from the CORINE Land Cover database stored with the reference coordinate system EPSG 25830. EPGS is the initialism for “European Petroleum Survey Group” [70], originally established for the oil industry and nowadays used as a reference. EPSG 25830 corresponds to the reference system ETRS89 (European Terrestrial Reference System) projection UTM (Universal Transversal Mercator) zone 30N. Both the 1990 and 2018 files were cropped using the administrative boundaries of Castellon province (the study area), to analyse the LULC distribution. These administrative boundaries were downloaded with the R geodata package. Their reference system is geographic, WGS84/EPSG 4326 (World Geodetic System), so they were first transformed to the ETRS89/EPSG 25830 of the CORINE Land Cover layers. This transformation enabled the areas to be calculated more accurately. A legend was also added with the levels of the CORINE Land Cover layers and their colour palette. The CORINE Land Cover layers from 1990 and 2018, the first and last years of the database, show how land use changed over the period analysed. However, some of the large-scale wildfires went beyond the province's borders. A decision was made to study all the areas which were burned and so the entire CORINE database from 1990 to 2018, including the intermediate years 2000, 2006 and 2012, was cropped to encompass a larger area (Table 3) including the province and all the wildfires.
The next step consisted of obtaining NDVI data from the Climate Engine website [51,71], enabling data to be retrieved from a point or surface defined in a vector file. NDVI has a slight advantage over other indices in post-fire recovery detection as it observes a wider range of values, making it easier to identify changes in trends [72]. The perimeter of each burned area was saved in shapefile format. This shapefile format is supported by the website as long as it is in the WGS84/EPSG 4326 (World Geodetic System) geographic reference system. To prevent errors when selecting and assigning polygons, the process was carried out after visually inspecting the polygons in QGIS software.
Once the NDVI data had been obtained, they underwent a twofold process consisting of locating outliers and imputing them using the capping method. This method replaces the upper outliers with the 95th percentile value and the lower ones with the 5th percentile. Next, temporary reference files were created to locate the months with no Landsat images where no data was available. The missing data were replaced by the Weight Moving Average method based on the two closest observations.
The next step was to analyse the intensity of the wildfires and vegetation recovery. Previous studies have used a wide variety of methods such as calculating the annual NDVI slope following the wildfire [14], comparing the minimum NDVI value recorded in the year of the fire with the median of the previous four years [23] and measuring recovery based on changes in vegetation indices across multiple time frames: the year before the fire, the year of the fire, the following year, and additional recovery phases at short-term (+6 years), medium-term (+11 years), and long-term (+16 years) intervals [73].
The methodology employed in this study with the R tidyverse package was as follows. The monthly averages per year and per wildfire were worked out from the NDVI data. Similarly, annual averages per wildfire were calculated for all years in the study (1985–2024) divided into several recovery-related phases: the five years prior to the fire, the year of the fire, the year after the fire, the value in the fifth year after the fire, the years after the fire until NDVI recovered to its pre-wildfire level, and the years after that recovery value.
Finally, the recovery results from NDVI were compared with those from NBR. The NBR difference (dNBR) was calculated by subtracting the pre-fire NBR from the post-fire NBR [21]. The value provides an estimate of the wildfire’s severity compared to average NBR [3]. As with NDVI, the NBR values from images five years after the wildfire were calculated as evidence of vegetation cover recovery [17,74].
3. Results
Although beyond the scope of the study, the compelling evidence furnished by the data underscores the strong spatial and time clustering of wildfires. Provincial data recorded a total of 4,004 cases between 1990 and 2024. Just under a quarter were considered as wildfires, whilst the other 3,000 were classified as fire outbreaks, i.e., burning an area of less than one hectare. By way of reference, a football pitch has a surface area of around 0.75 hectares. All wildfires above this threshold and those burning an area equivalent to ten football pitches were analysed. While the main study focused on the effects and recovery following large-scale wildfires affecting over 500 hectares, the threshold has been reduced in this brief overview of changes in fire numbers and burned area to make the conclusions more robust since, fortunately, “only” 25 fires have been classified in the highest severity category in the last 35 years.
August stands out as the peak month for both variables, following a steady increase from the low values observed in May and June. The onset of autumn brings a decline in the data, especially from October onwards. Another salient feature of seasonality is a secondary peak in spring. Interestingly, the number of fires reaches this secondary peak earlier, in March, while the area burned does not peak until April (Figure 3).
There has been a clear downward trend over time compared to the high figures recorded in the 1990s. The first half of that decade saw values consistently above 70 wildfires per year. Although the area burned was low in 1990 and 1991, from 1992 to 1994 there was a steady increase in the number of large-scale wildfires and the area they burned. There were seven large wildfires in 1994, all affecting more than 1,000 hectares. Three wildfires affected over 5,000 hectares. Two of them, Olocau del Rey and Espadilla, were particularly devastating. The former destroyed more than 10,000 hectares, whilst the latter burned nearly 20,000 hectares.
Since that tragic year, the number of wildfires (always below 30 per year), which have affected more than one hectare, fell gradually until 2022. There have been around 15 wildfires per year in the last three years. The decline has been more pronounced in terms of area burned which has remained nearly constant except for peaks caused by large-scale wildfires. Notable events included the 2007 Gaibiel wildfire, which affected around 1,000 hectares, and the Useras wildfire, which burned almost 6,000 hectares. In 2022, nearly 17,000 hectares were burned in the Bejis fire, along with the smaller Costur fire at just over 700 hectares. The latter was particularly concerning because it impacted areas already burned by the Useras wildfire 15 years earlier. The largest wildfire affecting the province was the Andilla wildfire, named after a small town in Valencia province in the Los Serranos comarca where the wildfire actually started before eventually spreading into Castellon province. As the fire broke out in the province of Valencia, it does not appear in the Valencian Regional Government’s databases [35], for Castellon province, which explains why 2012 shows no peak in area burned (Figure 3).
The time clustering of wildfires, particularly during the summer months and between 1992 and 1994, when more than half of all large-scale wildfires occurred, is mirrored by strong geographical clustering, especially regarding the area burned. La Plana Alta and El Baix Maestrat stand out for having the highest number of wildfires. However, Alto Mijares and Alto Palancia accounted for two-thirds of the burned area despite experiencing only one-fifth of the wildfires. This difference indicates that wildfires primarily drive burned area in these two comarcas: 29% of fires in these areas affected over 75 hectares, and more than half of those that burned over 500 hectares, i.e., the largest wildfires. Specifically, 41% of the total area burned by large-scale wildfires occurred in Alto Mijares, while 33% occurred in Alto Palancia. Vegetation recovery in Alto Palancia has been particularly slow, as some areas have been affected by multiple wildfires. Conversely, La Plana Alta and El Baix Maestrat show the opposite pattern. They have suffered many fires but with a smaller total burned area. This is due to a predominance of agricultural land and less forest, scrub, or grassland, which limits fire spread across large expanses (Figure 4).
The annual NDVI values (Figure 5) show a distinct upward trend following a wildfire. Nonetheless, the year of the wildfire does not usually record the lowest value as this is delayed until the year afterwards. The year of the wildfire includes the months before it which push up the average. Only wildfires which took place in the first few months of the year, March or April, have their minimum value in the same year as the event, which includes up to nine or ten months with burned land indices.
The NDVI decline and recovery values show, albeit with significant differences, the regenerative capacity of Mediterranean vegetation which is well adapted to wildfires and the climatic conditions that favour their occurrence. The NDVI decline ranges from a minimum of 0.103 for the 1991 Coves de Vinroma wildfire, the first in the series, to a maximum of 0.265 recorded in the 2016 Artana wildfire. Alongside the Artana fire, four other fires exceeded the 0.200 threshold. Another five fires showed a significant decrease greater than 0.170. Most of these fires occurred in areas with a high proportion of forest cover. By contrast, the lowest values in NDVI loss (below 0.500) tended to occur in areas dominated by scrub and/or herbaceous vegetation associations. These areas recovered their vegetation cover most quickly. Within five years after the fire (the reference threshold for recovery), NDVI values ranged from approximately 75% to over 90% of pre-fire levels. Notably, the Cabanes fire of April 1999 surpassed its pre-fire NDVI within that five-year period. Most fires with over 90% recovery occurred in landscapes dominated by herbaceous and scrub vegetation, where initial NDVI loss was relatively low. However, two cases, Espadilla (July 1994) and Artana (July 2016), paint a starkly different picture. Both involved extensive forest damage, especially Artana, where approximately 70% of forest cover was destroyed and NDVI dropped by 0.265, the highest loss recorded. Despite this, Artana achieved a 94.3% recovery in NDVI within five years (Table 4).
Meanwhile, dNBR values match dNDVI in a wide range of situations, from a decline of just 0.093 in the Azuebar fire in 1992 to a more substantial drop of 0.233 following the Toga fire. However, the largest declines in dNDVI do not coincide with those in dNBR. The other major difference is that NBR recovers more slowly than NDVI. There are only seven fires with recovery rates above 75%, which is the minimum recovery value for NDVI. The minimum NBR value is 32.8%, less than half that figure. Even so, two wildfires, Salsadella and Cabanes, have exceeded 100% recovery, both occurring in areas dominated by scrub and/or herbaceous vegetation associations. Alongside the unique case of Artana, these are the only fires with recovery above 85% (Table 4).
The seasonal behaviour of NDVI in the various periods before and after the fire is intriguing (Figure 6). Typical Mediterranean vegetation, characterized by summer drought and dominated by scrubland and pine trees, exhibits a secondary NDVI peak in May–June, indicating heightened spring growth after reaching a low point around March. NDVI values fall in summer when plants, impacted by water stress, become less active. From the summer nadir in August, activity resumes with the rains and cooler temperatures of autumn. The highest values are recorded in winter [75]. This characteristic curve is disrupted in the two periods most affected by the wildfire, i.e., the year of the fire itself and the year following it. The curve for the year of the fire shows a drop in the month in which it occurs, although this is not apparent in the Castellon and Culla fires which took place in December 1992 and 2017, as the fall in NDVI shifted to January of the following year.
4. Discussion
There is no shortage of studies and news reports announcing an increase in wildfires [13,56,76,77,78,79,80,81,82,83], including the IPCC Sixth Assessment Report: Impacts, Adaptation and Vulnerability [84]. Based on models predicting a warmer and drier world [8], the conclusion is obvious. All this is notwithstanding the uncertainty surrounding the issue [17,82,85] and the actual situation reflected in the data, which show varying trends depending on the territory and period considered. Numerous studies have found a downward shift [31,85,86,87,88,89,90] explained by significant management and prevention efforts. There are a number of meteorological and climate aspects (precipitation, temperature, relative humidity and wind speed) associated with wildfires [91], but the human footprint is evident both in the causes [15,31] and in prevention and extinction. Climate appears to be a determining factor in the high incidence of large-scale wildfires in the early 1990s, especially in 1994, which was a period of severe drought, yet studies do not always reflect this, insofar as wildfires can be restricted under dry conditions by low plant productivity which reduces available fuel, but also under wet conditions. The largest areas burned are usually in areas of intermediate humidity [85,92].
The Spanish Mediterranean region has also experienced a decline in wildfires. The trends already seen in Castellon province can be extended to the entire Valencian Region [31], to which it belongs, and to much of Spain [86]. This trend persists despite the fact that many parts of Spain, especially coastal areas like Castellon [93], have experienced changes that increase the risk of wildfires: rural depopulation with more scrubland and forests, fewer pastures and farmland, rising tourism in natural areas and more second homes near forests [8]. Across Spain as a whole, the overall number and area of wildfires greater than one hectare, as well as large-scale wildfires over 500 hectares, have fallen significantly following high figures between the mid-1970s and mid-1990s [95]. This upward trend peaked in the early 1990s and was clearly reflected in Castellon province, where a series of devastating wildfires coincided with a severe drought [9,31,96]. The year 1994 set a similar record for all of Spain [90] (Figure 7). A similar decline in the number of fires has also been observed in southern Europe during the 21st century [17].
It is no coincidence that the two peaks in wildfire occurrence and burned area correlate with holiday periods, particularly August, the holiday month par excellence, when summer drought conditions intensify and storms with lightning become more frequent. There are few studies that examine this issue. The timing of the summer peak has been consistently observed [90,97,98] yet in Huelva province, Spain, it shifts to July in the most recent study period, 2000-2019 [98]. The Italian region of Tuscany shows the same secondary spring peak [97], as does the whole of Spain in terms of the number of large-scale wildfires [90], but Huelva is the only case in 21st-century fires [98].
However fascinating this question may be, it is secondary to our main research question: the regenerative capacity of Mediterranean vegetation. Although it might seem obvious, it should be pointed out that wildfires destroy vegetation instantly, leading to a decrease in NDVI after the fire. The NDVI value is usually lower in the first year after the fire, though sometimes it occurs in the second year [72]. However, there are plenty of cases in the large-scale wildfires in Castellon where the lowest annual NDVI was recorded in the same year as the wildfire, such as Borriol, Castillo de Villamalefa, Cabanes and Gaibiel. These fires occurred in March and April, thus bringing forward the decline in NDVI for the year.
By contrast, recovery is a longer process. NDVI recovery is typically considered complete when values reach 80% of pre-fire levels [99]. In most of Castellon province’s large-scale wildfires, this threshold was met or exceeded within five years. This benchmark estimate, based on a study in Florida, USA, in an area dominated by herbaceous vegetation, scrubland and pine trees, seems overly optimistic for the situation in our study. We will come back to this point when we explore the recovery in the Artana and Bejis fires in greater detail.
The vegetation cover’s regenerative capacity is clearly demonstrated by the swift increase in NDVI. Within just five years, values often reach at least 75% of their pre-fire levels. This represents a good example of vegetation's ability to regenerate and gradually return to a state similar to its pre-fire condition [14], as shown in images of the areas affected by the Argelita fire in 1993 (Figure 8 and Figure 9). Nevertheless, analysis using NBR reveals NDVI’s limitations as a standalone indicator of vegetative regeneration. NBR recovery rates are considerably more modest as shown in previous research which estimates NDVI recovery times at 3–5 years, while for NBR they tend to be longer [11].
The data here do not show a relationship between pre-fire NDVI or dNBR and the speed of recovery, as observed in other studies [3]. Our results suggest that recovery speed is influenced by initial vegetation type and fire severity [18], yet the influence of other environmental factors [13,18], such as phenology, temperature and precipitation as well as management [3] and the small number of cases, makes it hard to pin down a clear relationship. Thus, wildfires with dNDVI above 0.200 and low forest cover values showed the lowest recovery rates, below 80%. In contrast, the Artana fire, which had high forest cover, achieved a regeneration rate close to 95%. Interestingly, this same recovery percentage was also reached after fires with very different dNDVI values (between 0.10 and 0.185) and vegetation types. A similar pattern is observed when relating dNBR data and vegetation regeneration. The most common species in forest areas is Pinus halepensis whose regeneration is aided by moisture and heat. Contrary to the studies cited above, our findings suggest a possible positive relationship between fire severity and regeneration, as this heliophilous species thrives in open spaces, which are more common in high-severity burn areas [100].
We also found no evidence that the month in which a wildfire occurs affects the speed of recovery, contrary to previous studies that show a faster recovery when fires occur during vegetation growth periods in spring and autumn [99]. The conclusions drawn are undoubtedly influenced by the clustering of fires in the summer months, particularly in August with 10 fires out of a total of 25, as well as another four fires which occurred in July. Spring wildfires show similar recovery rates to others in midsummer, even though it has to be said that the wildfire with the best recovery, the one in Cabanes in April 1999, happened in spring while those with the worst recovery rates at below 80% were all in summer. However, there are also other cases in summer with recovery rates above 90%.
The role of moisture is equally uncertain. In principle, moisture aids post-fire recovery [100]. However, the high number of fires in 1994 suggests that this environmental variable is not that significant. There were seven wildfires in 1994. Two of them occurred in March: Castillo de Villamalefa and Borriol. The NDVI regeneration values were quite similar at around 85% but differed in NBR recovery at 55.2% and 32.8%, respectively. The limited influence of rainfall becomes even more apparent with summer fires: Olocau del Rey and Espadilla started just one day apart, and despite having nearly identical LULC data with about 40% forest cover, their regeneration outcomes varied greatly. Wildfires in August of the same year showed similar contrasting results. Recovery during the first seven years appears to depend primarily on the time elapsed since the fire, with little impact from environmental factors such as rainfall and rock type. Beyond that period, rainfall does seem to influence NDVI recovery [24]. The complexity and uncertainty surrounding these factors make it difficult to explain why trees recover in some areas but fail to do so in others [101].
The optimism derived from the recovery in NDVI values contrasts sharply with the weaker NBR data and also with the fact that Pinus halepensis vegetation needs at least 15 years to recover after a fire, given that it takes between 12 and 20 years for seed-bearing species to surpass the juvenile reproductive phase and fully replenish their seed bank [11]. Whilst vegetation cover may recover after a wildfire, its height remains reduced, even 26 years later. This recovery in cover can be accounted for by the regrowth of trees and a high density of stems per hectare (Figure 10) which requires forestry services to undertake regeneration work. The minimum interval commonly used to consider a forest is recovered is 15–20 years, reflecting the time needed to reach the juvenile reproductive phase (20 years), meaning a minimum of 15 and up to 30 years to achieve reproductive maturity [73,102]. In summary, these indices tend to overestimate the speed of recovery [73].
Photos of the Bejis fire illustrate the Mediterranean vegetation’s strong regenerative capacity but also highlight the limitations of satellite indices. Although the wildfire occurred just three years ago, its NBR has recovered by an average of 90%. However, the landscape is nowhere near what it was before the fire broke out (Figure 11). The pine trees affected were over 50 years old, as shown by the growth rings in Figure 12b, and were therefore fully mature with a complete seed bank. This has fostered the emergence of new shoots (Figure 12a). The growth of herbaceous plants and shrubs after the spring rains has completed the vegetation cover of the burned soil, but by no means constitutes the entirety of the original forest’s vegetation structure (Figure 12).
The research revealed that the Artana fire in July 2016 was the most severe in terms of NDVI decline and one of the most significant in NBR loss. Both indices were down by more than 0.200. However, in spite of its high forest cover percentage (70%), it shows impressive regeneration data. In just five years, its NDVI recovered to 94.3%. The NBR recovery data, which are always less impressive, stand at 86.8%, second only to the fires in Salsadella and Cabanes which, by contrast, affected areas of scrub and/or herbaceous vegetation associations. As in the case of Bejis, satellite data tell only part of the story in these two wildfires. Google Earth images from 18 July 2015 (Figure 13a,b) show complete forest cover with the distinctive tree crowns clearly visible. After the fire, the landscape has changed completely (Figure 13c,d). The greenery has disappeared, and in the detailed image from 16 November 2016 (Figure 13d) the burning of the trees and the disappearance of their crowns has exposed the typical agricultural terraces of the Mediterranean mountains. In the last two images (Figure 13e,f) taken on 27 February 2022, over five years after the fire, the landscape is once again green, as reflected in NDVI, yet the forest structure has not recovered: the terraces are still visible, but sadly the original vegetation has not returned, as evidenced by the absence of the tree crowns (Figure 13f). Vegetation recovery is a process which takes longer than NDVI suggests.
The next step in our research is contingent upon the publication of the new CORINE Land Cover version for 2024, expected before mid-2026 [42], which will enable us to examine whether the effect of fires and subsequent regeneration is discernible in LULC. Our intention is to investigate this database and others such as SIOSE [103] and Global Land Cover and Land Use Change, 2000-2020 [104].
While we await the new CORINE Land Cover release, we have no shortage of research goals. This study has contributed valuable insights into wildfire trends, seasonal behavior, and underlying causes, which are only briefly mentioned here as they go beyond the scope of the study. Nevertheless, understanding the causes of fires is critical for effective prevention. The sharp decline in fires after the devastating early 1990s coincided with an equally steep fall in fires attributed to unknown causes: highlighting that accurate identification is a key tool to prevent them. In the next phase, we aim to study the seasonal behaviour and causes of fires and exploit the potential of both ground-based and remote sensing imagery, to refine the results obtained by vegetation indices.
5. Conclusions
This study analyses the regenerative capacity of Mediterranean vegetation affected by summer drought and water scarcity during the hottest time of the year, in a climate that is unique in the world. This vegetation, whether forests or scrub and/or herbaceous vegetation associations, is adapted to this climate and to wildfires, one of the main natural disasters in this ecosystem.
To demonstrate this adaptation, we analysed wildfires in Castellon, one of Spain's fifty provinces, focusing especially on large-scale wildfires which, in Spain, are defined as those affecting over 500 hectares. Castellon is the northernmost province of the Valencian Region, straddling the Mediterranean Sea and the Iberian mountain range. It was hit by 25 large-scale wildfires between 1990 and 2024.
The study also shows that provincial, regional and national data do not support earlier predictions, revealing instead a downward trend in the number of wildfires and burned area. More importantly, it confirms the strong regenerative capacity of Mediterranean vegetation. In all large-scale wildfires analyzed, NDVI values recovered to over 75% of their pre-fire levels within just five years. This optimism, however, is tempered by the evolution of NBR values which in most cases lags behind NDVI recovery. In only a few instances did NBR exceed 75%, while in some areas, values remained below 40% of pre-fire levels. Images on the ground and those obtained with Google Earth have confirmed the need to qualify this purported regeneration of Mediterranean vegetation, restricting it to vegetation cover and not type and structure, a process that requires at least two decades.
Author Contributions
the authors contributed to the design of the methodology and implementation of this research. They also helped to retrieve NDVI data from the Landsat satellite series. Enrique Montón Chiva processed the data and produced the graphs and maps showing the results using QGIS as well as writing the first draft. José Quereda Sala took part in reviewing this first draft and writing and editing subsequent versions. Enrique Montón Chiva and José Quereda Sala read and approved the final manuscript.
Funding
this research has been conducted with financial support from Castellon Provincial Council (Excelentísima Diputación de Castellón) under the Provincial Climate Observatory Agreement.

Data Availability Statement
The original data used in the study are openly available at the websites included in references [32,33,35,37,38,39,40,41,51,71]. These data were analysed, summarized and presented by the authors. The final datasets are available on request from the corresponding author due to the great number of files.
Acknowledgments
The authors would like to thank Jesús Lancis Sáez, Vice-Rector for Research, for his efforts in securing access to Google Earth Engine data. They also express their gratitude to Universitat per a Majors at Universitat Jaume I in Castellon, represented by Ms Inmaculada Rodríguez Moya, its Academic Director, Ms Pilar Escuder Mollón, its Coordinator, and the specialists Ms Mónica Sales Giner and Ms Mari Paz García Alegre, for their permission and assistance in publicising our search for photos of large wildfires in Castellon province. This gratitude extends to all the students at this exceptional Universitat per a Majors who responded to our appeal. We would therefore like to acknowledge the help and material provided by Mr José Manuel Mon Dols, Mr Fernando Pérez Huecas, Ms Mª Pilar Flor Gil, Ms María del Carmen Sobrinos Novo and Ms Bienvenida Garcés Fortanet. Their clues and/or photos are invaluable to the authors, and we apologise for not being able to include them all here. Special thanks go to one of these keen students, Mr Adrián Casado de Madariaga, a forestry engineer. He was a Forestry Coordination Specialist, responsible for wildfires between 1987 and 1994, and Chief Engineer in the South Castellon Brigade. In addition to his photos, suggestions and support, he put us in touch with the Regional Environmental Service which is part of the Ministry of the Environment, Infrastructure and Territory in the Valencian Regional Government. And, of course, our thanks and support go to his chief, Mr Diego Marín Fabra, the specialist Mr Francisco Montesinos Fandos and Mr Bernardo Gracia Monforte, head of the Wildfire Prevention Section. The authors would like to thank and acknowledge the significant scientific input provided by the Climate Engine website for retrieving satellite data and by Google Earth Engine which, among other databases, makes Landsat images available to researchers free of charge. They also acknowledge the work involved in creating, maintaining and improving open source software such as QGIS and R. “This publication has been prepared using European Union's Copernicus Land Monitoring Service information;<https://doi.org/10.2909/5c1f2e03-fcba-47b1-afeb-bc05a47bada0> <https://doi.org/10.2909/71c95a07-e296-44fc-b22b-415f42acfdf0>” “Generated using European Union's Copernicus Land Monitoring Service information; <https://doi.org/10.2909/5c1f2e03-fcba-47b1-afeb-bc05a47bada0> <https://doi.org/10.2909/71c95a07-e296-44fc-b22b-415f42acfdf0>”.
Conflicts of Interest
The authors declare no conflicts of interest. The funders had no role in the design of the study; in the collection, analyses, or interpretation of data; in the writing of the manuscript; or in the decision to publish the results.
Abbreviations
The following abbreviations are used in this manuscript:
| NDVI | Normalized Difference Vegetation Index |
| LULC | Land Use/Land Cover |
| GEE | Google Earth Engine |
| CORINE | Coordination of Information on Environment |
| CE | Climate Engine |
| NBR | Normalized Burn Ratio |
| Km2 | Square kilometers |
References
- Parker, B. M.; Lewis, T.; Srivastava, S. K. Estimation and Evaluation of Multi-Decadal Fire Severity Patterns Using Landsat Sensors. Remote Sensing of Environment 2015, 170, 340–349. [Google Scholar] [CrossRef]
- Yengoh, G. T.; Dent, D.; Olsson, L.; Tengberg, A. E.; Tucker, C. J. Use of the Normalized Difference Vegetation Index (NDVI) to Assess Land Degradation at Multiple Scales: Current Status, Future Trends, and Practical Considerations, 2015., 1st ed.; SpringerBriefs in Environmental Science; Springer: Cham, 2016. [Google Scholar] [CrossRef]
- Lanorte, A.; Lasaponara, R.; Lovallo, M.; Telesca, L. Fisher–Shannon Information Plane Analysis of SPOT/VEGETATION Normalized Difference Vegetation Index (NDVI) Time Series to Characterize Vegetation Recovery after Fire Disturbance. International Journal of Applied Earth Observation and Geoinformation 2014, 26, 441–446. [Google Scholar] [CrossRef]
- Szpakowski, D. M.; Jensen, J. L. R.; Butler, D. R.; Chow, T. E. A Study of the Relationship between Fire Hazard and Burn Severity in Grand Teton National Park, USA. International Journal of Applied Earth Observation and Geoinformation 2021, 98, 102305. [Google Scholar] [CrossRef]
- Rossi, S. Un Viaje a La Antártida: Un Científico En El Continente Olvidado, 1a. edición.; Metatemas; Tusquets Editores: Barcelona, 2013. [Google Scholar]
- Global Wildfire Information System – with minor processing by Our World in Data. Seasonal Wildfire Trends, 2024. https://ourworldindata.org/wildfires (accessed 2024-08-29).
- Jain, P.; Coogan, S. C. P.; Subramanian, S. G.; Crowley, M.; Taylor, S.; Flannigan, M. D. A Review of Machine Learning Applications in Wildfire Science and Management. Environ. Rev. 2020, 28, 478–505. [Google Scholar] [CrossRef]
- Liu, Y.; Stanturf, J.; Goodrick, S. Trends in Global Wildfire Potential in a Changing Climate. Forest Ecology and Management 2010, 259, 685–697. [Google Scholar] [CrossRef]
- Vélez Muñoz, R. Incendios Forestales. In Riesgos naturales; Ayala_Carcedo, F. J., Olcina Cantos, J., Eds.; Ariel, S.A.: Barcelona, 2002. [Google Scholar]
- Tazieff, H. Water risks on the Mediterranean coast. Met-mar. Revue de météorologie maritime de Météo-France.
- Viana-Soto, A.; Aguado, I.; Salas, J.; García, M. Identifying Post-Fire Recovery Trajectories and Driving Factors Using Landsat Time Series in Fire-Prone Mediterranean Pine Forests. Remote Sensing 2020, 12, 1499. [Google Scholar] [CrossRef]
- Azorín Molina, C. El Viento, Un Elemento Climático Importante En El País Valencià. In Climas y tiempos del País Valenciano; Olcina Cantos, J., Moltó Mantero, E., Eds.; Publicacions Universitat d’Alacant, 2019; pp 78–84.
- Gouveia, C.; DaCamara, C. C.; Trigo, R. M. Post-Fire Vegetation Recovery in Portugal Based on Spot/Vegetation Data. Nat. Hazards Earth Syst. Sci. 2010, 10, 673–684. [Google Scholar] [CrossRef]
- Viedma, O.; Meliá, J.; Segarra, D.; Garcia-Haro, J. Modeling Rates of Ecosystem Recovery after Fires by Using Landsat TM Data. Remote Sensing of Environment 1997, 61, 383–398. [Google Scholar] [CrossRef]
- Vilar, L.; Camia, A.; San-Miguel-Ayanz, J.; Martín, M. P. Modeling Temporal Changes in Human-Caused Wildfires in Mediterranean Europe Based on Land Use-Land Cover Interfaces. Forest Ecology and Management 2016, 378, 68–78. [Google Scholar] [CrossRef]
- Arnett, J. T. T. R.; Coops, N. C.; Daniels, L. D.; Falls, R. W. Detecting Forest Damage after a Low-Severity Fire Using Remote Sensing at Multiple Scales. International Journal of Applied Earth Observation and Geoinformation 2015, 35, 239–246. [Google Scholar] [CrossRef]
- Hislop, S.; Haywood, A.; Jones, S.; Soto-Berelov, M.; Skidmore, A.; Nguyen, T. H. A Satellite Data Driven Approach to Monitoring and Reporting Fire Disturbance and Recovery across Boreal and Temperate Forests. International Journal of Applied Earth Observation and Geoinformation 2020, 87, 102034. [Google Scholar] [CrossRef]
- Díaz-Delgado, R.; Lloret, F.; Pons, X. Influence of Fire Severity on Plant Regeneration by Means of Remote Sensing Imagery. International Journal of Remote Sensing 2003, 24, 1751–1763. [Google Scholar] [CrossRef]
- Jiao, W.; Wang, L.; McCabe, M. F. Multi-Sensor Remote Sensing for Drought Characterization: Current Status, Opportunities and a Roadmap for the Future. Remote Sensing of Environment 2021, 256, 112313. [Google Scholar] [CrossRef]
- Li, M.; Qu, J. Satellite Applications for Detecting Vegetation Phenology. In Satellite-based Applications on Climate Change; Qu, J., Powell, A., Sivakumar, M. V. K., Eds.; Springer Netherlands: Dordrecht, 2013. [Google Scholar] [CrossRef]
- Escuin, S.; Navarro, R.; Fernández, P. Fire Severity Assessment by Using NBR (Normalized Burn Ratio) and NDVI (Normalized Difference Vegetation Index) Derived from LANDSAT TM/ETM Images. International Journal of Remote Sensing 2008, 29, 1053–1073. [Google Scholar] [CrossRef]
- Chuvieco, E.; Aguado, I.; Salas, J.; García, M.; Yebra, M.; Oliva, P. Satellite Remote Sensing Contributions to Wildland Fire Science and Management. Curr Forestry Rep 2020, 6, 81–96. [Google Scholar] [CrossRef]
- João, T.; João, G.; Bruno, M.; João, H. Indicator-Based Assessment of Post-Fire Recovery Dynamics Using Satellite NDVI Time-Series. Ecological Indicators 2018, 89, 199–212. [Google Scholar] [CrossRef]
- Abdel Malak, D.; Pausas, J. G. Fire Regime and Post-Fire Normalized Difference Vegetation Index Changes in the Eastern Iberian Peninsula (Mediterranean Basin). Int. J. Wildland Fire 2006, 15, 407. [Google Scholar] [CrossRef]
- Viedma, O.; Meliá, J. Monitoring Temporal Changes in the Spatial Patterns of a Mediterranean Shrubland Using LandsatTM Images. Diversity and Distributions 1999, 5, 275–293. [Google Scholar] [CrossRef]
- Ricotta, C.; Avena, G. C.; Olsen, E. R.; Ramsey, R. D.; Winn, D. S. Monitoring the Landscape Stability of Mediterranean Vegetation Relation to Fire with a Fractal Algorithm. International Journal of Remote Sensing 1998, 19, 871–881. [Google Scholar] [CrossRef]
- Montón Chiva, E.; Quereda Sala, J. Castellón, La Segunda Provincia Más Montañosa de España: ¿algo Más Que Un Lema Turístico? In Diego López Olivares. La visión integradora desde el turismo desde la geografía: libro homenaje: in memoriam; Ferrer Maestro, J. J., Ferreres Bonfill, J. B., Eds.; Publicacions de la Universitat Jaume I; pp 265–287.
- Quereda Sala, J.; Montón Chiva, E. Los Elementos Del Clima: Distribución de Temperaturas y Precipitaciones. In Climas y tiempos del País Valenciano; Olcina Cantos, J., Moltó Mantero, E., Eds.; Publicacions Universitat d’Alacant, 2019; pp 72–77.
- Pérez Cueva, A. J. Los Climas Del País Valenciano. In Climas y tiempos del País Valenciano; Olcina Cantos, J., Moltó Mantero, E., Eds.; Publicacions Universitat d’Alacant, 2019; pp 85–94.
- Núñez Mora, J. Á. Datos Climáticos Básicos y Récords Atmosféricos En La Comunitat Valenciana. In Climas y tiempos del País Valenciano; Olcina Cantos, J., Moltó Mantero, E., Eds.; Publicacions Universitat d’Alacant, 2019; pp 137–144.
- Olcina Cantos, J. Cuando El Cielo Se Enfada. Peligrosidad Climática y Riesgos. In Climas y tiempos del País Valenciano; Olcina Cantos, J., Moltó Mantero, E., Eds.; Publicacions Universitat d’Alacant, 2019; pp 117–131.
- Copernicus Land Monitoring Service. CORINE Land Cover 1990 (Vector/Raster 100 m), Europe, 6-Yearly CC-BY 4.0 Scne.Es. https://centrodedescargas.cnig.es/CentroDescargas/index.jsp#. [CrossRef]
- Copernicus Land Monitoring Service. CORINE Land Cover 2018 (Vector/Raster 100 m), Europe, 6-Yearly. CC-BY 4.0 Scne.Es. https://centrodedescargas.cnig.es/CentroDescargas/index.jsp#. [CrossRef]
- Copernicus. CORINE Land Cover Nomenclature Guidelines, 2024. https://land.copernicus.eu/content/corine-land-cover-nomenclature-guidelines/html/ (accessed 2024-02-21).
- Valencian Government - Integrated forest fire management system. Fire Statistics. https://prevencionincendiosgva.es/Incendios/EstadisticasIncendios (accessed 2025-03-04).
- Detalle nota de prensa - Comunica GVA - Generalitat Valenciana. Comunica GVA. https://comunica.gva.es/va/detalle?id=368980826&site=174859783 (accessed 2025-06-19).
- MITECO - Ministry for the ecological transition and the demographic challenge. General Statistics on Forest Fires (EGIF). https://www.miteco.gob.es/es/biodiversidad/temas/incendios-forestales/estadisticas-datos.html (accessed 2025-02-17).
- MITECO - Ministry for the ecological transition and the demographic challenge. Forest Fires. Information Updates. https://www.miteco.gob.es/es/biodiversidad/temas/incendios-forestales/estadisticas-avances.html (accessed 2025-03-04).
- Copernicus Land Monitoring Service. CORINE Land Cover 2000 (Vector/Raster 100 m), Europe, 6-Yearly CC-BY 4.0 Scne.Es. https://centrodedescargas.cnig.es/CentroDescargas/index.jsp#. [CrossRef]
- Copernicus Land Monitoring Service. CORINE Land Cover 2006 (Vector/Raster 100 m), Europe, 6-Yearly CC-BY 4.0 Scne.Es. https://centrodedescargas.cnig.es/CentroDescargas/index.jsp#. [CrossRef]
- Copernicus Land Monitoring Service. CORINE Land Cover 2012 (Vector/Raster 100 m), Europe, 6-Yearly CC-BY 4.0 Scne.Es. https://centrodedescargas.cnig.es/CentroDescargas/index.jsp#. [CrossRef]
- Copernicus Land Monitoring Service. CORINE Land Cover Roadmap. https://land.copernicus.eu/en/products/corine-land-cover?tab=roadmap (accessed 2025-06-15).
- Climate Engine Team. Dataset Information. Landsat At-Surface Reflectance/Landsat Top-Of-Atmosphere Reflectance, 2024.
- Remote Sensing Handbook: Volume I: Remotely Sensed Data Characterization, Classification, and Accuracies; Thenkabail, P. S., Ed.; CRC Press: Boca Raton, 2016. [Google Scholar]
- Beck, H. E.; McVicar, T. R.; Van Dijk, A. I. J. M.; Schellekens, J.; De Jeu, R. A. M.; Bruijnzeel, L. A. Global Evaluation of Four AVHRR–NDVI Data Sets: Intercomparison and Assessment against Landsat Imagery. Remote Sensing of Environment 2011, 115, 2547–2563. [Google Scholar] [CrossRef]
- White, J. C.; Wulder, M. A.; Hermosilla, T.; Coops, N. C.; Hobart, G. W. A Nationwide Annual Characterization of 25 Years of Forest Disturbance and Recovery for Canada Using Landsat Time Series. Remote Sensing of Environment 2017, 194, 303–321. [Google Scholar] [CrossRef]
- Lillesand, T. M.; Kiefer, R. W.; Chipman, J. W. Remote Sensing and Image Interpretation, Seventh edition.; Wiley: Hoboken, NJ, 2015. [Google Scholar]
- Chen, F.; Yang, S.; Yin, K.; Chan, P. Challenges to Quantitative Applications of Landsat Observations for the Urban Thermal Environment. Journal of Environmental Sciences (China), 2017, 59, 80–88. [Google Scholar] [CrossRef] [PubMed]
- Chen, X.; Giri, C. P.; Vogelmann, J. E. Land-Cover Change Detection. In Remote Sensing of Land Use and Land Cover: Principles and Applications; Giri, C. P., Ed.; Remote Sensing Applications Series; CRC Press: Hoboken, 2012. [Google Scholar]
- Huntington, J. L.; Hegewisch, K. C.; Daudert, B.; Morton, C. G.; Abatzoglou, J. T.; McEvoy, D. J.; Erickson, T. Climate Engine: Cloud Computing and Visualization of Climate and Remote Sensing Data for Advanced Natural Resource Monitoring and Process Understanding. Bulletin of the American Meteorological Society 2017, 98, 2397–2409. [Google Scholar] [CrossRef]
- Desert Research Institute and University of California Merced. Climate Engine, Version 2.1. (1985-2024). http://climateengine.org (accessed 2025-03-20).
- Ravanelli, R.; Nascetti, A.; Cirigliano, R. V.; Rico, C. D.; Leuzzi, G.; Monti, P.; Crespi, M. Monitoring the Impact of Land Cover Change on Surface Urban Heat Island through Google Earth Engine: Proposal of a Global Methodology, First Applications and Problems. Remote Sensing 2018, 10. [Google Scholar] [CrossRef]
- Gorelick, N.; Hancher, M.; Dixon, M.; Ilyushchenko, S.; Thau, D.; Moore, R. Google Earth Engine: Planetary-Scale Geospatial Analysis for Everyone. Remote Sensing of Environment 2017, 202, 18–27. [Google Scholar] [CrossRef]
- Yang, L.; Driscol, J.; Sarigai, S.; Wu, Q.; Chen, H.; Lippitt, C. D. Google Earth Engine and Artificial Intelligence (AI): A Comprehensive Review. Remote Sensing 2022, 14. [Google Scholar] [CrossRef]
- Kumar, L.; Mutanga, O. Google Earth Engine Applications Since Inception: Usage, Trends, and Potential. Remote Sensing 2018, 10. [Google Scholar] [CrossRef]
- North, M. P.; Stephens, S. L.; Collins, B. M.; Agee, J. K.; Aplet, G.; Franklin, J. F.; Fulé, P. Z. Reform Forest Fire Management. Science 2015, 349, 1280–1281. [Google Scholar] [CrossRef]
- Xulu, S.; Mbatha, N.; Peerbhay, K. Burned Area Mapping over the Southern Cape Forestry Region, South Africa Using Sentinel Data within GEE Cloud Platform. IJGI 2021, 10, 511. [Google Scholar] [CrossRef]
- Soulard, C. E.; Albano, C. M.; Villarreal, M. L.; Walker, J. J. Continuous 1985–2012 Landsat Monitoring to Assess Fire Effects on Meadows in Yosemite National Park, California. Remote Sensing 2016, 8. [Google Scholar] [CrossRef]
- Venter, Z. S.; Scott, S. L.; Desmet, P. G.; Hoffman, M. T. Application of Landsat-Derived Vegetation Trends over South Africa: Potential for Monitoring Land Degradation and Restoration. Ecological Indicators 2020, 113, 106206. [Google Scholar] [CrossRef]
- Sharma, L. K.; Gupta, R.; Fatima, N. Assessing the Predictive Efficacy of Six Machine Learning Algorithms for the Susceptibility of Indian Forests to Fire. Int. J. Wildland Fire 2022, 31, 735–758. [Google Scholar] [CrossRef]
- De Marzo, T.; Pflugmacher, D.; Baumann, M.; Lambin, E. F.; Gasparri, I.; Kuemmerle, T. Characterizing Forest Disturbances across the Argentine Dry Chaco Based on Landsat Time Series. International Journal of Applied Earth Observation and Geoinformation 2021, 98, 102310. [Google Scholar] [CrossRef]
- Japan Aerospace Exploration Agency. ALOS World 3D 30 Meter DEM., 2021. [CrossRef]
- OpenTopography. ALOS World 3D - 30m. https://portal.opentopography.org/raster?opentopoID=OTALOS.112016.4326.2 (accessed 2025-06-05).
- Dirección General del Agua (DGA). Ministerio para la Transición Ecológica y el Reto Demográfico. Red Hidrográfica Básica Procedente MDT 100x100. https://www.mapama.gob.es/app/descargas/descargafichero.aspx?f=Rios_MDT_100x100.zip (accessed 2025-04-24).
- Ministerio para la Transición Ecológica y el Reto Demográfico. Red Hidrográfica Básica. Descripción Del Servicio. https://sig.mapama.gob.es/Docs/PDFServicios/Rios_MT100x100.pdf (accessed 2025-06-15).
- Institut Cartogràfic Valencià; Instituto Geográfico Nacional. Delimitació Territorial: Comarques de La Comunitat Valenciana, 2024.
- EFE News Agency. El Incendio de l’Alcalatén de 2007 Fue Provocado Por Trabajos En La Red Eléctrica Sin Licencia. El Mundo online, 2010.
- Dalezios, N. R.; Kalabokidis, K.; Koutsias, N.; Vasilakos, C. Wlidfires and Remote Sensing. An Overview. In Remote sensing of hydrometeorological hazards; Petropoulos, G. P., Islam, T., Eds.; CRC Press, Taylor & Francis Group: Boca Raton London New York, 2018. [Google Scholar]
- Saghafi, M. Extract NBR index using GEE (SLC issue resolved). https://github.com/MostafaSaghafi/NBR_GEE?tab=readme-ov-file#extract-nbr-index-using-gee-slc-issue-resolved (accessed 2025-03-02).
- Stal, C.; Sloover, L. D.; Verbeurgt, J.; Wulf, A. D. On Finding a Projected Coordinate Reference System. Geographies 2022, 2, 245–257. [Google Scholar] [CrossRef]
- Climate Engine Team. On-Demand Insights from Climate and Earth Observations Data, 2025. https://www.climateengine.org/.
- Chen, X.; Vogelmann, J. E.; Rollins, M.; Ohlen, D.; Key, C. H.; Yang, L.; Huang, C.; Shi, H. Detecting Post-Fire Burn Severity and Vegetation Recovery Using Multitemporal Remote Sensing Spectral Indices and Field-Collected Composite Burn Index Data in a Ponderosa Pine Forest. International Journal of Remote Sensing 2011, 32, 7905–7927. [Google Scholar] [CrossRef]
- Viana-Soto, A.; García, M.; Aguado, I.; Salas, J. Assessing Post-Fire Forest Structure Recovery by Combining LiDAR Data and Landsat Time Series in Mediterranean Pine Forests. International Journal of Applied Earth Observation and Geoinformation 2022, 108, 102754. [Google Scholar] [CrossRef]
- Kennedy, R. E.; Yang, Z.; Cohen, W. B.; Pfaff, E.; Braaten, J.; Nelson, P. Spatial and Temporal Patterns of Forest Disturbance and Regrowth within the Area of the Northwest Forest Plan. Remote Sensing of Environment 2012, 122, 117–133. [Google Scholar] [CrossRef]
- Chéret, V.; Denux, J.-P. Analysis of MODIS NDVI Time Series to Calculate Indicators of Mediterranean Forest Fire Susceptibility. GIScience & Remote Sensing 2011, 48, 171–194. [Google Scholar] [CrossRef]
- As climate changes, world grapples with a wildfire crisis. https://www.unep.org/news-and-stories/story/climate-changes-world-grapples-wildfire (accessed 2025-07-02).
- Wildfires and Climate Change - NASA Science. https://science.nasa.gov/earth/explore/wildfires-and-climate-change/ (accessed 2025-07-02).
- Wildfires and Climate Change - Center for Climate and Energy SolutionsCenter for Climate and Energy Solutions. https://www.c2es.org/content/wildfires-and-climate-change/ (accessed 2025-07-02).
- Wildfires | Environmental Defense Fund. https://www.edf.org/climate/heres-how-climate-change-affects-wildfires (accessed 2025-07-02).
- Wildfire climate connection | National Oceanic and Atmospheric Administration. https://www.noaa.gov/noaa-wildfire/wildfire-climate-connection (accessed 2025-07-02).
- The Amazon, Siberia, Indonesia: A World of Fire - The New York Times. https://www.nytimes.com/2019/08/28/climate/fire-amazon-africa-siberia-worldwide.html (accessed 2025-07-02).
- Kloster, S.; Lasslop, G. Historical and Future Fire Occurrence (1850 to 2100) Simulated in CMIP5 Earth System Models. Global and Planetary Change 2017, 150, 58–69. [Google Scholar] [CrossRef]
- Stevens-Rumann, C. S.; Morgan, P. Tree Regeneration Following Wildfires in the Western US: A Review. fire ecol 2019, 15. [Google Scholar] [CrossRef]
- Technical Summary | Climate Change 2022: Impacts, Adaptation and Vulnerability. https://www.ipcc.ch/report/ar6/wg2/chapter/technical-summary/ (accessed 2025-07-02).
- Teckentrup, L.; Harrison, S. P.; Hantson, S.; Heil, A.; Melton, J. R.; Forrest, M.; Li, F.; Yue, C.; Arneth, A.; Hickler, T.; Sitch, S.; Lasslop, G. Response of Simulated Burned Area to Historical Changes in Environmental and Anthropogenic Factors: A Comparison of Seven Fire Models. Biogeosciences 2019, 16, 3883–3910. [Google Scholar] [CrossRef]
- Turco, M.; Bedia, J.; Di Liberto, F.; Fiorucci, P.; Von Hardenberg, J.; Koutsias, N.; Llasat, M.-C.; Xystrakis, F.; Provenzale, A. Decreasing Fires in Mediterranean Europe. PLoS ONE 2016, 11, e0150663. [Google Scholar] [CrossRef]
- Chen, Y.; Hall, J.; Van Wees, D.; Andela, N.; Hantson, S.; Giglio, L.; Van Der Werf, G. R.; Morton, D. C.; Randerson, J. T. Multi-Decadal Trends and Variability in Burned Area from the Fifth Version of the Global Fire Emissions Database (GFED5). Earth Syst. Sci. Data 2023, 15, 5227–5259. [Google Scholar] [CrossRef]
- Andela, N.; Morton, D. C.; Giglio, L.; Chen, Y.; Van Der Werf, G. R.; Kasibhatla, P. S.; DeFries, R. S.; Collatz, G. J.; Hantson, S.; Kloster, S.; Bachelet, D.; Forrest, M.; Lasslop, G.; Li, F.; Mangeon, S.; Melton, J. R.; Yue, C.; Randerson, J. T. A Human-Driven Decline in Global Burned Area. Science 2017, 356, 1356–1362. [Google Scholar] [CrossRef] [PubMed]
- Mora Aliseda, J.; Horcajo Romo, A. I.; Castro Serrano, J.; Garrido Velarde, J. Evolución de los incendios forestales en España y Extremadura. ¿Correlación con el Cambio Climático? An. geogr. Univ. Complut. 2024, 44, 191–215. [Google Scholar] [CrossRef]
- Ubeda Cartañà, X.; Mataix-Solera, J.; Francos, M.; Farguell, J. Grandes incendios forestales en España y alteraciones de su régimen en las últimas décadas. In Geografia, Riscos e Proteção Civil. Homenagem ao Professor Doutor Luciano Lourenço.; Nunes, A., Amaro, A., Vieira, A., Velez de Castro, F., Félix, F., Eds.; RISCOS - Associação Portuguesa de Riscos, Prevenção e Segurança, 2021; pp 147–161. [CrossRef]
- Ruffault, J.; Curt, T.; Moron, V.; Trigo, R. M.; Mouillot, F.; Koutsias, N.; Pimont, F.; Martin-StPaul, N.; Barbero, R.; Dupuy, J.-L.; Russo, A.; Belhadj-Khedher, C. Increased Likelihood of Heat-Induced Large Wildfires in the Mediterranean Basin. Sci Rep 2020, 10, 13790. [Google Scholar] [CrossRef]
- Krawchuk, M. A.; Moritz, M. A. Constraints on Global Fire Activity Vary across a Resource Gradient. Ecology 2011, 92, 121–132. [Google Scholar] [CrossRef]
- Delgado-Artés, R.; Garófano-Gómez, V.; Oliver-Villanueva, J. V.; Rojas-Briales, E. Land Use/Cover Change Analysis in the Mediterranean Region: A Regional Case Study of Forest Evolution in Castelló (Spain) over 50 Years. Land Use Policy 2022, 114. [Google Scholar] [CrossRef]
- Vilar, L.; Camia, A.; San-Miguel-Ayanz, J.; Martín, M. P. Modeling Temporal Changes in Human-Caused Wildfires in Mediterranean Europe Based on Land Use-Land Cover Interfaces. Forest Ecology and Management 2016, 378, 68–78. [Google Scholar] [CrossRef]
- Gónzalez Hidalgo, J. C. Una Teoría Con Fallos. Hechos, Mitos y Paradojas Del Cambio Del Clima; Aula Magna. Proyecto Clave; McGraw Hill.
- Fernández, A.; Illera, P.; Casanova, J. L. Automatic Mapping of Surfaces Affected by Forest Fires in Spain Using AVHRR NDVI Composite Image Data. Remote Sensing of Environment 1997, 60, 153–162. [Google Scholar] [CrossRef]
- Maselli, F.; Romanelli, S.; Bottai, L.; Zipoli, G. Use of NOAA-AVHRR NDVI Images for the Estimation of Dynamic Fire Risk in Mediterranean Areas. Remote Sensing of Environment 2003, 86, 187–197. [Google Scholar] [CrossRef]
- Doctor Cabrera, A. M. Los incendios forestales de más de 100 hectáreas en Andalucía (1988-2020): caracterización general y análisis de su afección en la provincia de Huelva. Ingeo 2025, No. 83, 9–36. [Google Scholar] [CrossRef]
- Lacouture, D. L.; Broadbent, E. N.; Crandall, R. M. Detecting Vegetation Recovery after Fire in A Fire-Frequented Habitat Using Normalized Difference Vegetation Index (NDVI). Forests 2020, 11, 749. [Google Scholar] [CrossRef]
- Elvira, N. J.; Lloret, F.; Jaime, L.; Margalef-Marrase, J.; Pérez Navarro, M. Á.; Batllori, E. Species Climatic Niche Explains Post-Fire Regeneration of Aleppo Pine (Pinus Halepensis Mill.) under Compounded Effects of Fire and Drought in East Spain. Science of The Total Environment 2021, 798, 149308. [Google Scholar] [CrossRef]
- Kiel, N. G.; Turner, M. G. Where Are the Trees? Extent, Configuration, and Drivers of Poor Forest Recovery 30 Years after the 1988 Yellowstone Fires. Forest Ecology and Management 2022, 524, 120536. [Google Scholar] [CrossRef]
- Thanos, C. A.; Daskalakou, E. N. Reproduction in Pinus Halepensis and P. Brutia. In Ecology, Biogeography and Management of Pinus Halepensis and P. Brutia. In Ecology, Biogeography and Management of Pinus Halepensis and P. Brutia. Forest Ecosystems in the Mediterranean Basin; Ne’eman, G., Traubaud, L., Eds.; Backhuys Publishers: Leyden, 2000. [Google Scholar]
- Presentación SIOSE. https://www.siose.es/presentacion (accessed 2025-07-04).
- Potapov, P.; Hansen, M. C.; Pickens, A.; Hernandez-Serna, A.; Tyukavina, A.; Turubanova, S.; Zalles, V.; Li, X.; Khan, A.; Stolle, F.; Harris, N.; Song, X.-P.; Baggett, A.; Kommareddy, I.; Kommareddy, A. The Global 2000-2020 Land Cover and Land Use Change Dataset Derived From the Landsat Archive: First Results. Front. Remote Sens. 2022, 3. [Google Scholar] [CrossRef]
- Google Earth. General View of Artana Fire, 2015/05/18. 39°54’51.77"N - 0°17’19.28"W, 2015.
- Google Earth. Detail View of Artana Fire, 2015/05/18. 39°55’8.59"N - 0°16’55.60"W, 2015.
- Google Earth. General View of Artana Fire, 2016/11/16. 39°54’51.77"N - 0°17’19.28"W, 2016.
- Google Earth. Detail View of Artana Fire, 2016/11/16. 39°55’8.59"N - 0°16’55.60"W, 2016.
- Google Earth. Detail View of Artana Fire, 2022/02/27. 39°55’8.59"N - 0°16’55.60"W, 2022.
- Google Earth. General View of Artana Fire, 2022/02/27. 39°54’51.77"N - 0°17’19.28"W, 2022.
Figure 1.
Relief and location of Castellon province, Spain, and extent of large-scale wildfires in the period 1990-2024.
Figure 1.
Relief and location of Castellon province, Spain, and extent of large-scale wildfires in the period 1990-2024.
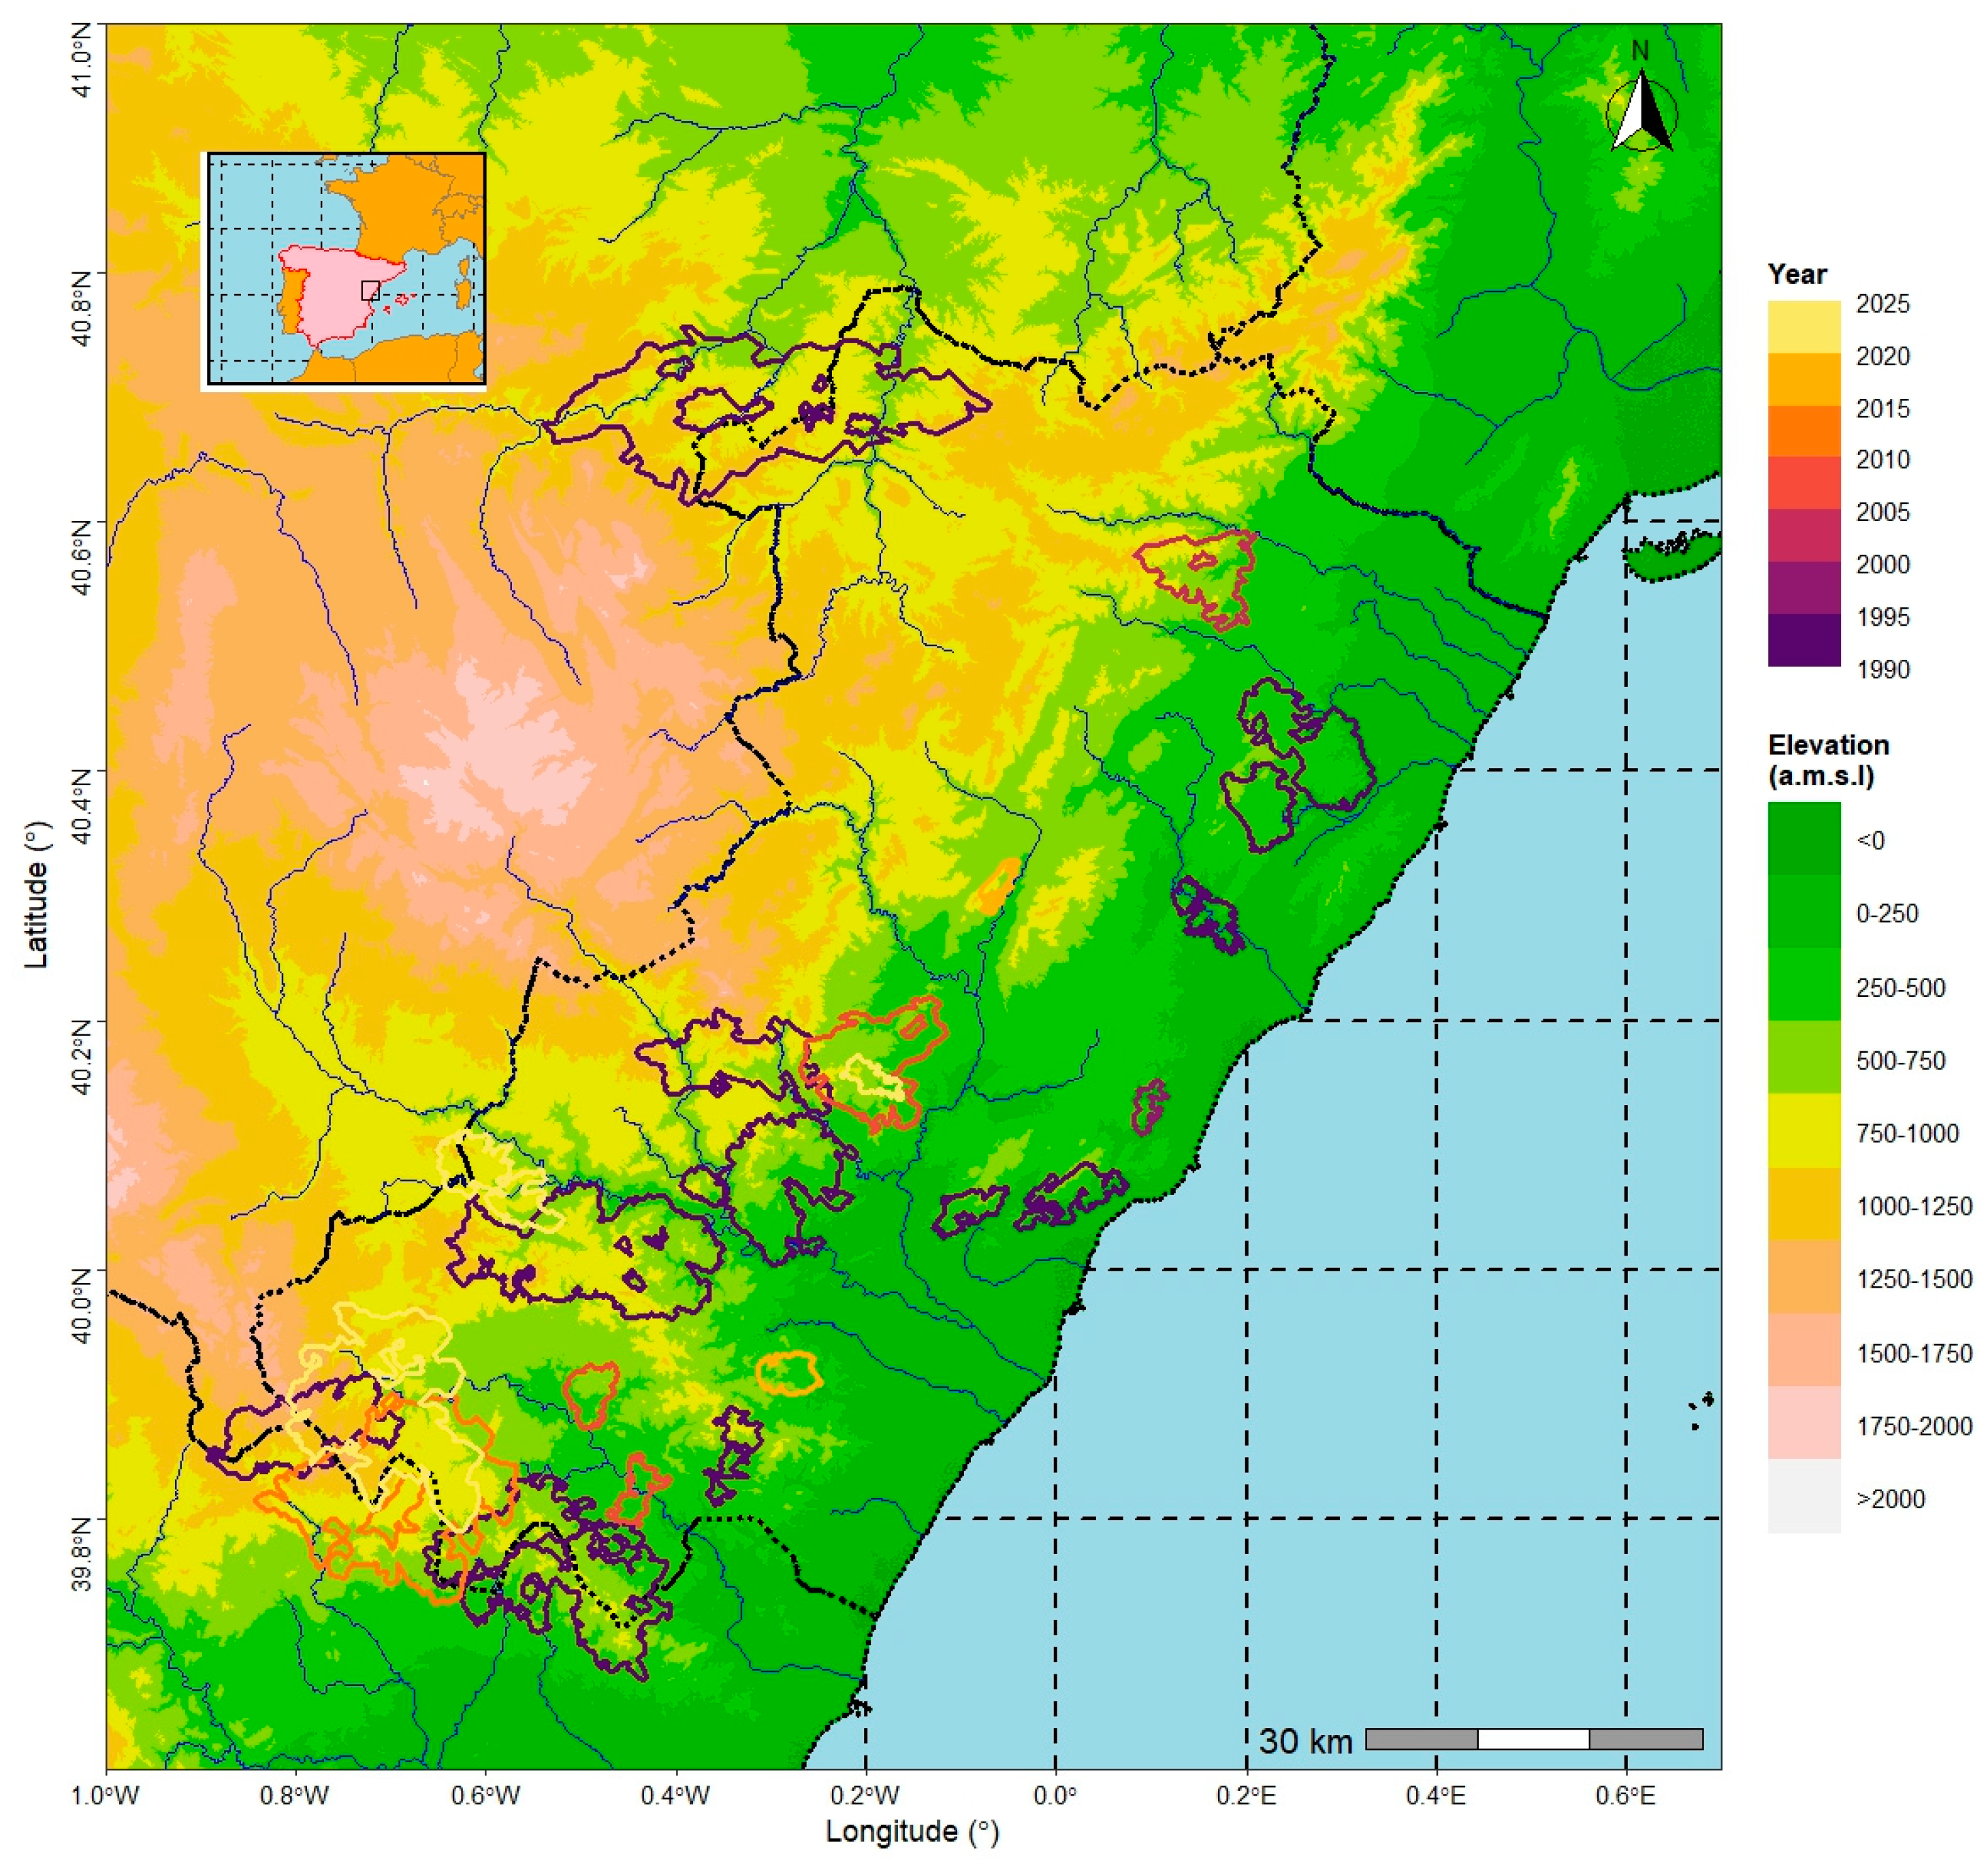
Figure 2.
LULC distribution in Castellon province in 2018. Source: “Generated using European Union's Copernicus Land Monitoring Service information; <https://doi.org/10.2909/71c95a07-e296-44fc-b22b-415f42acfdf0>” [33].
Figure 2.
LULC distribution in Castellon province in 2018. Source: “Generated using European Union's Copernicus Land Monitoring Service information; <https://doi.org/10.2909/71c95a07-e296-44fc-b22b-415f42acfdf0>” [33].
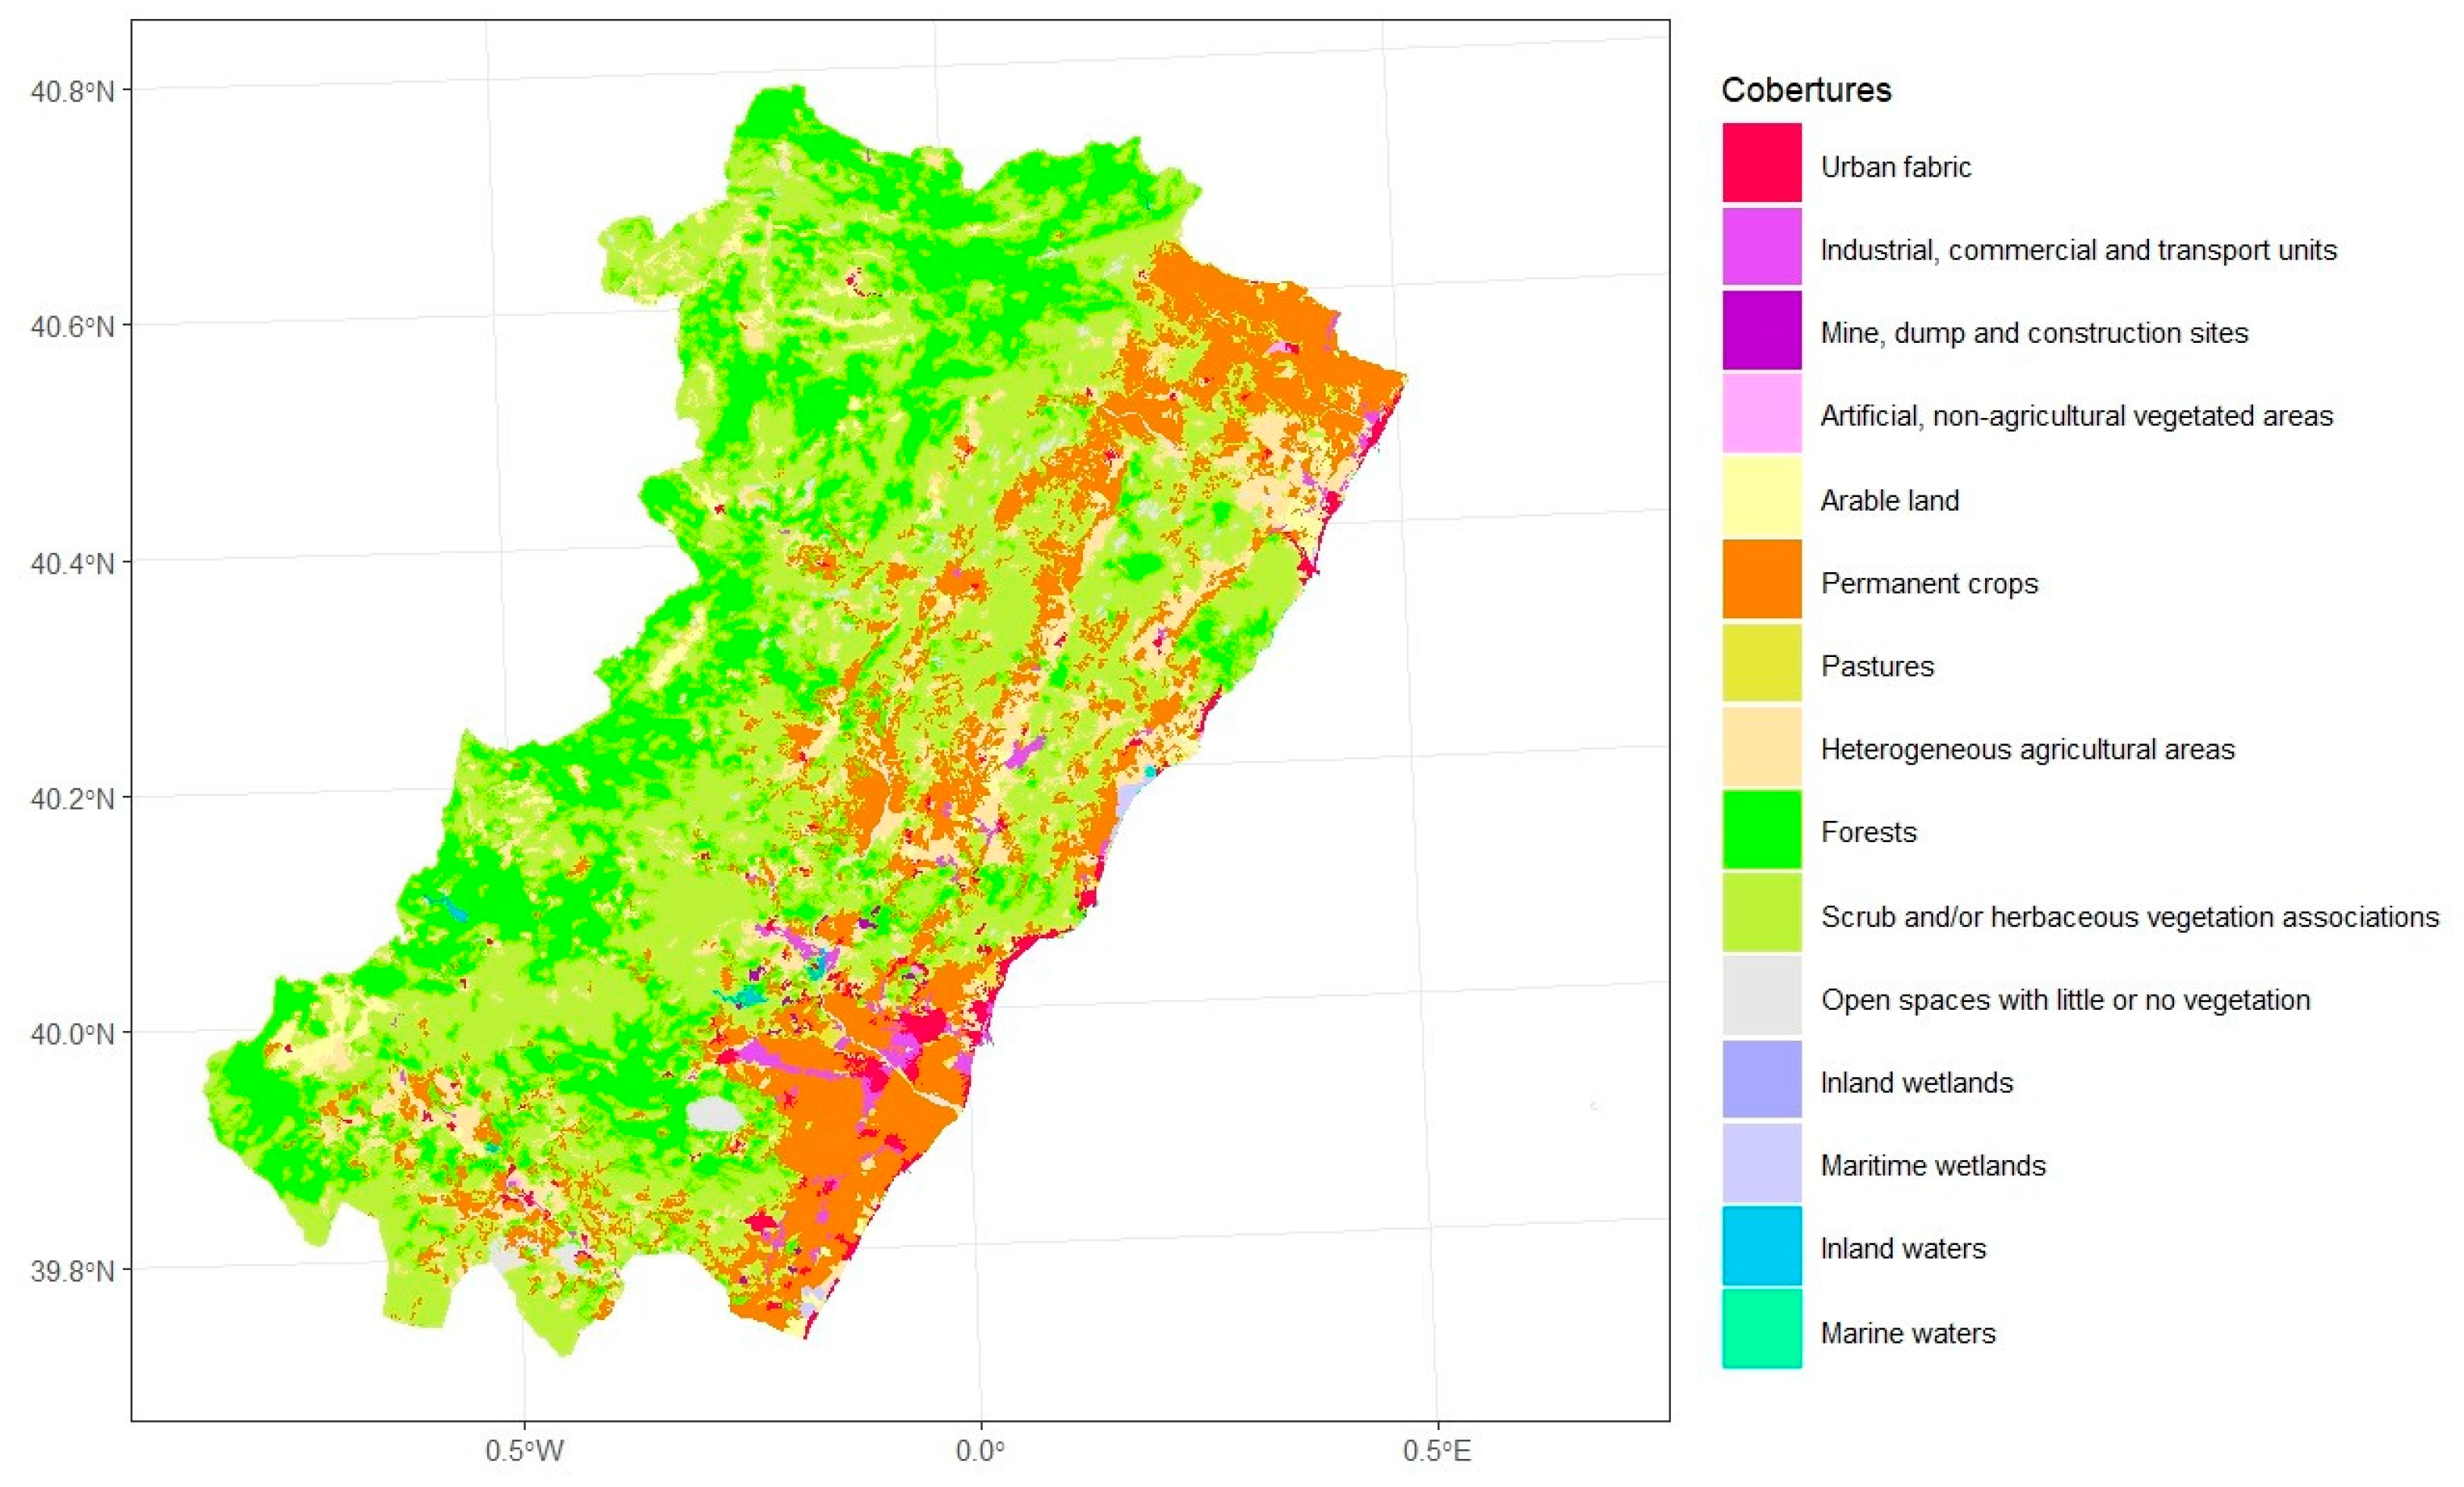
Figure 3.
Monthly change in the number of fires and area burned, for wildfires affecting more than 1 (top left) and 75 (top right) hectares, and annual change in the number of wildfires affecting more than 1 hectare and area burned by them (bottom). Red indicates number of fires; grey indicates area burned. Source: Valencian Regional Government wildfire databases [35].
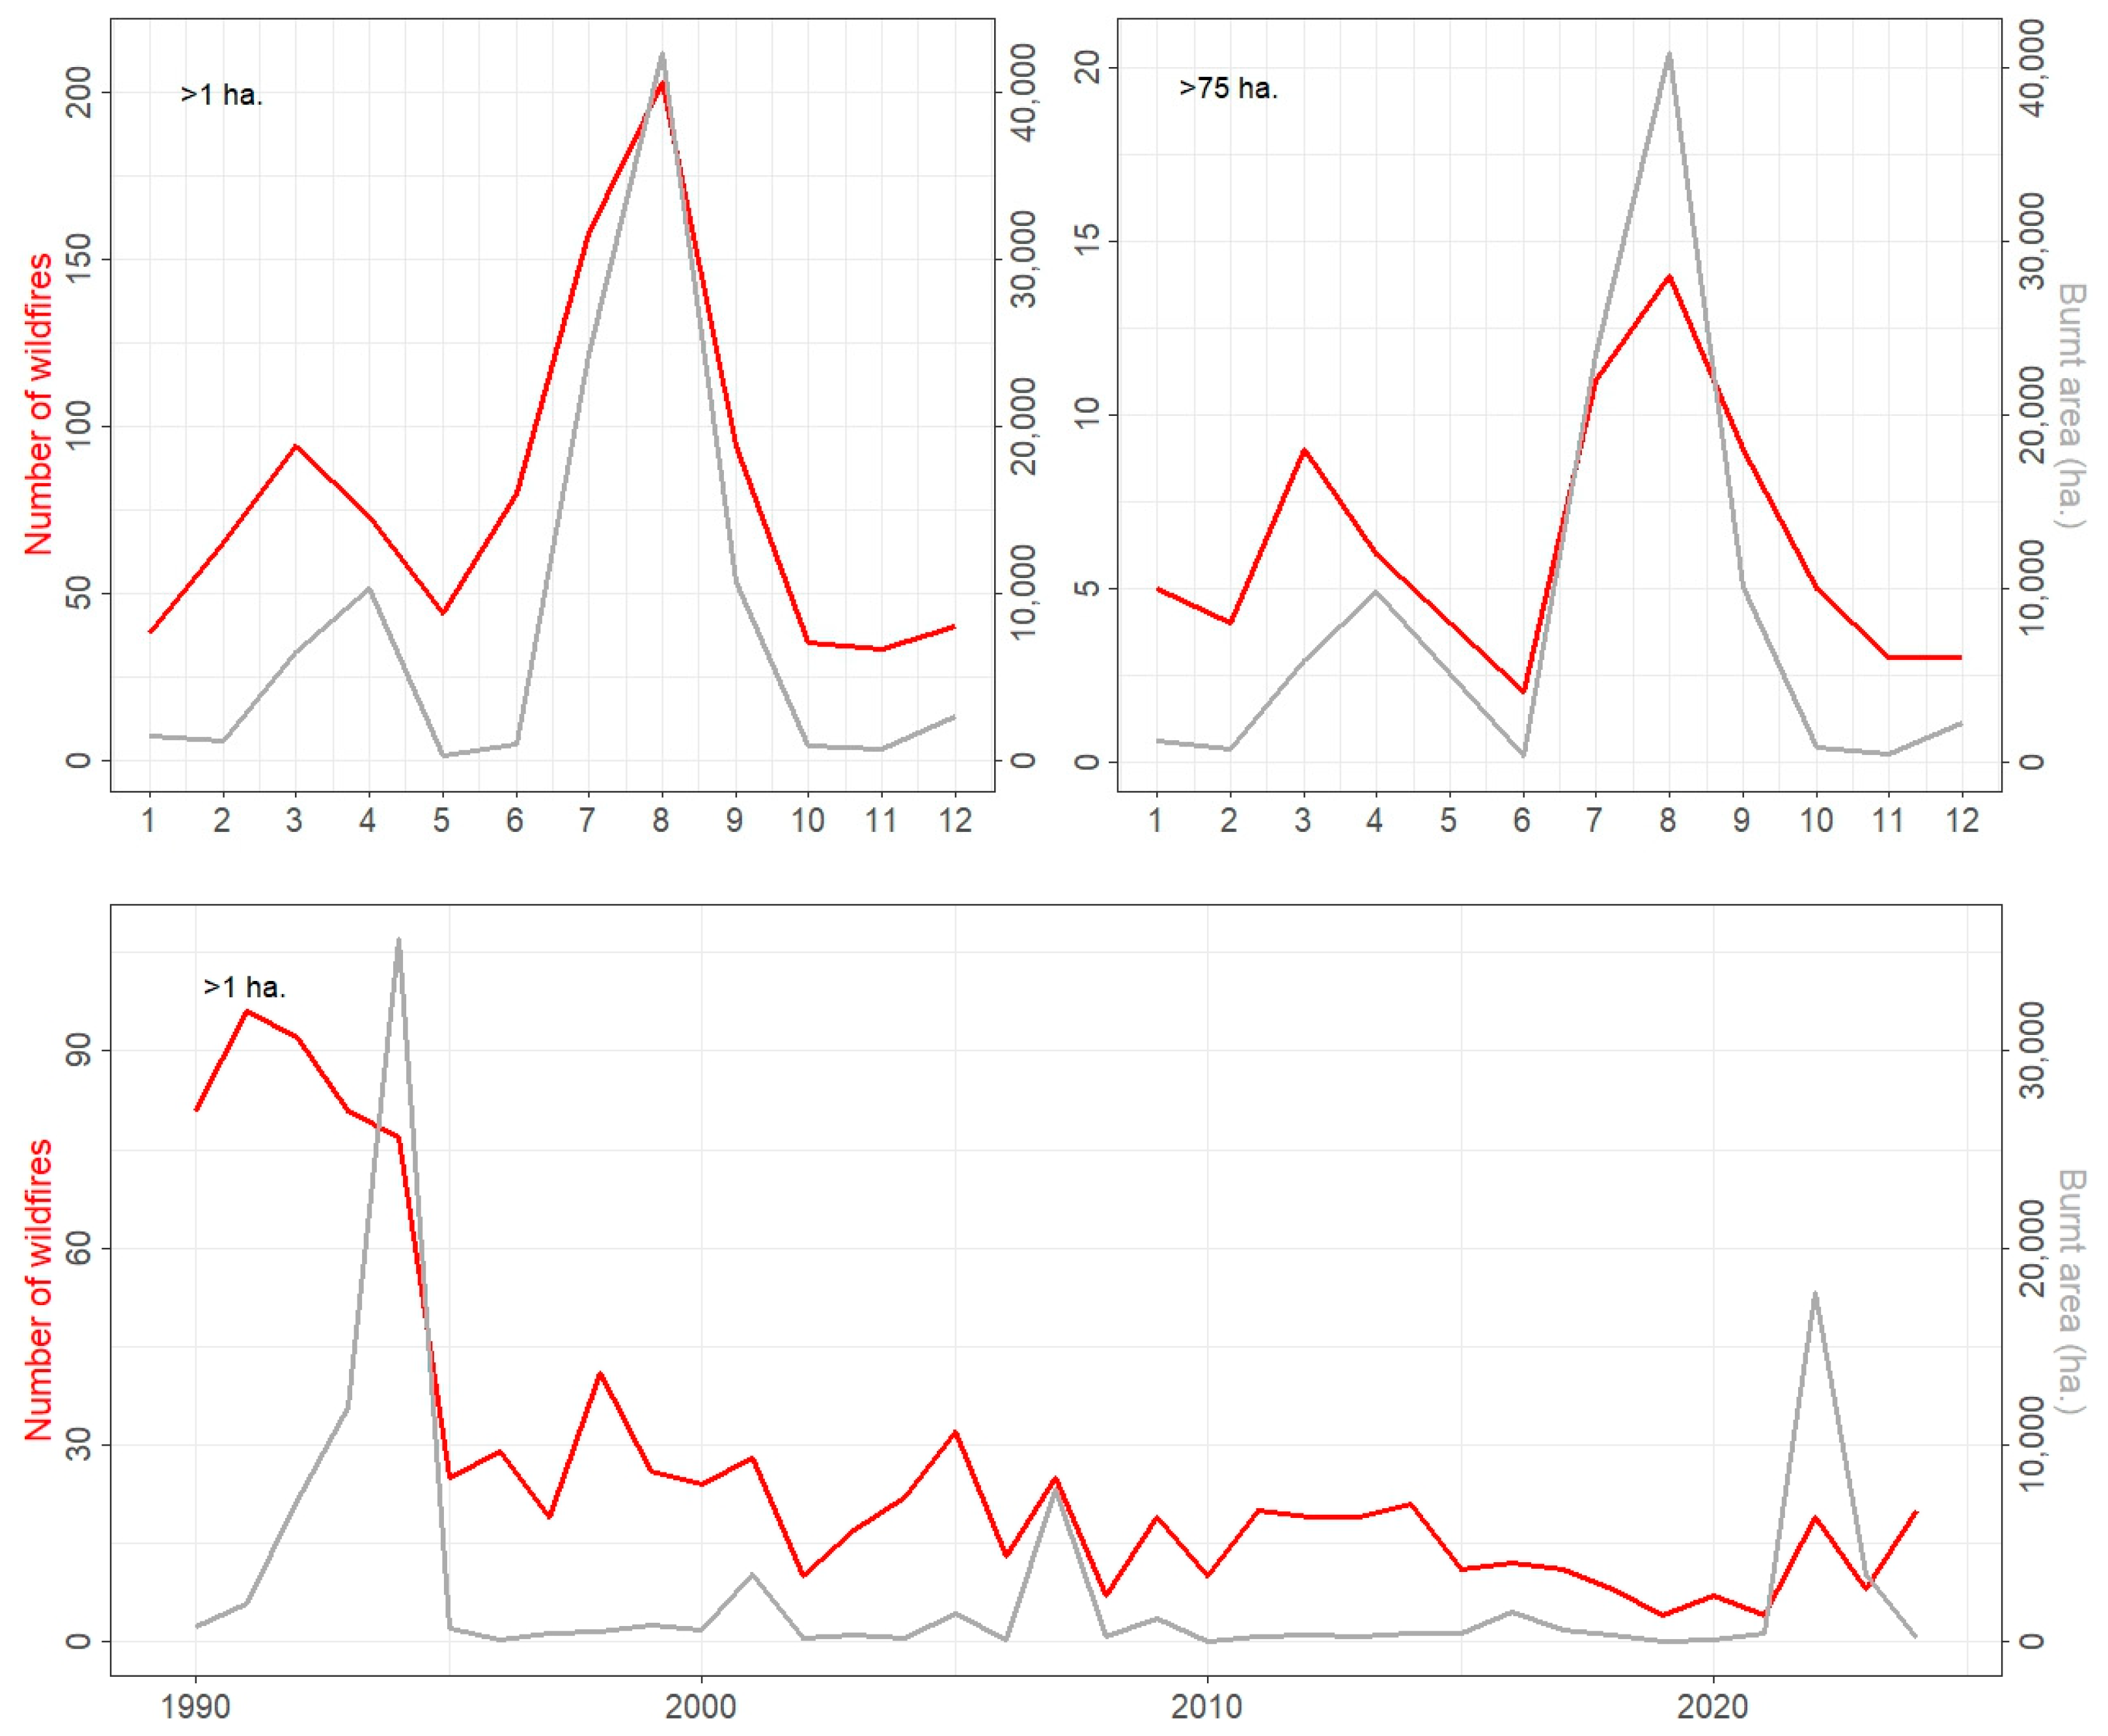
Figure 4.
Monthly change in the number of fires, shown in red on the left, and area burned, shown in grey on the right, for fires larger than 1 hectare by comarca. Source: Valencian Regional Government wildfire databases [35].
Figure 4.
Monthly change in the number of fires, shown in red on the left, and area burned, shown in grey on the right, for fires larger than 1 hectare by comarca. Source: Valencian Regional Government wildfire databases [35].
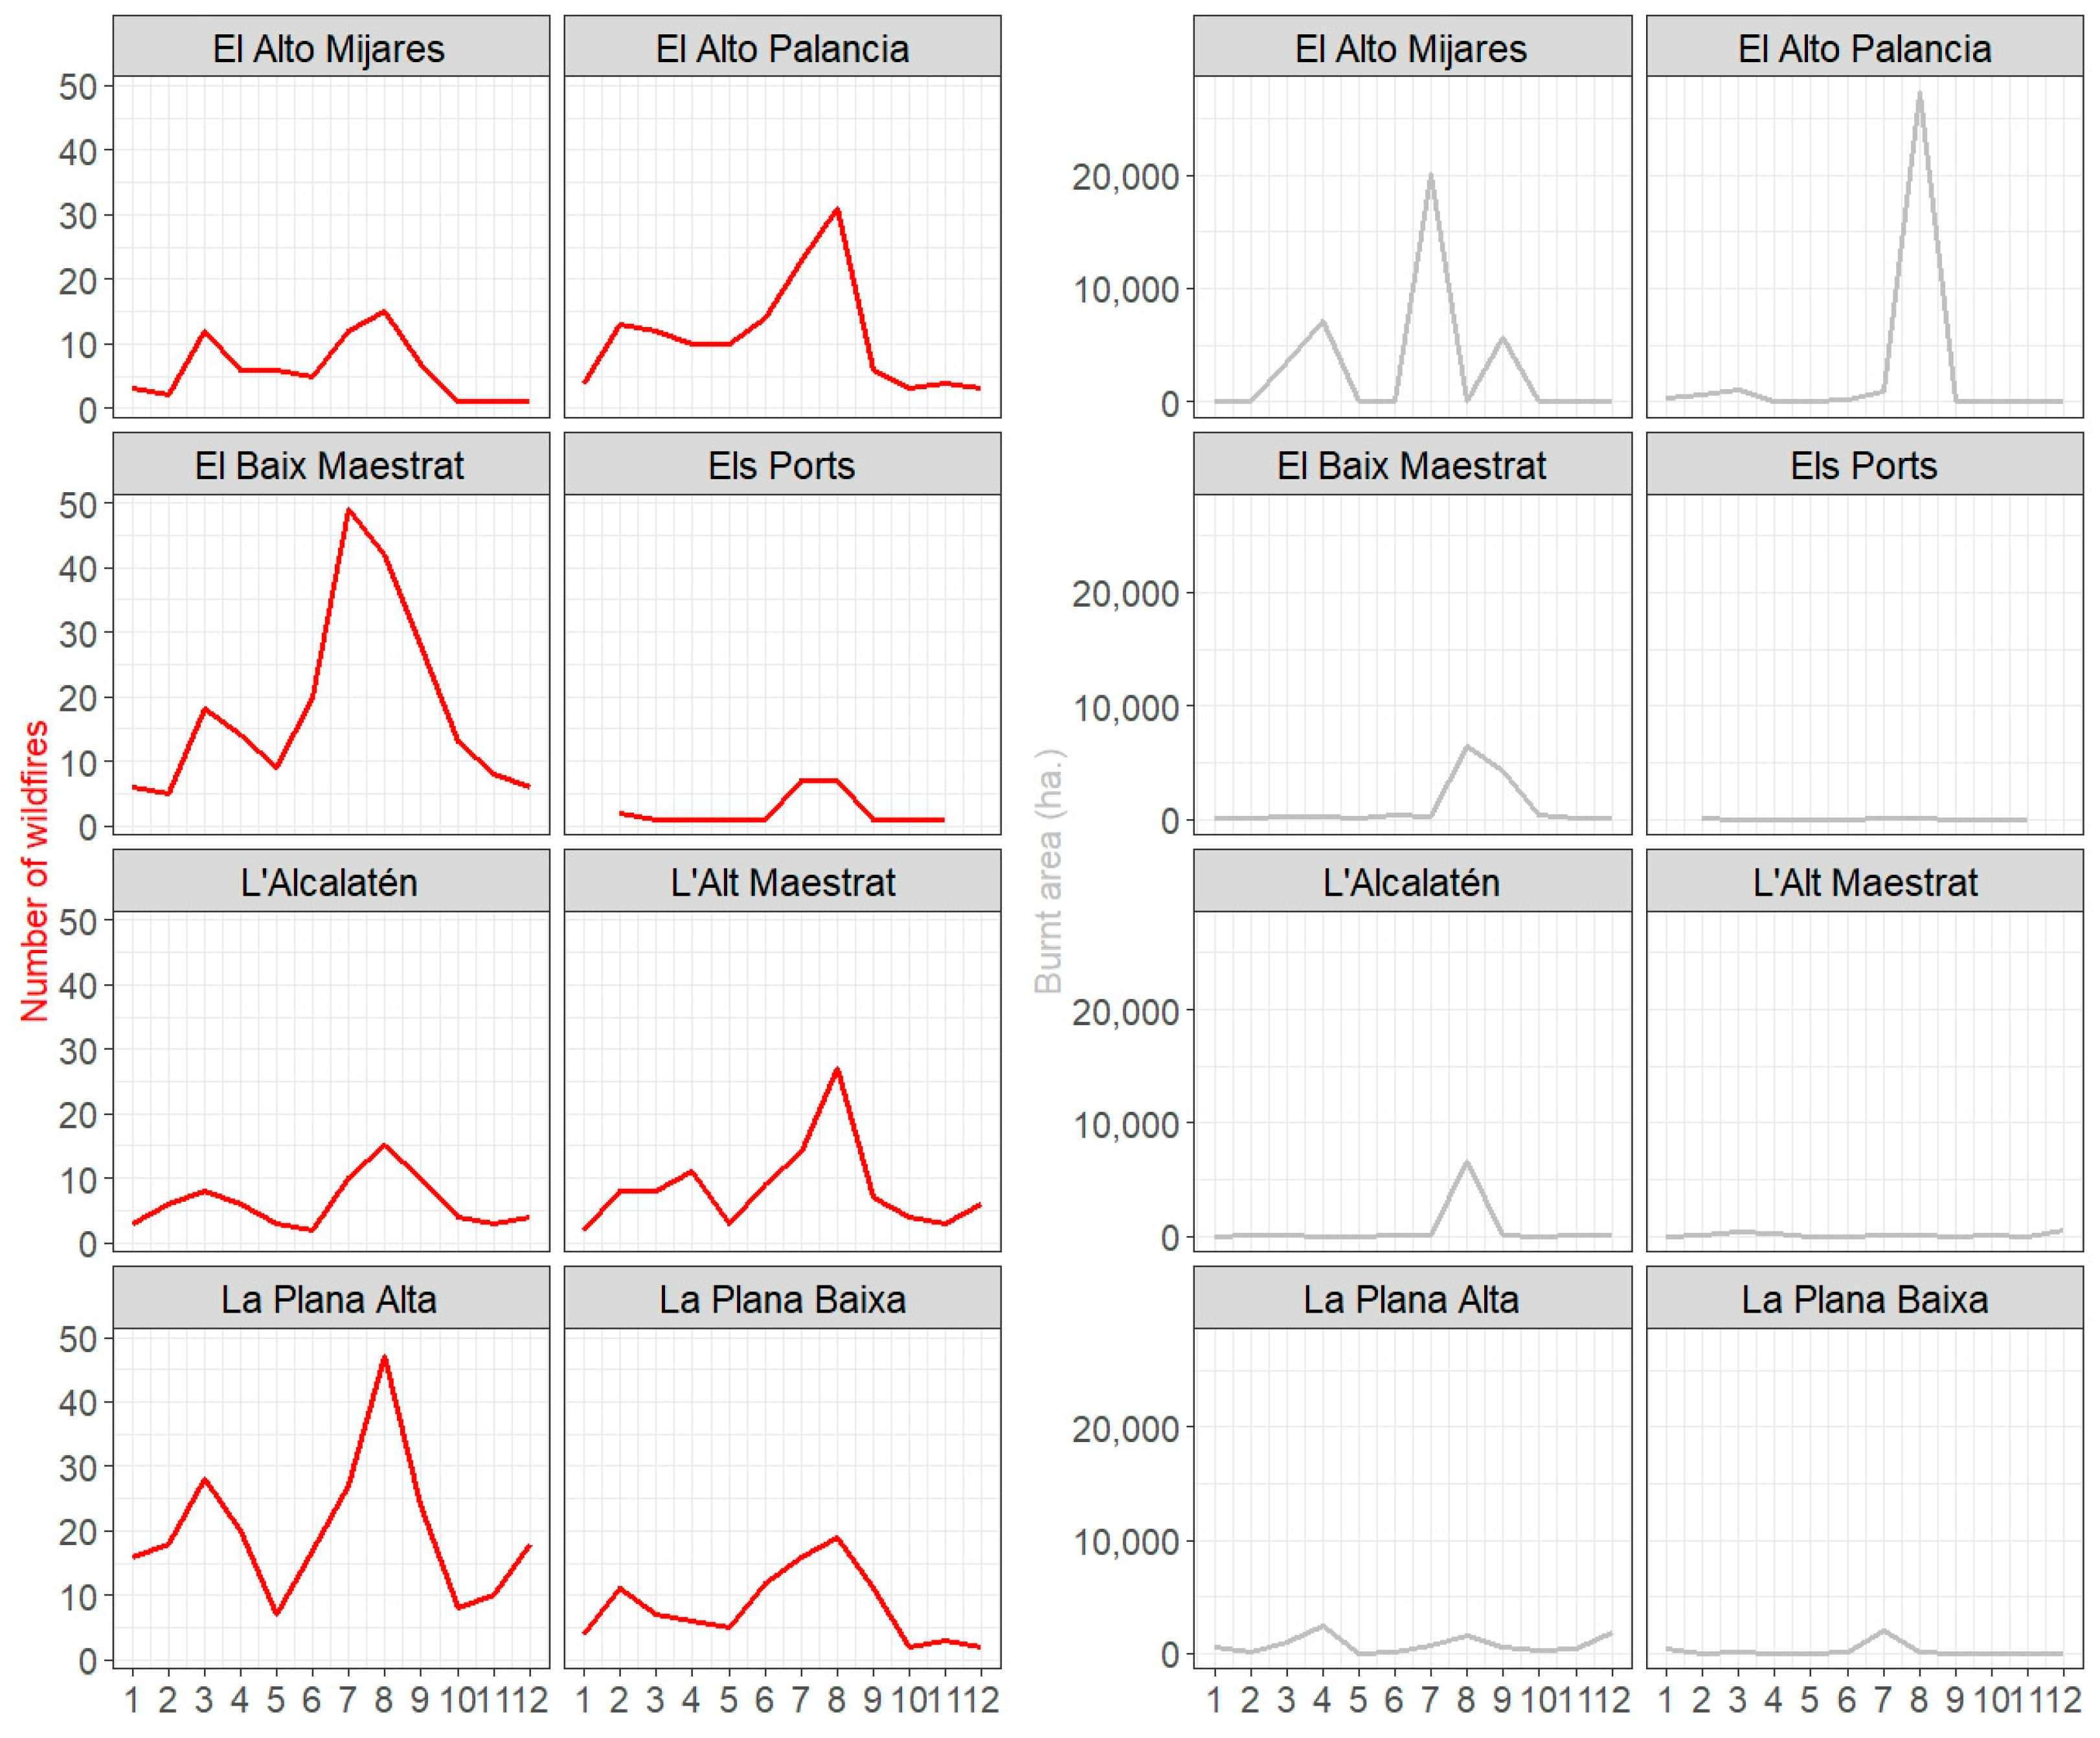
Figure 5.
Annual NDVI change for each wildfire. The vertical red line indicates the year of the fire and the dark green line the year in which NDVI reaches the average value prior to the fire. The horizontal dark green line indicates the average NDVI value prior to the fire and the light green line the NDVI reached five years after the fire. This latter line does not appear in the last three wildfires, the most recent ones, as the five-year period has not yet ended, just as the pre-fire NDVI level has not been reached in the last five fires. Their graphs therefore do not feature the vertical dark green line. Source: Climate Engine [50,71].
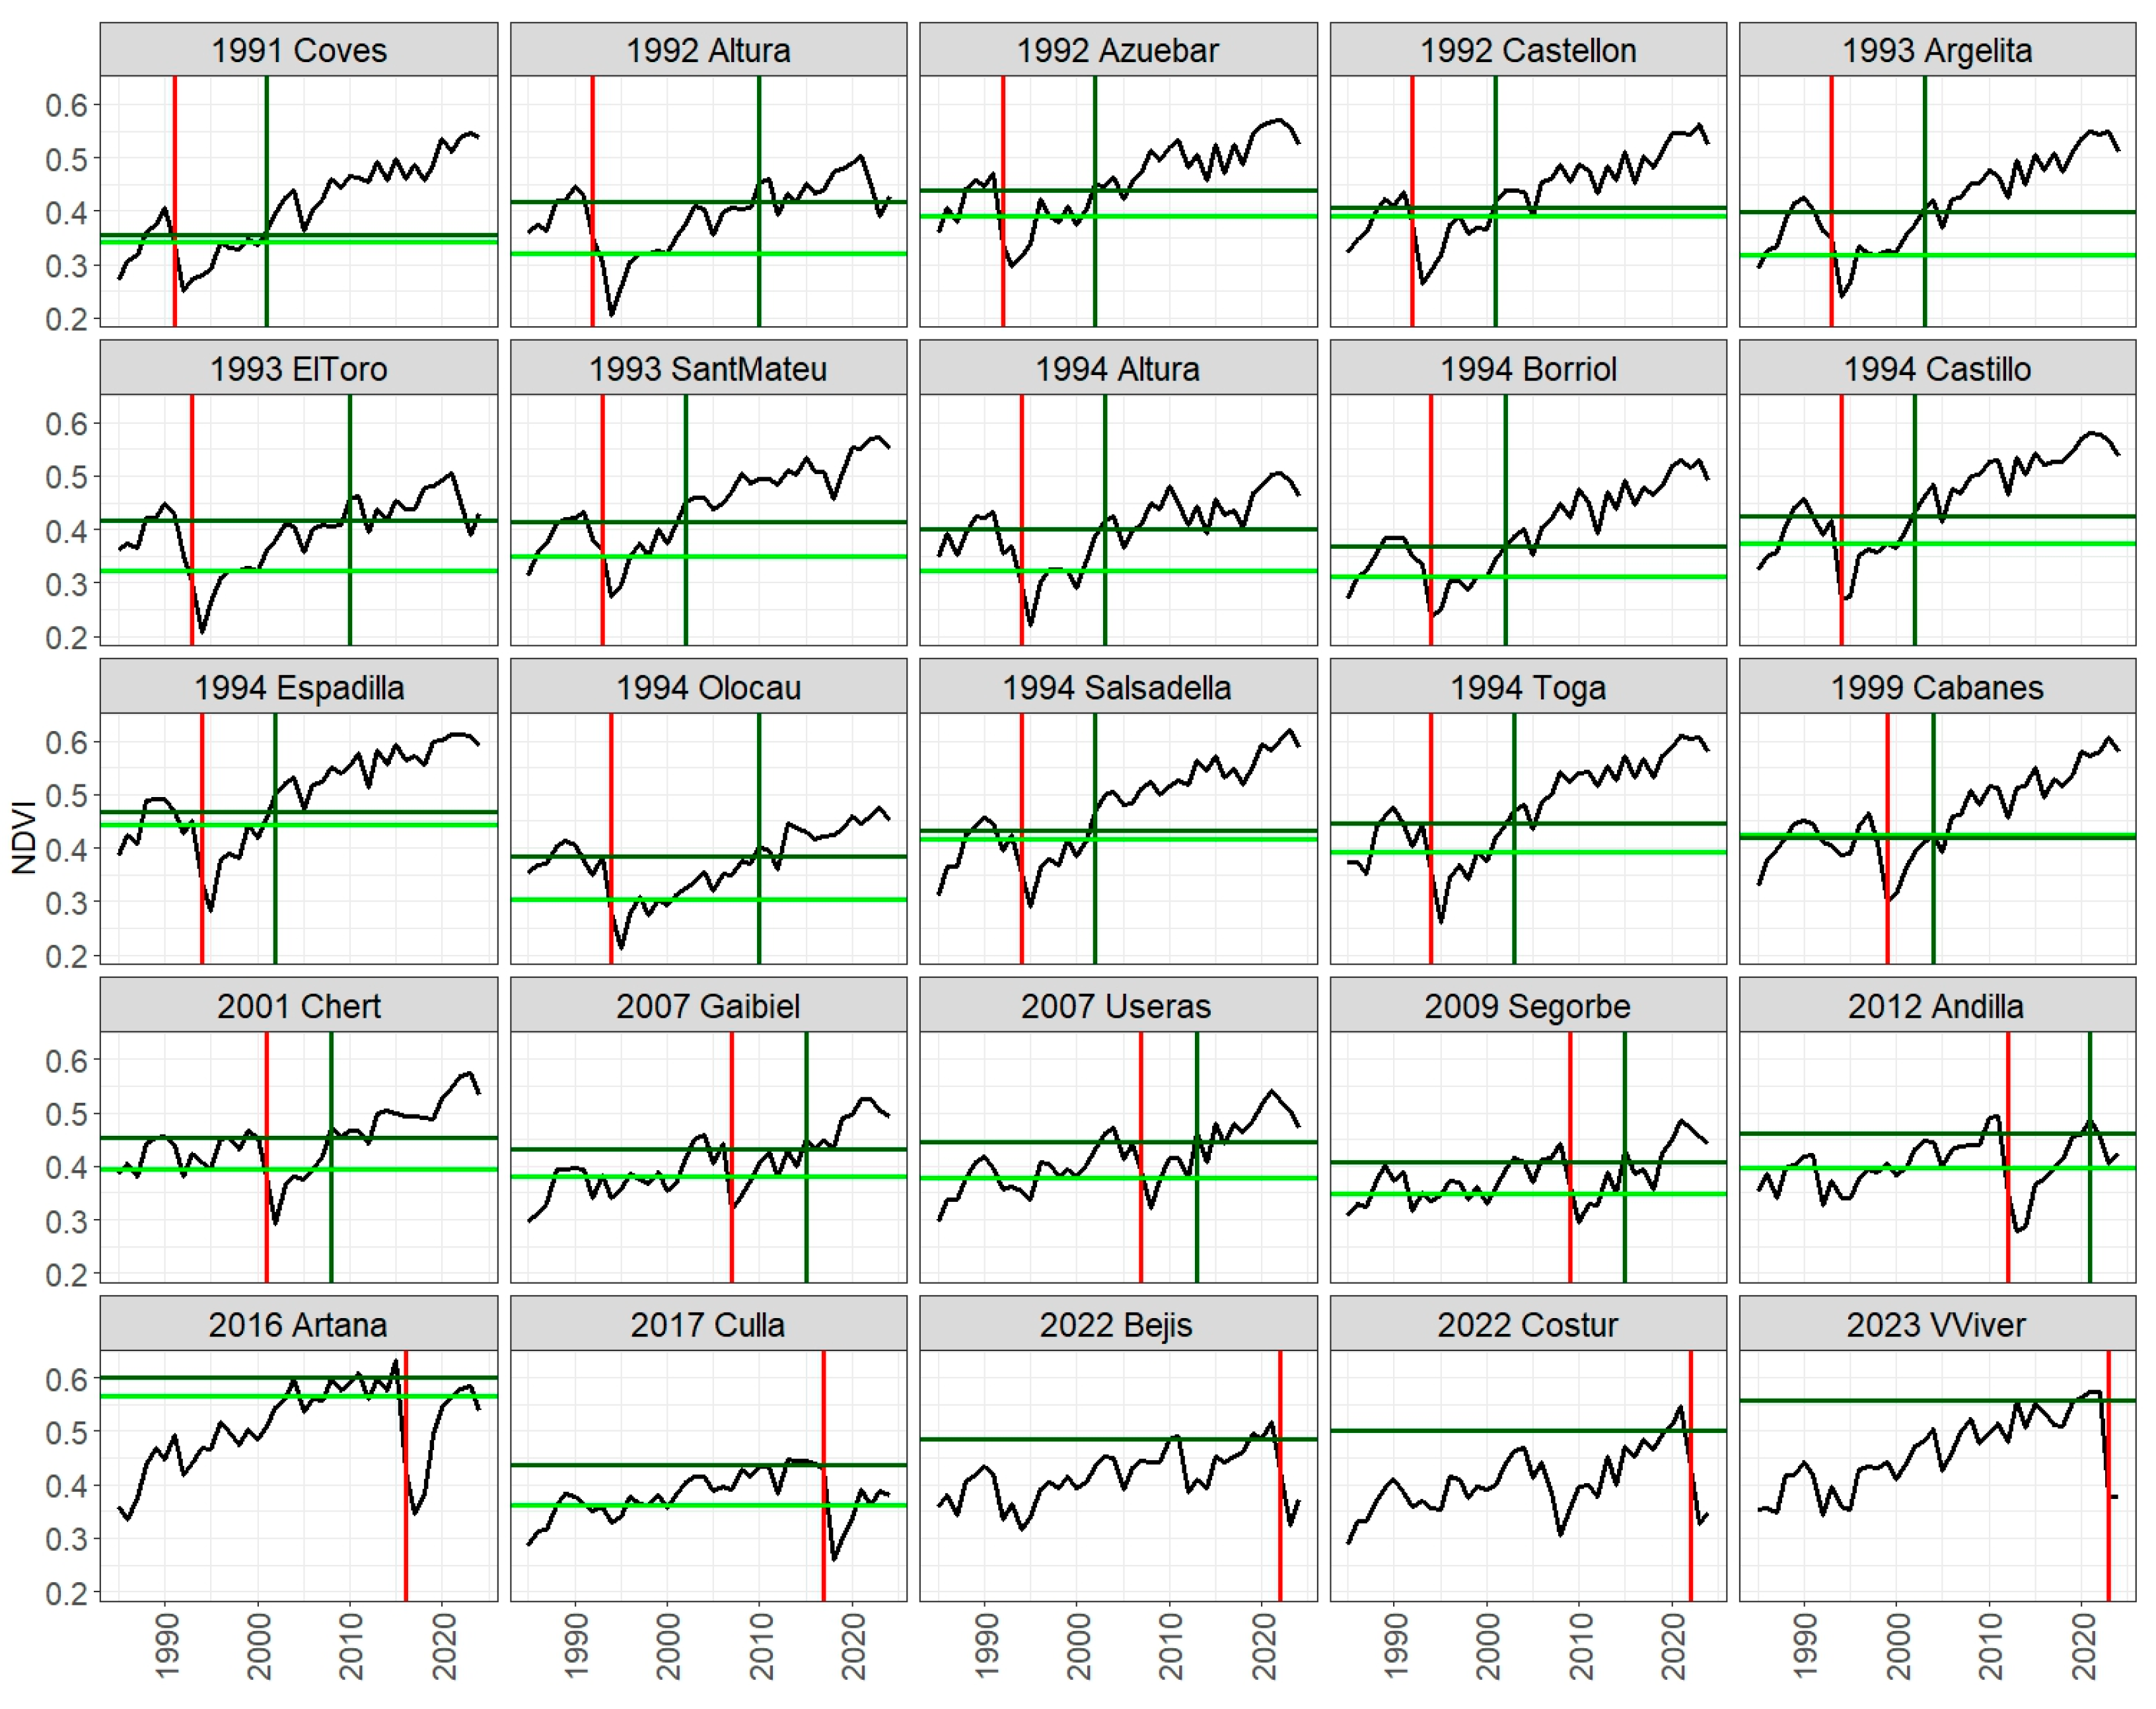
Figure 6.
Monthly change in NDVI values for each wildfire in the following periods: prior to the fire (pre-fire), fire year (fire), post-fire year (fire+1), post-fire recovery period (post-fire), and post-fire period after NDVI recovery (post-recover). Source: Climate Engine [51,72].
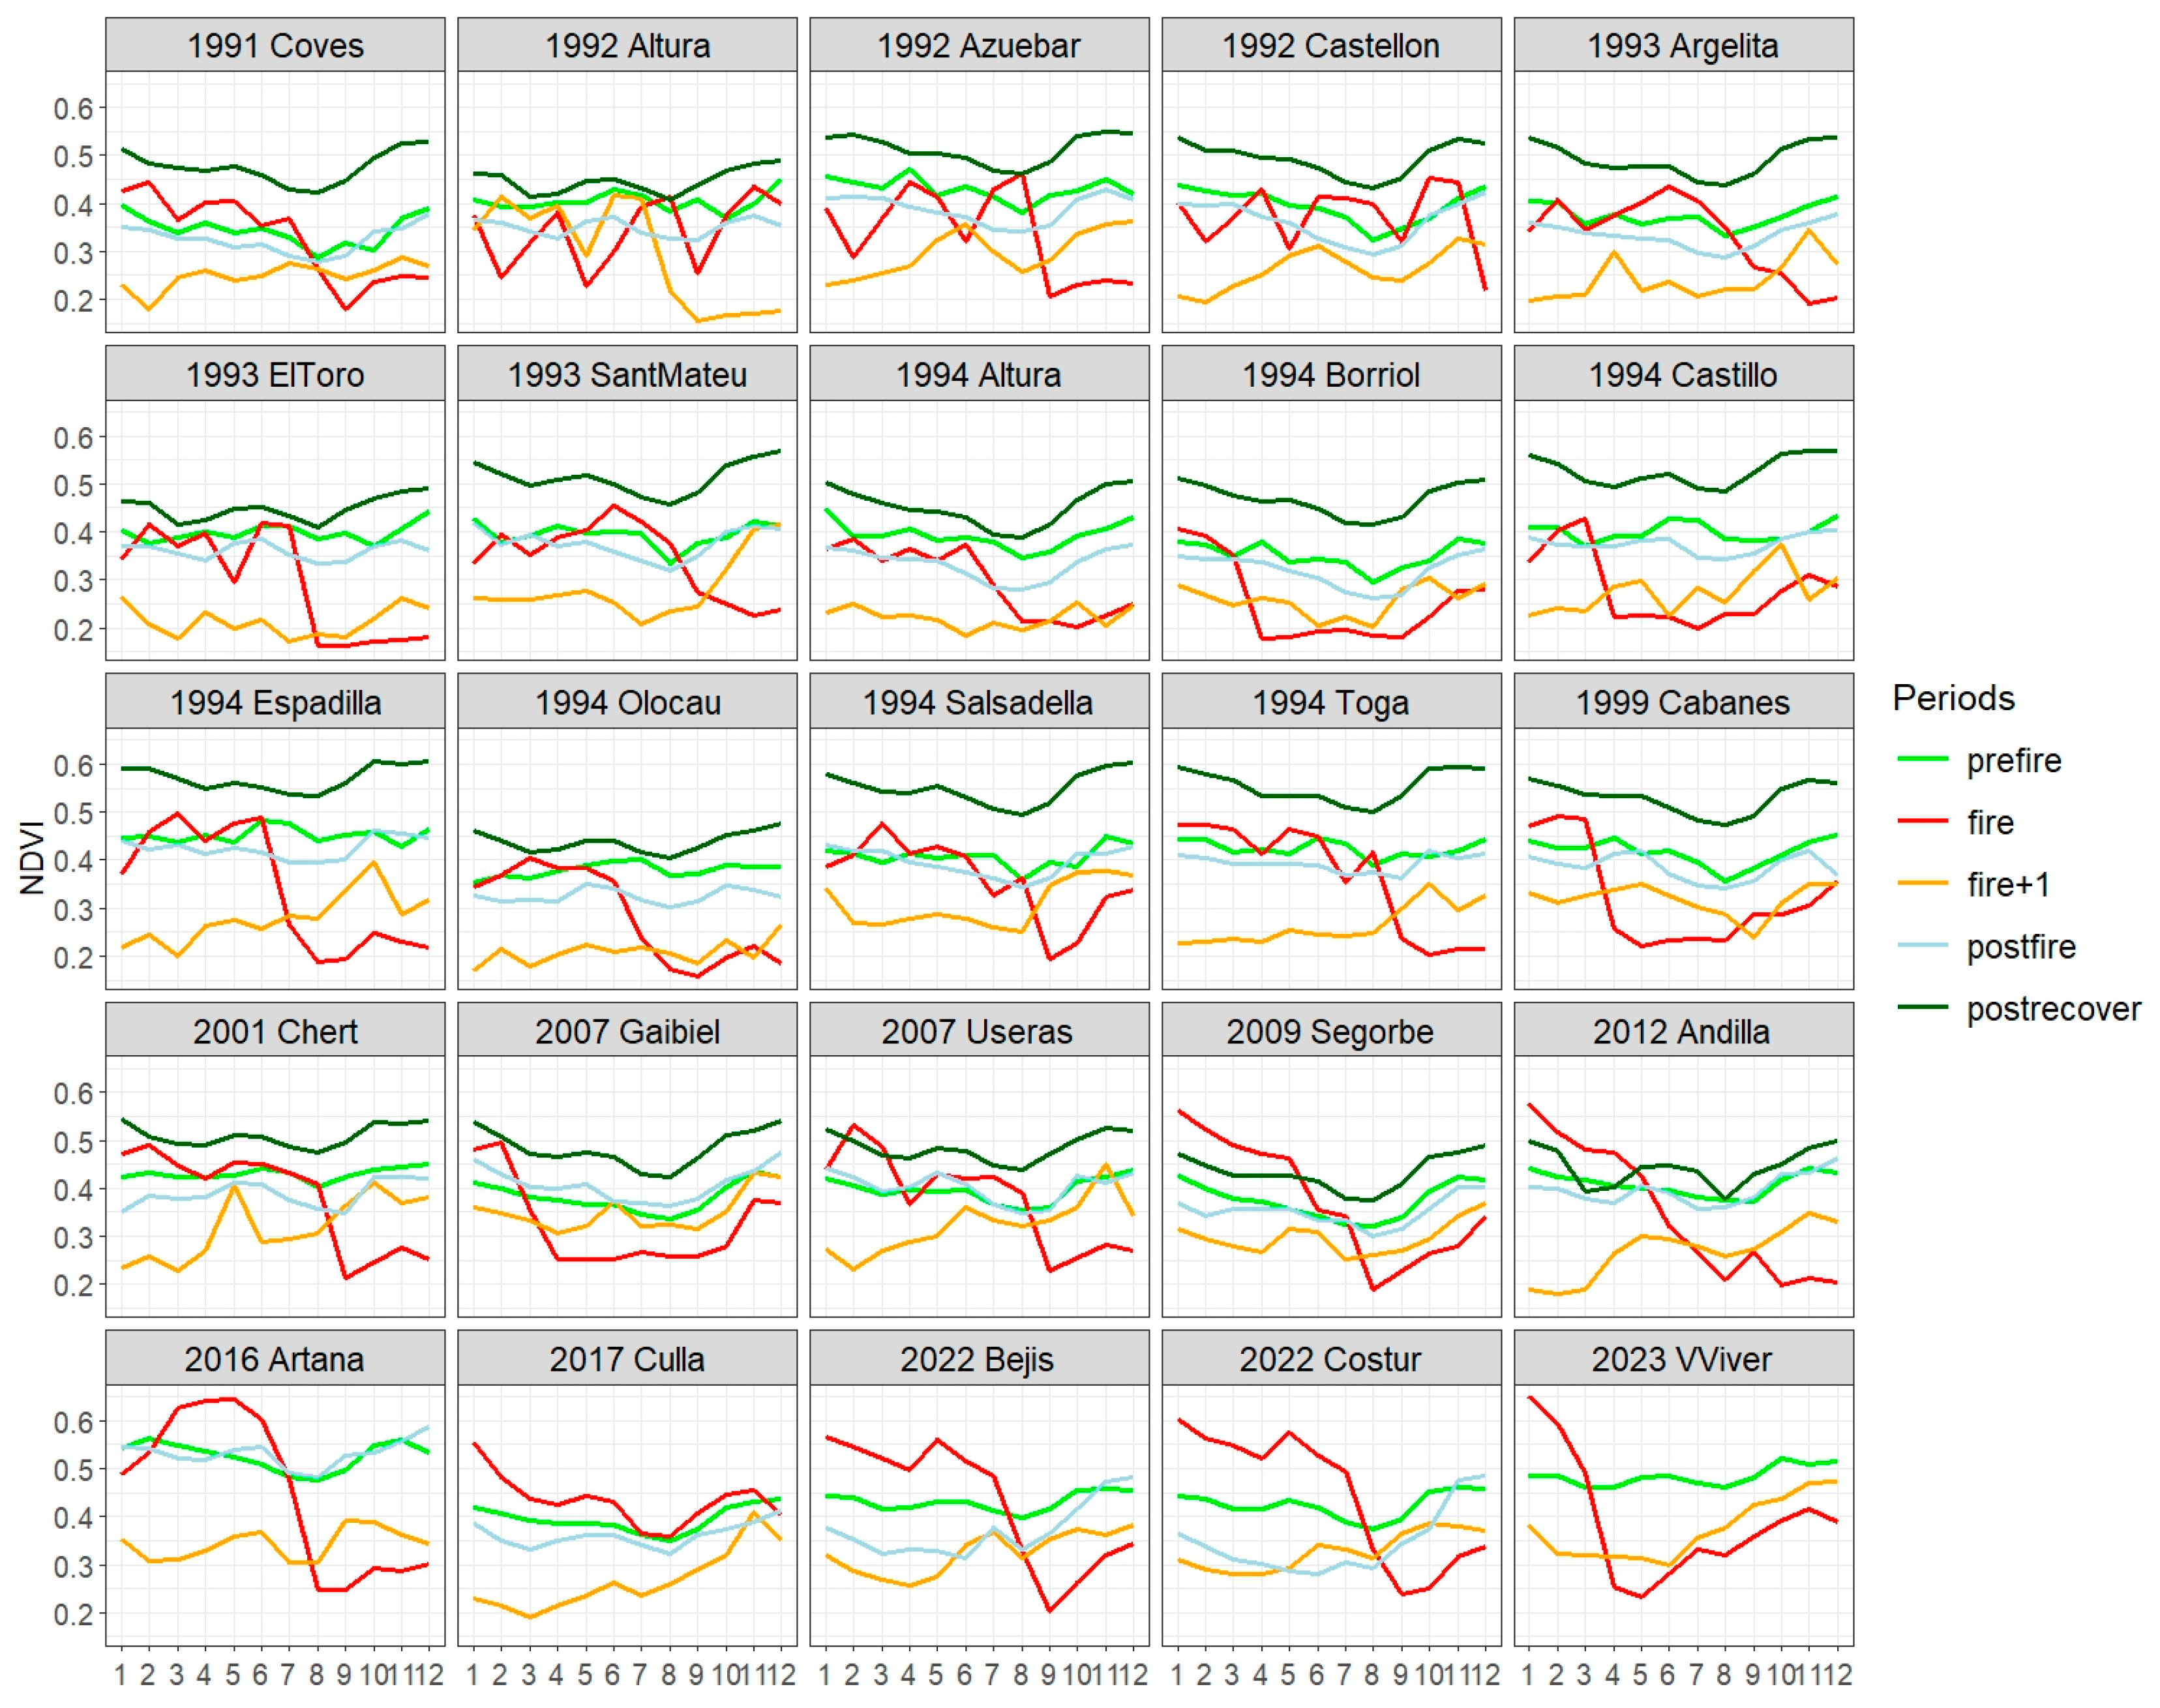
Figure 7.
Annual change in the number of wildfires and area burned in hectares for all fires (top) and large fires (bottom) in Spain (1968-2024). Source: Spanish Government [37,38].
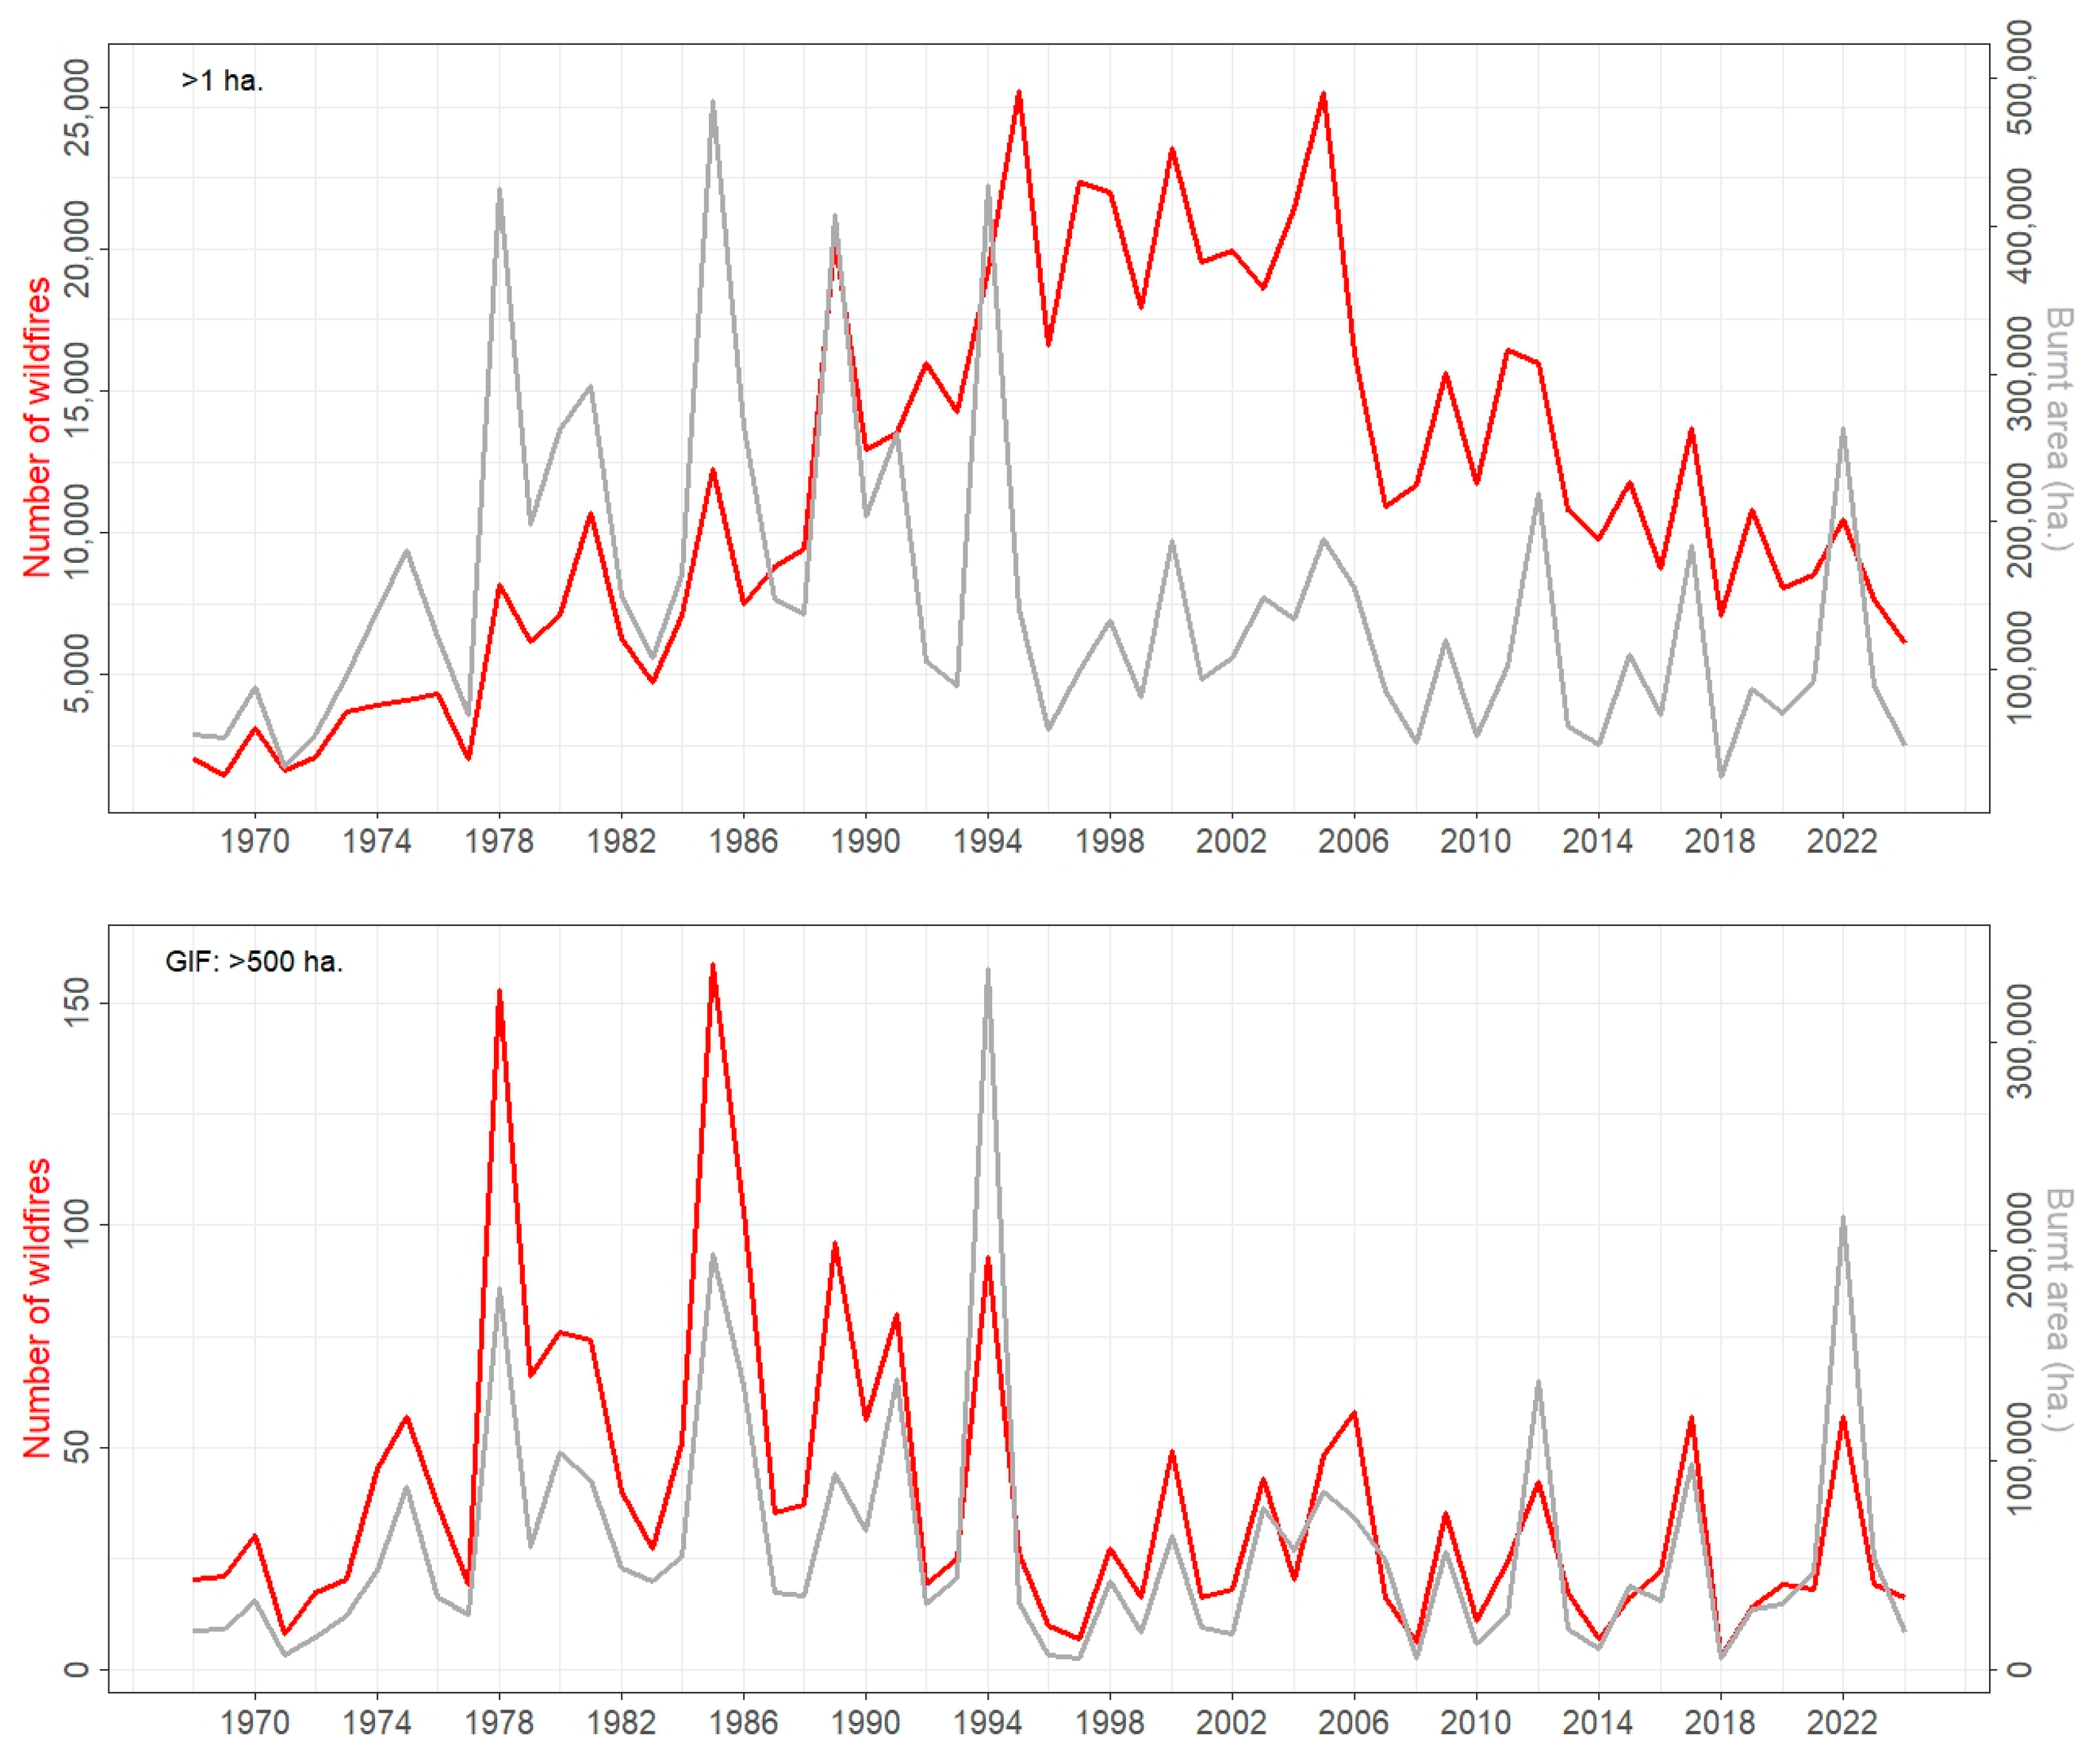
Figure 8.
View from the village of Argelita where the fire broke out on 12/09/1993, with the distinctive skyline of the “Peñas negras” as a reference point: (a) Photo from 1993, immediately after the fire; (b) Photo from 2025, 32 years later. Source: (a) Ms Bienvenida Garcés Fortanet; (b) Mr Enrique Montón Chiva.
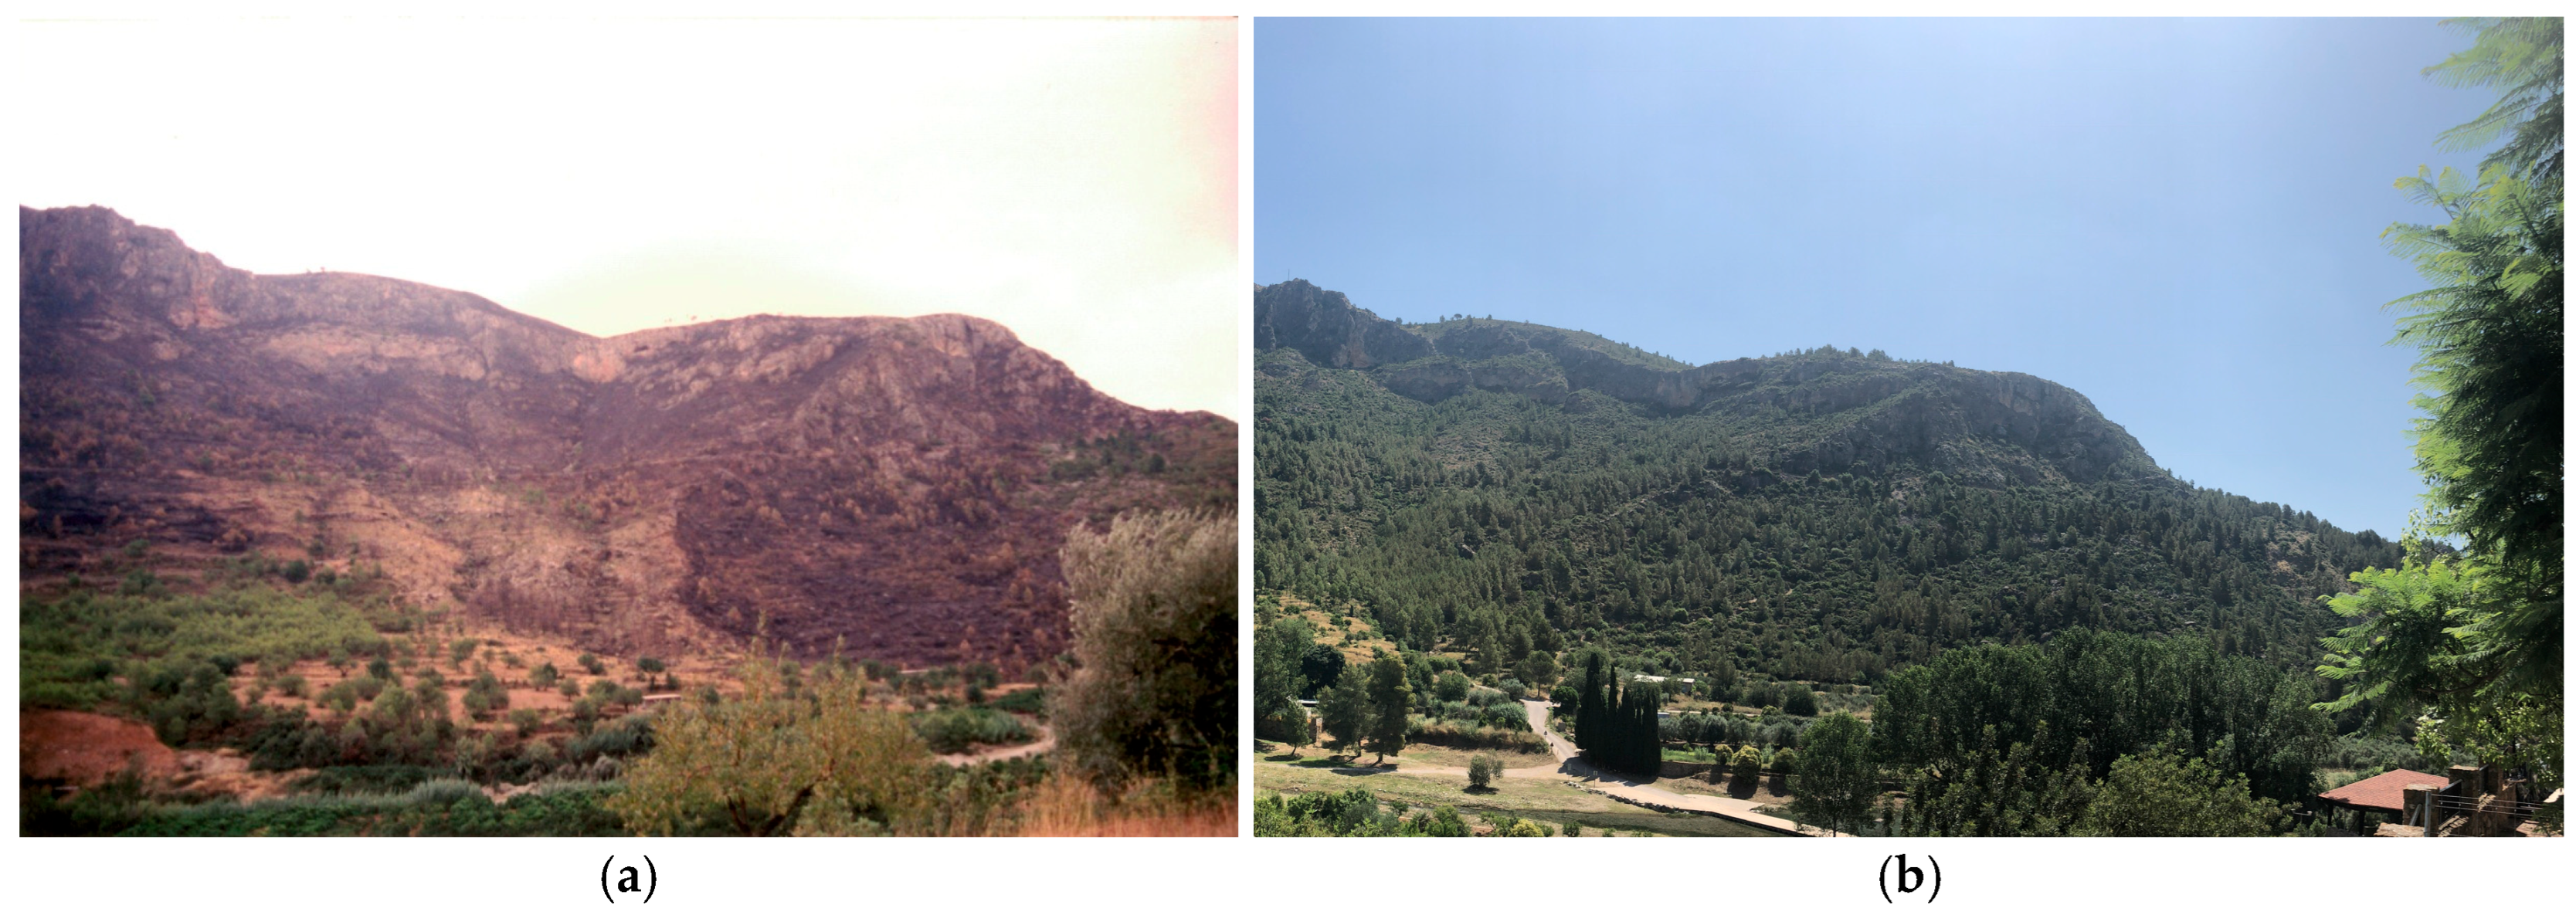
Figure 9.
View from the CV-193 road between Lucena del Cid and Argelita where the fire broke out on 12/09/1993, with the landmark known as “Roca Alta” as a reference point: (a) Photo from 1993, immediately after the fire; (b) Photo from 2025, 32 years later. Source: (a), Ms Bienvenida Garcés Fortanet; (b), Mr Enrique Montón Chiva.
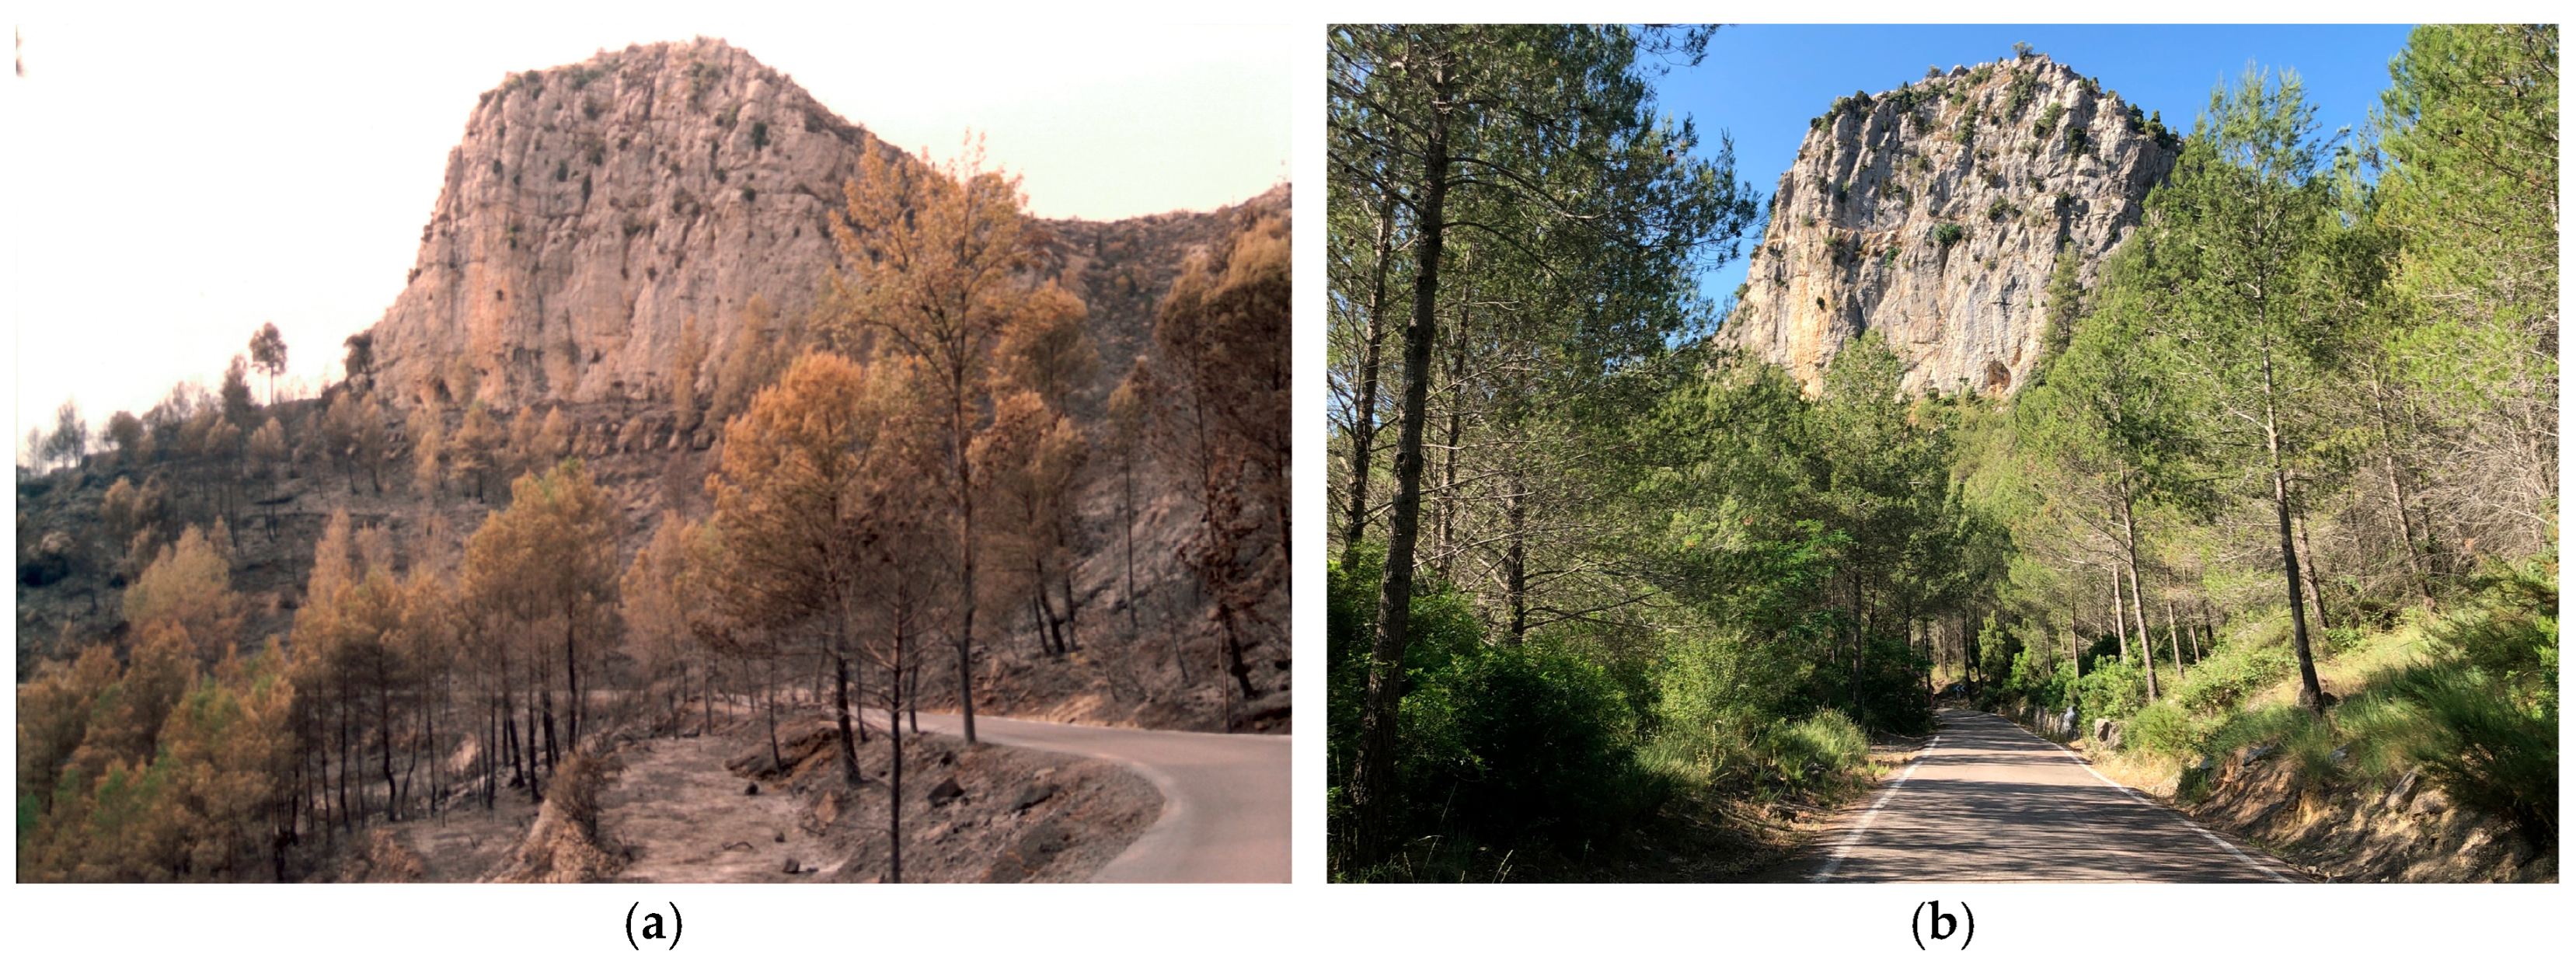
Figure 10.
View during regeneration work in 2011 in Fuentes de Ayodar, a village hit by the Espadilla wildfire on 2 July 1994. Source: Mr Adrián Casado de Madariaga.
Figure 10.
View during regeneration work in 2011 in Fuentes de Ayodar, a village hit by the Espadilla wildfire on 2 July 1994. Source: Mr Adrián Casado de Madariaga.
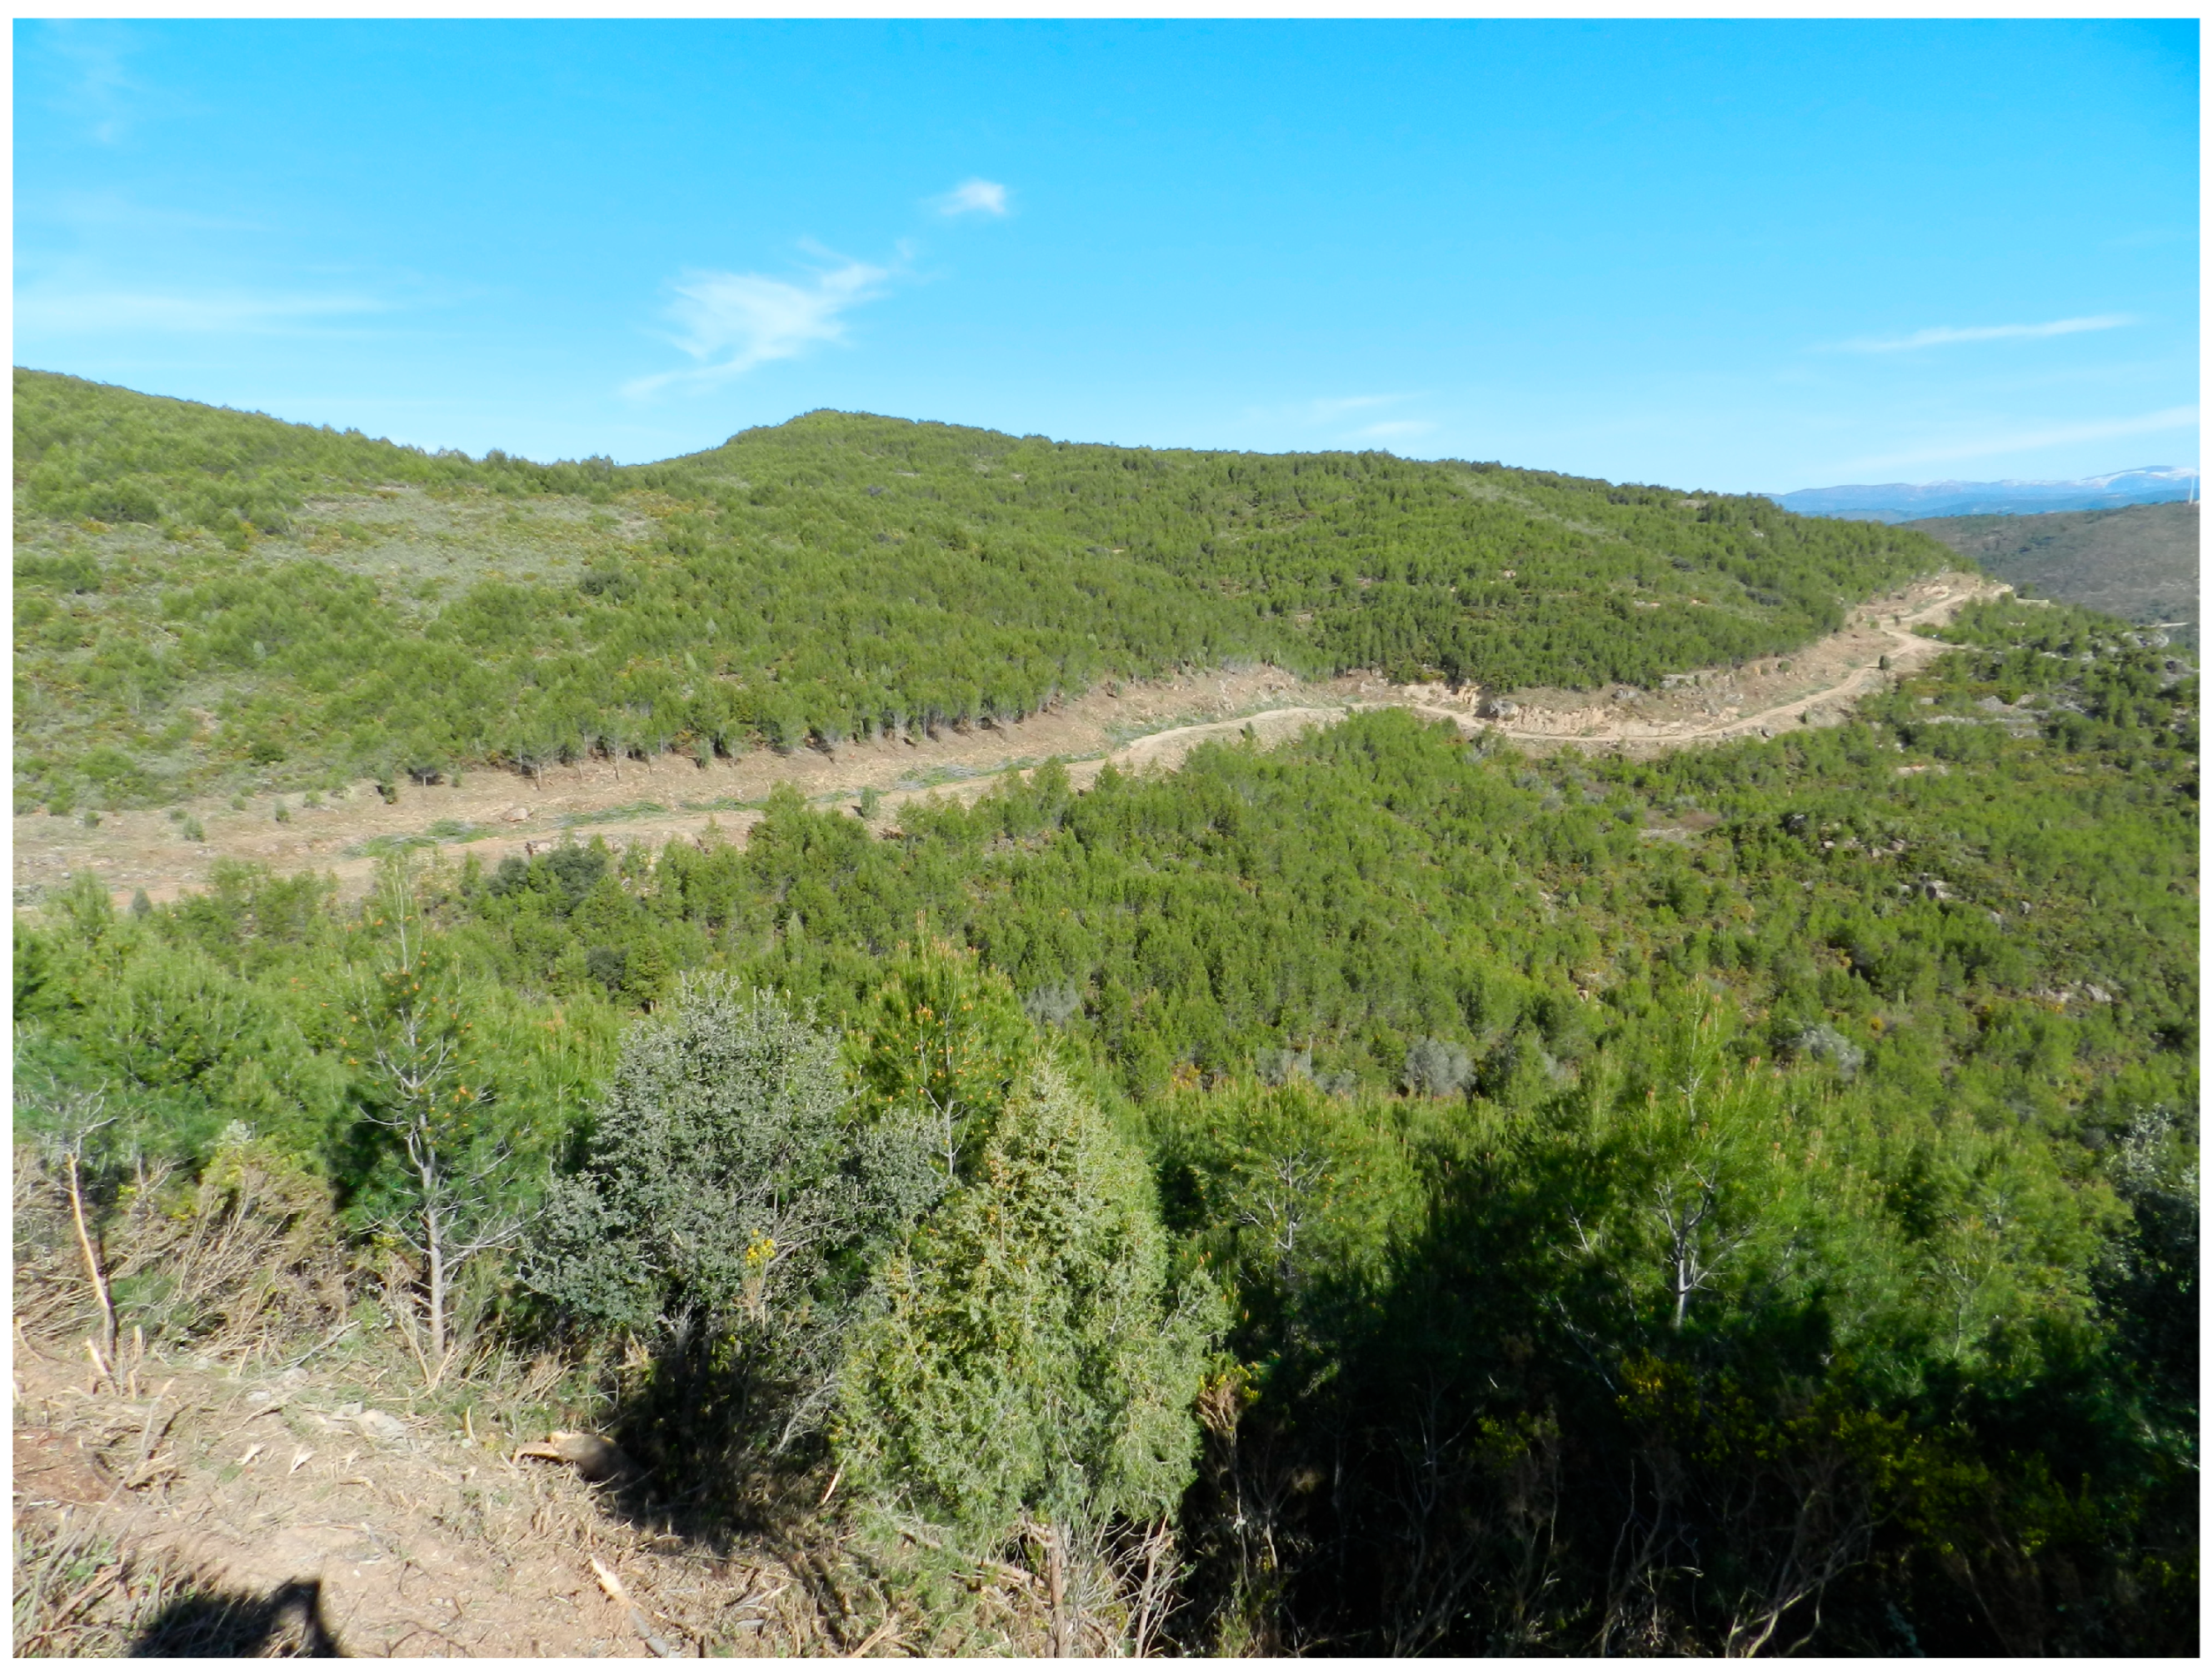
Figure 11.
Views of the village of Bejis where the fire broke out on 15/08/2022 from the Las Ventas viewpoint on the CV-235 road. In addition to Bejis, the distinctive shape of the “Peña Escabia” rock formation stands out in all three photos as a reference: (a) Photo from 2021, before the fire; (b) Photo from 2022, immediately after the fire; (c) Photo from 2025, three years after the fire. Source: (a) and (b) Mr José Manuel Mon Dols; (c) Mr Enrique Montón Chiva.
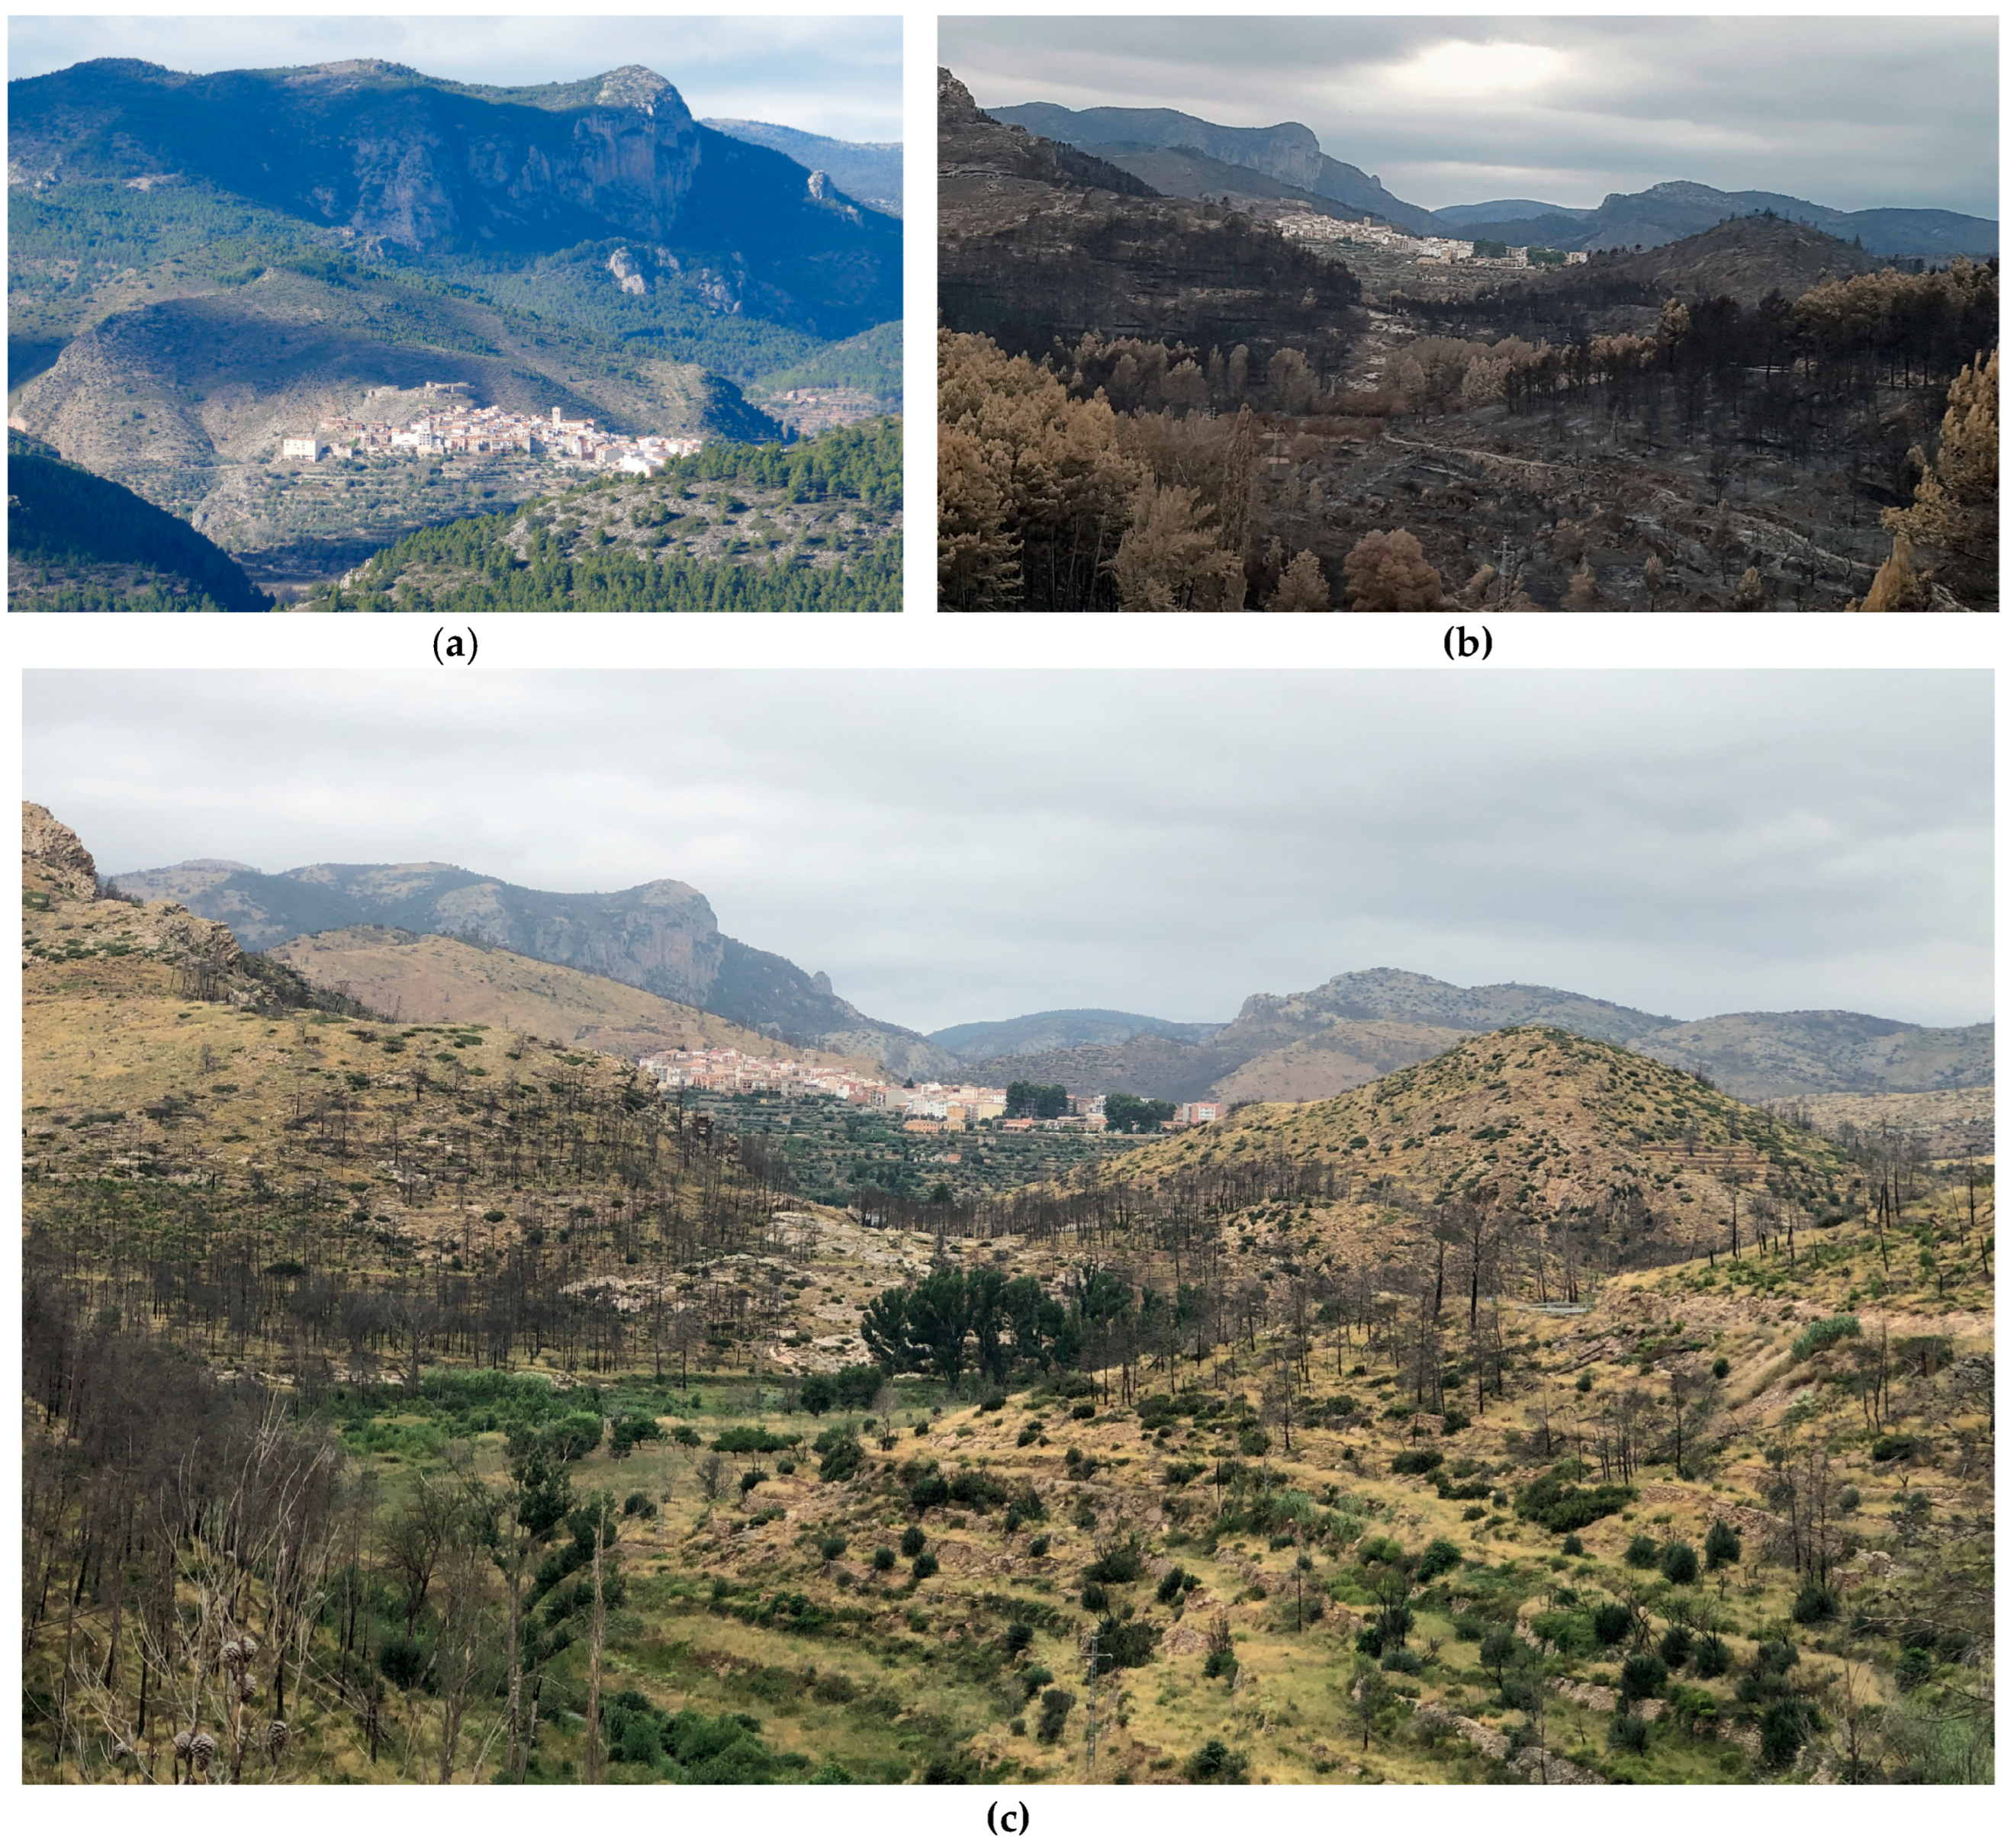
Figure 12.
Pictures of the area damaged by the Bejis fire on 15/08/2022: (a) Photo from 2025, three years after the fire near Bejis, with pine trees growing; (b) Trunk cut at the same spot. Source: Mr Enrique Montón Chiva.
Figure 12.
Pictures of the area damaged by the Bejis fire on 15/08/2022: (a) Photo from 2025, three years after the fire near Bejis, with pine trees growing; (b) Trunk cut at the same spot. Source: Mr Enrique Montón Chiva.
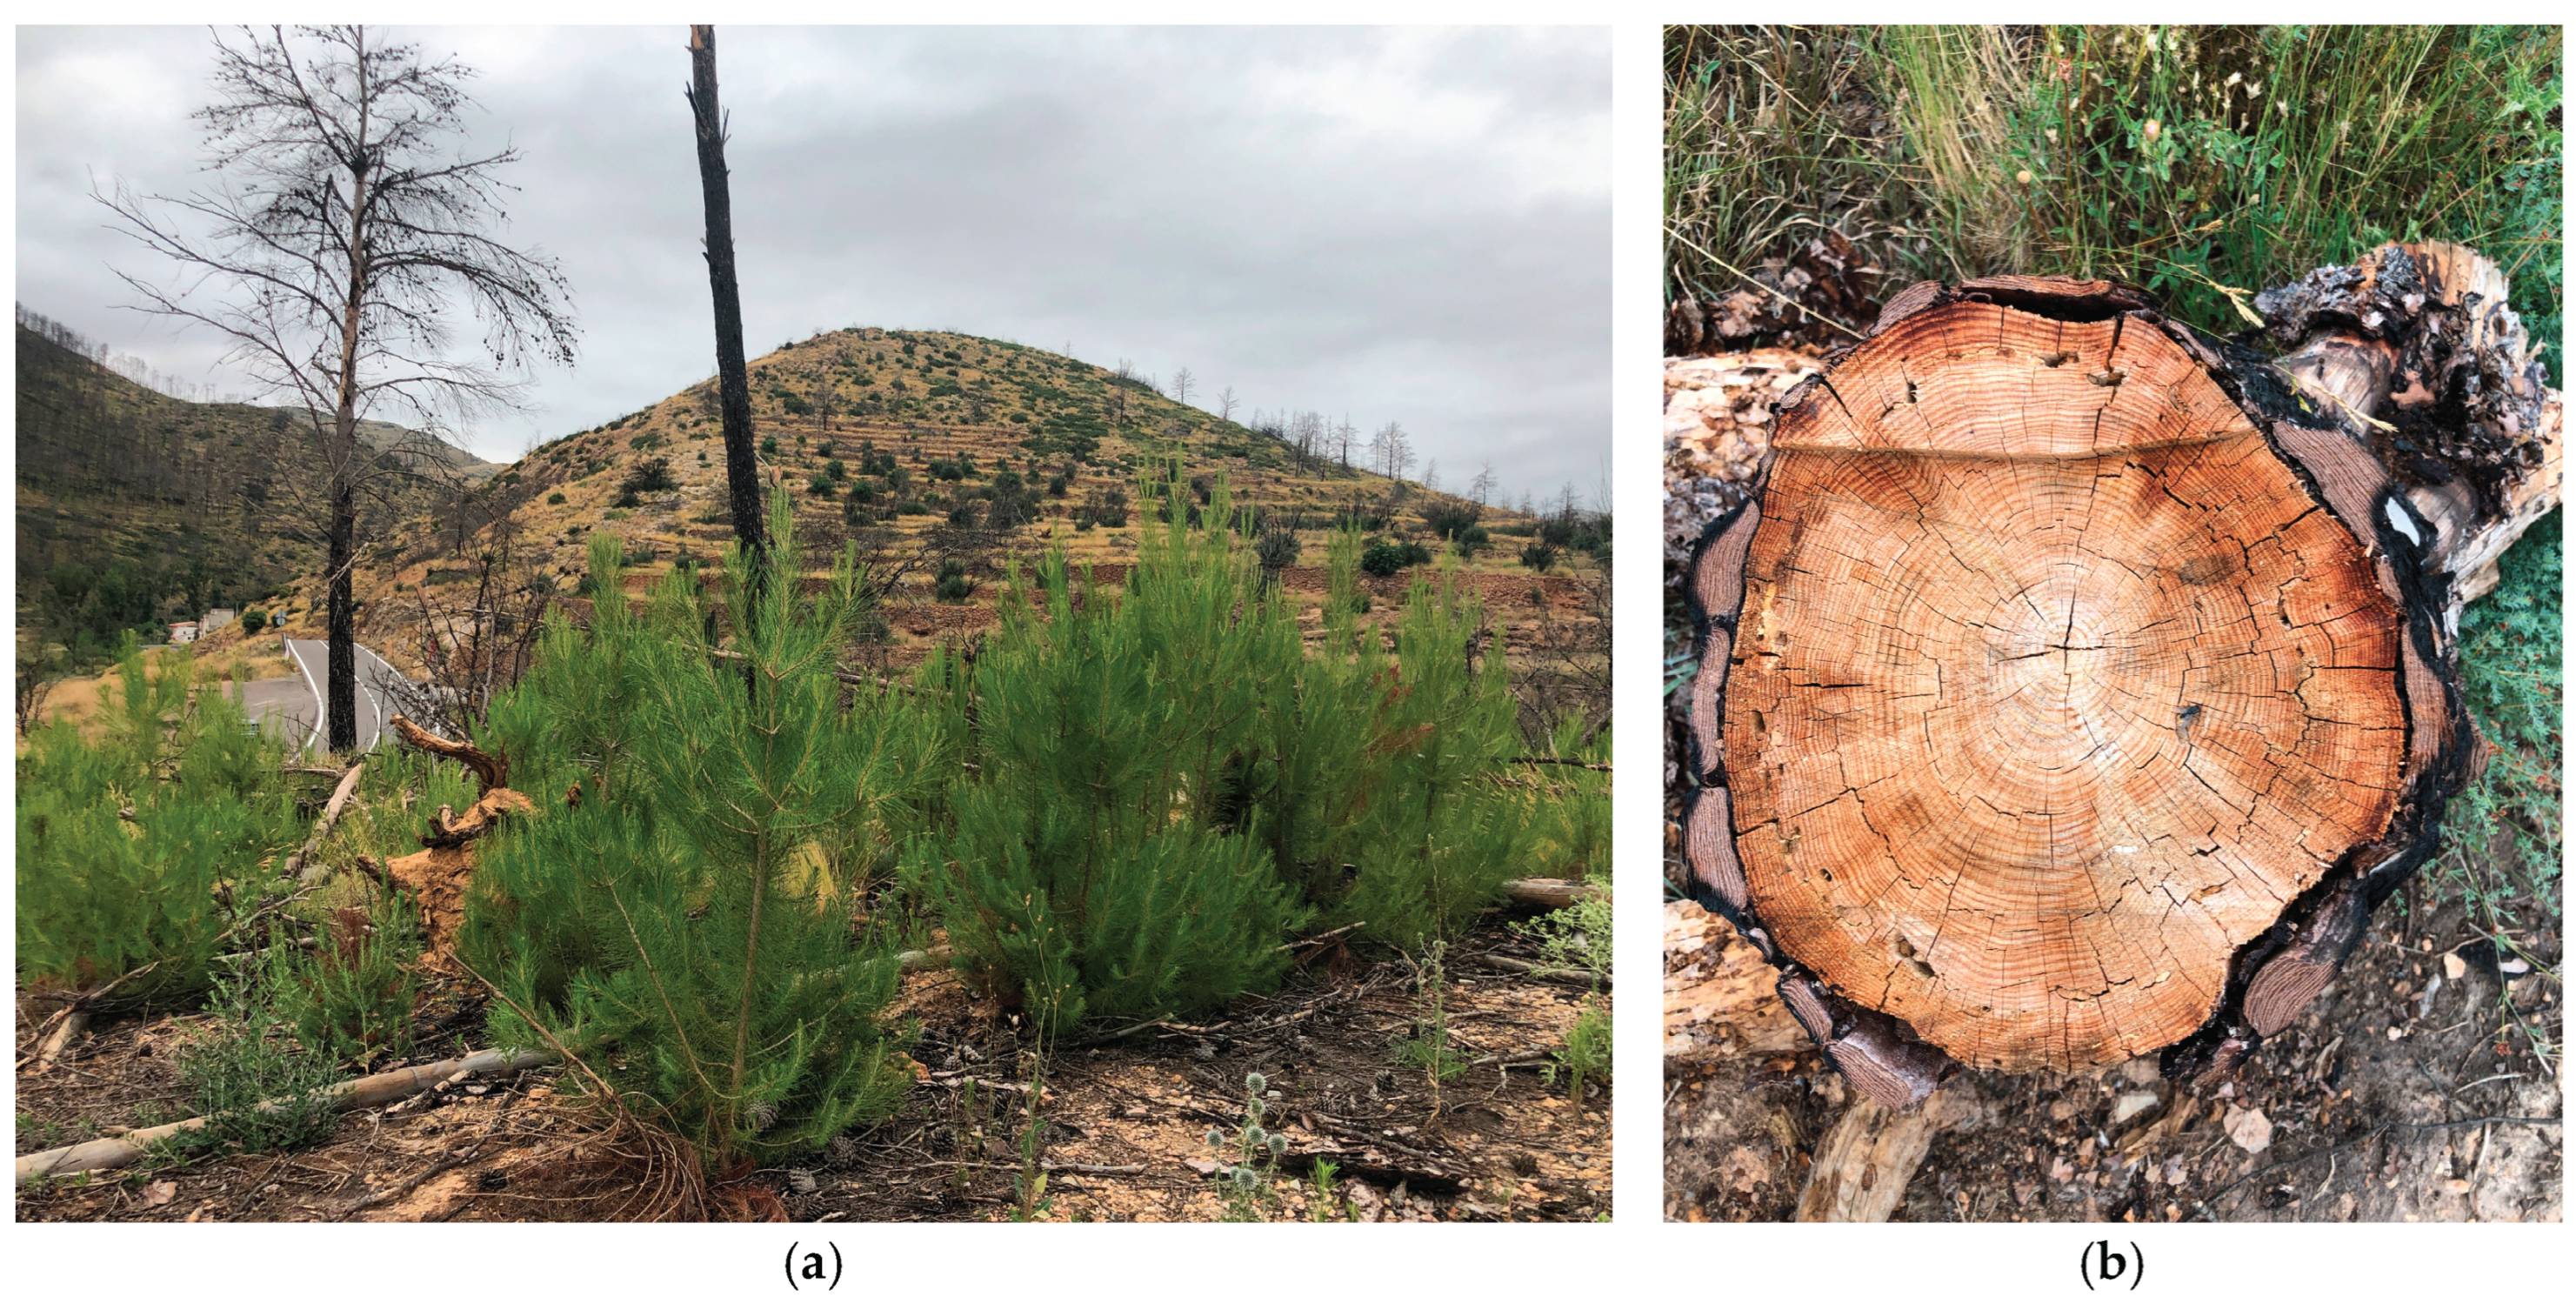
Figure 13.
Sequence of Google Earth images of the area affected by the Artana wildfire which broke out on 25 July 2016: (a) General view on 18 July 2015, before the fire; (b) Detailed view of the bottom right corner on the same date, before the fire; (c) General view on 16 November 2016, after the fire; (d) Detailed view of the bottom right corner on the same date, after the fire; (e) General view on 27 February 2022, over 5 years after the fire; (f) Detailed view of the bottom right corner on the same date, over 5 years after the fire. Source: Google Earth [105,106,107,108,109,110].
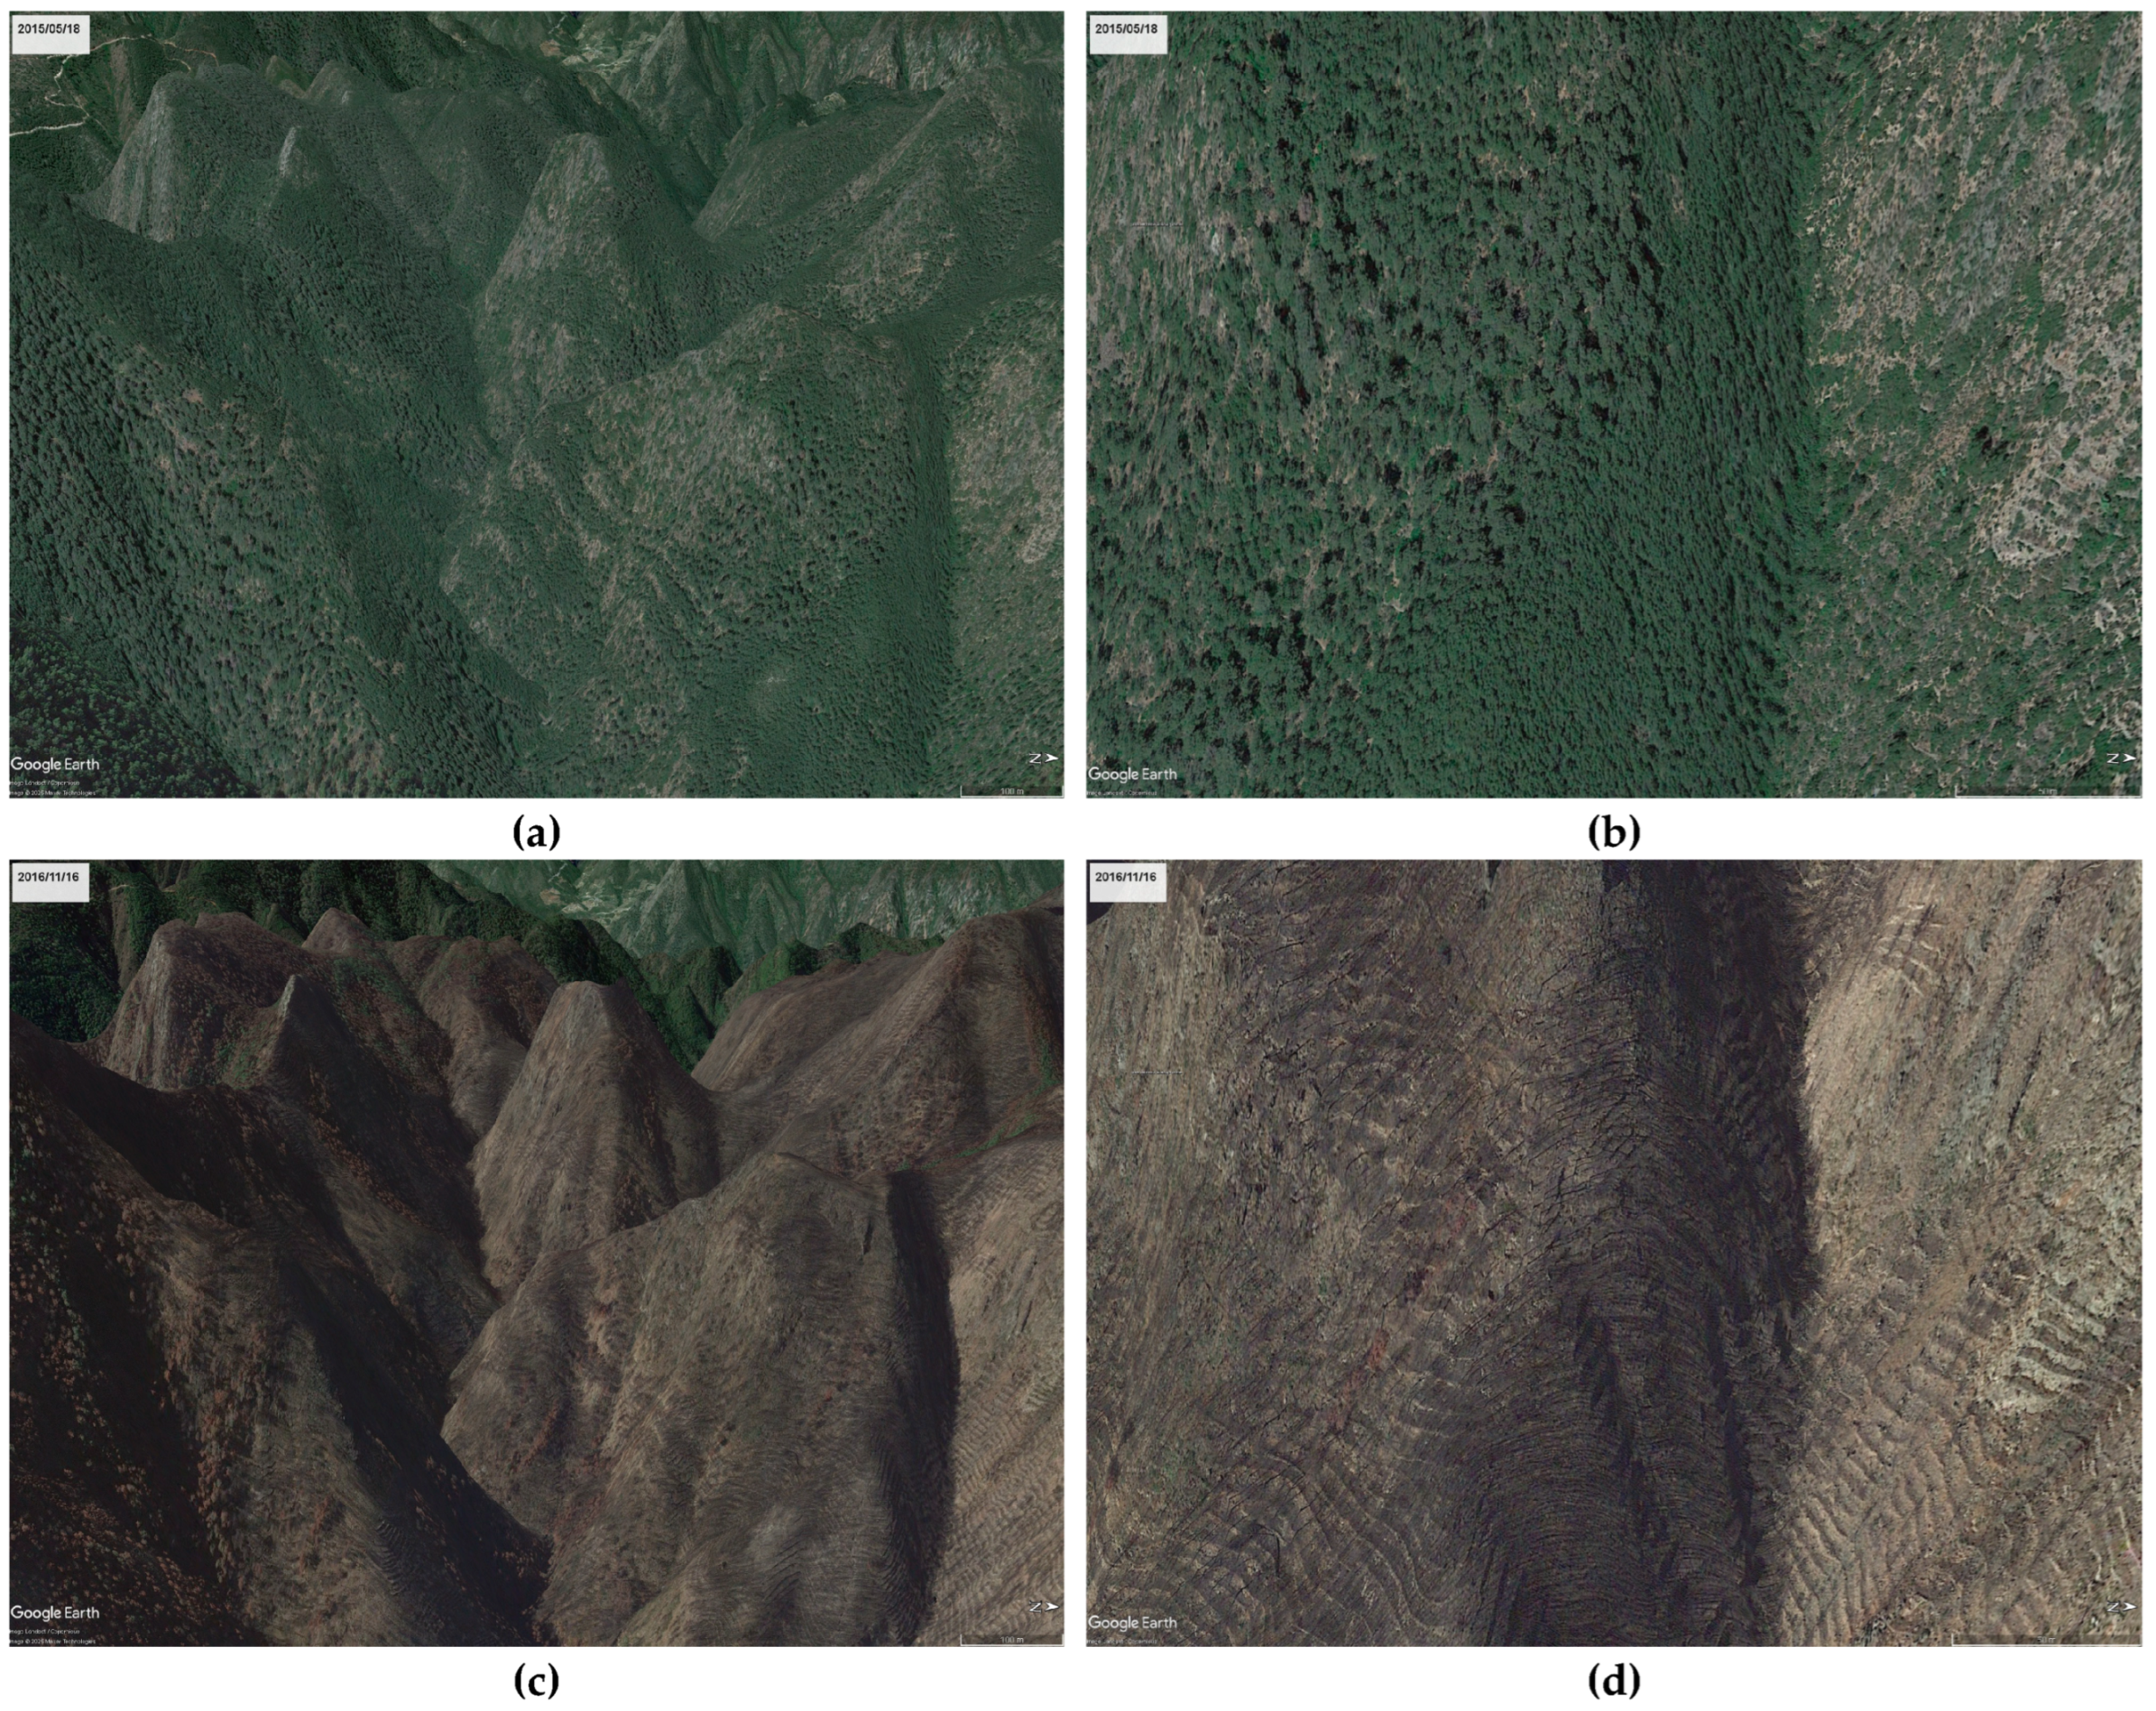
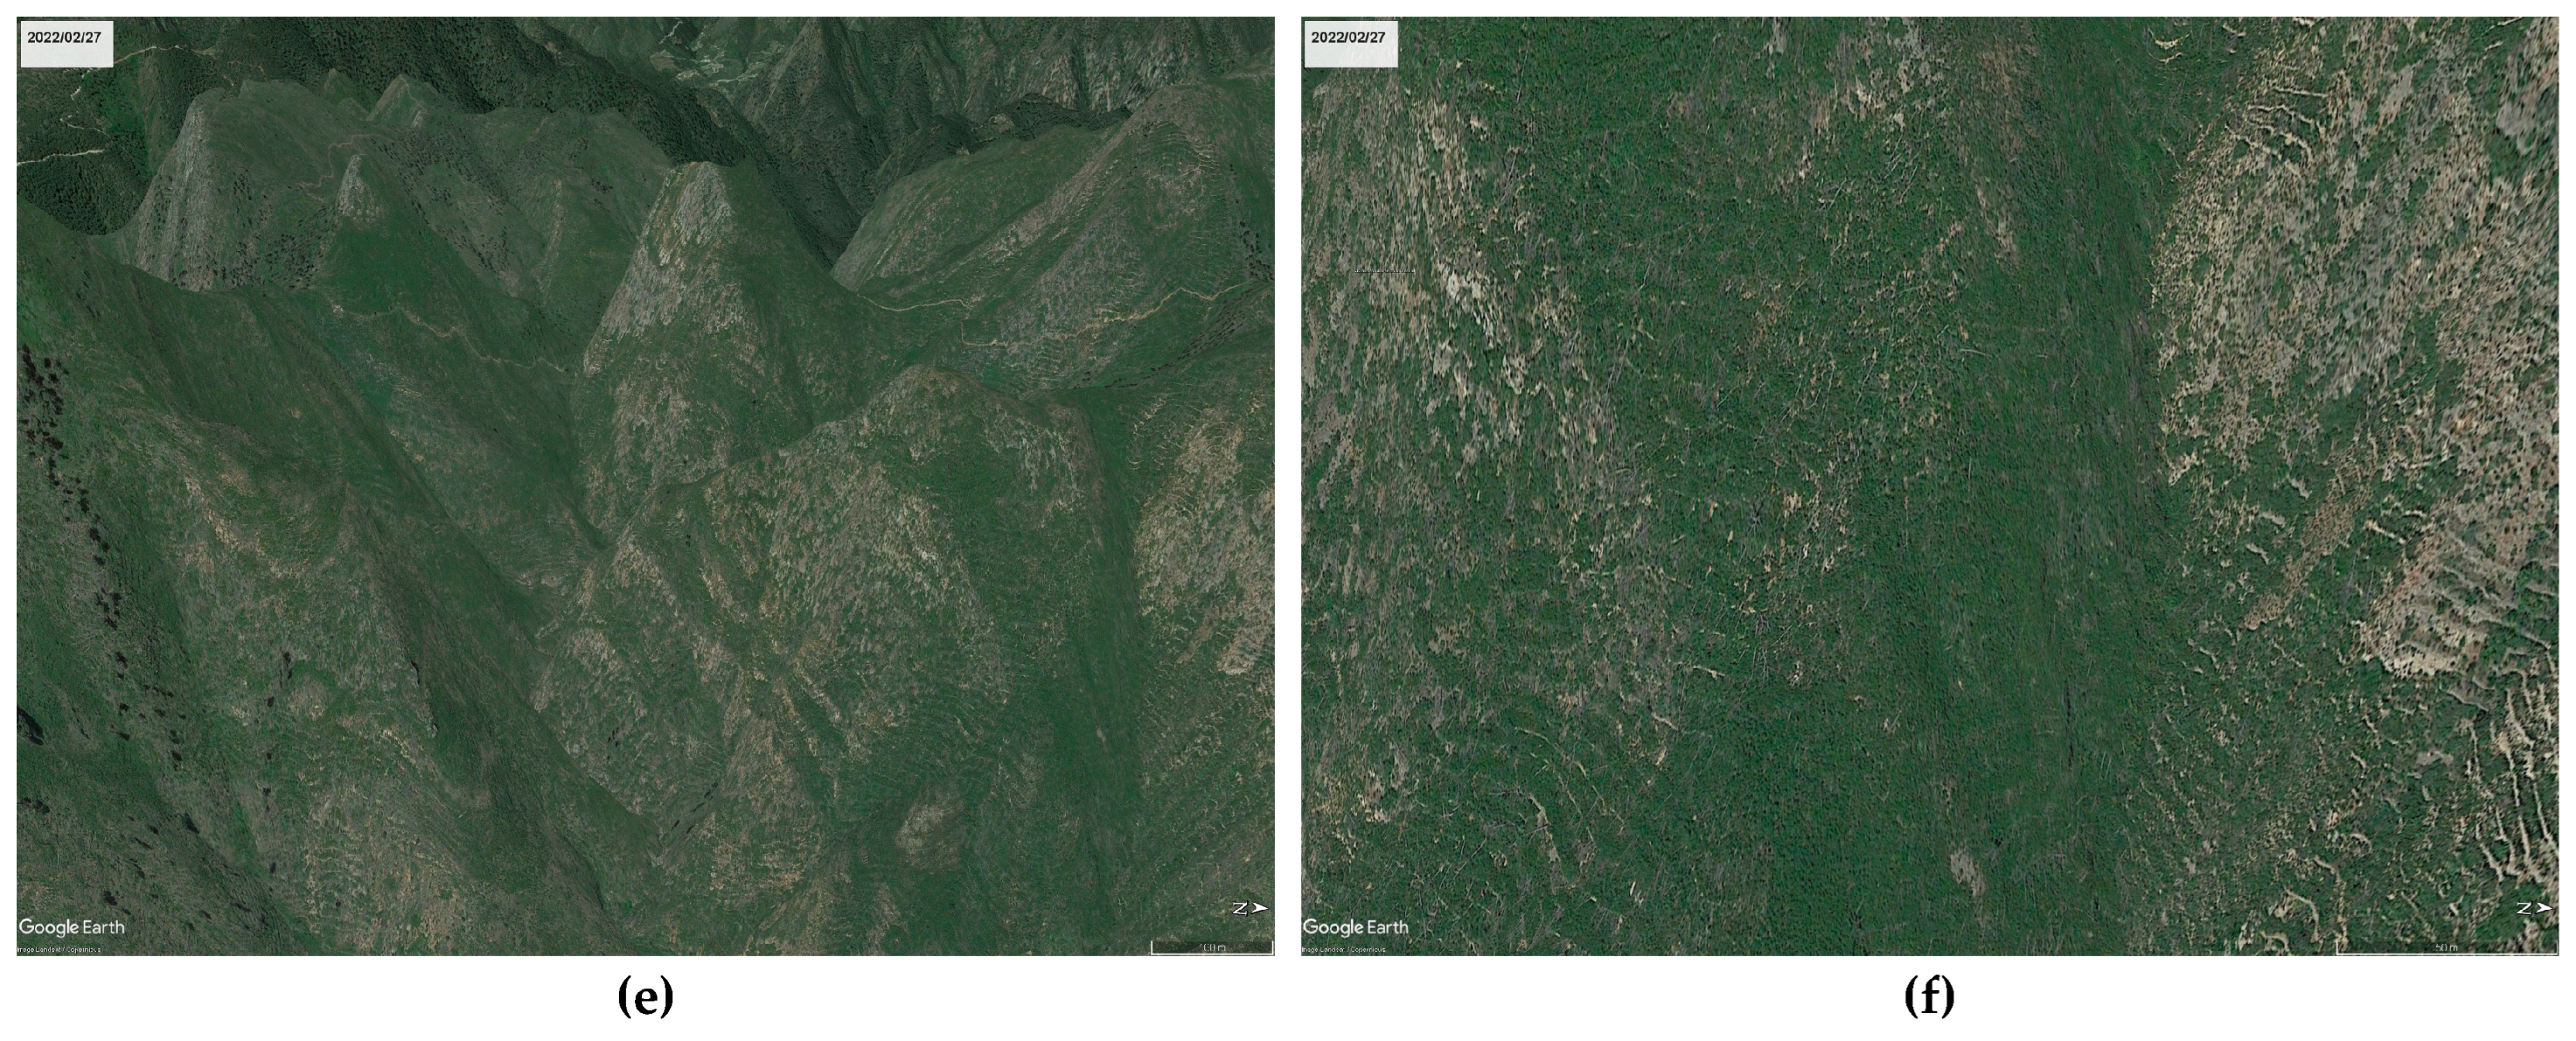

Table 1.
Wildfires affecting over 500 hectares in Castellon province since 1990.
| Date | Start municipality | Total area (ha.) | Cause |
|---|---|---|---|
| 1991/08/08 | Coves de Vinromà | 600 | Rubbish burning |
| 1992/08/30 | Altura | 3,310 | Unknown |
| 1992/08/31 | Azuébar | 1,042 | Stubble burning |
| 1992/12/08 | Castellón | 1,634 | Bonfires |
| 1993/08/07 | El Toro | 2,135 | Unknown |
| 1993/09/12 | Argelita | 4,896 | Bonfires |
| 1993/09/13 | Sant Mateu | 3,520 | Stubble burning |
| 1994/04/02 | Castillo de Villamalefa | 7,120 | Bonfires |
| 1994/04/09 | Borriol | 1,113 | Bonfires |
| 1994/07/01 | Olocau del Rey1 | 11,381 | Lightning |
| 1994/07/02 | Espadilla | 19,310 | Lightning |
| 1994/08/10 | Altura | 3,220 | Unknown |
| 1994/08/26 | Salsadella | 2,800 | Unknown |
| 1994/09/08 | Toga | 778 | Intentional |
| 1999/04/07 | Cabanes | 742 | Intentional |
| 2001/08/29 | Chert | 3,200 | Lightning |
| 2007/03/07 | Gaibiel | 1,045 | Lightning |
| 2007/08/28 | Useras | 5,775 | Railway2 |
| 2009/07/23 | Segorbe | 832 | Lightning |
| 2012/06/29 | Andilla1 | 23,273 | Negligence |
| 2016/07/25 | Artana | 1,487 | Lightning |
| 2017/12/29 | Culla | 535 | Negligence |
| 2022/08/14 | Costur | 728 | Other causes |
| 2022/08/15 | Bejís | 16,824 | Lightning |
| 2023/03/23 | Villanueva de Viver | 3,381 | Other causes |
1 The Olocau and Andilla wildfires do not appear in the Valencian Regional Government's database as they started outside Castellon province. The Olocau wildfire started in Teruel province whilst the Andilla wildfire started in Valencia province. 2 Although beyond the scope of the study, the cause of the wildfire in Useras, known as the l'Alcalaten wildfire because of the comarca it was in, was not rail-related as there is no railway track in this area. The cause was maintenance work on the electricity grid [67]. Source: Valencian Regional Government [35] and Government of Spain [37,38] wildfire databases.
Table 2.
R software packages used in the study.
| Package | Tasks |
|---|---|
| Terra | Reading raster data |
| geodata | Administrative boundaries |
| Gpkg | Reading CORINE data |
| Sf | Spatial data processing |
| Utils | Reading csv files |
| data.table | Linking CORINE layers with categories |
| Dlookr | Outlier imputation |
| imputeTS | Missing data imputation |
| tidyverse | Data processing, results by areas and comparative tables |
| tidygeocoder | Retrieving geographical coordinates |
| ggplot2 | Graphic visualisation |
| basemapR | Base maps |
| grDevices | Saving graphs and maps |
| patchwork | Image compositions |
Table 3.
Geographical coordinates of the study area.
| Coordinates | Data |
|---|---|
| Maximum latitude | 41.0 oN |
| Minimum latitude | 39.6 oN |
| Maximum longitude | 0.7 oE |
| Maximum longitude | 1.0 oW |
Table 4.
NDVI and NBR decline after a wildfire and five-year recovery by total burned area.
| Date | Start municipality | LULC1 | dNDVI2 | %rec NDVI+53 |
dNBR4 | %rec NBR+55 |
|---|---|---|---|---|---|---|
| 1991/08/08 | Coves de Vinromà | 1.70 | 0.103 | 96.3 | 0.170 | 69.0 |
| 1992/08/30 | Altura | 13.70 | 0.212 | 76.7 | 0.129 | 57.9 |
| 1992/08/31 | Azuébar | 7.73 | 0.143 | 89.0 | 0.093 | 69.1 |
| 1992/12/08 | Castellón | 7.83 | 0.144 | 95.9 | 0.169 | 74.7 |
| 1993/08/07 | El Toro | 29.67 | 0.208 | 77.6 | 0.171 | 79.0 |
| 1993/09/12 | Argelita | 11.75 | 0.158 | 79.5 | 0.155 | 52.7 |
| 1993/09/13 | Sant Mateu | 8.61 | 0.140 | 84.3 | 0.117 | 68.1 |
| 1994/04/02 | Castillo de Villamalefa | 43.49 | 0.157 | 87.5 | 0.141 | 55.2 |
| 1994/04/09 | Borriol | 0.76 | 0.131 | 85.0 | 0.183 | 32.8 |
| 1994/07/01 | Olocau del Rey | 44.45 | 0.172 | 78.7 | 0.149 | 51.3 |
| 1994/07/02 | Espadilla | 41.54 | 0.185 | 94.9 | 0.209 | 70.3 |
| 1994/08/10 | Altura | 22.28 | 0.181 | 80.3 | 0.160 | 38.4 |
| 1994/08/26 | Salsadella | 3.90 | 0.143 | 96.2 | 0.188 | 102.0 |
| 1994/09/08 | Toga | 45.52 | 0.183 | 88.1 | 0.233 | 45.4 |
| 1999/04/07 | Cabanes | 0.89 | 0.120 | 102.0 | 0.142 | 101.7 |
| 2001/08/29 | Chert | 29.60 | 0.160 | 87.1 | 0.149 | 78.7 |
| 2007/03/07 | Gaibiel | 8.71 | 0.134 | 88.3 | 0.080 | 59.8 |
| 2007/08/28 | Useras | 2.69 | 0.148 | 85.1 | 0.195 | 58.2 |
| 2009/07/23 | Segorbe | 17.32 | 0.113 | 85.1 | 0.171 | 55.6 |
| 2012/06/29 | Andilla | 30.62 | 0.183 | 86.4 | 0.208 | 75.6 |
| 2016/07/25 | Artana | 70.30 | 0.265 | 94.3 | 0.227 | 86.8 |
| 2017/12/29 | Culla | 0.96 | 0.177 | 82.8 | 0.190 | 69.3 |
| 2022/08/14 | Costur | 11.77 | 0.169 | -----6 | 0.228 | -----6 |
| 2022/08/15 | Bejís | 42.48 | 0.211 | -----6 | 0.163 | -----6 |
| 2023/03/23 | Villanueva de Viver | 58.36 | 0.214 | -----6 | 0.165 | -----6 |
1LULC indicator: the whole number indicates the percentage of forests whilst the decimal part indicates the areas of scrub and/or herbaceous vegetation associations. 2Difference in NDVI between the average values prior to the wildfire and the minimum annual value afterwards. 3Percentage NDVI recovery in the fifth year after the fire. 4Difference in NBR before and after the fire. 5Percentage NBR recovery in the fifth year after the fire. 6Less than five years from the fire. Source: Valencian Regional Government [35] and Spanish Government [37,38] wildfire databases.
Disclaimer/Publisher’s Note: The statements, opinions and data contained in all publications are solely those of the individual author(s) and contributor(s) and not of MDPI and/or the editor(s). MDPI and/or the editor(s) disclaim responsibility for any injury to people or property resulting from any ideas, methods, instructions or products referred to in the content. |
© 2025 by the authors. Licensee MDPI, Basel, Switzerland. This article is an open access article distributed under the terms and conditions of the Creative Commons Attribution (CC BY) license (http://creativecommons.org/licenses/by/4.0/).
Copyright: This open access article is published under a Creative Commons CC BY 4.0 license, which permit the free download, distribution, and reuse, provided that the author and preprint are cited in any reuse.


