Submitted:
21 October 2024
Posted:
21 October 2024
You are already at the latest version
Abstract
Karst areas are one of the world's major ecological fragile zones, are prone to influences from human activities and climate change. Although the vegetation cover in karst area of southwest China increased significantly in recent decades, there are obvious spatial differences in vegetation greening. To better elevate the relative importance of the anthropogenic factors and climatic factors to the vegetation greening, and explore the factors leading to the spatial heterogeneity of vegetation greening in karst desertification area where vegetation was seriously degraded, linear regression analysis, correlation analysis and residual analysis were used to evaluate the contribution of anthropic factors and climatic factors to the growth of normalized difference vegetation index (NDVI) from 1998 to 2020, and revealed the correlations between natural factors (proportion of karst areas, elevation and landscape pattern) anthropic factors (change in land use, population density and gross domestic product), climatic factors (annual temperature and annual precipitation) and the spatial-temporal variation of county NDVI in the paper. The results showed that (1) generally, the NDVI value increased by 23.59% from 1998 to 2020 in total area, and the anthropic factor dominated the process of vegetation greening (87.02%). The rapid increase of vegetation coverage occurred from 2011 to 2020, which was jointly promoted by the urbanization, economic development, increasing mean temperature and precipitation, and climate change were the main contributor (67.65%). (2) there were significant spatial heterogeneity in the NDVI, which was mainly caused by the site conditions (e.g. the proportion of karst area, landscapes pattern, mean annual temperature and precipitation) and anthropic factors (e.g. the proportion of construction land, population density and gross domestic product); the county NDVI value was negatively correlated with the proportion of karst area, cropland, grassland and construction land, population density, and gross domestic product, while it was positively correlated with the proportion of woodland, mean annual temperature and mean annual precipitation. (3) Generally, vegetation greening was faster in regions with warm and humid climate or more forestland, and lower in regions with higher average elevation and economic growth. Nevertheless, the effects of environmental factors on the vegetation greening rate varied in the different periods. The land cover pattern, population density, GDP in 2000, and the rate of urbanization and economic growth influenced vegetation growth from 2000 to 2010, while the impact of mean annual temperature and mean annual precipitation became more pronounced since 2010. The results of this study contributed to understand the importance of anthropic factors and climatic factors that affect veg-etation greening in karst rocky desertification areas in different periods, which provided deci-sion-making basis for land managers.
Keywords:
karst rocky desertification area
; normalized difference vegetation index
; anthropic factors
; climate factors
; Southwest China
1. Introduction
Vegetation is a vital component of the biosphere and plays an important role in regulating the Earth's climate and providing ecosystem services, and the reliable detection and attribution of changes in vegetation growth is a prerequisite for developing strategies for sustainable management of ecosystems [1]. Satellites have been widely used to monitor and evaluate global and regional vegetation growth, such as the normalized difference vegetation index (NDVI), which reflects the vegetation coverage by calculating the ratio of reflectance between infrared band and visible band [2,3,4]. Satellites data show that the global vegetation index is increasing [5,6], especially in China and India [7]. CO2 fertilization, nitrogen deposition, climate change, and land management are the main drivers of earth greening [5,6]. However, the dominant driver of remain controversial in different areas, for example in China, one of the most significant area of greening, vegetation greening was deemed to be mainly attributed to the "China model", which refers to a series of ecological projects to protect and expand forests [7,8]. Thus, to deepen the understanding of the driving mechanism of vegetation greening, it is essential to evaluate the relationship between direct human activities, indirect drivers such as climate change.
Over the past two decades, one of the largest global increases in vegetation cover occurred in southwest China [8,9], which is one of the three karst concentrated contiguous regions in the world. In southwest China, the seven provinces including Yunnan, Guizhou, Guangdong, Chongqing, Hunan, Hubei and Sichuan, and Guangxi Zhuang Autonomous region have about 0. 51 million km2 of outcropped carbonate rock area, accounting for 25.9% of the total land area of this area [10]. Karst areas were characterized with shortage of soil resources, strong development of karst fissures, complex and hidden soil erosion process, lack of surface water resources, poor continuity of the soil distribution, and slow vegetation growth [10]. The southwest karst area has low environmental capacity, slow vegetation growth and poor self-recovery ability, and is easily affected by environmental changes [11]. Due to excessive human activities in the 20th century, the vegetation degenerates rapidly and presents a serious rocky desertification in the karst area of Yunnan, Guizhou and Guangxi, in southwest China [10,12]. To improve ecological conditions, since 2000, national and local Chinese governments have implemented ecological projects such as returning farmland to forest (grass) project, natural forest protection project, and karst rocky desertification control project, which was deemed to be the crucial driver of the rocky desertification area reduction and rapid vegetation greening [13,14,15]. However, a few studies found that the NDVI in karst regions had strong correlation with climate factor, especially the mean annual temperature [16]. In recent years, correlation analysis and residual trend method have been widely used to reveal and quantify the relative importance of climate change and human activities on vegetation greening [11,17,18]. And the perspective that the vegetation greening was a joint result of ecological projects and climate change were widely accepted, but contribution of ecological projects and climate factors to the greening of vegetation remains controversial [15,18,19].
Moreover, due to the effectiveness of ecological projects and climate change on is also influenced by local natural factors, such as geological settings, topography, soil properties, population density, economic development, land cover pattern and land management [20,21], the vegetation greening had the high spatiotemporal inhomogeneity, which were rarely investigated [11,18,19]. Most of studies focused on single time scales analysis, which cannot comprehensively reveal the response of vegetation to environmental change, and may ignore some important information on other time scales. Multiple time scale analysis might facilitate a better understanding of the mechanisms of vegetation dynamics, and provide scientific knowledge on vegetation restoration and conservation in fragile ecosystems [22].
To better elevate the relative importance of anthropic activities and climate changes to vegetation greening at different periods, and explore the factors leading to the spatial heterogeneity of vegetation greening in karst area where vegetation was seriously degraded. In this study, based on the NDVI value, landscape pattern, population density, gross domestic product, and meteorology data (annual temperature and annual precipitation) from 1998 to 2020, we analyzed the characteristics of the NDVI and its relationship with natural factors (karst land proportion, average elevation, mean annual temperature and mean annual precipitation), anthropic factors (construction land proportion, population density and gross domestic product) and climate factors (changes in annual temperature and precipitation) in a typical rocky desertification area in southwest China. Our results will contribute to predict future changes of vegetation, and develop adaptation and alleviation strategies for climate changes and human activities in fragile ecosystem.
2. Materials and Methods
2.1. Study Area
The study area is located at the border of the Guangxi, Yunnan, and Guizhou provinces in southwest China, which includes 44 counties in Guizhou, 35 counties in Guangxi, and 12 counties in Yunnan. This region covers an area of 223,830 km2, most of which is in the southeast Yunnan-Guizhou Plateau and the transition zone to the Guangxi Basin. The topography has a higher elevation in the west and a lower elevation in the east. The average elevation is about 904.4 m, ranging from 79.5 to 2866.8 m (Figure 1). The climate of most of the area is a subtropical humid climate, with the average annual precipitation ranging from 858 to 1971 mm and the average annual temperature ranging from 12.9 to 22.6 °C (1991–2020). This region is one of the most typical karst regions in the world and about 48.7% of the total area is classified as a karst region (Figure 1). At the beginning of the 21st century, the area was the most serious rocky desertification area, was called "Yunnan, Guizhou and Guangxi rocky desertification Area" by National Development and Reform Commission of China. The region is also one of the poorest in southwest China, where economic and social development is undeveloped and the poverty is widespread and deep.
2.2. Data
Based on the SPOT/VEGETATION Normalized Difference Vegetation Index (NDVI) satellite remote sensing data, a quarterly NDVI dataset from 1998 to 2020 was generated by the Data Center for Resources and Environmental Sciences at the Chinese Academy of Sciences (RESDC; http://www.resdc.cn) on a monthly basis using the maximum synthesis method. To best reflect the vegetation coverage in the rocky desertification area and exclude the influence of seasonal cultivated crops on the vegetation coverage, the NDVI data of the fourth quarter (December to February) from 1998 to 2020 was selected as the research index. To reduce the differences between the adjacent years, the NDVI value was divided into four periods: from 1998 to 2000 (1998-2000), from 2001 to 2005 (2001-2005), from 2006 to 2010 (2006-2010), from 2011 to 2015 (2011-2015), and from 2016 to 2020 (2016-2020).
In this paper, the datasets of land use, population density (Population), gross domestic product (GDP) in 2000, 2005, 2010, 2015 and 2020 were downloaded from the Resource and Environmental Science and Data Center of the Chinese Academy of Sciences (RESDC, http://www.resdc.cn). The spatial resolution of NDVI value, GDP, population density and land use data is 1km. The land use data were derived from the interpretation of Landsat-TM/ETM remote sensing images, while the land use data for 2015 and 2020 were derived from the interpretation of Landsat 8 remote sensing images. China's land use data classification system uses a first-level classification system, which is mainly divided into cropland, woodland, grassland, water area, construction land, and unused land according to the land resources and their utilization. The unit of the population distribution data was people per square kilometer, and the unit of the GDP data was ten thousand CNY per square kilometer.. The mean annual temperature (MAT) and mean annual precipitation (MAP) data of 90 meteorological stations in the study area from 1998 to 2020 were obtained from the China Meteorological Network (http://data.cma.cn).
2.3. Data Analysis
2.3.1. Linear Regression Analysis
The temporal variation of NDVI value (from 1998 to 2020), and the relationships between anthropic factors (land cover pattern, population density, GDP), climatic factors (MAT and MAP) were analyzed by a linear regression and the slop of the temporal variation (β) was obtained. To figure out the relationship between anthropic factors, the relationships between the proportion of karst area, land cover pattern (proportion of woodland, grassland, cropland, and construction land), population density, GDP, MAT, MAP and the county NDVI value in five periods were calculated by a linear regression. The significance of the NDVI trend was examined by F test at a confidence level of 95% or 99%. p ≤ 0.05 or p ≤ 0.01 indicates a significant increase or decrease trend, while p>0.05 indicates a non-significant increase or decrease trend.
2.3.2. Correlation Analysis
The Pearson correlation coefficients (R) between the temporal variation of NDVI value and environmental variables were calculated in whole area and 90 counties respectively. Correlations with p ≤ 0.05 are considered to be significant. The correlations between NDVI and environmental variables were classified to three types: strong correlation (|R| ≥ 0.7), moderate correlation 0.4 ≤ |R|<0.7, and weak correlation (0.2 ≤ |R|<0.4). R>0 indicates a positive correlation, and R<0 indicates a negative correlation. The Pearson correlation coefficients between the county NDVI value, natural condition and environmental variable were calculated in five periods (from 2000 to 2005, from 2005 to 2010, from 2010 to 2015, from 2015 to 2020, and from 2000 to 2020). The correlations between variation of NDVI value and county environmental factors in five periods (from 2000 to 2005, from 2005 to 2010, from 2010 to 2015, from 2015 to 2020 and from 2000 to 2020) were calculated.
2.3.3. Residual Analysis
The residual analysis is based on a strong relationship exists between NDVI and climate factor (temperature and precipitation). If the influence of climate factors is excluded from the NDVI time series, the residual can be attributed to the influence of anthropic factors. The method has three steps.
First, we used a multiple linear regressions to establish the relationship between the NDVI and mean annual temperature (T) and precipitation (P), and the regression coefficients (a, b1 and b2) were used to obtain the predicted value of the NDVI (NDVIpre) by Eq. (1).
Then, the residuals between the observed annual NDVI value and predicted annual NDVI value (NDVIres) were calculated by Eq. (2), which represented the remaining observed NDVI value that were not explained by precipitation and temperature.
Finally, the contribution of climatic factor (Cclimatic) and anthropic factors (Canthropic) to the variation of NDVI value were defined by Eq. (3). βNDVI indicates the slop of observed annual NDVI value, βNDVIpre indicates the slop of NDVIpre, and the βNDVIres indicates the slop of NDVIres.
Origin 2018 software was used for linear regression analysis, and SPSS 22.0 software was used for correlation analysis and residual analysis. ARCGIS 17.0 and origin 2018 software were used for figures generation.
3. Results
3.1. Dynamics of the Normalized Difference Vegetation Index
Generally, the NDVI value showed an increasing trend in the study area (Figure 2). The mean NDVI value in 1998–2000, 2001–2005 and 2006–2010 was 0.55, 0.54 and 0.55 respectively, and there were not significantly differences between the three periods (Figure 3). The mean of the NDVI value increased significantly to 0.62 in 2011–2015, and continuously increased to 0.67 in 2016–2020, which were significantly more than that in 1998–2000, 2001–2005 and 2006–2010 (Figure 3). The mean of NDVI value in the karst area was significantly lower than that in the non-karst area during five periods (Figure 4). The NDVI value in the karst area increased by 23.51% over 23 years, while that in the non-karst area increased by 21.13% (Figure 3).
The areas with NDVI value greater than 0.7 indicated that the vegetation cover in these areas was high, and there was no karst rocky desertification. The type of land was 6308.18 km2 in 2000, accounting for 2.78% of the total area (Figure 4), which was mainly distributed sporadically in the non-karst areas of south-western, central and north-western part of the study area (Figure 2A). The proportion of this type of land decreased to 2.50% in 2005, and increased to 3.92% in 2010 (Figure 4). The spatial distribution of areas with high NDVI value in 2010 was roughly the same as in 2000 or 2005 (Figure 2C). In 2015, the proportion of land with high NDVI value sharply increased to 24.54%, and these areas spread to the central, east, northeast, and south. By 2020, the proportion of the area with high vegetation coverage increased to 44.11%, which was widely distributed in the most of the central and southern regions.
The areas with NDVI value between 0.5 and 0.7 indicated that the vegetation coverage in these areas was relatively high, and most of these areas belong to the mildly karst rocky desertification land. This type of area was 149615.20 km2 in 2000, accounting for 65.95% of the total area, which was mainly distributed in western, central and south-eastern part of the study area. From 2005 to 2010, the proportion decreased to 64.44% in 2005 and returned to 65.80% in 2010 (Figure 4), and the spatial distribution is roughly the same as in 2000. From 2015 to 2020, the proportion sharply decreased from 62.22% to 48.36% (Figure 4), and the spatial distribution extended from southeast to northwest (Figure 2D, Figure 2E).
The areas with NDVI value between 0.3 and 0.5 had low vegetation coverage, and most of these areas belong to moderate karst rocky desertification land. This type of land was 70522.12 km2 in 2000, accounting for 31.09% of the total area, which was mainly distributed in the north-western, western part, southern part of the karst area. From 2005 to 2010, the proportion decreased from 32.88% to 30.08% (Figure 4). From 2010 to 2020, the proportion sharply decreased to 13.13% in 2015 and 7.31% in 2020, and the distribution was narrowed to small parts of the west, northwest and north (Figure 2D, Figure 2E).
The areas with NDVI value less than 0.3 represent lower vegetation coverage, which belong to construction land, water area or severe karst rocky desertification land. From 2000 to 2010, the areas with an NDVI value less than 0.3 ranged from 419.50 km2 to 442.82 km2 (Figure 4), accounting for 0.18%-0.20% of the total area. Since 2010, the proportion area decreased sharply to 0.11% in 2015 and increased to 0.22% in 2020 (Figure 4), which mainly distributed sporadically in the northern, western and southern part of the study area (Figure 2A, Figure 2B, Figure 2C, Figure 2D, Figure 2E).
The NDVI value increased or unchanged (≥ 0.0) in 40.57% of the total area in 2005, while it increased to 54.61% in 2010. The area with increasing or unchanged NDVI value mainly distributed in the east, central and north, while the area with decreasing NDVI value mainly distributed in west and south (Figure 5A, Figure 5B). From 2000 to 2010, the areas with a significantly increasing NDVI value (≥ 0.1) accounted for 0.01% of the total area (Figure 5A, Figure 5B). In 2015, the NDVI value increased or unchanged (≥ 0.0) in 92.14% of the regions, and the areas with a significantly increasing NDVI value (≥ 0.1) accounted for 33.13% of the total area, which mainly distributed in south and southeast (Figure 5C). By 2020, the decreased NDVI value occurred only in 3.49% of the total area, which was mainly distributed sporadically in small parts of the western and northern. The areas with a significant increase in NDVI value (≥ 0.1) accounted for 67.48% of the total area, and the NDVI value increased by ≥ 0.2 in 9.34% of these areas, which mainly distributed in south and southeast (Figure 5D).
3.2.1. Variation in Land Cover
In 2000, the woodland, cropland, grassland, construction land, and water areas were 143710.95 km2, 43720.90 km2, 36810.54 km2, 1220.26 km2, and 1231.23 km2, respectively (Table 1), which accounted for 63.36%, 19.28%, 16.23%, 0.54% and 0.54% of the total land area, respectively. In 2005, the woodland, cropland, grassland, construction land, and water areas accounted for 64.61%, 18.70%, 15.59%, 0.53% and 0.52% of the total land area, respectively. In 2010, the woodland, cropland, grassland, construction land, and water areas accounted for 64.71%, 18.49%, 15.58%, 0.58%, and 0.59, respectively. In 2015, the woodland, cropland, grassland, construction land, and water areas accounted for 64.63%, 18.34%, 15.54%, 0.83% and 0.60% of the total land area, respectively. By 2020, the woodland, cropland, grassland, construction land, and water areas accounted for 63.57%, 18.82%, 15.99%, 0.91%, and 0.67, respectively. The area of woodland, construction land and the water increased by 0.32%, 69.26% and 22.88%, respectively. While the area of the cropland and grassland decreased by 2.35% and 1.50% respectively (Table 1). The area of woodland, cropland, and grassland accounted for more than 98% of the total area, which remained stable from 2000 to 2020. The area of the cropland, woodland, grassland, construction land, and water in karst area accounted for 66.71-72.58%, 48.81-50.68%, 66.96-70.14%, 63.33-73.53% and 50.87-56.72% of the same type of the land cover area, respectively (Table 1). From 2000 to 2020, the woodland in the karst area decreased by 1685.14, while the cropland and construction land and water areas increased by 1190.83 km2, 746.10 km2 and 130.60 km2, respectively (Table 1).
The NDVI value of the woodland was the highest, which ranged from 0.56 (2005) to 0.70 (2020). The NDVI values of the cropland and grassland were similar from 2000 to 2020, which ranging from 0.50 in 2005 to 0.61 (from 0.50 in 2000 to 0.63 in 2020, grassland) in 2020 (Table 2). During the same period, the NDVI values of the cropland, woodland, and grassland in the karst area were all lower than those in the non-karst area (Table 2). The difference of NDVI value in the woodland, cropland and grassland between the karst and non-karst areas was decreasing (Table 2). The contribution of the woodland to the total NDVI value ranged from 66.04 to 67.26%, and which was from 30.73% to 31.52% in karst area. The contribution of the woodland to the total NDVI value was significantly higher than that of cropland and grassland (Table 3). The contribution of cropland to the total NDVI value was slightly higher than that of the grassland. The contribution of cropland and grassland in the karst area to total NDVI value was higher than that in the non-karst area (Table 3).
3.2.2. Variation in Population Density, GDP, MAT and MAP
The population density of the study area was 127.25 km-2 in 2000, and it increased by 10.68% to 140.84 km-2 in 2005. It decreased to 125.21 km-2 in 2010, and slightly increased to 129.07 km-2 in 2015 and 130.01 km-2 in 2020 (Table 4). The change of GDP in the study area showed an S-shaped growth curve, which increased from 0.45 million CNY/km2 in 2000 to 4.50 million CNY/km2 in 2020 (Table 4). The MAT of the study area in 1998–2000, 2001–2005, 2006–2010, 2011–2015, and 2016–2020 was 18.03 °C, 18.38 °C, 18.46 °C, 18.43 °C, and 18.80 °C, respectively, which showed an increasing trend (Table 4). The MAP in the study area was 1303.3 mm, and the MAP showed a trend of decreasing first and then increasing. The MAP in 1998-2000, 2001–2005, 2006–2010, 2011–2015, and 2016–2020 was 1346.01mm, 1300.7 mm, 1235.4 mm, 1227.5 mm, and 1449.5 mm, respectively (Table 4).
3.3. Relationship Between the Variation in the NDVI and the Influencing Factors
Generally, the NDVI value of the whole area had a strong correlation with the proportion of construction land, GDP and MAT, and a moderate correlation with MAP. The proportion of construction land, GDP, MAT, and MAP were all positively correlated with the NDVI value (Figure 6).
In 90 counties in total, between the NDVI value and the proportion of woodland, there was a positive correlation in 46 counties and a negative correlation in 19 counties, in which there was a strong correlation in 22 counties (Figure 7A). Between the NDVI value and the proportion of grassland, there was a positive correlation in 48 counties and a negative correlation in 23 counties (Figure 7B). Between the NDVI value and the proportion of cropland, there was a positive correlation in 40 counties and a negative correlation in 29 counties (Figure 7C). Between the NDVI value and the proportion of construction land, there was a positive correlation in 85 counties and a strong correlation in 73 counties (Figure 7D). Between the NDVI value and the population density, there was a positive correlation in 19 counties and a negative correlation in 54 counties (Figure 7E). Between the NDVI value and GDP, there was a positive correlation in 89 counties, and a strong correlation in 88 counties (Figure 7F). Between the NDVI value and the MAT, there was a positive correlation in 67 counties and a strong correlation in 40 counties (Figure 7G). Between the NDVI value and the MAP, there was a positive correlation in 68 counties and a strong correlation in 20 counties (Figure 7H).
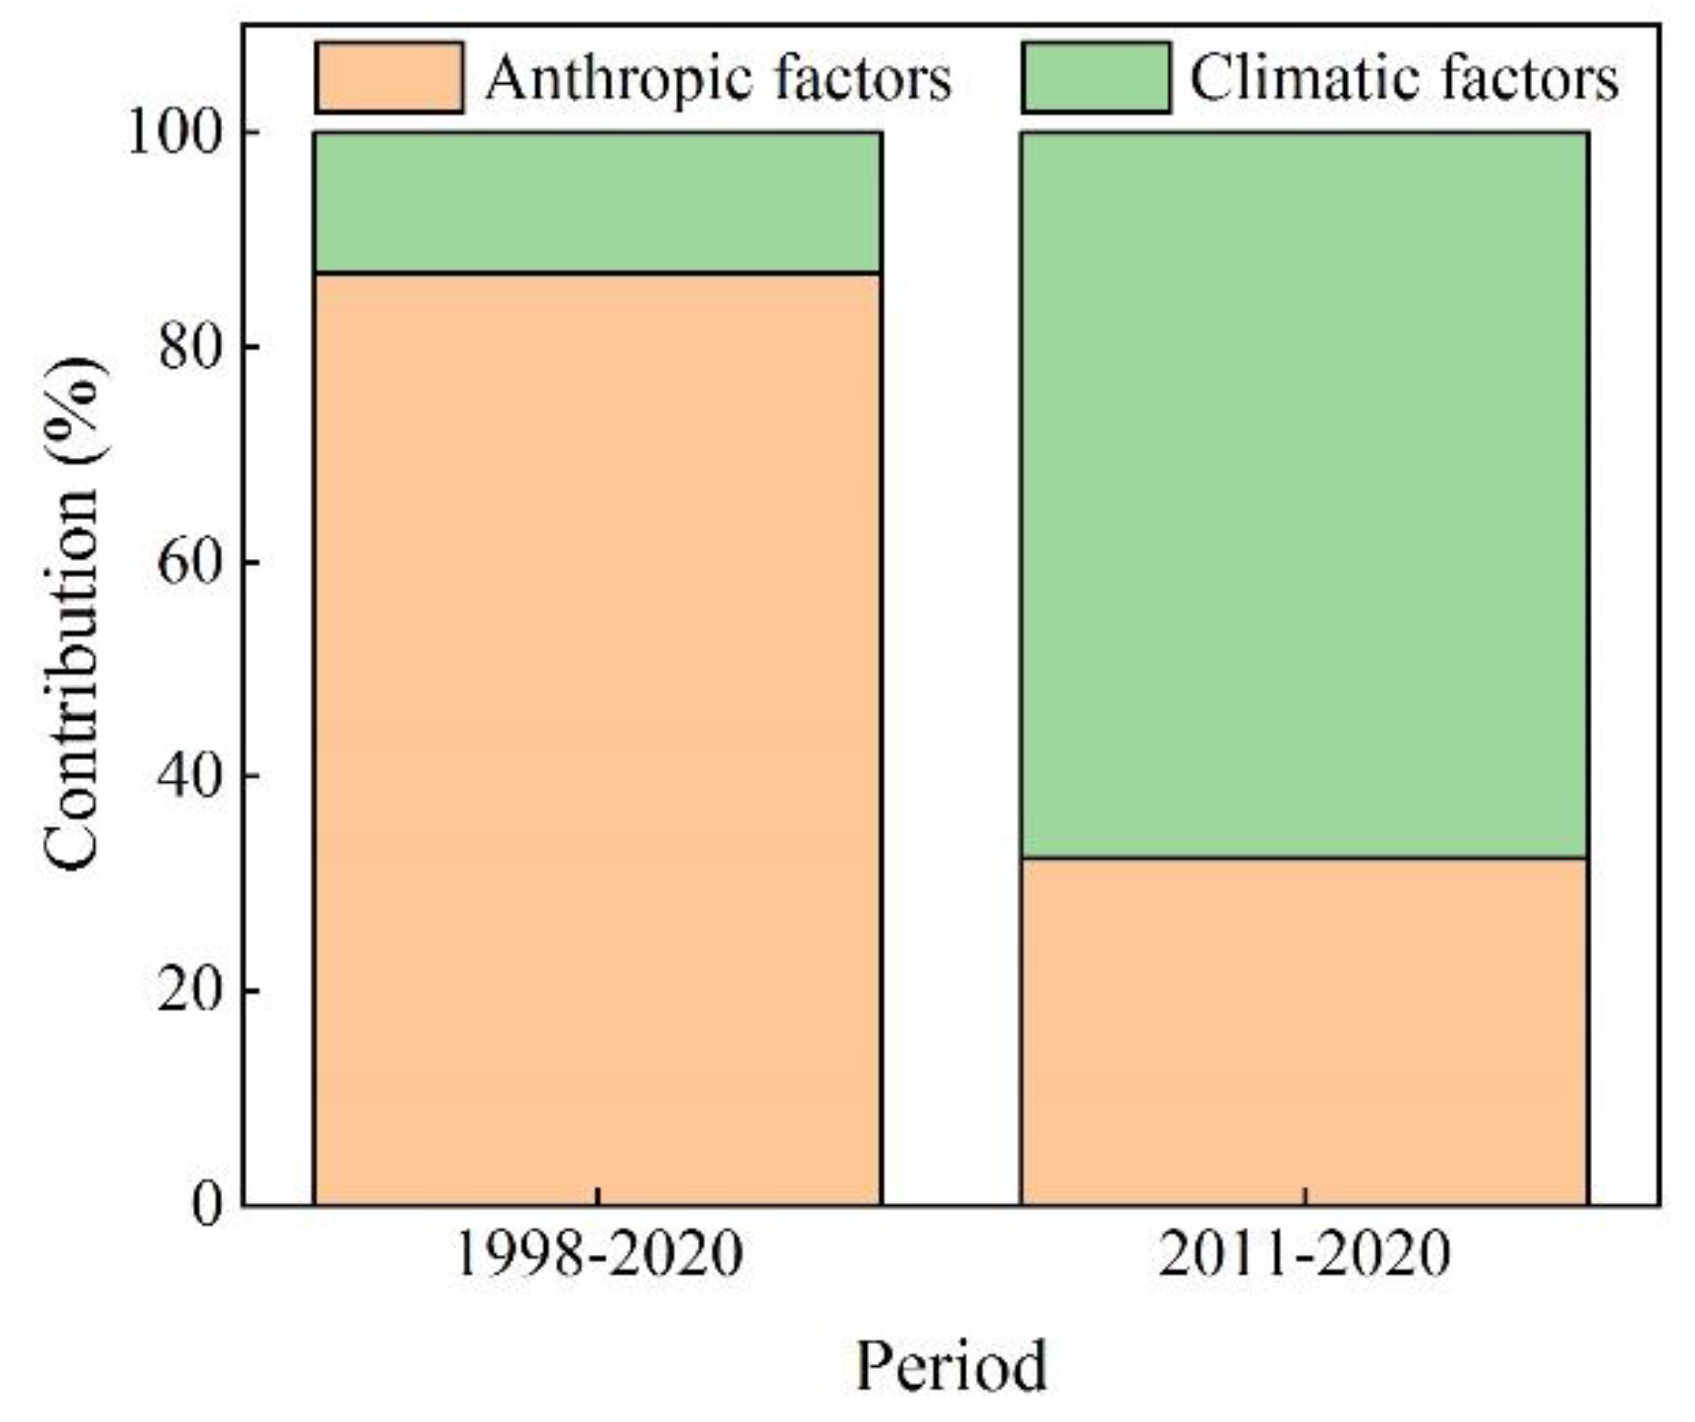
Through Through residual analysis, from 1998 to 2020, the anthropic factors were the dominant driver of variation of NDVI vale. The Canthropic was 87.02%, while the Cclimatic was12.98%. However, from 2011 to 2020, the Canthropic decreased to be 32.35%, while the Cclimatic increased to 67.65%.
Figure 8.
Interpretation for the variation of NDVI value by anthropogenic factors and climatic factors.
Figure 8.
Interpretation for the variation of NDVI value by anthropogenic factors and climatic factors.
3.2. Primary Factors Influencing the Spatial Variation in NDVI Value in the Different Periods
There were significant differences in the spatial variation of NDVI value. In 1998-2000, 2001-2005, 2006-2010, 201-2015 and 2016-2020, the NDVI were all significantly correlated with the proportion of karst area, woodland proportion, grassland proportion, cropland proportion, the population density, and MAT. There was a positive correlation between NDVI value and proportion of woodland, MAT, while a negative correlation between NDVI value and the proportion of karst area, grassland proportion, cropland proportion, the population density (Figure 9).
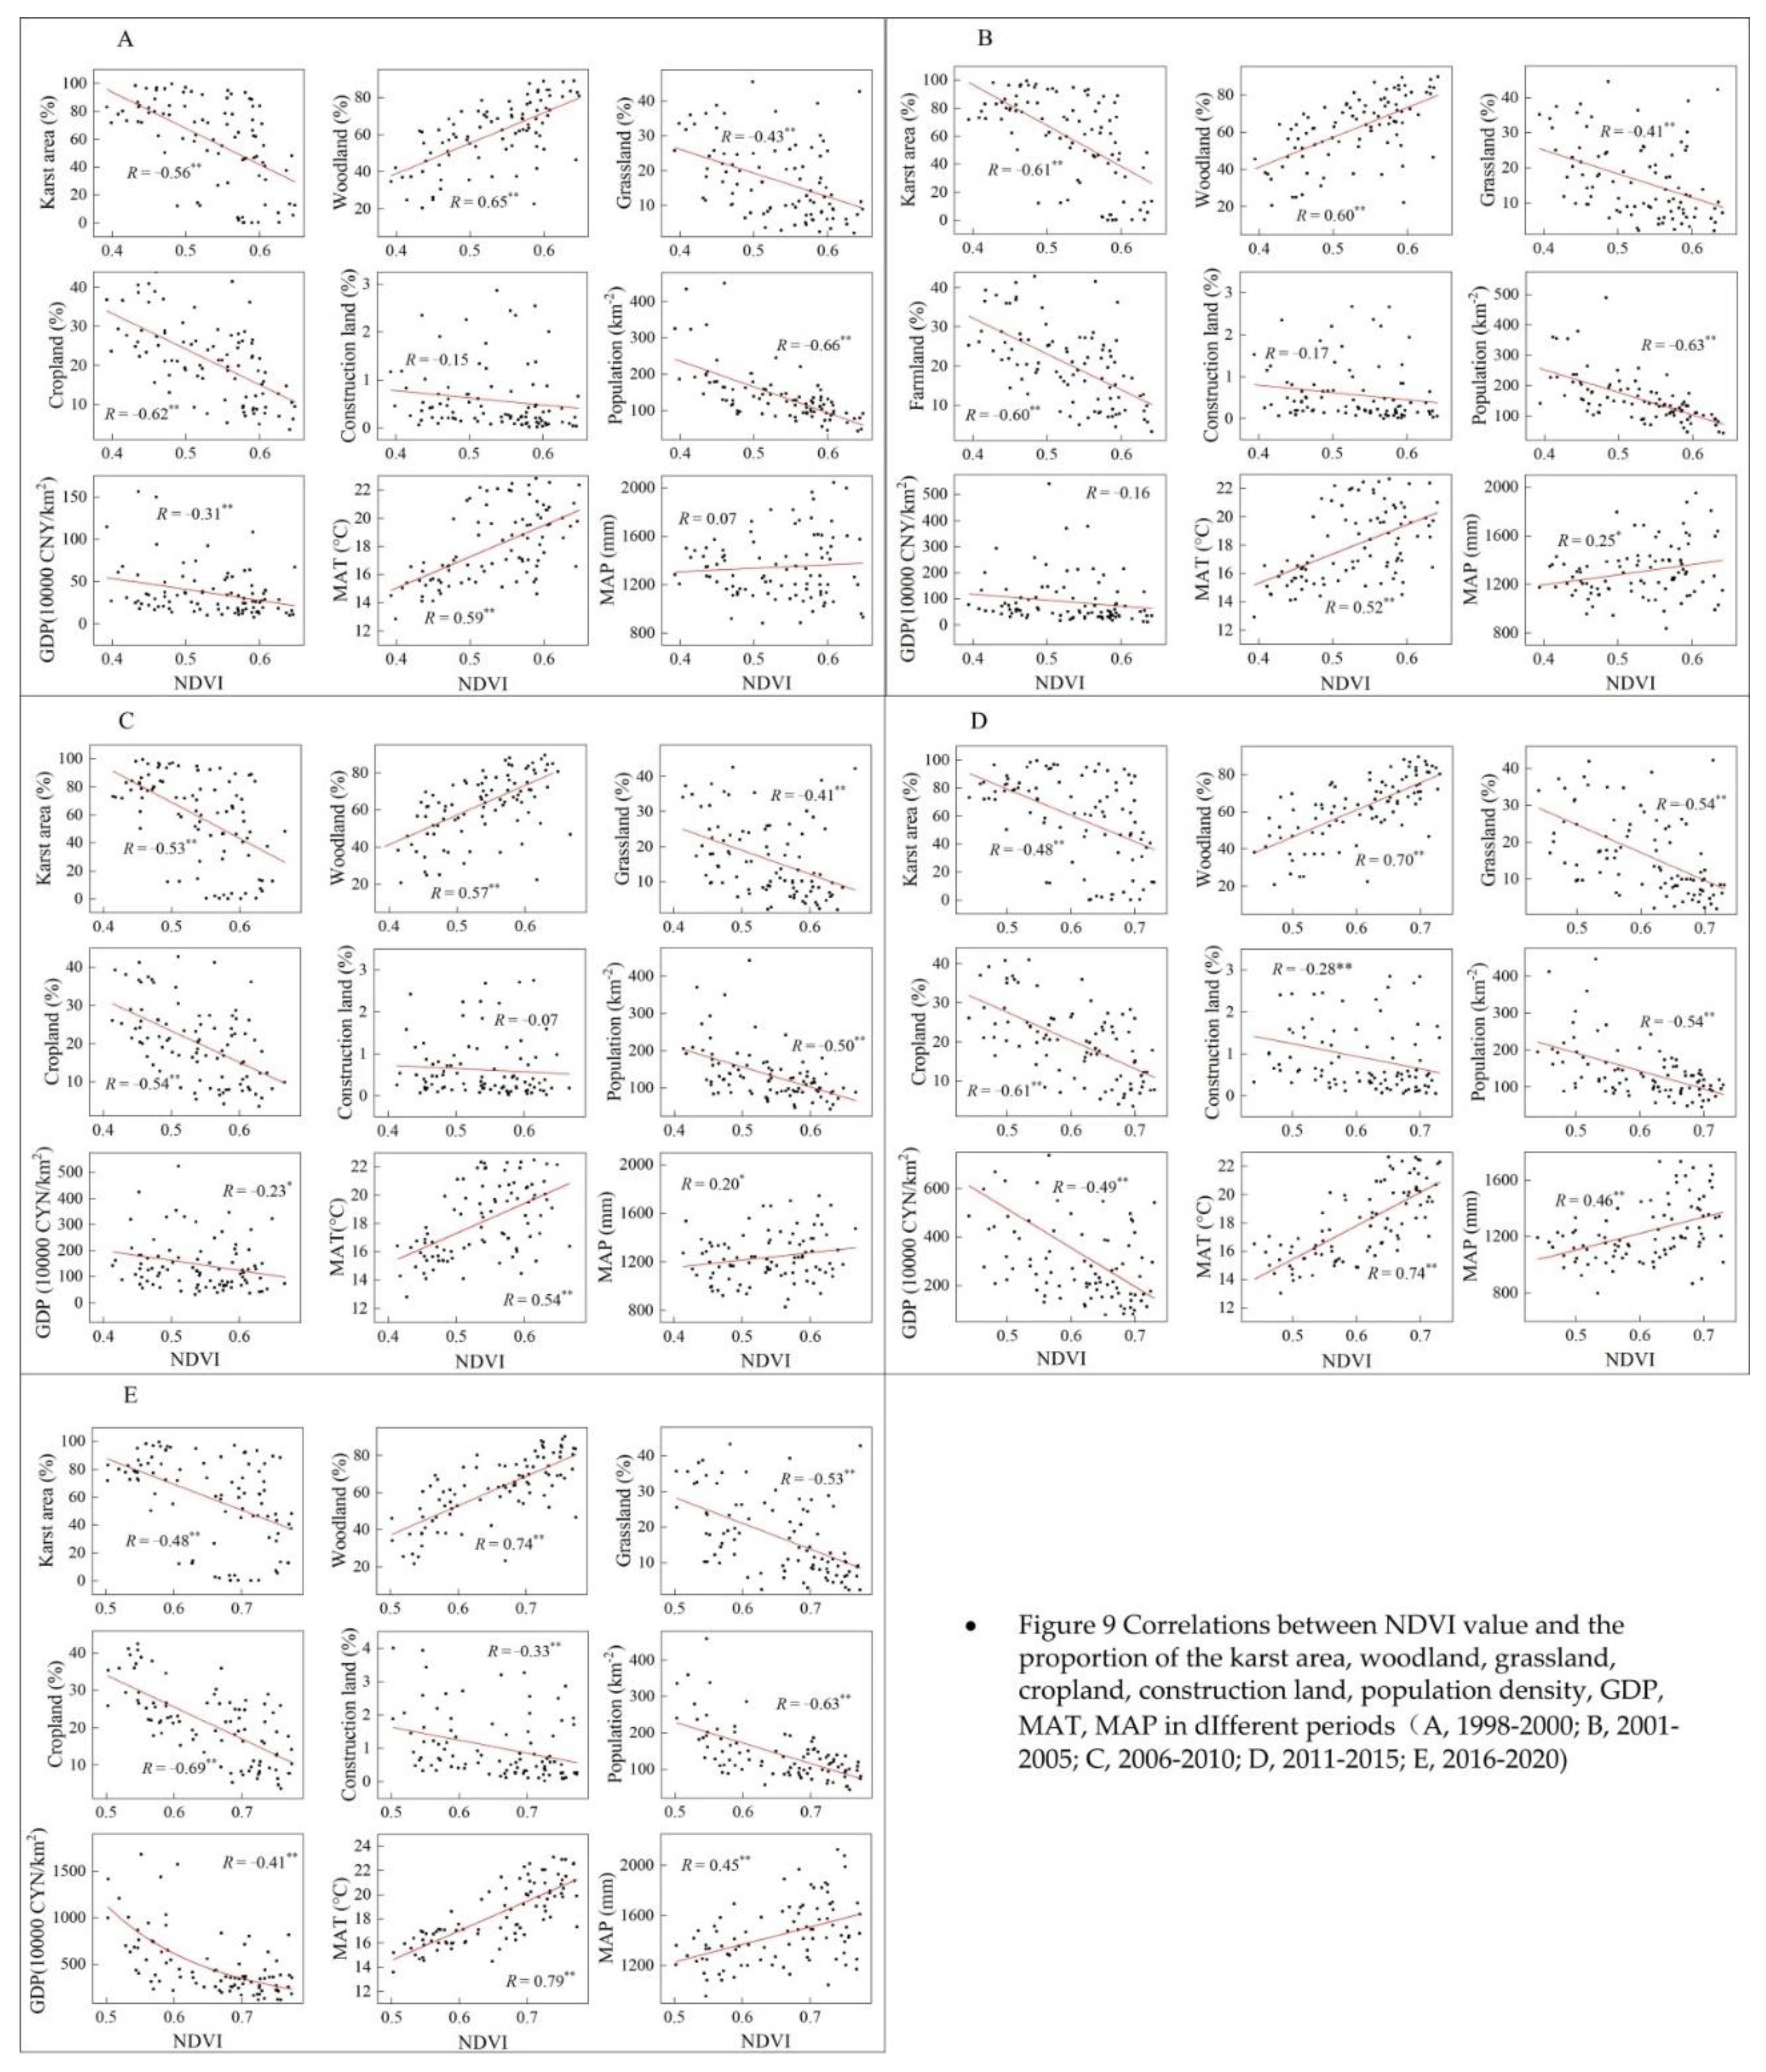
Furthermore, in 2000 and 2010, there was a weakly negatively correlation between NDVI value and GDP (9A, 9C). There was a positively weak correlation between NDVI value and MAT In 2005 and 2010 (Figure 9B, 9C), and a positively moderate correlation in 2015 and 2020 (Figure 9D, 9E). In 2015 and 2020, there was a negatively weak correlation between NDVI value and the proportion of construction land (Figure 9D,E).
From 2000 to 2020, the variation of NDVI value had significantly and positively correlations with the woodland proportion in 2000, MAT in 2000 and MAT in 2000, while there was a significantly and negatively correlation between the variation of NDVI value and the variation of GDP, average elevation, the cropland proportion in 2000, grassland proportion in 2000 (Table 5).
However, the correlations between the spatial variation of NDVI value and the environmental variables in the different periods varied. From 2000 to 2010, the variation of NDVI value had significantly positive correlation with variation in the grassland proportion, variation of GDP, construction land proportion in 2000, cropland proportion in 2000, population density in 2000, and GDP in 2000, while it had significantly negative correlations with the NDVI value in 2000 and woodland in 2000. From 2010 to 2020, the variation of NDVI value had significantly positive correlations with the woodland proportion in 2010, MAT in 2010, and MAP in 2010, while it had significantly negative correlations with the variations in construction land proportion, population density and GDP, average elevation, cropland proportion in 2010, grassland proportion in 2010, population density in 2010, and GDP in 2010 (Table 5).
4. Discussion
In this study, we found that the NDVI value in the study area increased significantly from 2000 to 2020, especially in karst areas, which was consistent with the results of previous studies [8,18]. Since the 1990s, a series of comprehensive measures have been implemented to control karst rocky desertification, which had been deemed to play a crucial role in vegetation greening [10,18]. More studies suggested that ecological engineering is was dominant driver of vegetation greening in karst area of southwest China [8,10]. In this study, we also supported that anthropic factors dominated the vegetation greening, which contributed 87.02% of the variation in vegetation coverage from 1998 to 2020. We found no significant changes in land use, but a significant increase of NDVI value in woodland, grassland and cropland. Therefore, we supported that ecological engineering such as returning farmland to forest (grass), prohibiting grazing and forest reservation would play key role in the land greening process. Meanwhile, the greening was also contributed by other human activities such as urbanization and economic development. We found that the variation of NDVI value had significantly positive correlations with construction land area (R = 0.98, P < 0.01) and GDP (R = 0.98, P < 0.01). Karst rocky desertification was once not only the primary ecological problem, but also a social problem exacerbating the poverty level of residents who depend on agricultural products [12]. The urbanization promoted the reduction of the resident rural population, alleviating the demand for vegetation resources, and contributing vegetation restoration [23,24]. We found the NDVI value had negative correlation with population density in 54 of 90 counties, while positive correlation in 19 counties (Figure 7E). Economic development, especially the development of non-agricultural industries, greatly increased farmers' income and reduced farmers' dependence on traditional agriculture and animal husbandry. The adjustment of the rural energy structure and the improvement of agricultural production efficiency also reduced the destruction of woodland [10]. However, our result supported that climate factors also played a key role on the vegetation greening of karst rocky desertification areas, which contributed 12.98% of the variation in NDVI value from 1998 to 2020 in this study. We found that the NDVI value had a strong correlation with MAT (R = 0.76, P = 0.14), which would be mainly due to the effect of CO2 fertilization [25]. Our results were similar to that of Pei [15], who suggested that major vegetation recovery was highly attributable to afforestation projects, and the climate change contributed only one-fifth to vegetation restoration. Qiao [8] suggested that the contribution of climate factor on vegetation greening decreased from 35% in 2000-2005 to 23% in 2006~2016. On the contrary, we found that the contribution of climate change increased from 0% in 1998-2010 to 67.65% in 2011-2020 (Figure 8). This result was similar with Liu [19], which showed that the impact of climate change became more pronounced with increasing time scale. There's no doubt that the significant increase in the contribution of climate change to vegetation would be also attributed to the foundation by previous ecological projects.
Although the vegetation coverage increased significantly in whole area, the vegetation greening had strong spatial heterogeneity (Figure 5). The NDVI value increased rapidly in the south and southeast of the study area, while it increased slowly in the western and northern regions of the study area. We found that the differences of the proportion of karst area, landscape pattern, the population density, GDP, MAT and MAP all contributed the contrasting spatial difference of NDVI value in different periods. Karst areas are characterized by a thin soil layer and rock outcroppings, especially in areas where the rocky desertification is serious, as it generates higher infrared light reflectivity. Due to the more rock outcropping and sparse vegetation cover, the area with the higher proportion of karst area will has lower NDVI value. Woodland, cropland and grassland were the main land use types in this area, accounting for more than 98% of the total land area. The proportion of woodland, cropland and grassland area determined the NDVI value of the counties. Because that the woodland has a higher NDVI value than cropland and grassland, the counties with more woodland generally had higher NDVI value. Partly, the population density determines the demand for regional ecological resources. There was a moderate correlation between the counties’ NDVI value and population density, which was because a higher population density means a higher dependence on the natural environment, which leads to more felling and grazing activities and a relatively low NDVI value. A higher population density means a higher dependence on the natural environment, which leaded to more felling and grazing activities and a relatively low NDVI value. Different from the whole area, the urban construction and GDP at the county level are negatively correlated with NDVI value in certain periods, for example in 2011-2015 and 2016-2020. Different from the whole area, the urban construction and GDP at the county level are negatively correlated with NDVI value in certain periods. This may be because the construction land has a lower NDVI value, and the local economic development will consume more forest and grass resources. This is due to that the construction land has a lower NDVI value and the local economic development will consume more forest and grass resources. The significantly positive correlation between the NDVI value and MAT may be attributed to the increase in evergreen trees with the increase in the MAT confirmed that temperature is the main climate factor affecting vegetation cover in the southwest China [16], which may be attributed to the more evergreen trees in areas with higher MAT. Precipitation was also a key factor influencing vegetation greening, due to vegetation growth in karst regions is also susceptible to water stress [26,27]. Since 2005, the correlation between the county NDVI value and the local MAP gradually increased, indicating that the average annual precipitation played an increasing role in leading to the difference in NDVI value among counties.
From 1998 to 2020, the main factors affecting the spatial differentiation in county NDVI growth were landscape pattern in 2000, temperature and precipitation in 1998-2000, variation in population density, average elevation, MAT, and MAP. The significantly positive correlation between NDVI growth and woodland proportion, MAT and MAP, indicated vegetation greening was faster in regions with warm and humid climate or more forestland. The significantly negative correlation between NDVI growth and higher average elevation would slow down the vegetation growth. Nonetheless, the main factors affecting the spatial differences in vegetation greening varied in the different periods. From 2000 to 2010, The construction land and cropland proportion, population, GDP in 2000, GDP growth and variation of grassland proportion all had significantly positive correlation with NDVI change, which confirmed that anthropic factors (e.g. urbanization and returning farmland to grassland project) play crucial role on vegetation greening. The negative correlation between variation of NDVI growth and NDVI in 1998-2000 implied that the counties with lower NDVI value had the higher growth of NDVI value, which further confirmed effectiveness of the rocky desertification control on reducing the degree of rocky desertification. The negatively and significantly correlation between average elevation and NDVI growth indicated higher elevation slowed down the vegetation growth rate, which was consistent with Liu [19].
However, the effects of environmental factor on county vegetation greening was contrasting in different periods. From 2000 to 2010, the construction land proportion and cropland proportion in 2000, population in 2000, GDP in 2000, and variation in GDP were all positively and significantly correlated with the NDVI growth, but were negatively and significantly correlated with NDVI value in 2000 and woodland proportion in 2000. This may be related to the investment of ecological projects, which tended to favor the counties with more serious rocky desertification and more poor. Then, from 2011 to 2020, the cropland proportion in 2010, grassland proportion in 2010, population in 2010, GDP in 2010, and variation in GDP were all negatively and significantly correlated with the NDVI growth, but were positively and significantly with woodland proportion in 2010. This may be also due to that more forestland means higher vegetation cover growth rates with reduced human activity since 2010, and the vegetation in the counties with rapid urbanization and economic development has suffered varying degrees of destruction and degradation with the decrease of ecological engineering investment. MAT and MAP have no significant correlation with NDVI growth from 2000 to 2010, but have a significant positive correlation with NDVI growth from 2011 to 2020, which supported that the anthropic factors contributed almost all of the variation in NDVI from 2000 to 2010 [13], and supported that increasing MAT and MAP were also key factors affecting vegetation greening from 2011 to 2020. And the higher correlation coefficient between the variation of NDVI value and MAT than MAP illustrated that the sensitivity of vegetation coverage to MAT was stronger than MAP. The regions with a high MAT or MAP generally had faster vegetation recovery, such as in Guangxi and north of Guizhou provinces. Our result was consistent with the result of Liu [22], which reported that the relationships between vegetation dynamics and climate change at different time scales exhibited clear spatial heterogeneity in southwestern China. The average elevation had no significant correlation with NDVI growth from 2000 to 2010, but a significant correlation with NDVI growth from 2011 to 2020, which may be attributed that the driving effect of climate change on vegetation greening was altitude dependent [28].
5. Conclusions
(1) The vegetation coverage increased by 23.59% over the past 23 years, and the and the anthropic factor dominated the vegetation greening. The contribution of anthropic factors and climatic factors were 87.02% and 12.98% from 1998 to 2020. Significant vegetation greening occurred from 2011 to 2020, and the greening during this period was mainly contributed by climatic factors (67.65%).
(2) The significant spatial heterogeneity in the NDVI was mainly caused by the site conditions (e.g. the proportion of karst area, landscapes pattern, mean annual temperature and precipitation) and anthropic factors (e.g. the proportion of construction land, population density and gross domestic product); the county NDVI value was negatively correlated with the proportion of karst area, cropland, grassland and construction land, population density, and gross domestic product, while it was positively correlated with the proportion of woodland, mean annual temperature and mean annual precipitation.
(3) Vegetation greening was faster in counties with warm and humid climate or more forestland, and lower in counties with higher average elevation and economic growth. The effects of environmental factors on vegetation growth were different in different periods. Mean annual temperature and precipitation
(4) The anthropic factors (e.g. ecological projects) from 1998 to 2010 was the basis for the rapid greening of vegetation from 2011 to 2020, the increasing temperature and precipitation since 2010 magnified the contribution of human activity. The increasing MAT is likely to promote the further increase of NDVI value in southwest China.
Therefore, land managers should implemented ecological restoration projects in a coordinated manner and be tailored to local conditions, for instance implementing more natural restoration measures and reducing excessive project investment in most areas with high MAT and MAP, and carrying out some rational artificial assisted recovery measures in areas with low precipitation, such as afforestation with local drought-tolerant trees.
Author Contributions
Conceptualization, X. Yue and X. Pan; methodology, X. Yue and H. Lu; software, H. Lu; validation, X. Pan; formal analysis, X. Yue, J. Zeng, and H. Lu; writing–original draft preparation, X. Yue; writing–review and editing, X. Pan; visualization, X. Yue; supervision, J. Zeng and X. Pan; funding acquisition, X. Yue and X. Pan. All authors have read and agreed to the published version of the manuscript.
Funding
This research was funded by Chinese Academy of Geological Sciences Basic scientific research funds (2023006), Guangxi Key Research and Development Program (GuikeAB21196026), the Guangxi Innovation-Driven Development Special Fund Project (GuikeAA20161004), and Guangxi Natural Science Foundation (2018GXNSFAA138172).
Data Availability Statement
The data presented in this study are available on request from the corresponding author.
Conflicts of Interest
The authors declare no conflicts of interest.
References
- Piao, S.; Yin, G.; Tan, J.; Cheng, L.; Huang, M.; Li, Y.; Liu, R.; Mao, J.; Myneni, R.B.; Peng,S. Detection and attribution of vegetation greening trend in China over the last 30 years. Glob. Chang. Biol. 2015, 21, 1601–1609. [CrossRef]
- Pettorelli, N.; Vik, J.; Mysterud, A.; Gaillard, J.M.; Tucker, C.J.; Stenseth, N.C. Using the satellite-derived NDVI to assess ecological responses to environmental change. Trends Ecol. Evol. 2005, 20, 503–510. [CrossRef]
- Zhang, X.; Yang, Y.; Gao, H.; Xu, S.; Feng J.; Qin T. Land Cover Changes and Driving Factors in the Source Regions of the Yangtze and Yellow Rivers over the Past 40 Years. Land 2024, 13, 259. [CrossRef]
- Guo, E.; Wang, Y.; Wang, C.; Sun, Z.; Bao, Y.; Mandula, N.; Jirigala, B.; Bao, Y.; Li, H. NDVI indicates long-term dynamics of vegetation and its driving forces from climatic and anthropogenic factors in Mongolian Plateau. Remote Sens. 2021, 13, 688. [CrossRef]
- Zhu, Z.; Piao, S.; Myneni, R.; Myneni, R.B.; Huang, M.; Zeng, Z.; Canadell, J.G.; Ciais, P.; Sitch, S.; et al. Greening of the Earth and its drivers. Nat. Clim. Change 2016, 6, 791–795. [CrossRef]
- Song, X.; Hansen, M.C.; Potapov, P.V.; Tyukavina, A.; Townshend, J.R.; Stehman, S.V.; Vermote E.F. Global land change from 1982 to 2016. Nature 2018, 563, 639. [CrossRef]
- Chen, C.; Park, T.; Wang, X.; Piao, S.; Xu, B.; Chaturvedi, R.K.; Fuchs, R.; Brovkin, V.; Ciais, P.; Fensholt, R.; Tømmervik, H.; Bala, G.; Zhu, Z.; Nemani, R.R.; Myneni, R.B. China and India lead in greening of the world through land-use management. Nat. Sustain. 2019, 2, 122-129. [CrossRef]
- Tong, X.; Brandt, M.; Yue, Y.; Horion, S.; Wang, K.; De Keersmaecker, W.; Tian, F.; Schurgers, G.; Xiao, X.; Luo, Y.; Chen, C.; Myneni, R.; Shi, Z.; Chen, H.; Fensholt, R. Increased vegetation growth and carbon stock in China karst via ecological engineering. Nat. Sustain. 2018, 1, 44–50. [CrossRef]
- Brandt, M.; Yue, Y.; Wigneron, J. P.; Tong, X.; Tian, F.; Jepsen, M. R.; Xiao, X.; Verger, A.; Mialon, A.; Al-Yaari, A.; Wang, K.; Fensholt, R. Satellite-observed major greening and biomass increase in South China karst during recent decade. Earth’s Future 2018, 6, 1017-1028. [CrossRef]
- Jiang, Z.; Lian, Y.; Qin, X. Rocky desertification in southwest China: impacts, causes, and restoration. Earth-Sci. Rev. 2014, 132, 1–12. [CrossRef]
- Tong, X., Wang, K., Yue, Y., Brandt, M., Liu, B., Zhang, C., Liao, C., Fensholt, R. Quantifying the effectiveness of ecological restoration projects on long-term vegetation dynamics in the karst regions of Southwest China. Int. J. Appl. Earth. Obs. 2017, 54, 105–113. [CrossRef]
- Wang, K.; Zhang, C.; Chen, H.; Yue, Y.; Zhang, W.; Zhang, M.; Qi, X.; Fu, Z. Karst landscapes of China: patterns, ecosystem processes and services. Landscape Ecol. 2019, 34, 2743–2763. https://www.webofscience.com/wos/woscc/full-record/WOS:000492939700001.
- Cai, H.; Yang, X.; Wang, K.; Xiao, L. Is forest restoration in the southwest China karst promoted mainly by climate change or human-induced factors? Remote Sens. 2014, 6, 9895–9910. [CrossRef]
- Zhao, S.; Pereira, P.; Wu, X.; Zhou, J.; Cao, J.; Zhang, W. Global karst vegetation regime and its response to climate change and human activities. Ecol. Indic. 2020, 113, 106208. [CrossRef]
- Pei, J.; Wang, L.; Huang, H.; Wang, L.; Li, W.; Wang, X.; Yang, H.; Cao, J.; Fang, H.; Niu, Z. Characterization and attribution of vegetation dynamics in the ecologically fragile South China Karst: evidence from three decadal landsat observations. Front. Plant Sci. 2022, 13, 1043389. [CrossRef]
- Hou, W.; Gao, J.; Wu, S.; Dai, E. Interannual variations in growing-season NDVI and its correlation with climate variables in the southwestern karst region of China. Remote Sens. 2015, 7, 11105-11124. [CrossRef]
- Tong, X.; Wang, K.; Brandt, M.; Yue, Y.; Liao, C.; Fensholt, R. Assessing future vegetation trends and restoration prospects in the karst regions of southwest China. Remote Sens. 2016, 8, 357. [CrossRef]
- Qiao, Y.; Jiang, Y.; Zhang, C. Contribution of karst ecological restoration engineering to vegetation greening in southwest China during recent decade. Ecol. Indic. 2021, 121, 107081. [CrossRef]
- Liu, H.; Jiao, F.; Yin, J.; Li, T.; Gong, H.; Wang, Z.; Lin, Z. Nonlinear relationship of vegetation greening with nature and human factors and its forecast – a case study of Southwest China. Ecol. Indic. 2020, 111, 106009. [CrossRef]
- Qu, S.; Wang, L.; Lin, A.; Zhu, H.; Yuan, M. What drives the vegetation restoration in Yangtze River basin, China: climate change or anthropogenic factors? Ecol. Indic. 2018, 90, 438–450. [CrossRef]
- Zhang, X.M.; Yue, Y.M.; Tong, X.W.; Wang, K.L.; Qi, X.K.; Deng, C.Q.; Brandt, M. Eco-engineering controls vegetation trends in southwest China karst. Sci. Total Environ. 2021, 770, 145160. [CrossRef]
- Liu, H.; Zhang, M.; Lin, Z.; Xu, X. Spatial heterogeneity of the relationship between vegetation dynamics and climate change and their driving forces at multiple time scales in Southwest China. Agr. Forest Meteorol. 2018, 256, 10–21. [CrossRef]
- Qi, X.; Li, Q.; Yue, Y.; Liao, C.; Zhai, L.; Zhang, X.; Wang, K.; Zhang, C.; Zhang, M.; Xiong, Y. Rural-urban migration and conservation drive the ecosystem services improvement in China karst: A case study of Huanjiang County, Guangxi. Remote Sens. 2021, 13, 566. [CrossRef]
- Zhang, X.; Brandt, M.; Tong, X.; Ciais, P.; Yue, Y.; Xiao, X.; Zhang, W.; Wang, K.; Fensholt, R. A large but transient carbon sink from urbanization and rural depopulation in China. Nat. Sustain. 2022, 5, 321–328. [CrossRef]
- Chen, X; Chen, T; He, B; Liu, S; Zhou, S.; Shi, T. The global greening continues despite increased drought stress since 2000. Glob. Ecol. Conserv. 2024, 49, e02791. [CrossRef]
- Zhou, Q.; Luo, Y.; Zhou, X.; Cai, M.; Zhao, C. Response of vegetation to water balance conditions at different time scales across the karst area of southwestern China-A remote sensing approach. Sci. Total Environ. 2018, 645, 460–470. [CrossRef]
- Wan, L.; Zhou, J.; Guo, H.; Cui, M.; Liu Y. Trend of water resource amount, drought frequency, and agricultural exposure to water stresses in the karst regions of South China. Nat. Hazards. 2016, 80, 23–42. [CrossRef]
- Tao, J.; Xu, T.; Dong, J.; Yu, X.; Jiang, Y.; Zhang, Y.; Huang, K.; Zhu, J.; Dong, J.; Xu, Y.; Wang, S. Elevation-dependent effects of climate change on vegetation greenness in the high mountains of southwest China during 1982–2013. Int. J. Climatol. 2018, 38, 2029–2038. [CrossRef]
Figure 1.
Location of the study area.
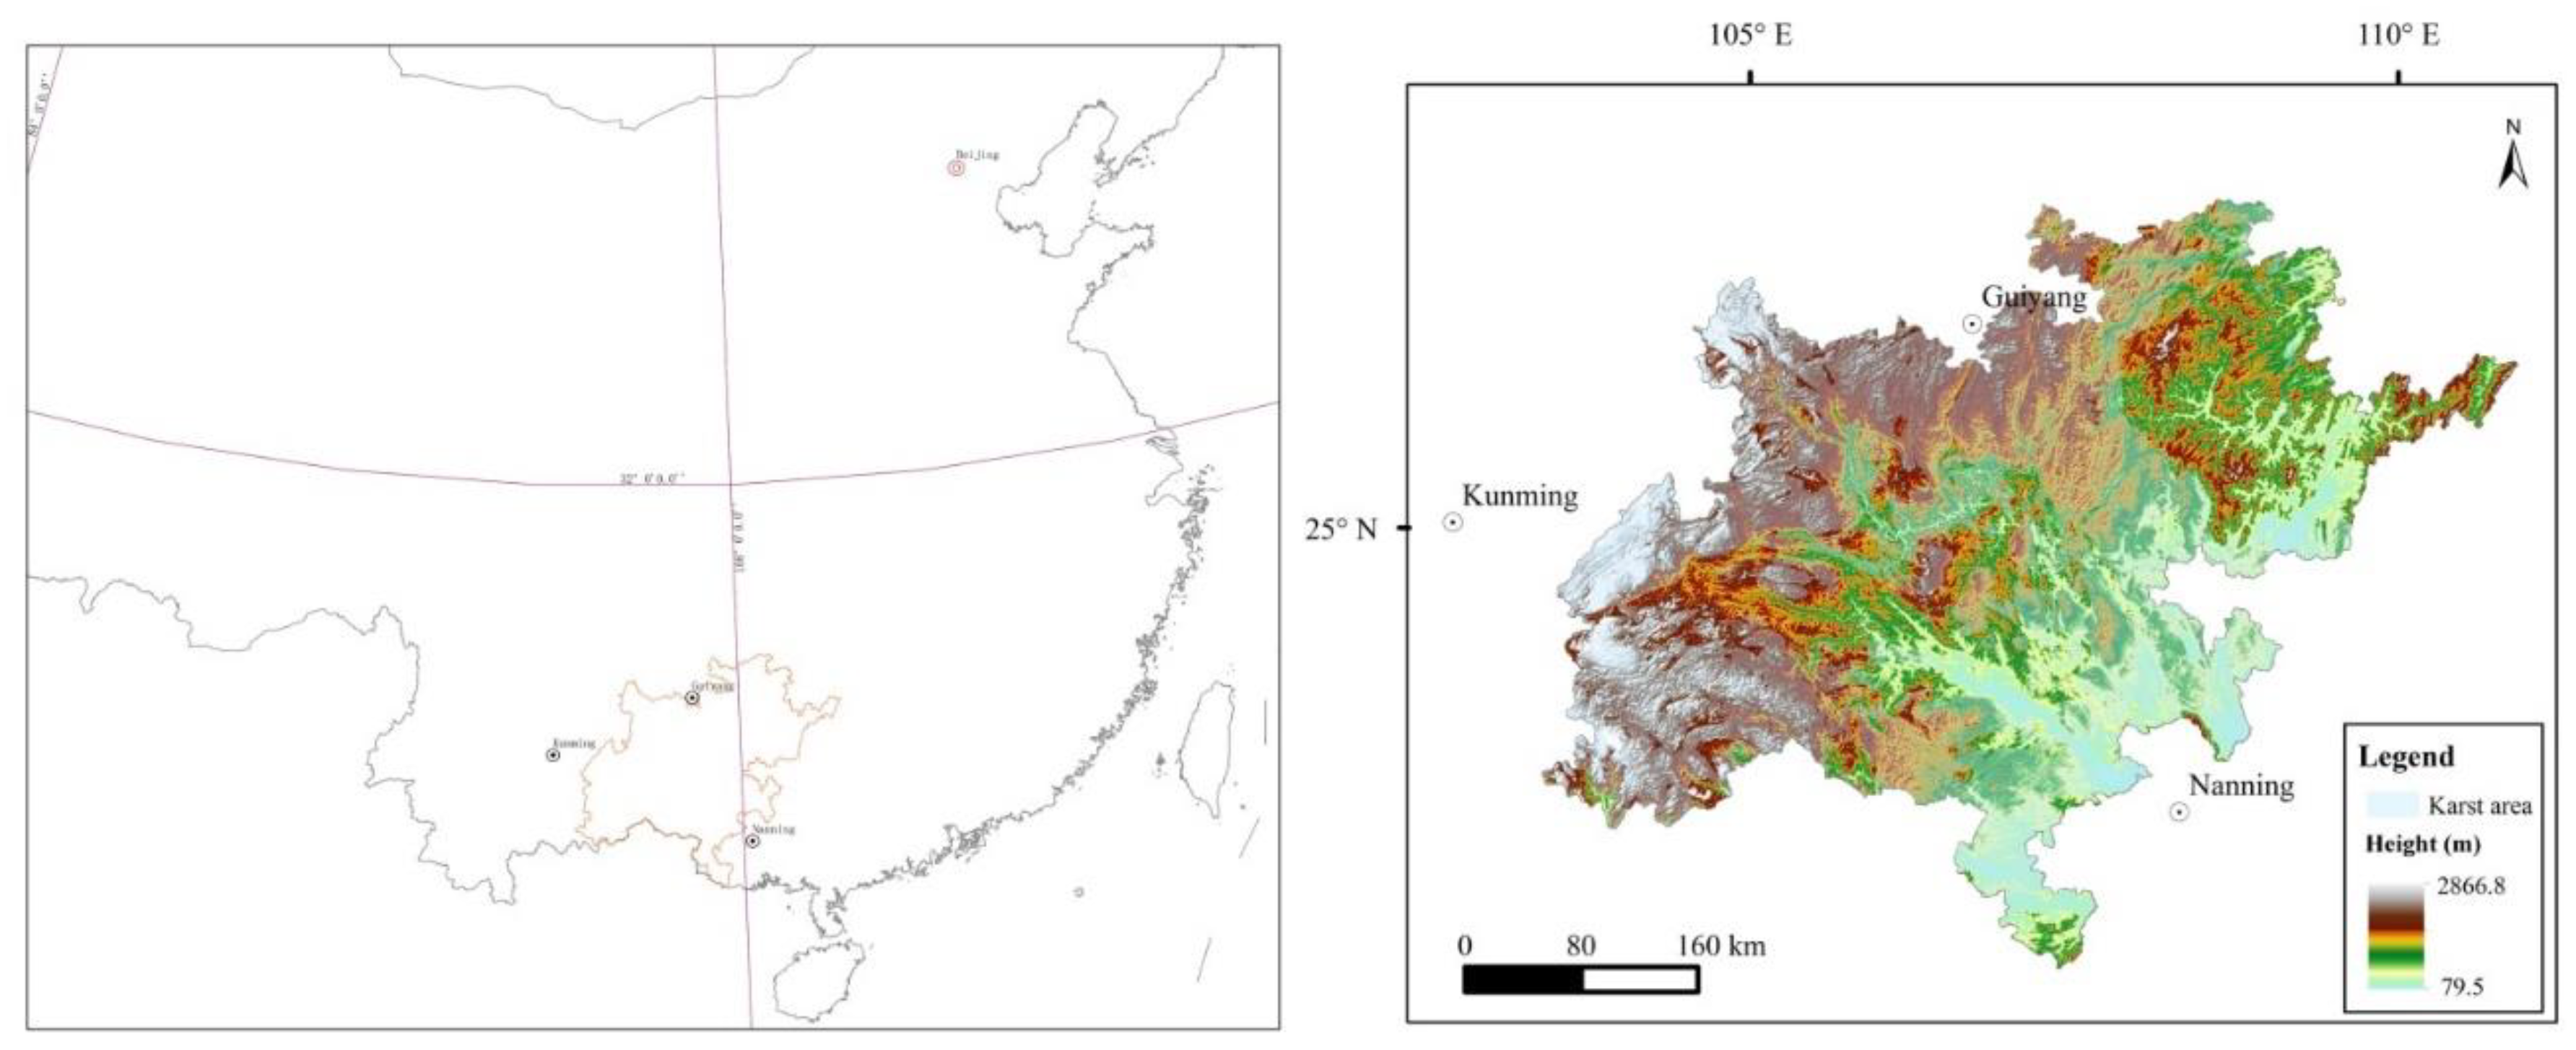
Figure 2.
Temporal and spatial changes in the NDVI value in the study area in different periods (A, 1998-2000; B, 2001-2005; C, 2006-2010; D, 2011-2015; E, 2016-2020).
Figure 2.
Temporal and spatial changes in the NDVI value in the study area in different periods (A, 1998-2000; B, 2001-2005; C, 2006-2010; D, 2011-2015; E, 2016-2020).
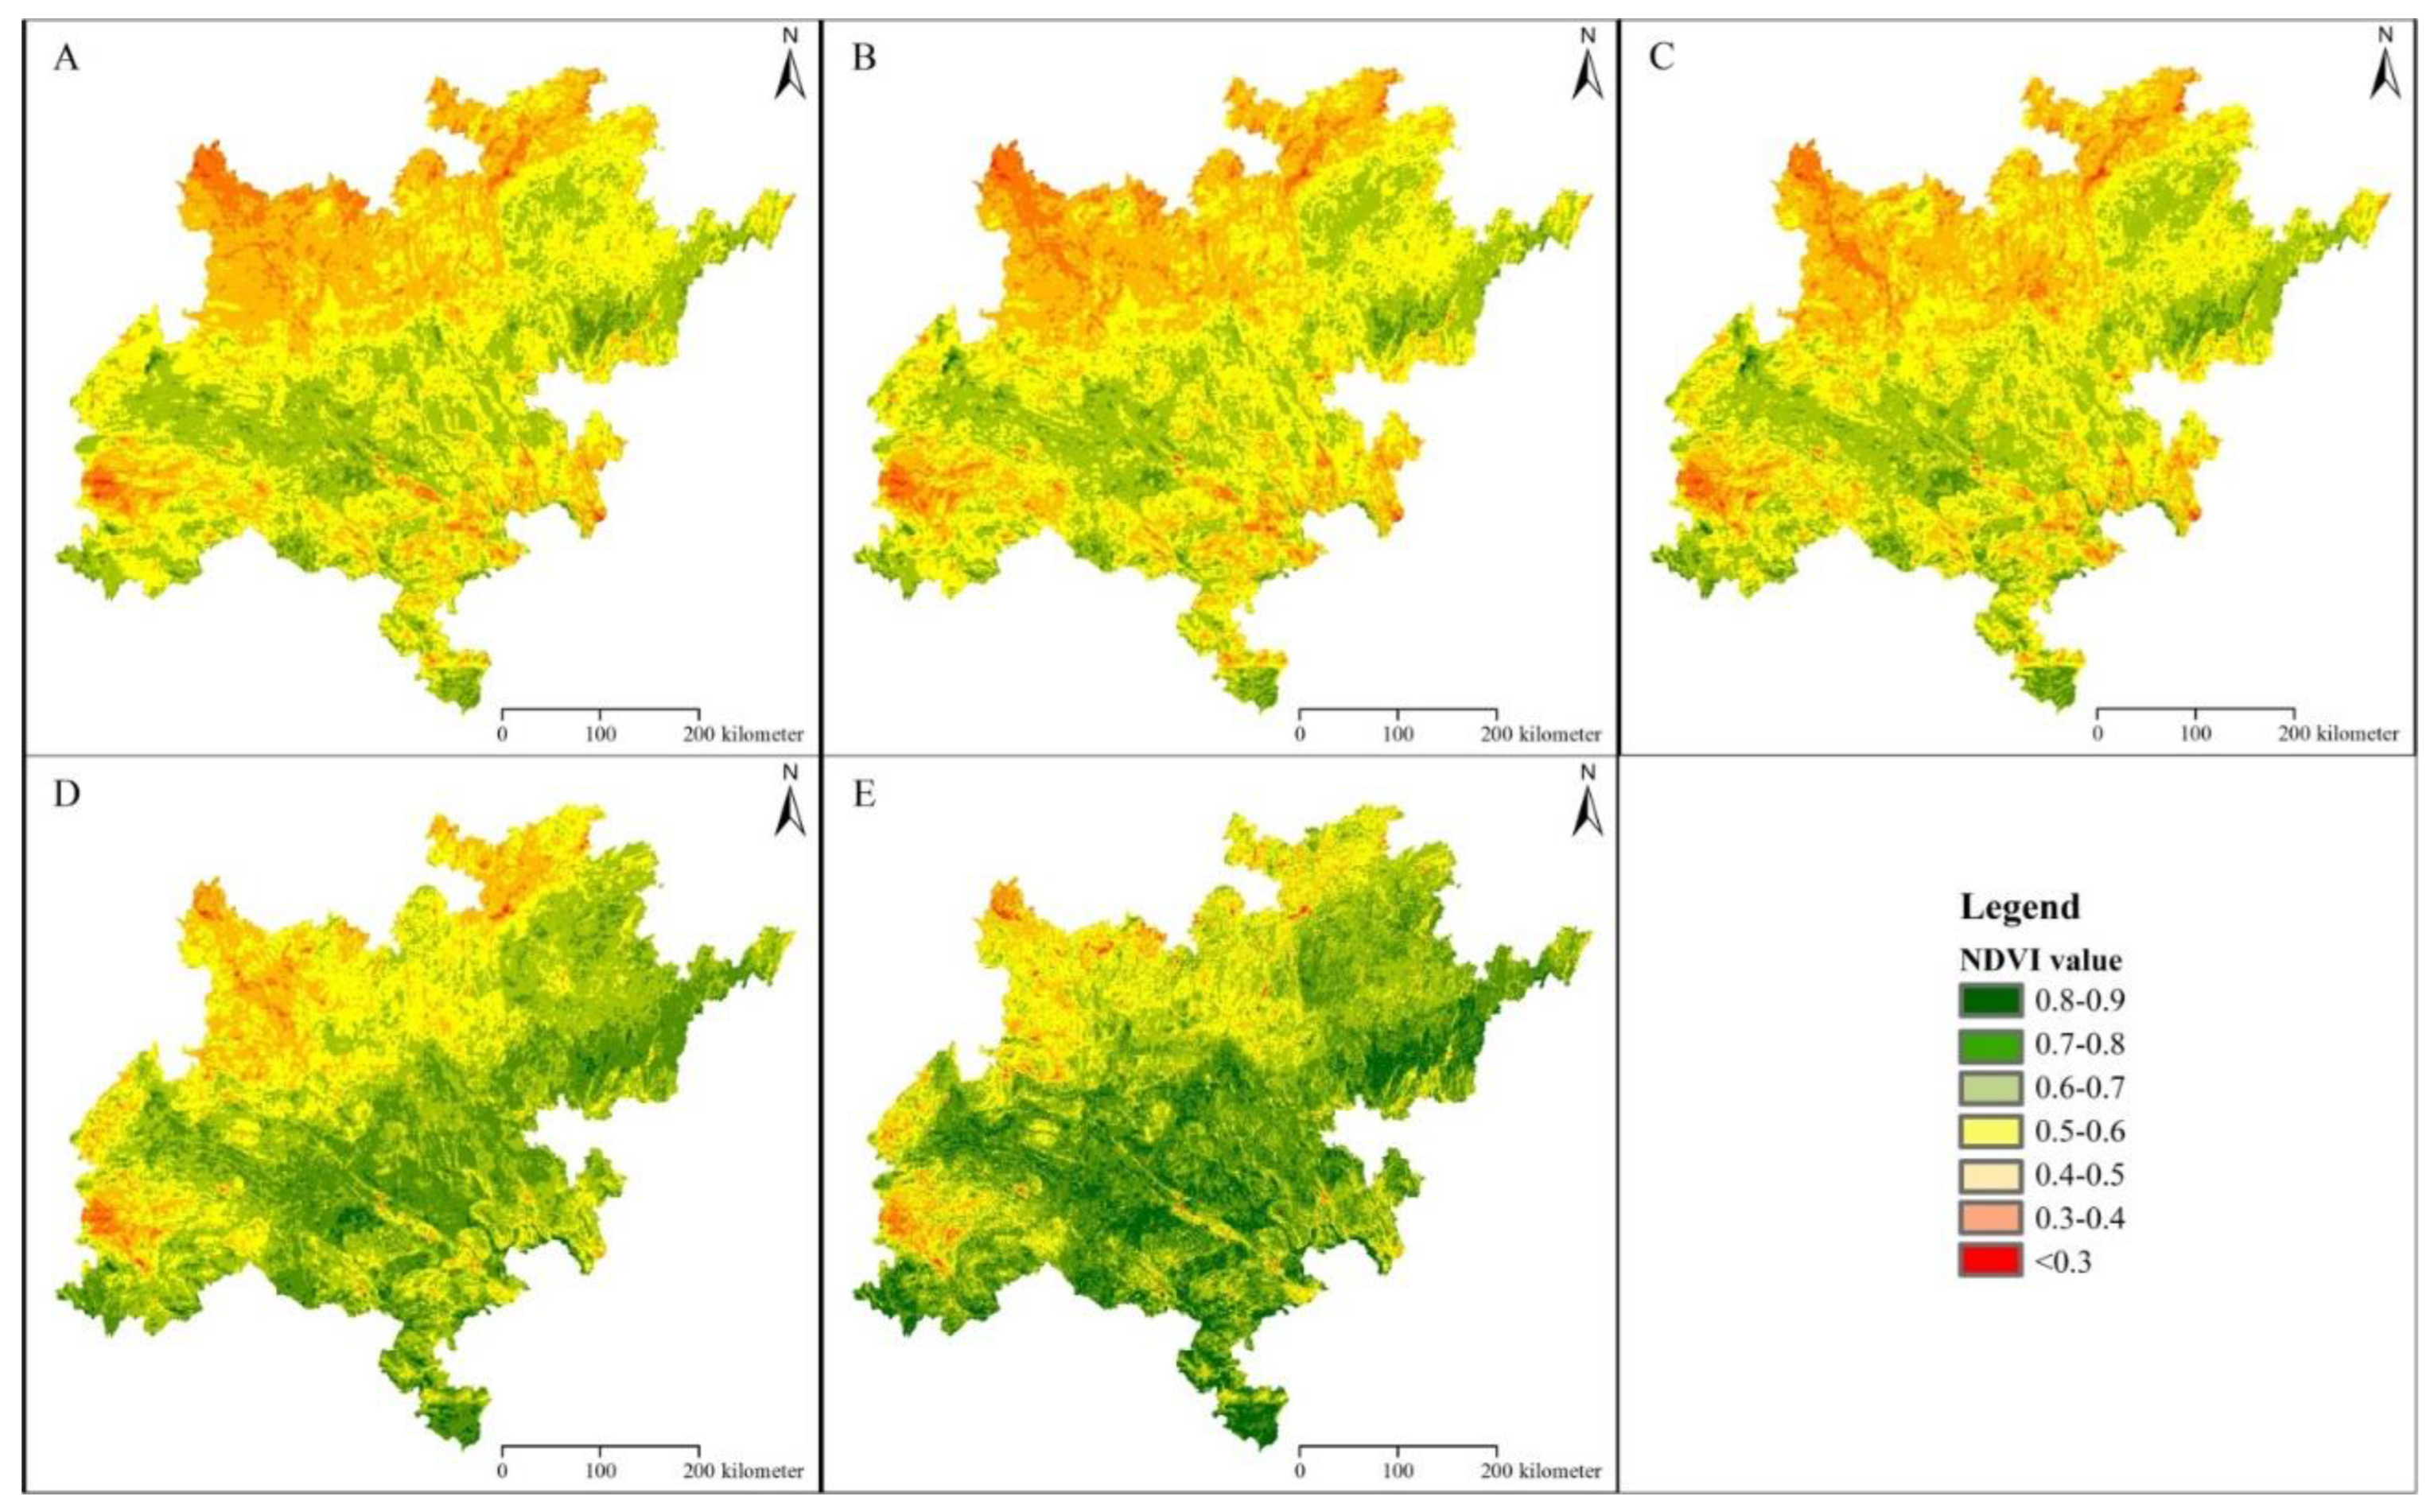
Figure 3.
Dynamics of NDVI value in the karst and non-karst areas.
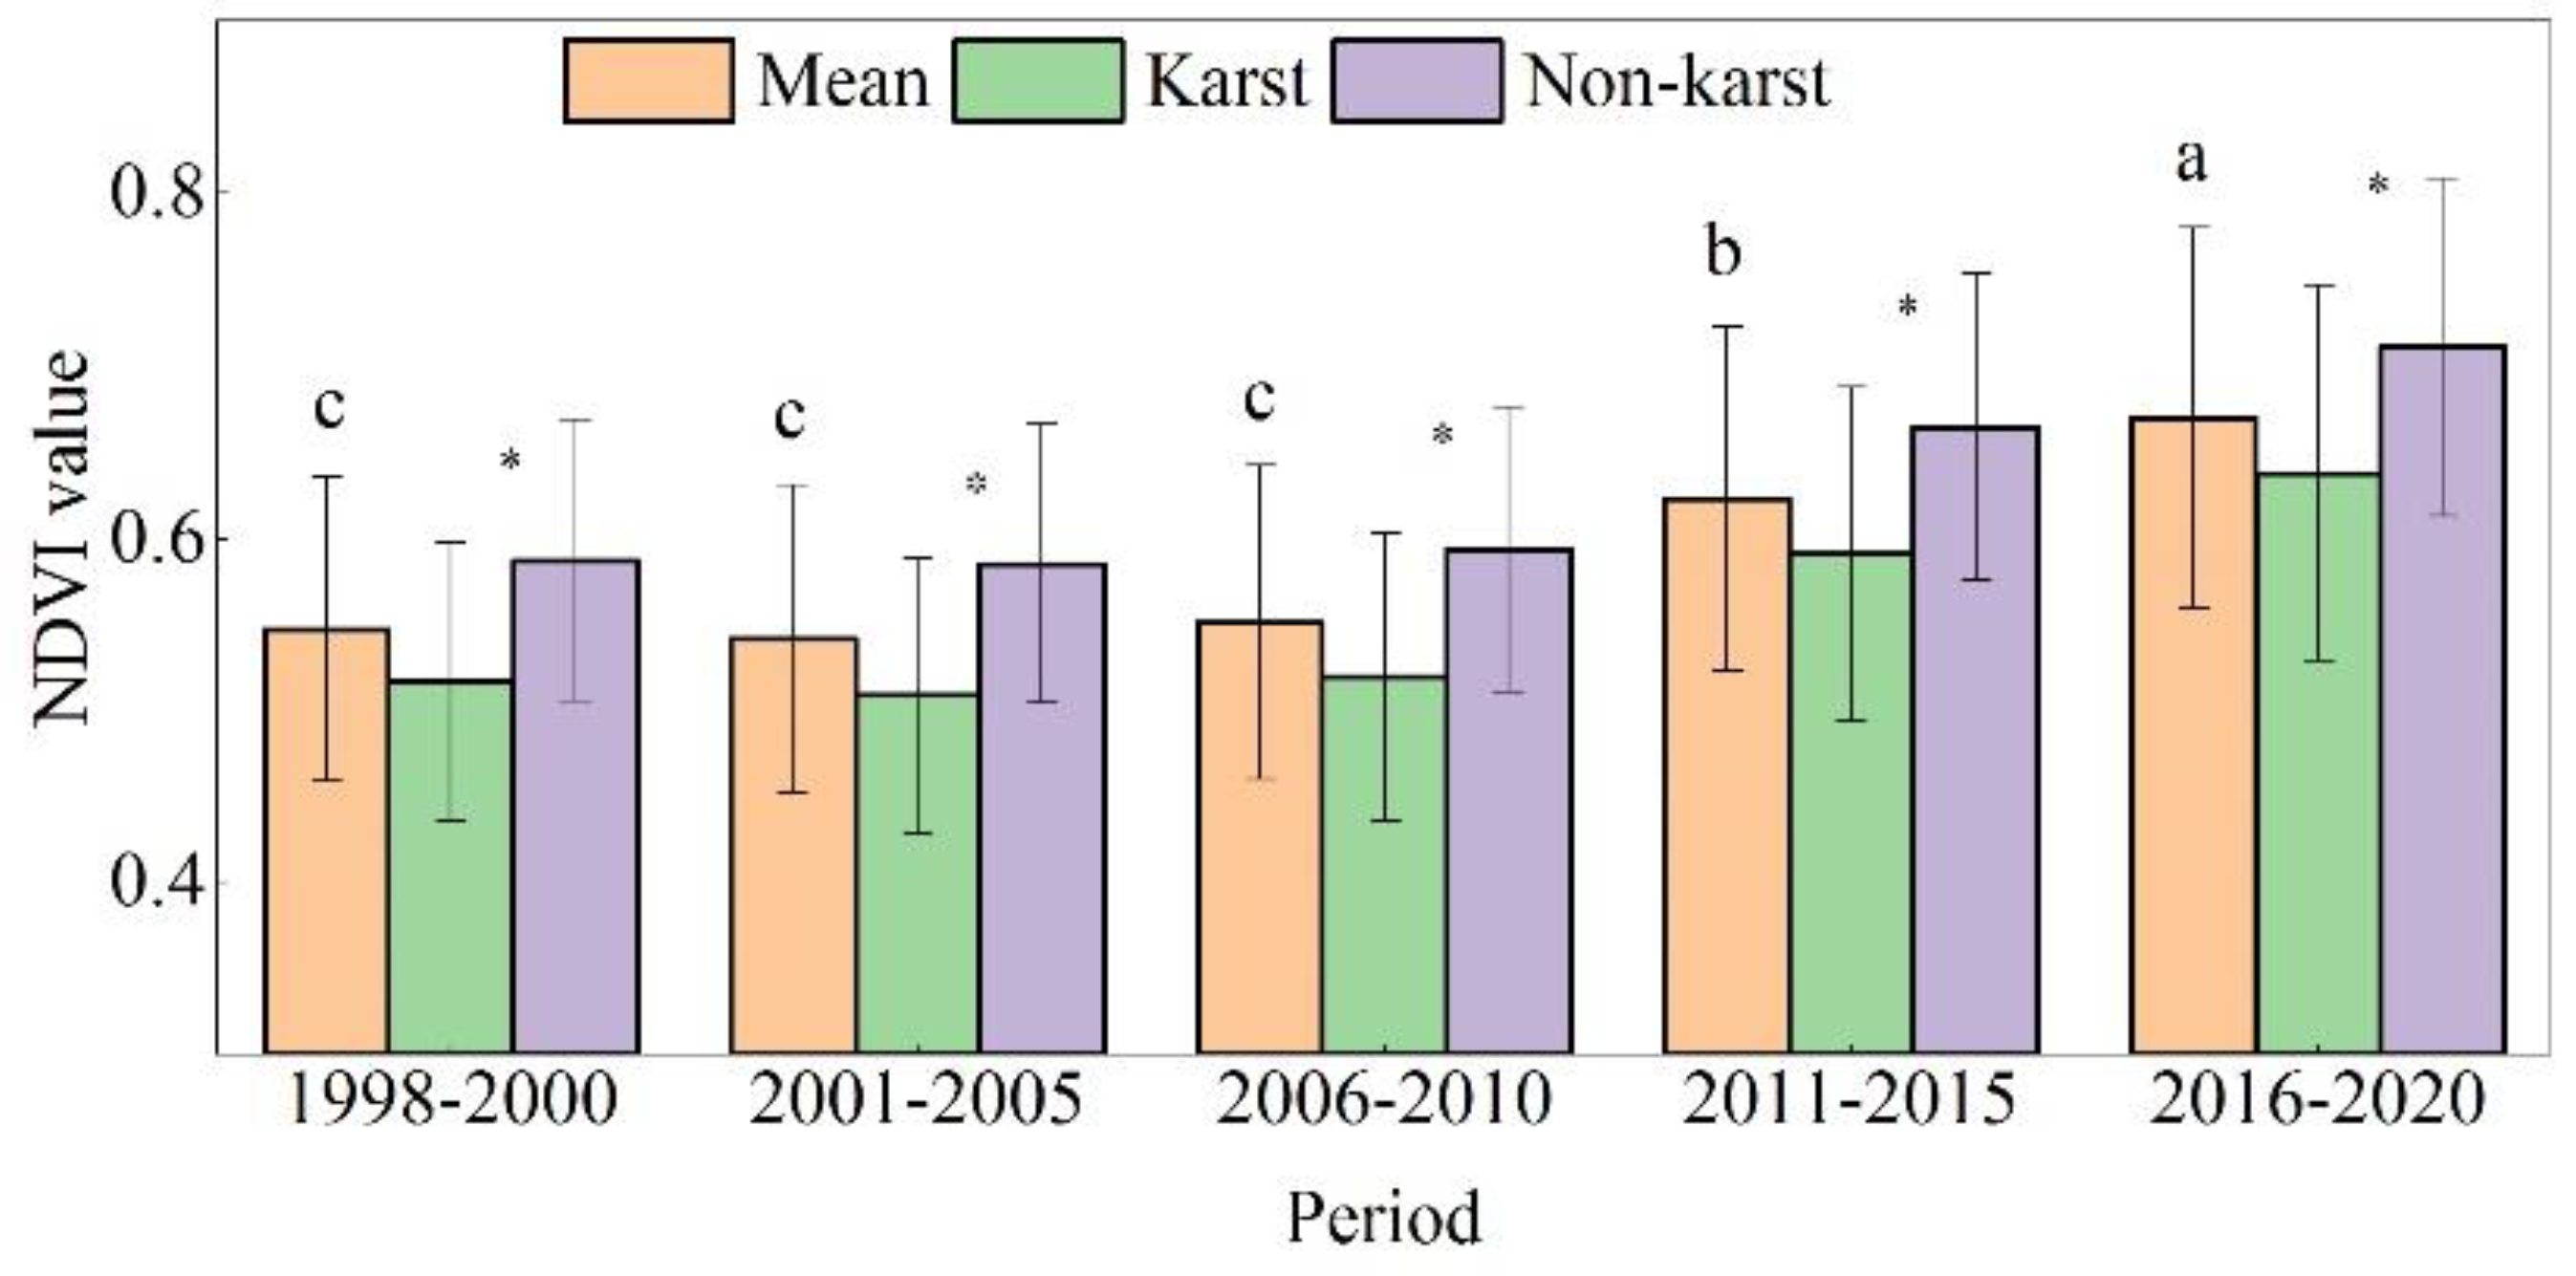
Figure 4.
Change in area proportion of different NDVI value ranges (A, 1998-2000; B, 2001-2005; C, 2006-2010; D, 2011-2015; E, 2016-2020).
Figure 4.
Change in area proportion of different NDVI value ranges (A, 1998-2000; B, 2001-2005; C, 2006-2010; D, 2011-2015; E, 2016-2020).
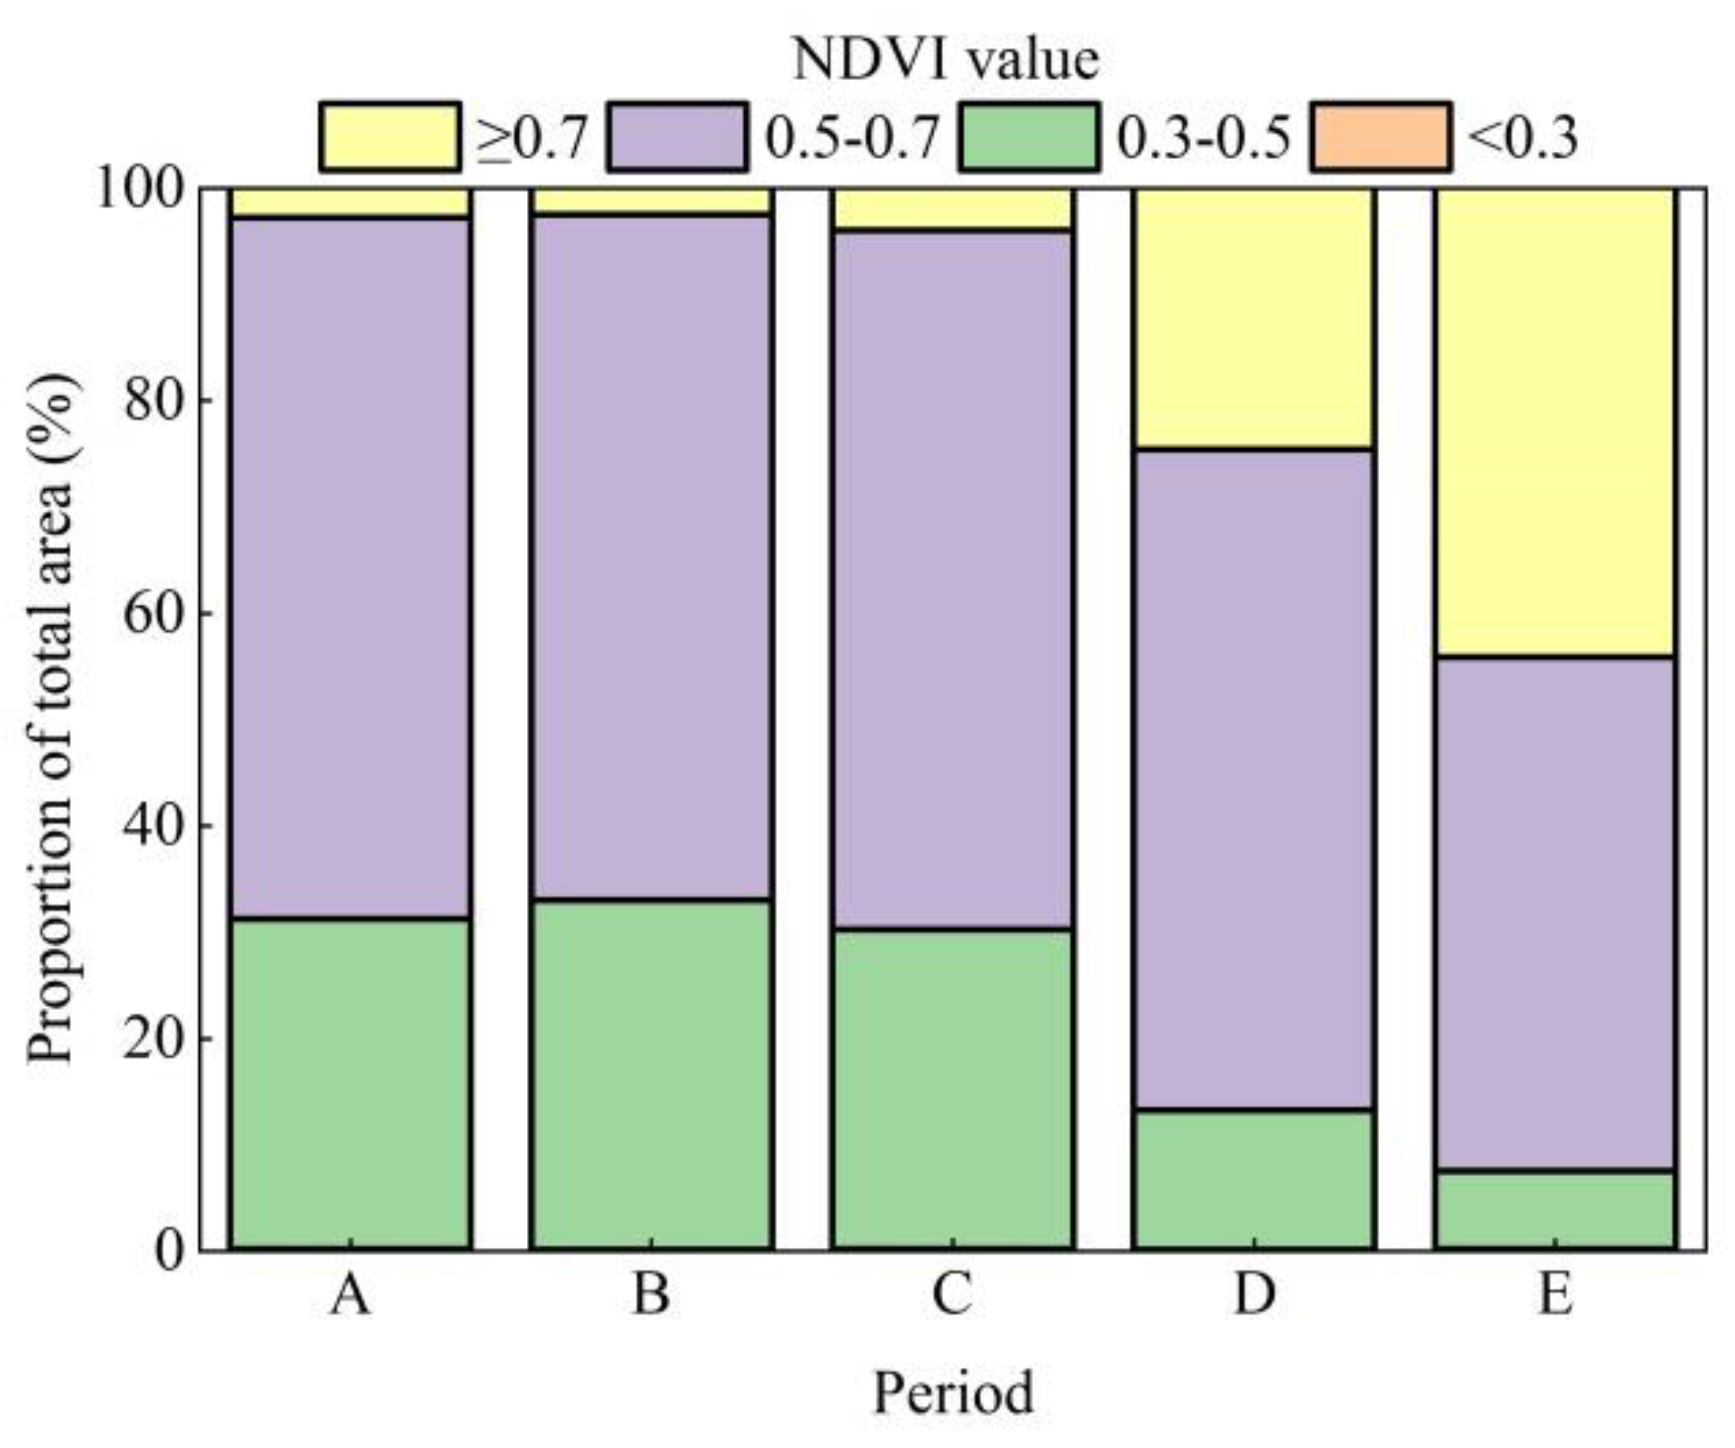
Figure 5.
The variation of NDVI value. (A, from 2000 to 2005; B, from 2000 to 2010; C, from 2000 to 2015; D, from 2000 to 2020).
Figure 5.
The variation of NDVI value. (A, from 2000 to 2005; B, from 2000 to 2010; C, from 2000 to 2015; D, from 2000 to 2020).
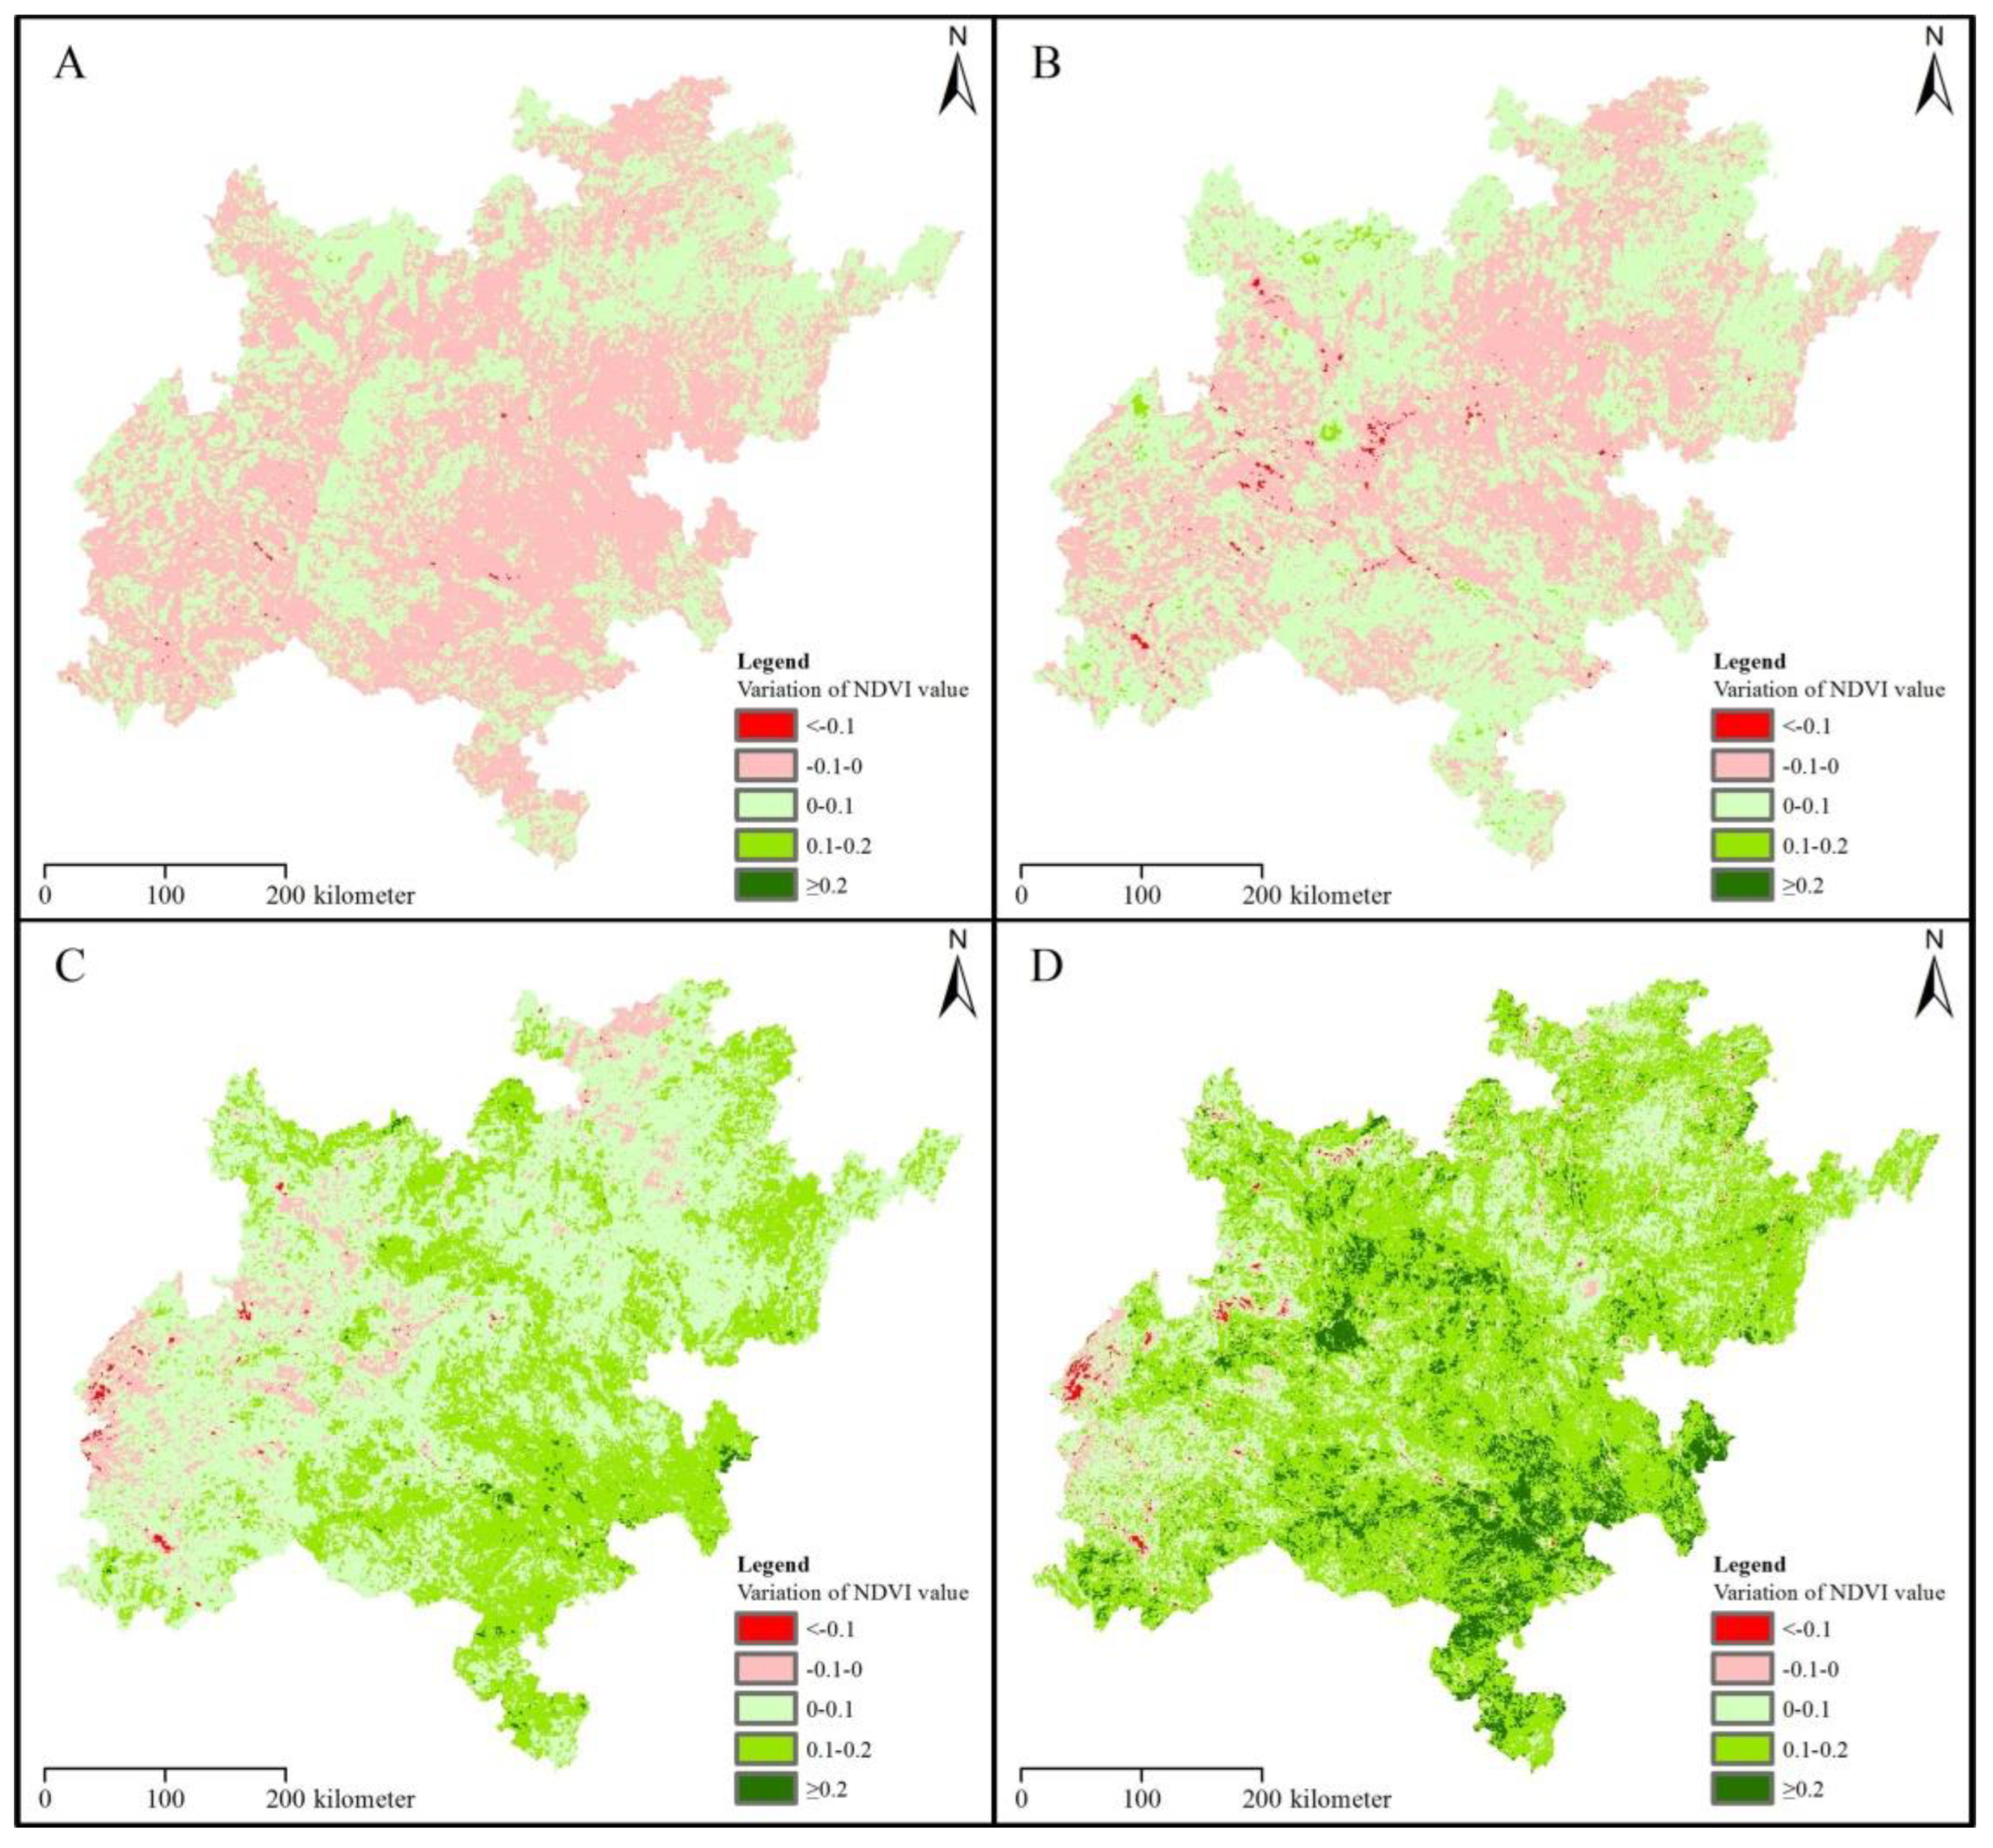
Figure 6.
Relationship between the proportion of four land use types, population, GDP, MAT, MAP, and NDVI value.
Figure 6.
Relationship between the proportion of four land use types, population, GDP, MAT, MAP, and NDVI value.
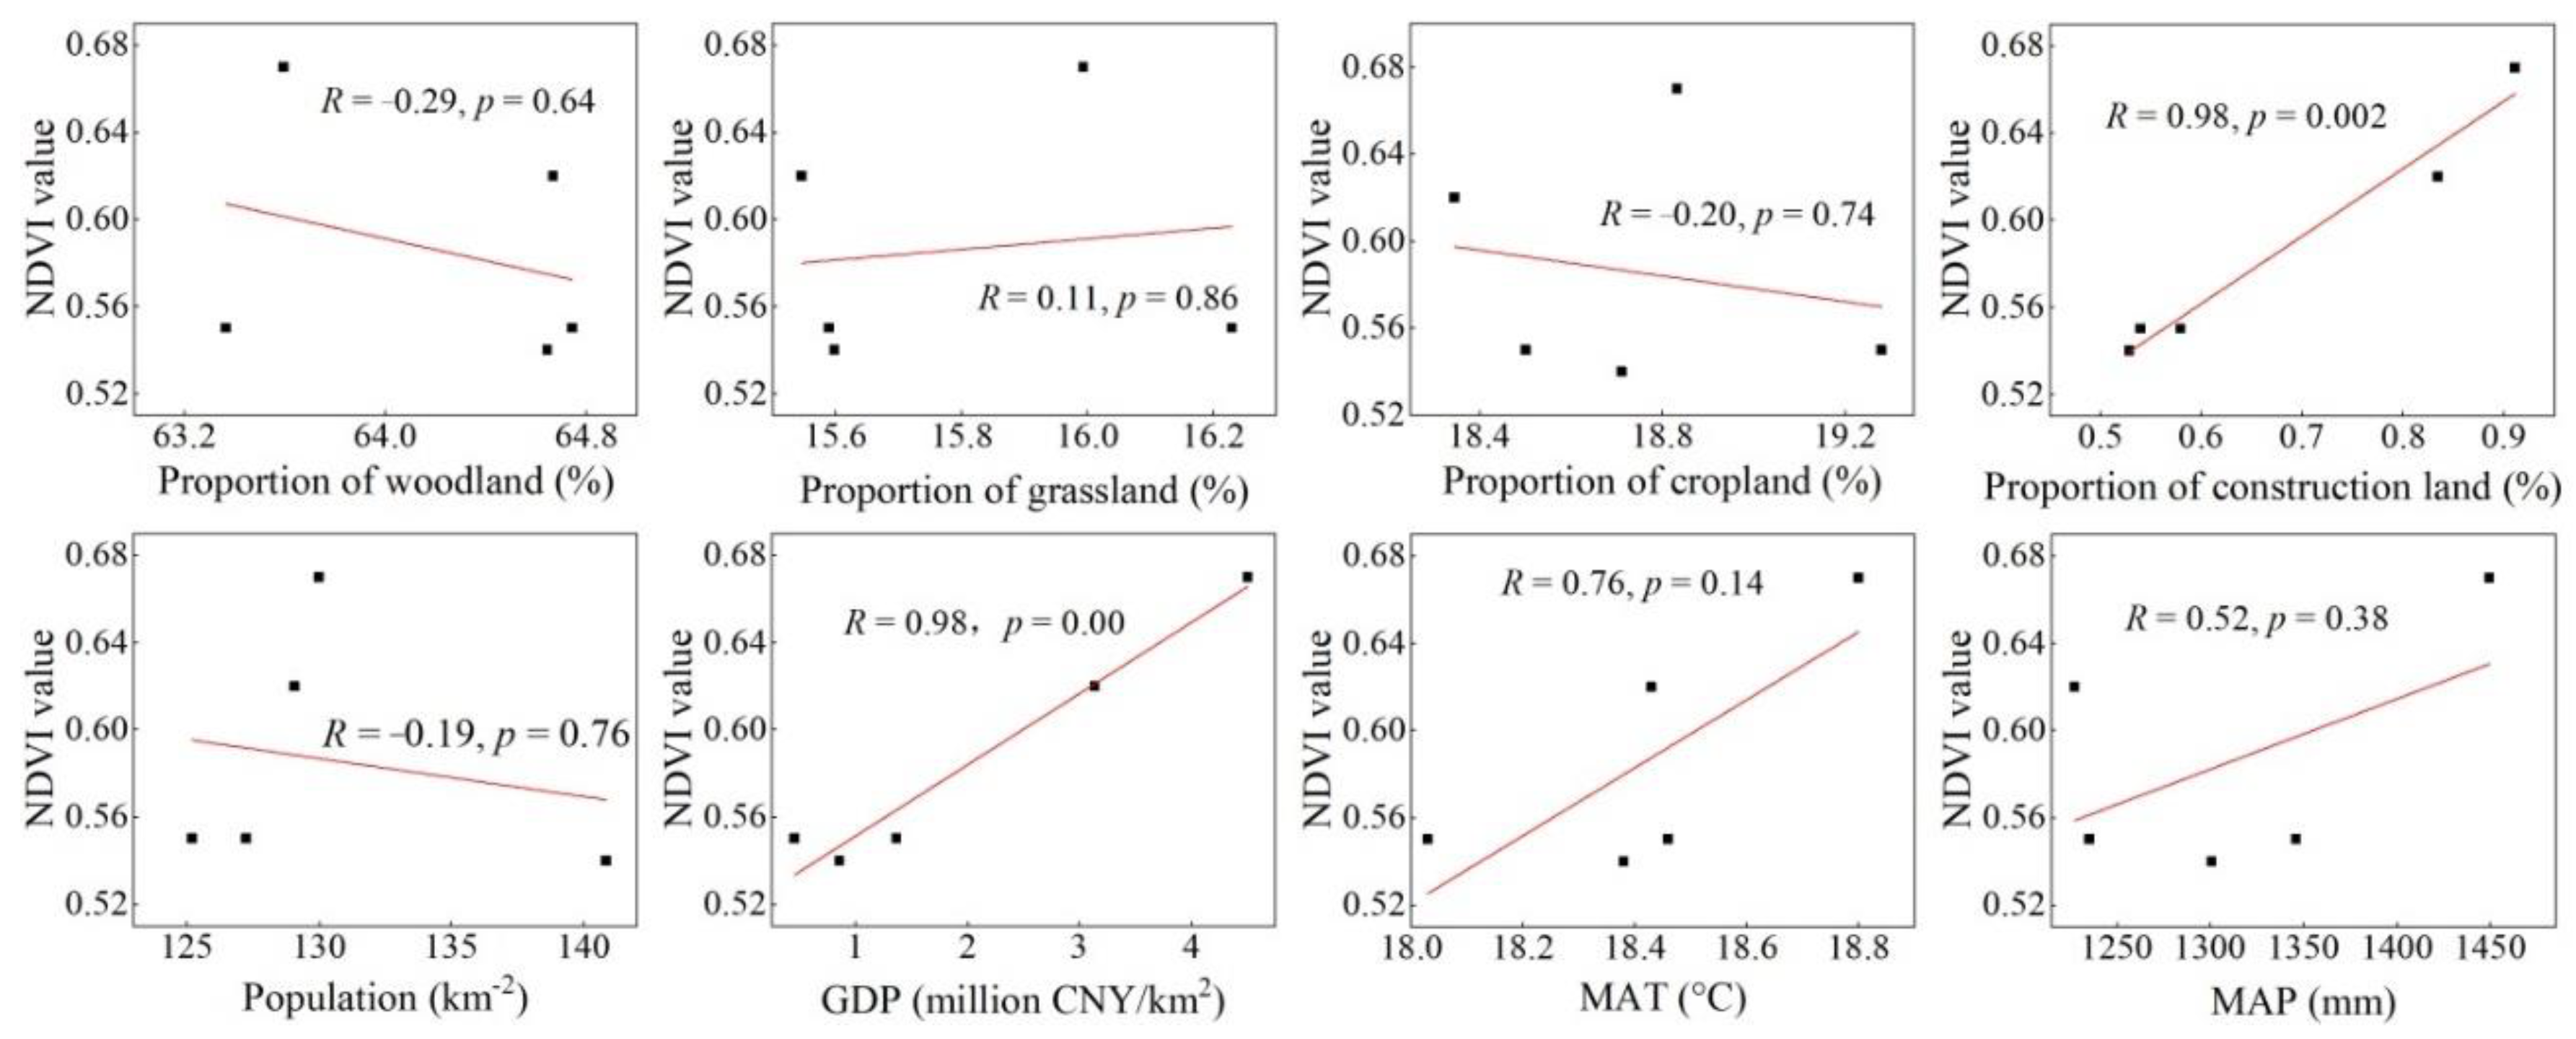
Figure 7.
Correlation between the variation of counties’ NDVI value and the variation in the proportion of woodland (A), grassland (B), cropland (C), construction land (D), population density (E), GDP (F), MAT (G), and MAP (H).
Figure 7.
Correlation between the variation of counties’ NDVI value and the variation in the proportion of woodland (A), grassland (B), cropland (C), construction land (D), population density (E), GDP (F), MAT (G), and MAP (H).
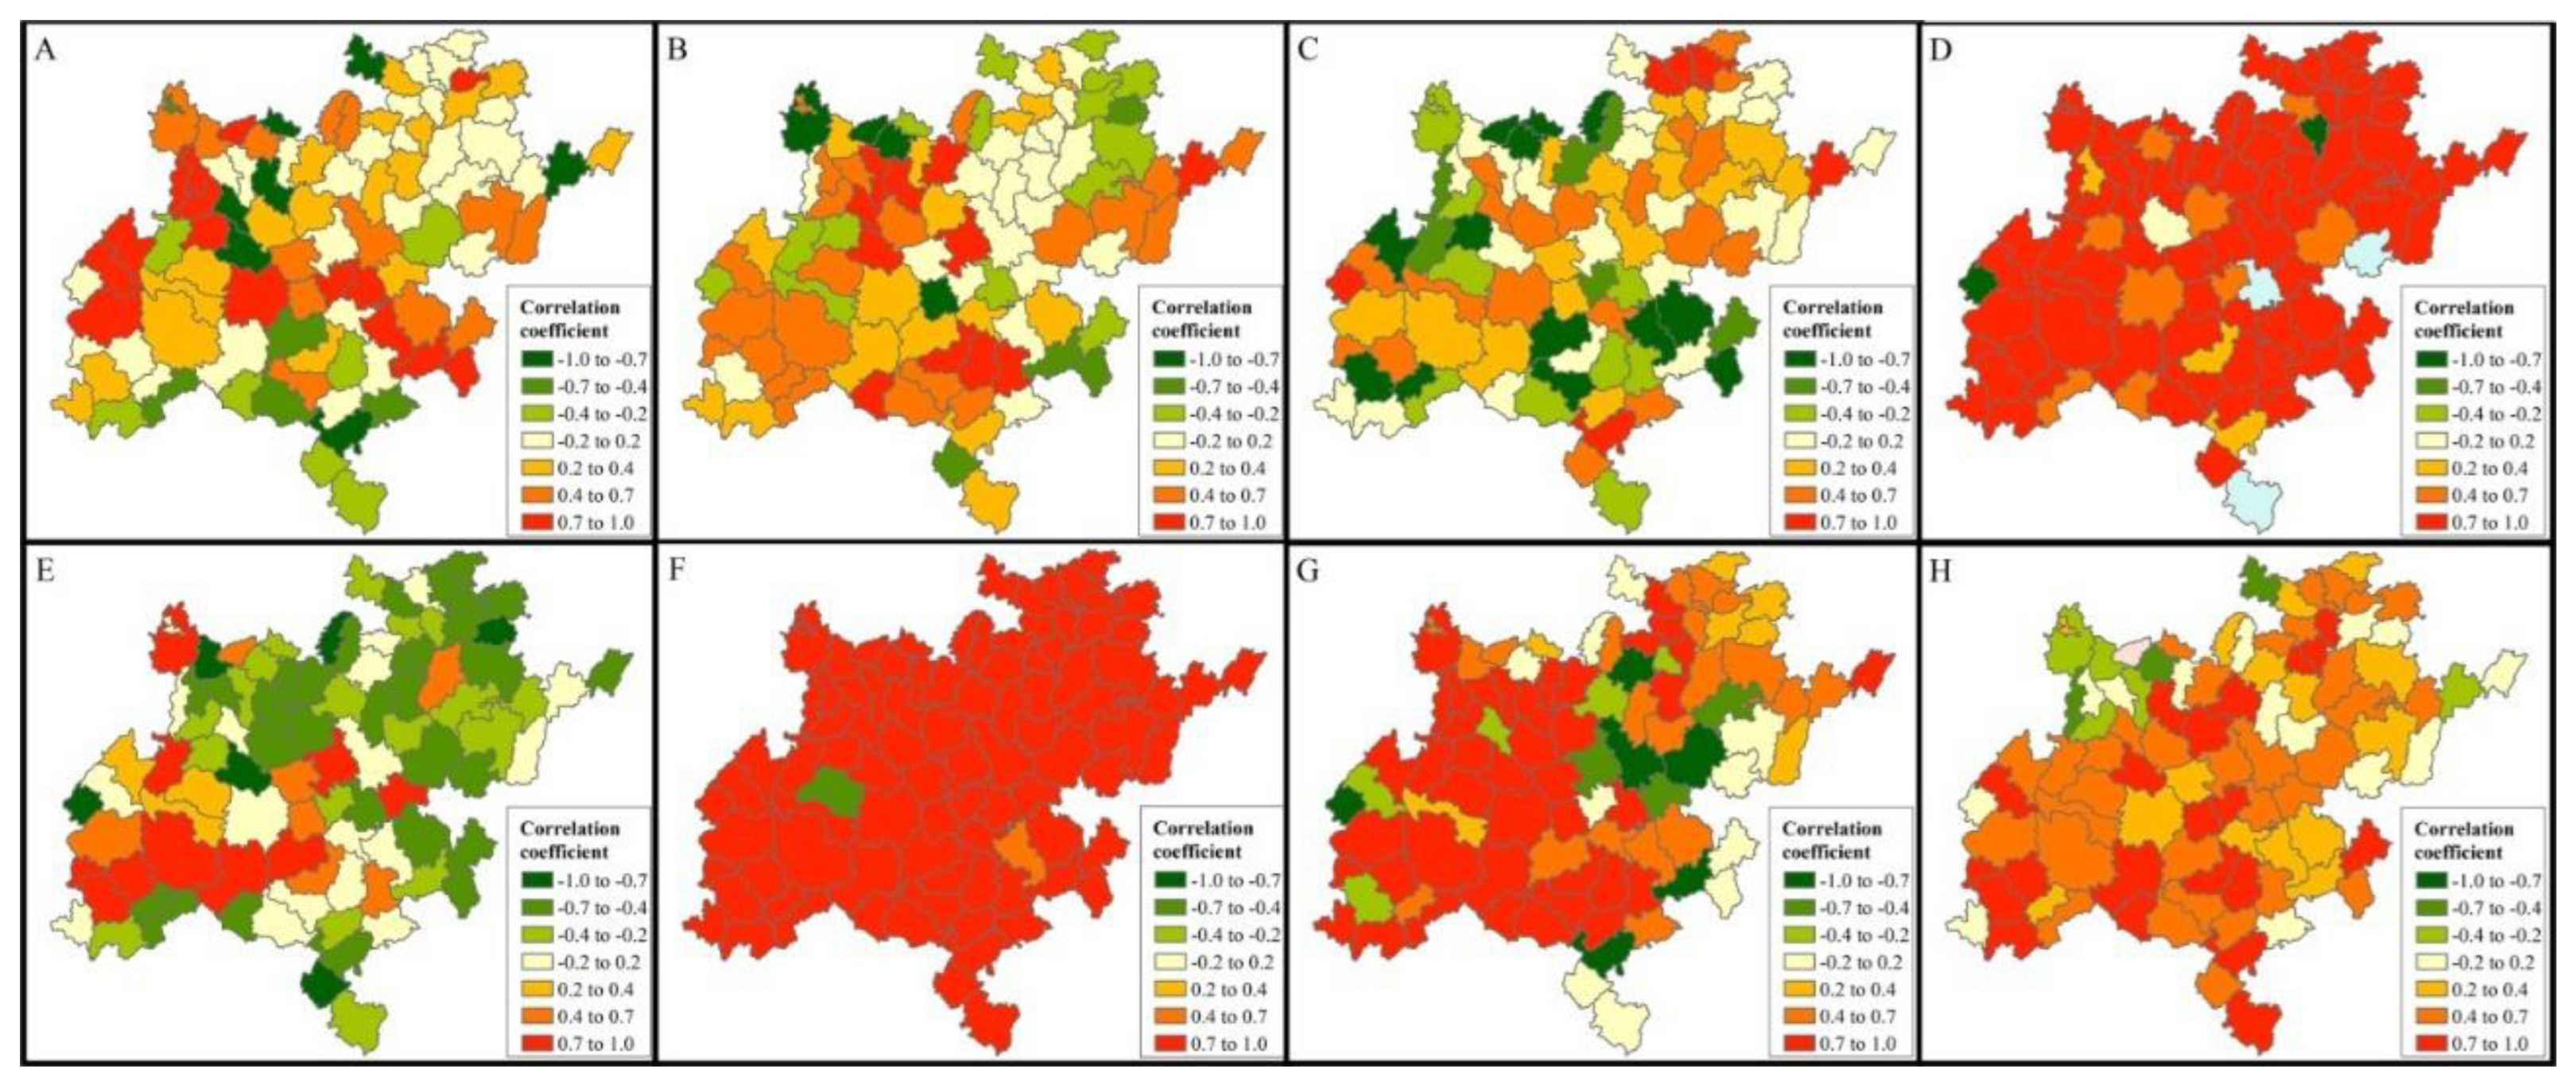

Table 1.
Change in the land cover in the study area.
| Land cover types | Area (km2) | |||||
| 2000 | 2005 | 2010 | 2015 | 2020 | ||
| Cropland | Total | 43720.90 | 42418.22 | 41941.03 | 41588.38 | 42695.31 |
| Karst area | 29167.92 | 30741.42 | 30428.68 | 30184.31 | 30358.75 | |
| Non-karst area | 14552.98 | 30741.42 | 30428.68 | 11404.08 | 12336.56 | |
| Woodland | Total | 143710.95 | 146540.36 | 146768.29 | 146593.69 | 144174.51 |
| Karst area | 72826.61 | 71522.50 | 71672.37 | 71589.05 | 71141.47 | |
| Non-karst area | 70884.34 | 75017.86 | 75095.92 | 75004.64 | 73033.04 | |
| Grassland | Total | 36810.54 | 35359.90 | 35339.28 | 35240.37 | 36259.12 |
| Karst area | 24648.34 | 24671.68 | 24788.36 | 24705.92 | 24654.22 | |
| Non-karst area | 12162.2 | 10688.22 | 10550.91 | 10534.45 | 11604.90 | |
| Construction land | Total | 1220.26 | 1198.60 | 1313.48 | 1892.49 | 2065.46 |
| Karst area | 772.73 | 850.24 | 871.56 | 1272.16 | 1518.83 | |
| Non-karst area | 447.53 | 348.36 | 441.91 | 620.34 | 546.63 | |
| Water area | Total | 1231.23 | 1172.67 | 1327.23 | 1372.25 | 1512.98 |
| Karst area | 644.52 | 665.11 | 689.74 | 698.03 | 775.12 | |
| Non-karst area | 586.71 | 507.57 | 637.49 | 674.21 | 737.85 | |
Table 2.
Dynamics of the NDVI value of cropland, woodland and grassland in the karst and non-karst area.
Table 2.
Dynamics of the NDVI value of cropland, woodland and grassland in the karst and non-karst area.
| Land cover type | Geology type | Year | ||||
| 2000 | 2005 | 2010 | 2015 | 2020 | ||
| Cropland | Non-karst area | 0.53 | 0.53 | 0.54 | 0.60 | 0.64 |
| Mean | 0.52 | 0.50 | 0.51 | 0.57 | 0.61 | |
| Karst area | 0.49 | 0.48 | 0.49 | 0.55 | 0.59 | |
| Forest | Non-karst area | 0.60 | 0.60 | 0.61 | 0.68 | 0.73 |
| Mean | 0.57 | 0.56 | 0.57 | 0.65 | 0.70 | |
| Karst area | 0.53 | 0.53 | 0.54 | 0.62 | 0.67 | |
| Grassland | Non-karst area | 0.56 | 0.56 | 0.57 | 0.63 | 0.68 |
| Mean | 0.50 | 0.51 | 0.52 | 0.58 | 0.63 | |
| Karst area | 0.49 | 0.49 | 0.50 | 0.56 | 0.61 | |
Table 3.
Contribution of the cropland, woodland, and grassland to the total NDVI value.
| Land cover types | Contribution to the total NDVI value (%) | |||||
| 2000 | 2005 | 2010 | 2015 | 2020 | ||
| Cropland | Total | 18.21 | 17.11 | 16.98 | 16.80 | 17.04 |
| Karst area | 11.43 | 12.01 | 11.96 | 11.84 | 11.78 | |
| Woodland | Total | 66.04 | 67.19 | 67.19 | 67.26 | 66.24 |
| Karst area | 31.52 | 30.73 | 30.89 | 31.28 | 31.33 | |
| Grassland | Total | 14.85 | 14.66 | 14.67 | 14.53 | 15.09 |
| Karst area | 9.81 | 9.76 | 9.83 | 9.77 | 9.86 | |
Table 4.
Variation in the population, GDP, MAT, and MAP.
| Factor | Year | ||||
| 2000 | 2005 | 2010 | 2015 | 2020 | |
| Population (km-2) | 127.25 | 140.87 | 125.21 | 129.07 | 130.01 |
| GDP(million CNY/km2) | 0.45 | 0.86 | 1.26 | 3.14 | 4.50 |
| MAT(°C) | 18.03 | 18.38 | 18.46 | 18.43 | 18.80 |
| MAP(mm) | 1346.01 | 1300.70 | 1235.43 | 1227.45 | 1449.53 |
Table 5.
Correlations between the variation of NDVI value at county level and the environmental variables.
Table 5.
Correlations between the variation of NDVI value at county level and the environmental variables.
| Environmental variables | Variation of NDVI value | ||
| 2000-2010 | 2011-2020 | 2000-2020 | |
| Variation in the construction land proportion | 0.09 | -0.42** | -0.15 |
| Variation in the cropland proportion | -0.05 | 0.09 | -0.03 |
| Variation in the woodland proportion | -0.13 | 0.03 | -0.18 |
| Variation in the grassland proportion | 0.20 | 0.02 | 0.16 |
| Variation of population density | -0.13 | -0.21 | -0.10 |
| Variation of GDP | 0.38** | -0.55** | -0.32** |
| Variation of MAT | 0.03 | -0.04 | -0.16 |
| Variation of MAP | 0.01 | 0.18 | 0.18 |
| Karst area proportion | 0.17 | -0.10 | -0.01 |
| Average elevation | 0.10 | -0.73** | -0.69** |
| NDVI value in the previous period | -0.28** | 0.20 | 0.13 |
| Construction land proportion in the previous period | 0.41** | -0.01 | 0.10 |
| Cropland proportion in the previous period | 0.37** | -0.57** | -0.39** |
| Woodland proportion in the previous period | -0.29** | 0.60** | 0.47** |
| Grassland proportion in the previous period | 0.09 | -0.42** | -0.39** |
| Population in the previous period | 0.48** | -0.46** | -0.20 |
| GDP in the previous period | 0.37** | -0.29** | -0.05 |
| MAT in the previous period | -0.14 | 0.71** | 0.67** |
| MAP in the previous period | -0.00 | 0.37** | 0.25** |
Note: * represents p<0.05, ** represents p<0.01. GDP represents gross domestic product; MAT represents mean annual temperature; MAP represents mean annual precipitation.
Disclaimer/Publisher’s Note: The statements, opinions and data contained in all publications are solely those of the individual author(s) and contributor(s) and not of MDPI and/or the editor(s). MDPI and/or the editor(s) disclaim responsibility for any injury to people or property resulting from any ideas, methods, instructions or products referred to in the content. |
© 2024 by the authors. Licensee MDPI, Basel, Switzerland. This article is an open access article distributed under the terms and conditions of the Creative Commons Attribution (CC BY) license (http://creativecommons.org/licenses/by/4.0/).
Copyright: This open access article is published under a Creative Commons CC BY 4.0 license, which permit the free download, distribution, and reuse, provided that the author and preprint are cited in any reuse.


