Submitted:
23 October 2024
Posted:
24 October 2024
You are already at the latest version
Abstract
The Loess Plateau is one of the most severely affected regions by soil erosion in the world, with a fragile ecological environment. Vegetation plays a key role in the region's ecological restoration and protection. Most existing studies focus on the trends of vegetation cover change, while fewer studies investigate the driving factors or only conduct quantitative analyses. This study uses the Geodetector (Geographic Detector Model) to assess the impact of natural and human factors such as temperature, precipitation, soil type, and land use on vegetation growth, revealing the characteristics and driving mechanisms of vegetation cover changes on the Loess Plateau from 1982 to 2022. It also quantitatively calculates the influence of different factors. The findings indicate that vegetation cover on the Loess Plateau has generally risen from 1982 to 2022, but there was a noticeable difference around 2000. The annual mean slope of vegetation cover from 1982 to 2000 was 0.00129, which increased to 0.01075 from 2000 to 2022. The Geodetector indicates that the factors with the greatest impact on vegetation cover in the Loess Plateau are temperature, precipitation, soil type, and land use, and the interaction between these factors has a greater effect on vegetation cover than any single factor alone. This study identifies the ideal ranges or types for vegetation growth on the Loess Plateau over four time periods, offering a scientific basis for soil restoration and soil and water conservation efforts in the area.
Keywords:
Loess Plateau
; NDVI
; Vegetation Cover
; Land Use
; Geographic Detector Model
1. Introduction
Vegetation is a vital element of the Earth's ecosystem [1] and plays a crucial role in influencing soil erosion on the Loess Plateau [2]. In semi-arid environments, the distribution pattern of vegetation is a major driving force and a preventive measure against soil erosion [3]. Fractional Vegetation Cover (FVC) represents the proportion of the ground area covered by the vertical projection of vegetation, including leaves, stems, and branches, relative to the total area of a given region. It is a widely used parameter for evaluating the relationship between vegetation and soil erosion [4], often used to reflect ecological and environmental issues and, to some extent, assess changes in the region’s ecological environment [5,6,7,8,9].
There are three main methods to calculate vegetation cover: simple visual estimation, instrument measurement, and remote sensing interpretation [10]. In recent years, with the increasing number of satellites, the quality and availability of remote sensing images have significantly improved, leading to substantial progress in remote sensing estimation of vegetation cover. The Normalized Difference Vegetation Index (NDVI) [11], due to its spectral sensitivity to green plants, is often used in studies of vegetation conditions [12,13,14]. Studies have proven that NDVI can accurately estimate vegetation cover [15,16]. Many researchers now use pixel binary models with NDVI to estimate vegetation cover [17,18,19], while others use pixel ternary models for estimation [20,21].
In addition, there are various methods for obtaining vegetation cover from remote sensing images. For instance, Okin et al. used MODIS imagery data and three different spectral mixture analysis (SMA) methods: simple SMA, multiple endmember SMA (MESMA), and relative SMA (RSMA), to evaluate the effectiveness of extracting vegetation and soil cover [22]. Muchoney et al. used a global supervised classification model on MODIS data to extract vegetation with an accuracy of 75-88% [23]. Stojanova et al. combined LiDAR and Landsat satellite data with machine learning algorithms to generate predictive models of forest attributes and extract vegetation cover [24].
The Loess Plateau has long experienced severe soil erosion, and human activities have caused environmental degradation and exacerbated soil erosion [25]. To address the increasingly serious soil erosion on the Loess Plateau, China has implemented various projects since the late 1990s, such as returning farmland to forest and grassland [26,27,28], to mitigate soil erosion and enhance land quality. Changes in vegetation cover significantly affect soil erosion, so studying the spatial-temporal characteristics of vegetation cover on the Loess Plateau has guiding significance for soil restoration and conservation.
Previous studies on the spatial-temporal changes in vegetation cover mostly used qualitative analysis, but were unable to quantitatively evaluate the influencing factors. In this study, we use the Geodetector model to quantitatively analyze the driving factors. The Geodetector, first developed by Wang Jingfeng et al. [29,30], is a spatial analysis model that detects spatial differentiation and reveals the underlying driving forces. It overcomes the limitations of traditional mathematical-statistical models, which often involve a large number of parameters, numerous assumptions, and isolated factors [31]. Vegetation cover change on the Loess Plateau is influenced by multiple factors. The Geodetector allows for comprehensive analysis of these factors. By calculating and comparing the q-values of individual factors with the combined q-values of two factors, we can assess the existence of an interaction between the two factors, as well as the strength and direction of this interaction, and determine whether it is linear or nonlinear. Additionally, by analyzing the response of vegetation cover to single and multiple factors under four different detectors, we can more precisely identify the critical factors affecting vegetation growth and examine the optimal ranges that enhance this growth [32].
2. Materials and Methods
2.1. Studu Area
The Loess Plateau is located in the central-northern part of China (100-114°E, 33-41°N), primarily encompassing parts of seven provinces: Shaanxi, Gansu, Ningxia, Qinghai, Shanxi, Inner Mongolia, and Henan (Figure 1). The total area of the loess region on the Loess Plateau is 635,000 km², making it one of the most severely affected regions by soil erosion in the world. The topography of the Loess Plateau descends from the higher northwest to the lower southeast, with mountains, hills, and plateaus being the primary landform type. The Loess Plateau experiences a typical temperate continental monsoon climate, marked by cold, dry winters and hot, rainy summers, along with considerable temperature fluctuations between day and night. Influenced by monsoon circulation, precipitation on the Loess Plateau decreases progressively from around 700 mm in the southeast to about 100 mm in the northwest. The main land use types on the Loess Plateau include forest land, grassland, and farmland, with forest land having the highest proportion.
2.2. Data Sources
NDVI data comes from the 1982–2015 GIMMS NDVI and the 2001–2022 MODIS NDVI datasets. The GIMMS NDVI13g dataset, promoted by NASA, features a spatial resolution of 8 km and a temporal resolution of 15 days. The MOD13A3 dataset has a spatial resolution of 500 m. NDVI data from both datasets were processed in ArcGIS through projection transformation and mask extraction.
Soil type and land use data are from the National Glaciology and Desert Science Data Center (http://www.ncdc.ac.cn), with a spatial resolution of 30 m and a time series covering 1985 to 2022. This dataset was constructed by Yang Jie and Huang Xin from Wuhan University using 335,709 Landsat images on the Google Earth Engine [33]. It represents the first annual land cover product for China based on Landsat, spanning from 1985 to 2022 (CLCD). The dataset integrates stable samples from the China Land Use/Cover Dataset (CLUD) with training samples derived from visual interpretation of satellite time series data, as well as imagery from Google Earth and Google Maps. Temporal metrics from all available Landsat data were input into a random forest classifier to generate classification results. The experiment divided land use into six categories based on land use classification standards: farmland, forest land, grassland, water bodies, construction land, and unused land [34].
Meteorological data was supplied by the National Tibetan Plateau Data Center, featuring a spatial resolution of 1 km and covering the period from January 1982 to December 2020. The dataset was generated for China using data from CRU and WorldClim, following the Delta spatial downscaling scheme. Temperature and precipitation data were spatially interpolated using the Thin Plate Spline (TPS) and Kriging interpolation methods. Projection coordinate transformations were applied to the results to obtain monthly and annual meteorological raster data corresponding to the NDVI data [35,36].
Elevation data from the ASTER GDEM was obtained from the Geospatial Data Cloud platform of the Chinese Academy of Sciences (http://www.gscloud.cn), offering a spatial resolution of 30 m. After mosaicking and cropping, digital elevation data for the Loess Plateau was obtained. Slope and aspect data for the Loess Plateau were derived using ArcGIS software based on the elevation data. GDP and population density data were sourced from the Resource and Environmental Science and Data Center of the Chinese Academy of Sciences (https://www.resdc.cn).
2.3. Method
2.3.1. Pixel Binary Mode
In remote sensing estimation methods for vegetation cover, the pixel dichotomy model is one of the more commonly used approaches. This model assumes that the surface of a pixel consists of both vegetated and non-vegetated areas, and the proportion of the vegetated area within the pixel represents the fractional vegetation cover (FVC) for that pixel. By establishing a conversion relationship between the Normalized Difference Vegetation Index (NDVI) and FVC, the vegetation cover information within the pixel can be extracted. Finally, the FVC for each pixel is calculated to determine the vegetation cover across the entire study area. The formula for calculating FVC is as follows:
Where FVC represents the fractional vegetation cover, NDVIsoil refers to the NDVI value of pixels in non-vegetated or bare soil areas, and NDVIveg denotes the NDVI value of pixels fully covered by vegetation. To eliminate the influence of outliers in NDVI values, this study selects the 5% to 95% range of cumulative pixel percentages as the confidence interval. That is, NDVIsoil corresponds to the NDVI value at the 5th percentile of the cumulative pixel percentage, while NDVIveg corresponds to the NDVI value at the 95th percentile of the cumulative pixel percentage.
2.3.2. Theil-Sen Median
The Theil-Sen Median method, also referred to as Sen's slope estimator, is a robust non-parametric statistical technique for calculating trends. It is computationally efficient, resistant to measurement errors and outliers, and well-suited for analyzing trends in long-term time series data. It is referred to as "the most popular non-parametric technique for estimating linear trends" [37]. The calculation formula is as follows:
In the formula, n represents the number of study years, Xᵢ and Xⱼ are the FVC values for the ith and jth years, respectively, and ρ represents the trend. When ρ < 0, it indicates that the FVC is showing a downward trend over time; when ρ > 0, it indicates that the FVC is showing an upward trend over time.
2.3.3. Mann-Kendall
The Mann-Kendall test is a non-parametric technique used to evaluate trends in time series data. It does not require the data to adhere to a normal distribution and remains unaffected by missing values and outliers, making it ideal for testing significant trends in lengthy time series datasets. In this study, the MK values for the vegetation cover time series on the Loess Plateau from 1982 to 2022 were calculated on a pixel-by-pixel basis and visualized.
The calculation formula for the test is as follows:
Where:
In the formula, S represents the test statistic, and the rejection region is ,This means that when |Z| is exceeds 1.65, 1.96, and 2.58, it signifies that the vegetation trend has successfully passed significance tests at confidence levels of 90%, 95%, and 99%, respectively.
The combination of Theil-Sen Median trend analysis and Mann-Kendall significance testing demonstrates a good effect in assessing trend changes in long time series data, and it is widely used in vegetation analysis [38].
2.3.4. Geographic Detector Model
This study utilizes the geographic detector model to investigate the driving mechanisms behind vegetation cover changes on the Loess Plateau. This model consists of four components: factor detection, interaction detection, risk detection, and ecological detection.
(1) Factor detector: Factor detection is employed to assess the degree to which each factor accounts for the spatial differentiation of vegetation cover changes on the Loess Plateau. The calculation formula is as follows:
In the formula, the value of q ranges from (0, 1). The magnitude of the q value indicates the explanatory power of the factor regarding spatial changes in vegetation cover; a higher value signifies a stronger influence of that factor on the spatial variation of vegetation cover. h = 1,…, L represents the stratification of various natural and anthropogenic factors X, as shown in Table 1. For convenience in the study, all factors were resampled to a spatial resolution of 1 km.
(2) Risk detection: Risk detection involves calculating the average vegetation cover for a particular influencing factor across different sub-regions, followed by statistical analysis and significance testing of the results. Based on the average values and their significance, the suitable growth range for vegetation is determined. Regions with higher FVC mean values are considered suitable for vegetation growth.
(3) Interaction Detection: Interaction detection is used to identify whether the combined effects of two different factors enhance or weaken their influence on the spatial differentiation of the dependent variable. q(x1) and q(x2) represent the q values of the two different factors affecting vegetation cover. By comparing the interaction effect with the sum of q(x1)、 q(x2) and q(x1∩x2),we can determine whether the interaction of factors x₁ and x₂ promotes or suppresses vegetation cover. The specific comparison method is shown in Table 2.
3. Results
3.1. Temporal and Spatial Changes in Vegetation Coverage
3.1.1. Temporal Changes
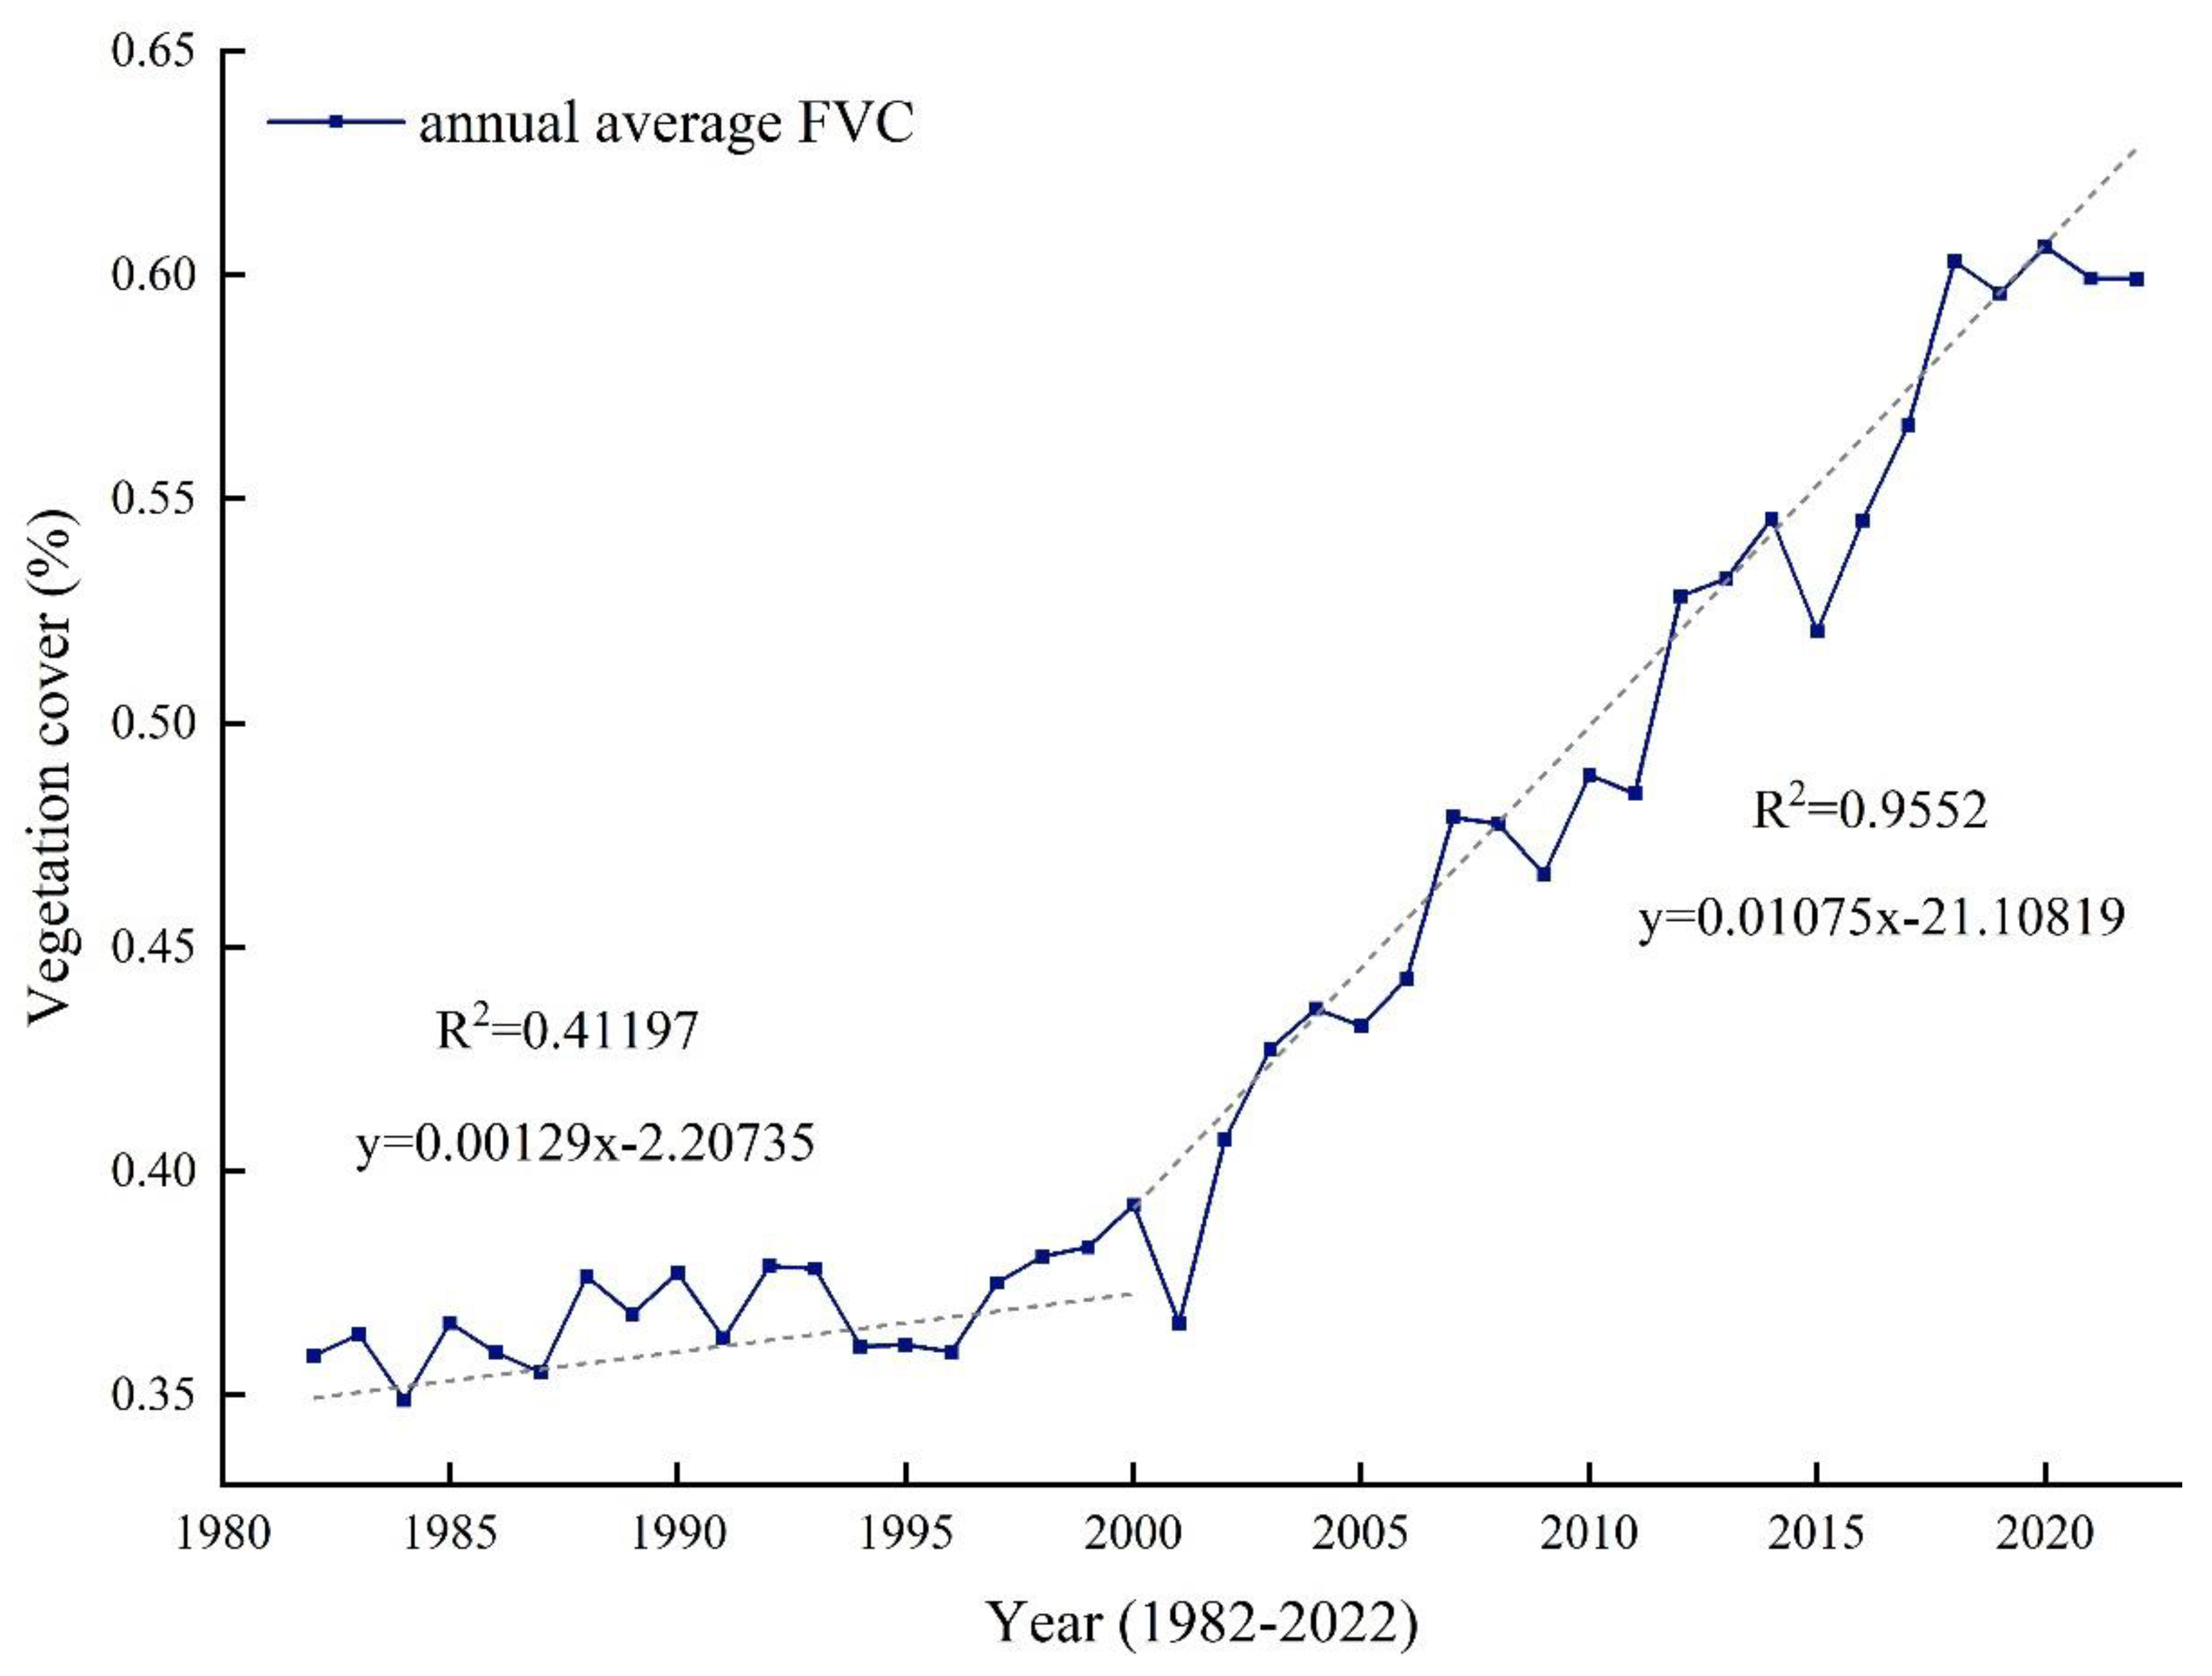
Figure 2 shows the changes in the mean vegetation cover on the Loess Plateau from 1982 to 2022. As illustrated, the interannual mean vegetation cover has shown an overall upward trend over the past 41 years, but there is a notable difference around the year 2000. Between 1982 and 2000, the vegetation cover on the Loess Plateau exhibited fluctuations with a slight overall increase, with a slope of 0.00129. From 2000 to 2022, the average vegetation cover on the Loess Plateau experienced some degree of fluctuation, but the overall upward trend is more pronounced, with a slope of 0.01075.
Figure 2.
Annual mean FVC changes in the Loess Plateau from 1982 to 2022.
3.1.2. Spatial Differentiation
Figure 3 illustrates the trends in vegetation cover changes across different regions of the Loess Plateau from 1982 to 2022. As shown, over the past 41 years, the vegetation cover in most areas of the Loess Plateau has demonstrated a highly significant upward trend, while a small number of areas show a significant upward trend. Some regions exhibit no obvious trend, primarily consisting of established forested land. A very small portion of the area has shown a significant or highly significant downward trend due to the increase in construction land.
This section may be divided by subheadings. It should provide a concise and precise description of the experimental results, their interpretation, as well as the experimental conclusions that can be drawn.
3.2. Analysis of the Driving Factors of Vegetation Cover Changes
3.2.1. Factor Detector
The factor detector calculates the q values to investigate the extent to which each factor influences vegetation cover. Among the various factors, the p values serve as significance tests for the q values, all of which are less than 0.05, indicating that the q values of both natural and anthropogenic factors have statistical significance. Table 3 presents the q values of each factor for the years 1994, 2000, 2010, and 2020. Notably, the q values for temperature, precipitation, soil type, and land use are all greater than 0.2, indicating that these factors are the primary driving elements with the most significant impact on the spatial changes in vegetation cover on the Loess Plateau.
From the analysis of the explanatory power of multiple factors on vegetation cover changes during different research periods (Table 3), it can be observed that in 1995, land use type had the greatest impact on vegetation cover. During this period, policies such as returning farmland to forest and afforestation were implemented, resulting in significant changes in land use on the Loess Plateau, with some farmland and grassland being converted into forest land. Temperature and precipitation were the most significant factors affecting vegetation cover in 2000, 2010, and 2020. Interestingly, in 1995, in addition to land use type, temperature and precipitation emerged as the key influential factors, highlighting their critical role in vegetation growth. Soil type maintained a stable and relatively high level of influence on vegetation cover across all four time periods, underscoring its significant impact on vegetation cover. In contrast, factors such as elevation, slope, aspect, GDP, and population density had relatively minor influences on vegetation cover and thus are not considered important influencing factors.
3.2.2. Risk Detector
Precipitation is a key factor affecting vegetation growth. With the continuous increase in precipitation, vegetation cover also shows an increasing trend. Using the natural breaks classification method in ArcGIS, precipitation was divided into 10 intervals, represented by the numbers 1 to 10, as shown in Table 4. Table 5 presents the average FVC values under different precipitation intervals. The results indicate a positive correlation between precipitation and average FVC; within the effective data range, higher precipitation leads to better vegetation growth conditions.
Temperature has a direct impact on the photosynthesis, respiration, and transpiration of vegetation. Extreme temperatures, whether too low or too high, affect the growth and developmental physiological processes of plants. Using the natural breaks classification method, temperature was divided into 10 intervals, represented by the numbers 1 to 10 (Table 6). Table 7 presents the average FVC values for different temperature intervals. Overall, the increase in temperature results in a trend where the average vegetation cover first rises, then falls, and then rises again. The average FVC values for each year exhibit two peaks in intervals 2, 3, and 9, 10.
Under different soil types, significant differences in average vegetation cover are observed due to variations in soil moisture content and organic matter content. The soil classification standards are divided into 15 categories, represented by their corresponding numbers (Table 8). The results indicate that leached soil, semi-leached soil, and alpine soil have a favorable promoting effect on vegetation growth.
Land use is categorized into 6 intervals, represented by the numbers 1 to 6 (Table 9). It can be noted that the average vegetation cover for unused land is the lowest, remaining below 0.2. In contrast, forest land corresponds to the largest vegetation cover area, with an average above 0.9 during the study period.
3.2.3. Interaction Detector
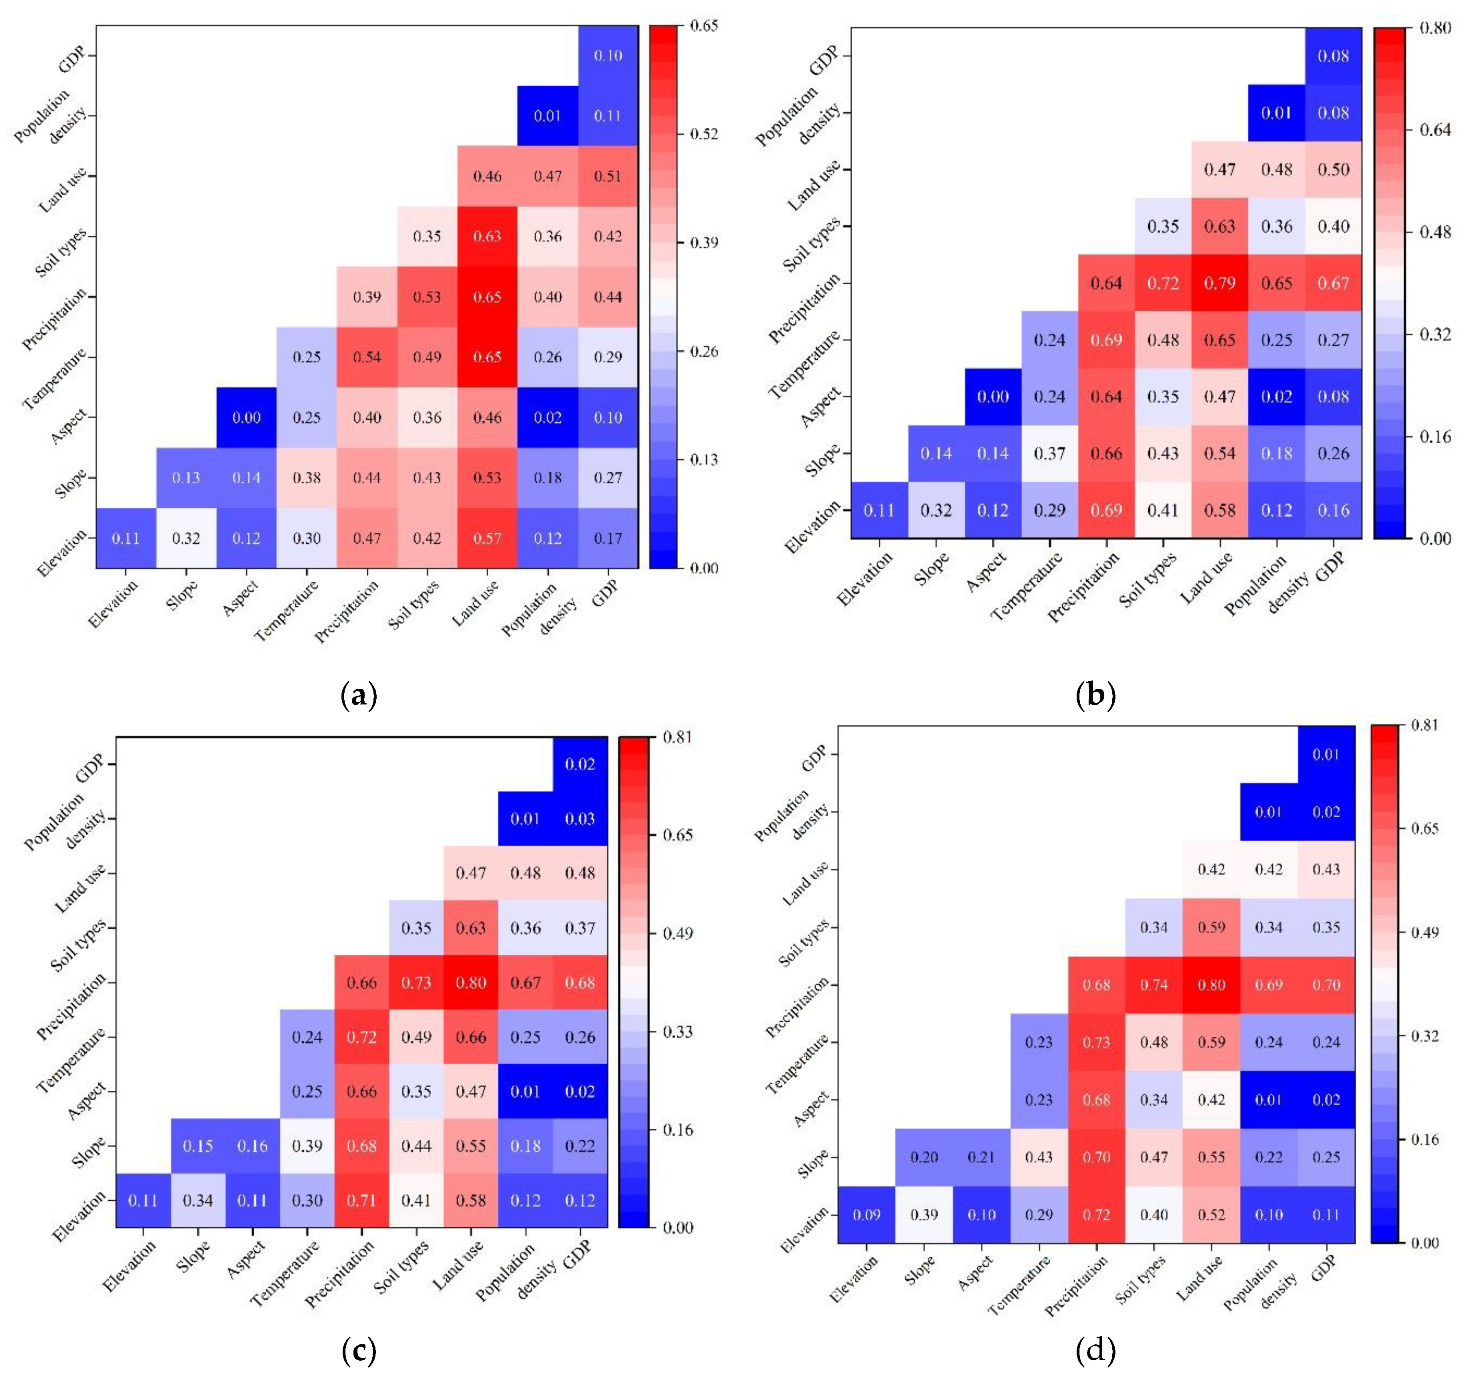
To examine the changes in vegetation cover influenced by the interaction between natural and human factors, an interaction detector was employed to analyze the interactions of nine factors in 1995, 2000, 2010, and 2020. The explanatory power of the interaction among various driving factors is shown in Figures 4–7. The results indicate that in 1995, the q value of the interaction between land use and temperature and precipitation was the highest at 0.65, making it the most prominent influence among the three factors during that study period. In 2000, 2010, and 2020, the two factors with the highest influence on vegetation cover under interaction were land use and precipitation, with q values of 0.79, 0.80, and 0.80, respectively. This indicates that human factors represented by land use, along with the natural factors of precipitation and temperature, play a key role in the changes of vegetation cover in the study area. Overall, the influence of different driving factors on vegetation cover under interaction is greater than that of single factors acting independently
Figure 2.
Detection of interaction effects of various factors in 1995,2000,2010,2020: (a) Detection of interaction effects of various factors in 1995; (b) Detection of interaction effects of various factors in 2000; (c) Detection of interaction effects of various factors in 2010; (d) Detection of interaction effects of various factors in 2020.
The analysis of the interaction between various factors affecting the spatial differentiation of vegetation cover (Table 10) reveals that, over the study period, the interactions among factors fell into two categories: nonlinear enhancement and dual-factor enhancement.
4. Discussion
4.1. Suitable Growth Ranges for Vegetation
Taking temperature, precipitation, soil type, and land use—four factors that significantly influence vegetation coverage—as examples, the average vegetation coverage under different driving factor ranges is analyzed and discussed. The suitable ranges for each driving factor are shown in Table 15. In 1995, 2000, 2010, and 2020, the suitable ranges for land use and soil type remained consistent, with the highest average FVC values found in areas where land use was forest land and the soil type was leaching soil. Due to the significant differences in precipitation and temperature data across different years, the suitable ranges for precipitation and temperature are related to their respective annual data partitions. Over all, vegetation on the Loess Plateau grows best when the precipitation is between 630.64 mm and 935.51 mm and the temperature is between -4.38°C and 2°C, with leaching soil as the soil type and forest land as the land use type. When vegetation is within the optimal growth range for each factor, the average vegetation coverage will significantly increase. However, existing studies have shown that there is an upper limit to vegetation coverage, with the vegetation coverage threshold being 65% [39].

Table 11.
The suitable range and types of vegetation coverage in 1995, 2000, 2010, and 2020.
| Factors | FVC | |||
|---|---|---|---|---|
| 1995 | 2000 | 2010 | 2020 | |
| Temperature | -1.75—1.02 | -1.42—1.49 | -1.05—1.87 | -4.38—2.00 |
| Precipitation | 733.72—931.58 | 630.64—802.62 | 698.83—880.68 | 752.01—935.51 |
| Soil types | leached soil | leached soil | leached soil | leached soil |
| Land use | forest land | forest land | forest land | forest land |
4.2. Factor Interaction Effects
The changes in vegetation coverage on the Loess Plateau are influenced by multiple factors. This study examines the influence of various natural and human-induced factors on vegetation coverage. Population density reflects the number of people in the area; generally, population growth tends to encroach on ecological land, leading to a decrease in vegetation coverage. Related studies have shown that a reduction in vegetation coverage is closely related to a high population growth rate [40]. Some scholars point out that the widely held belief of an inverse relationship between population growth and vegetation coverage may not hold true [41]. Their research suggests that in regions where human activities are frequent and climate change has minimal influence on vegetation coverage, a long-term inverted N-shaped relationship exists between population growth and vegetation coverage. Initially, population growth negatively affects vegetation coverage, but over time, it begins to have a positive impact.
GDP represents the area's level of economic development. Some scholars believe that excessively rapid economic development can adversely affect the local natural environment [42]. However, other scholars argue that effective policies can achieve both rapid economic growth and increased vegetation coverage [43]. Since the conclusion of the last century, various measures, including returning farmland to forest and afforestation, have been carried out in the Loess Plateau region to mitigate soil loss and enhance the ecological environment.
Some researchers believe that vegetation conditions largely depend on the current land use status. Different land use types can be categorized into specific vegetation units, and changes in land use result in alterations to vegetation characteristics, establishing it as one of the key drivers of vegetation change [44]. This study also demonstrates that land use type is among the most influential factors impacting vegetation coverage, and the maximum interactive impact occurs when precipitation interacts with land use type in different time periods.
Precipitation, as an essential factor in the vegetation growth process, is the most significant factor influencing vegetation coverage in the findings of this study. Research indicates a significant positive correlation between vegetation and precipitation in semi-arid to semi-humid regions [45], with plant growth being especially responsive to precipitation anomalies. Some scholars have also found correlations between precipitation and vegetation coverage in arid and semi-arid regions [46]. The average annual precipitation in the Loess Plateau ranges from 100 mm to 700 mm, with most areas being arid, semi-arid, or semi-humid. According to the research findings, there is a significant correlation between vegetation coverage and precipitation in the Loess Plateau region. Scholars have noted that vegetation coverage on the Chinese mainland is strongly correlated with both precipitation and temperature, with a more pronounced correlation with temperature [47]. Research has indicated that at an inter-annual scale, precipitation is the primary driver of vegetation coverage in the entire region, and at an inter-monthly scale, changes in vegetation coverage align with changes in precipitation and temperature [48]. This suggests that the responsiveness of vegetation growth to the combined influences of water and heat throughout the year exceeds that of any single climatic factor. In this study, it is shown that the interactive effects of precipitation and temperature are greater than those of each factor independently.
The soil types in this study were categorized into 15 classes, and results indicated that leaching soil is the most conducive for vegetation growth. Related research has demonstrated that in areas with low precipitation, soil moisture is positively correlated with vegetation, and this correlation decreases as one moves from arid to semi-arid or semi-humid regions [49]. Different soil types possess distinct physical and chemical characteristics, leading to differences in soil moisture content and thus affecting vegetation growth differently. Although slope orientation has a relatively small direct effect on vegetation, its interactions with other natural and anthropogenic factors can produce significant impacts. Relevant studies indicate that soil moisture effectiveness is associated with topography, which subsequently impacts vegetation growth [50]. For example, north-facing slopes receive less solar radiation and experience lower evaporation rates compared to south-facing slopes, leading to relatively higher soil moisture that is more conducive to vegetation growth. Within a specific range, the steeper the slope, the greater the difference in soil moisture between north and south slopes, and slope also influences land use types to some extent, affecting vegetation. In the same area, a certain elevation difference can lead to varying temperatures and precipitation levels; therefore, elevation affects vegetation coverage by influencing climatic factors.
5. Conclusions
This study uses the NDVI dataset as a data source to assess and calculate vegetation coverage, investigating the spatiotemporal changes in vegetation coverage on the Loess Plateau from 1982 to 2022. By integrating data on land use types, temperature, precipitation, slope, and other factors, the geographical detector model was employed to evaluate the impact of these factors on vegetation coverage changes on the Loess Plateau and to analyze the driving mechanisms behind these changes in vegetation coverage. The following conclusions were drawn:
(1) The average vegetation coverage on the Loess Plateau increased from 0.36 to 0.6 between 1982 and 2022, showing an overall upward trend. From a temporal perspective, a significant difference is observed around the year 2000. Between 1982 and 2000, vegetation coverage exhibited considerable fluctuations with a slight increase, having a slope of 0.00129. After 2000, with the implementation of policies for returning farmland to forest and grassland, there were slight fluctuations, but the overall upward trend became very evident, with a slope of 0.01075. Spatially, the majority of the Loess Plateau exhibited a highly significant upward trend in vegetation coverage, while a small portion showed no significant change, and a very small area experienced a highly significant decrease.
(2) The changes in vegetation coverage on the Loess Plateau are affected by both natural and anthropogenic factors. Among the natural factors, elevation, slope, and aspect have relatively minor impacts, while temperature, precipitation, and soil type have significant influence, with precipitation being the most influential factor on vegetation coverage changes. Among the anthropogenic factors, soil type has the most considerable effect on vegetation growth, while population density and GDP have relatively minor impacts on the spatial variation of vegetation coverage. Overall, precipitation emerged as the factor with the greatest combined influence. Moreover, the interactive effects of the various factors on vegetation coverage are greater than the individual effects, characterized by mutual enhancement and nonlinear enhancement.
(3) According to the results from the geographical detector model, the highest average vegetation coverage is achieved when the temperature is between -4.8 and 2°C, precipitation is between 630.64 and 935.51 mm, soil type is leaching soil, and land use type is forest. Under these conditions, the vegetation growth status is at its best.
Author Contributions
Conceptualization, Z.Y. and Q.Y.; methodology, Z.Y.; software, Y.Z.; validation, Y.Z., Y.H.; formal analysis, Q.Y.; investigation, Y.Z.; resources, Z.Y.; data curation, Y.Z.; writing—original draft preparation, Y.H.; writing—review and editing, Y.H., M.Y., Q.Y. and Z.Y.; visualization, Y.H.; supervision, Z.Y.; project administration, Q.Y.; funding acquisition, Q.Y. and M.Y. All authors have read and agreed to the published version of the manuscript.
Funding
This research was funded by the National Key Research and Development Program (grant no. 2022YFF130080101), the National Natural Science Foundation of China (grant no. 42401384), the Science and Technology Development of Henan Province of China (grant no. 20242865), and Humanity and Social Science Foundation of Ministry of Education (grant no. 24YJCZH376).
Data Availability Statement
No new data were created or analyzed in this study. Data sharing is not applicable to this article.
Conflicts of Interest
The authors declare no conflicts of interest.
References
- Song, W.; Mu, X.; Ruan, G.; Gao, Z.; Li, L.; Yan, G. Estimating fractional vegetation cover and the vegetation index of bare soil and highly dense vegetation with a physically based method. International Journal of Applied Earth Observation and Geoinformation 2017, 58, 168–176. [Google Scholar] [CrossRef]
- Zheng, F.-L. Effect of Vegetation Changes on Soil Erosion on the Loess Plateau. Pedosphere 2006, 16, 420–427. [Google Scholar] [CrossRef]
- Zhou, J.; Fu, B.; Gao, G.; Lü, Y.; Liu, Y.; Lü, N.; Wang, S. Effects of precipitation and restoration vegetation on soil erosion in a semi-arid environment in the Loess Plateau, China. Catena 2016, 137, 1–11. [Google Scholar] [CrossRef]
- Gao, L.; Wang, X.; Johnson, B.A.; Tian, Q.; Wang, Y.; Verrelst, J.; Mu, X.; Gu, X. Remote sensing algorithms for estimation of fractional vegetation cover using pure vegetation index values: A review. ISPRS Journal of Photogrammetry and Remote Sensing 2020, 159, 364–377. [Google Scholar] [CrossRef] [PubMed]
- Liu, Q.; Zhang, T.; Li, Y.; Li, Y.; Bu, C.; Zhang, Q. Comparative analysis of fractional vegetation cover estimation based on multi-sensor data in a semi-arid sandy area. Chinese Geographical Science 2019, 29, 166–180. [Google Scholar] [CrossRef]
- Yang, P.; Tian, J.; Zhang, N.; Gao, Y.; Feng, X.; Yang, C.; Peng, D. Characteristics of spatio-temporal changes and future trends forecast of vegetation cover in the Yellow River Basin from 1990 to 2022. Acta Ecol. Sin 2024, 44, 1–12. [Google Scholar]
- Liu, Y.; Feng, Y.; Zhao, Z.; Zhang, Q.; Su, S. Socioeconomic drivers of forest loss and fragmentation: A comparison between different land use planning schemes and policy implications. Land Use Policy 2016, 54, 58–68. [Google Scholar] [CrossRef]
- Johnson, B.; Tateishi, R.; Kobayashi, T. Remote sensing of fractional green vegetation cover using spatially-interpolated endmembers. Remote sensing 2012, 4, 2619–2634. [Google Scholar] [CrossRef]
- Cao, Q.; Yu, D.; Georgescu, M.; Han, Z.; Wu, J. Impacts of land use and land cover change on regional climate: A case study in the agro-pastoral transitional zone of China. Environmental Research Letters 2015, 10, 124025. [Google Scholar] [CrossRef]
- QIN, W.; ZHU, Q.-k.; ZHANG, X.-x.; LI, W.-h.; FANG, B. Review of vegetation covering and its measuring and calculating method. Journal of Northwest A & F University (Natural Science Edition) 2006, 34. [Google Scholar]
- Rouse Jr, J.W.; Haas, R.H.; Deering, D.; Schell, J.; Harlan, J.C. Monitoring the vernal advancement and retrogradation (green wave effect) of natural vegetation; 1974.
- Pettorelli, N.; Vik, J.O.; Mysterud, A.; Gaillard, J.-M.; Tucker, C.J.; Stenseth, N.C. Using the satellite-derived NDVI to assess ecological responses to environmental change. Trends in ecology & evolution 2005, 20, 503–510. [Google Scholar]
- Carlson, T.N.; Ripley, D.A. On the relation between NDVI, fractional vegetation cover, and leaf area index. Remote sensing of Environment 1997, 62, 241–252. [Google Scholar] [CrossRef]
- Wang, Q.; Adiku, S.; Tenhunen, J.; Granier, A. On the relationship of NDVI with leaf area index in a deciduous forest site. Remote sensing of environment 2005, 94, 244–255. [Google Scholar] [CrossRef]
- Purevdorj, T.; Tateishi, R.; Ishiyama, T.; Honda, Y. Relationships between percent vegetation cover and vegetation indices. International journal of remote sensing 1998, 19, 3519–3535. [Google Scholar] [CrossRef]
- Li, F.; Chen, W.; Zeng, Y.; Zhao, Q.; Wu, B. Improving estimates of grassland fractional vegetation cover based on a pixel dichotomy model: A case study in Inner Mongolia, China. Remote Sensing 2014, 6, 4705–4722. [Google Scholar] [CrossRef]
- Carlson, T.N.; Gillies, R.R.; Perry, E.M. A method to make use of thermal infrared temperature and NDVI measurements to infer surface soil water content and fractional vegetation cover. Remote sensing reviews 1994, 9, 161–173. [Google Scholar] [CrossRef]
- Jiapaer, G.; Chen, X.; Bao, A. A comparison of methods for estimating fractional vegetation cover in arid regions. Agricultural and Forest Meteorology 2011, 151, 1698–1710. [Google Scholar] [CrossRef]
- Zhang, X.; Liao, C.; Li, J.; Sun, Q. Fractional vegetation cover estimation in arid and semi-arid environments using HJ-1 satellite hyperspectral data. International Journal of Applied Earth Observation and Geoinformation 2013, 21, 506–512. [Google Scholar] [CrossRef]
- Wang, G.; Wang, J.; Zou, X.; Chai, G.; Wu, M.; Wang, Z. Estimating the fractional cover of photosynthetic vegetation, non-photosynthetic vegetation and bare soil from MODIS data: Assessing the applicability of the NDVI-DFI model in the typical Xilingol grasslands. International Journal of Applied Earth Observation and Geoinformation 2019, 76, 154–166. [Google Scholar] [CrossRef]
- Li, T.; Li, X.S.; Li, F. Estimating fractional cover of photosynthetic vegetation and non - photosynthetic vegetation in the Xilingol steppe region with EO-1 hyperion data. Acta Ecologica Sinica 2015, 35, 3643–3652. [Google Scholar]
- Okin, G.S.; Clarke, K.D.; Lewis, M.M. Comparison of methods for estimation of absolute vegetation and soil fractional cover using MODIS normalized BRDF-adjusted reflectance data. Remote Sensing of Environment 2013, 130, 266–279. [Google Scholar] [CrossRef]
- Muchoney, D.; Borak, J.; Chi, H.; Friedl, M.; Gopal, S.; Hodges, J.; Morrow, N.; Strahler, A. Application of the MODIS global supervised classification model to vegetation and land cover mapping of Central America. International Journal of Remote Sensing 2000, 21, 1115–1138. [Google Scholar] [CrossRef]
- Stojanova, D.; Panov, P.; Gjorgjioski, V.; Kobler, A.; Džeroski, S. Estimating vegetation height and canopy cover from remotely sensed data with machine learning. Ecological Informatics 2010, 5, 256–266. [Google Scholar] [CrossRef]
- Chen, L.; Wei, W.; Fu, B.; Lü, Y. Soil and water conservation on the Loess Plateau in China: review and perspective. Progress in Physical Geography 2007, 31, 389–403. [Google Scholar] [CrossRef]
- Zhao, G.; Mu, X.; Wen, Z.; Wang, F.; Gao, P. Soil erosion, conservation, and eco-environment changes in the Loess Plateau of China. Land Degradation & Development 2013, 24, 499–510. [Google Scholar]
- Zhang, P.; Shao, G.; Zhao, G.; Le Master, D.C.; Parker, G.R.; Dunning Jr, J.B.; Li, Q. China's forest policy for the 21st century. Science 2000, 288, 2135–2136. [Google Scholar] [CrossRef] [PubMed]
- Liu, J.; Diamond, J. China's environment in a globalizing world. Nature 2005, 435, 1179–1186. [Google Scholar] [CrossRef] [PubMed]
- Wang, J.F.; Li, X.H.; Christakos, G.; Liao, Y.L.; Zhang, T.; Gu, X.; Zheng, X.Y. Geographical detectors-based health risk assessment and its application in the neural tube defects study of the Heshun Region, China. International Journal of Geographical Information Science 2010, 24, 107–127. [Google Scholar] [CrossRef]
- WANG, J.; XU, C. Geodetector:Principle and prospective. Acta Ecologica Sinica 2017, 72. [Google Scholar] [CrossRef]
- Liang, P.; Yang, X. Landscape spatial patterns in the Maowusu (Mu Us) Sandy Land, northern China and their impact factors. Catena 2016, 145, 321–333. [Google Scholar] [CrossRef]
- Wang, J.-F.; Hu, Y. Environmental health risk detection with GeogDetector. Environmental Modelling & Software 2012, 33, 114–115. [Google Scholar]
- Yang, J.; Huang, X. 30 m annual land cover and its dynamics in China from 1990 to 2019. Earth System Science Data Discussions 2021, 2021, 1–29. [Google Scholar]
- CHEN, B.-m.; ZHOU, X.-p. Explanation of Cur r ent Land Use Condition Classification for National Standard of the People’s Republic of China. Journal of Natural Resources 2007, 22, 994–1003. [Google Scholar]
- Peng, S. 1-km monthly mean temperature dataset for china (1901–2022). National Tibetan Plateau Data Center: Beijing, China 2019.
- Peng, S. 1-km monthly precipitation dataset for China (1901–2020). National Tibetan Plateau Data Center: Beijing, China 2020.
- Birkes, D.; Dodge, Y. 6.3 estimating the regression line. Alternative methods of regression, Wiley series in probability and statistics 1993, 282, 113-118.
- YUAN, L.; JIANG, W.; SHEN, W.; LIU, Y.; WANG, W.; TAO, L.; ZHENG, H.; LIU, X. The spatio-temporal variations of vegetation cover in the Yellow River Basin from 2000 to 2010. Acta Ecologica Sinica 2013, 33, 7798–7806. [Google Scholar] [CrossRef]
- Chen, Y.-p.; Wang, K.-b.; Fu, B.-j.; Wang, Y.-f.; Tian, H.-w.; Wang, Y.; Zhang, Y. 65% cover is the sustainable vegetation threshold on the Loess Plateau. Environmental Science and Ecotechnology 2024, 100442. [Google Scholar] [CrossRef]
- Brandt, M.; Rasmussen, K.; Peñuelas, J.; Tian, F.; Schurgers, G.; Verger, A.; Mertz, O.; Palmer, J.R.; Fensholt, R. Human population growth offsets climate-driven increase in woody vegetation in sub-Saharan Africa. Nature ecology & evolution 2017, 1, 0081. [Google Scholar]
- Liu, C.; Xie, W.; Lao, T.; Yao, Y.-t.; Zhang, J. Application of a novel grey forecasting model with time power term to predict China's GDP. Grey Systems: Theory and Application 2021, 11, 343–357. [Google Scholar] [CrossRef]
- Hu, M.; Xia, B. A significant increase in the normalized difference vegetation index during the rapid economic development in the Pearl River Delta of China. Land degradation & development 2019, 30, 359–370. [Google Scholar]
- Li, C.; Kuang, Y.; Huang, N.; Zhang, C. The long-term relationship between population growth and vegetation cover: An empirical analysis based on the panel data of 21 cities in Guangdong province, China. International Journal of Environmental Research and Public Health 2013, 10, 660–677. [Google Scholar] [CrossRef]
- Tasser, E.; Tappeiner, U. Impact of land use changes on mountain vegetation. Applied vegetation science 2002, 5, 173–184. [Google Scholar] [CrossRef]
- Jiang, D.; Zhang, H.; Zhang, Y.; Wang, K. Interannual variability and correlation of vegetation cover and precipitation in Eastern China. Theoretical and applied climatology 2014, 118, 93–105. [Google Scholar] [CrossRef]
- Mo, K.; Chen, Q.; Chen, C.; Zhang, J.; Wang, L.; Bao, Z. Spatiotemporal variation of correlation between vegetation cover and precipitation in an arid mountain-oasis river basin in northwest China. Journal of Hydrology 2019, 574, 138–147. [Google Scholar] [CrossRef]
- Chen, H.; Ren, Z. Response of vegetation coverage to changes of precipitation and temperature in Chinese mainland. Bull. Soil Water Conserv 2013, 2, 18. [Google Scholar]
- Mu, S.; Yang, H.; Li, J.; Chen, Y.; Gang, C.; Zhou, W.; Ju, W. Spatio-temporal dynamics of vegetation coverage and its relationship with climate factors in Inner Mongolia, China. Journal of Geographical Sciences 2013, 23, 231–246. [Google Scholar] [CrossRef]
- D'Odorico, P.; Caylor, K.; Okin, G.S.; Scanlon, T.M. On soil moisture–vegetation feedbacks and their possible effects on the dynamics of dryland ecosystems. Journal of Geophysical Research: Biogeosciences 2007, 112. [Google Scholar] [CrossRef]
- Fan, J.; Xu, Y.; Ge, H.; Yang, W. Vegetation growth variation in relation to topography in Horqin Sandy Land. Ecological Indicators 2020, 113, 106215. [Google Scholar] [CrossRef]
Figure 1.
Map of the Loess Plateau geographic location.
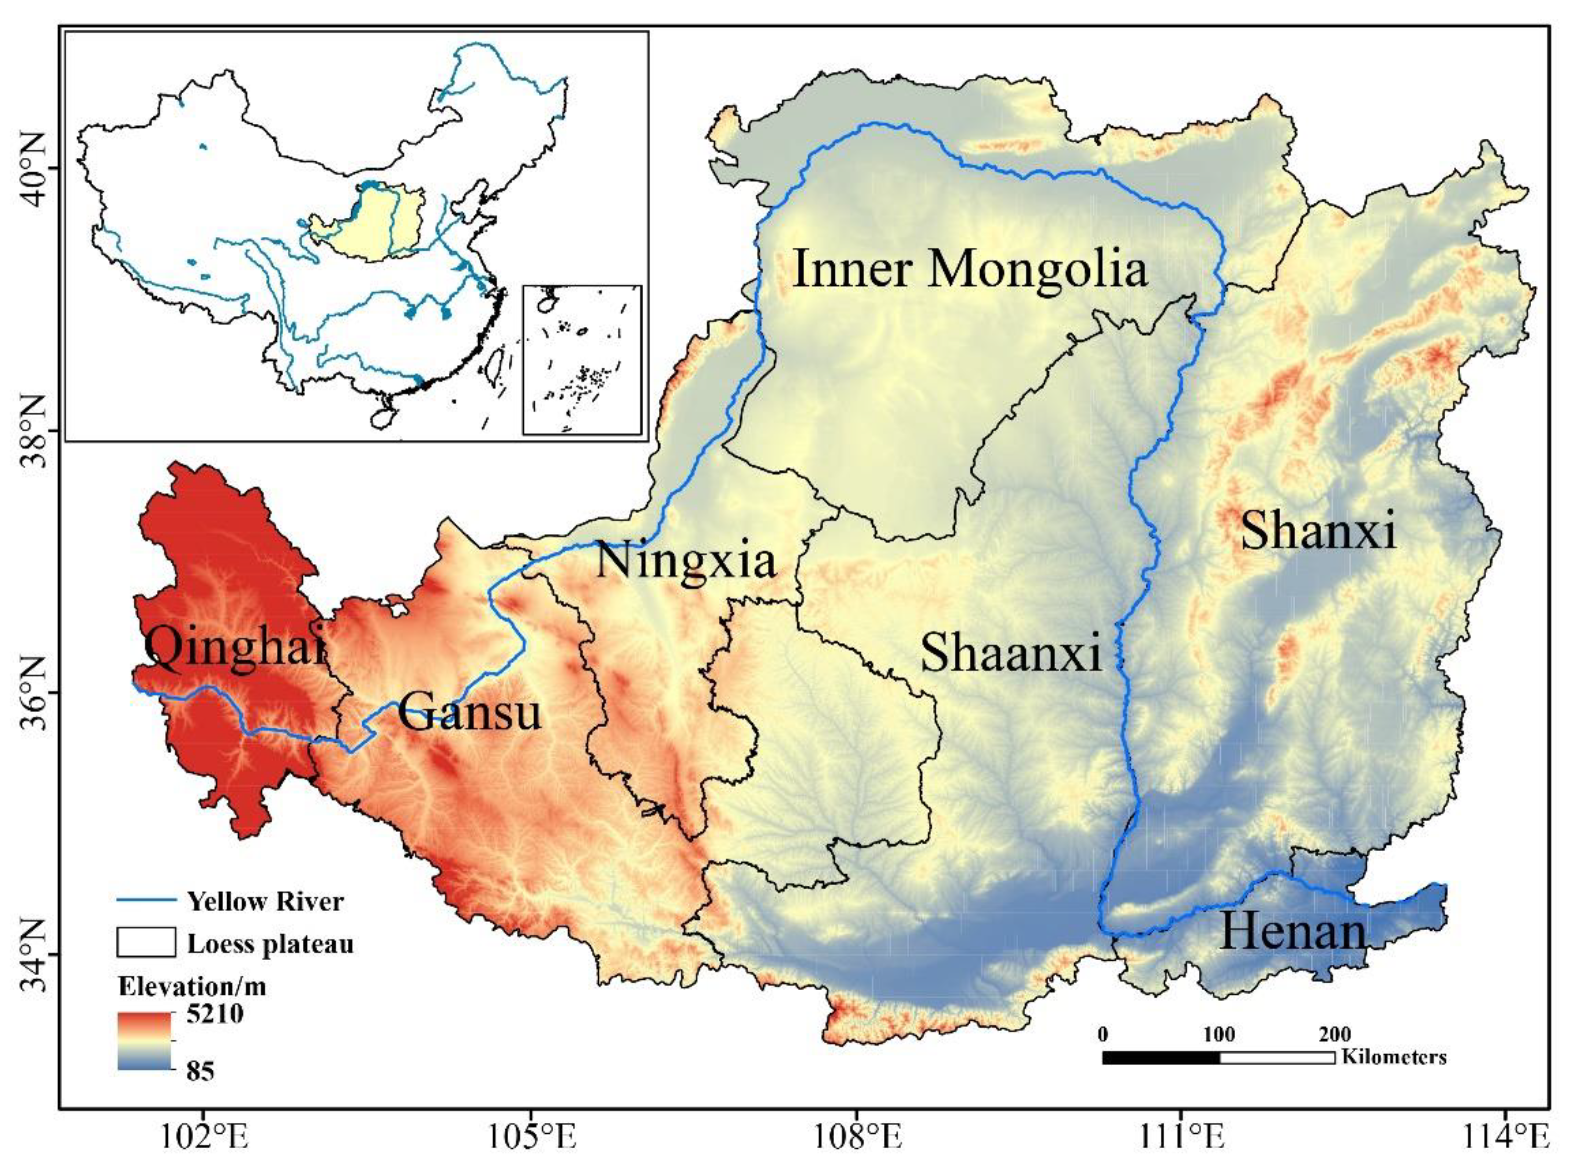
Figure 3.
Trend of vegetation coverage change from 1982 to 2022.
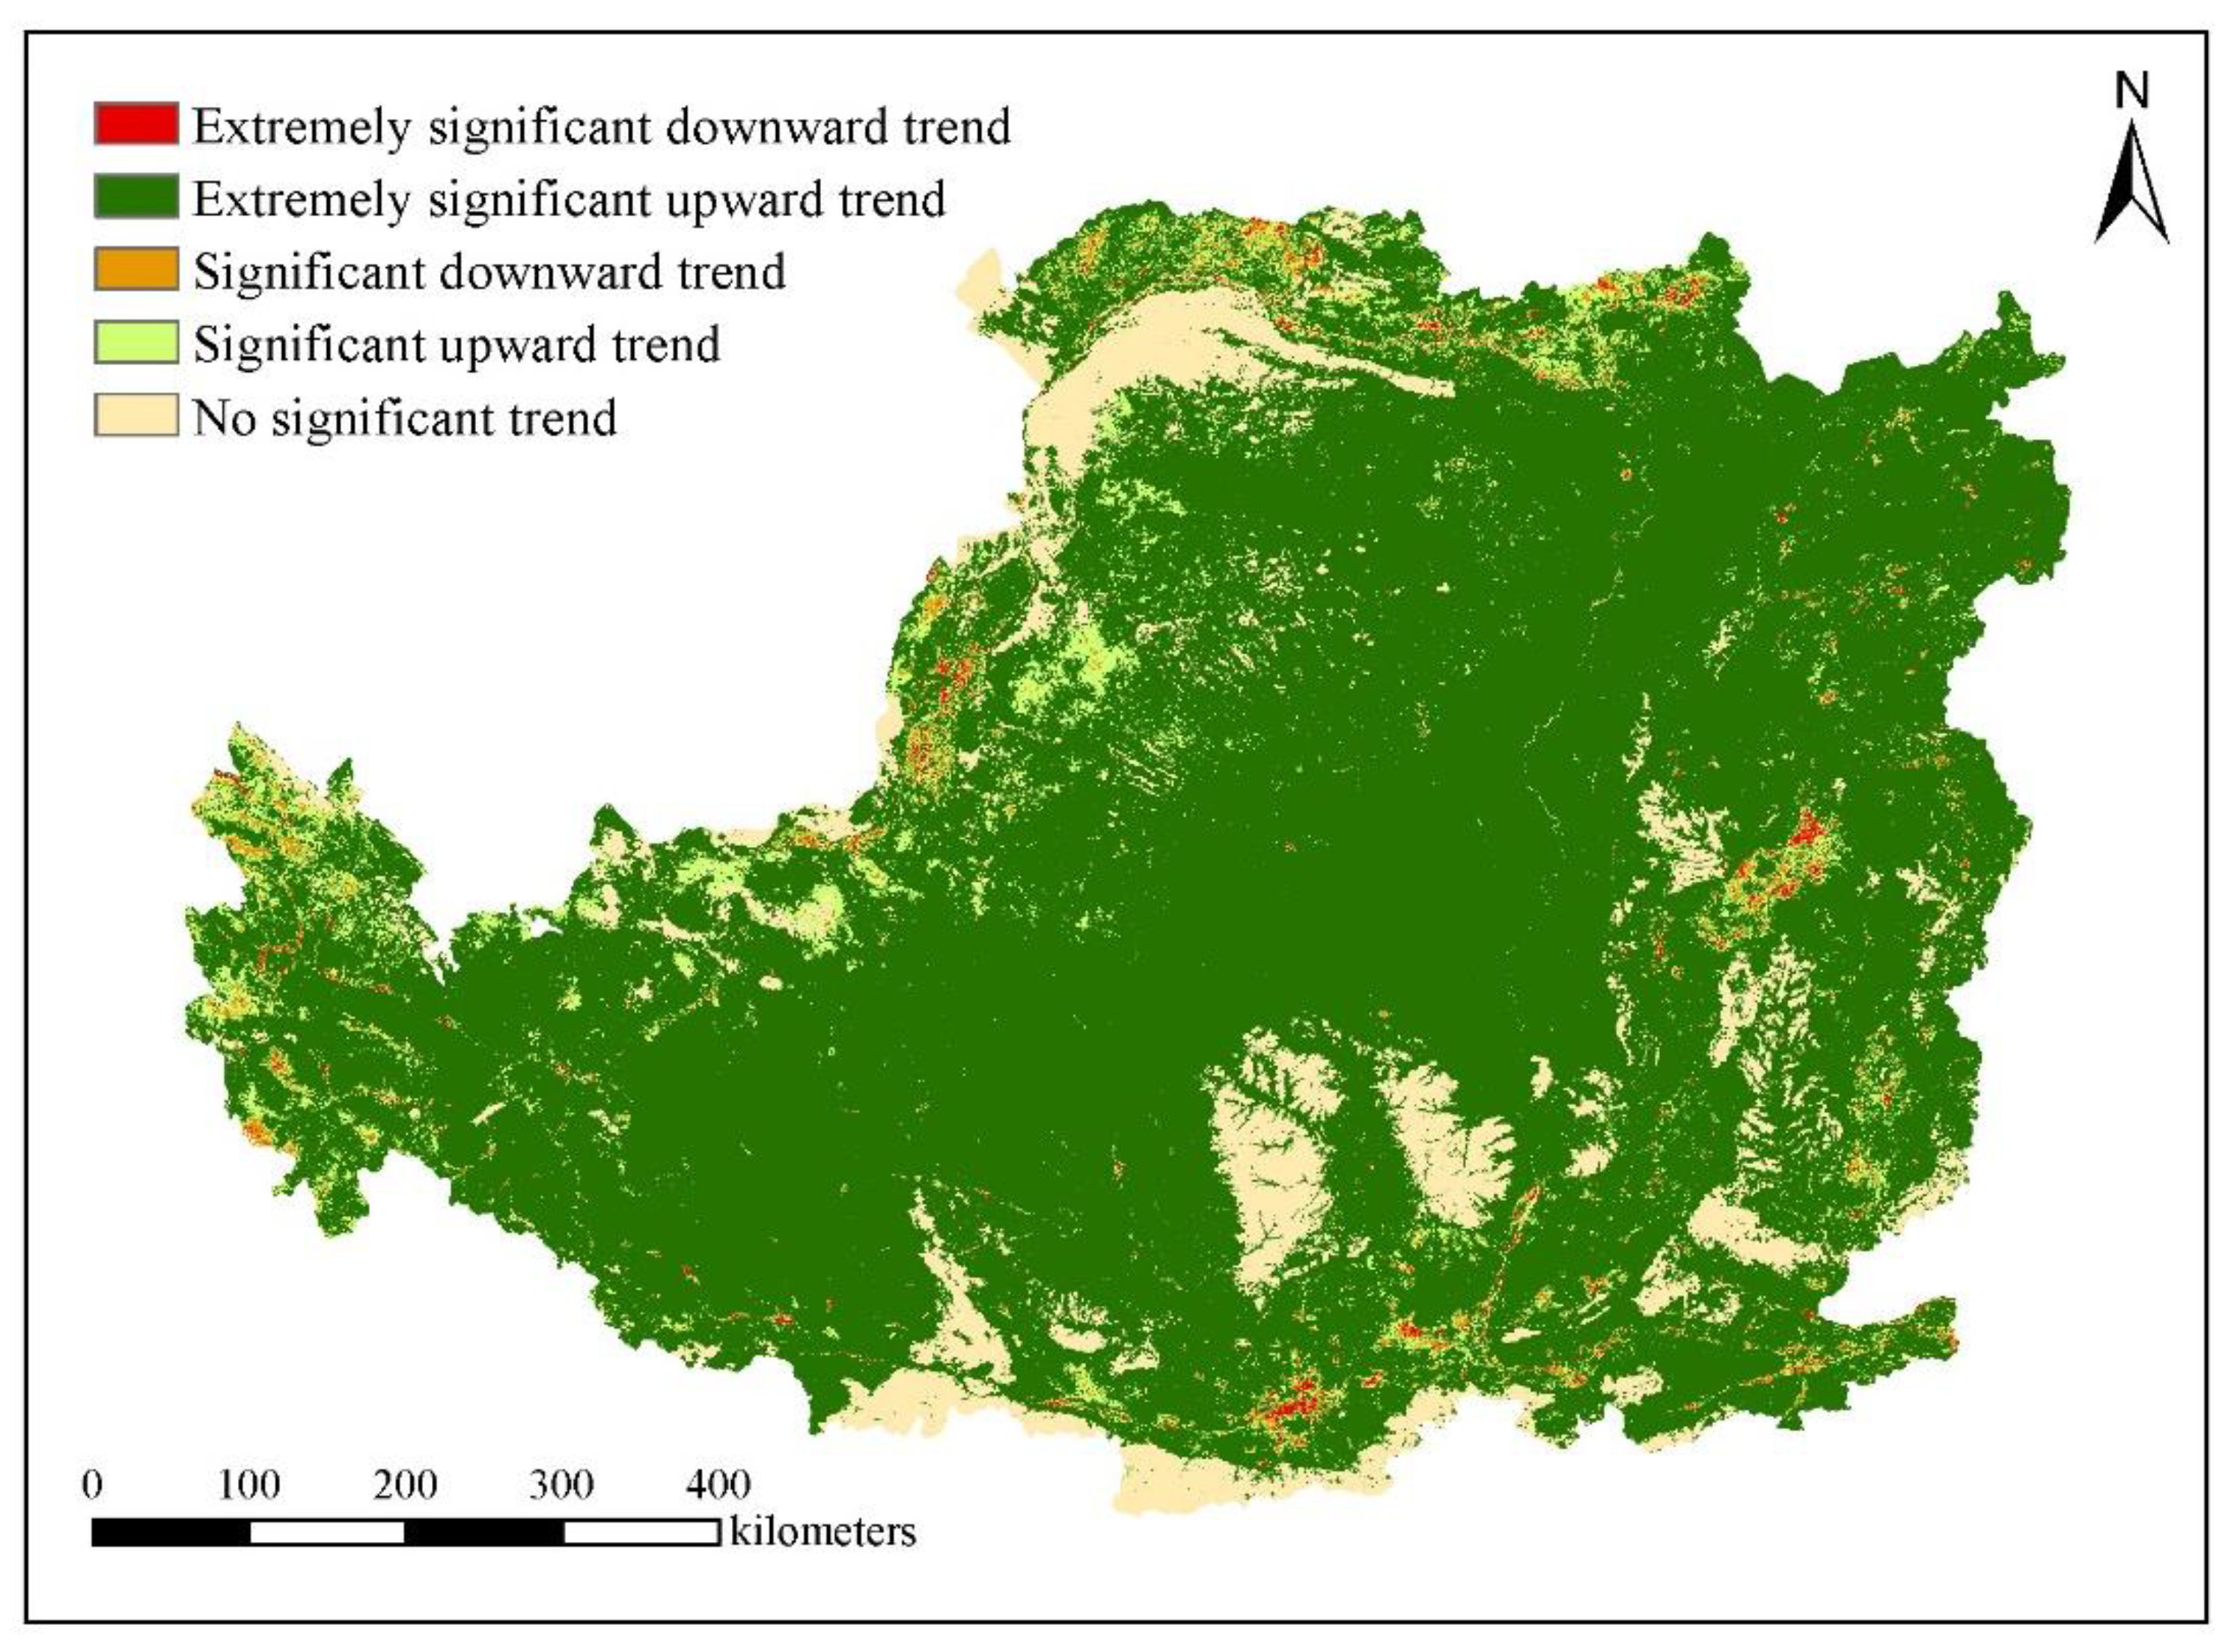
Table 1.
Classification of natural and human factors.
| Natural Factors | Human Factors |
| Elevation(x1) | Land use(x7) |
| Slope(x2) | Population density(x8) |
| Aspect(x3) | GDP(x9) |
| Temperature(x4) | |
| Precipitation(x5) | |
| Soil types(x6) |
Table 2.
Types of Two-Factor Interactions.
| Discriminant Criteria | Types of Interactions |
| q(x1∩x2) < Min(q(x1), q(x2)) | weaken, nonlinear |
| Min(q(x1), q(x2)) < q(x1∩x2) < Max(q(x1), q(x2)) | single factor weaken, nonlinear |
| q(x1∩x2) > Max(q(x1), q(x2)) | dual-factor enhancement |
| q(x1∩x2) = q(x1) + q(x2) | dual-factor independent |
| q (x1x2) > q(x1) + q(x2) | enhance, nonlinear |
Table 3.
The explanatory power of various factors on FVC in 1995, 2000, 2010, and 2020.
| Factors | q values | |||
|---|---|---|---|---|
| 1995 | 2000 | 2010 | 2020 | |
| Elevation | 0.114 | 0.113 | 0.11 | 0.095 |
| Slope | 0.133 | 0.135 | 0.152 | 0.201 |
| Aspect | 0.001 | 0.001 | 0.001 | 0.001 |
| Temperature | 0.251 | 0.241 | 0.245 | 0.231 |
| Precipitation | 0.394 | 0.641 | 0.657 | 0.682 |
| Soil types | 0.354 | 0.352 | 0.35 | 0.336 |
| Land use | 0.459 | 0.465 | 0.468 | 0.418 |
| Population density | 0.014 | 0.014 | 0.009 | 0.006 |
| GDP | 0.1 | 0.079 | 0.019 | 0.013 |
Table 4.
Precipitation zone codes and corresponding precipitation values.
| Zone Code | Precipitation values(mm) | |||
|---|---|---|---|---|
| 1995 | 2000 | 2010 | 2020 | |
| 1 | 90.66—209.38 | 106.52—196.60 | 107.81—226.01 | 114.57—236.91 |
| 2 | 209.38—285.23 | 196.60—259.39 | 226.01—298.75 | 236.91—314.17 |
| 3 | 285.23—351.18 | 259.39—322.18 | 298.75—359.37 | 314.17—381.78 |
| 4 | 351.18—413.84 | 322.18—379.50 | 359.37—416.96 | 381.78—446.17 |
| 5 | 413.84—476.49 | 379.50—428.64 | 416.96—471.51 | 446.17—507.33 |
| 6 | 476.49—535.85 | 428.64—475.04 | 471.51—523.04 | 507.33—565.28 |
| 7 | 535.85—591.92 | 475.04—524.18 | 523.04—571.53 | 565.28—620.01 |
| 8 | 591.92—651.27 | 524.18—570.58 | 571.53—623.05 | 620.01—674.74 |
| 9 | 651.27—733.72 | 570.58—630.64 | 623.05—698.83 | 674.74—752.01 |
| 10 | 733.72—931.58 | 630.64—802.62 | 698.83—880.68 | 752.01—935.51 |
Table 5.
Mean FVC under different precipitation zones.
| Zone Code | FVC | |||
|---|---|---|---|---|
| 1995 | 2000 | 2010 | 2020 | |
| 1 | 0.224 | 0.222 | 0.214 | 0.261 |
| 2 | 0.156 | 0.168 | 0.192 | 0.225 |
| 3 | 0.208 | 0.230 | 0.252 | 0.281 |
| 4 | 0.478 | 0.293 | 0.357 | 0.392 |
| 5 | 0.527 | 0.432 | 0.463 | 0.536 |
| 6 | 0.570 | 0.614 | 0.587 | 0.653 |
| 7 | 0.663 | 0.731 | 0.769 | 0.796 |
| 8 | 0.759 | 0.754 | 0.786 | 0.849 |
| 9 | 0.823 | 0.842 | 0.864 | 0.901 |
| 10 | 0.879 | 0.923 | 0.988 | 0.975 |
Table 6.
Temperature zone number and corresponding temperature value.
| Zone Code | Temperature(℃) | |||
|---|---|---|---|---|
| 1995 | 2000 | 2010 | 2020 | |
| 1 | -13.20—-5.19 | -13.11—-4.91 | -12.67—-4.55 | -12.56—-4.38 |
| 2 | -5.19—-1.75 | -4.91—-1.42 | -4.55—-1.05 | -4.38—-0.91 |
| 3 | -1.75—1.02 | -1.42—1.49 | -1.05—1.87 | -4.38—2.00 |
| 4 | 1.02—3.36 | 1.49—3.96 | 1.87—4.35 | 2.00—4.46 |
| 5 | 3.36—5.18 | 3.96—5.65 | 4.35—6.15 | 4.46—6.25 |
| 6 | 5.18—6.58 | 5.65—6.99 | 6.15—7.62 | 6.25—7.71 |
| 7 | 6.58—7.80 | 6.99—8.34 | 7.62—8.86 | 7.71—8.94 |
| 8 | 7.80—9.25 | 8.34—9.80 | 8.86—10.32 | 8.94—10.40 |
| 9 | 9.25—11.47 | 9.80—12.05 | 10.32—12.58 | 10.40—12.53 |
| 10 | 11.47—15.14 | 12.05—15.53 | 12.58—16.07 | 12.53—16.00 |
Table 7.
Mean FVC under temperature zones.
| Zone Code | FVC | |||
|---|---|---|---|---|
| 1995 | 2000 | 2010 | 2020 | |
| 1 | 0.326 | 0.318 | 0.315 | 0.305 |
| 2 | 0.788 | 0.790 | 0.793 | 0.803 |
| 3 | 0.804 | 0.817 | 0.818 | 0.854 |
| 4 | 0.663 | 0.678 | 0.684 | 0.757 |
| 5 | 0.508 | 0.523 | 0.538 | 0.644 |
| 6 | 0.418 | 0.427 | 0.439 | 0.541 |
| 7 | 0.327 | 0.340 | 0.351 | 0.444 |
| 8 | 0.408 | 0.430 | 0.450 | 0.557 |
| 9 | 0.644 | 0.654 | 0.685 | 0.796 |
| 10 | 0.742 | 0.746 | 0.762 | 0.836 |
Table 8.
Mean FVC under soil type zoning.
| Zone Code | Soil Type | FVC | |||
|---|---|---|---|---|---|
| 1995 | 2000 | 2010 | 2020 | ||
| 1 | leached soil | 0.962 | 0.961 | 0.965 | 0.984 |
| 2 | semi-lateritic soil | 0.769 | 0.768 | 0.783 | 0.856 |
| 3 | caliche soil | 0.408 | 0.424 | 0.438 | 0.552 |
| 4 | arid soil | 0.148 | 0.151 | 0.160 | 0.222 |
| 5 | desert soil | 0.140 | 0.145 | 0.144 | 0.198 |
| 6 | incipient soil | 0.447 | 0.456 | 0.480 | 0.597 |
| 7 | semi-hydromorphic soil | 0.447 | 0.450 | 0.451 | 0.525 |
| 8 | hydromorphic soil | 0.396 | 0.389 | 0.404 | 0.504 |
| 9 | saline-alkali soil | 0.331 | 0.339 | 0.337 | 0.384 |
| 10 | anthropogenic soil | 0.430 | 0.440 | 0.437 | 0.472 |
| 11 | mountain soil | 0.693 | 0.700 | 0.701 | 0.721 |
| 12 | ferro-aluminum soil | 0.182 | 0.182 | 0.182 | 0.264 |
| 13 | rock | 0.335 | 0.335 | 0.339 | 0.381 |
| 14 | water body | 0.394 | 0.387 | 0.395 | 0.435 |
| 15 | other | 0.100 | 0.100 | 0.100 | 0.100 |
Table 9.
Average FVC under land use zoning.
| Zone Code | Land Use Type | FVC | |||
|---|---|---|---|---|---|
| 1995 | 2000 | 2010 | 2020 | ||
| 1 | cultivated land | 0.533 | 0.543 | 0.564 | 0.663 |
| 2 | forest land | 0.933 | 0.929 | 0.935 | 0.963 |
| 3 | grassland | 0.366 | 0.371 | 0.382 | 0.486 |
| 4 | Water body | 0.224 | 0.211 | 0.231 | 0.271 |
| 5 | construction land | 0.487 | 0.474 | 0.476 | 0.535 |
| 6 | unused land | 0.126 | 0.116 | 0.109 | 0.122 |
Table 10.
Interaction results of various factors in 1995、2000、2010 and 2020.
| Interaction Factors | FVC | |||
|---|---|---|---|---|
| 1995 | 2000 | 2010 | 2020 | |
| Elevation ∩ Slope | ↑↑ | ↑↑ | ↑↑ | ↑↑ |
| Elevation ∩ Aspect | ↑↑ | ↑↑ | ↑↑ | ↑↑ |
| Elevation ∩ Temperature | ↑ | ↑ | ↑ | ↑ |
| Elevation ∩ Precipitation | ↑ | ↑ | ↑ | ↑ |
| Elevation ∩ Soil types | ↑ | ↑ | ↑ | ↑ |
| Elevation ∩ Land use | ↑ | ↑ | ↑ | ↑↑ |
| Elevation ∩ Population density | ↑ | ↑ | ↑ | ↑↑ |
| Elevation ∩ GDP | ↑ | ↑ | ↑ | ↑ |
| Slope ∩ Aspect | ↑↑ | ↑↑ | ↑↑ | ↑↑ |
| Slope ∩ Temperature | ↑ | ↑ | ↑ | ↑↑ |
| Slope ∩ Precipitation | ↑ | ↑ | ↑ | ↑ |
| Slope ∩ Soil types | ↑ | ↑ | ↑ | ↑ |
| Slope ∩ Land use | ↑ | ↑ | ↑ | ↑ |
| Slope ∩ Population density | ↑↑ | ↑↑ | ↑↑ | ↑↑ |
| Slope ∩ GDP | ↑↑ | ↑↑ | ↑↑ | ↑↑ |
| Aspect ∩ Temperature | ↑↑ | ↑↑ | ↑↑ | ↑↑ |
| Aspect ∩ Precipitation | ↑↑ | ↑↑ | ↑↑ | ↑↑ |
| Aspect ∩ Soil types | ↑↑ | ↑↑ | ↑↑ | ↑↑ |
| Aspect ∩ Land use | ↑↑ | ↑↑ | ↑↑ | ↑↑ |
| Aspect ∩ Population density | ↑↑ | ↑↑ | ↑↑ | ↑↑ |
| Aspect ∩ GDP | ↑↑ | ↑↑ | ↑↑ | ↑↑ |
| Temperature ∩ Precipitation | ↑ | ↑ | ↑ | ↑ |
| Temperature ∩ Soil types | ↑ | ↑ | ↑ | ↑ |
| Temperature ∩ Land use | ↑ | ↑ | ↑ | ↑ |
| Temperature ∩ Population density | ↑ | ↑ | ↑ | ↑↑ |
| Temperature ∩ GDP | ↑ | ↑ | ↑ | ↑↑ |
| Precipitation ∩ Soil types | ↑ | ↑ | ↑ | ↑ |
| Precipitation ∩ Land use | ↑ | ↑ | ↑ | ↑ |
| Precipitation ∩ Population density | ↑ | ↑ | ↑ | ↑↑ |
| Precipitation ∩ GDP | ↑ | ↑ | ↑↑ | ↑↑ |
| Soil types ∩ Land use | ↑ | ↑ | ↑ | ↑ |
| Soil types ∩ Population density | ↑ | ↑ | ↑ | ↑↑ |
| Soil types ∩ GDP | ↑ | ↑ | ↑ | ↑ |
| Land use ∩ Population density | ↑ | ↑ | ↑ | ↑ |
| Land use ∩ GDP | ↑ | ↑ | ↑ | ↑↑ |
| Population density ∩ GDP | ↑ | ↑ | ↑ | ↑ |
Note: “↑” represents dual-factor enhancement, “↑↑” represents nonlinear enhancement.
Disclaimer/Publisher’s Note: The statements, opinions and data contained in all publications are solely those of the individual author(s) and contributor(s) and not of MDPI and/or the editor(s). MDPI and/or the editor(s) disclaim responsibility for any injury to people or property resulting from any ideas, methods, instructions or products referred to in the content. |
© 2024 by the authors. Licensee MDPI, Basel, Switzerland. This article is an open access article distributed under the terms and conditions of the Creative Commons Attribution (CC BY) license (http://creativecommons.org/licenses/by/4.0/).
Copyright: This open access article is published under a Creative Commons CC BY 4.0 license, which permit the free download, distribution, and reuse, provided that the author and preprint are cited in any reuse.


