
Submitted:
02 August 2023
Posted:
03 August 2023
You are already at the latest version
Abstract
Landscape configuration and forest structure assume an increasing importance as determinants of animal communities. This paper focused on nocturnal lepidoptera inhabiting alder patches in the Sila National Park, Italy. According to their shape, patches were divided into linear and compact ones to disentangle the role of forest structure and landscape configuration in determining the composition of nocturnal lepidopteran communities at different observation scales. We used the Mann-Whitney test for medians to Shannon diversity, Equitability, Fisher’s alpha, and nestedness to test differences among moth communities. We found that compact patches inhabit richer and more abundant communities. The abundance-based Correspondence Analysis showed moth communities clustered according to woodlot shape, except a compact woodlot having a linear-like moth community because entirely surrounded by grasslands. Percentage of forested area and abundance and composition of communities are positively correlated at 50 and 200 m buffers, while correlations are absent at smaller and larger buffers. Our results demonstrated that a width of 50 m may not be sufficient to give proper functionality to the wooded area, at least for moths. As consequence, planning of forest restorations should consider the importance to increase structural habitat continuity at larger scales.
Keywords:
Lepidoptera
; landscape ecology
; riparian forest
; Alnus glutinosa
; natural park
; beta-diversity
; South Italy
1. Introduction
Forests have been managed by man from long time to produce timber and their surfaces have been reduced for the increasing demand of pastures, agricultural and anthropic land [1,2]. Deforestation disrupts ecosystem equilibrium and threats associated biodiversity [3,4,5,6,7], mainly because of habitat reduction and fragmentation that modify patch shape and woodlot structure [8,9,10,11,12,13]. When a forest is highly fragmented, there is an inevitably increase in forest edges leading to a higher margin effect on species assemblages, but also structure and ecological processes of ecosystems near the ecotone are affected [14]. In addition, modifications of habitat quality and heterogeneity, as well as surrounding matrix attributes, are known to have significant effects on species occurrence and population size [15,16,17,18,19]. Proper forest management devoted to habitat restoration should ameliorate connectivity and reduce fragmentation through the establishment of ecological corridor and increasing patch size, both with positive effects on biodiversity [20,21,22,23], and the latter favouring the presence of the more vulnerable core species [24]. Besides landscape drivers, also pure dendrometric parameters and spatial tree arrangement affect abundance and composition of animals and plants communities. Structural parameters of forest are relevant for animal and plant diversity [25], i.e., age of trees affects lichen and bird diversity [26], tree species composition affects animal community composition [27,28,29], and tree density and basal area affects diversity in dry and tropical forests [30].
Among forest types, riparian ones and associated biodiversity are those that suffer more from severe deforestation because of the additive detrimental effects of climate change [31], mainly due to the expected alteration of rainfall regimes. Fragmentation of riparian forests has been observed all around the world [32,33,34] and protected areas have not been spared. In the Mediterranean Basin, they are particularly vulnerable because climate change is there stronger than elsewhere, with temperatures and aridity increasing faster than the global average [35].
Several studies analysed the effects of changes in patch structure and shape of woodlots on biodiversity such as birds and mammals [8,10], reptiles [36], amphibians [37] and invertebrates [9]. Among invertebrates, nocturnal Lepidoptera communities are often used to investigate the effects of changes in patch shape and size of forests [13,24] as well as bioindicators for agricultural intensification and forest quality [38,39,40,41]. It is known that abundance and richness of moth species are influenced by patch size, quality of woodlot, surrounding matrix attributes and edge length [15,16,17,18,19]. As the size of a woodlot patch increases, the richness and the abundance of moth species increases for the addition of forest core species [24]. Moth occupies several environments, and many species are linked to forested habitats [42]. Those linked to riparian habitats have rarely been studied [23,43], especially in Italy where knowledge increased only in the last decades [44,45,46,47,48]. Riparian habitats are essential to preserve many lepidoptera’s species some of which find here suitable habitat against global warming induced range shift [49]. In fact, despite exclusive species weren’t among the most abundant ones, sampled riparian forest resulted an important component of beta-diversity [47].
Black alder (Alnus glutinosa (L.) Gaertn.) forests of the Sila plateau, in the middle of Mediterranean Basin, are a perfect model to study the effects of landscape structure on biodiversity hosted in riparian forests as they are (i) threatened by severe climate change, and (ii) mostly reduced to stripes surrounded by pastures and cultivated lands, then with a significant edge length and potentially with a marked margin effect.
In this paper, we analysed nocturnal lepidoptera sampled by Leonetti et al. [47] in linear and compact alder woodlots in order to test the hypotheses that linear woodlots inhabit an impoverished version of moth communities inhabiting compact woodlots. The latter are supposed to host a well-preserved moth community also composed by core species, as the margin effect is supposed to be lower than in linear ones. Then, we assessed the role of landscape drivers and forest structure in shaping moth communities, providing suggestions to manage this vulnerable habitat.
2. Material and Methods
2.1. Study area
Study area is entirely comprised within the Sila National Park, Calabria region, Italy (Figure 1). Most of the territory extends between 1,100 and 1,200 metres of altitude, reaching the highest altitudes with Mount Botte Donato (1,928 m a.s.l.) and Mount Curcio (1,768 m a.s.l.). The climate of the study area is warm temperate with relatively humid summers typical of upland Mediterranean zones. Mean annual precipitation is around 1,240 mm, with a mean monthly maximum of 180 mm recorded in November and a mean monthly minimum of 33 mm in July [50]. Snow cover usually occurs from December to April. The metamorphic and granite substratum of the plateau, since it has poor permeability, favors the surface flow of the abundant rainfall with the formation of a capillary network of watercourses which flow into four main rivers: Neto, Crati, Trionto and Tacina. Landscape is mostly composed by woodlands with a predominance of Pinus nigra Poir. subsp. calabrica (Loud.) Cesca & Peruzzi forests at lower altitude and Fagus sylvatica L. in the upper belt [51]. Woodlands are interrupted by grasslands and cultivated fields. Riparian woodlots only extents along water courses. In detail, sampled woodlots have been selected along the Neto and Cecita riversides with altitudes ranging between 1,250 and 1,397 m a.s.l.
Figure 1.
Localization of study sites. White circles indicate alder woodlots, the yellow triangle indicates the pine woodlot.
Figure 1.
Localization of study sites. White circles indicate alder woodlots, the yellow triangle indicates the pine woodlot.
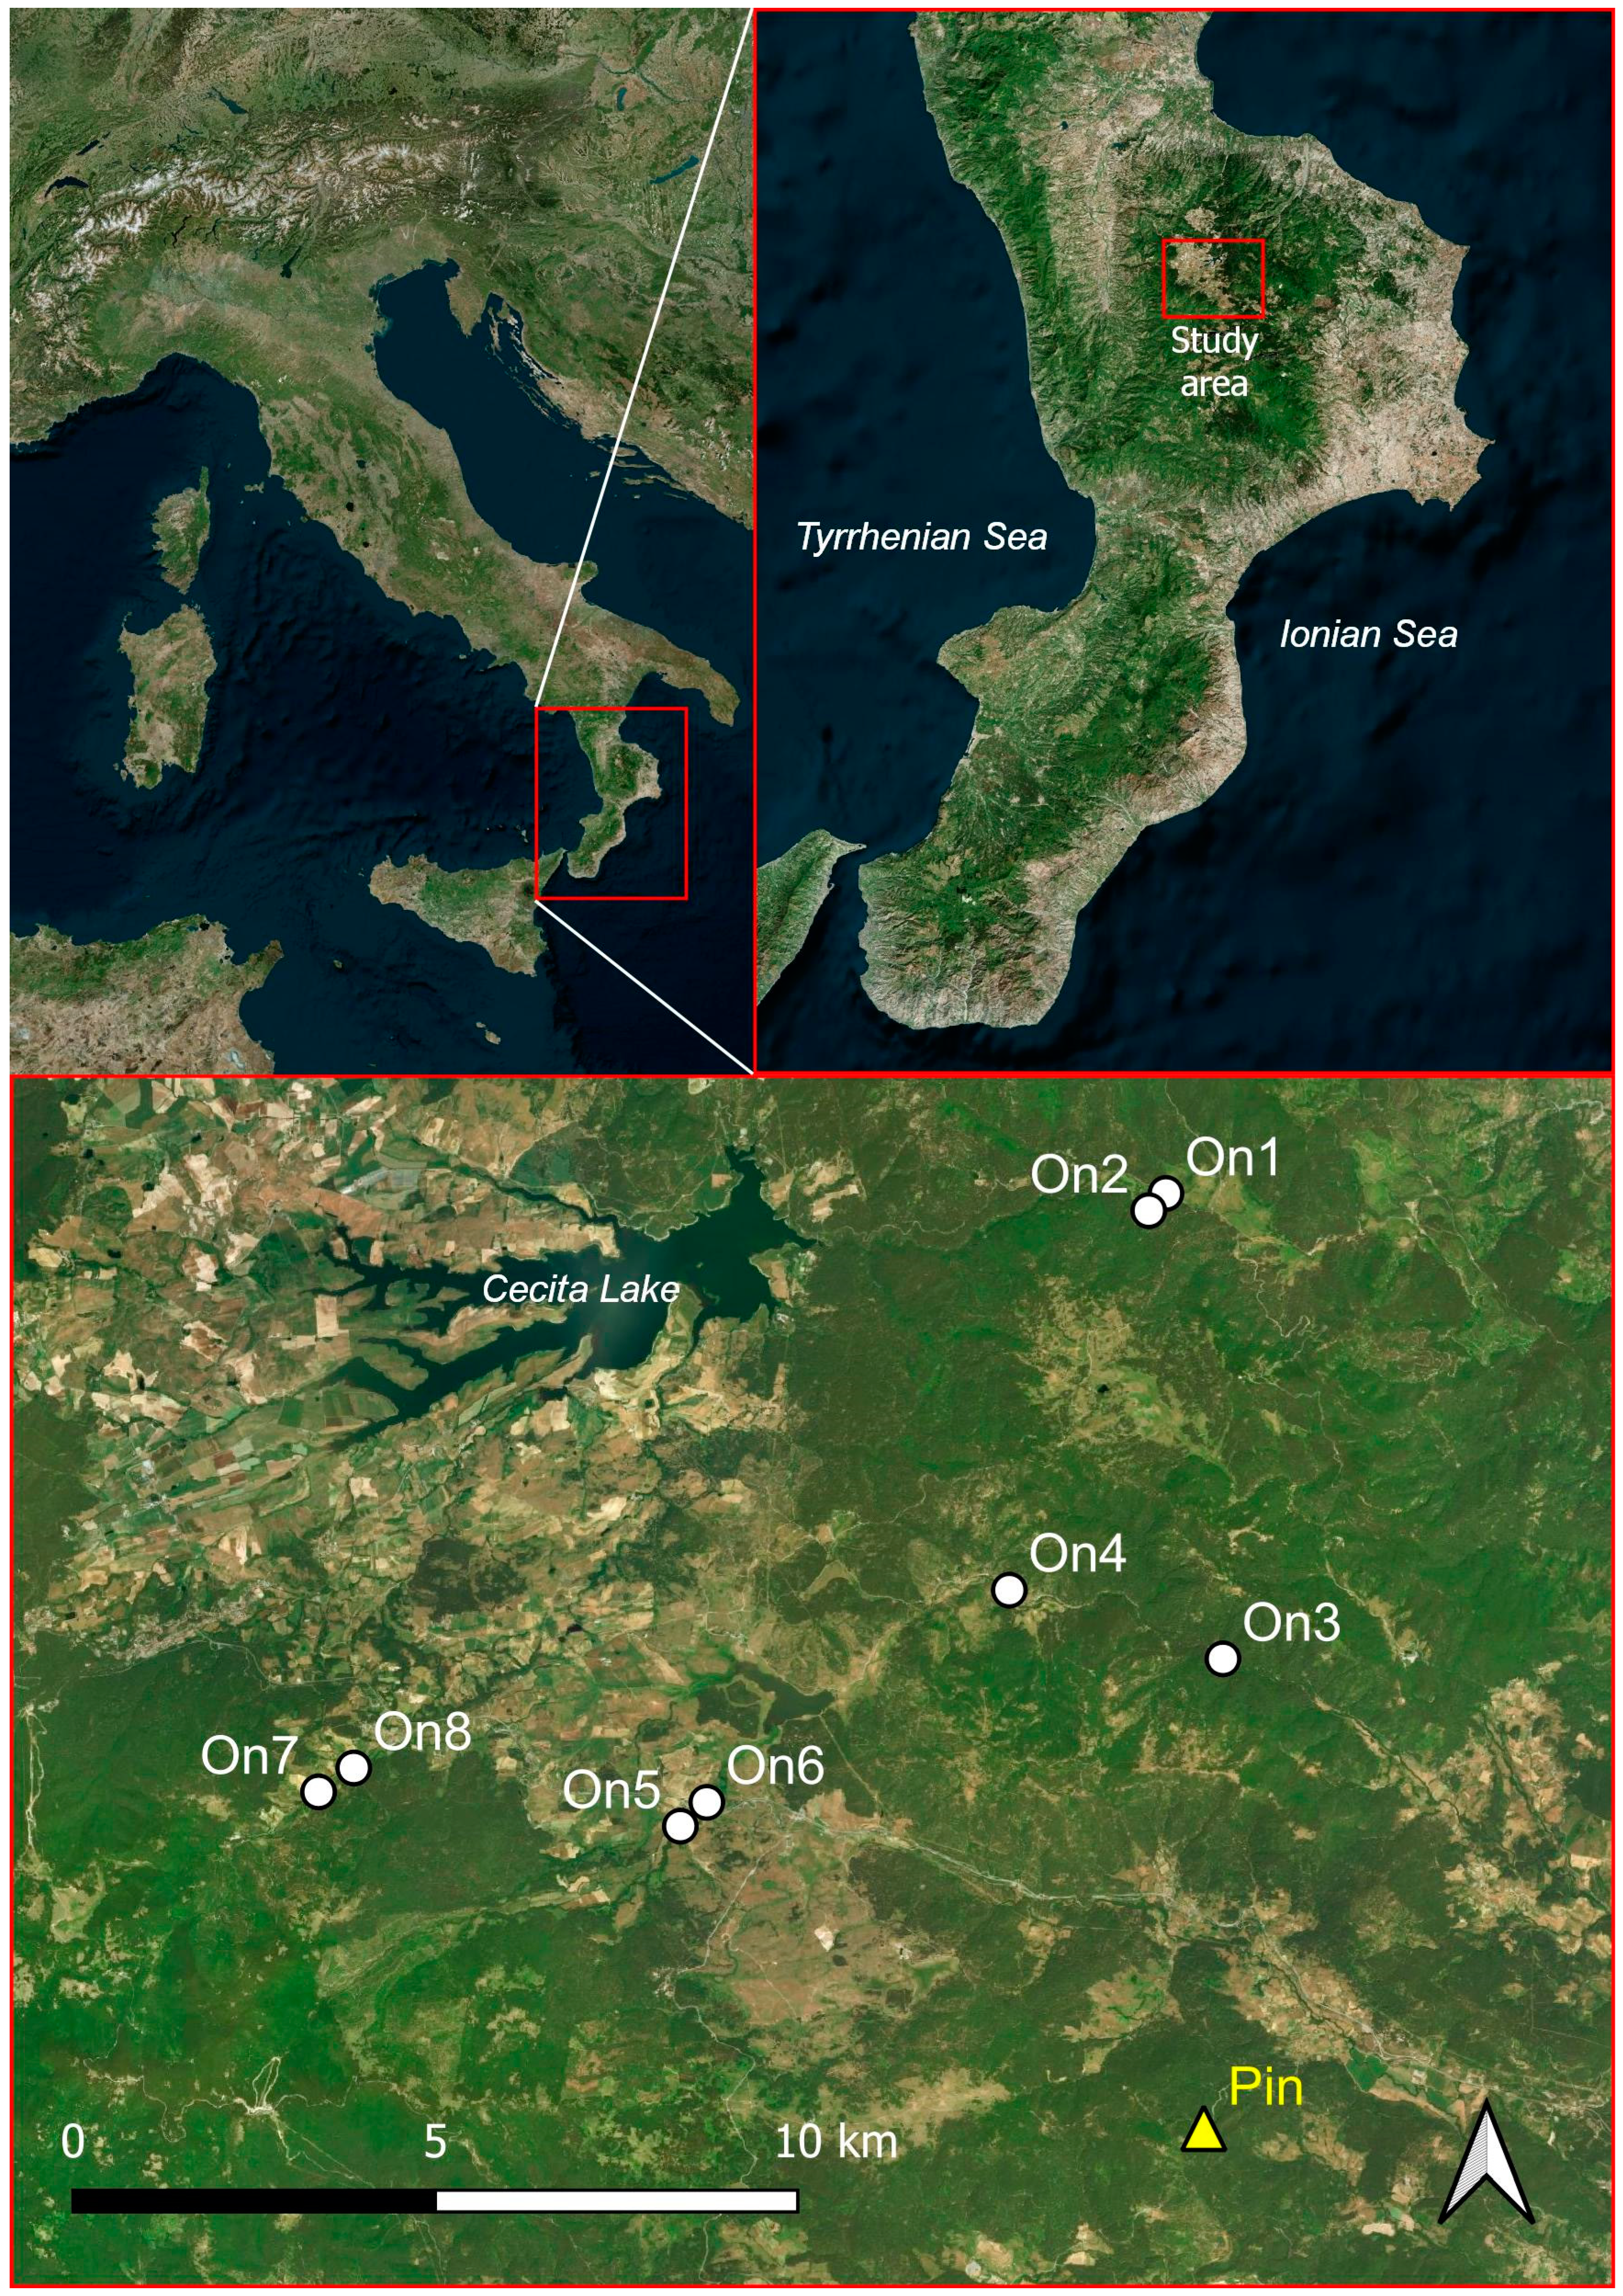
Eight sites were monitored by Leonetti et al. [47], representative of riparian alder woodlots and of the main landscapes of the study area. Leonetti et al. [47] selected four pairs, each of them represented by a linear and a compact alder woodlot located in the neighbouring of each other for minimizing the bias due to local abiotic factors. Linear woodlots were those composed by alder trees growing along watercourses surrounded by open herbaceous habitats, whilst compact woodlots were defined those at least 50 meters wide with or without lateral continuity with other forest types (Table 1). One more site was monitored in this study within a pine woodlot for a better characterization of alder communities.

Table 1.
Diversity and abundance of moths in sampled sites. Number of species (S); number of individuals (N); Shannon index (H); Equitability (J); Fisher’s alpha (α).
Table 1.
Diversity and abundance of moths in sampled sites. Number of species (S); number of individuals (N); Shannon index (H); Equitability (J); Fisher’s alpha (α).
| S | N | H | J | α | |
|---|---|---|---|---|---|
| Linear woodlots | |||||
| On1 | 131 | 663 | 4.07 | 0.83 | 48.92 |
| On4 | 86 | 359 | 3.62 | 0.81 | 35.84 |
| On6 | 137 | 635 | 4.35 | 0.88 | 53.69 |
| On8 | 131 | 669 | 4.16 | 0.85 | 48.69 |
| Compact woodlots | |||||
| On2 | 157 | 1179 | 4.17 | 0.82 | 48.63 |
| On3 | 151 | 1140 | 4.05 | 0.81 | 46.66 |
| On5 | 151 | 849 | 4.23 | 0.84 | 53.41 |
| On7 | 147 | 704 | 4.36 | 0.87 | 56.57 |
2.2. Moth sampling
Moth data were mostly gathered from Leonetti et al. [47], supplemented by original data sampled in a pine woodlot and with taxonomic changes occurred in recent years [52]. Due to the confirmed presence of both species in the study area [53] and their hard discrimination, we considered the recent recognised Hoplodrina alsinides and H. octogenaria as a species pair cited in this paper as Hoplodrina cfr. octogenaria.
Leonetti et al. activated an UV LED light trap per site one night per month from March to November 2017 in georeferenced points obtaining a total of 72 samples. Traps worked simultaneously in all sites reducing the effects of different weather conditions on collected data. Sampling nights were chosen near the new moon phase (±7 days), with temperature no lower than the mean of the period, with low wind (<10 km/hour), and possibly with no or low rain. Collected material was sorted in laboratory and moths belonging to the selected superfamilies (Hepialoidea, Zygaenoidea, Cossoidea, Lasiocampoidea, Bombycoidea, Drepanoidea, Geometroidea, and Noctuoidea) were identified at species level and counted. Voucher specimens were preserved in the scientific collection of Lepidoptera of the Research Centre for Forestry and Wood, Rende, Italy. For any further detail on samplings see Leonetti et al. [47]. We sampled a pine woodlot from April to October 2022 following the same trapping design obtaining a total of 6 samples. Data from 78 samples were pooled and arranged in a species/site matrix and then submitted to statistical analyses.
2.3. Forest structure
In this study we selected structural parameters of forest which are known to be relevant in determine animal and plant diversity [25] i.e. age of trees, that determines lichen and bird diversity [26], tree density and basal area that affects diversity in dry and tropical forests [30]. Furthermore, we separately evaluated these parameters for dead and alive trees, as the former seems to affect forest diversity differently [54,55]
We evaluated classical dendrometric parameters within a radius of 25 meters around sampling points in order to characterise alder woodlots. In detail, we measured separately for alive and dead trees, the followings: estimated tree age, mean tree hights (m), tree density (n/ha), mean diameter of stems at breast hight (DBHmean), total basal area (BAtot), total dendrometric volume (Vtot). Tree heights were measured using an infrared ipsometer Vertex III, whilst diameters were extrapolated from measured stem circumferences. Tree age for a plot was extrapolated measuring the age of the tree with the DBH nearest to the mean of the plot by using a Pressler’s coring device. Dendrometric volumes were computed by using volume table for alder forests of Sila Mountains [56].
2.4. Landscape configuration
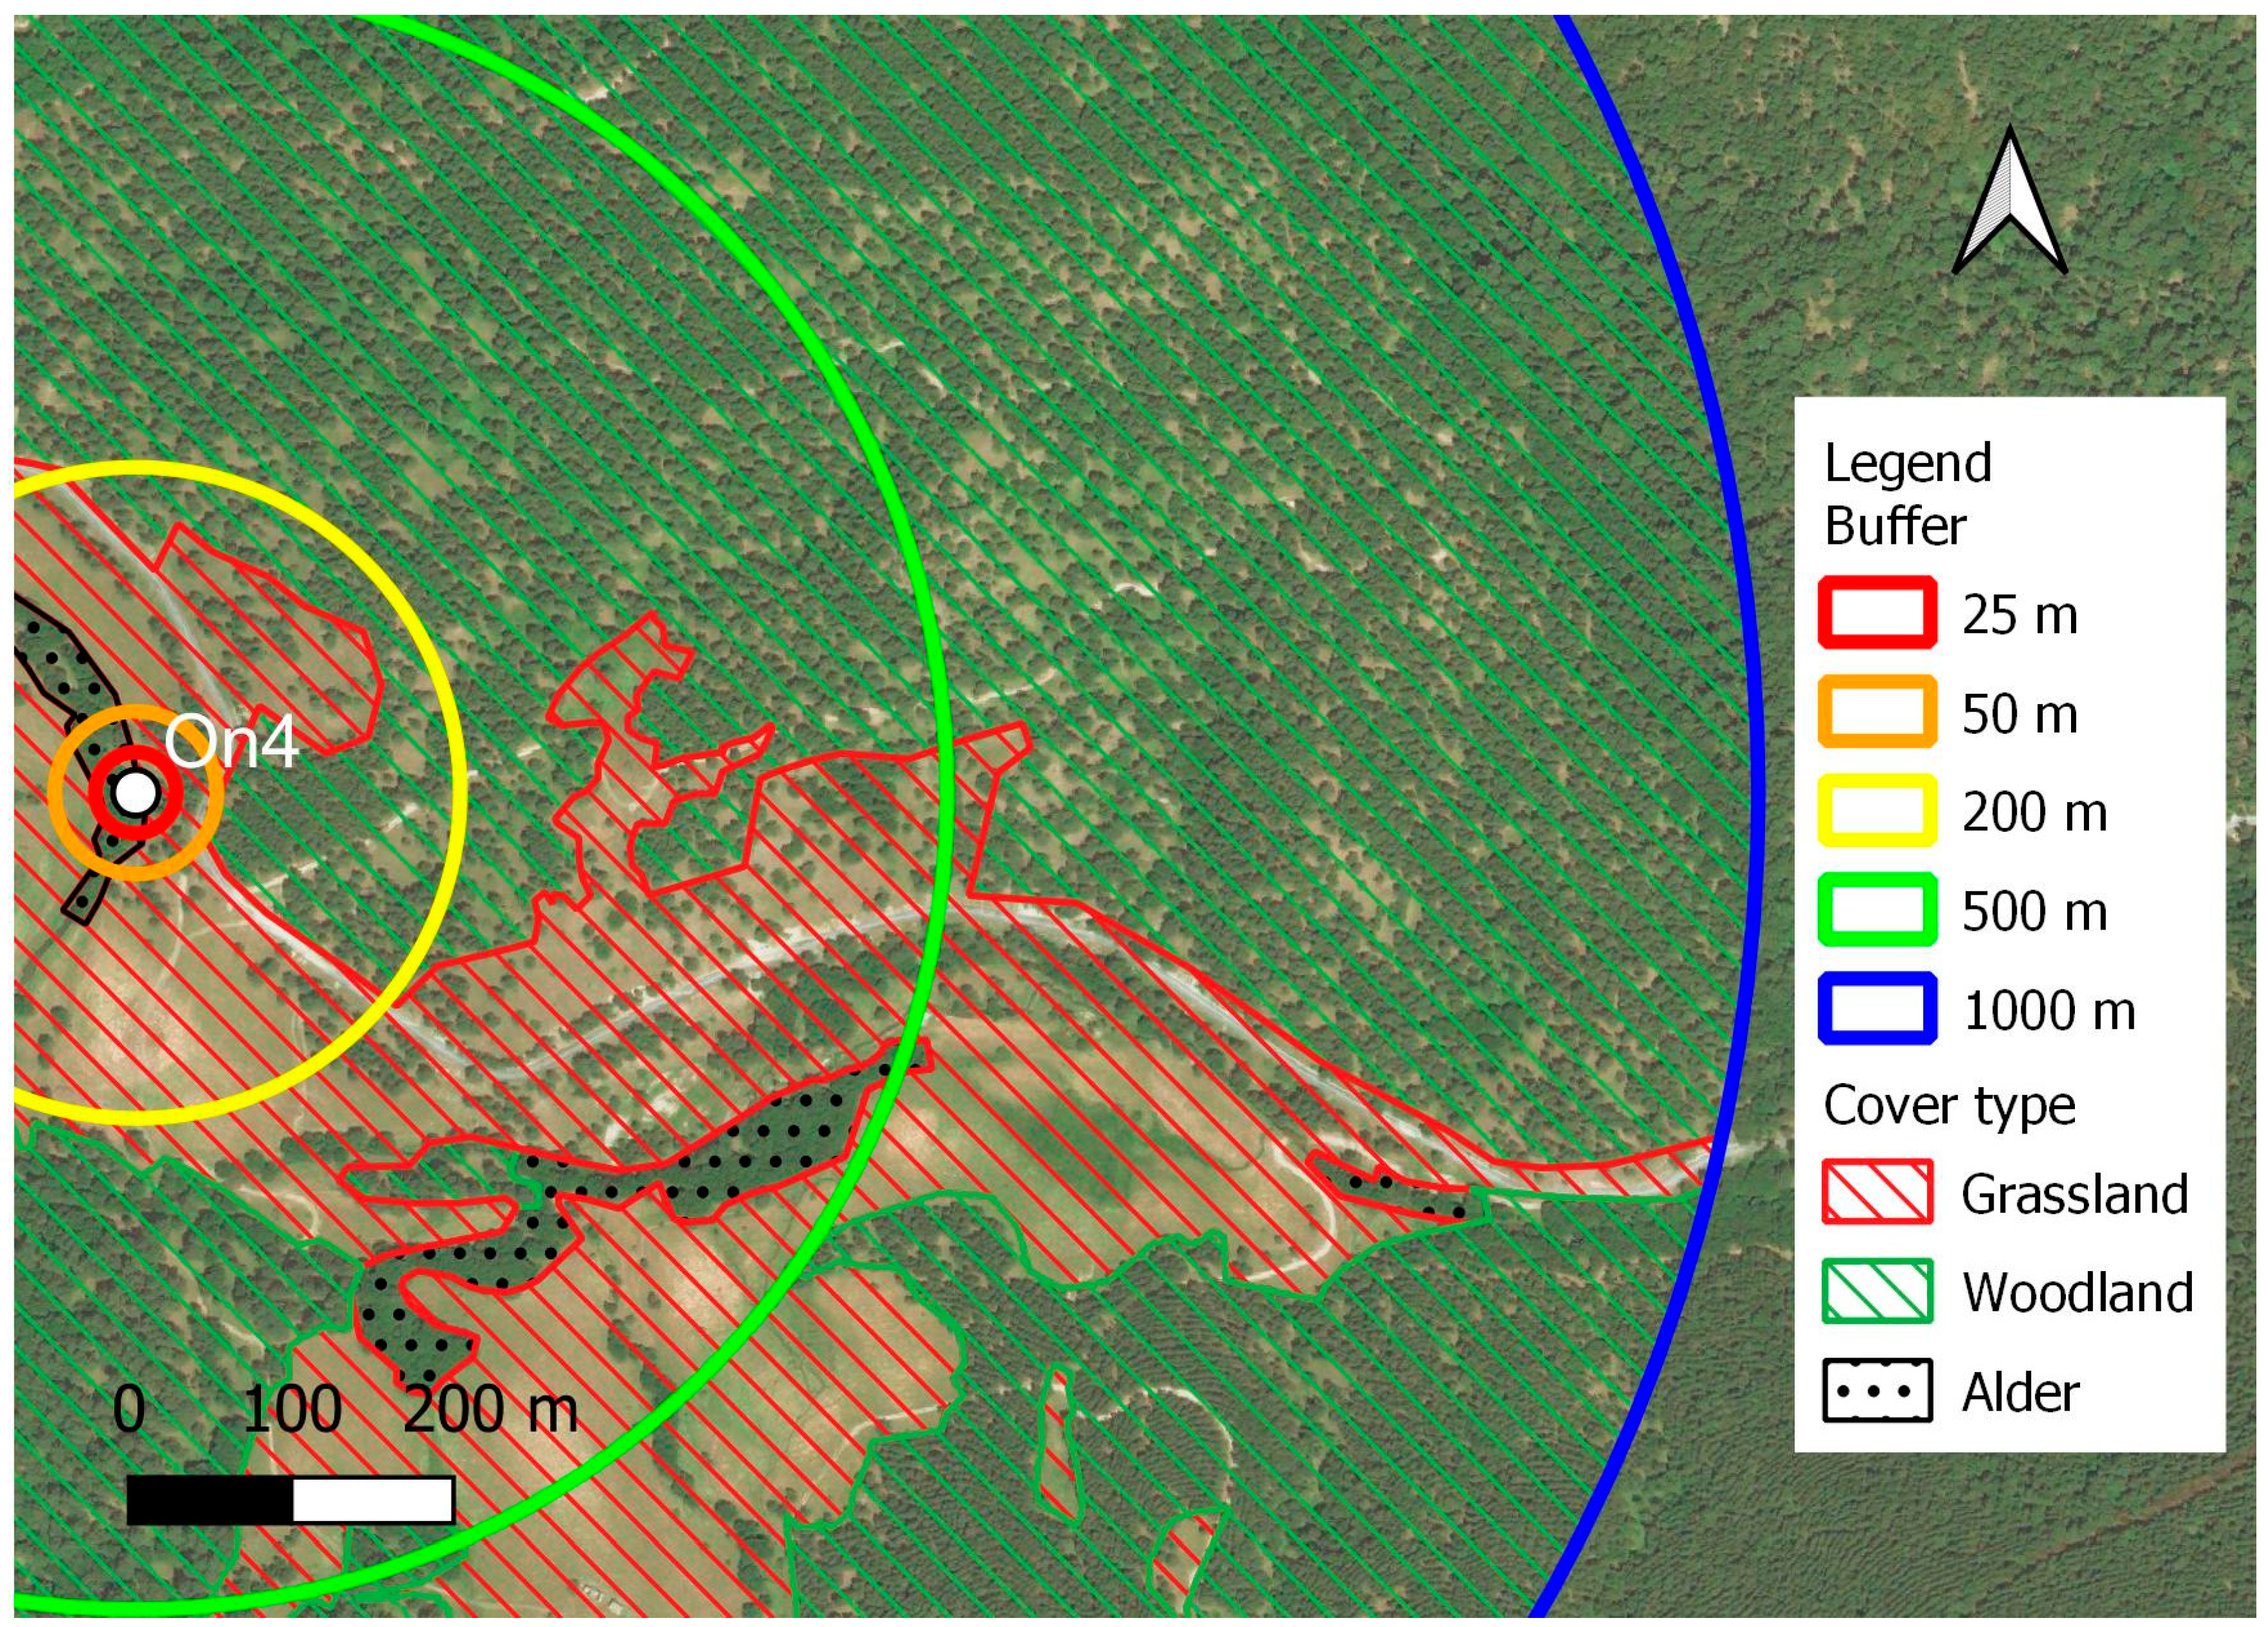
Landscape was described around each moth trap (sampling point) using circular buffers of 25, 50, 200, 500, and 1,000 meters. The smallest radius is those describing the landscape from which the trap is expected to attract moths [57], the largest is those describing the landscape where most moths are expected to live due to their dispersal abilities [58]. Resulting circular landscapes were analysed using two landscape metrics: proportion of classes and shared edge length, both at a class level [59]. Three classes were selected according to the study goals, including alder woodlots, forests, and grasslands (Figure 2). Alder woodlots are the subject under study from which moths were sampled and analysed. Forests, whichever their composition was, share similar abiotic conditions with alder woodlots having higher permeability to moth movements than herbaceous habitats. Shared edge length is the measure of the ecotone between forests and grasslands, becoming a proxy of habitat fragmentation in fixed buffers. Every single patch was manually digitized as a polygon in GIS environment, based on satellite image as background layer, and then merged by attributes. Features areas and shared edges were automatically computed using QGis processing tools.
Figure 2.
Schematization of landscape interpretation and analysis around light trapping points at five different buffers. The white dot indicates the location of the light trap.
Figure 2.
Schematization of landscape interpretation and analysis around light trapping points at five different buffers. The white dot indicates the location of the light trap.
2.5. Moth analysis
Differences in abundance and richness of moth communities between linear and compact black alder woodlots were compared by mean of the Mann-Whitney test for medians running PAST 4.03 [60]. Diversity indices were also computed, namely Shannon (H), Equitability (J), and Fisher’s alpha (α).
Main ecological processes shaping beta-diversity are known to be the turnover, or species substitution, and the nestedness, or species impoverishment. Diversity of altered habitats as we hypothesized linear woodlots to be, usually tends to be nested within the natural ones, as compact woodlots are assumed to be in this study. Then, we expect that in woodlot pairs, linear alder moth communities are nested within compact ones. To test this hypothesis, we computed the “Nestedness metric based on Overlap and Decreasing Fill” (NODF) for a binary matrix following Almeida-Neto et al. [61], running Nestedness for Dummies (NeD) [62].
Then, abundance matrix of sampled alder and pine woodlots were submitted to Correspondence Analysis (CA) by running PAST 4.03 [60].
3. Results
3.1. Moth
A total of 8,451 individuals belonging to 332 taxa were included in this study, of which 6,198 individuals belonging to 309 taxa were collected in alder woodlots (Table S1). Most abundant species were Orthosia incerta, Eilema lurideola, E. complana, and Hoplodrina cfr. octogenaria, representing altogether the 18% of the whole sample.
Linear woodlots inhabit communities with significantly less species (p = 0.028) and less individuals (p = 0.030) than compact ones, but computed diversity indices are not statistically different (Table 1). However, linear communities were not nested within the respective compact pair, with one exception only represented by On4 (Table 2).
Table 2.
Nestedness metric based on Overlap and Decreasing Fill (NODF) for sampled woodlot pairs.
| alder woodlots linear vs. compact |
NODF | nested | |
|---|---|---|---|
| On1 vs. On2 | 49.344 | NO | p > 0.05 |
| On4 vs. On3 | 45.554 | YES | p < 0.001 |
| On6 vs. On5 | 50.064 | NO | p > 0.05 |
| On8 vs. On7 | 50.177 | NO | p > 0.05 |
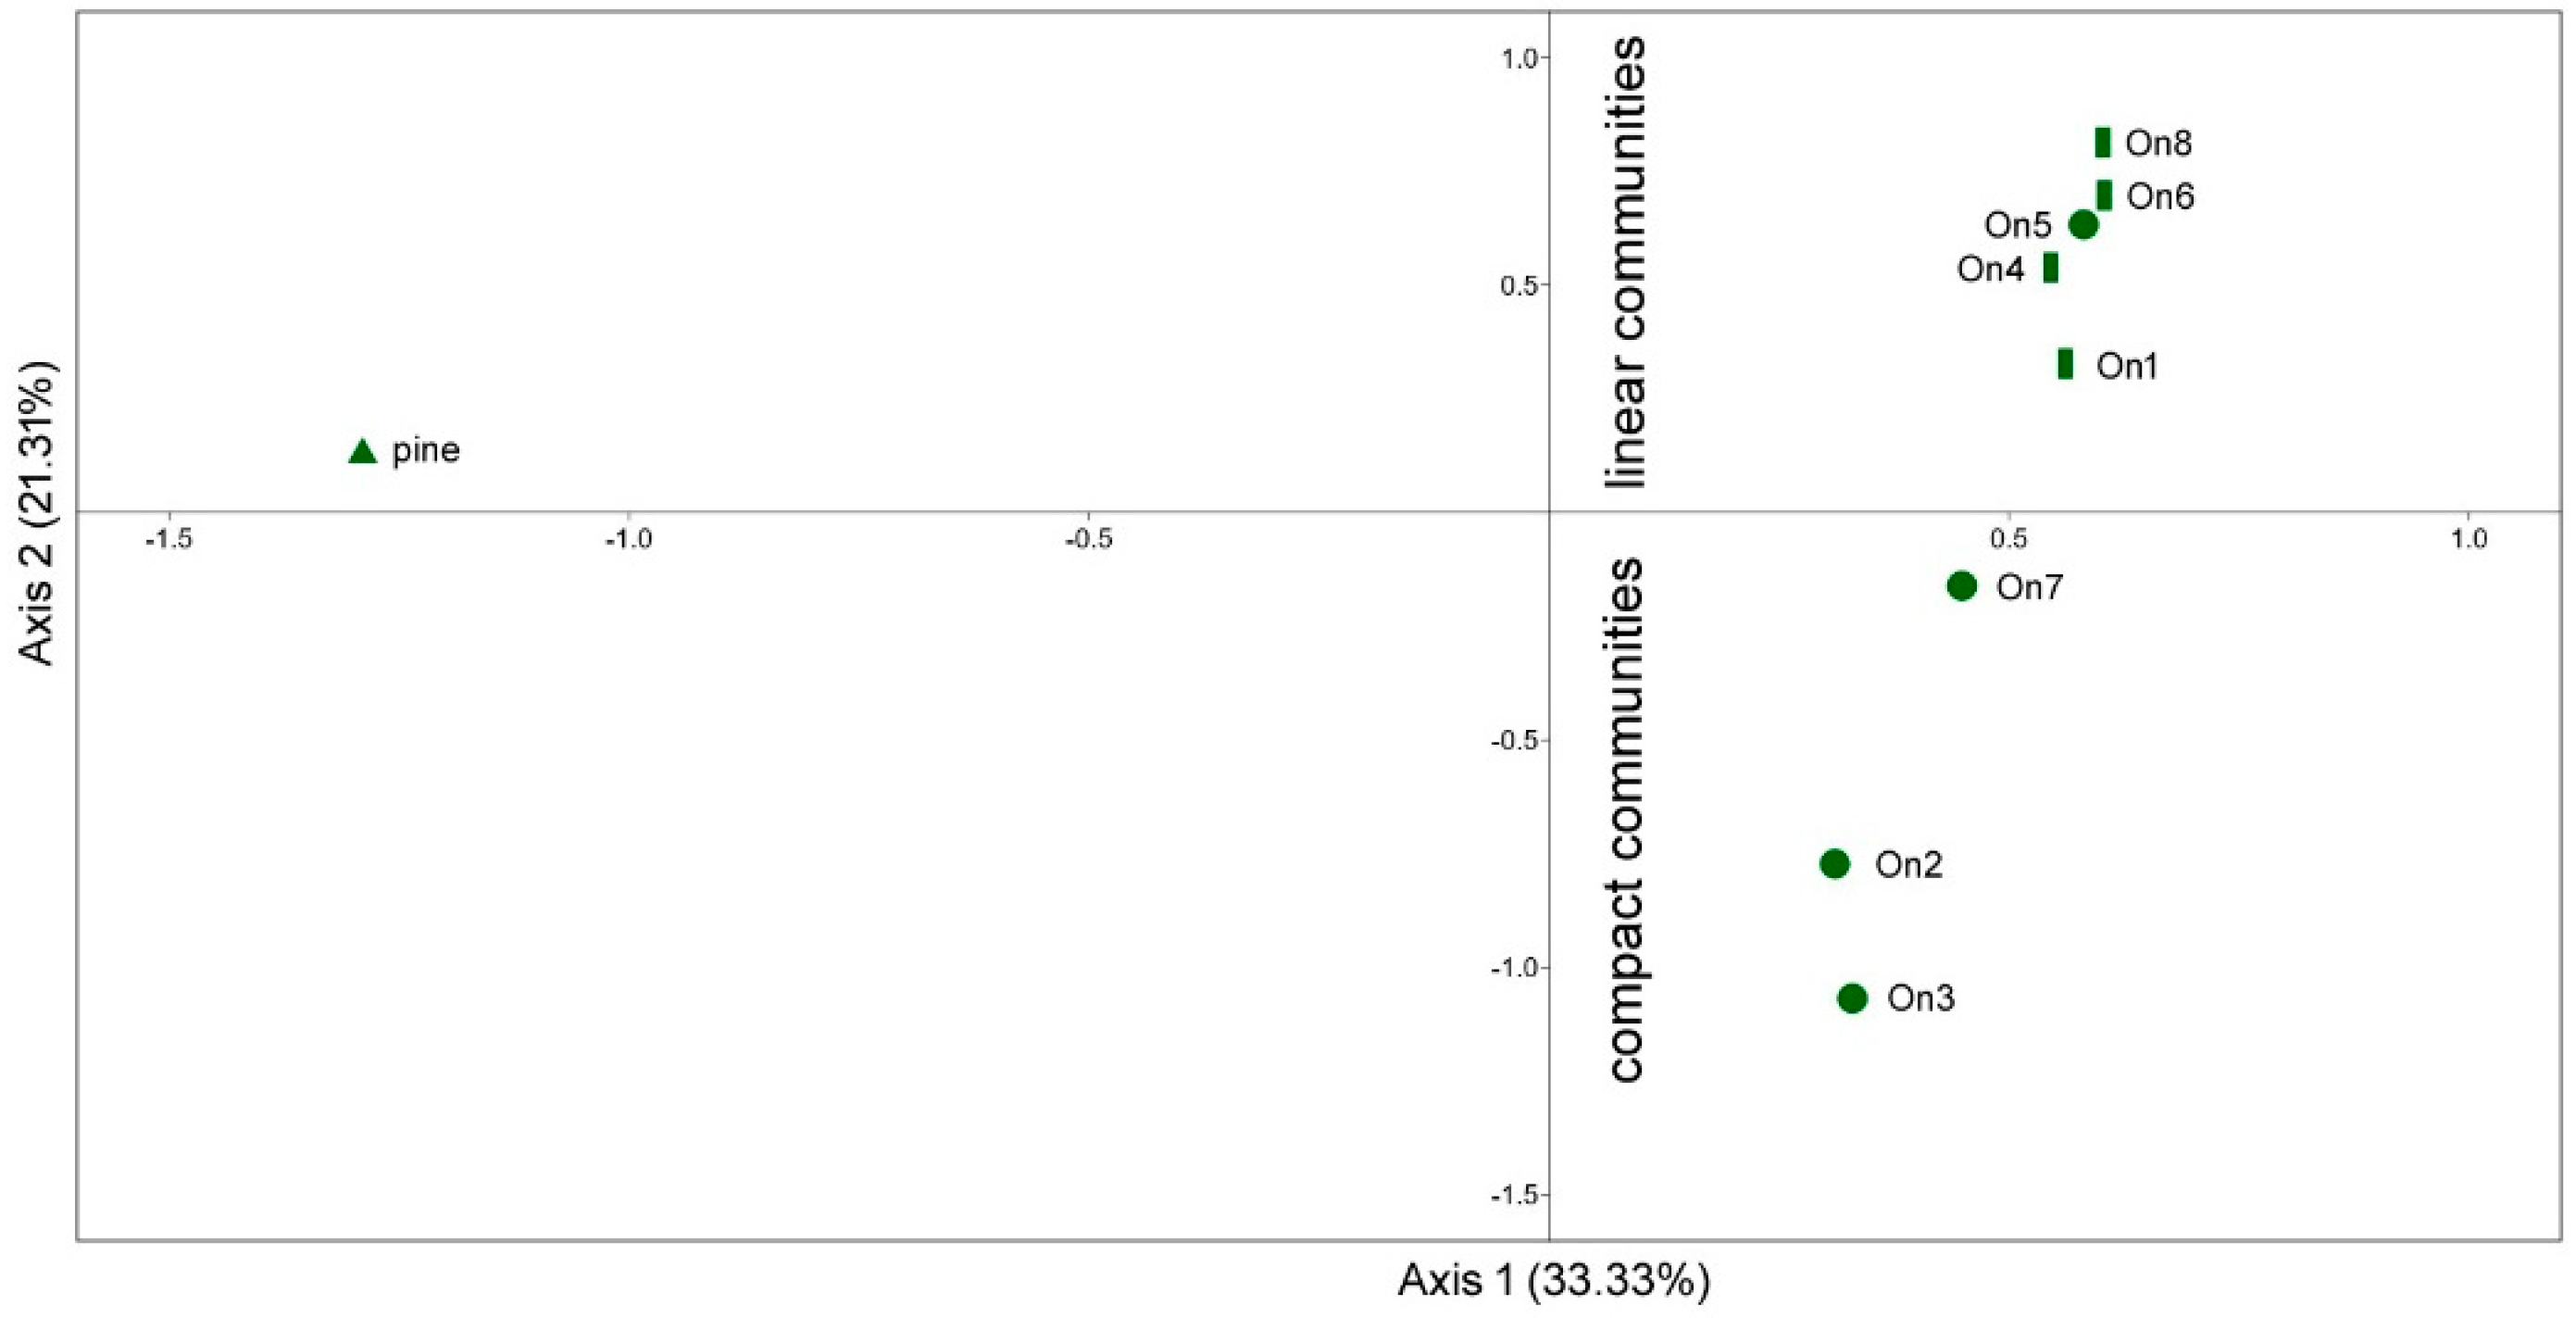
The abundance-based Correspondence Analysis (CA) showed that moth communities were primarily shaped by forest types being the pine strongly separated from alder communities along the Axis 1. On the other hand, alder communities were only slightly separated along the Axis 1, having most of compact alders lower values than linear ones (Figure 3). A fairly better separation of alder woodlots was observed along the Axis 2 assuming most of compact ones negative and all linear ones positive values. CA showed that the supposed compact woodlot On5 inhabits a linear community despite its forest structure at stand level (Figure 3).
Figure 3.
Moth communities sampled within sampled alder (circle: compact; bar: linear) and pine (triangle) woodlots plotted on a cartesian plan individuated by axis 1 e axis 2 of Correspondence Analysis.
Figure 3.
Moth communities sampled within sampled alder (circle: compact; bar: linear) and pine (triangle) woodlots plotted on a cartesian plan individuated by axis 1 e axis 2 of Correspondence Analysis.
By splitting individual moth samples according to CA in two groups, we found that among the ten most abundant species in linear communities only two were also among the ten most abundant species in compact communities, namely Orthosia incerta and Hoplodrina cfr. octogenaria (Table 3). Most characteristic species for linear communities were Agrotis cinerea, Luperina testacea, and L. dumerilii, whilst those characterising compact communities were Eilema lurideola, E. complana, and Lithosia quadra (Table 3).
Table 3.
Abundance (N) and rank of the ten most abundant species within linear and compact black alder woodlots.
Table 3.
Abundance (N) and rank of the ten most abundant species within linear and compact black alder woodlots.
| Species |
Linear communities (N = 5) |
Compact communities (N = 3) |
|||
|---|---|---|---|---|---|
| N | Rank | N | Rank | ||
| Non characteristic species | |||||
| Orthosia (Orthosia) incerta | 229 | 1 | 103 | 4 | |
| Hoplodrina cfr. octogenaria | 166 | 2 | 62 | 9 | |
| Peribatodes rhomboidaria | 67 | 8 | 52 | 13 | |
| Epirrhoe alternata | 65 | 9 | 23 | 34 | |
| Pachetra sagittigera | 61 | 10 | 25 | 32 | |
| Lycia hirtaria | 48 | 14 | 145 | 3 | |
| Characteristic species for linear woodlots | |||||
| Agrotis cinerea | 145 | 3 | 21 | 36 | |
| Luperina testacea | 105 | 4 | 14 | 49 | |
| Luperina dumerilii | 82 | 5 | 4 | 105 | |
| Mythimna (Mythimna) impura | 79 | 6 | 16 | 44 | |
| Agrotis exclamationis | 76 | 7 | 8 | 43 | |
| Characteristic species for compact woodlots | |||||
| Eilema lurideola | 19 | 44 | 289 | 1 | |
| Eilema complana | 25 | 31 | 221 | 2 | |
| Lithosia quadra | 5 | 106 | 96 | 5 | |
| Xestia (Megasema) triangulum | 14 | 59 | 81 | 6 | |
| Diarsia mendica | 20 | 43 | 64 | 7 | |
| Dysstroma truncata | 2 | 155 | 64 | 8 | |
| Alcis repandata | 10 | 73 | 60 | 10 | |
3.2. Forest structure
Among the parameters involved in the dendrometric analysis, only the tree density showed results driven by the woodlot choice. In fact, all compact woodlots were denser than linear ones in the analysed buffer of 25 meters, considering both all tree species and alders alone (Table 4). Most of linear woodlots had older and larger trees than those composing compact ones, but they showed lower values of total basal area and total dendrometric volume (Table 4). The woodlot On1 was an exception among the linear ones as those with the highest trees and the highest amount of total dendrometric volume. Similarly, On2 was an exception among the compact woodlots because of the very low total dendrometric volume. Dead trees were present in three compact woodlots and in one linear woodlot only. Tree species different than alders were present within two sites of both woodlot shapes, but more abundant within compact ones. Summarising, linear woodlots were composed by less trees than compact woodlots resulting in a lower amount of wood, but these trees were older and larger than those in compact woodlots.
Table 4.
Forest structure of sampled woodlots. DBHmean: mean±S.D. of diameters at breast high; BA: basimetric area; Vtot: estimated total volume of wood.
Table 4.
Forest structure of sampled woodlots. DBHmean: mean±S.D. of diameters at breast high; BA: basimetric area; Vtot: estimated total volume of wood.
| Shape of alder woodlots | Linear | Compact | |||||||
| Woodlot | On1 | On4 | On6 | On8 | On2 | On3 | On5 | On7 | |
| All tree species | |||||||||
| Heightmean (m) | 35.9±3.9 | 19.6±1.9 | 18.9±3.2 | 14.1±4.7 | 20.6±1.7 | 21.8±3.6 | 16.2±3.7 | 23.1±2.6 | |
| Estimated age (y) | 46 | 45 | 31 | 35 | 26 | 33 | 23 | 34 | |
| Density (n/ha) | 589 | 287 | 597 | 342 | 835 | 916 | 1,989 | 995 | |
| DBHmean (cm) | 41.0±8.9 | 41.2±14.5 | 25.1±12.1 | 32.3±16.6 | 21.8±11.2 | 27.2±10.0 | 17.6±6.4 | 28.0±7.5 | |
| BAtot (m2/ha) | 77.7 | 36.8 | 29.6 | 28.0 | 31.2 | 53.3 | 48.3 | 61.3 | |
| Vtot (m3/ha) | 745.3 | 369.0 | 268.6 | 269.1 | 270.6 | 479.8 | 378.6 | 558.2 | |
| Alders total | |||||||||
| Density (n/ha) | 589 | 279 | 597 | 326 | 716 | 836 | 1,989 | 995 | |
| DBHmean (cm) | 41.0±8.9 | 40.2±13.7 | 25.1±12.1 | 29.9±13.7 | 20.4±10.6 | 27.9±8.9 | 17.6±6.4 | 28.0±7.5 | |
| BAtot (m2/ha) | 77.7 | 35.3 | 29.6 | 23.0 | 23.4 | 51.0 | 48.3 | 61.3 | |
| Vtot (m3/ha) | 745.3 | 338.1 | 268.6 | 214.3 | 196.5 | 455.2 | 378.6 | 558.2 | |
| Alive alders | |||||||||
| Density (n/ha) | 557 | 279 | 597 | 326 | 716 | 820 | 1,870 | 971 | |
| DBHmean (cm) | 41.5±8.6 | 40.2±13.7 | 25.1±12.1 | 29.9±13.7 | 20.4±10.6 | 28.0±8.9 | 17.9±6.5 | 28.1±7.4 | |
| BAtot (m2/ha) | 75.2 | 35.3 | 29.6 | 23.0 | 23.4 | 50.6 | 47.0 | 60.2 | |
| Vtot (m3/ha) | 720.7 | 338.1 | 268.5 | 214.3 | 196.5 | 450.9 | 371.2 | 549.1 | |
| Dead alders | |||||||||
| Density (n/ha) | 32 | 0 | 0 | 0 | 0 | 16 | 119 | 24 | |
| DBHmean (cm) | 31.5±8.9 | 0 | 0 | 0 | 0 | 19.0±6.4 | 11.6±2.7 | 24.1±11.0 | |
| BAtot (m2/ha) | 2.47 | 0 | 0 | 0 | 0 | 0.45 | 1.27 | 1.09 | |
| Vtot (m3/ha) | 24.6 | 0 | 0 | 0 | 0 | 4.3 | 7.4 | 9.1 | |
| Other trees | |||||||||
| Density (n/ha) | 0 | 8 | 0 | 16 | 119 | 80 | 0 | 0 | |
| DBHmean (cm) | 0 | 69.0±0.0 | 0 | 63.5±5.4 | 28.9±12.7 | 19.2±14.1 | 0 | 0 | |
| BAtot (m2/ha) | 0 | 1.6 | 0 | 5.0 | 7.9 | 2.3 | 0 | 0 | |
| Vtot (m3/ha) | 0 | 30.9 | 0 | 54.8 | 74.2 | 19.6 | 0 | 0 | |
3.3. Landscape configuration
At large scale, woodland was the prevalent cover type from 200 m to 1,000 m buffer for On2 and On3, while grassland prevailed for On5 and On6. At smaller scale, in the 25 m buffer, the percentage of alder cover type was always over 90% for compact alder patches while it ranged between 50% and 90% among the linear ones. Alder surface was less than 50 % only for the On8 site. Moving from 25 to 50 m buffer alder area proportion did not varies significantly for On4 and On6 among the linear and for the compact On2. Among compact alder woodlots, On5 was associated with the greatest increase in grassland as the buffer radius increased. In the 50 m radius buffer grassland prevailed for all the linear patches. Cover type percentage was quite constant for linear woodlots while for compact ones it varied significantly for On5 and On7. Alder percentage variation became irrelevant beyond the 200 m buffer. Ecotone forest/grassland was similar for the same buffer radius for all the site except for the 50 m buffer where edge length was longer in linear than in compact woodlots (Table 5).
Table 5.
Landscape analysis performed around light trapping points at different buffers. Total forest cover at 25 and 50 meters of buffers correspond to alder forest cover and was not duplicated in the table.
Table 5.
Landscape analysis performed around light trapping points at different buffers. Total forest cover at 25 and 50 meters of buffers correspond to alder forest cover and was not duplicated in the table.
| Shape of alder woodlots | Linear | Compact | ||||||||||
|---|---|---|---|---|---|---|---|---|---|---|---|---|
| Woodlot | On1 | On4 | On6 | On8 | On2 | On3 | On5 | On7 | ||||
| Landscape composition | ||||||||||||
| Grassland cover (%) | ||||||||||||
| buffer_25 | 14 | 46 | 46 | 59 | 0 | 0 | 3 | 0 | ||||
| buffer_50 | 50 | 68 | 68 | 77 | 0 | 0 | 40 | 0 | ||||
| buffer_200 | 62 | 62 | 92 | 58 | 9 | 1 | 82 | 29 | ||||
| buffer_500 | 40 | 36 | 92 | 53 | 19 | 0 | 92 | 51 | ||||
| buffer_1,000 | 24 | 27 | 92 | 40 | 18 | 1 | 86 | 32 | ||||
| Alder forest cover (%) | ||||||||||||
| buffer_25 | 86 | 54 | 54 | 41 | 100 | 100 | 97 | 100 | ||||
| buffer_50 | 50 | 31 | 32 | 23 | 100 | 84 | 60 | 74 | ||||
| buffer_200 | 7 | 6 | 8 | 9 | 32 | 22 | 18 | 7 | ||||
| buffer_500 | 6 | 4 | 6 | 3 | 7 | 7 | 7 | 3 | ||||
| buffer_1,000 | 2 | 1 | 3 | 2 | 2 | 3 | 5 | 1 | ||||
| Total forest cover (%) | ||||||||||||
| buffer_200 | 38 | 38 | 8 | 42 | 91 | 99 | 18 | 71 | ||||
| buffer_500 | 60 | 64 | 8 | 47 | 80 | 100 | 8 | 49 | ||||
| buffer_1,000 | 76 | 73 | 8 | 60 | 82 | 99 | 14 | 68 | ||||
| Ecotone forests/grasslands (m) | ||||||||||||
| buffer_50 | 205 | 210 | 230 | 242 | 0 | 0 | 196 | 0 | ||||
| buffer_200 | 1,490 | 1,584 | 739 | 1,453 | 915 | 225 | 1,647 | 1,292 | ||||
| buffer_500 | 5,697 | 7,731 | 4,267 | 6,097 | 3,496 | 375 | 4,236 | 7,176 | ||||
| buffer_1,000 | 1,365 | 17,436 | 13,220 | 22,135 | 10,833 | 1,524 | 22,642 | 17,279 | ||||
3.4. Moth-forest relationship
Moth-forest relationship was investigated searching for correlations of moth data with forest structure and landscape configuration of sampled woodlot. We found very few significant correlations between forest structure and moth data. DBH and the linked estimated tree age were negatively correlated with species richness, whilst tree density was positively correlated with compositional aspects of moth communities (CA Axis2 values) and with moth abundance (Table 6).
Table 6.
Linear correlation (Pearson) between moth community variables and structural attributes of forests. Only parameters with at least one significant correlation were included in the table. CA Axis 2: values of moth communities along the axis 2 of Correspondence Analysis; S: number of species; N: number of individuals; a: Fisher’s alpha diversity index.
| CA Axis 2 | S | N | a | |
|---|---|---|---|---|
| Forest total | ||||
| Estimated age (y) | N.S. | -0.754* | N.S. | N.S. |
| Density (n/ha) | -0.765* | N.S. | N.S. | N.S. |
| DBHmean (cm) | N.S. | -0.784* | N.S. | N.S. |
| Alders total | ||||
| DBHmean (cm) | N.S. | -0.761* | N.S. | N.S. |
| Alive alders | ||||
| DBHmean (cm) | N.S. | -0.754* | N.S. | N.S. |
| Other trees | ||||
| Density (n/ha) | -0.821* | N.S. | 0.825* | N.S. |
| DBHmean (cm) | N.S. | N.S. | N.S. | -0.774* |
p<0.05 = *.
Community composition, synthesised by the values of CA Axis2, was significantly related to selected landscape variables mostly at the buffers of 50 and 200 meters, but never to the largest one of 1,000 meters. Number of individuals was significantly correlated at the buffers of 50 and 200 meters, and equitability only to the 500 meters buffer. Grasslands and ecotones were positively correlated with moth compositional aspects (CA Axis2 values) and equitability, but negatively correlated with moth abundance. Consequently, the opposite occurred for forests (Table 7).
Table 7.
Linear correlation (Pearson) between moth community variables and landscape configuration. Only parameters with at least one significant correlation were included in the table. CA Axis 2: values of moth communities along the axis 2 of Correspondence Analysis; N: number of individuals; J: Equitability.
| CA Axis 2 | N | J | |
|---|---|---|---|
| Grasslands cover (%) | |||
| buffer_25 | 0.719* | N.S. | N.S. |
| buffer_50 | 0.898** | -0.760* | N.S. |
| buffer_200 | 0.932*** | N.S. | N.S. |
| buffer_500 | 0.786* | N.S. | 0.732* |
| Alder forest cover (%) | |||
| buffer_25 | -0.719* | N.S. | N.S. |
| buffer_50 | -0.893** | 0.847** | N.S. |
| buffer_200 | N.S. | 0.910** | N.S. |
| Forest cover (%) | |||
| buffer_200 | -0.932*** | N.S. | N.S. |
| buffer_500 | -0.784* | N.S. | -0.732* |
| Ecotone forests/grasslands (m) | |||
| buffer_50 | 0.928*** | -0.709* | N.S. |
p<0.05 = *; p<0.01 = **; p<0.001 = ***.
4. Discussion
Black alder forests inhabit well characterized moth communities, that resulted very different from those found in a pine forest located at the same altitude, on the same geological substratum, and near to sampled alder woodlots. This occurred despite black alder forests are usually surrounded by pine forests. Ienco et al. [29] demonstrated that community composition is mainly driven by vegetation type, but our data also demonstrated an important role of other drivers when an individual forest type is analysed.
The study concerned eight sampled woodlots that can be considered a low number of sites, but it is very hard to find in the field woodlots pairs having in the shape the only difference. Furthermore, the dataset we used covered the whole flight period of moths encompassing the main beta-diversity driver for Lepidoptera. i.e. phenological changes [63], resulting in well-established datasets.
We found that moth communities of black alder forests of the Sila Massif were primarily shaped by landscape configuration, having forest structure a weaker effect. Furthermore, our hypothesis that linear woodlots inhabit an impoverished version of communities inhabiting compact ones seemed to be not confirmed.
As expected for impoverished communities, a lower species richness resulted within linear moth communities, thus apparently supporting our main hypothesis. On the contrary, the NODF analysis failed to support it, as most of linear communities were shaped by the turnover, with only one exception. The latter concerned a woodlot surrounded by a heavy grazed grassland, where cows were present constantly across the summer. Grazing is known to be detrimental to the moth diversity [64,65]. In our case, the impoverished moth community of grassland was not able to support the turnover, increasing the contribution of nestedness. Then, the turnover was the main beta-diversity process involved in shaping linear woodlot communities, with grassland species entering the community in substitution of forest ones when meadows are well preserved.
In multivariate analysis moth communities were mostly grouped accordingly to forest patch shapes, with one exception concerning the sole compact woodlot surrounded by grasslands (On5). We defined as compact the woodlots at least 50 metres wide, but our results demonstrated this measure be too small for reducing the edge effect when a riparian woodlot is not surrounded by other forest types. In fact, the On5 community resulted richer than expected in grassland individuals and poorer in forest ones. As an example, Agrotis cinerea, very abundant in mountain grasslands of South Italy [66], was particularly common within the On5 community. On the other hand, Diarsia mendica, living within different kind of forests [67] and common within compact alder woodlots, was found with only one individual in this woodlot. It has already been observed that the increasing of edges, a proxy of forest fragmentation, leads to a decrease of forest species populations [12,68,69]. However, the edges have not all the same ecological significance, as those between different forest types are obviously milder than those between forest and non-forest habitats, due to the similar abiotic conditions. Then, the edges between forests are weaker barriers to moth movements allowing the persistence of a characteristic alder moth community also in case of small woodlots.
Only few forest structure variables we studied were correlated with moth community attributes, i.e. estimated tree age, tree density, and diameter at breast high (DBH). Tree age, and the related DBH, was negatively correlated to diversity, apparently in contradiction with previous papers that found a higher diversity in older forests [70,71]. However, we found this discrepancy because trees growing along riverbanks, and then composing linear woodlots, were older than those growing within compact woodlots. This finding points out that a forest ecosystem could be defined old not only when composed by old trees, but when all the portion of a given ecosystem are at a mature successional stage as observed in old-growth forests [72].
Tree density seems to be effective in determining moth community composition as previously observed for other animals [73,74,75] due to changes in biotic and abiotic parameters. In addition, we found a positive correlation between tree density and moth abundance, as also observed by Fuentes-Montemayor et al. (13,75). In denser forests we would expect a reduced abundance of moths because the abundance and diversity of larval food plants is reduced due to low light [76,77,78]. On the contrary, we found an increased abundance of moths. This anomaly could be due to the lower predation pressure of Chiroptera registered in denser forests [79,80,81], but this should be better investigated.
Our data confirmed the findings of previous studies in which a buffer of about 200 metres is the best to describe the relationships of Lepidoptera community composition with landscape metrics [82,83,84], being always not significant at 1,000 metres of buffer. Black alder forests usually occupy very small surfaces [85], having a decreasing relationship with moth community composition when the buffer under consideration is too large. However, considering the surface of all forest types, the correlation between forest cover and moth community composition is still very significant. The negative correlation we found between equitability and forest cover at 500 meters of buffer, could be due to the increasing of the abundance of individual species linked to this habitat.
From a practical point of view, our study suggests that a width of 50 m may be not enough to give functionality to isolated riparian woodland patches, at least for moth communities. Our outcome may help not only forest habitat restoration planners aiming at increasing landscape connectivity [75], but also policy-makers. For the Italian law (D.Lgs 03 April 2018 n. 34, Testo Unico in materia di Foreste e Filiere Forestali [Consolidated Act on Forestry and Forest Chain]) a forest, to be such, must have a minimum width of 20 meters, significantly narrower than needed according to our results. Narrow and isolated forest patches can play at their best only the role of corridors and/or stepping-stones for forest specialist species [58]. Maintenance of large riparian forests promotes the integrity of waterways [86], being beneficial for both biodiversity and water quality.
5. Conclusions
Riparian forests provide several ecological services, among which biodiversity conservation is of relevant importance especially within national parks. However, in times of rapid habitat degradation, a more effective and informed riparian woodlot management is needed, and it should be supported by inter-disciplinary analyses. In this paper we found a secondary role of forest structure in driving composition and diversity of moth communities, having patch shape and landscape configuration a major role. Differences between linear and compact woodlot pairs were mostly due to the turnover, not confirming the original hypothesis that linear woodlots inhabit an impoverished version of moth communities, but only when grasslands are in a good conservation status. Our results can help to improve forest management planning because of the importance arisen from woodlot width and landscape configuration. Silvicultural intervention and forest restoration should avoid isolated spotted forest patches since they may not deliver the expected ecological benefit, being unable to support a forest specialist community. Increasing the minimum sizes for a forest, to be considered as such, leads to reduce the edge effect especially when other forests do not surround the riparian woodlot. This may assume an even greater significance in times of rapid landform transformation and climate changes that are expected to make riparian woodland more and more vulnerable.
Author Contributions
Conceptualization, S.S.; Methodology, V.B., R.T. and S.S.; Formal Analysis, V.B., R.T., F.F. and M.L.; Data Curation, V.B., R.T., L.B. and S.S.; Writing – Original Draft Preparation, S.L.C., M.L. and S.S.; Writing – Review & Editing, F.F., G.R., L.B., G.Z., S.L.C., M.L. and S.S.; Visualization, M.L. and F.F.; Supervision, S.S.; Funding Acquisition, S.S.
Funding
This research was funded by the Sila National Park, Project “Il Barcoding delle farfalle nel Parco Nazionale della Sila: aree umide”, and with the support of the National Biodiversity Future Centre (NBFC) to Research Centre for Forestry and Wood, Rende, funded by the Italian Ministry of University and Research, PNRR, Missione 4 Componente 2, “Dalla ricerca all’impresa”, Investimento 1.4, Project CN00000033.
Data Availability Statement
data available from: Leonetti, F. L., Greco, S., Ienco, A., & Scalercio, S. (2019). Lepidopterological fauna of Alnus glutinosa (L.) Gaertn., forests in the Sila Massif (southern Italy)(Insecta: Lepidoptera). SHILAP Revista de lepidopterología, 47(187), 535-556.
Acknowledgments
We would like to thank Marco Infusino, Silvia Greco, and Carlo Di Marco for their help during field surveys, and Giuseppe Luzzi (Sila National Park) for supporting this study releasing the collecting permit.
References
- Steffen, W.; Broadgate, W.; Deutsch, L.; Gaffney, O.; Ludwig, C. The trajectory of the Anthropocene: the great acceleration. Anthr. Rev. 2015, 2(1), 81–98. [CrossRef]
- Curtis, P.G.; Slay, C.M.; Harris, N.L.; Tyukavina, A.; Hansen, M.C. Classifying drivers of global forest loss. Science 2018, 361(6407), 1108–1111. [CrossRef]
- Sala, O.E.; Stuart Chapin, F.I.I.I.; Armesto, J.J.; Berlow, E.; Bloomfield, J.; Dirzo, R.; Huber-Sanwald E.; Huenneke, L.F.; Jackson R.B.; Kinzig, A.; Leemans, R.; Lodge, D.M.; Mooney, H.A.; Oesterheld, M.; Poff, N.L.; Sykes, M.T.; Walker, B.H.; Walker, M.; Wall, D.H. Global biodiversity scenarios for the year 2100. Science 2000, 287(5459), 1770–1774. [CrossRef]
- Davies K.F.; Margules C.R.; Lawrence J.F. Which traits of species predict population declines in experimental forest fragments? Ecology 2000, 81:1450–1461. [CrossRef]
- Sanderson, E.W.; Jaiteh, M.; Levy, M.A.; Redford, K.H.; Wannebo, A.V.; Woolmer, G. The human footprint and the last of the wild: the human footprint is a global map of human influence on the land surface, which suggests that human beings are stewards of nature, whether we like it or not. BioScience, 2002, 52(10), 891–904. [CrossRef]
- Fahrig, L. Effects of habitat fragmentation on biodiversity. Annu. Rev. Ecol. Syst. 2003, 34(1), 487–515. [CrossRef]
- Foley, J.A.; DeFries, R.; Asner, G.P.; Barford, C.; Bonan, G.; Carpenter, S.R.; Chapin, F.S.; Coe, M.T.; Daily, G.C.; Gibbs, H.K.; Helkowski J.H.; Holloway, T.; Howard E.A.; Kucharik C.J.; Monfreda C.; Patz J.A.; Prentice I.C.; Ramankutty N.; Snyder, P.K. Global consequences of land use. Science 2005, 309(5734), 570–574. [CrossRef]
- Andren, H. Effects of habitat fragmentation on birds and mammals in landscapes with different proportions of suitable habitat: a review. Oikos 1994, 355–366. [CrossRef]
- Didham, R.K., Ghazoul, J.; Stork, N.E.; Davis, A.J. Insects in fragmented forests: a functional approach. Trends Ecol. Evol. 1996, 11(6), 255–260. [CrossRef]
- Recher, H. The state of Australia’s avifauna: a personal opinion and prediction for the new millennium. Aust. Zool. 1999, 31(1), 11–27. [CrossRef]
- Fletcher, Jr. R.J.; Ries, L.; Battin, J.; Chalfoun, A.D. The role of habitat area and edge in fragmented landscapes: definitively distinct or inevitably intertwined?. Can. J. Zool. 2007, 85(10), 1017–1030. [CrossRef]
- Yamaura, Y.; Kawahara, T.; Iida, S.; Ozaki, K. Relative importance of the area and shape of patches to the diversity of multiple taxa. Conserv. Biol. 2008, 22(6), 1513–1522. [CrossRef]
- Fuentes-Montemayor, E.; Goulson, D.; Cavin, L.; Wallace, J.M.; Park, K.J. Factors influencing moth assemblages in woodland fragments on farmland: Implications for woodland management and creation schemes. Biol. Conserv. 2012, 153, 265–275. [CrossRef]
- Murcia, C. Edge effects in fragmented forests: implications for conservation. Trends Ecol. Evol. 1995, 10(2), 58–62. [CrossRef]
- Tscharntke, T.; Steffan-Dewenter, I.; Kruess, A.; Thies, C. Characteristics of insect populations on habitat fragments: a mini review. Ecol. Res. 2002, 17, 229–239. [CrossRef]
- Prugh, L.R.; Hodges, K.E.; Sinclair, A.R.; Brashares, J.S. Effect of habitat area and isolation on fragmented animal populations. PNAS 2008, 105(52), 20770–20775. [CrossRef]
- Prevedello, J.A.; Vieira, M.V. Does the type of matrix matter? A quantitative review of the evidence. Biodivers. Conserv. 2010, 19, 1205–1223. [CrossRef]
- Börschig, C.; Klein, A.M.; von Wehrden, H.; Krauss, J. Traits of butterfly communities change from specialist to generalist characteristics with increasing land-use intensity. Basic Appl. Ecol. 2013, 14(7), 547–554. [CrossRef]
- Perović, D.; Gámez-Virués, S.; Börschig, C.; Klein, A.M.; Krauss, J.; Steckel, J.; Rothenwöhrer, C.; Erasmi, S.; Tscharntke, T.; Westphal, C. Configurational landscape heterogeneity shapes functional community composition of grassland butterflies. J. Appl. Ecol. 2015, 52(2), 505–513. [CrossRef]
- Noss, R.F.; Beier, P. Arguing over little things: response to Haddad et al. Conserv. Biol. 2000, 14(5), 1546–1548. [CrossRef]
- Haila, Y.A conceptual genealogy of fragmentation research: from island biogeography to landscape ecology. Ecol. Appl. 2002, 12(2), 321-334. [CrossRef]
- Levey, D.J.; Bolker, B.M.; Tewksbury, J.J.; Sargent, S.; Haddad, N.M. Effects of landscape corridors on seed dispersal by birds. Science 2005, 309(5731), 146–148. [CrossRef]
- Gray, R.E.; Slade, E.M.; Chung; A. Y.; Lewis, O.T. Movement of moths through riparian reserves within oil palm plantations. Fron. For. Glob. Change 2019, 2, 68. [CrossRef]
- Usher, M.B.; Keiller, S.W. The macrolepidoptera of farm woodlands: determinants of diversity and community structure. Biodivers. Conserv. 1998, 7, 725–748. [CrossRef]
- Blasi, C.; Marchetti, M.; Chiavetta, U.; Aleffi, M.; Audisio, P.; Azzella, M.M.; Brunialti, G.; Capotorti, G.; Del Vico, E.; Lattanzi, E.; Persiani, A.M.; Ravera, S.; Tilia, A.; Burrascano, S. Multi-taxon and forest structure sampling for identification of indicators and monitoring of old-growth forest. Plant Biosyst 2010, 144(1), 160–170. [CrossRef]
- Moning, C.; Müller, J. Critical Forest age thresholds for the diversity of lichens, molluscs and birds in beech (Fagus sylvatica L.) dominated forests. Ecol. Indic. 2009, 9(5), 922–932. [CrossRef]
- Ostaff, D.P.; Quiring, D.T. Population trends of a specialist herbivore, the spruce bud moth, in young white spruce stands. Can. Entomol 2000, 132(6), 825–842. [CrossRef]
- Cherkaoui, I.; Selmi, S.; Boukhriss, J.; Hamid, R.I.; Mohammed, D. Factors affecting bird richness in a fragmented cork oak forest in Morocco. Acta Oecol. 2009, 35(2), 197–205. [CrossRef]
- Ienco, A.; Dapporto, L.; Greco, S.; Infusino, M.; Scalercio, S. β-diversity partitioning of moth communities within and between different forest types. Sci. Nat. 2020, 107(1), 8. [CrossRef]
- Sagar, R.; Singh, J.S. Tree density, basal area and species diversity in a disturbed dry tropical forest of northern India: implications for conservation. Environ. Conserv. 2006, 33(3), 256–262. [CrossRef]
- Allan, J.D.; Flecker, A.S. Biodiversity conservation in running waters. BioScience 1993, 43(1), 32–43. [CrossRef]
- Tewksbury, J.J.; Black, A.E.; Nur, N.A.D.A.V.; Saab, V.A.; Logan, B.D.; Dobkin, D.S. Effects of anthropogenic fragmentation and livestock grazing on western riparian bird communities. Stud. Avian Biol. 2002, 25, 158–202.
- Jansson, R.; Nilsson, C.; Renöfält, B. Fragmentation of riparian floras in rivers with multiple dams. Ecology 2000, 81(4), 899–903. [CrossRef]
- Collinge, S.K.; Holyoak, M.; Barr, C.B.; Marty, J.T. Riparian habitat fragmentation and population persistence of the threatened valley elderberry longhorn beetle in central California. Biol. Conserv. 2001, 100(1), 103–113. [CrossRef]
- Lionello, P.; Abrantes, F.; Gacic, M.; Planton, S.; Trigo, R.; Ulbrich, U. The climate of the Mediterranean region: research progress and climate change impacts. Reg. Environ. Change 2014, 14, 1679–1684. [CrossRef]
- Gibbons, J.W.; Scott, D.E.; Ryan, T.J.; Buhlmann, K.A.; Tuberville, T.D.; Metts, B. S., Greene, L.J.; Mills, T.; Leiden, Y.; Poppy, S.; Winne, C.T. The Global Decline of Reptiles, Déjà Vu Amphibians: Reptile species are declining on a global scale. Six significant threats to reptile populations are habitat loss and degradation, introduced invasive species, environmental pollution, disease, unsustainable use, and global climate change. BioScience 2000, 50(8), 653–666. [CrossRef]
- Stuart, S.N.; Chanson, J.S.; Cox, N.A.; Young, B.E.; Rodrigues, A.S.; Fischman, D.L.; Waller, R.W. Status and trends of amphibian declines and extinctions worldwide. Science 2004, 306(5702), 1783–1786. [CrossRef]
- Kitching, R.L.; Orr, A.G.; Thalib, L.; Mitchell, H; Hopkins, M.S; Graham, A.W. Moth assemblages as indicators of environmental quality in remnants of upland Australian rain forest. J. Appl. Ecol. 2000, 37(2), 284–297. [CrossRef]
- Jennings, N.; Pocock, M.J. Relationships between sensitivity to agricultural intensification and ecological traits of insectivorous mammals and arthropods. Conserv. Biol. 2009, 23(5), 1195–1203. [CrossRef]
- An, J.S.; Choi, S.W. Forest moth assemblages as indicators of biodiversity and environmental quality in a temperate deciduous forest. Eur. J. Entomol. 2013, 110(3), 509. [CrossRef]
- Greco, S.; Infusino, M.; Ienco, A.; Scalercio, S. How different management regimes of chestnut forests affect diversity and abundance of moth communities. Ann. Silvic. Res 2018, 42(2), 59–67. [CrossRef]
- Waring, P. "Moth conservation project news bulletin 2." Nature Conservancy Council, Peterborough (1989).
- Truxa, C.; Fiedler, K. Down in the flood? How moth communities are shaped in temperate floodplain forests. Insect Conserv. Diver. 2012, 5(5), 389–397. [CrossRef]
- Parenzan, P. Macrolepidotterofauna della Riserva Naturale WWF “Lago di Pignola”. Basilicata, Potenza. Contributi alla conoscenza della Lepidotterofauna dell’Italia meridionale. XXII. Phytophaga 2002, 12, 43–116.
- Scalercio, S.; Infusino, M. I Macrolepidotteri di fosso Scuotrapiti, lago dell’Angitola (Calabria, Italia meridionale) (Lepidoptera). Phytophaga 2003, 13, 25–52.
- Dapporto, L.; Fabiano, F.; Balderi, F. I macrolepidotteri della Val di Farma (Toscana). Aldrovandia 2005, 1(2004), 37–54.
- Leonetti, F.L.; Greco, S.; Ienco, A.; Scalercio, S. Lepidopterological fauna of Alnus glutinosa (L.) Gaertn., forests in the Sila Massif (southern Italy) (Insecta: Lepidoptera). SHILAP-Rev. Lepidopt. 2019, 47(187), 535–556.
- Scalercio, S. Nocturnal macrolepidoptera associated to cork oak woodlands and neighbour forest remnants in a fragmented Mediterranean landscape (Lepidoptera). Redia 2022, 105, 131–139. [CrossRef]
- Scalercio, S.; Russo, M.; Dapporto, L. Wetlands are refuge areas that delay global warming-induced range shift of Lepidoptera. In Handbook of nature conservation: Global, Environmental and Economic Issues, Aronoff J.B., Eds.; Nova Publishers: New York, USA, 2009; pp. 393–406.
- Scarciglia, F.; Marsico, A.; Capolongo, D. Weathering processes and rates of scarp retreat in a Mediterranean mountain environment: A multi-analytical approach from terrestrial laser scanning to microscale surveys. Geomorphology 2022, 413, 108356. [CrossRef]
- Moser, D.; Di Pasquale, G.; Scarciglia, F.; Nelle, O. Holocene mountain forest changes in central Mediterranean: Soil charcoal data from the Sila Massif (Calabria, southern Italy). Quatern. Int. 2017, 457, 113–130. [CrossRef]
- Govi, G.; Fiumi, G.; Barbut, J.; Scalercio, S.; Hausmann, A. An unexpected species complex unveiled in southern European populations of Phragmatiphila nexa (Hübner,[1808]) (Lepidoptera, Noctuidae, Noctuinae, Apameini). Zootaxa 2022, 5128(3), 355–383.
- Huemer, P.; Haxaire, J.; Lee, K.M.; Mutanen, M.; Pekarsky, O.; Scalercio, S.; Ronkay, L. Revision of the genus Hoplodrina Boursin, 1937 (Lepidoptera, Noctuidae, Xyleninae). I. Hoplodrina octogenaria (Goeze, 1781) and its sister species H. alsinides (Costantini, 1922) sp. rev. in Europe. ZooKeys 2020, 927, 75. [CrossRef]
- Lachat, T.; Wermelinger, B.; Gossner, M.M.; Bussler, H.; Isacsson, G.; Müller, J. Saproxylic beetles as indicator species for dead-wood amount and temperature in European beech forests. Ecol. Indic. 2012, 23, 323–331. [CrossRef]
- De Zan, L.R.; Bellotti, F.; D’Amato, D.; Carpaneto, G.M. Saproxylic beetles in three relict beech forests of central Italy: analysis of environmental parameters and implications for forest management. Forest Ecol. Manag. 2014, 328, 229–244. [CrossRef]
- Castellani C. Tavole stereometriche e alsometriche costruite per i boschi italiani. Annali Istituto Sperimentale per l’Assestamento Forestale e l’Alpicoltura 1970, 1(1): 1–750.
- Merckx, T.; Slade, E.M. Macro-moth families differ in their attraction to light: implications for light-trap monitoring programmes. Insect Conserv. Diver. 2014, 7(5), 453–461. [CrossRef]
- Slade, E.M.; Merckx, T.; Riutta, T.; Bebber, D.P.; Redhead, D.; Riordan, P.; Macdonald, D.W. Life-history traits and landscape characteristics predict macro-moth responses to forest fragmentation. Ecology 2013, 94(7), 1519–1530. [CrossRef]
- McGarigal, K.; Cushman, S.A.; Neel, M.C.; Ene, E. Spatial pattern analysis program for categorical maps. 2002 available online: www. umass.edu/landeco/research/fragstats/fragstats.html. (Accessed on 27th July 2023).
- Hammer, Ø.; Harper, D.A. Past: paleontological statistics software package for educaton and data anlysis. Palaeontol. Electron. 2001, 4(1), 1.
- Almeida-Neto, M.; Guimaraes, P.; Guimaraes Jr, P.R.; Loyola, R.D.; Ulrich, W.A. Consistent metric for nestedness analysis in ecological systems: reconciling concept and measurement. Oikos 2008, 117(8), 1227–1239. [CrossRef]
- Strona, G.; Galli, P.; Seveso, D.; Montano, S.; Fattorini, S. Nestedness for Dummies (NeD): a user-friendly web interface for exploratory nestedness analysis. Journal of Statistical Software 2014, 59, 1–9. [CrossRef]
- Ienco, A.; Greco, S.; Scalercio, S. Is the “best season” the best choice? Temporal variations of β-diversity patterns in moth communities of Calabrian black pine forests. Ecol. Indic. 2020, 112, 106134. [CrossRef]
- Littlewood, N.A. Grazing impacts on moth diversity and abundance on a Scottish upland estate. Insect Conserv. Diver. 2008, 1(3), 151–160. [CrossRef]
- Enkhtur, K.; Brehm, G.; Boldgiv, B.; Pfeiffer, M. Effects of grazing on macro-moth assemblages in two different biomes in Mongolia. Ecol. Indic. 2021, 133, 108421. [CrossRef]
- Scalercio, S. On top of a Mediterranean Massif: Climate change and conservation of orophilous moths at the southern boundary of their range (Lepidoptera: Macroheterocera). Eur. J. Entomol. 2009, 106(2), 231. [CrossRef]
- Mönkkönen, M.; Mutanen, M. Occurrence of moths in boreal forest corridors. Conserv. Biol. 2003, 17(2), 468–475. [CrossRef]
- Woodroffe, R.; Ginsberg, J.R. Edge effects and the extinction of populations inside protected areas. Science 1998, 280, 2126–2128. [CrossRef]
- Ries, L.; Fletcher, R.J.; Battin J.; Sisk T.D. Ecological responses to habitat edges: mechanisms, models, and variability explained. Annu. Rev. Ecol. Evol. Syst. 2004, 35, 491–522. [CrossRef]
- Lassauce, A.; Larrieu, L.; Paillet, Y.; Lieutier, F.; Bouget, C. The effects of forest age on saproxylic beetle biodiversity: implications of shortened and extended rotation lengths in a French oak high forest. Insect. Conserv. Diver. 2013, 6(3), 396–410. [CrossRef]
- Bongers, F.J.; Schmid, B.; Bruelheide, H.; Bongers, F.; Li, S.; von Oheimb, G.; Li, Y.; Cheng, A.; Ma, K.; Liu, X. Functional diversity effects on productivity increase with age in a forest biodiversity experiment. Nat. Ecol. Evol. 2021, 5(12), 1594–1603. [CrossRef]
- Wirth, C.; Messier, C.; Bergeron, Y.; Frank, D.; Fankhänel, A. Old-growth forest definitions: a pragmatic view. In Old-Growth Forests: Function, Fate and Value, Wirth, C.; Gleixner, G.; Heimann, M. Eds. Springer: Berlin, Heidelberg, Germany, 2009; pp. 11–33. [CrossRef]
- De la Montana, E.; Rey-Benayas, J.M.; Carrascal, L.M. Response of bird communities to silvicultural thinning of Mediterranean maquis. J. Appl. Ecol. 2006, 43(4), 651–659. [CrossRef]
- Taki, H.; Inoue, T.; Tanaka, H.; Makihara, H.; Sueyoshi, M.; Isono, M.; Okabe, K. Responses of community structure, diversity, and abundance of understory plants and insect assemblages to thinning in plantations. Forest Ecol. Manag. 2010, 259(3), 607–613. [CrossRef]
- Fuentes-Montemayor, E.; Watts, K.; Sansum, P.; Scott, W.; Park, K. J. Moth community responses to woodland creation: The influence of woodland age, patch characteristics and landscape attributes. Divers. Distrib. 2022, 28(9), 1993–2007. [CrossRef]
- Mӧlder, A.; Bernhardt-Rӧmermann, M.; Schmidt, W. Herb-layer diversity in deciduous forests: Raised by tree richness or beaten by beech? Forest Ecol. Manag. 2008, 256(3), 272–281. [CrossRef]
- Wulf, M.; Naaf, T. Herb layer response to broadleaf tree species with different leaf litter quality and canopy structure in temperate forests. J. Veg. Sci. 2009, 20(3), 517–526. [CrossRef]
- Sercu, B.K.; Baeten L.; van Coillie F.; et al. How tree species identity and diversity affect light transmittance to the understory in mature temperate forests. Ecol Evol. 2017, 7:10861–10870. [CrossRef]
- Jung, T.S.; Thompson, I.D.; Titman, R.D.; Applejohn, A. P. Habitat selection by forest bats in relation to mixed-wood stand types and structure in central Ontario. J. Wildlife Manage. 1999, 1306–1319. [CrossRef]
- Kalcounis, M.C.; Hobson, K.A.; Brigham, R. M.; Hecker, K.R. Bat activity in the boreal forest: importance of stand type and vertical strata. J. Mammal. 1999, 80(2), 673–682. [CrossRef]
- Blakey, R.V.; Law, B.S.; Kingsford, R.T.; Stoklosa, J. Terrestrial laser scanning reveals below-canopy bat trait relationships with forest structure. Remote Sens. Environ. 2017, 198, 40–51. [CrossRef]
- Archaux, F.; Lorel, C.; Villemey, A. Landscape drivers of butterfly and burnet moth diversity in lowland rural areas. Landscape Ecol. 2018, 33, 1725–1739. [CrossRef]
- Bergman, K.O.; Dániel-Ferreira, J.; Milberg, P.; Öckinger, E.; Westerberg, L. Butterflies in Swedish grasslands benefit from forest and respond to landscape composition at different spatial scales. Landscape Ecol. 2018, 33, 2189–2204. [CrossRef]
- Scalercio, S.; Brandmayr, P.; Iannotta, N.; Petacchi, R.; Boccaccio, L. Correlations between landscape attributes and ecological traits of Lepidoptera communities in olive groves. Eur. J. Entomol. 2012, 109(2): 207–216. [CrossRef]
- Claessens, H.; Oosterbaan, A.; Savill, P.; Rondeux, J. A review of the characteristics of black alder (Alnus glutinosa (L.) Gaertn.) and their implications for silvicultural practices. Forestry 2010, 83(2), 163–175. [CrossRef]
- Kuglerová, L.; Jyväsjärvi, J.; Ruffing, C.; Muotka, T.; Jonsson, A.; Andersson, E.; Richardson, J.S. Cutting edge: A comparison of contemporary practices of riparian buffer retention around small streams in Canada, Finland, and Sweden. Water Resour. Res. 2020, 56(9), 1–15. [CrossRef]
Disclaimer/Publisher’s Note: The statements, opinions and data contained in all publications are solely those of the individual author(s) and contributor(s) and not of MDPI and/or the editor(s). MDPI and/or the editor(s) disclaim responsibility for any injury to people or property resulting from any ideas, methods, instructions or products referred to in the content. |
© 2023 by the authors. Licensee MDPI, Basel, Switzerland. This article is an open access article distributed under the terms and conditions of the Creative Commons Attribution (CC BY) license (http://creativecommons.org/licenses/by/4.0/).
Copyright: This open access article is published under a Creative Commons CC BY 4.0 license, which permit the free download, distribution, and reuse, provided that the author and preprint are cited in any reuse.


