
Submitted:
26 July 2023
Posted:
27 July 2023
You are already at the latest version
Abstract
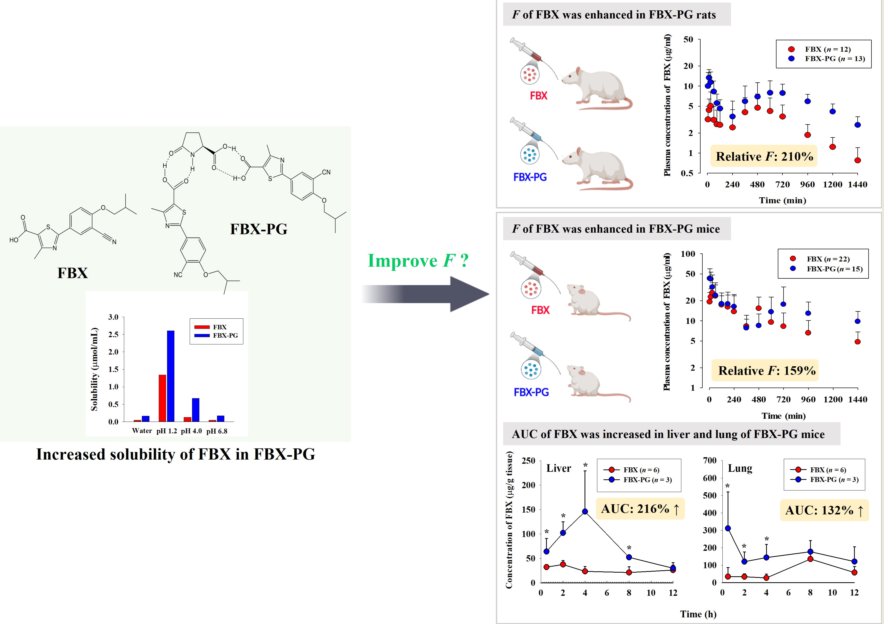
Febuxostat (FBX), a selective xanthine oxidase inhibitor, belongs to BCS class II showing low solubility and high permeability with a moderate F value (< 49%). Recently, FBX/L-pyroglutamic acid cocrystal (FBX-PG) was developed with improving 4-fold increase of the FBX solubility. Nevertheless, in vivo pharmacokinetic property of FBX-PG has not been evaluated yet. Therefore, the pharmacokinetic feasibility of FBX in FBX and FBX-PG-treated rats and mice was compared in this study. The results showed that the F values of FBX were 210% and 159% in FBX-PG rats and mice, respectively. The 2.10-fold greater AUC of FBX was due to the increased absorption (i.e., 2.60-fold higher Cmax,1 at 15 min) and entero-hepatic circulation of FBX (i.e., 1.68-fold higher Cmax,2 at 600 min) in FBX-PG rats compared to the FBX rats. The 1.59-fold greater AUC of FBX was due to a 1.65-fold higher Cmax,1 at 5 min, and 1.15-fold higher Cmax,2 at 720 min of FBX in FBX-PG mice than those in FBX mice. FBX was highly distributed in the liver, stomach, small intestine, and lungs in both groups of mice, and the FBX distributions to the liver and lungs were increased in FBX-PG mice compared to FBX mice. The results suggest the FBX-PG has a suitable pharmacokinetic profile of FBX for improving its oral F value.
Keywords:
febuxostat
; FBX/L-pyroglutamic acid cocrystals
; pharmacokinetics
; bioavailability
1. Introduction
Pharmaceutical cocrystals are defined as crystalline molecular complexes of fixed stoichiometry between an active pharmaceutical ingredient (API) with another pharmaceutically acceptable molecules [1,2]. Cocrystals can improve the physicochemical properties (e.g., stability, solubility, dissolution rate, and/or permeability) of compounds [3,4] and can also be tuned with pharmaceutically acceptable co-formers without altering the chemical structure of the API [1].
Febuxostat (FBX) has been popularly used to treat hyperuricemia, gout, and other chronic renal diseases [5,6]. FBX reduces uric acid levels in the blood by selectively inhibiting xanthine oxidase [7,8,9]. From physicochemical and pharmacokinetic perspectives, FBX is a poorly water-soluble and highly permeable drug belonging to biopharmaceutics classification system (BCS) class II [1,10,11,12,13]. Although FBX form-A is still used in drug formulation, the co-crystallization of FBX has been diversely tried due to the low aqueous solubility and slow absorption rate of FBX as a restriction of BCS class II drugs [1,7,11,14,15,16,17,18,19,20,21]. Among various trials to develop cocrystals of FBX, L-pyroglutamic acid (PG) was proper because of its safety (i.e., LD50 of PG is 1 g/kg in rats [22]) and its chemical property (i.e., pKa difference of less than 3 between FBX and PG [11,23]). Cocrystals of FBX were formed with FBX/PG at a ratio of 2:1, leading to enhanced solubility in deionized water and simulated gastrointestinal pH conditions (pH 1.2, 4.0, and 6.8) [11]. However, in vivo pharmacokinetic property of FBX after administration FBX/PG cocrystals (FBX-PG) has not been evaluated yet. Thus, the pharmacokinetic feasibility of FBX-PG, a novel cocrystals of FBX, was evaluated by comparing FBX-PG with FBX in rats and mice.
2. Materials and Methods
2.1. Materials
FBX (purity 98.00%) and FBX-PG (99.85%) (Figure 1 and Table 1), with identical spectroscopic characteristics, were provided by Dr. Kiwon Jung at the College of Pharmacy, CHA University and Oncobix Co., Ltd (Republic of Korea) [11,24]. Carbamazepine [internal standard (IS) for liquid chromatography-tandem mass spectrometry (LC-MS/MS)] was purchased from Sigma-Aldrich (St. Louis, MO, USA). All other chemicals and reagents used were of analytical grade.
2.2. Animals
The protocols for the animal studies were approved by the Institute of Laboratory Animal Resources of Dongguk University_Seoul, Republic of Korea (IACUC-2016-023 on March 18, 2016, and IACUC-2022-012 on June 10, 2022). Male Sprague-Dawley rats (6–7 weeks old, weighing 150–250 g) and male Institute of Cancer Research mice (6 weeks old, weighing 25–30 g) were purchased from the Charles River Company Korea (Orient, Seoul, Republic of Korea). The animals were acclimated for one week before starting the study. Upon arrival, the animals were randomized and housed at two (for rats) or five (for mice) per cage under strictly controlled environmental conditions (20–25 °C and 48–52% relative humidity). A 12 h light/dark cycle was used at an intensity of 150 to 300 Lux. Animals had free access to food and water. They were fasted for 12 h before drug administration.
2.3. LC-MS/MS analysis of FBX in biological samples
The concentration of FBX in biological samples was determined using a previously reported LC-MS/MS method with a slight modification [9]. All analyses were performed using an API 4000 triple quadrupole mass spectrometer (AB Sciex, Foster City, CA, USA) coupled with an Agilent 1200 high-performance liquid chromatography system (Agilent, Santa Clara, CA, USA).
The mass spectrometer was operated in the multiple reaction monitoring mode with an electrospray ionization interface. For positive ions ([M+H]+), the source temperature and gas parameters were optimized as follows: ion spray voltage was set to 5,500 V, turbo ion spray temperature was set at 500 °C, nebulizer gas (GS1, nitrogen) and heater gas (GS2, nitrogen) were set at 50 L/min, curtain gas was set at 20 L/min, and collision gas (nitrogen) was set at 6 Torr. m/z values of 317.115 → 261 (29 eV for collision energy) and 237.241 → 194.3 (52 eV for collision energy) were obtained for FBX and the IS, respectively.
Chromatographic separation was carried out using a reversed-phase C18 column (X-select C18, 2.1 mm × 100 mm i.d., particle size; 3 μm; Waters, Ireland) at a flow rate of 0.4 mL/min. The mobile phase was composed of 0.1% formic acid in water (A) and acetonitrile (B). Gradient elution was performed using the mobile phase at a 90:10 (v/v) ratio of A:B initially. The ratio was changed to 10:90 (v/v) from 0.5 min to 3.5 min and was returned to the initial composition at 7.1 min, which was then maintained for 10 min. The analytical data were processed using Analyst software (Version 1.7.2, AB Sciex, Foster City, CA, USA).
A stock solution of FBX was prepared at a concentration of 14 mg/mL in methanol to make FBX standards in the biological samples. The stock solution was serially diluted with methanol. Different concentrations of FBX working solutions were added to drug-free plasma, urine, or gastrointestinal tract (GI) samples to prepare standard samples of FBX in biological samples.
For sample preparation, a 50 µL aliquot of sample was deproteinized by adding 950 µL of acetonitrile containing 1 µg/mL of IS. After vortex and centrifuging for 10 min at 12,000 rpm, a 5 µL aliquot of the supernatant was obtained and diluted with acetonitrile containing 0.1% formic acid, resulting in a 25,000-fold dilution of the biological samples. Then, a 10 µL aliquot of the diluted supernatant was injected into the column. The FBX and IS peaks appeared at 5.5 and 3.8 min, respectively (Figure S1). The concentration range of the FBX calibration curves of plasma, urine, and GI samples was 1.4−140 µg/mL. The calibration curves for FBX were derived from the peak area ratios relative to those of the IS via linear regression with 1/x weighting.
2.4. Pharmacokinetics of FBX after oral administration of FBX or FBX-PG to rats
Rats were fasted for 12 h prior to the experiment but were allowed access to water. On the day of the experiment, the rats were exposed to diethyl ether by inhalation for 5 min. Under anesthesia, the carotid artery was cannulated for blood sampling according to a previously reported method [26,27,28] Upon recovery from the anesthesia (i.e., 3 h after cannulation), FBX or FBX-PG (dissolved in ethanol and polyethylene glycol at 5:5, v/v) at a dose of 50 mg (4 mL)/kg as FBX was orally administered to the rats using a gastric gavage tube (n = 12 and n = 13 in the FBX and FBX-PG groups, respectively). Blood samples (approximately 150 µL) were collected via the carotid artery 0, 5, 15, 30, 60, 90, 120, 240, 360, 480, 600, 720, 960, 1200, and 1440 min after the oral administration of FBX or FBX-PG. Immediately after each blood collection, a 0.4 mL of heparinized 0.9% NaCl-injectable solution was injected into the cannula to prevent blood clotting. Each blood sample was immediately centrifuged, and a 50 µL aliquot of plasma was collected. At the end of 24 h, each metabolic cage was rinsed with 20 mL of distilled water, and the resulting fluid was mixed with the urine collected over the previous 24 h and taken as the urine sample. After manual shaking and stirring, a 50 µL aliquot of the urine sample was collected. At the same time, each rat was euthanized by cervical dislocation. The GI tract, including its contents and feces, was removed, transferred into a beaker, and cut into small pieces. To facilitate the extraction of FBX, 100 mL of methanol was added to each beaker. After manual shaking and stirring, 50 µL of supernatant was collected from each beaker. All collected biological samples were stored at -20 °C for LC-MS/MS analysis of FBX.
2.5. Pharmacokinetics of FBX after oral administration of FBX or FBX-PG in mice
Prior to the experiment, mice were fasted for 12 h but were allowed access to water. FBX and FBX-PG (dissolved in ethanol and polyethylene glycol at 5:5, v/v) were orally administered to mice at a dose of 50 mg (10 mL)/kg as FBX using a gastric gavage tube. Blood samples (approximately 120 µL) were collected via heart puncture using a heparinized insulin syringe at 0, 5, 15, 30, 60, 120, 240, 360, 480, 600, 720, 960, and 1440 min after the oral administration of FBX and FBX-PG. Blood samples were immediately centrifuged, and 50 µL of plasma was collected and stored at -20 °C for LC-MS/MS analysis of FBX. In heart puncture, 31-gauge needle was used to minimize damage to cardiac and pericardial tissues along the needle track and to keep mice alive for several blood collections. The heart puncture was conducted following the recommended guidelines and the approved protocols, which included a blood sampling volume of 0.26 mL/35 g BW at each time point and a total blood sampling volume of 2.76 mL/35 g BW when multiple blood sampling was deemed acceptable and recommended [29,30,31,32]. As four or five blood samples were obtained per mouse, 22 and 15 mice were used for FBX and FBX-PG.
2.6. Tissue distribution of FBX after oral administration of FBX or FBX-PG to mice
The tissue distribution of FBX after FBX or FBX-PG administration was evaluated according to methods in previous reports [33,34]. Prior to the experiment, mice were fasted for 12 h but were allowed access to water. FBX or FBX-PG (dissolved in ethanol and polyethylene glycol at 5:5, v/v) at a dose of 50 mg (10 mL)/kg as FBX was orally administered to mice using a gastric gavage tube. At 0.5, 2, 4, 8, and 12 h after the oral administration of FBX or FBX-PG, as much blood as possible was collected via heart puncture, and then the portal vein was perfused with 0.9% NaCl solution to remove all blood from the body. Each blood sample was centrifuged for 10 min at 12,000 rpm, and a 50 μL aliquot of the plasma was collected. Liver, kidney, stomach, small intestine, large intestine, lung, heart, and fat were excised, weighed, and washed with cold 0.9% NaCl solution. Each tissue was homogenized in a 3-fold volume of 0.9% NaCl solution, which was centrifugated for 20 min at 9,000 rpm, and 50 μL of the supernatant was collected. All collected samples were stored at -20 °C until LC-MS/MS analysis of FBX.
2.7. Plasma protein binding of FBX and FBX-PG in rats and mice
The plasma protein binding values of FBX and FBX-PG in rats were measured at a final concentration equivalent to 1 µg/mL FBX using a rapid equilibrium dialysis (RED) device (Thermo Fisher Scientific). A 100 µL sample of fresh rat plasma containing FBX or FBX-PG was added to the plasma chamber, and 350 µL of dialysis buffer solution (phosphate-buffered saline) was added to the buffer chamber. After incubating for 4 h at 37 °C with stirring at 300 rpm, 50 µL was transferred from each chamber into a tube and stored at -20 °C for LC-MS/MS analysis of FBX.
The plasma protein binding values of FBX and FBX-PG in mice were also measured at two concentrations (equivalent to 1 and 20 µg/mL FBX final concentrations). Except for the concentration of FBX or FBX-PG, the other procedures were the same as those used to measure the plasma protein binding values in rats described above.
2.8. Pharmacokinetic analysis
The total area under the plasma concentration-time curve from time zero to the last blood sampling time (AUC0-1440min) or infinity (AUC) was calculated using the trapezoidal rule method. The area from the last datum point to infinity was estimated by dividing the last measured plasma concentration by the terminal-phase rate constant.
Standard methods [35] were used to calculate the following pharmacokinetic parameters using non-compartmental analysis (PK solver, version 2.1; Scientific); terminal half-life (t1/2): apparent time-averaged total body clearance after oral administration (CL/F), apparent volume of distribution during elimination after oral administration (Vz/F), relative bioavailability from time zero to the last blood sampling time (relative F0-1440min) or to time infinity (relative F), percentage of the dose recovered from the gastrointestinal tract (including its contents and feces) at 24 h (GI24h), and the percentage of the dose excreted in urine up to 24 h (Ae0-24h). The relative F or F0-1440min was estimated by dividing the AUC or AUC0-1440min after the oral administration of FBX-PG by AUC or AUC0-1440min after the oral administration of FBX at the same dose. The first peak plasma concentration (Cmax,1) and time to reach Cmax,1 (Tmax,1), and second peak plasma concentration (Cmax,2) and time to reach Cmax,2 (Tmax,2) were directly obtained from the plasma concentration-time data. The mean ‘true’ unabsorbed fractions of oral dose (‘Funabs’) were estimated using a reported equation [36]: GI24h, oral = ‘Funabs’ + (F × GI24h, intravenous).
2.9. Statistical analysis
The statistical comparison of pharmacokinetic parameters between two groups was performed using the student’s t-test. A P-value < 0.05 was deemed to be statistically significant. All data are expressed as the mean ± standard deviations except for Tmax,1 and Tmax,2, which are expressed as medians (ranges).
3. Results
3.1. Pharmacokinetics of FBX after the oral administration of FBX or FBX-PG to rats
The mean plasma concentration-time profiles of FBX after the oral administration of FBX or FBX-PG at a dose of 50 mg (4 mL)/kg as FBX to rats are shown in Figure 2, and the relevant pharmacokinetic parameters of FBX are listed in Table 2. FBX was detected in plasma based on an early blood sampling time point (5 min) for both rats and the time to reach the first peak concentration (Tmax,1) value was 30 min and 15 min for FBX and FBX-PG rats, respectively. These results suggest the considerably rapid absorption of FBX from the GI tract in FBX and FBX-PG rats. The first peak plasma concentration (Cmax,1) was higher (160% increase) at the shorter Tmax,1 (50% decrease) in FBX-PG rats than in FBX rats, indicating that FBX absorption was faster in FBX-PG rats than in FBX rats. Second peaks appeared in both FBX and FBX-PG rats, indicating that the biliary excretion of FBX occurred even after FBX-PG administration, similar to FBX administration reported previously [37,38]. Interestingly the second peak plasma concentration (Cmax,2) was higher (67.7% increase), and the time to reach the second peak concentration (Tmax,2) was longer (25.0% increase) in FBX-PG rats than in FBX rats. A smaller GI24h (21.1% decrease) of FBX was observed in FBX-PG rats compared to FBX rats. The Ae0-24h of FBX was comparable between FBX and FBX-PG rats, at 3.64% and 3.69%, respectively. Although GI24h is the sum of the unabsorbed and biliary excreted fraction of oral dose at 24 h, the comparable terminal t1/2 values of FBX of 434 min and 472 min suggest that FBX elimination was not different between FBX and FBX-PG rats. As a result of drug absorption and disposition, the AUC of FBX was significantly increased (110% increase) in FBX-PG rats compared to FBX rats. Thus, the relative F value of FBX-PG was 210% that of FBX rats.
3.2. Pharmacokinetics of FBX after the oral administration of FBX or FBX-PG to mice
The mean plasma concentration-time profiles of FBX after the oral administration of FBX and FBX-PG at a dose of 50 mg (10 mL)/kg to mice are shown in Figure 3, and the relevant pharmacokinetic parameters are listed in Table 3. FBX was detected in plasma based on an early blood sampling time point (5 min) for both groups of mice, and the Tmax,1 values were 30.0 min and 5.00 min in FBX and FBX-PG mice, respectively. These results indicated the rapid GI absorption of FBX in FBX and FBX-PG mice. Moreover, the higher Cmax,1 (65.0% increase) at the shorter Tmax,1 (83.3% decrease) of FBX in FBX-PG mice than FBX mice indicated that the FBX absorption might be faster and greater in FBX-PG mice than in FBX mice. Second peaks of FBX appeared in FBX and FBX-PG mice. The Cmax,2 at Tmax,2 values were 15.3 μg/mL at 480 min and 17.6 μg/mL at 720 min in FBX and FBX-PG mice, respectively. These second peak profiles suggested that biliary excretion might be involved in the elimination of FBX in both FBX and FBX-PG mice. The terminal t1/2 values of FBX, at 880 min and 883 min, were similar in FBX and FBX-PG mice, respectively. As a result of absorption and disposition, the AUC of FBX in FBX-PG mice was greater (58.7% increase) than in FBX mice, with a relative F value of 159% in FBX-PG mice compared to FBX mice.
3.3. Tissue distribution of FBX after the oral administration of FBX or FBX-PG to mice
The FBX concentrations in the plasma and various tissues, the ratios of tissue-to-plasma (T/P ratios) and AUC0-720min values at 0.5, 2, 4, 8, and 12 h after the oral administration of FBX or FBX-PG to mice at a dose of 50 mg (10 mL)/kg are shown in Figure 4 and Table 4. In FBX mice, FBX was more highly distributed in the lung, stomach, small intestine, and liver than in other tissues (e.g., large intestine, kidneys, heart, and fat). Although differences in distribution depend on the uptake time to tissues and elimination time from tissues, the T/P ratios of FBX in lung, stomach, liver, small intestine, large intestine and kidneys were above 1. FBX distribution in the heart and fat was relatively small compared to other tissues because the T/P ratios in the heart and fat were almost below 1. In FBX-PG mice, the tissue distribution patterns of FBX (i.e., FBX concentrations and its T/P ratios) were similar to those in FBX mice. However, the AUC0-720min values of FBX in the lungs and liver were significantly increased (132% and 216% increase, respectively) in FBX-PG mice compared to FBX mice (Table 4).
3.4. Plasma protein binding of FBX and FBX-PG in rats and mice
The rat plasma protein binding values of FBX in fresh rat plasma spiked with FBX and FBX-PG were 98.4 ± 1.20% and 98.2 ± 1.33% at a final concentration equivalent to 1 μg/mL FBX. The mouse plasma protein binding values of FBX in fresh mouse plasma spiked with FBX and FBX-PG were 94.9 ± 0.0369% and 94.2 ± 1.16% at a final concentration equivalent to 1 μg/mL FBX and 95.7 ± 0.00339% and 95.4 ± 0.143% at a final concentration equivalent to 20 μg/mL FBX.
Figure 4.
Mean concentrations (μg/mL for plasma and μg/g tissue in tissues) of FBX in plasma and tissue after the oral (50 mg/kg as FBX) administration of FBX (●) or FBX-PG (○) to mice (a). The T/P ratios of FBX after the oral (50 mg/kg as FBX) administration of FBX (■) or FBX-PG (□) to mice (b) are also shown. The dotted line in the graph shows that the T/P ratio is 1. Error bars represent standard deviations. The n values of 6 and 3 represent the number of mice used in the FBX and FBX-PG mice * Statistically different (P-value < 0.05) from FBX mice.
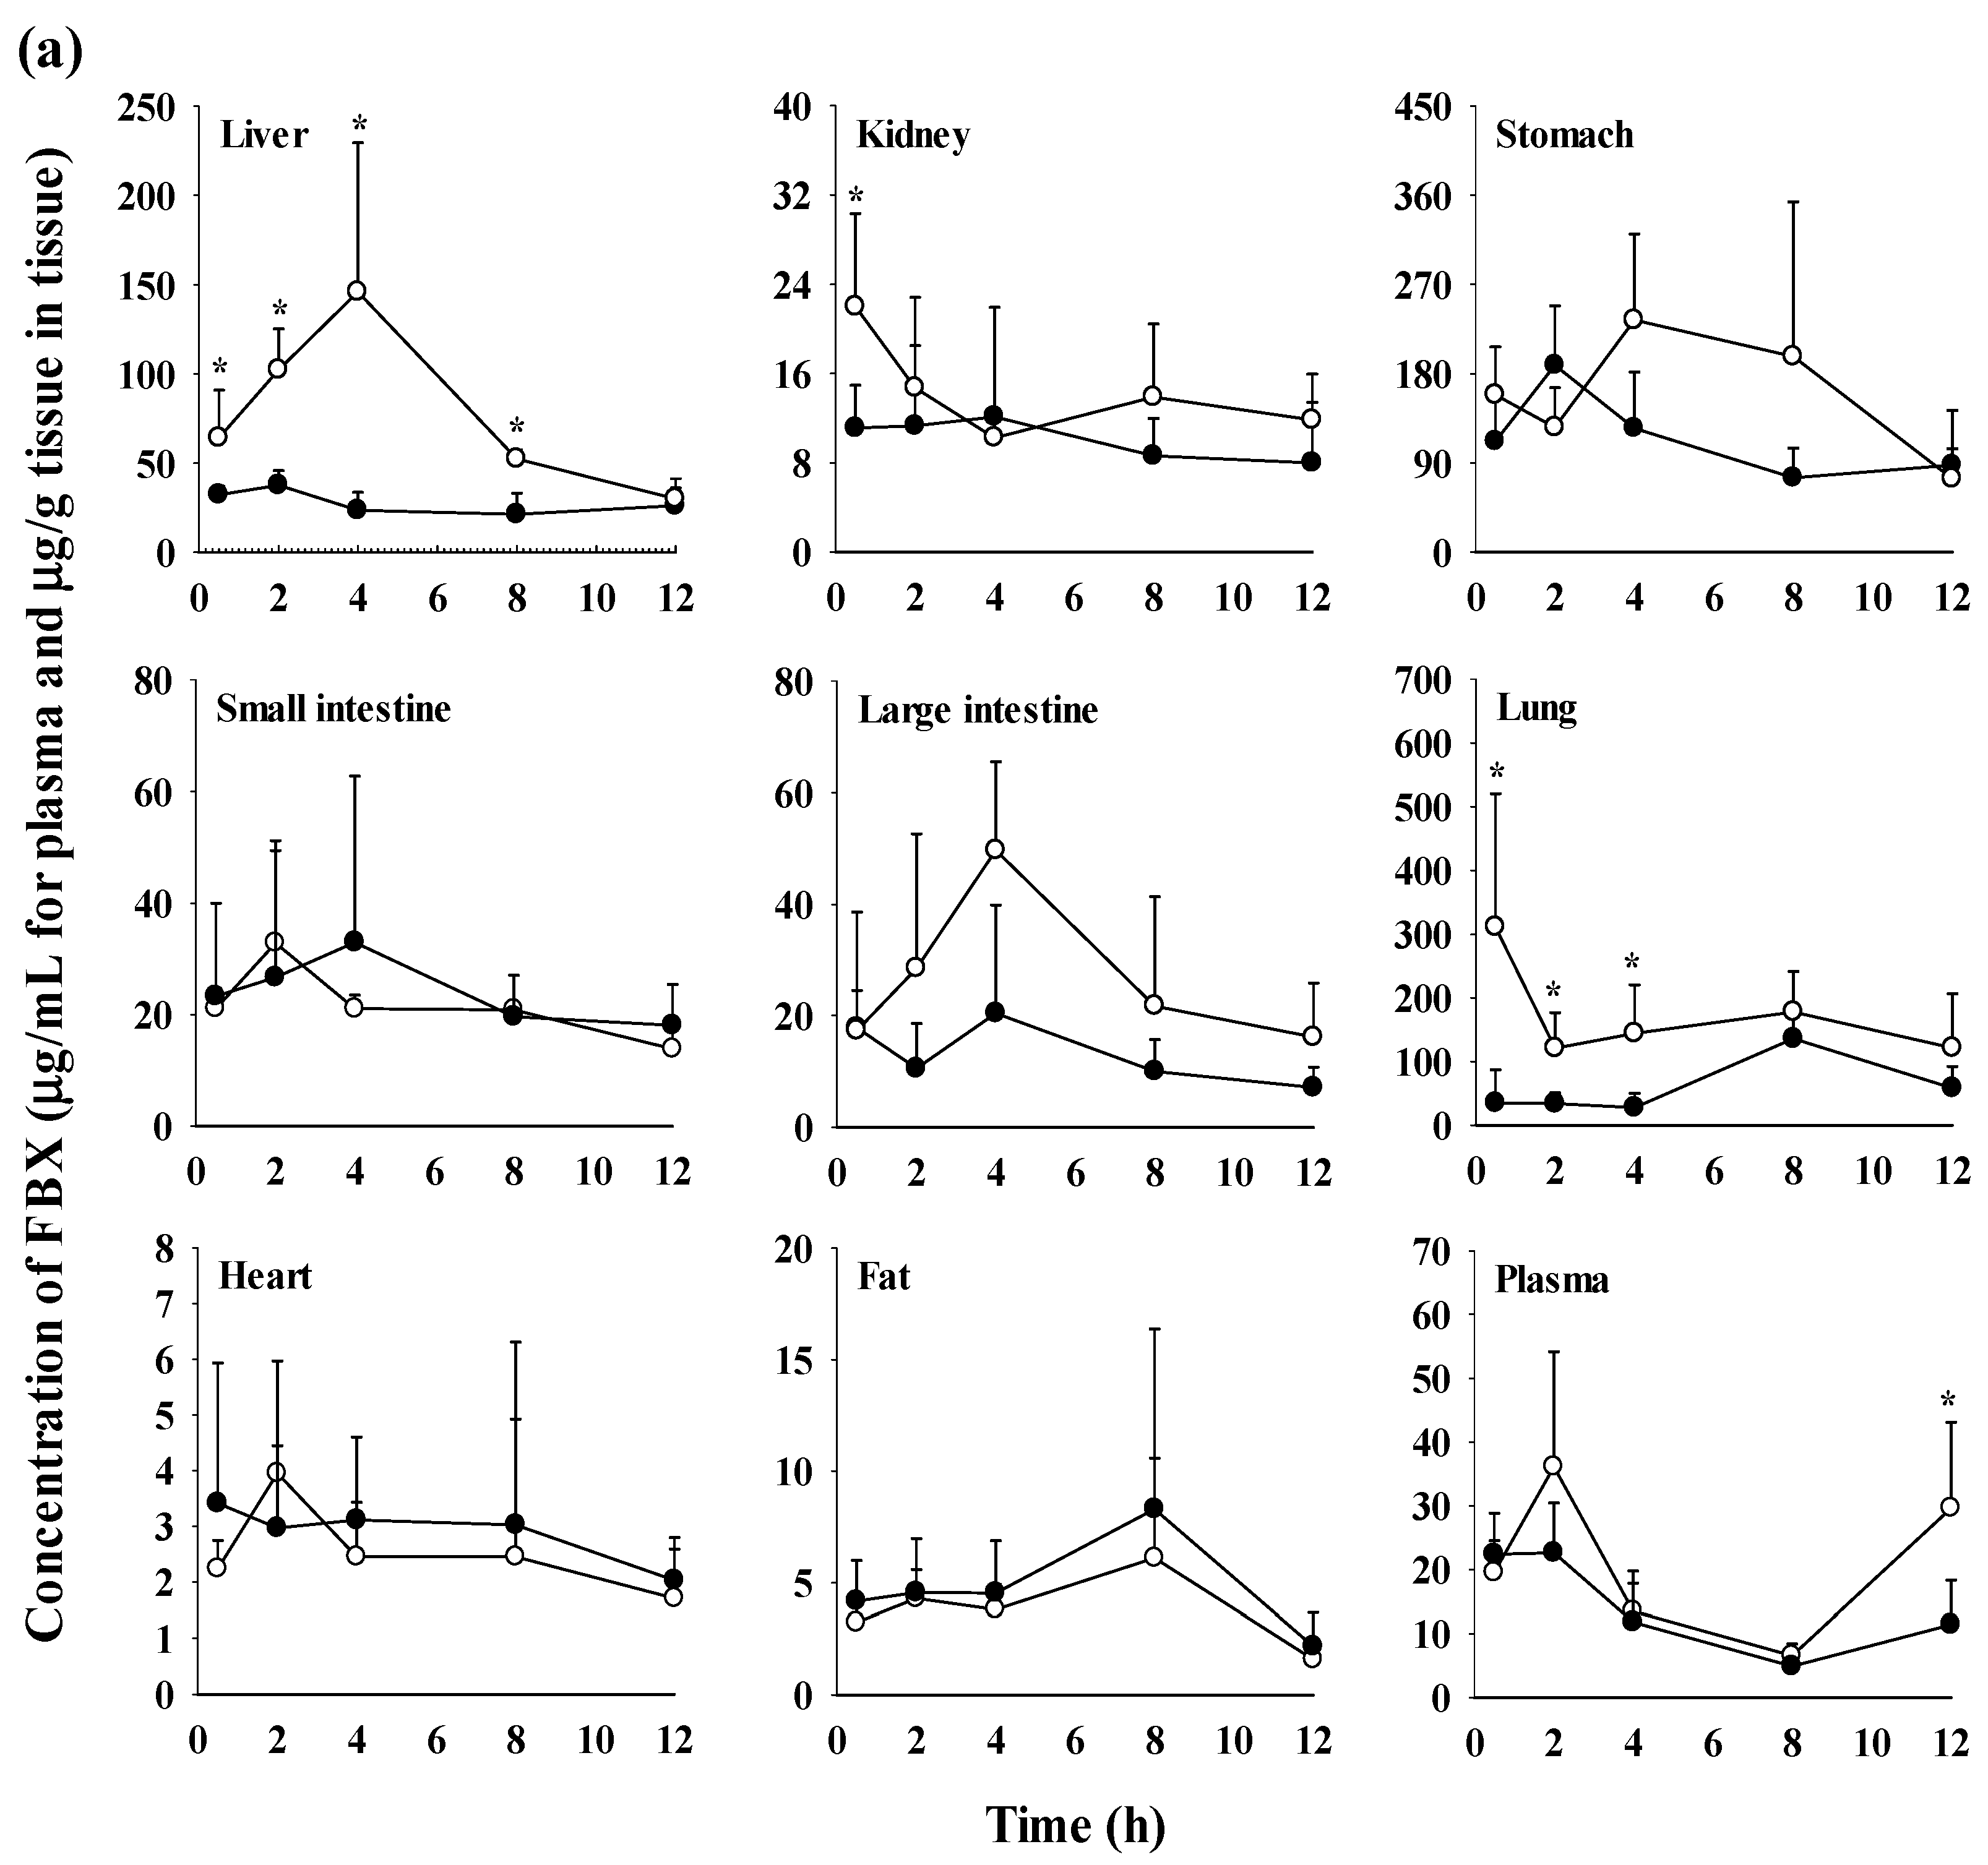
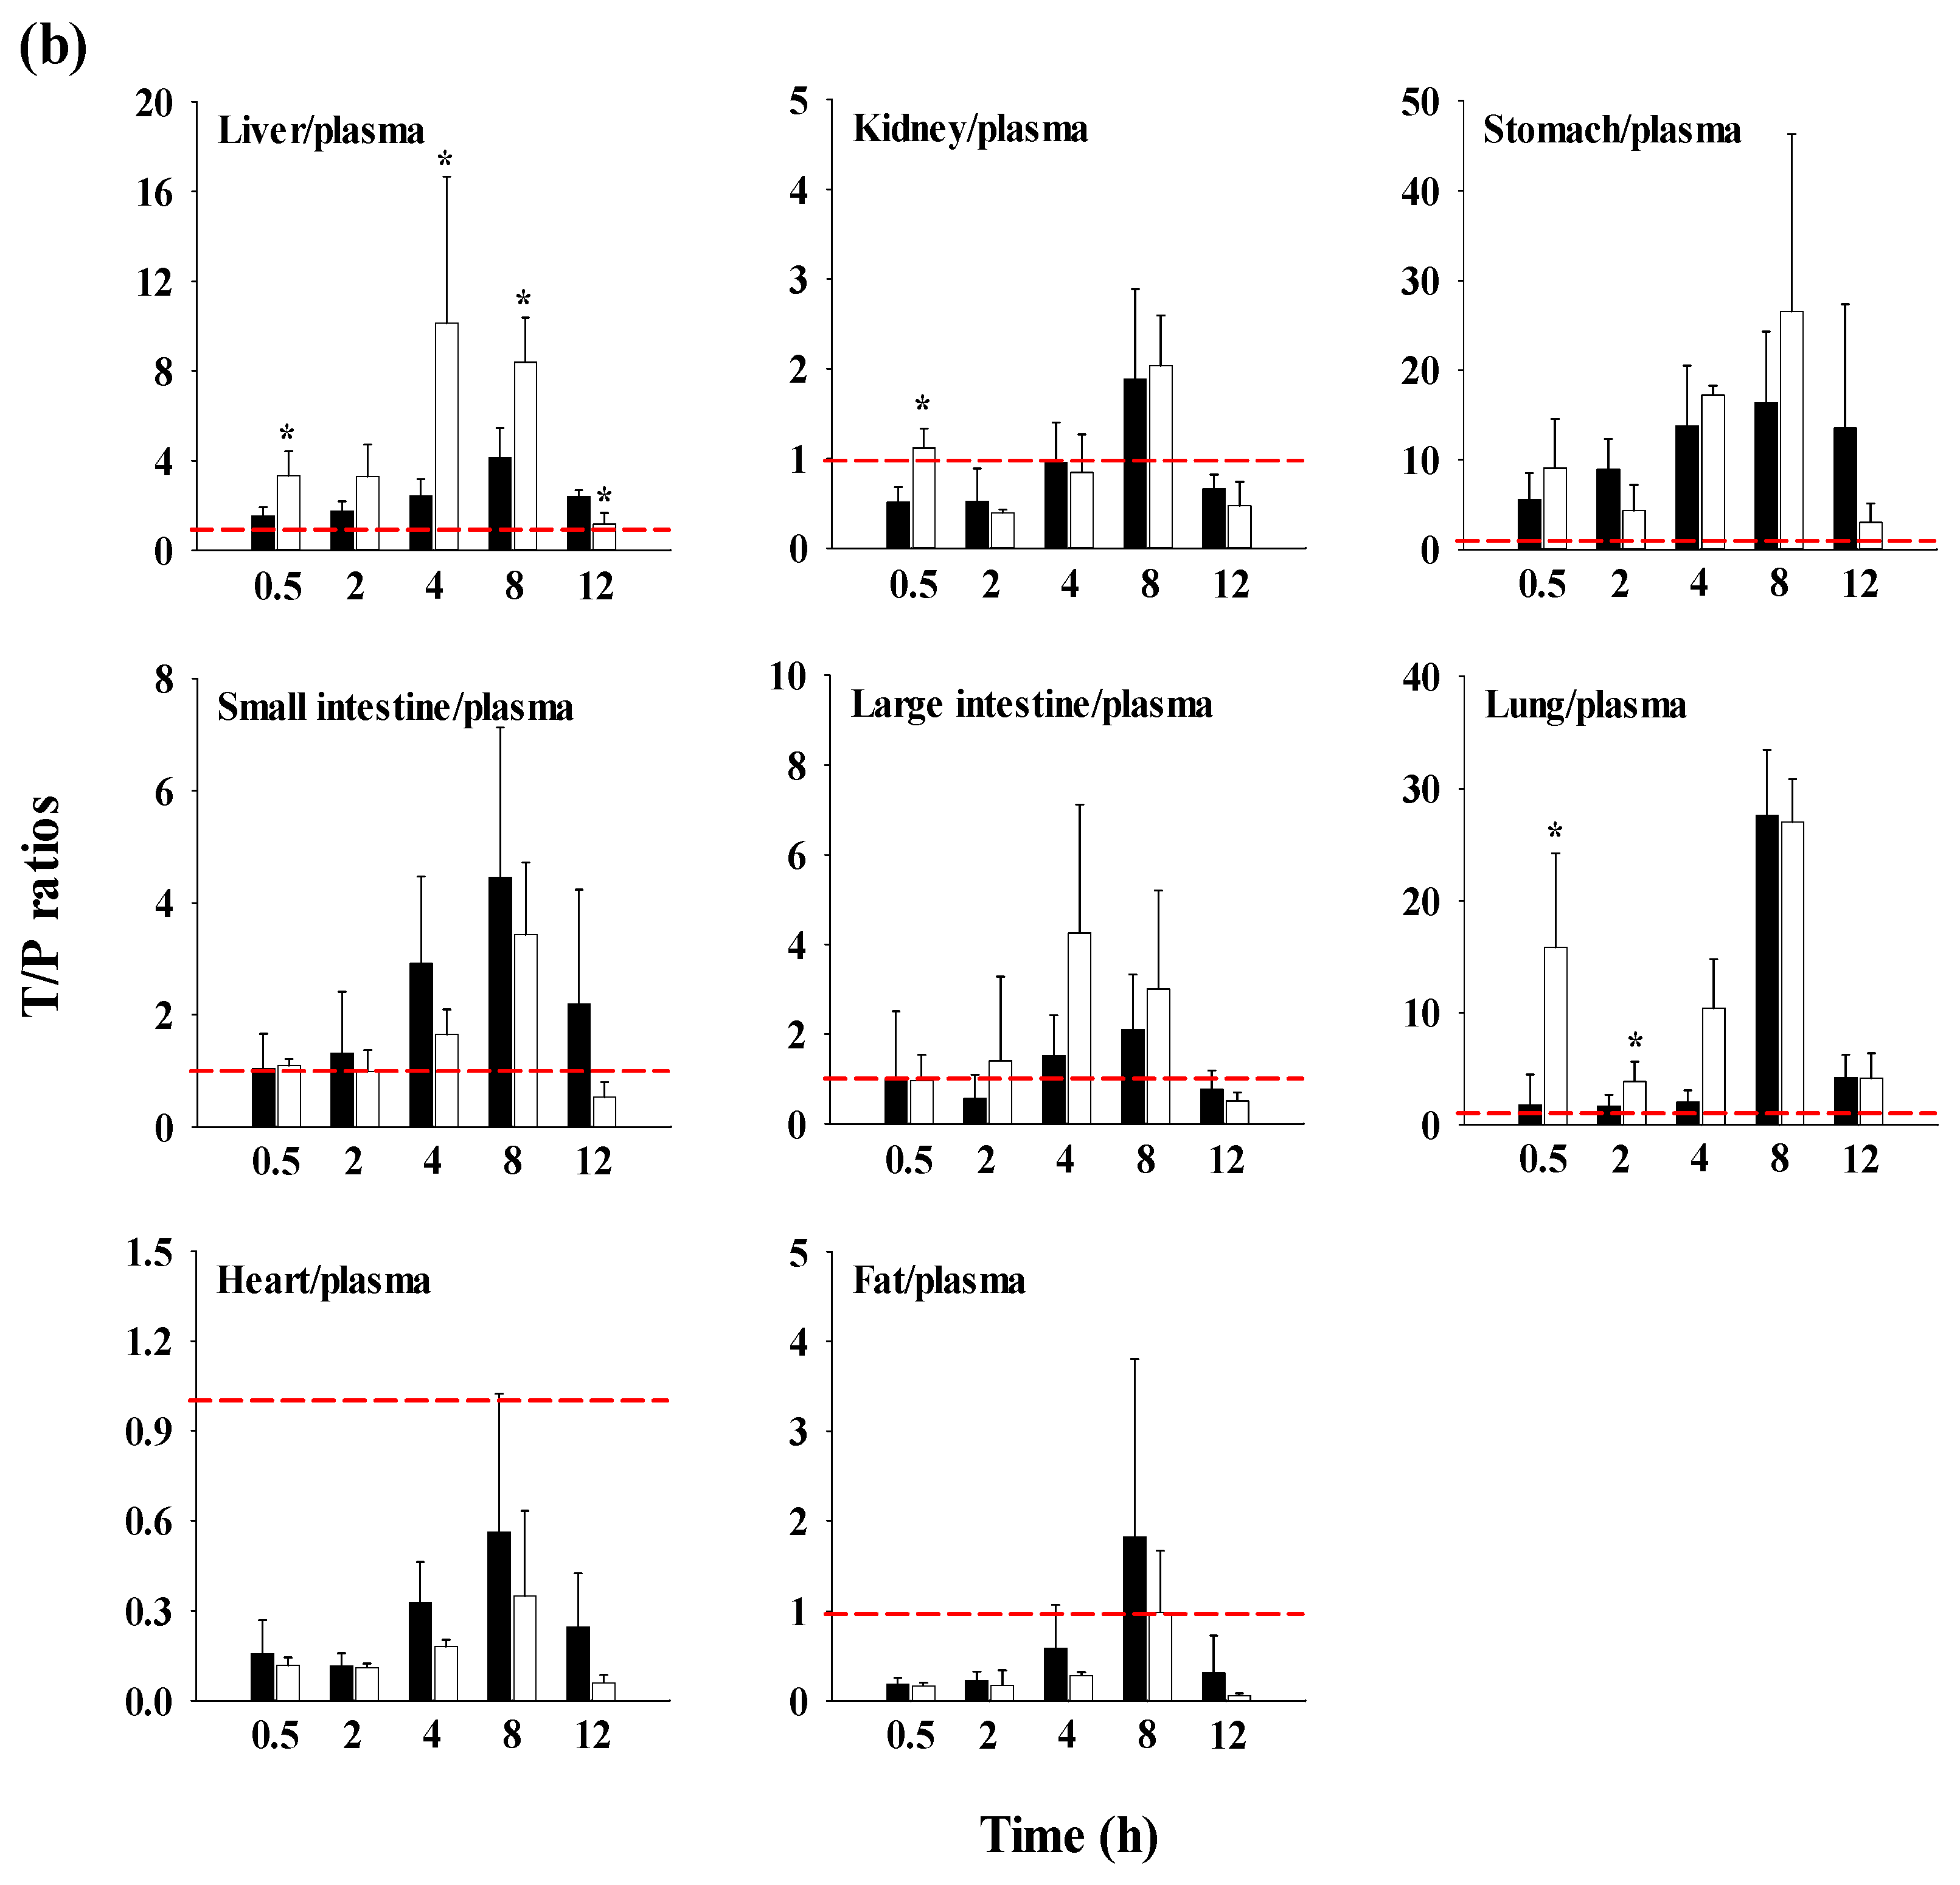

Table 4.
Mean (± standard deviation) AUC0-720min (μg min/g tissue) of FBX in tissues after oral administration of FBX or FBX-PG at a dose of 50 mg/kg as FBX to mice, respectively.
Table 4.
Mean (± standard deviation) AUC0-720min (μg min/g tissue) of FBX in tissues after oral administration of FBX or FBX-PG at a dose of 50 mg/kg as FBX to mice, respectively.
| Tissue | FBX (n = 6) | FBX-PG (n = 3) |
|---|---|---|
| Liver | 17234±5813 | 54403±10551* |
| Kidney | 6961±3954 | 9285±619 |
| Stomach | 70803±19964 | 114976±53471 |
| Small intestine | 16447±8793 | 14983±2818 |
| Large intestine | 9434±7230 | 18978±7719 |
| Lung | 48314±16259 | 112008±19080* |
| Heart | 1971±841 | 1746±738 |
| Fat | 3356±1392 | 2834±1302 |
* Statistically different (P-value < 0.05) from FBX mice.
4. Discussion
In pharmacokinetic evaluation, the concentration-time profiles of a drug in the blood and tissues can explain the absorption rate and systemic and/or specific tissue exposure of the drug. The drug exposure of a drug at appropriate concentrations for a sufficient duration is a critical factor in achieving the expected efficacy. Therefore, the pharmacokinetic characteristics of a drug play an important role in determining the expected drug response over time (i.e., efficacy and/or toxicity) [39,40].
The low solubility of FBX restricts its dissolution and/or absorption processes in the GI tract, resulting in incomplete and variable absorption. This leads to a low oral dose F value [11,13,41]. Another contributing factor to the low F is its extensive first-pass effect. After absorption, FBX undergoes significant metabolism and biliary excretion, further reducing its systemic availability [37,38]. FBX is extensively metabolized by cytochrome P450 enzymes (CYP 1A1, 1A2, 2C8, 2C9, and 3A4) as well as uridine 5'-diphospho-glucuronosyltransferase (UGT) [13,38,42]. It has been reported that approximately 20−30% of glucuronidated FBX, such as FBX N-glucuronide, is excreted in the urine, along with less than 10% unchanged FBX [37,38,42,43]. Furthermore, a second peak pattern of FBX itself, attributed to biliary excretion, has also been observed [43]. A study conducted in rats reported that approximately 8.5% of the administered FBX dose was excreted in the bile after intravenous administration [37]. In terms of distribution, FBX exhibits high protein binding capacity (greater than 99%), which can impact its distribution and availability in the systemic circulation [37]. These pharmacokinetic properties of FBX contribute to its low F value.
The high plasma protein binding values of FBX were observed in both FBX and FBX-PG rats and mice, ranging from approximately 94.2% to 98.4%. These results indicated that the free fractions of FBX were similarly low in both rodents.
In pharmacokinetic study, the amount of ethanol used in vehicle, 5:5 (v/v) of ethanol: polyethylene glycol, was in the safe range [44,45]: orally administered ethanol volume, 2 mL/kg and 5 mL/kg to rats and mice, respectively, in this study is equivalent to 1.98 g/kg and 3.95 g/kg for rats and mice, considering the density of ethanol as 0.789 g/mL. Based on the reported LD50 values of orally administered ethanol, 10.6 g/kg and 12 g/kg in rats and mice [44,46], the safe amount of ethanol was used as vehicle in this study.
In evaluation of pharmacokinetic feasibility of FBX and FBX-PG, the higher Cmax,1 and shorter Tmax,1 of FBX observed after FBX-PG administration (Table 2 for rats and Table 3 for mice) indicated a faster absorption compared to FBX administration. It is worth noting that GI24h, which represents the sum fraction of the unabsorbed dose and biliary excreted dose 24 h after oral administration, does not provide an exact calculation of the unabsorbed percentage of the oral dose [36]. Therefore, the mean 'true' unabsorbed fraction (‘Funabs’) after the oral administration of FBX to rats was calculated based on a reported equation.
GI24h, oral = ‘Funabs’ + (F × GI24h, intravenous)
In FBX rats, the assumed value for GI24h of the intravenous dose (GI24h, intravenous) was approximately 8.5%, based on a previously reported value of the dose excreted in the bile after intravenous administration [37]. The absolute F of FBX in rats was estimated to be approximately 49% using a previously reported value [13]. In FBX-PG rats, the same value for GI24h, intravenous was utilized, and the estimated absolute F was 103%, considering the relative F of 210% in rats.
0.517 = ‘Funabs’ + (0.49 × 0.085) FBX rats
0.408 = ‘Funabs’ + (1.03 × 0.085) FBX-PG rats
As shown in Table 1, the solubility of FBX-PG was improved approximately 3.92 in water and 1.95–5.19 fold compared to FBX in various pH conditions. This improved solubility of FBX-PG might affect the absorption rate of FBX, which resulting in higher Cmax,1 at shorter Tmax,1 values in FBX-PG compared to those in FBX. Moreover, the increased solubility of FBX-PG caused the enhanced absorption extent of FBX as well as absorption rate of FBX, which was supported by the absorbed fraction values of FBX were 52.5 and 68.0% in FBX and FBX-PG rats, respectively. Similar phenomenon were already reported in numerous cases: increased solubility of a cocrystal formation of API with a conformer resulted in increased absorption rate and extent of each API such as hesperetin cocrystal with piperine [47], TAK-020 (a Bruton tyrosine kinase inhibitor) cocrystal with gentisic acid [48], and ketoconazole cocrystal with 4-aminobenzoic acid [49].
The possible mechanisms for the appearance of second peaks in FBX and FBX-PG rats include enterohepatic circulation, solubility-limited absorption, and reversible distribution between tissues and plasma [50,51,52]. Firstly, the second peaks may be attributed to the enterohepatic circulation of FBX in rats, as previously reported [10,43]. The higher Cmax,2 with longer Tmax,2 in FBX-PG rats compared to FBX rats suggests that biliary-excreted FBX may be more readily reabsorbed into the bloodstream. The similar terminal t1/2 of FBX, at 434 min and 472 min, in both FBX and FBX-PG rats, respectively, supports the notion that the elimination of FBX in both groups of rats was comparable. Secondly, solubility-limited absorption, particularly observed in BCS class II drugs with low solubility, can lead to the appearance of second peaks after oral administration. Similar second peak profiles at approximately 4‒8 h were reported for levodopa and doxycycline [50]. Thirdly, reversible distribution between tissue and plasma can also contribute to the occurrence of second peaks. Despite its high plasma protein binding value, FBX rapidly distributes to the lung, stomach, and liver, indicating the possibility of the reversible movement of FBX between tissues and plasma over time. Multiple peaks have been observed in drugs, such as trimethoprim and sulfadiazine, due to their extensive distribution and reversible movement between tissues and systemic circulation [53]. As a result of absorption and disposition, systemic exposure (i.e., AUC, Cmax,1, and Cmax,2), as well as the relative F value of FBX, were increased in FBX-PG rats compared to FBX rats (Table 2 and Figure 2). This could be attributed to the enhanced absorption of FBX in the GI tract and its subsequent reabsorption into the bloodstream through enterohepatic circulation. The increased solubility of FBX in FBX-PG may have contributed to this phenomenon.
Similar to the observations in rats, increased relative F values and increased systemic exposure (i.e., increased AUC, Cmax,1, and Cmax,2) of FBX were observed in FBX-PG mice compared to FBX mice (Table 3 and Figure 3). And, similar to rats, second peaks were also observed in the mice. FBX-PG mice exhibited higher Cmax,1 at shorter Tmax,1, and higher Cmax,2 at longer Tmax,2 compared to FBX mice.
During tissue distribution, FBX initially distributes to the stomach and small intestine during absorption and then extensively distributes to highly perfused organs, such as the liver and lungs. In FBX mice, FBX showed higher distribution in the stomach, liver, and lungs compared to other tissues. The distribution pattern may vary depending on the extraction time of the tissue, which reflects the distribution process. T/P ratios of FBX above 1 were observed in the stomach, small intestine, large intestine, lungs, and liver, indicating the preferential accumulation of FBX in these tissues. In contrast, the distribution in the heart and fat tissue was slower and smaller, with T/P ratios below 1. In FBX-PG mice, the tissue distribution of FBX, including FBX concentrations and T/P ratios, appeared to be similar to those in FBX mice. However, the distribution of FBX in the liver and lungs seemed to be increased in FBX-PG mice compared to FBX mice. Additionally, the T/P ratios in almost all tissues increased from 0.5 to 8 h, even though the plasma concentrations of FBX decreased after 2 h. This suggests that FBX continues to be distributed to tissues even when its concentrations in the bloodstream decrease. The findings indicate that FBX was well-distributed to various tissues with high affinity, and the distribution pattern of FBX was largely comparable between FBX and FBX-PG mice. The differential rates of FBX distribution in various tissues can provide valuable information for selecting suitable in vivo disease models to further evaluate the in vitro potency of FBX [54].
It is important to note that there may be differences in the pharmacokinetics of FBX between rodents and humans, and further studies are necessary to fully understand the role of absorption and biliary excretion of FBX in humans. However, based on the findings of this study, it can be concluded that FBX-PG administration to rats and mice significantly increased the AUC and F values of FBX. This indicates an improved pharmacokinetic profile of FBX when administered as FBX-PG. The FBX-PG formulation not only maintained the extensive tissue distribution observed with FBX alone but showed an even greater tissue distribution pattern. These results suggest that FBX-PG may be a promising formulation for enhancing FBX exposure in both plasma and tissues, potentially improving its therapeutic efficacy.
Supplementary Materials
The following supporting information can be downloaded at the website of this paper posted on Preprints.org, Figure S1: Representative chromatograms of FBX and IS in mouse plasma, urine, and GI samples. (a) Stock solution of 0.005 µg/mL FBX and 0.005 µg/mL IS; (b) drug-free mouse plasma; (c) plasma standard spiked with 7 µg/mL FBX; (d) plasma sample at 30 min after oral administration of 50 mg/kg FBX; (e) drug-free urine; (f) urine standard spiked with 7 µg/mL FBX; (g) urine sample collected at 24 h after oral administration of 50 mg/kg FBX; (h) drug-free GI; (i) GI standard spiked with 7 µg/mL FBX; (j) GI sample collected at 24 h after oral administration of 50 mg/kg FBX.; Table S1: Concentrations (μg/mL for plasma and μg/g tissue in tissues) of FBX in plasma and tissues and their T/P ratios after oral (50 mg/kg as FBX) administration of FBX or FBX-PG to mice, respectively. Values in parentheses are mean values of the T/P ratios. * Statistically different (P-value < 0.05) from FBX mice.
Author Contributions
Conceptualization, K.J. and Y.H.C.; methodology, Y.H.C.; investigation, J.-E.Y., B.H.Y. and M.B.; data curation, J.-E.Y., B.H.Y. and M.B.; writing−original draft preparation, J.-E.Y., B.H.Y., M.B. and Y.H.C.; writing−review and editing, S.Y.H., Y.H.C.; visualization, J.-E.Y., B.H.Y. and M.B.; supervision, K.J. and Y.H.C.; funding acquisition, Y.H.C. All authors have read and agreed to the published version of the manuscript.
Funding
This research was funded by the National Research Foundation of Korea (NRF) of the Korean government (MSIT) [grant number NRF-2018R1A5A2023127 and NRF-2021R1A2C1094462 (Y.H.C.)].
Institutional Review Board Statement
All animal studies were approved by the Institute of Laboratory Animal Resources of Dongguk University_Seoul (approval number: IACUC-2016-023 on March 18, 2016 and IACUC-2022-012 on June 10, 2022; Seoul, Republic of Korea) and maintained according to the guidelines of the Animal Facility. The animal experiments were performed in accordance with the current ethical regulations for animal care and use at Dongguk University_Seoul.
Informed Consent Statement
Not applicable.
Data Availability Statement
Not applicable.
Conflicts of Interest
The authors declare no conflict of interest.
References
- Maddileti, D.; Jayabun, S.K.; Nangia, A. Soluble Cocrystals of the Xanthine Oxidase Inhibitor Febuxostat. Cryst. Growth Des. 2013, 13, 3188–3196. [Google Scholar] [CrossRef]
- Vishweshwar, P.; McMahon, J.A.; Bis, J.A.; Zaworotko, M.J. Pharmaceutical co-crystals. J. Pharm. Sci. 2006, 95, 499−516. [Google Scholar] [CrossRef] [PubMed]
- Guo, M.; Sun, X.; Chen, J.; Cai, T. Pharmaceutical cocrystals: A review of preparations, physicochemical properties and applications. Acta Pharm. Sin. B 2021, 11, 2537–2564. [Google Scholar] [CrossRef] [PubMed]
- Karimi-Jafari, M.; Padrela, L.; Walker, G.M.; Croker, D.M. Creating Cocrystals: A Review of Pharmaceutical Cocrystal Preparation Routes and Applications. Cryst. Growth Des. 2018, 18, 6370–6387. [Google Scholar] [CrossRef]
- Khosravan, R.; Grabowski, B.; Wu, J.-T.; Joseph-Ridge, N.; Vernillet, L. Effect of food or antacid on pharmacokinetics and pharmacodynamics of febuxostat in healthy subjects. Br. J. Clin. Pharmacol. 2008, 65, 355–363. [Google Scholar] [CrossRef]
- Roubenoff, R.; Klag, M.J.; Mead, L.A.; Liang, K.-Y.; Seidler, A.J.; Hochberg, M.C. Incidence and Risk Factors for Gout in White Men. JAMA 1991, 266, 3004–3007. [Google Scholar] [CrossRef]
- Amin, O.M.; Ammar, A.; Eladawy, S.A. Febuxostat loaded β-cyclodextrin based nanosponge tablet: an in vitro and in vivo evaluation. J. Pharm. Investig. 2019, 50, 399–411. [Google Scholar] [CrossRef]
- White, W.B.; Saag, K.G.; Becker, M.A.; Borer, J.S.; Gorelick, P.B.; Whelton, A.; Hunt, B.; Castillo, M.; Gunawardhana, L.; CARES Investigators. Cardiovascular Safety of Febuxostat or Allopurinol in Patients with Gout. N. Engl. J. Med. 2018, 378, 1200–1210. [Google Scholar] [CrossRef]
- Xu, Y.; Chen, J.; Yang, D.; Hu, Y.; Hu, X.; Jiang, B.; Ruan, Z.; Lou, H. Development of LC-MS/MS determination method and backpropagation artificial neural networks pharmacokinetic model of febuxostat in healthy subjects. J. Clin. Pharm. Ther. 2020, 46, 333–342. [Google Scholar] [CrossRef]
- Ahuja, B.K.; Jena, S.K.; Paidi, S.K.; Bagri, S.; Suresh, S. Formulation, optimization and in vitro-in vivo evaluation of febuxostat nanosuspension. Int. J. Pharm. 2015, 478, 540−552. [Google Scholar] [CrossRef]
- An, J.-H.; Lim, C.; Ryu, H.C.; Kim, J.S.; Kim, H.M.; Kiyonga, A.N.; Park, M.; Suh, Y.G.; Park, G.H.; Jung, K. Structural characterization of febuxostat/L-pyroglutamic acid cocrystal using solid-state 13C-NMR and investigational study of its water solubility. Crystals. 2017, 7, 365. [Google Scholar] [CrossRef]
- Gurumukhi, V.C.; Sonawane, V.P.; Tapadiya, G.G.; Bari, S.B.; Surana, S.J.; Chalikwar, S.S. Quality-by-design based fabrication of febuxostat-loaded nanoemulsion: Statistical optimization, characterizations, permeability, and bioavailability studies. Heliyon 2023, 9, e15404. [Google Scholar] [CrossRef] [PubMed]
- Habib, B.A.; Abd El-Samiae, A.S.; El-Houssieny, B.M.; Tag, R. Formulation, characterization, optimization, and in-vivo performance of febuxostat self-nano-emulsifying system loaded sublingual films. Drug. Deliv. 2021, 28, 1321–1333. [Google Scholar] [CrossRef] [PubMed]
- Banerjee, R.; Bhatt, P.M.; Ravindra, N.V.; Desiraju, G.R. Saccharin Salts of Active Pharmaceutical Ingredients, Their Crystal Structures, and Increased Water Solubilities. Cryst. Growth Des. 2005, 5, 2299–2309. [Google Scholar] [CrossRef]
- Basavoju, S.; Boström, D.; Velaga, S.P. Pharmaceutical Cocrystal and Salts of Norfloxacin. Cryst. Growth Des. 2006, 6, 2699–2708. [Google Scholar] [CrossRef]
- Byrn, S.R.; Pfeiffer, R.R.; Stowell, J.G. Solid-state chemistry of drugs, 2nd ed.; SSCI: West lafayette, Indiana, 1999. [Google Scholar]
- Good, D.J.; Rodríguez-Hornedo, N. Solubility Advantage of Pharmaceutical Cocrystals. Cryst. Growth Des. 2009, 9, 2252–2264. [Google Scholar] [CrossRef]
- McNamara, D.P.; Childs, S.L.; Giordano, J.; Iarriccio, A.; Cassidy, J.; Shet, M.S.; Mannion, R.; O'Donnell, E.; Park, A. Use of a Glutaric Acid Cocrystal to Improve Oral Bioavailability of a Low Solubility API. Pharm. Res. 2006, 23, 1888–1897. [Google Scholar] [CrossRef]
- Remenar, J.F.; Morissette, S.L.; Peterson, M.L.; Moulton, B.; MacPhee, J.M.; Guzmán, H.R.; Almarsson. Crystal Engineering of Novel Cocrystals of a Triazole Drug with 1,4-Dicarboxylic Acids. J. Am. Chem. Soc. 2003, 125, 8456–8457. [Google Scholar] [CrossRef]
- Sanphui, P.; Goud, N.R.; Khandavilli, U.B.R.; Nangia, A. Fast Dissolving Curcumin Cocrystals. Cryst. Growth Des. 2011, 11, 4135–4145. [Google Scholar] [CrossRef]
- Sanphui, P.; Goud, N.R.; Khandavilli, U.B.R.; Bhanoth, S.; Nangia, A. New polymorphs of curcumin. Chem. Commun. 2011, 47, 5013–5015. [Google Scholar] [CrossRef]
- Spectrum. Safety data sheet (L-pyroglutamic acid). 2018.
- Chen, J.; Sarma, B.; Evans, J.M.B.; Myerson, A.S. Pharmaceutical Crystallization. Cryst. Growth Des. 2011, 11, 887−895. [Google Scholar] [CrossRef]
- Ryu, H.C. Crystalline febuxostat pidolate salt and method for preparing thereof. K.R. Patent 10-1501253. 2015.
- Aher, S.V.; Pore, Y.V. Physicochemical Characterization of Febuxostat Microcomplexes with Parent and Modified Cyclodextrins. Dhaka Univ. J. Pharm. Sci. 2018, 17, 51–63. [Google Scholar] [CrossRef]
- Han, S.Y.; Chae, H.-S.; You, B.H.; Chin, Y.-W.; Kim, H.; Choi, H.S.; Choi, Y.H. Lonicera japonica extract increases metformin distribution in the liver without change of systemic exposed metformin in rats. J. Ethnopharmacol. 2019, 238, 111892. [Google Scholar] [CrossRef] [PubMed]
- You, B.H.; Chin, Y.-W.; Kim, H.; Choi, H.S.; Choi, Y.H. Houttuynia cordata extract increased systemic exposure and liver concentrations of metformin through OCTs and MATEs in rats. Phytotherapy Res. 2018, 32, 1004–1013. [Google Scholar] [CrossRef]
- You, B.H.; Bae, M.; Han, S.Y.; Jung, J.; Jung, K.; Choi, Y.H. Pharmacokinetic Feasibility of Stability-Enhanced Solid-State (SESS) Tenofovir Disoproxil Free Base Crystal. Pharmaceutics 2023, 15, 1392. [Google Scholar] [CrossRef] [PubMed]
- Diehl, K.-H.; Hull, R.; Morton, D.; Pfister, R.; Rabemampianina, Y.; Smith, D.; Vidal, J.-M.; Van De Vorstenbosch, C. A good practice guide to the administration of substances and removal of blood, including routes and volumes. J. Appl. Toxicol. 2001, 21, 15–23. [Google Scholar] [CrossRef]
- Florida atlantic university institutional animal care and use committee (FAU IACUC). Guidelines for rodent survival blood collection, 2021.
- Golde, W.T.; Gollobin, P.; Rodriguez, L.L. A rapid, simple, and humane method for submandibular bleeding of mice using a lancet. Lab Anim. 2005, 34, 39–43. [Google Scholar] [CrossRef]
- Lee, C.W.; You, B.H.; Yim, S.; Han, S.Y.; Chae, H.-S.; Bae, M.; Kim, S.-Y.; Yu, J.-E.; Jung, J.; Nhoek, P.; et al. Change of metformin concentrations in the liver as a pharmacological target site of metformin after long-term combined treatment with ginseng berry extract. Front. Pharmacol. 2023, 14, 1148155. [Google Scholar] [CrossRef]
- Han, S.Y.; You, B.H.; Kim, Y.C.; Chin, Y.-W.; Choi, Y.H. Dose-Independent ADME Properties and Tentative Identification of Metabolites of α-Mangostin from Garcinia mangostana in Mice by Automated Microsampling and UPLC-MS/MS Methods. PLOS ONE 2015, 10, e0131587. [Google Scholar] [CrossRef]
- Kim, Y.-J.; Han, S.Y.; Seo, J.S.; Chin, Y.-W.; Choi, Y.H. Pharmacokinetics, Tissue Distribution, and Tentative Metabolite Identification of Sauchinone in Mice by Microsampling and HPLC-MS/MS Methods. Biol. Pharm. Bull. 2015, 38, 218–227. [Google Scholar] [CrossRef]
- Gibaldi, M.; Perrier, D. Pharmacokinetics, 2nd ed.; Marcel-Dekker: Boca raton, Florida, 1982. [Google Scholar]
- Lee, M.G.; Chiou, W.L. Evaluation of potential causes for the incomplete bioavailability of furosemide: Gastric first-pass metabolism. J. Pharmacokinet. Biopharm. 1983, 11, 623–640. [Google Scholar] [CrossRef] [PubMed]
- Grabowski, B.A.; Khosravan, R.; Vernillet, L.; Mulford, D.J. Metabolism and Excretion of [14C] Febuxostat, a Novel Nonpurine Selective Inhibitor of Xanthine Oxidase, in Healthy Male Subjects. J. Clin. Pharmacol. 2011, 51, 189–201. [Google Scholar] [CrossRef] [PubMed]
- Khosravan, R.; A Grabowski, B.; Wu, J.-T.; Joseph-Ridge, N.; Vernillet, L. Pharmacokinetics, Pharmacodynamics and Safety of Febuxostat, a Non-Purine Selective Inhibitor of Xanthine Oxidase, in a Dose Escalation Study in Healthy Subjects. Clin. Pharmacokinet. 2006, 45, 821–841. [Google Scholar] [CrossRef] [PubMed]
- Cook, D.; Brown, D.; Alexander, R.; March, R.; Morgan, P.; Satterthwaite, G.; Pangalos, M.N. Lessons learned from the fate of AstraZeneca's drug pipeline: a five-dimensional framework. Nat. Rev. Drug Discov. 2014, 13, 419–431. [Google Scholar] [CrossRef]
- Lin, J.H. Tissue Distribution and Pharmacodynamics: A Complicated Relationship. Curr. Drug Metab. 2006, 7, 39–65. [Google Scholar] [CrossRef]
- Bhalani, D.V.; Nutan, B.; Kumar, A.; Chandel, A.K.S. Bioavailability Enhancement Techniques for Poorly Aqueous Soluble Drugs and Therapeutics. Biomedicines 2022, 10, 2055. [Google Scholar] [CrossRef]
- Mukoyoshi, M.; Nishimura, S.; Hoshide, S.; Umeda, S.; Kanou, M.; Taniguchi, K.; Muroga, H. In vitrodrug–drug interaction studies with febuxostat, a novel non-purine selective inhibitor of xanthine oxidase: plasma protein binding, identification of metabolic enzymes and cytochrome P450 inhibition. Xenobiotica 2008, 38, 496–510. [Google Scholar] [CrossRef]
- Kamel, B.; Graham, G.G.; Williams, K.M.; Pile, K.D.; Day, R.O. Clinical Pharmacokinetics and Pharmacodynamics of Febuxostat. Clin. Pharmacokinet. 2016, 56, 459–475. [Google Scholar] [CrossRef]
- Wiberg, G.; Trenholm, H.; Coldwell, B.B. Increased ethanol toxicity in old rats: Changes in LD50, in vivo and in vitro metabolism, and liver alcohol dehydrogenase activity. Toxicol. Appl. Pharmacol. 1970, 16, 718–727. [Google Scholar] [CrossRef]
- The international council for harmonization of technical requirements for pharmaceuticals for human use (ICH). Impurities: Guideline for residual solvents. 2011.
- Tsibulsky, W.; Amit, Z. Tolerance to effects of high doses of ethanol: 1. Lethal effects in mice. Pharmacol. Biochem. Behav. 1993, 45, 465–472. [Google Scholar] [CrossRef]
- Liu, Y.; Yang, F.; Zhao, X.; Wang, S.; Yang, Q.; Zhang, X. Crystal structure, solubility, and pharmacokinetic study on a hesperetin cocrystal with piperine as conformer. Pharmaceutics. 2022, 14, 94. [Google Scholar] [CrossRef] [PubMed]
- Kimoto, K.; Yamamoto, M.; Karashima, M.; Hohokabe, M.; Takeda, J.; Yamamoto, K.; Ikeda, Y. Pharmaceutical Cocrystal Development of TAK-020 with Enhanced Oral Absorption. Crystals 2020, 10, 211. [Google Scholar] [CrossRef]
- Kataoka, M.; Minami, K.; Takagi, T.; Amidon, G.E.; Yamashita, S. In Vitro–In Vivo Correlation in Cocrystal Dissolution: Consideration of Drug Release Profiles Based on Coformer Dissolution and Absorption Behavior. Mol. Pharm. 2021, 18, 4122–4130. [Google Scholar] [CrossRef]
- Davies, N.M.; Takemoto, J.K.; Brocks, D.R.; Yáñez, J.A. Multiple Peaking Phenomena in Pharmacokinetic Disposition. Clin. Pharmacokinet. 2010, 49, 351–377. [Google Scholar] [CrossRef] [PubMed]
- Helmy, S.A. Therapeutic drug monitoring and pharmacokinetic compartmental analysis of sulpiride double-peak absorption profile after oral administration to human volunteers. Biopharm. Drug Dispos. 2013, 34, 288–301. [Google Scholar] [CrossRef]
- Ogungbenro, K.; Pertinez, H.; Aarons, L. Empirical and Semi-Mechanistic Modelling of Double-Peaked Pharmacokinetic Profile Phenomenon Due to Gastric Emptying. AAPS J. 2014, 17, 227–236. [Google Scholar] [CrossRef] [PubMed]
- Van Duijkeren, E.; Ensink, J.M.; Meijer, L.A. Distribution of orally administered trimethoprim and sulfadiazine into noninfected subcutaneous tissue chambers in adult ponies. J. Veter- Pharmacol. Ther. 2002, 25, 273–277. [Google Scholar] [CrossRef]
- You, B.H.; BasavanaGowda, M.K.; Lee, J.U.; Chin, Y.-W.; Choi, W.J.; Choi, Y.H. Pharmacokinetic properties of moracin C in mice. Planta. Med. 2021, 87, 642−651. [Google Scholar] [CrossRef]
Figure 1.
Structures of FBX and FBX-PG.
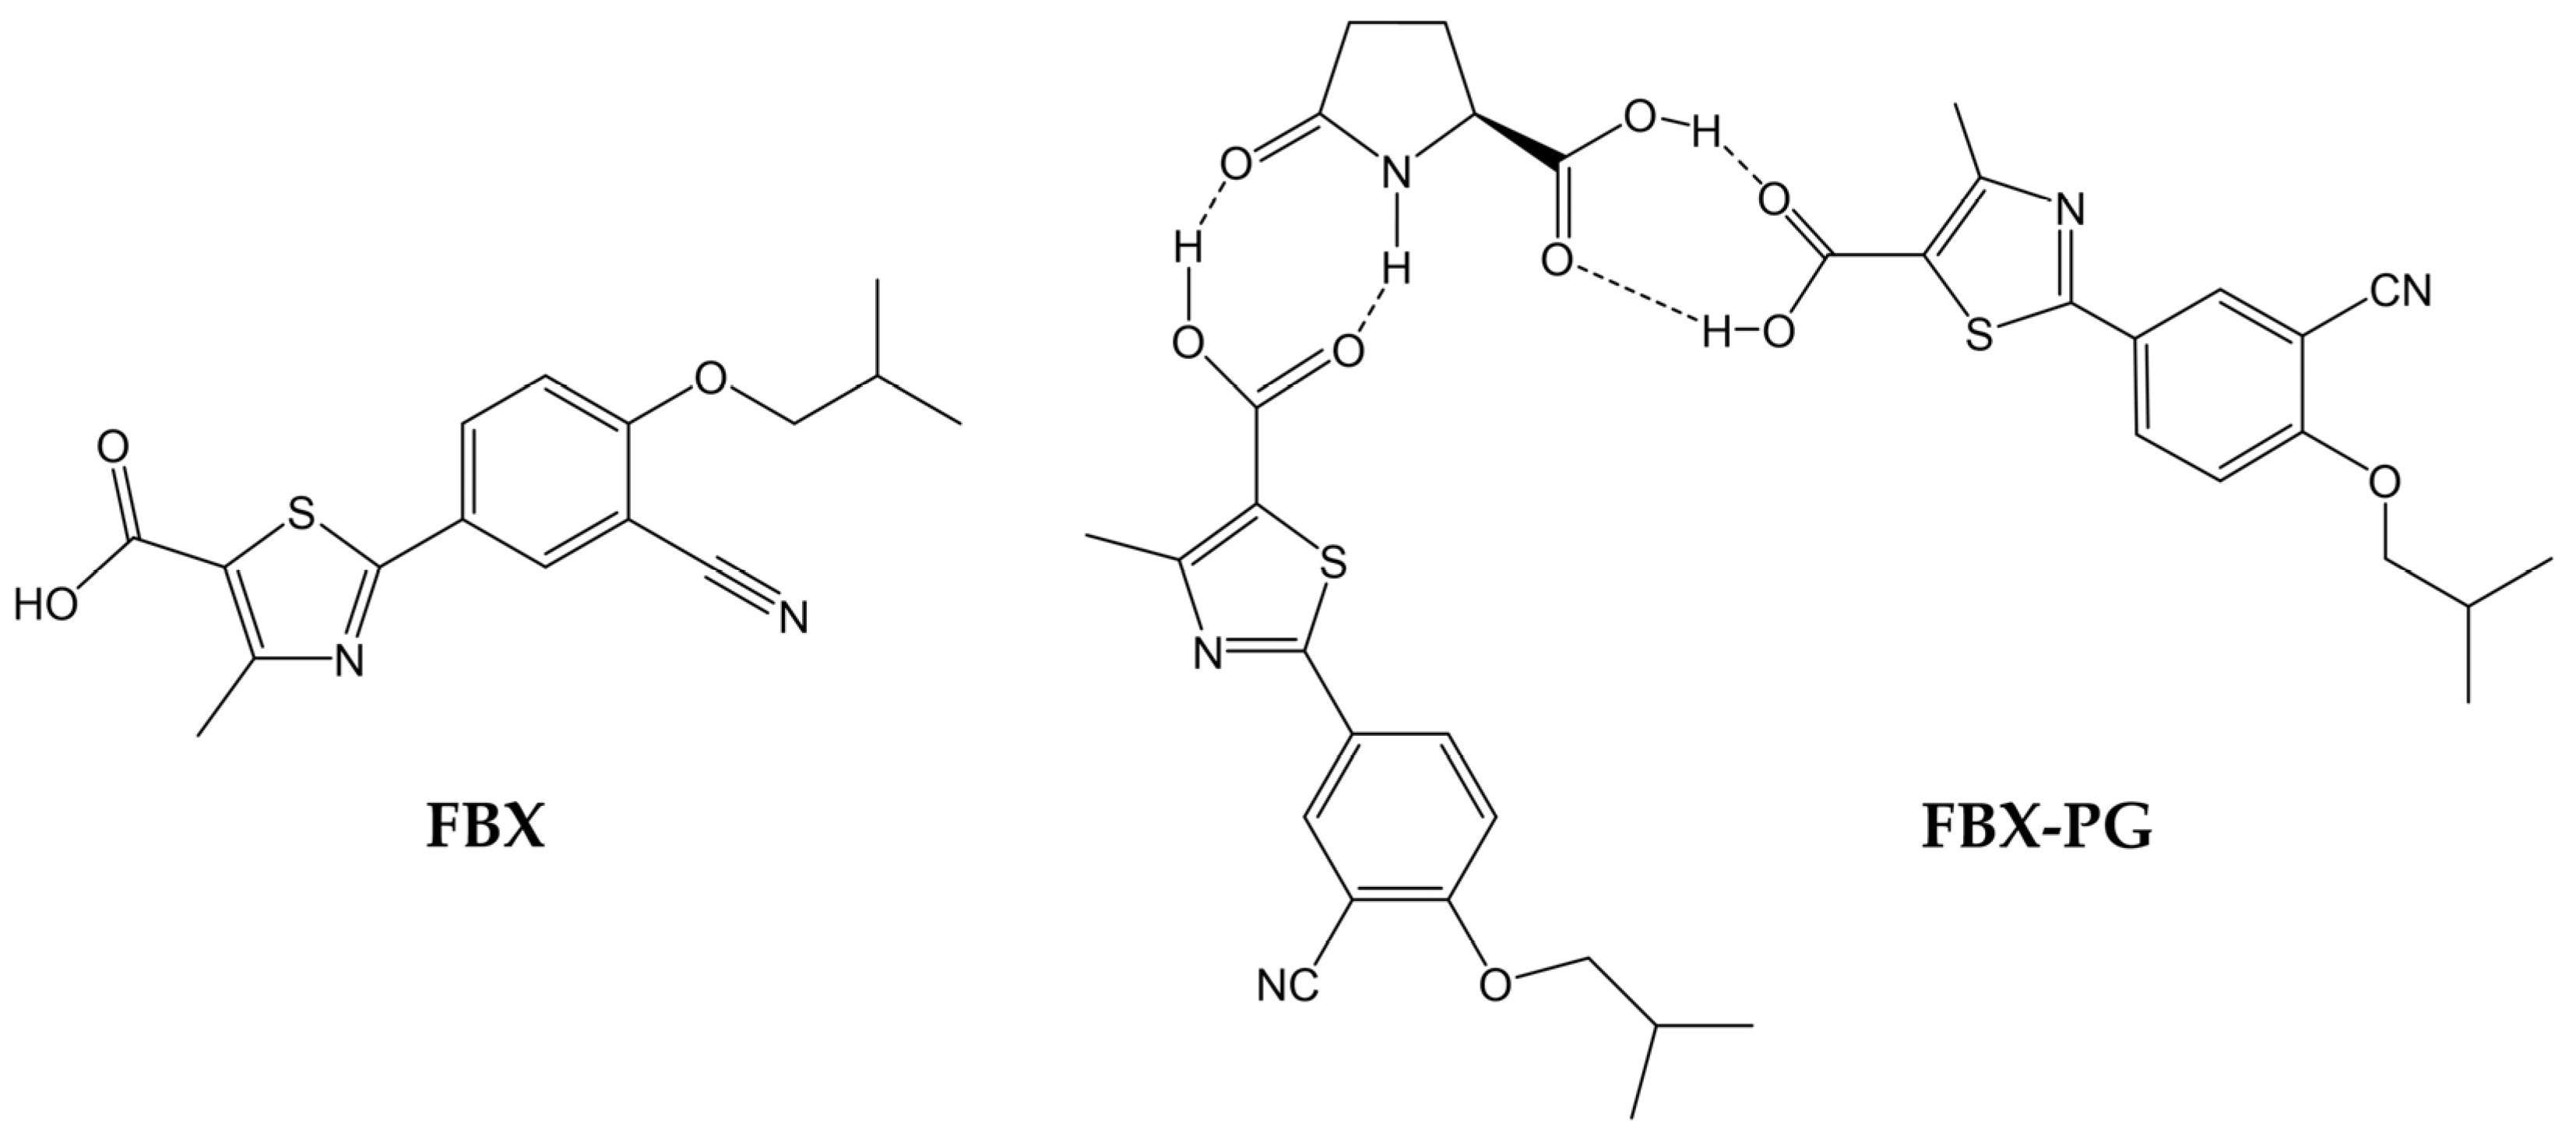
Figure 2.
Mean plasma concentrations of FBX after the oral administration of FBX (●) and FBX-PG (○) at a dose of 50 mg/kg as FBX to rats. Error bars represent standard deviations. The n values of FBX and FBX-PG was 12 and 13, respectively.
Figure 2.
Mean plasma concentrations of FBX after the oral administration of FBX (●) and FBX-PG (○) at a dose of 50 mg/kg as FBX to rats. Error bars represent standard deviations. The n values of FBX and FBX-PG was 12 and 13, respectively.
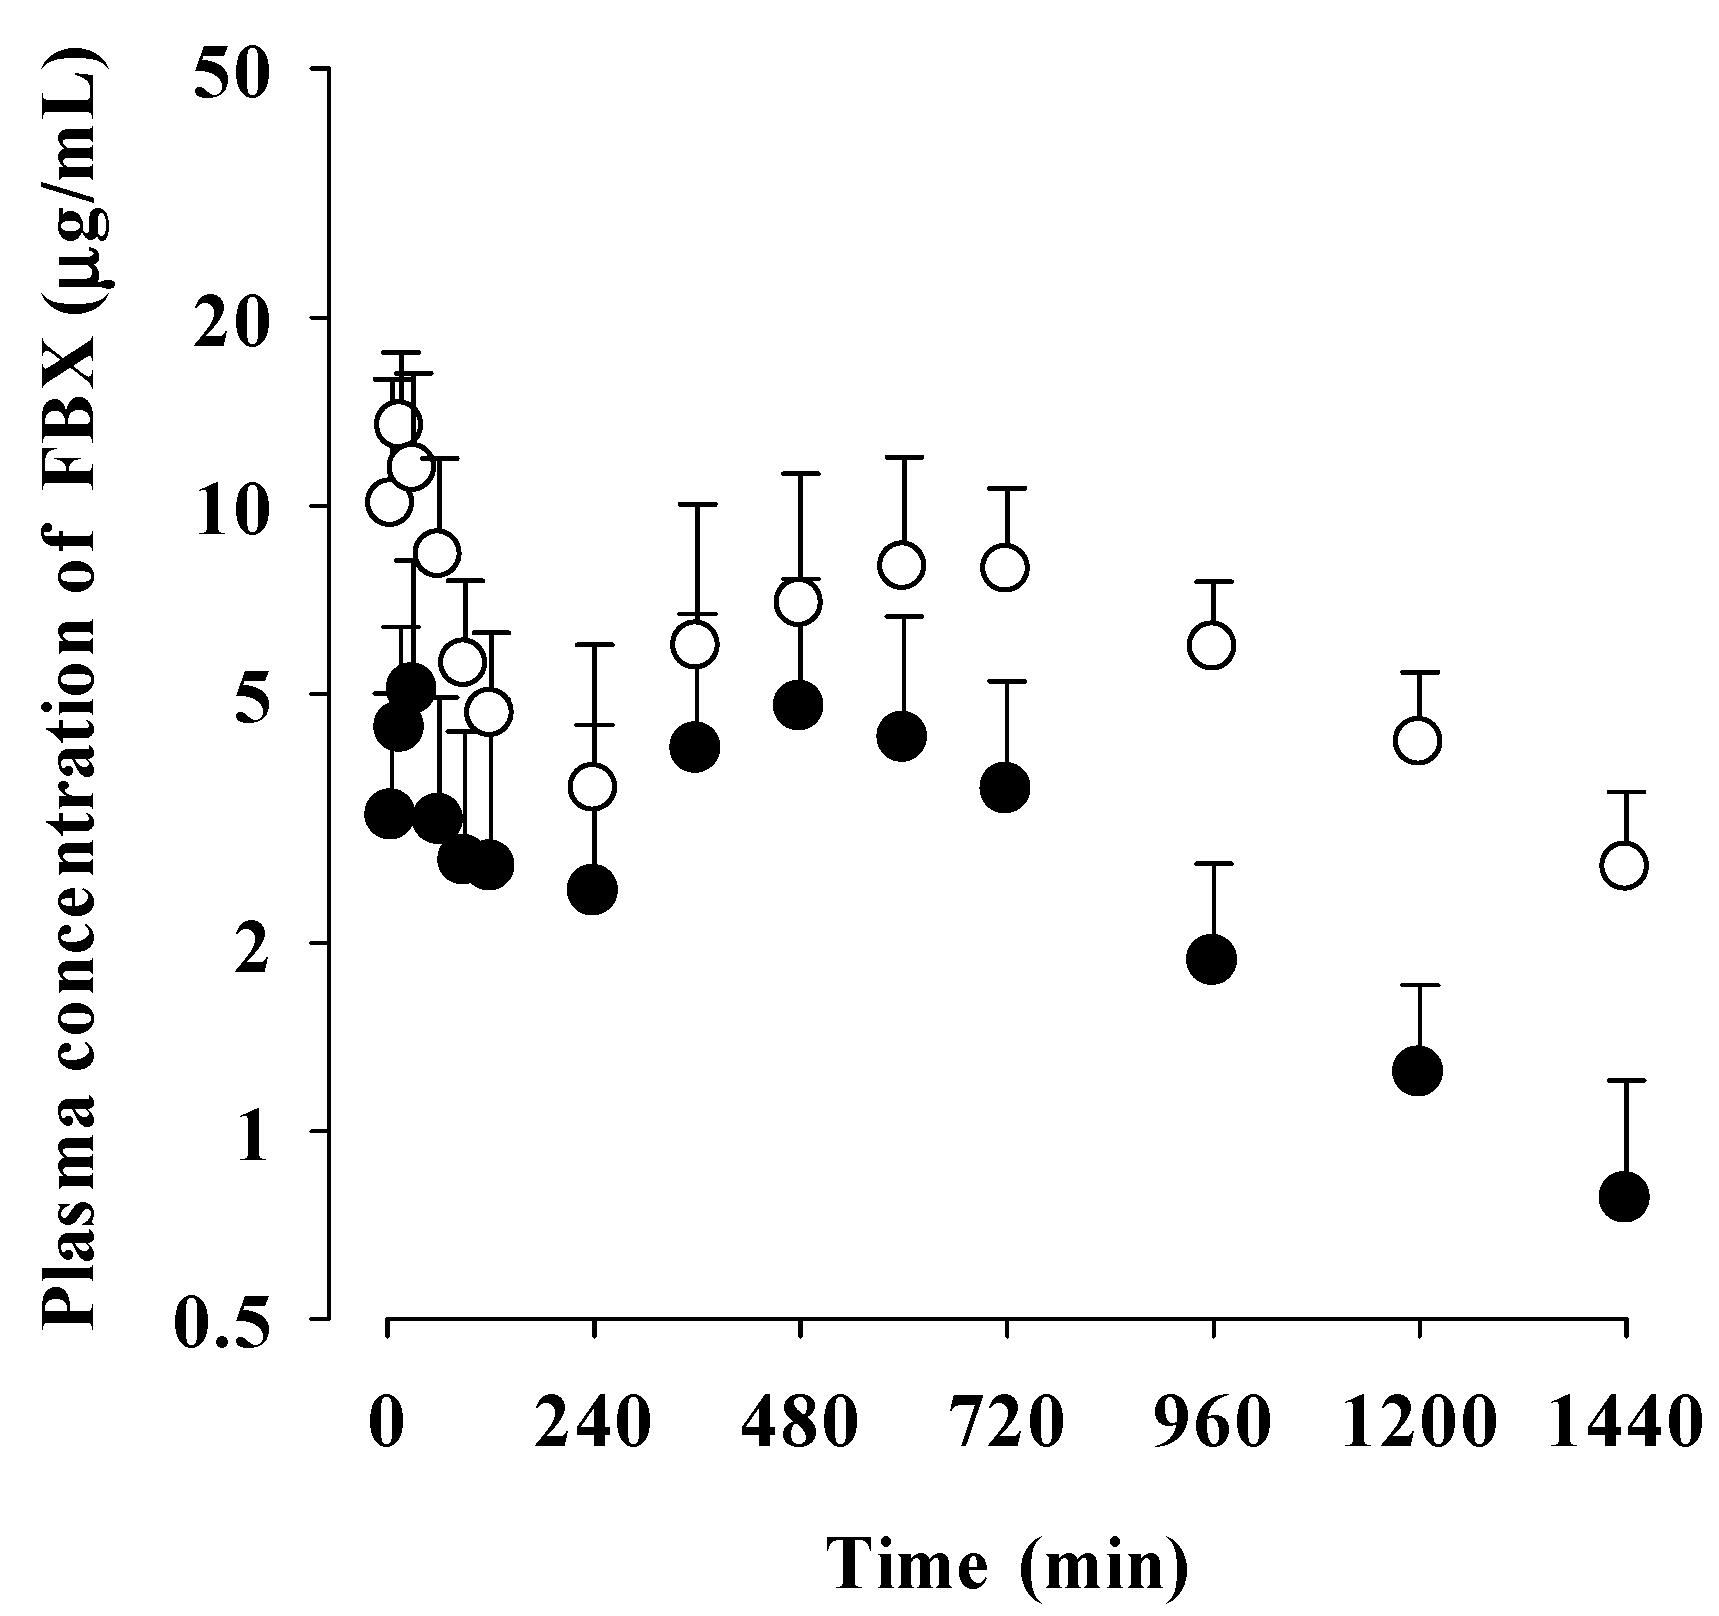
Figure 3.
Mean plasma concentrations of FBX after the oral administration of FBX (●) and FBX-PG (○) at a dose of 50 mg/kg as FBX to mice. Error bars represent standard deviations. The n values of 22 and 15 represent the number of mice used in the FBX and FBX-PG mice.
Figure 3.
Mean plasma concentrations of FBX after the oral administration of FBX (●) and FBX-PG (○) at a dose of 50 mg/kg as FBX to mice. Error bars represent standard deviations. The n values of 22 and 15 represent the number of mice used in the FBX and FBX-PG mice.
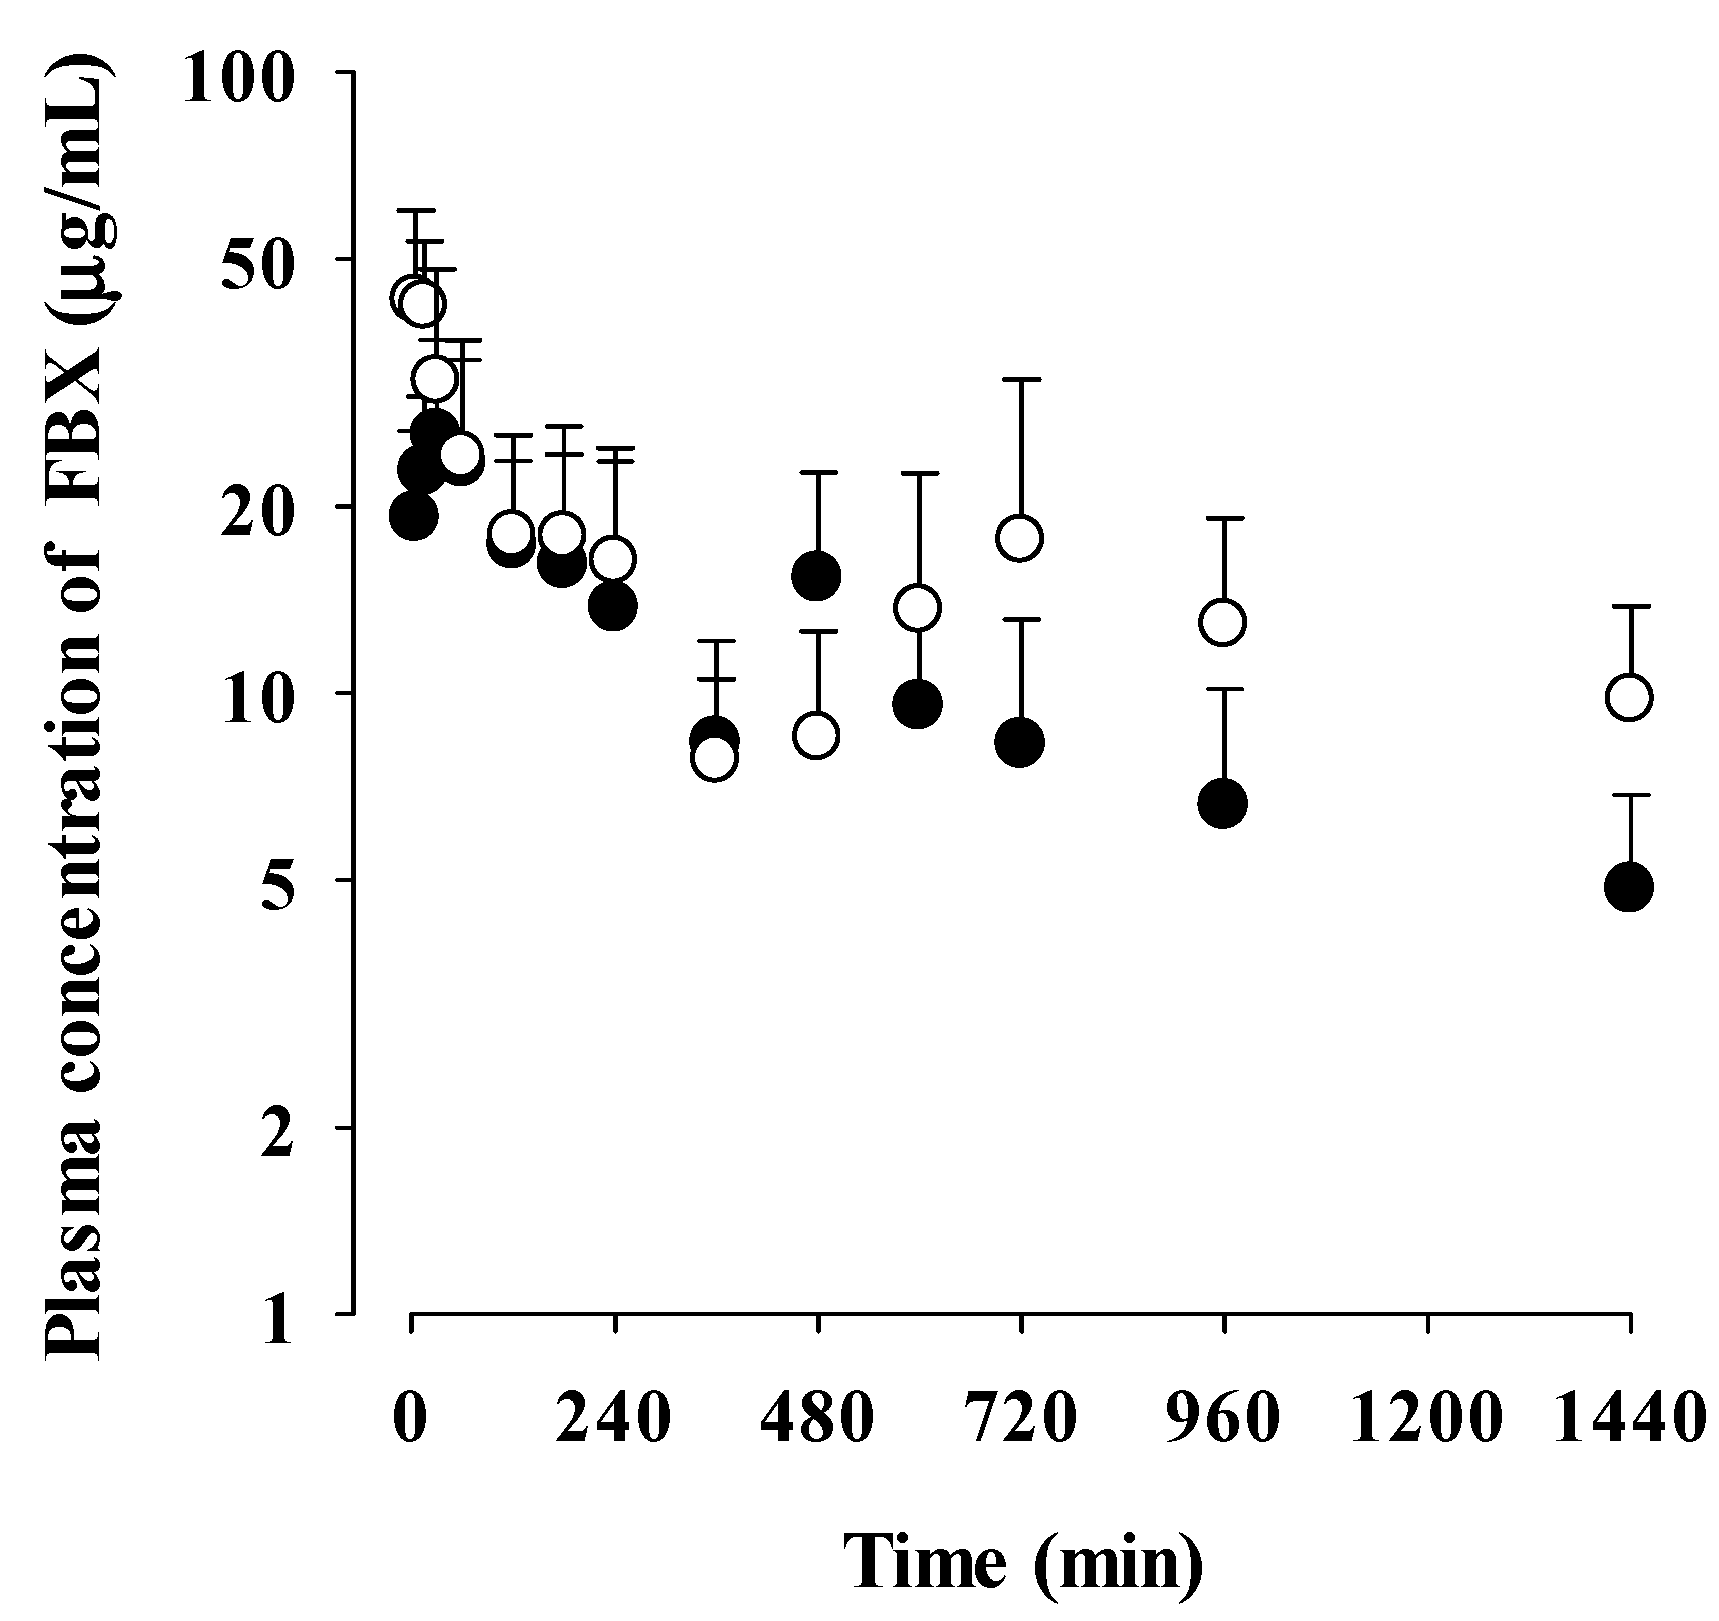
Table 1.
Physicochemical properties of FBX and FBX-PG.
| FBX | FBX-PG | |
|---|---|---|
| Molecular weight | 316.37 [11] | 761.85 [11] |
| log P | 3.953 [25], 3.90 1 | 7.611 |
| pKa | ||
| FBX | 3.42 [11] | - |
| PG | - | 3.32 [11] |
| Solubility | ||
| distilled water | 0.041 [11] | 0.161 [11] |
| pH 1.2 | 1.337 [11] | 2.605 [11] |
| pH 4.0 | 0.129 [11] | 0.670 [11] |
| pH 6.8 | 0.041 [11] | 0.170 [11] |
1 Data are the values predicted through the Swiss ADME program.
Table 2.
Mean (± standard deviation) pharmacokinetic parameters of FBX after the oral administration of FBX or FBX-PG at a dose of 50 mg/kg as FBX to rats.
Table 2.
Mean (± standard deviation) pharmacokinetic parameters of FBX after the oral administration of FBX or FBX-PG at a dose of 50 mg/kg as FBX to rats.
| Parameters | FBX (n = 12) | FBX-PG (n = 13) |
|---|---|---|
| Body weight (g) | 325±37.4 | 330±36.2 |
| Terminal t1/2 (min) | 434±206 | 472±207 |
| Cmax,1 (μg/mL) | 5.62±2.86 | 14.6±4.48* |
| Tmax,1 (min)1 | 30.0 (15−90) | 15.0 (15−30)* |
| Cmax,2 (μg/mL) | 5.63±2.63 | 9.44±3.27* |
| Tmax,2 (min)1 | 480 (120−960) | 600 (480−960)* |
| AUC0-1440min (μg min/mL) | 4144±1784 | 8251±2566* |
| AUC (μg min/mL) | 4824±1960 | 10149±3164* |
| Vz/F (mL/kg) | 7502±4709 | 3508±1567* |
| CL/F (mL/min/kg) | 12.5±6.10 | 5.35±1.58* |
| Ae0-24h (% of dose) | 3.64±1.25 | 3.69±1.64 |
| GI24h (% of dose) | 51.7±15.7 | 40.8±9.68* |
| Relative F0-1440min (%) | 199 | |
| Relative F (%) | 210 |
1 Data are median values (ranges). * Statistically different (P-value < 0.05) from FBX rats.
Table 3.
Mean pharmacokinetic parameters of FBX after the oral administration of FBX or FBX-PG at a dose of 50 mg/kg as FBX to mice.
Table 3.
Mean pharmacokinetic parameters of FBX after the oral administration of FBX or FBX-PG at a dose of 50 mg/kg as FBX to mice.
| Parameters | FBX (n = 22) | FBX-PG (n = 15) |
|---|---|---|
| Body weight (g) | 35.3±3.94 | 37.5±3.62 |
| Terminal t1/2 (min) | 880 | 883 |
| Cmax,1 (μg/mL) | 26.0 | 42.9 |
| Tmax,1 (min)1 | 30.0 | 5.00 |
| Cmax,2 (μg/mL) | 15.3 | 17.6 |
| Tmax,2 (min)1 | 480 | 720 |
| AUC0-1440min (μg min/mL) | 14187 | 19831 |
| AUC (μg min/mL) | 20324 | 32253 |
| Vz/F (mL/kg) | 3123 | 1974 |
| CL/F (mL/min/kg) | 2.46 | 1.55 |
| Relative F0-1440min (%) | 140 | |
| Relative F (%) | 159 |
Parameters are calculated using the average plasma concentrations from all mice in each group. The n values represent the number of mice used in the FBX and FBX-PG mice. 1 Data are median values (ranges).
Disclaimer/Publisher’s Note: The statements, opinions and data contained in all publications are solely those of the individual author(s) and contributor(s) and not of MDPI and/or the editor(s). MDPI and/or the editor(s) disclaim responsibility for any injury to people or property resulting from any ideas, methods, instructions or products referred to in the content. |
© 2023 by the authors. Licensee MDPI, Basel, Switzerland. This article is an open access article distributed under the terms and conditions of the Creative Commons Attribution (CC BY) license (http://creativecommons.org/licenses/by/4.0/).
Copyright: This open access article is published under a Creative Commons CC BY 4.0 license, which permit the free download, distribution, and reuse, provided that the author and preprint are cited in any reuse.


