
Submitted:
06 January 2023
Posted:
10 January 2023
You are already at the latest version
Abstract
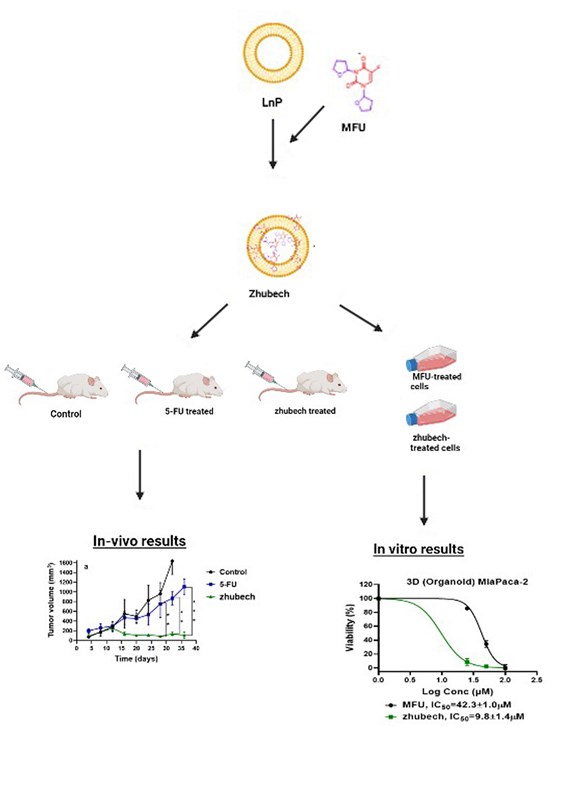
Pancreatic cancer is projected to be the second leading cause of cancer-related death by 2030 in the US. The benefits of the most common systemic therapy for various pancreatic cancer have been masked by high drug toxicities, adverse reactions, and resistance. Using nanocarriers like liposomes to overcome these unwanted effects has become very popular. This study aimed to formulate 1,3-bis tetrahydrofuran-2yl-5FU (MFU)-loaded liposomal nanoparticles (Zhubech) and evaluate the stability, MFU release kinetics, in vitro and in vivo anticancer activities, and biodistribution. Particle size and zeta potential were determined using a particle size analyzer, while cellular uptake of rhodamine-entrapped liposomal nanoparticle (Rh0-LnP) was determined by confocal microscopy. Gadolinium hexanoate (Gd-Hex) was synthesized and entrapped into the liposomal nanoparticle (LnP) (Gd-Hex-LnP) as a model contrast agent, to evaluate gadolinium biodistribution and accumulation by LnP in vivo using inductively coupled plasma mass spec-trometry (ICP-MS). The mean hydrodynamic diameters of the blank LnP and Zhubech were 90.0 ± 0.65 nm and 124.9 ± 3.2 nm, respectively. The hydrodynamic diameter of Zhubech was found to be highly stable at 4o C and 25oC for 30 days in solution. In vitro drug release of MFU from Zhubech formulation exhibited the Higuchi model (R2 value = 0.95). Both Miapaca-2 and Panc-1 treated with Zhubech showed reduced viability, two- or four-fold lower than that of MFU-treated cells in 3D spheroids (IC50Zhubech = 3.4 ± 1.0μM vs IC50MFU = 6.8 ± 1.1μM) and organoids (IC50Zhubech = 9.8 ± 1.4μM vs IC50MFU = 42.3 ± 1.0μM) culture models. Confocal imaging confirmed high uptake of rhodamine-entrapped LnP by Panc-1 cells in a time-dependent manner. Tumor efficacy studies in PDX bearing mouse model revealed more than 9-fold decrease in mean tumor volumes in Zhu-bech treated (108 ± 13.5 mm3) compared to 5-FU treated (1,107 ± 116.2 mm3) animals respectively. This study demonstrates that Zhubech may be a potential candidate for delivering drugs for pancreatic cancer treatment.
Keywords:
5-FU
; MFU
; liposomal nanoparticles
; Zhubech
; Gd-Hexanoate
; distribution
1. Introduction
Pancreatic cancer is projected to be the second leading cause of cancer death by 2030 after lung cancer in the United States[1]. The management of pancreatic cancer is multifaceted, comprising surgery, radiotherapy, and chemotherapy, with the choice of treatment mainly depending on the type and stage of the disease [2]. The benefits of chemotherapy, the most common systemic therapy for various cancers, have been masked by high drug toxicities, adverse reactions, and drug resistance [3,4]. The cancer burden worldwide has necessitated modern approaches that ensure safer, targeted, and efficient delivery of drugs to the tumor site. One such approach is using nanoparticles for targeted drug delivery to overcome the challenge of low drug concentration reaching tumors [5,6].
Nanoparticles range in size from between 1 and 1000nm [7]. Their composition includes phospholipids and other polymeric materials [8]. The size and design of nanoparticles increase the ease at which they permeate tumors, enhancing the deposition of a higher concentration of therapeutic agents in the tumors. Nanoparticles work by targeting cancer cells, tumor environment, or the immune system [7]. Liposomes, dendrimers, and polymeric micelles are nanoparticles used to treat cancer and other disease conditions by acting as carriers for various drugs [4]. These nanoparticles offer the advantage of increased water solubility of drugs, targeted drug delivery, improved stability, better circulation time, and benefits in tumor imaging, ultimately making them suitable carriers in cancer therapy [3,4]. Nanoparticles have been around for over five decades. However, their use in cancer treatment has become more popular over the last three decades.
Liposomes, the first nanoparticle to be approved as a carrier in cancer therapy, were discovered about six decades ago [4,9]. Liposomes are spherical vesicles that comprise lipid concentric bilayers enclosing an aqueous core [10]. The lipid bilayer of liposomes resembles the bilayer of mammal cells, facilitating better interaction and cellular uptake [3]. Liposomes are classified based on their size and number of bilayers as either small or large unilamellar or multilamellar vesicles. [7] Some characteristics of liposomes that make them ideal candidates as nanocarriers are that: they are biodegradable, biocompatible, allow for the incorporation of both aqueous and lipid-soluble drugs, sustained drug action, and targeted drug delivery [11]. Doxil (liposomal-based Doxorubicin) was the first liposomal anticancer formulation approved by the Food and Drugs Authority (FDA) for treating AIDS-related Kaposi Sarcoma and ovarian cancer [12]. The introduction of this novel formulation generated a heightened interest in liposome research which subsequently led to the development and approval of other liposomal formulations. Such formulations include Daunoxome – Daunorubicin (indicated for AIDS-related Kaposi Sarcoma and Acute Myeloid Leukemia), Myocet-Doxorubicin (indicated for metastatic breast cancer), and Onivyde -Irinotecan (indicated for metastatic pancreatic cancer) [3].
Some liposomal formulations are undergoing clinical evaluation for cancer treatment. An example is EndoTAG-1 (liposomal Paclitaxel) for treating pancreatic cancer (the third deadliest cancer in the United States) [9,13]. Liposomes have been used in several studies as nanocarriers to determine the efficacy of novel and standard cancer drugs in various tumors [10]. Matsumoto et al. demonstrated the superior cytotoxic effects of a novel liposomal Gemcitabine formulation (FF-10832) in mouse xenograft tumor models over the unmodified drug in pancreatic cancer cells [14]. In that study, liposomal Gemcitabine significantly reduced tumor size in mice with Capan-1 and BxPC-3 pancreatic cancer tumors compared to Gemcitabine Hydrochloride [14]. Also, Xu et al. demonstrated the potential of pH-sensitive liposomes in overcoming Gemcitabine resistance in pancreatic cancer management [15]. In addition, Inkoom and colleagues also demonstrated the effectiveness of Gemcitabine stearate nanoparticle in suppressing tumors using patient-derived xenograft mouse models [16].
An approach to further increase the cytotoxicity of liposomes in tumors is by conjugating to large molecular weight compounds such as polyethylene glycol (PEG) [10,17]. The concept behind this approach is the Enhanced Permeability and Retention Effect (EPR), in which high–molecular weight compounds accumulate in tissues with high vascular permeability, such as cancer tissues [10]. This accumulation results in increased bioavailability, sustained drug action, and higher cytotoxic effects. Kim et al. conducted a study comparing the efficacy of free cromolyn to pegylated liposomal cromolyn(PEG-lipo-cro) in BXPC-3 tumor-bearing mice [18]. PEG-lipo-cro significantly inhibited tumor growth compared with free cromolyn (p < 0.01) due to an increase in the compound's half-life leading to higher cytotoxicity [18].
Many novel cancer drugs never make it to clinical use due to differences in efficacy and safety data between animal and human studies. Traditional cancer models or 2-dimensional (2D) models have the major shortcoming of the inability to mimic the actual tumors effectively. This has led to inconsistencies in in-vitro, in-vivo, and human studies data, subsequently accounting for the deficient number of cancer drugs that make it to clinical use. Organoids were introduced into cancer research to mimic patients' tumors better and increase the likelihood of more drugs moving from clinical trials to bedside treatments [19]. Cancer organoids are 3-dimensional (3D) models of cancer cells that mimic the morphological and histopathological features of patient tumors [20,21] Organoids have improved the understanding of the heterogeneous nature of tumors and also somewhat overcome the shortcomings of 2-dimensional (2D) cancer models [20]. For example, pancreatic cancer organoids have been used to demonstrate the different sensitivities to various chemotherapeutic agents (76 drugs), initially undocumented in 2D models, further substantiating the benefits of organoids in personalized therapy [22].
The shortcoming of standard chemotherapeutic agents has led to increasing research involving modified forms of these drugs. One common approach is conjugating long-chain hydrocarbons to traditional medicines leading to the formation of lipophilic prodrugs [23,24]. The conjugation confers properties such as increased membrane permeability, bioavailability, and extended duration of action, ultimately leading to higher cytotoxic effects [16]. The present study details the design of a liposomal formulation (LnP), cell viability studies with 5-FU analog previously synthesized (1,3 bistetrahydrifuran-2yl-5-FU (MFU)) [25] against Panc-1 and MiaPaCa-2 cancer cells using 2D and 3D models (spheroids and organoids) respectively, tumor efficacy studies using patient-derived xenograft (PDX) mouse model with ectopic tumors and evaluating the tissue biodistribution of Gd-Hex-LnP in vivo.
2. Results
2.1.1 Characterization of Zhubech
LnP was made with modification of previously documented liposome [26,27] using DPPC; MPPC; Cholesterol, and DSPE-PEG2000 at a molar ratio of 50:25:20:5. The mean particle size of the blank liposomal nanoparticle, LnP was 90.0 ± 0.65 nm, (mean ± SD) while the mean size of Zhubech was 124.9 ± 3.2 nm (Supplementary Figure S1 and S2). With our formulation technique, entrapment efficiency (EE) of MFU was 97.2 ± 2.1% and a final zeta potential value of -30.3 ± 12 (Supplementary Figure S3), as shown in Table 1.
2.1.2 In vitro formulation stability
There are many parameters used to assess in vitro stability, however in this study we evaluated hydrodynamic diameter, physical appearance and EE or drug content of MFU-loaded LnP at temperatures of 4 ± 2°C, 25 ± 2°C, and 40 ± 3°C for 1, 2, and 3 months [28]. At the end of the 30 days (batch 1), all the liposomal formulations stored at all temperatures had normal physical appearance (cream white, clear). At the end of 60 days (batch 2), all the formulations stored at 4 ± 2°C and 25 ± 2°C appeared cloudy and coagulated respectively while those stored at 40°C appeared cream white but clear. However, 90 days later (batch 3), formulations stored at 4 ± 2°C, appeared cloudy while those stored at 25°C appeared suspended, however the formulations stored at 40°C appeared clear (Figure 1 and Table 2).
The particle size distribution (hydrodynamic diameter) of all the formulations as a function of temperature were also evaluated at the end of 30, 60, and 90 days in three batches Table 2 (Supplementary Figures S4–S6). An increase in particle size was noted at higher temperature (40°C) in batches 2 and 3, while decrease in drug content more than 5% was observed in batches 2 and 3. This observation suggests the likelihood of leakage of content from the formulation at the end of 60 and 90day period. In addition, at temperatures 4°C and 25°C, we noticed a small decrease in the drug content in batches 2 and 3, suggesting a slight leakage (<1.2%) in the formulations at those temperatures (Table 2). Overall, the size distribution of zhubech formulation stored at all temperatures showed an insignificant decrease (<5%) in drug content at 4±1OC and 25±2OC, however; significant loss of drug (>10%??) was observed in batches 2 and 3 at 40±3OC.
2.1.3 In vitro drug release kinetics from Zhubech formulation
Figure 2 shows the cumulative in-vitro drug release of MFU from Zhubech for 24 h period at 37°C while maintaining sink condition. The release of free MFU was rapid and almost complete from the dialysis bag, with about 80% released just within 2h and about 90% released within the first 4h. The free MFU release continued until it reached 95% within the first 6h. In comparison to MFU release from zhubech, about 50% of MFU was released within the first 2 h followed by a gradual or slow release of additional 20% over a period of 6 h and reached steady state at time 8 h. This suggests that any free MFU placed in the dialysis bag would rapidly diffuse significantly within a short period. In addition, its release profile could be used to differentiate the release pattern of MFU from zhubech as long as sink condition was maintained and diffusion of MFU to the receiving medium depended on concentration gradient (Figure 2a). This implies that most of the MFU remained entrapped in zhubech under the study conditions (Figure 2a).
To determine the MFU diffusion mechanism, in vitro release kinetics of MFU from zhubech was modeled as shown in Figure 2b for zero-order kinetics, Figure 2c for first-order kinetics, Figure 2d for the Higuchi model. The best-fit release mechanism was determined based on the R2 values of the various kinetic models (Figure 2 b,c,d) [29]. The R2 value (0.97) of the Higuchi model (Figure 2d) was found to be the highest compared with the R2 value (0.84) of zero-order (Figure 2b) and R2 value (0.92) of first-order (Figure 2c). This suggests that MFU released from LnP followed Higuchi diffusion kinetics and implies that MFU release comes from a homogeneous delivery system (conjugation) and diffuses out of the delivery system over a period of time [29,30].
2.1.4 In vitro cellular uptake
Lipid-based nanoparticles can be efficiently internalized by cancer cells and hence are an attractive system to deliver drugs to cancer cells. Cancer cells are known to efficiently uptake nanoparticles among the different cell types and may act as a reservoir for nanotherapeutics for drug delivery [31,32]. To determine the ability of LnP to get into the cells to deliver MFU, Panc-1 cells were incubated with rhodamine (Rho-14)-entrapped liposomes for 12 h and 24 h. Figure 3a shows that Panc-1 cells internalized LnP in a time-dependent manner. A confocal microscope was used to visualize the uptake of Rh0-14 labeled liposomes. The images and video taken further demonstrated the orientation of the dye-loaded nanoparticles in a 3D style showing the location of the rhodamine-liposomal formulation in the cytoplasm (Figure 3b and Supplementary video S1). The accumulation of labeled liposomes in perinuclear vesicles suggests the accumulation of formulation in the endosomal/lysosomal compartment in a time-dependent manner.
2.2 Cytotoxic effect of Zhubech on MiaPaCa-2 and Panc-1 cell lines
Prior to conducting cytotoxicity comparing free MFU and zhubech, studies were conducted to compare the efficacy of free MFU compared to 5-FU. This prior study had shown superiority of MFU over 5-FU in 2D and 3D spheroids using MiaPaca-2 and Panc-1 cell lines (Figure 4).
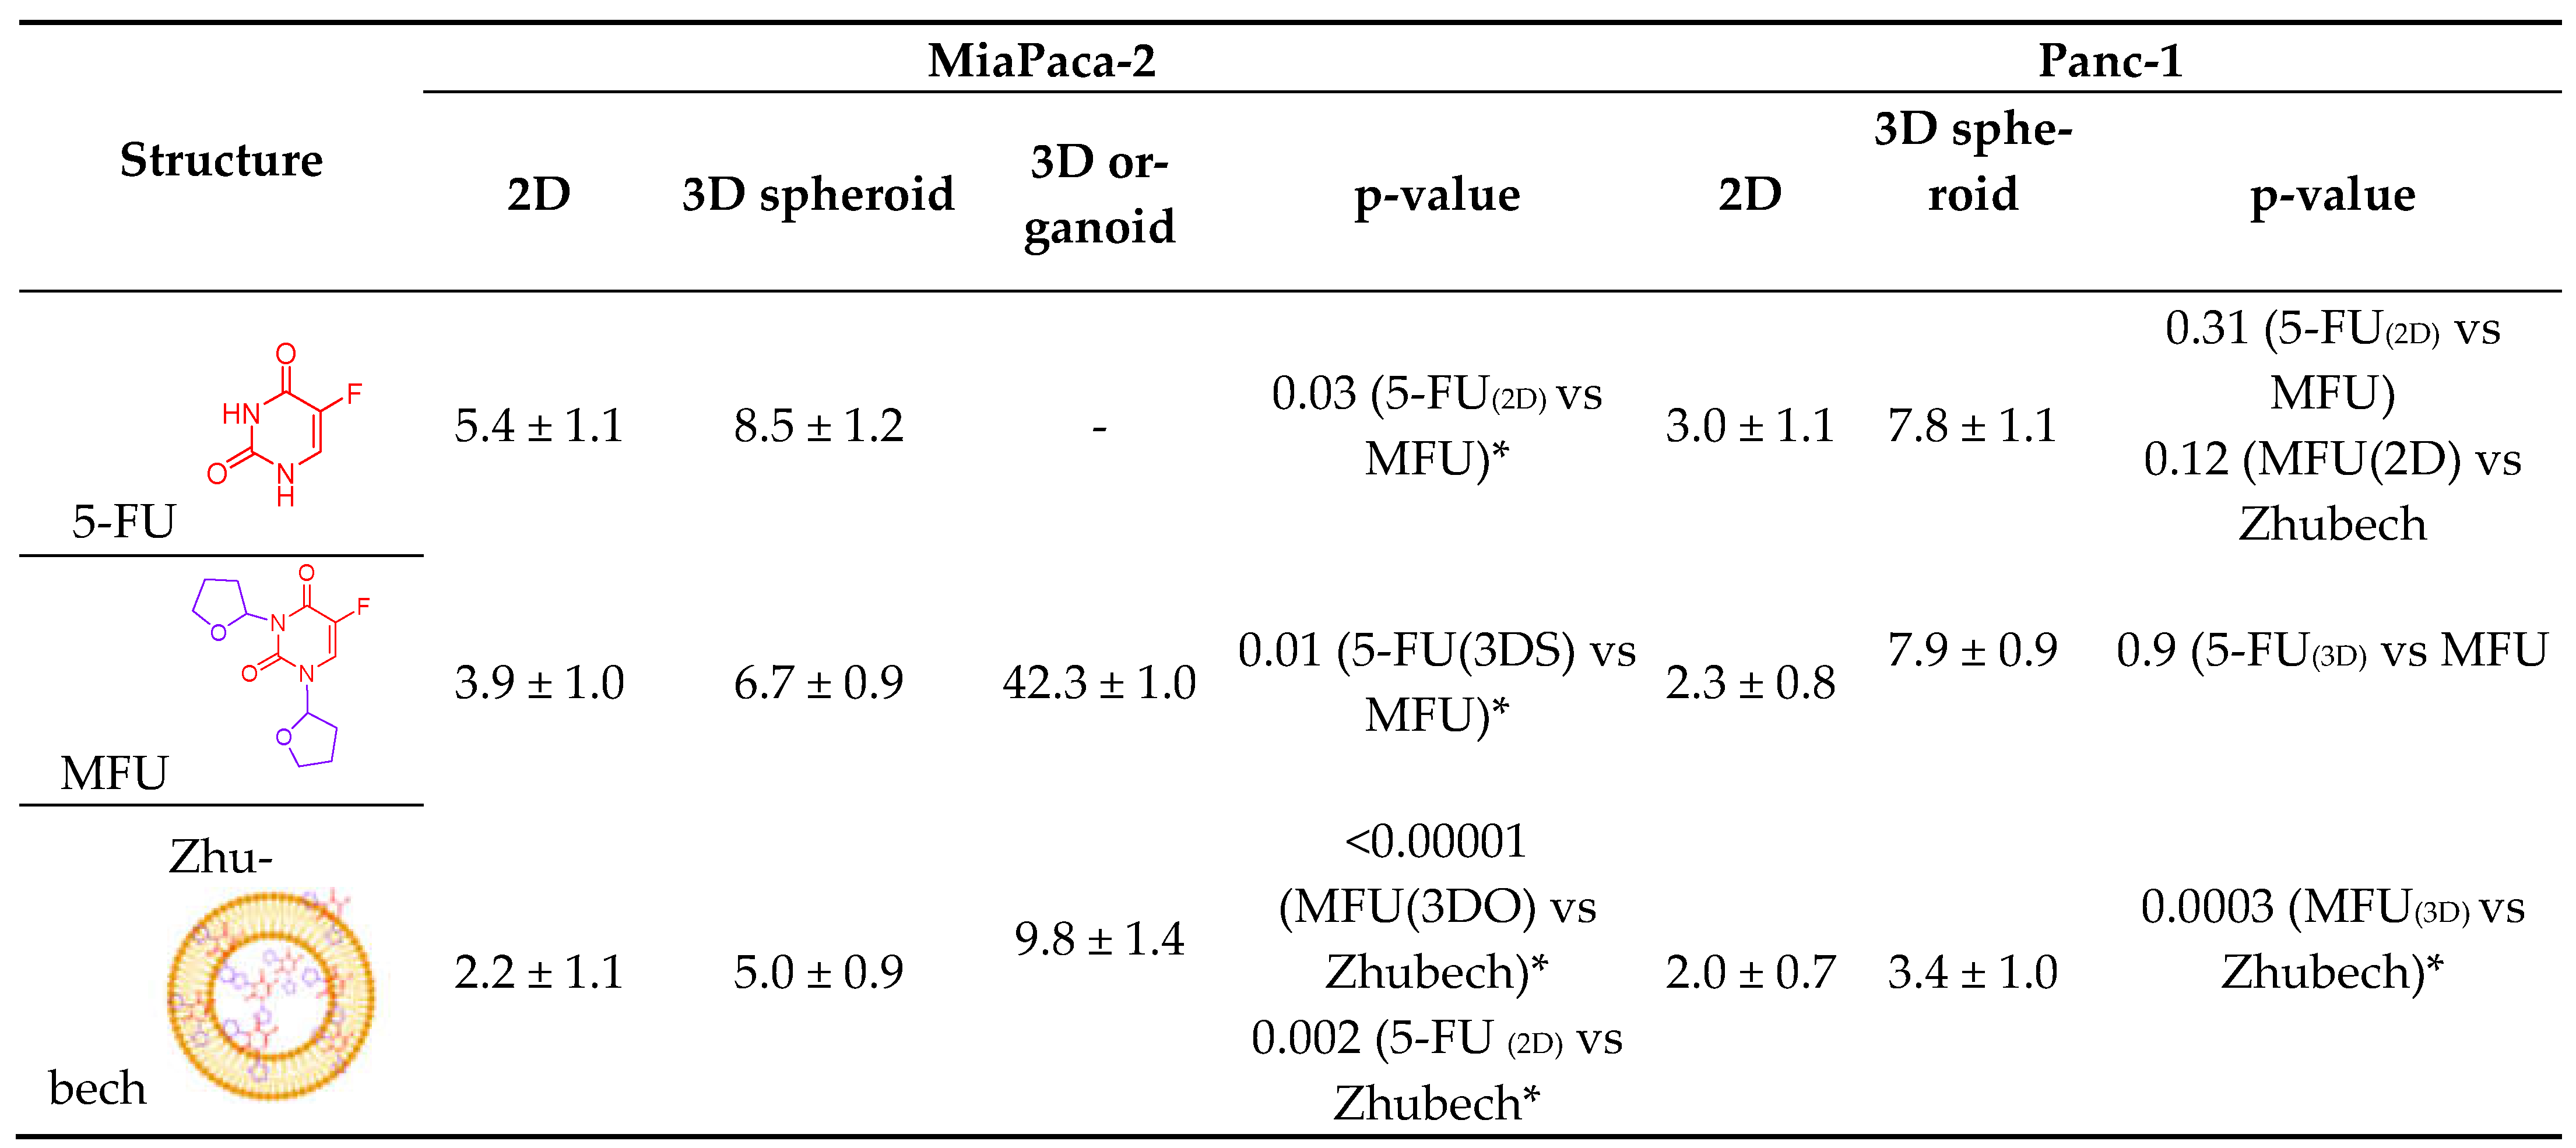
The cytotoxic activity of zhubech was compared to free MFU in MiaPaca-2 cells (2D, 3D spheroid and organoid) and Panc-1 cells via 2D and 3D (spheroid) culture models, using the alamar blue assay. As shown in Figure 5, zhubech demonstrated significant cytotoxic activity against 2D Panc-1 culture with an IC50 value of 2.0 ± 1.1 μM, compared to free MFU (IC50 value of 3.4 ± 1.1 μM) after 48 h treatment (Figure 5a-b). While free MFU and zhubech treated 3D Panc-1 cultures recorded IC50 values of 3.4 ± 1.0 μM and 6.8 ± 1.1 μM, respectively (Figure 5a-b). We noted that IC50 values were expectedly higher in the treated organoids of MiaPaCa-2 culture. Zhubech-treated organoids of MiaPaCa-2 culture showed four-fold lower IC50 values (IC50 = 9.8 ± 1.4 μM) compared with free MFU-treated organoid MiaPaCa-2 culture (IC50 = 42.3 ± 1.0 μM) (Figure 5c). Table 3 below compares the IC50 values of Panc-1 and MiaPaCa-2 cells using 2D and 3D spheroids and organoids.
2.3 Tumor efficacy studies
Mice bearing pancreatic PDX tumor were treated over a period of thirty-six days. In the zhubech treated group, a significant tumor growth suppression was observed compared with the control and 5-FU treated groups (Figure 6a). Tumor suppression was noticed up to two weeks after which 5-FU group noticed a geometric increase while the zhubech-treated group noticed decrease in tumor volume for the rest of study period. The mean tumor volume of the control group was extremely large, the mean tumor volume of zhubech-treated group (108 ± 13.5 mm3) exhibited significantly lower tumor growth compared with the mean tumor volume of 5-FU-treated group (1,107 ± 116.2 mm3) especially by week 5. Figure 6b shows change in the weight of the mice over the study period which is a representation of the toxicity of the drugs/compound on the animal. There is an insignificant change in weight of mice between during the study period which is less than 10% recommended to be due to toxicity of a drug [33].
2.4 Tissue biodistribution of Gd-Hex-LnP
Figure 7 shows the amount of Gd-Hex-LnP deposited in various tissues at different time points. We used Gd-Hex-LnP in place of MFU to enable easy quantification using the ICPMS. There was overall a significant amount of Gd-Hex-LnP deposited per gram of wet tissue in the liver, kidney, lungs, and pancreas. In the heart and brain, the amount of Gd-Hex-LnP deposited at each time point is insignificant compared to the other tissues such as lung, kidney, pancreas, and liver. In the kidney and lungs, there was a significant deposition noted at 4 hours and 1 hour respectively. The liver and the pancreas each noted significant increase at two time points with the liver occurring at 0.5 h and 1 h while the pancreas had a significant increase at 1h and 4h (Figure 7).
3. Discussion
Pharmaceutical nanoparticle delivery systems are ideal for transporting anti-cancer drugs and reducing unwanted distribution and side effects to healthy cells. These nanoparticles protect anti-cancer drugs from first-pass metabolism and enzymatic degradation. In addition, these delivery systems generally improve the drug's enhancement properties, prolong systemic circulation, and increase drug entrapment and loading capacity [3,34]. Furthermore, for cancer, nanoparticles as anticancer drug delivery systems are generally designed to improve, for example, high drug loading capacity, prolonged systemic circulation, the ability of the nanoparticle to accumulate specifically in the required pathological zone, and the nanoparticle’s ability to resist degradation in high environmental temperatures [35].
To resolve some of the issues mentioned above, we synthesized and characterized MFU from our previous studies [25], loaded it to LnP (together called zhubech) with the surface modified with/ DSPE-PEG_2000 to enhance stability in systemic circulation and improve the therapeutic efficacy of MFU. One of the unique features of zhubech is that it is very stable at room temperatures; hence does not need any particular temperatures for storage [36]. Also, LnP was prepared with DPPC; MPPC; Cholesterol, and DSPE-PEG_2000, and particle size <200nm has been reported to have a considerable decrease in the leakage of entrapped lipophilic content like MFU due to conjugation into the lipids [37]. The release characteristics of MFU from zhubech follows the Higuchi release model suggesting that the formulation zhubech behaves like a matrix system with release characterized by diffusion [38]. This assumes that the initial drug concentration in the matrix is much higher than drug solubility, with drug diffusion taking place only in one dimension, drug particle much smaller than system thickness and matrix swelling and dissolution are negligible. Further assumptions are that drug diffusivity is constant with perfect sink condition in place [39].
In in vitro cell viability study, we assessed the effects of MFU and 5-FU on MiaPaca-2 and Panc-1 cell lines in 2D and 3D spheroid models which demonstrated superiority of MFU compared to the parent drug 5-FU in cytotoxicity. We also demonstrated the effects of MFU and zhubech on Panc-1 (2D and 3D spheroid models) and MiaPaca-2 (3D organoid model) cell lines. Cells were exposed to the blank liposome (LnP), MFU, or zhubech for 48 hr, a sufficient period to assess inhibition. LnP was well tolerated by Panc-1 cells in 2D and 3D spheroid cell cultures, and MiaPaca-2 3D organoids. MFU, and zhubech showed a dose-dependent inhibitory effect with zhubech demonstrating a more significant reduction in cell viability in all culture models. This suggests a higher cellular uptake of liposomal form leading to a greater internalization of MFU.
In vivo anti-tumor activity of zhubech after the 15th day exhibited a significant inhibition of tumor growth compared with 5-FU. There was a significant decrease in tumor volume for zhubech-treated mice (108 ± 13.5 mm3) compared to 5FU-treated mice (1107 ± 116.2 mm3) at the end of the studies (P-value<0.001). This extraordinary tumor efficacy of Zhubech could be explained by three major factors: i) absence of free NH2-group on free MFU which rendered the dihydropyrimidnne dehydrogenase (DPD) enzyme ineffective to metabolize zhubech. This event most likely allowed for prolong circulation, increased bioavailability and improved therapeutic efficacy of MFU and ii) conjugation of THF to 5-FU may have imparted some degree of lipophilicity to MFU which may have facilitated its delivery to cancer cells and iii) probably loading MFU in zhubech might have increased the half-life, increase permeability to tumor site and improved stability in circulation.
Nanocarriers are very useful in drug delivery because of their ability to alter the pharmacokinetics and biodistribution. For the biodistribution study, Gd-Hex delivered to a mouse by LnP (Gd-Hex-LnP) was significantly higher in the liver, lungs, and pancreas after 1h and 4 h, respectively. The mechanism of delivery by LnP could be attributed to higher enhanced permeability and retention effect where nanoparticle size carriers are distributed in tissues with rich blood supply and retained there at high concentrations for a long period. In contrast, free drugs are not retained but return to circulation by diffusion [40,41,42]. In addition, environmental temperature did not influence the stability of zhubech (Table 2), possibly improving delivery of Gd-Hex to tissues [43,44].
4. Materials and Methods
4.1. Materials
1,2-distearoyl-sn-glycero-3-phosphoethanolamine-N-[amino(polyethyleneglycol)-2000] (DSPE-PEG2000), Dipalmitoylphosphatidylcholine (DPPC), 1-Myristoyl-2-palmitoyl-sn-glycero-3-phosphocholine (MPPC), Cholesterol (chol), lipids were all purchased from Avanti Polar Lipids, Inc. (Alabaster, AL, USA). All the chemicals, including 5-FU and reagents, were purchased from Sigma-Aldrich (St. Louis, Missouri, USA). Pca cell lines (Panc-1 and MiaPaca-2) were obtained from American Type Culture Collection (ATCC). All other chemicals used were of an analytical reagent grade.
4.2 Preparation of stealth LnP
LnP was prepared by thin film hydration technique [45]. Briefly, MPPC, DPPC, Chol, and DSPE_PEG -2000 was dissolved in 2 mL of chloroform and mixed at a molar ratio of (25:50:20:5) in a round bottom flask. The chloroform was removed using a rotary evaporator at 75° C for 30 minutes until a thin, dry film was formed. Samples were then placed under a high vacuum where the lipid sample formed a "swollen" film that was held under vacuum for 2-3 hours to remove residual chloroform. These dried, swollen lipid films were hydrated with the PBS in which the drug is dissolved and held at 65-70 °C (slightly above the transition temperature) and homogenized using a NanoDeBEE at a pressure of 30000 PSI for 20 cycles—sonicated for 5-10 minutes. Then the formulation was extruded 10 times through stacked polycarbonate filters with a pore size of 100 nm (Nuclepore Track-Etch membrane) at 65-70 °C using an extruder (Avanti®, Birmingham, AL).
4.3 Physical characterization:
4.3.1 Particle size, PDI, and zeta potential determination
The particle size (hydrodynamic diameter) of liposomes was determined by dynamic light scattering using a particle sizer (NICOMP ™ 380 ZLS, Santa Barbara, CA). All measurements were performed at room temperature. Before each measurement, samples were diluted with deionized water at a ratio of 1:10. Polydispersity index (PDI) and Zeta potential were measured using the same instrument [46]. Zhubech formulations were divided into 3 batches (corresponding to duration of study) and kept at different temperatures for modified real time and accelerated stability studies at 1,2 and 3 months measuring hydrodynamic diameter, MFU content in zhubech and physical appearance [28,47].
4.3.2: HPLC analysis
The Waters HPLC alliance e2695 system with a PDA detector was used to analyze MFU at a wavelength of 270 nm. The mobile phase was water (pH adjusted to 2.5 with phosphoric acid) and methanol at a ratio of 90:10 (v/v). The mobile phase flow rate was maintained at 1.0 ml/min. MFU retention time was 19.6 minutes. The injection volume was 50 μl. Data acquisition and analysis were performed using empower software (Waters Corporation, MA). The calibration curve (peak area vs. concentration) was generated over the range of 1–100 μg/ml and was found to be linear with a correlation coefficient of 0.9998. Before analysis, the reverse phase column was equilibrated with the mobile phase made up of water and methanol in a ratio of 90:10, and the pH was adjusted to 2.5. Isocratic elution was performed throughout the entire analysis, including internal standards.
4.3.3 Entrapment Efficiency:
The supernatant obtained after centrifugation of Zhubech was analyzed for unentrapped MFU by high-performance liquid chromatography (HPLC, Waters, USA) using a C18 column. The mobile phase consisted of H20 at a pH of 2.5 and methanol at v/v of 90:10. The injection volume was 50 μL, and the flow rate was 1 mL/min. The EE% was calculated according to the equation:
4.3.4. Release Studies:
The release of MFU from zhubech was studied by a dialysis method. The dialysis bags were soaked in distilled water at room temperature for 12 h to activate the dialysis bag and remove the preservative, and then rinsed thoroughly in distilled water.
In vitro release of the MFU from zhubech was performed by dialysis in a dialysis bag (14,000 MW cut off; Sigma-Aldrich) containing 150 ml of phosphate-buffered saline and methanol at a ratio of 3:1 v/v (PBS; pH 5.6). Two bags were prepared containing the Zhubech and the control containing free MFU. Equivalent amounts of Zhubech and free MFU concentrations were added to a dialysis bag. Both bags were prepared and tested together with the liposomal dispersions. The bags were suspended in a suitable solvent flask so that the part of the dialysis bag containing the formulation was immersed in a buffer solution (PBS/methanol). The flask was held on a magnetic stirrer (Matrex), and stirring was maintained at 200 rpm and a] temperature of 37°C. Samples were collected at 0.5, 1, 2, 4, 6, 8, 12, and 24 h while maintaining sink conditions throughout [48].
4.3.5: Release models:
The release kinetics of 5-FU from the heat-sensitive liposomes was investigated to predict the possible mechanism of release using mathematical models. The release order was determined using zero order (Eq. 1a) and the first-order kinetic model, as shown below.
C = C0 + K0t
LogC = LogC0 + K1t/2.303
where C0 is the initial amount of drug, C is the % cumulative MFU released (zero order) or first order (Eq. 1b) at time “t,” and K0 is the zero-order release constant, and K1 is the first order release constant.
Korsmeyer-Peppas (Eq. 2) and Higuchi (Eq. 3) models were used to determine whether the release mechanism follows the polymeric system (power law) or Fickian diffusion, respectively, as shown below:
Ct/C∞ = Ktn
C = C0 + KHt1/2
Where Ct/C∞ is the fraction of drug release at time, t, K is the rate constant, and n is the release exponent. While for the Higuchi model, C is the % cumulative MFU release at the time, and t and KH is the Higuchi constant.
4.4 Cell viability Studies:
These in-vitro viability studies were performed on pancreatic and colorectal cancer cell lines. MiaPaca-2 was incubated in DMEM with high glucose, and L-glutamine and Panc-1 were incubated in McCoy 5A modified media, both supplemented with 10% fetal bovine serum (FBS) and 1% penicillin-streptomycin (PenStrep) and 2.5% 4-(2-hydroxyethyl)-1-piperazineethanesulfonic acid (HEPES). Cells were plated in a T75 flask for culture and later seeded into 96 well plates.
4.4.1. 2D Cell Viability Studies:
MiaPaca-2 and Panc-1 cells were seeded in 96-well plates at a density of 5000 cells/well and incubated in 5% CO2 and a temperature of 37°C. A stock solution of Zhubech and free LnP were prepared in molar concentrations and serially diluted with the growth medium to prepare different concentrations: i.e., 80, 40, 20, 10, and 5μM. All cells were treated with 200 μL of each drug concentration in quintuplicate and incubated for 48h. At the end of the treatment, 20 μL of 0.15% resazurin sodium salt (Alamar blue®) was added and incubated for four hours under optimal conditions (5% CO2, 37 °C). Fluorometric analysis was determined at an excitation wavelength of 560/580 nm and an emission wavelength of 590/610 nm, and the percentage of viable cells per concentration was calculated.
4.4.2. 3D Cell Viability Studies:
MiaPaca-2 and Panc-1 cells were seeded in a special Nunclon Sphera® 96-well plate at a density of 5000 cells/ L, and then 100 μL of fresh complete media was added to obtain 200 μL in each well. Then the plates were centrifuged at 1500 rpm and incubated at 5% CO2 and a temperature of 37°C for 24 hours to allow spheroid formation. During treatment, 100 μl of the supernatant was replaced with the drug in the growth medium prepared as described in 2D viability studies. At the end of the treatment, 50 μl of 0.15% resazurin sodium salt (Alamar blue®) was added to each well and carefully dispersed by pipetting and incubated for 4 h. The drug was then added to the growth medium. Fluorometric analysis was measured as described above.
4.4.3. Organoid Cell Viability:
The MiaPaca-2 cell pellets were suspended in collagen and Matrigel (transglutaminase) mixture (20:1), as previously documented [49]. Then transfer the cells to a 48 well plates and incubate at 5% CO2, 37°C for 40 min. The Matrigel (transglutaminase) helps solidify collagen through cross-linking to form organoids. Then 10 μL of the mixture was seeded into the 48 well plates and rested in the incubator for 40 min to solidify. Once the mixture was solidified, it was given to the supplements as media for 24 hours. Allowed the organoid to develop over 48 hours, followed by treatment with Zhubech and free MFU as control over 7 days. Organoids were digested with 0.25% trypsin over 40 minutes, and an MTT assay was used to quantify cell viability.
4.5 Cellular uptake studies:
Panc-1 cancer cells were grown in 6-well plates (with coverslips) at a cell density of 2 × 10³ for 24 h at 37 °C. The cells were then treated with Rhodamine-labeled LnP in growth media. After 12 and 24 h, Rhodmaine-LnP was removed, and the cells were gently washed twice with PBS. Next, 5 μg/ml of DAPI dye was added for nuclear staining; the cells were fixed using 4% paraformaldehyde, then mounted and imaged using Leica SP2 Multiphoton system [26].
4.6 Animal study
Ethics statements: Eight-week-old mice were obtained from the Jackson Laboratory (Bar Harbor, ME). The mice were housed in a virus-free environment with indoor light and temperature controlled and provided access to food and water ad libitum for one week before treatment started. All procedures with mice were in strict accordance with the National Institutes of Health Guide for the care and Use of Laboratory Animals and the Animal Research Reporting of In Vivo Experiments (ARRIVE) guidelines. This was approved by the Florida A&M University Animal Care and Use Committee.
Tumor transplantation: Tumor tissue was surgically implanted in the left flank of immune-compromised mice as previously described [50]. A viable portion of resected tissue was isolated immediately following resection of primary pancreatic cancer specimens to minimize critical ischemia time. The pancreatic cancer tissue was then implanted subcutaneously into 8-week-old mice (n=15). Xenografts were allowed to grow to a maximum of 1.5 cm before implantation to the flank of the new host.
Tumor efficacy studies: In this study, mice bearing surgically implanted tumors were randomized into groups as control, 5-FU and zhubech (n = 5/group) once tumor volumes became palpable and reached a range of 70 –100 mm3. Baseline tumor volumes were established, and dosing initiation began with intravenous administration of 40 mg/k 5-FU and zhubech (with 5-FU equivalent doses) twice weekly for 6 weeks. Tumor measurements were performed every other day. Tumor volumes were measured using calipers and calculated using the following equation: V = (L*(W)2)/2, where V is volume (mm3), W(width) is the smaller of two perpendicular tumor axes and the value L (length) is the larger of two perpendicular axes. Tumor growth volumes were calculated for each treatment group.
Euthanization: Carbon dioxide (CO2) flow to the chamber was adjusted to 3 liters per minute for 2 to 3 minutes and observed each mouse for lack of respiration and faded eye color. The CO2 flow was maintained for a minimum of 1 minute after respiration was ceased and followed by decapitation with scissors. The tumors were then incised and prepared for immunohistochemistry studies.
4.6.1. Synthesis of Gadolinium Hexanoate (Gd-Hex) LnP
A mixture of GdCl3 (2.88 g, 10.9 mmol), Hexanoic acid (3.8 g, 32.7 mmol), ammonium hydroxide (4 mL) in H2O (20 mL) was heated at 80˚C for 2h (Figure a). The white solid was collected, and washed with acetone (20 mL), Et2O (20 mL). The solid was dried under a vacuum for 24h. The same technique for zhubech formulation was used to prepare Gd-Hex-LnP formulation and particle size measured (Supplementary Figure 7).
4.6.2. Tissue biodistribution
Nude mice (n=18) were allowed to acclimatize for one week, followed by studies. Mice were grouped into six groups (n=3 each) corresponding to each time point (10, 30, 60, 240, 480- and 720-minutes). Mice received 0.05mmol/kg Gd-Hex-LnP intravenously through the tail vein and sacrificed at various time points and tissues obtained and weighed.
After weighing, the organ samples were pre-treated with aqua regia (HNO3: HCl) in a 3:1 v/v ratio and allowed to stand overnight in a fume hood; the pre-treated samples were further diluted with 2% nitric acid (70%, v/v) in distilled water, centrifuged at 4,000 rpm for 10 min and finally filtered to remove debris [27]. The final sample solutions were analyzed by inductively coupled plasma mass spectrometry (ICP-MS) to determine the quantity of Gd in each sample solution.
5. Conclusions
We have successfully formulated liposomal nanoparticles, LnP, exhibiting enhanced release of MFU under physiologic conditions. The Zhubech nanoparticles exhibited a more potent anti-cancer effect compared to MFU against Panc-1 and MiaPaca-2 cancer cells. In addition, zhubech has shown superiority to 5-FU in vivo efficacy on tumor growth. These findings provide strong evidence in support of a possible therapeutic application of zhubech as a drug delivery system for MFU, which can overcome some of the limitations of MFU such as poor retention and short half-life.
Supplementary Materials
TThe following supporting information can be downloaded at the website of this paper posted on Preprints.org, Figure S1: Particle size and PDI of blank liposomal formulation (LnP); Figure S2: Particle size and PDI of MFU entrapped liposomal formulation (zhubech); Figure S3: Zeta Potential of MFU-loaded liposomal formulation (zhubech); Figure S4-S6: Particle size and PDI of MFU entrapped liposomal formulation (zhubech) measured at 1, 3 and 6 months at room temperature; Video S1: Demonstration of the colocalization of Rho-14 loaded LnP using confocal microscope.
Author Contributions
Conceptualization, NBN, XYZ and EA.; methodology, NBN, EA and SR; formal analysis, ED and RB; data curation, NBN, RB and EF; writing—original draft preparation, NBN, RB and EF; writing—review and editing, AI and JO; supervision, BH and EA; project administration, SR and EA; funding acquisition, EA. All authors have read and agreed to the published version of the manuscript.
Funding
This research was supported by the National Cancer Institute (NCI) of the National Institutes of Health (NIH) under grant number U54CA233396, National Institute of Health (NIH) National Institute on Minority Health and Health Disparities (NIMHD) grant number U54MD007582 and Title III of Florida A&M University. The content is solely the responsibility of the authors and does not necessarily represent the official views of the National Institutes of Health.
Institutional Review Board Statement
All procedures with mice were in strict accordance with the National Institutes of Health Guide for the care and Use of Laboratory Animals and the Animal Research Reporting of In Vivo Experiments (ARRIVE) guidelines. This was approved by the Florida A&M University Animal Care and Use Committee, approval protocol number 018-17 and approval date November 2nd, 2018.
Informed Consent Statement
Not applicable here.
Data Availability Statement
Not applicable here.
Acknowledgments
We thank Dr. Anil Kumar Kalvala for training on the use of confocal microscope for imaging and Dr. Mandip Sachdeva’s research lab for giving access to use the lab’s HPLC.
Conflicts of Interest
The authors declare no conflict of interest.
References
- Murphy, S.L.; Kochanek, K.D.; Xu, J.; Arias, E. Mortality in the United States, 2020. (2021).
- Akbarzadeh, A.; Rezaei-Sadabady, R.; Davaran, S.; Joo, S.W.; Zarghami, N.; Hanifehpour, Y.; Samiei, M.; Kouhi, M.; Nejati-Koshki, K. Liposome: classification, preparation, and applications. Nanoscale Res Lett 2013, 8, 102. [Google Scholar] [CrossRef] [PubMed]
- Bulbake, U.; Doppalapudi, S.; Kommineni, N.; Khan, W. Liposomal Formulations in Clinical Use: An Updated Review. Pharmaceutics 2017, 9. [Google Scholar] [CrossRef] [PubMed]
- Cheng, Z.; Li, M.; Dey, R.; Chen, Y. Nanomaterials for cancer therapy: Current progress and perspectives. Journal of Hematology & Oncology 2021, 14, 1–27. [Google Scholar]
- Driehuis, E.; van Hoeck, A.; Moore, K.; Kolders, S.; Francies, H.E.; Gulersonmez, M.C.; Stigter, E.C.; Burgering, B.; Geurts, V.; Gracanin, A. Pancreatic cancer organoids recapitulate disease and allow personalized drug screening. Proceedings of the National Academy of Sciences 2019, 116, 26580–26590. [Google Scholar] [CrossRef] [PubMed]
- Ndemazie, N.B.; Inkoom, A.; Morfaw, E.F.; Smith, T.; Aghimien, M.; Ebesoh, D.; Agyare, E. Multi-disciplinary Approach for Drug and Gene Delivery Systems to the Brain. AAPS PharmSciTech 2021, 23, 11. [Google Scholar] [CrossRef]
- Drost, J.; Clevers, H. Organoids in cancer research. Nat Rev Cancer 2018, 18, 407–418. [Google Scholar] [CrossRef] [PubMed]
- Dupertuis, Y.M.; Boulens, N.; Angibaud, E.; Briod, A.-S.; Viglione, A.; Allémann, E.; Delie, F.; Pichard, C. Antitumor Effect of 5-Fluorouracil-Loaded Liposomes Containing n-3 Polyunsaturated Fatty Acids in Two Different Colorectal Cancer Cell Lines. Aaps Pharmscitech 2021, 22, 1–10. [Google Scholar] [CrossRef] [PubMed]
- Gracia, B. Nanomedicine review: clinical developments in liposomal applications. Cancer Nanotechnology. Springer Vienna: 2019.
- Immordino, M.L.; Brusa, P.; Rocco, F.; Arpicco, S.; Ceruti, M.; Cattel, L. Preparation, characterization, cytotoxicity and pharmacokinetics of liposomes containing lipophilic gemcitabine prodrugs. Journal of Controlled Release 2004, 100, 331–346. [Google Scholar] [CrossRef]
- Sainaga Jyothi, V.G.S.; Bulusu, R.; Venkata Krishna Rao, B.; Pranothi, M.; Banda, S.; Kumar Bolla, P.; Kommineni, N. Stability characterization for pharmaceutical liposome product development with focus on regulatory considerations: An update. International Journal of Pharmaceutics 2022, 624, 122022. [Google Scholar] [CrossRef]
- Jin, C.; Wang, K.; Oppong-Gyebi, A.; Hu, J. Application of nanotechnology in cancer diagnosis and therapy-a mini-review. International Journal of Medical Sciences 2020, 17, 2964. [Google Scholar] [CrossRef]
- Bulbake, U.; Kommineni, N.; Khan, W. Liposomal Drug Delivery System and Its Clinically Available Products. In Handbook of Materials for Nanomedicine, Jenny Stanford Publishing: 2020; pp. 121–172.
- Kim, C.-E.; Lim, S.-K.; Kim, J.-S. In vivo antitumor effect of cromolyn in PEGylated liposomes for pancreatic cancer. Journal of controlled release 2012, 157, 190–195. [Google Scholar] [CrossRef] [PubMed]
- Kopeckova, K.; Eckschlager, T.; Sirc, J.; Hobzova, R.; Plch, J.; Hrabeta, J.; Michalek, J. Nanodrugs used in cancer therapy. Biomedical Papers of the Medical Faculty of Palacky University in Olomouc 2019, 163. [Google Scholar] [CrossRef] [PubMed]
- Inkoom, A.; Ndemazie, N.; Affram, K.; Smith, T.; Zhu, X.; Underwood, P.; Krishnan, S.; Ofori, E.; Han, B.; Trevino, J. Enhancing efficacy of gemcitabine in pancreatic patient-derived xenograft mouse models. International journal of pharmaceutics: X 2020, 2, 100056. [Google Scholar] [CrossRef] [PubMed]
- Kommineni, N.; Paul, D.; Saka, R.; Khan, W.; Nanjappan, S. Stealth Liposomal Chemotherapeutic Agent for Triple Negative Breast Cancer with Improved Pharmacokinetics. Nanotheranostics 2022, 6, 424–435. [Google Scholar] [CrossRef] [PubMed]
- Li, Z.; Tan, S.; Li, S.; Shen, Q.; Wang, K. Cancer drug delivery in the nano era: An overview and perspectives. Oncology reports 2017, 38, 611–624. [Google Scholar] [CrossRef] [PubMed]
- Matsumoto, T.; Komori, T.; Yoshino, Y.; Ioroi, T.; Kitahashi, T.; Kitahara, H.; Ono, K.; Higuchi, T.; Sakabe, M.; Kori, H. A Liposomal Gemcitabine, FF-10832, Improves Plasma Stability, Tumor Targeting, and Antitumor Efficacy of Gemcitabine in Pancreatic Cancer Xenograft Models. Pharmaceutical research 2021, 38, 1093–1106. [Google Scholar] [CrossRef] [PubMed]
- Moreira, L.; Bakir, B.; Chatterji, P.; Dantes, Z.; Reichert, M.; Rustgi, A.K. Pancreas 3D organoids: current and future aspects as a research platform for personalized medicine in pancreatic cancer. Cellular and molecular gastroenterology and hepatology 2018, 5, 289–298. [Google Scholar] [CrossRef] [PubMed]
- Pili, B.; Reddy, L.H.; Bourgaux, C.; Lepêtre-Mouelhi, S.; Desmaële, D.; Couvreur, P. Liposomal squalenoyl-gemcitabine: formulation, characterization and anticancer activity evaluation. Nanoscale 2010, 2, 1521–1526. [Google Scholar] [CrossRef]
- Senapati, S.; Mahanta, A.K.; Kumar, S.; Maiti, P. Controlled drug delivery vehicles for cancer treatment and their performance. Signal transduction and targeted therapy 2018, 3, 1–19. [Google Scholar] [CrossRef]
- Xu, H.; Paxton, J.W.; Wu, Z. Development of long-circulating pH-sensitive liposomes to circumvent gemcitabine resistance in pancreatic cancer cells. Pharmaceutical research 2016, 33, 1628–1637. [Google Scholar] [CrossRef]
- Yang, F.; Jin, C.; Jiang, Y.; Li, J.; Di, Y.; Ni, Q.; Fu, D. Liposome based delivery systems in pancreatic cancer treatment: from bench to bedside. Cancer treatment reviews 2011, 37, 633–642. [Google Scholar] [CrossRef] [PubMed]
- Ndemazie, N.B.; Inkoom, A.; Ebesoh, D.; Bulusu, R.; Frimpong, E.; Trevino, J.; Han, B.; Zhu, X.; Agyare, E. Synthesis, characterization, and in vitro anticancer evaluation of 1, 3-bistetrahydrofuran-2yl-5-FU as a potential agent for pancreatic cancer. 2022.
- Udofot, O.; Affram, K.; Israel, B.; Agyare, E. Cytotoxicity of 5-fluorouracil-loaded pH-sensitive liposomal nanoparticles in colorectal cancer cell lines. Integr Cancer Sci Ther 2015, 2, 245–252. [Google Scholar] [CrossRef]
- Udofot, O.; Affram, K.; Smith, T.; Tshabe, B.; Krishnan, S.; Sachdeva, M.; Agyare, E. Pharmacokinetic, biodistribution and therapeutic efficacy of 5-fluorouracil-loaded pH-sensitive PEGylated liposomal nanoparticles in HCT-116 tumor bearing mouse. J Nat Sci 2016, 2. [Google Scholar]
- Zietsman, S.; Kilian, G.; Worthington, M.; Stubbs, C. Formulation Development and Stability Studies of Aqueous Metronidazole Benzoate Suspensions Containing Various Suspending Agents. Drug Development and Industrial Pharmacy 2007, 33, 191–197. [Google Scholar] [CrossRef] [PubMed]
- Siepmann, J.; Siepmann, F. Mathematical modeling of drug dissolution. International journal of pharmaceutics 2013, 453, 12–24. [Google Scholar] [CrossRef] [PubMed]
- Siepmann, J.; Peppas, N.A. Higuchi equation: Derivation, applications, use and misuse. International journal of pharmaceutics 2011, 418, 6–12. [Google Scholar] [CrossRef] [PubMed]
- Yuan, H.; Miao, J.; Du, Y.-Z.; You, J.; Hu, F.-Q.; Zeng, S. Cellular uptake of solid lipid nanoparticles and cytotoxicity of encapsulated paclitaxel in A549 cancer cells. International journal of pharmaceutics 2008, 348, 137–145. [Google Scholar] [CrossRef] [PubMed]
- Brocato, T.A.; Coker, E.N.; Durfee, P.N.; Lin, Y.-S.; Townson, J.; Wyckoff, E.F.; Cristini, V.; Brinker, C.J.; Wang, Z. Understanding the connection between nanoparticle uptake and cancer treatment efficacy using mathematical modeling. Scientific reports 2018, 8, 1–8. [Google Scholar] [CrossRef]
- Prijovich, Z.; Chen, B.; Leu, Y.; Chern, J.; Roffler, S. Anti-tumour activity and toxicity of the new prodrug9-aminocamptothecin glucuronide (9ACG) in mice. British journal of cancer 2002, 86, 1634–1638. [Google Scholar] [CrossRef]
- Zahednezhad, F.; Zakeri-Milani, P.; Shahbazi Mojarrad, J.; Valizadeh, H. The latest advances of cisplatin liposomal formulations: essentials for preparation and analysis. Expert Opinion on Drug Delivery 2020, 17, 523–541. [Google Scholar] [CrossRef]
- Sułkowski, W.; Pentak, D.; Nowak, K.; Sułkowska, A. The influence of temperature, cholesterol content and pH on liposome stability. Journal of molecular structure 2005, 744, 737–747. [Google Scholar] [CrossRef]
- Maritim, S.; Boulas, P.; Lin, Y. Comprehensive analysis of liposome formulation parameters and their influence on encapsulation, stability and drug release in glibenclamide liposomes. International journal of pharmaceutics 2021, 592, 120051. [Google Scholar] [CrossRef] [PubMed]
- Schwendener, R.A.; Schott, H. Liposome formulations of hydrophobic drugs. In Liposomes, Springer: 2010; pp. 129–138.
- Bruschi, M.L. Mathematical models of drug release. Woodhead Publishing Cambridge, UK: 2015; Vol. 63, pp 63-86.
- Dash, S.; Murthy, P.N.; Nath, L.; Chowdhury, P. Kinetic modeling on drug release from controlled drug delivery systems. Acta Pol Pharm 2010, 67, 217–223. [Google Scholar] [PubMed]
- Dadashzadeh, S.; Mirahmadi, N.; Babaei, M.; Vali, A. Peritoneal retention of liposomes: Effects of lipid composition, PEG coating and liposome charge. Journal of controlled release 2010, 148, 177–186. [Google Scholar] [CrossRef] [PubMed]
- Dong, Y.-D.; Tchung, E.; Nowell, C.; Kaga, S.; Leong, N.; Mehta, D.; Kaminskas, L.M.; Boyd, B.J. Microfluidic preparation of drug-loaded PEGylated liposomes, and the impact of liposome size on tumour retention and penetration. Journal of liposome research 2019, 29, 1–9. [Google Scholar] [CrossRef] [PubMed]
- Krishna, R.; Webb, M.S.; Onge, G.S.; Mayer, L.D. Liposomal and nonliposomal drug pharmacokinetics after administration of liposome-encapsulated vincristine and their contribution to drug tissue distribution properties. Journal of Pharmacology and Experimental Therapeutics 2001, 298, 1206–1212. [Google Scholar] [PubMed]
- Song, G.; Wu, H.; Yoshino, K.; Zamboni, W.C. Factors affecting the pharmacokinetics and pharmacodynamics of liposomal drugs. Journal of liposome research 2012, 22, 177–192. [Google Scholar] [CrossRef] [PubMed]
- DiTizio, V.; Karlgard, C.; Lilge, L.; Khoury, A.E.; Mittelman, M.W.; DiCosmo, F. Localized drug delivery using crosslinked gelatin gels containing liposomes: Factors influencing liposome stability and drug release. Journal of Biomedical Materials Research: An Official Journal of The Society for Biomaterials, The Japanese Society for Biomaterials, and The Australian Society for Biomaterials and the Korean Society for Biomaterials 2000, 51, 96–106. [Google Scholar] [CrossRef]
- Zhang, H. Thin-film hydration followed by extrusion method for liposome preparation. In Liposomes, Springer: 2017; pp. 17–22.
- Monteiro, L.O.; Malachias, A.n.; Pound-Lana, G.; Magalhães-Paniago, R.r.; Mosqueira, V.C.; Oliveira, M.n.C.; de Barros, A.L.s.B.; Leite, E.A. Paclitaxel-loaded pH-sensitive liposome: New insights on structural and physicochemical characterization. Langmuir 2018, 34, 5728–5737. [Google Scholar] [CrossRef]
- Parhi, R.; Padilam, S. In vitro permeation and stability studies on developed drug-in-adhesive transdermal patch of simvastatin. Bulletin of Faculty of Pharmacy, Cairo University 2018, 56, 26–33. [Google Scholar] [CrossRef]
- Briuglia, M.-L.; Rotella, C.; McFarlane, A.; Lamprou, D.A. Influence of cholesterol on liposome stability and on in vitro drug release. Drug delivery and translational research 2015, 5, 231–242. [Google Scholar] [CrossRef] [PubMed]
- Han, B. Screening miRNA for Functional Significance by 3D Cell Culture System. In MicroRNA Protocols, Springer: 2018; pp. 193–201.
- Delitto, D.; Pham, K.; Vlada, A.C.; Sarosi, G.A.; Thomas, R.M.; Behrns, K.E.; Liu, C.; Hughes, S.J.; Wallet, S.M.; Trevino, J.G. Patient-derived xenograft models for pancreatic adenocarcinoma demonstrate retention of tumor morphology through incorporation of murine stromal elements. Am J Pathol 2015, 185, 1297–1303. [Google Scholar] [CrossRef] [PubMed]
Figure 1.
Physical appearance of Zhubech over time. (a) powdered appearance of MFU after synthesis, (b) MFU dissolved in distilled water to form a solution, (c) bluish, clear appearance after formulating Zhubech, (d) cream white, clear appearance of batch1 formulation at all temperatures, (e) cloudy appearance of batches 2 and 3 stored at 4 degrees, and (f) white coagulated appearance of batches 2 and 3 stored at 40 degrees.
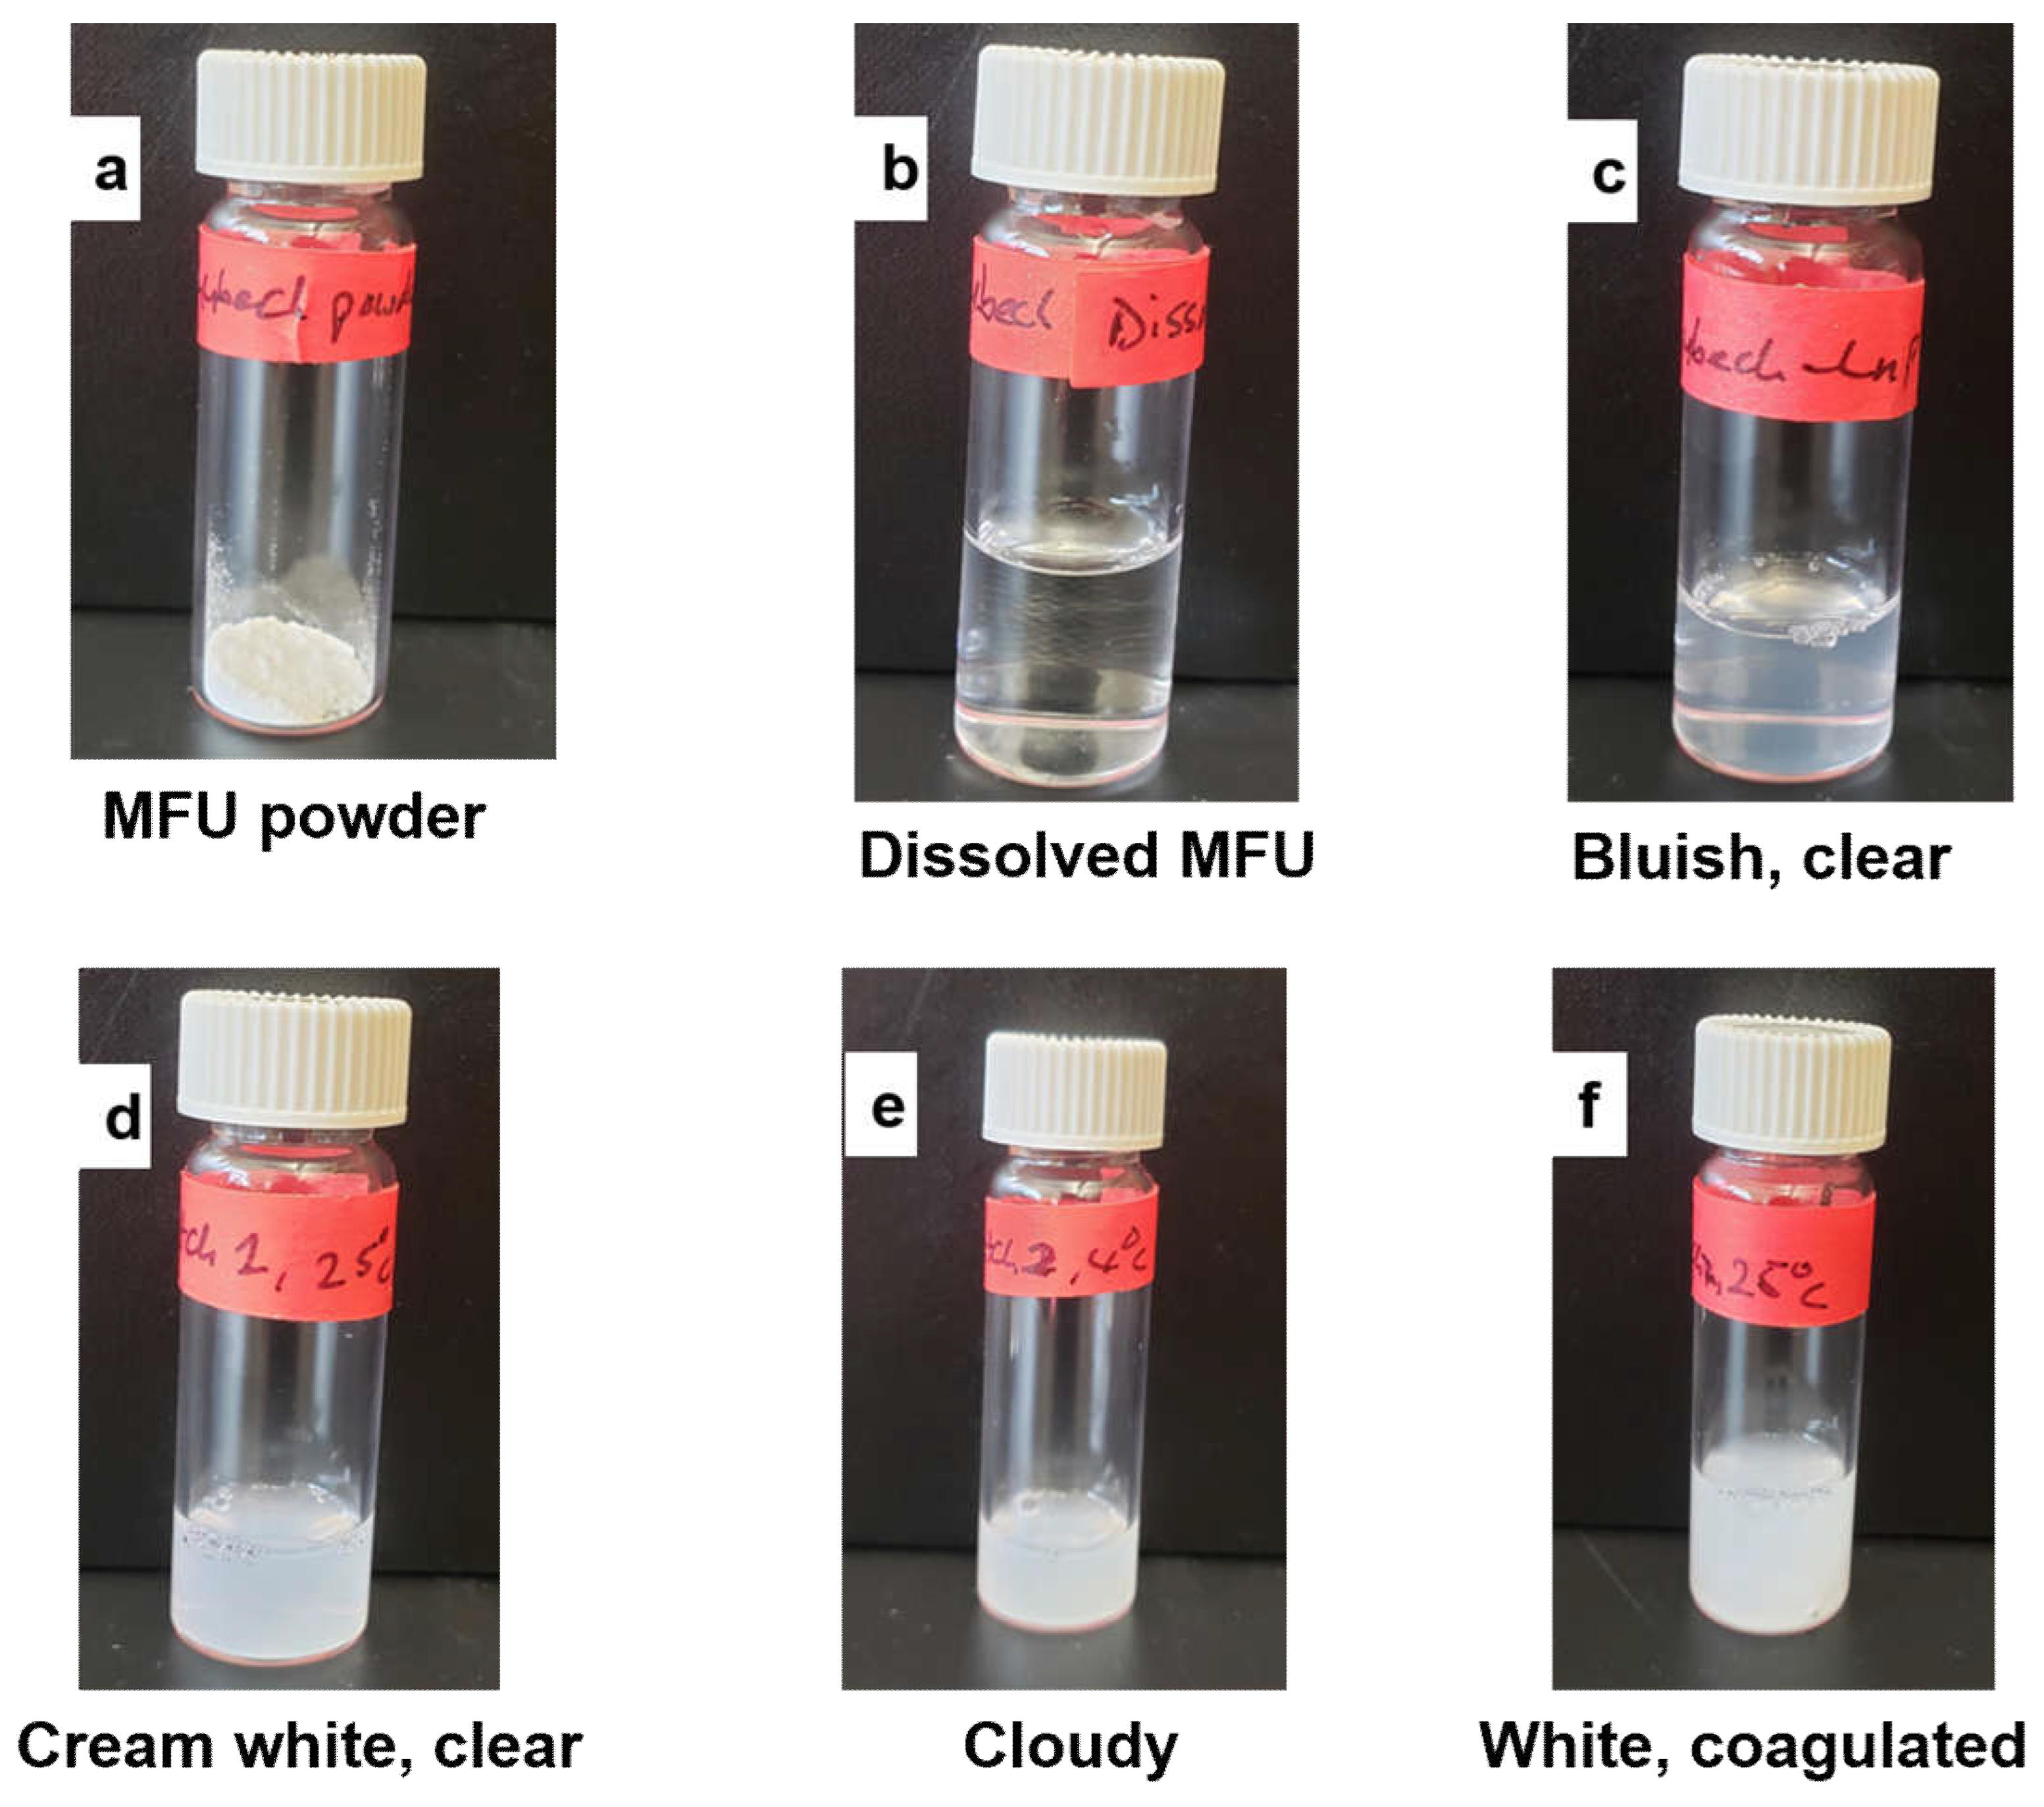
Figure 2.
In vitro release kinetics of Zhubech. (a) In vitro cumulative release of MFU from zhubech at 24h, in which free MFU was the control. (b) Release profile of MFU exhibiting zero-order kinetics, the release followed a non-linear pattern with R2=0.84. (c) Release profile of MFU showing first-order kinetics; the release followed an inverse linear pattern with R2=0.92. (d) Release profile of MFU exhibiting Higushi release model, the release shows a linear pattern with R2=0.97.
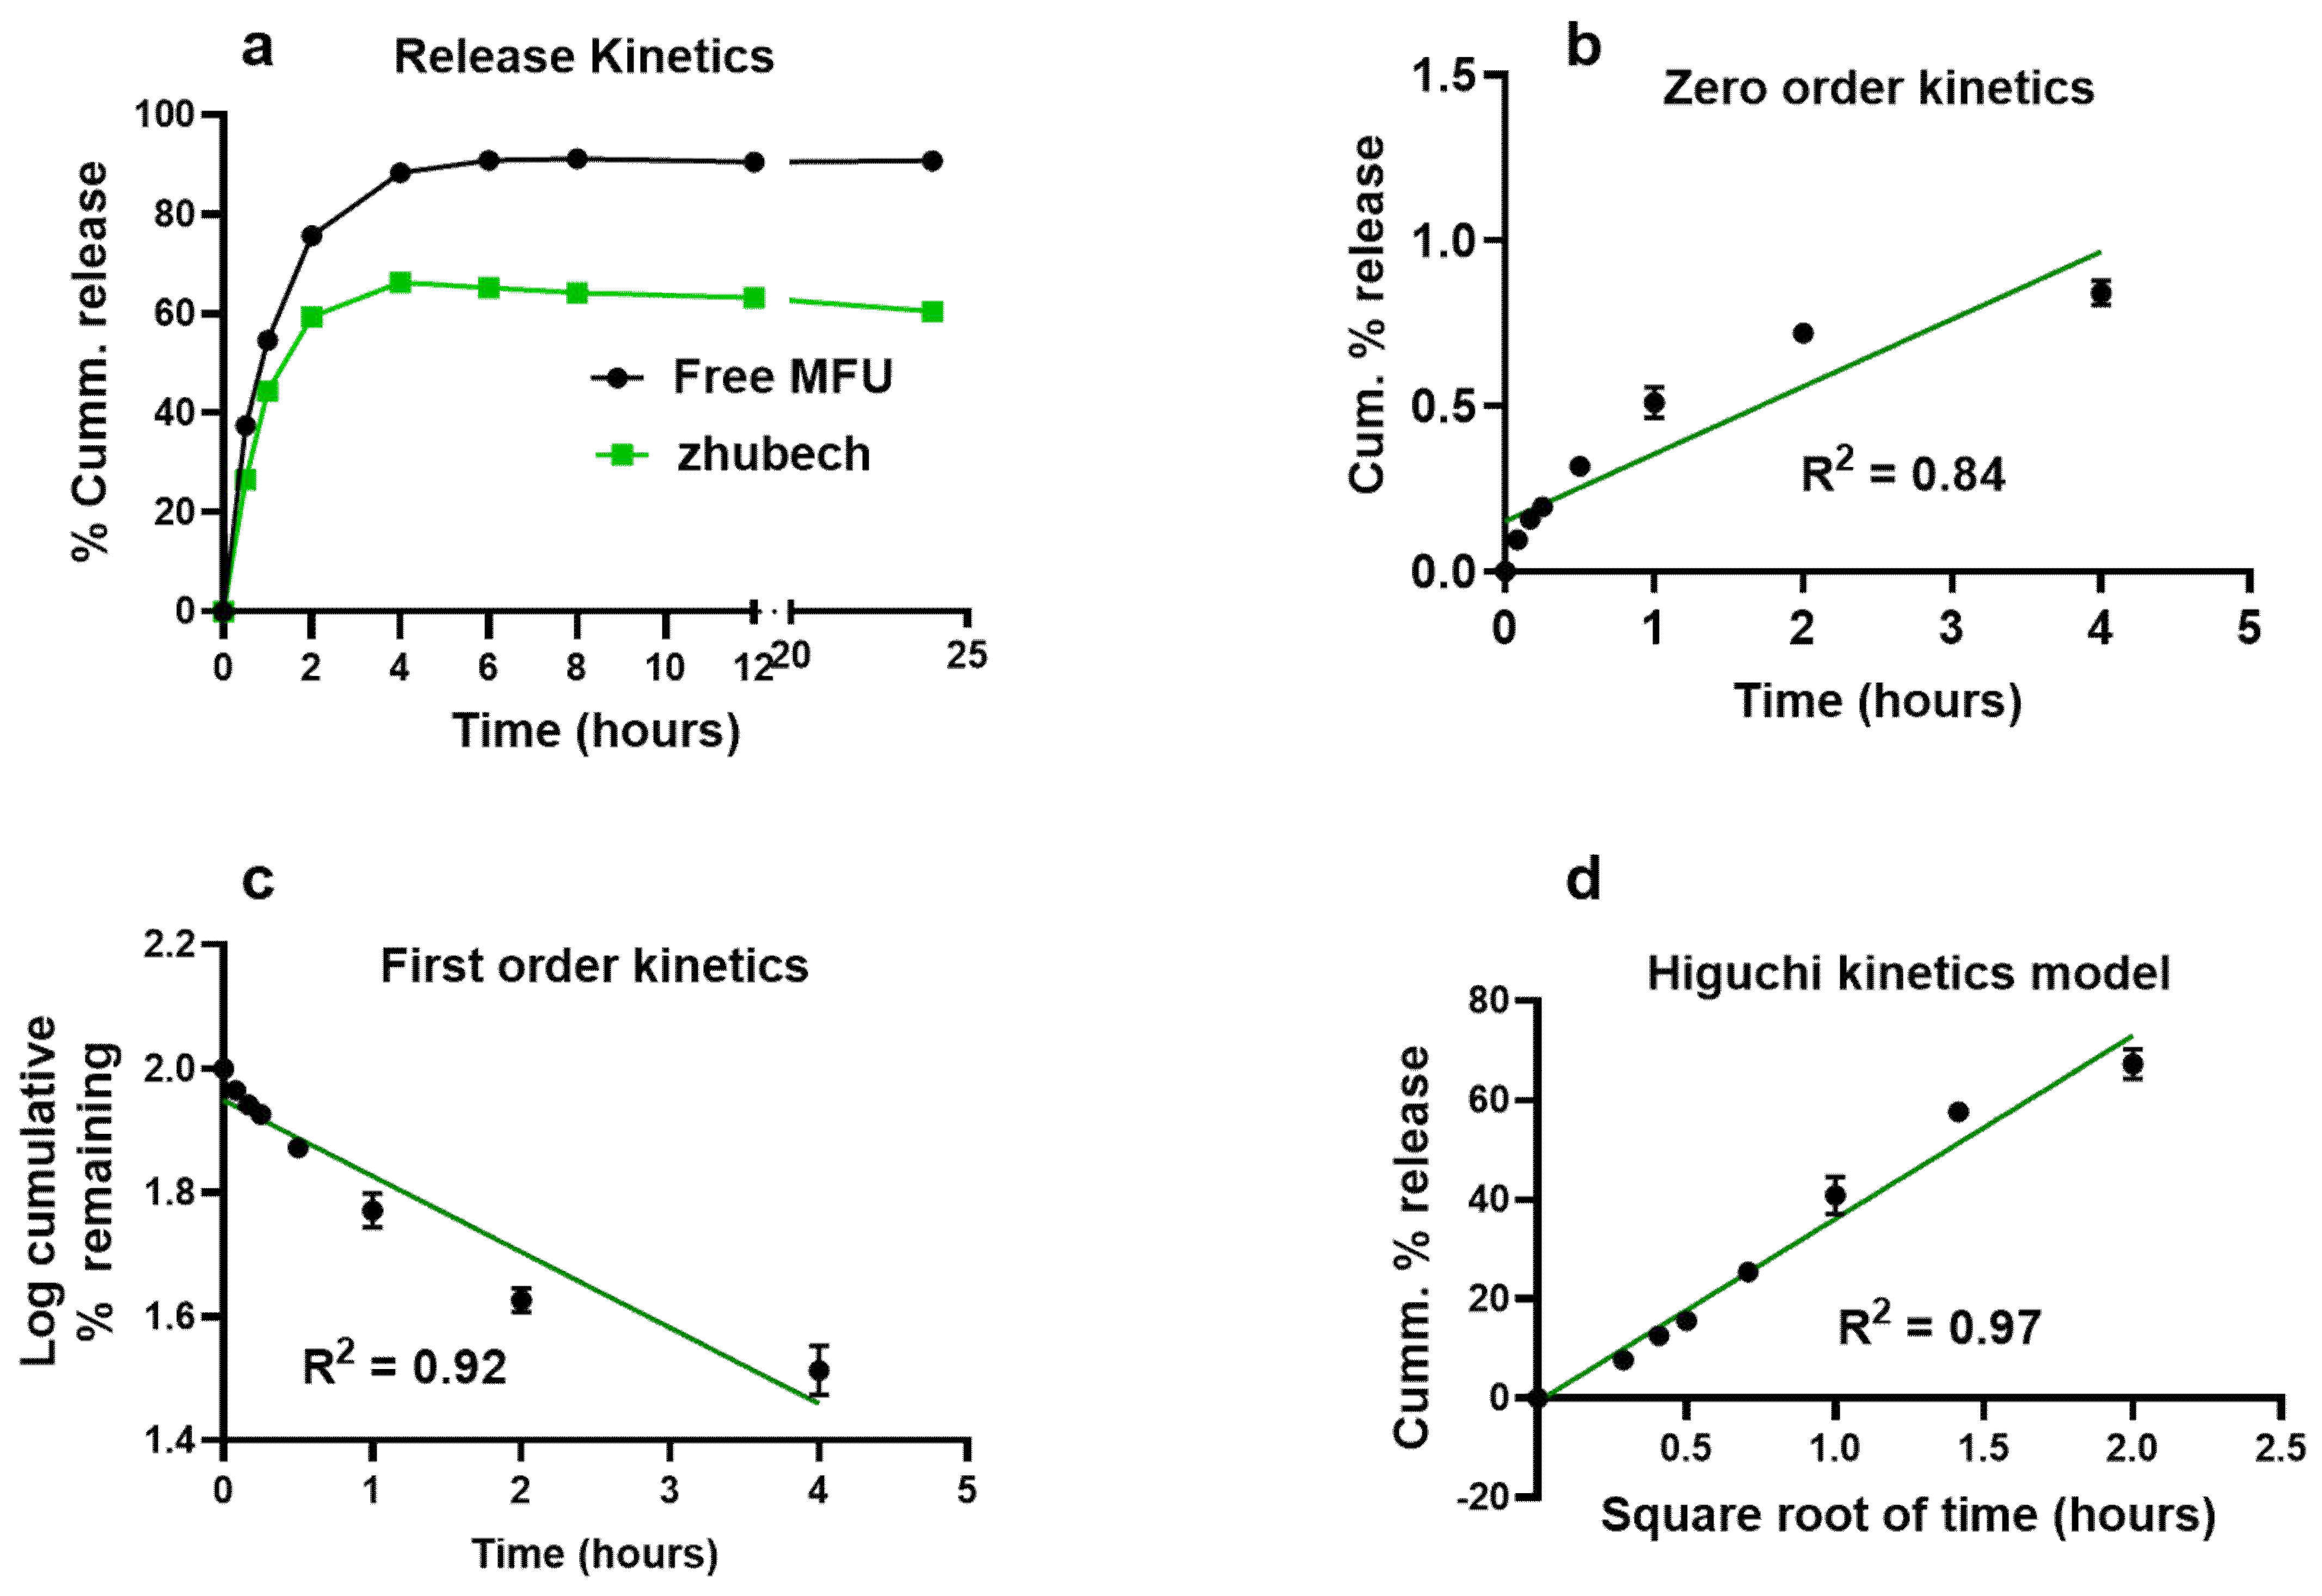
Figure 3.
Cellular uptake of LnP. (a) cellular uptake of Rh0-14-loaded LnP in Panc-1 cells over 12h and 24h with DAPI used as a nuclear stain. (b) 3D view of the colocalization of LnP within the cytoplasm of the cells after 12 h of incubation with Rh0-14-loaded LnP.
Figure 3.
Cellular uptake of LnP. (a) cellular uptake of Rh0-14-loaded LnP in Panc-1 cells over 12h and 24h with DAPI used as a nuclear stain. (b) 3D view of the colocalization of LnP within the cytoplasm of the cells after 12 h of incubation with Rh0-14-loaded LnP.
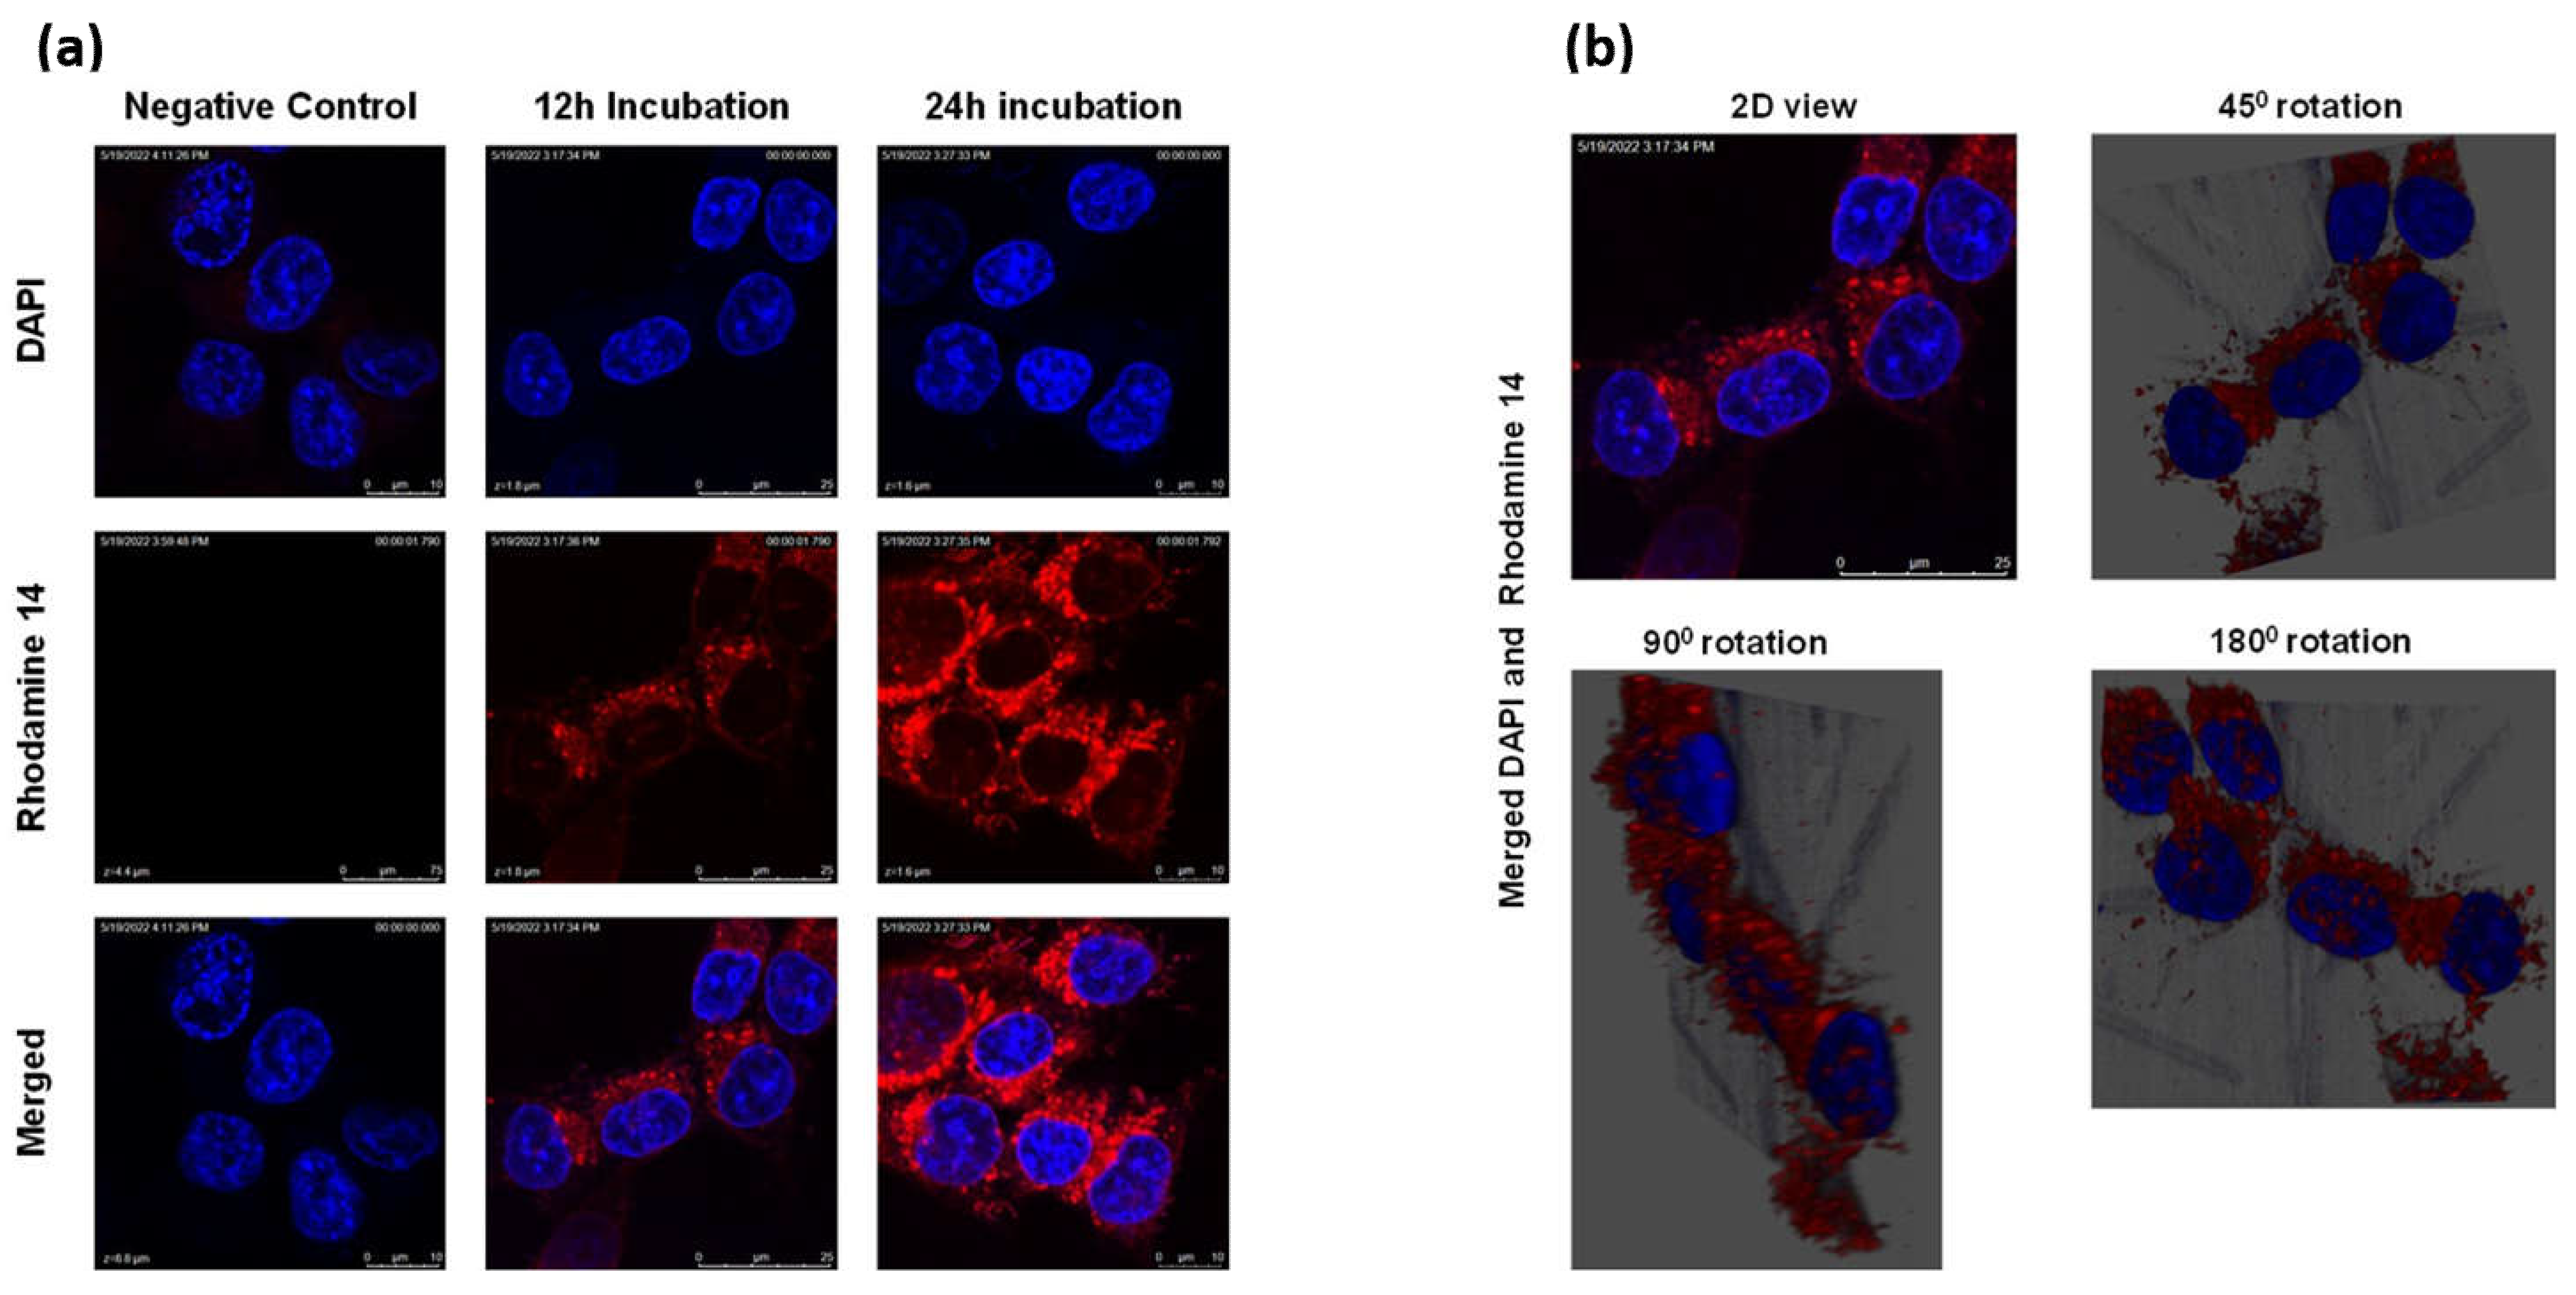
Figure 4.
In vitro studies comparing the efficiency of 5-FU and free MFU. a) 2D culture of MiaPaca-2 cells, b) 2D culture of Panc-1 cells, c) 3D culture of Miapaca-2 cells and d) 3D culture of Panc-1 cells.
Figure 4.
In vitro studies comparing the efficiency of 5-FU and free MFU. a) 2D culture of MiaPaca-2 cells, b) 2D culture of Panc-1 cells, c) 3D culture of Miapaca-2 cells and d) 3D culture of Panc-1 cells.
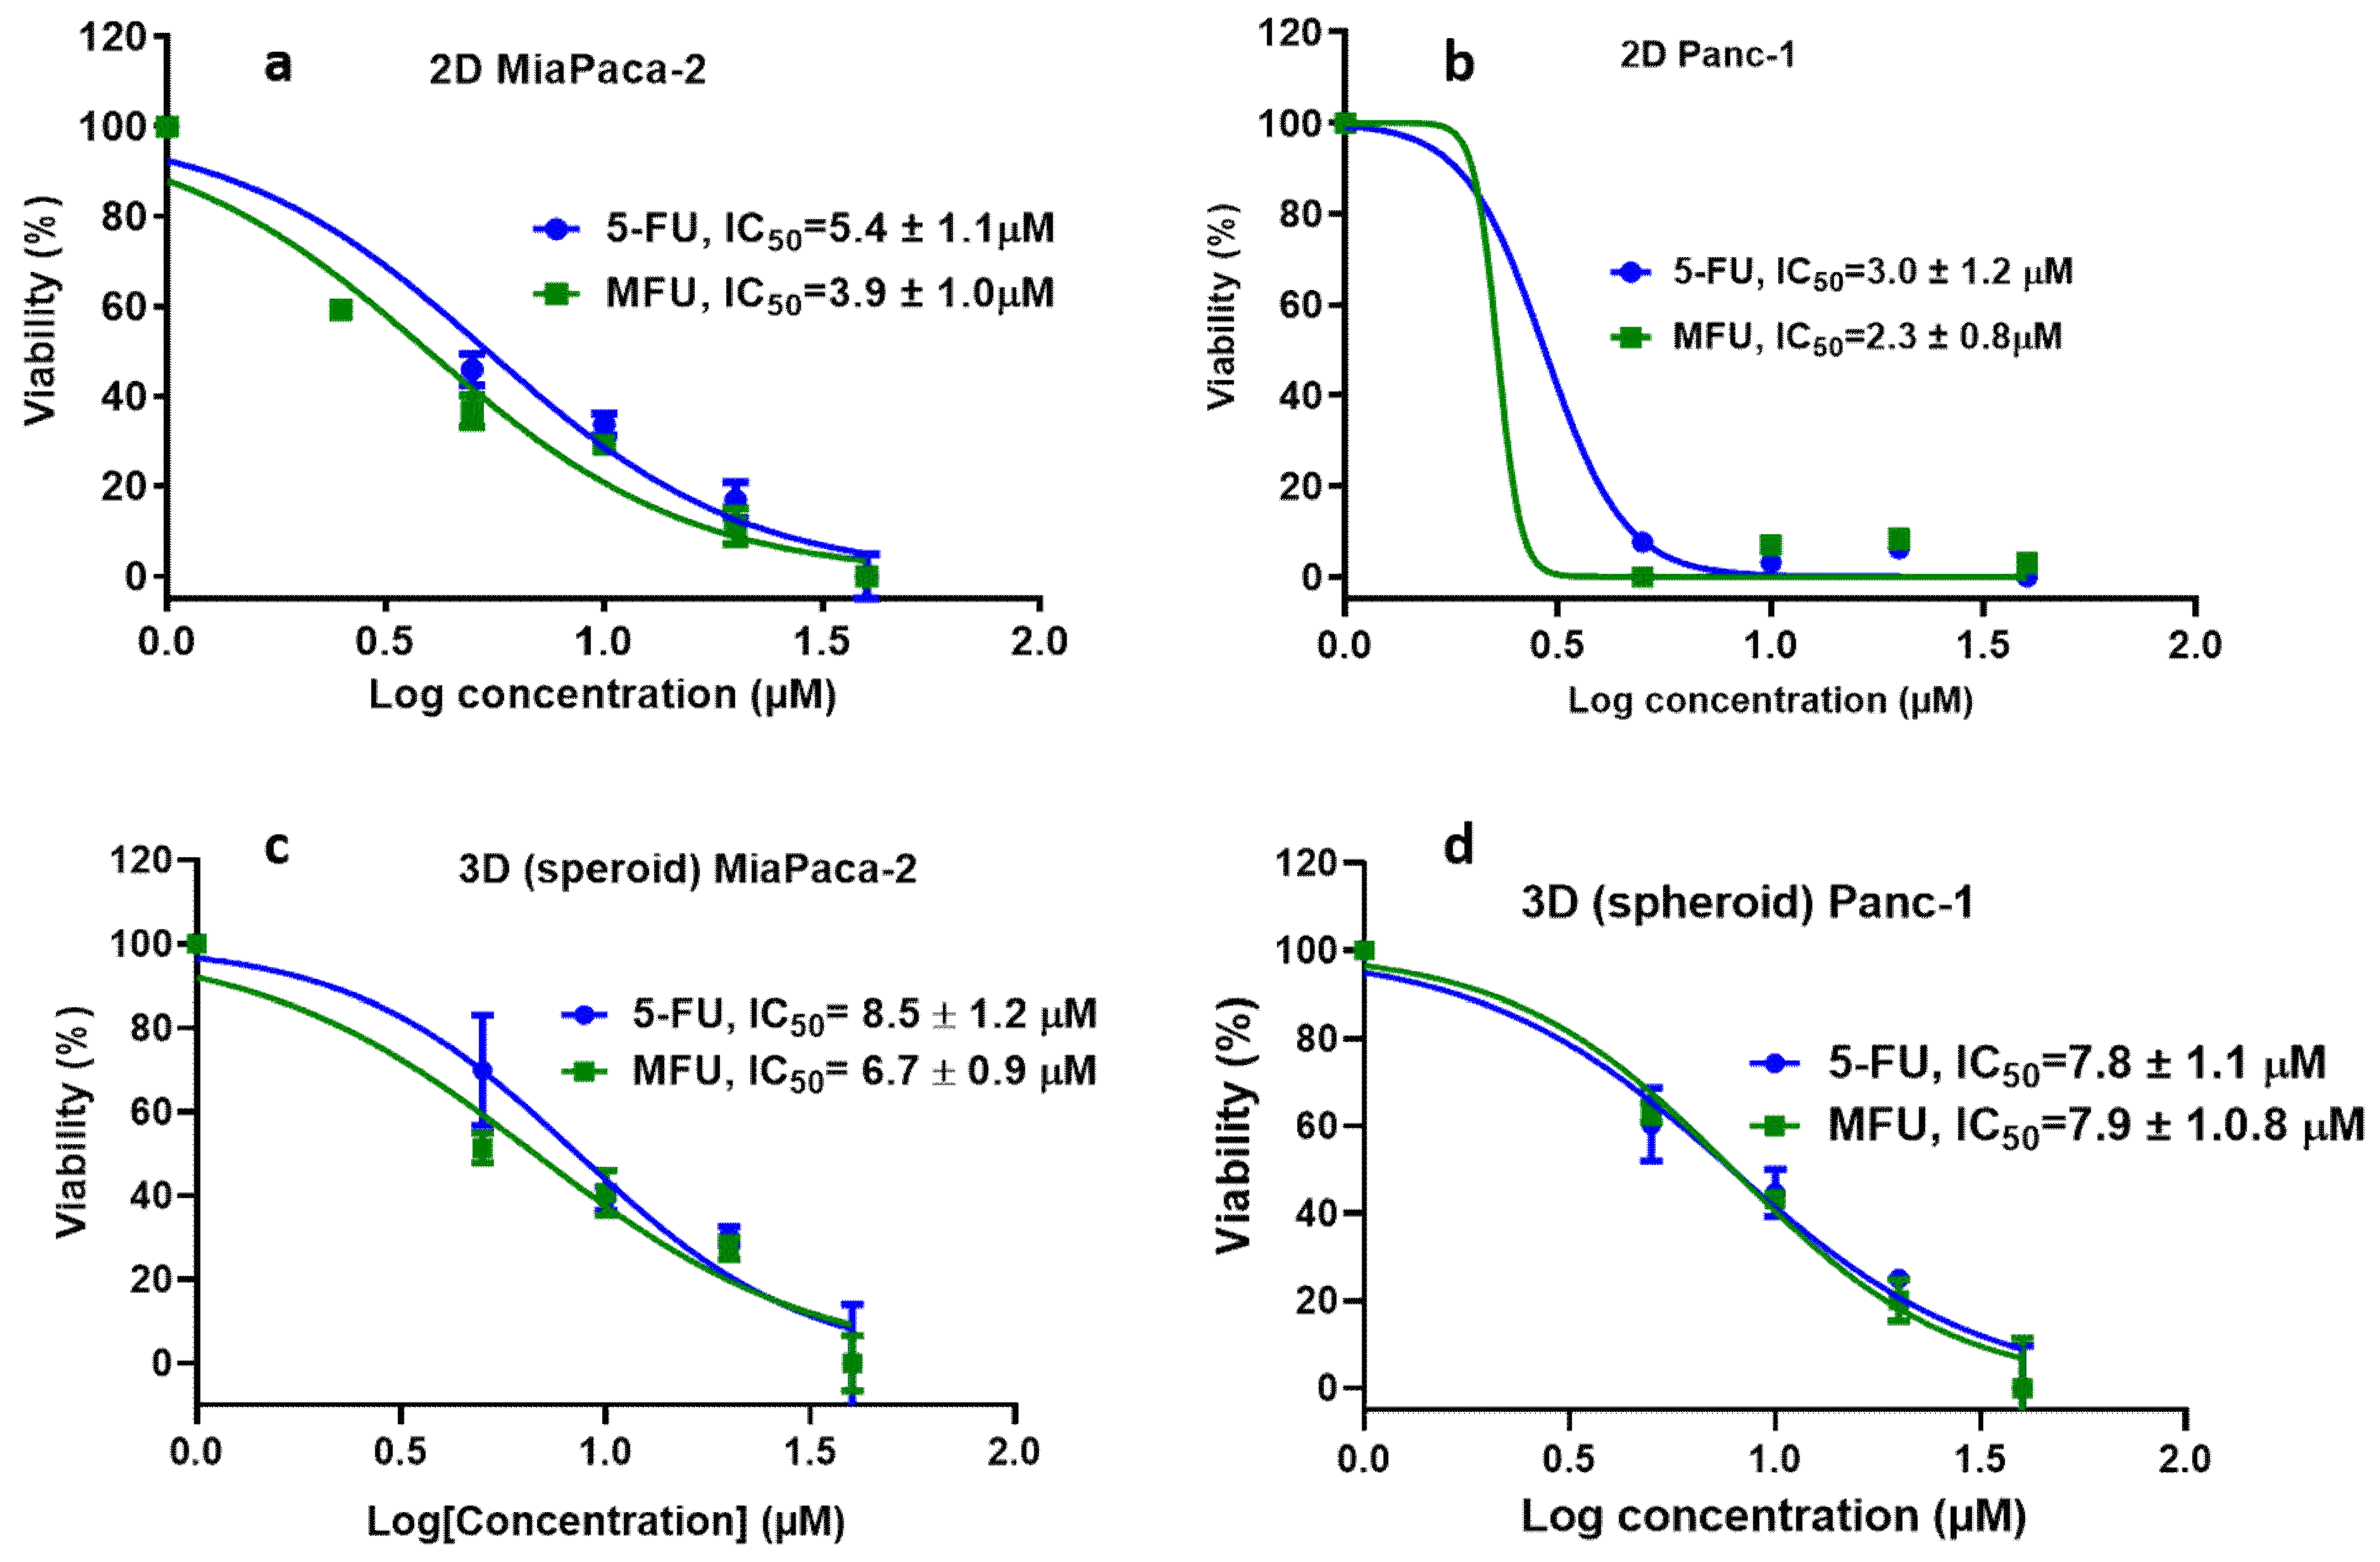
Figure 5.
Cell viability: Effects of Zhubech formulation on Panc-1 and MiaPaca-2 cell growth after 48 h exposure. (a) % viability of Panc-1 in 2D culture. (b) % viability of Panc-1 in 3D spheroid culture. (c) % viability of MiaPaca-2 in 2D culture. (d) % viability of MiaPaca-2 in 3D spheroid culture and (e) % viability of MiaPaca-2 in 3D organoid culture (after 7 days of exposure with MFU and Zhubech formulation).
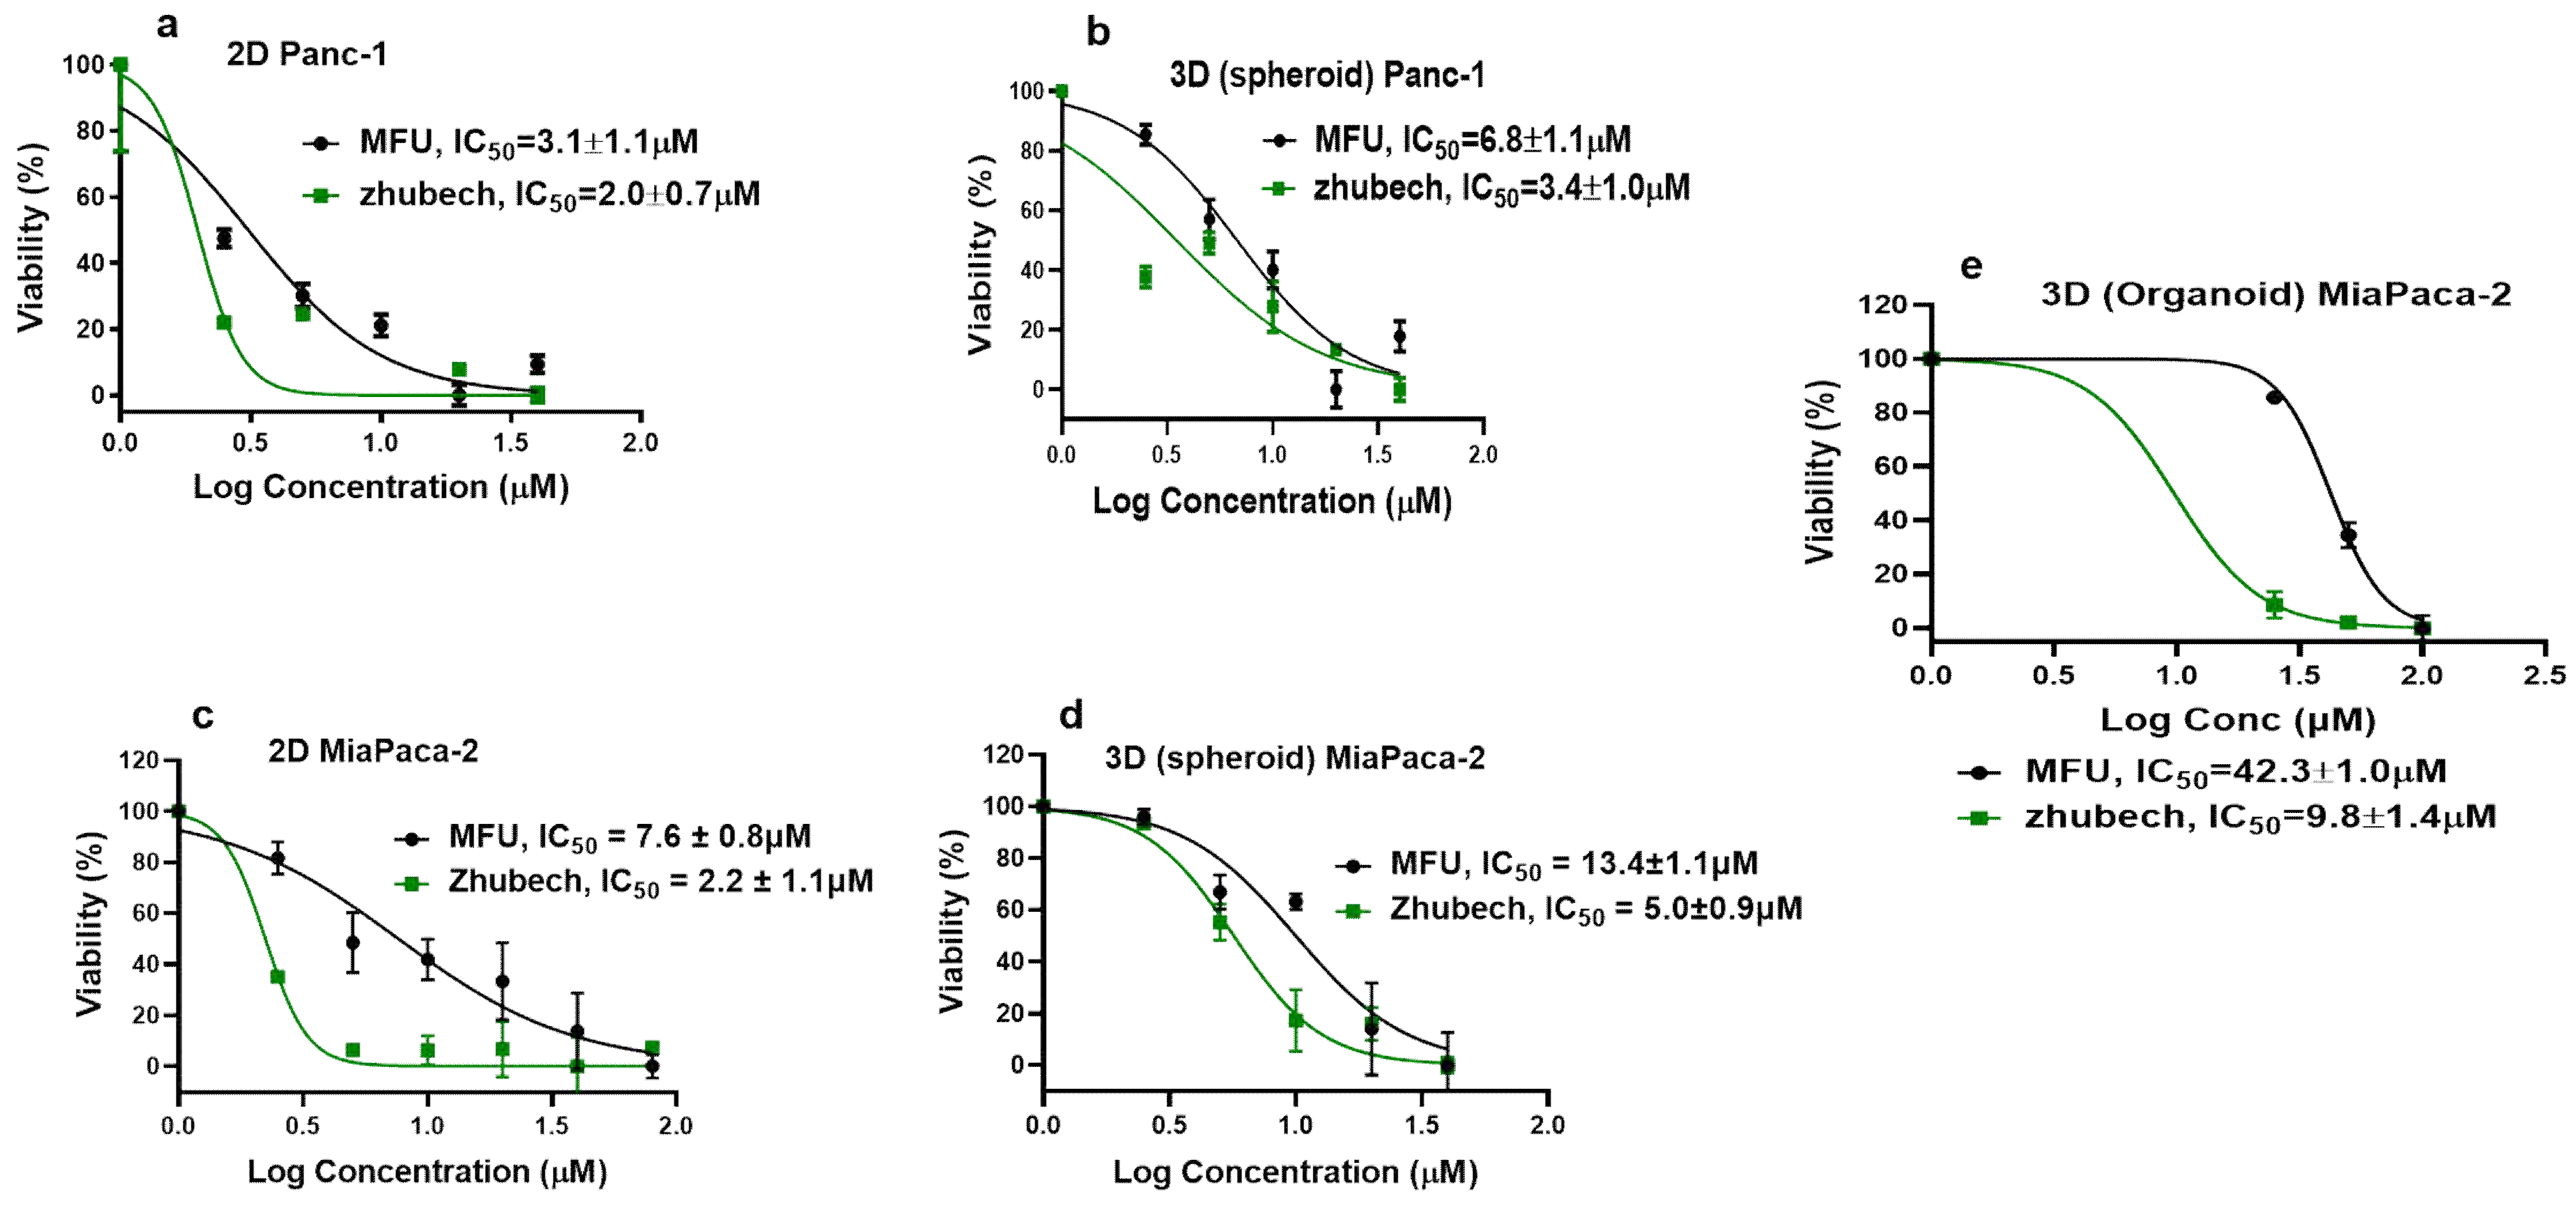
Figure 6.
In-vivo efficacy of zhubech in PDX mouse model and chronic toxicity. (a) Tumor growth curves of 5-FU and zhubech treated mice bearing pancreatic PDX tumor and (b) body weight during treatment. Asterisks represents level of significance between control and treatment group (**p<0.01, ***p<0.001). All data represents mean ± SD, (n=4/group).
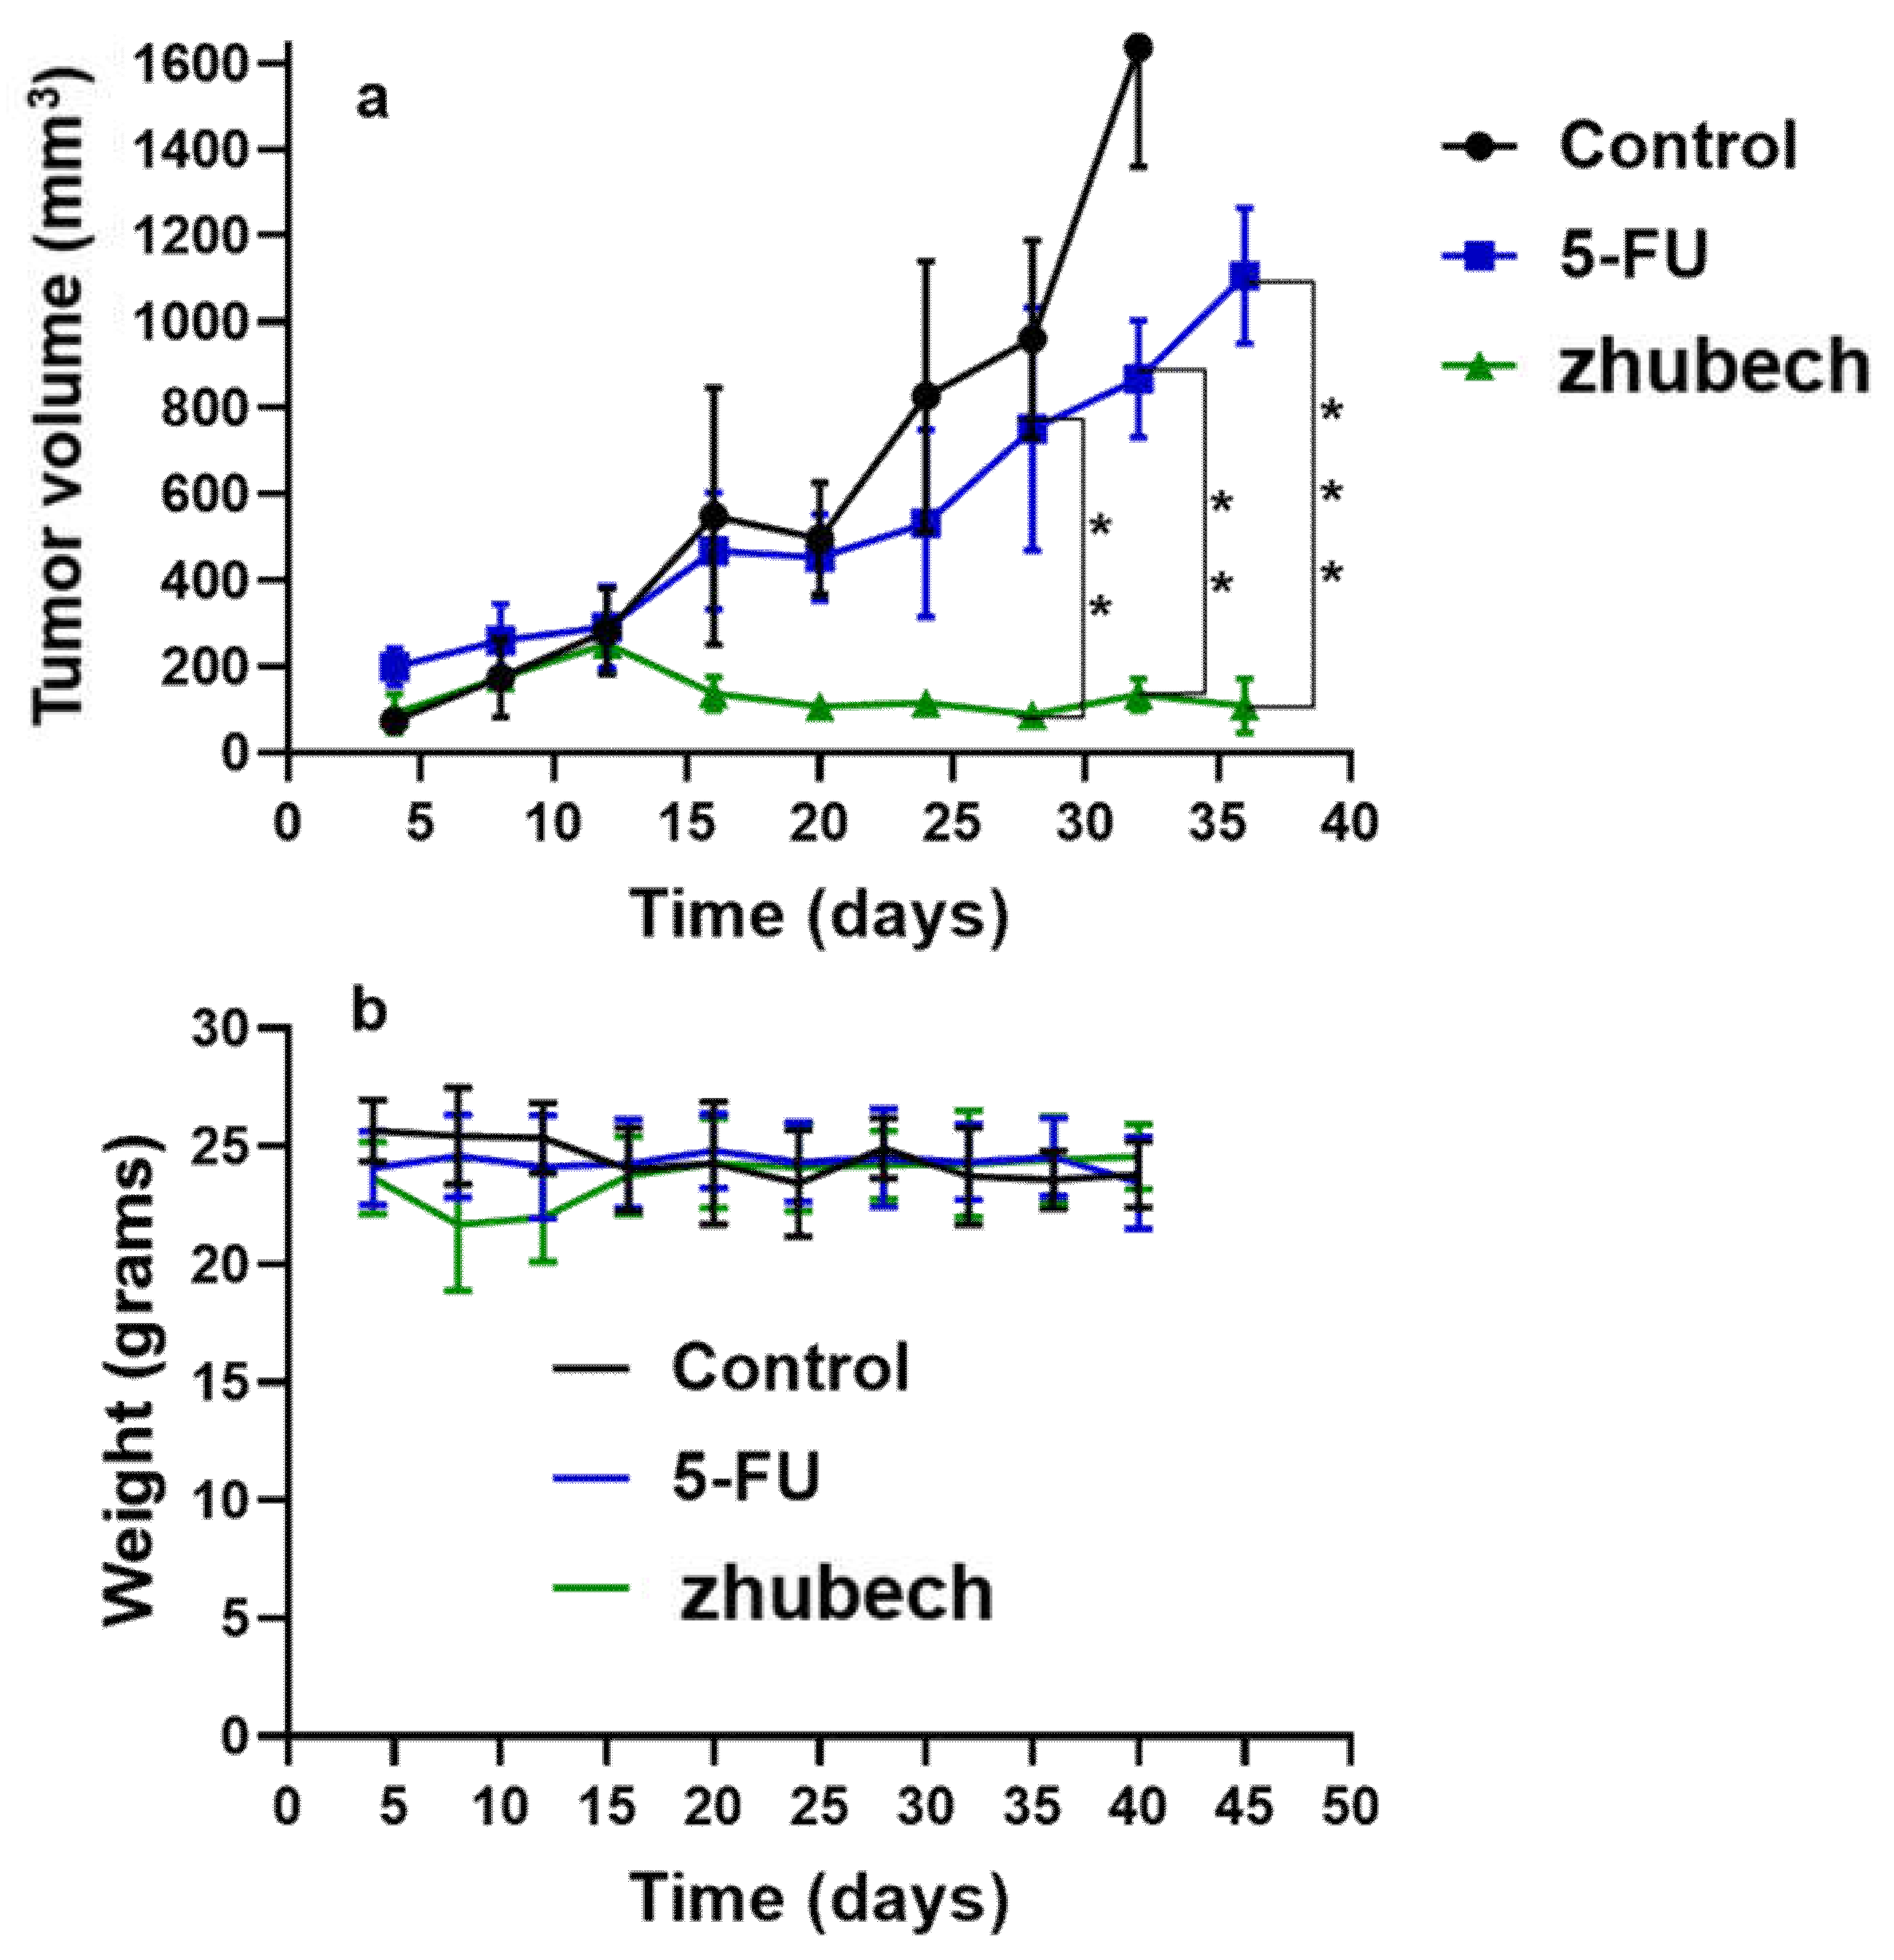
Figure 7.
Biodistribution of Gd-Hex-LnP in different tissues (Heart, Kidney, lungs, brain, liver, and pancreas) at different time points (0.17, 0.5, 1, 4, 8, and 12 hours) after IV injection of 0.05mmol/kg of Gd-Hex-LnP in nude mice. Data represent mean ± SD, number of mice per group = 3.
Figure 7.
Biodistribution of Gd-Hex-LnP in different tissues (Heart, Kidney, lungs, brain, liver, and pancreas) at different time points (0.17, 0.5, 1, 4, 8, and 12 hours) after IV injection of 0.05mmol/kg of Gd-Hex-LnP in nude mice. Data represent mean ± SD, number of mice per group = 3.
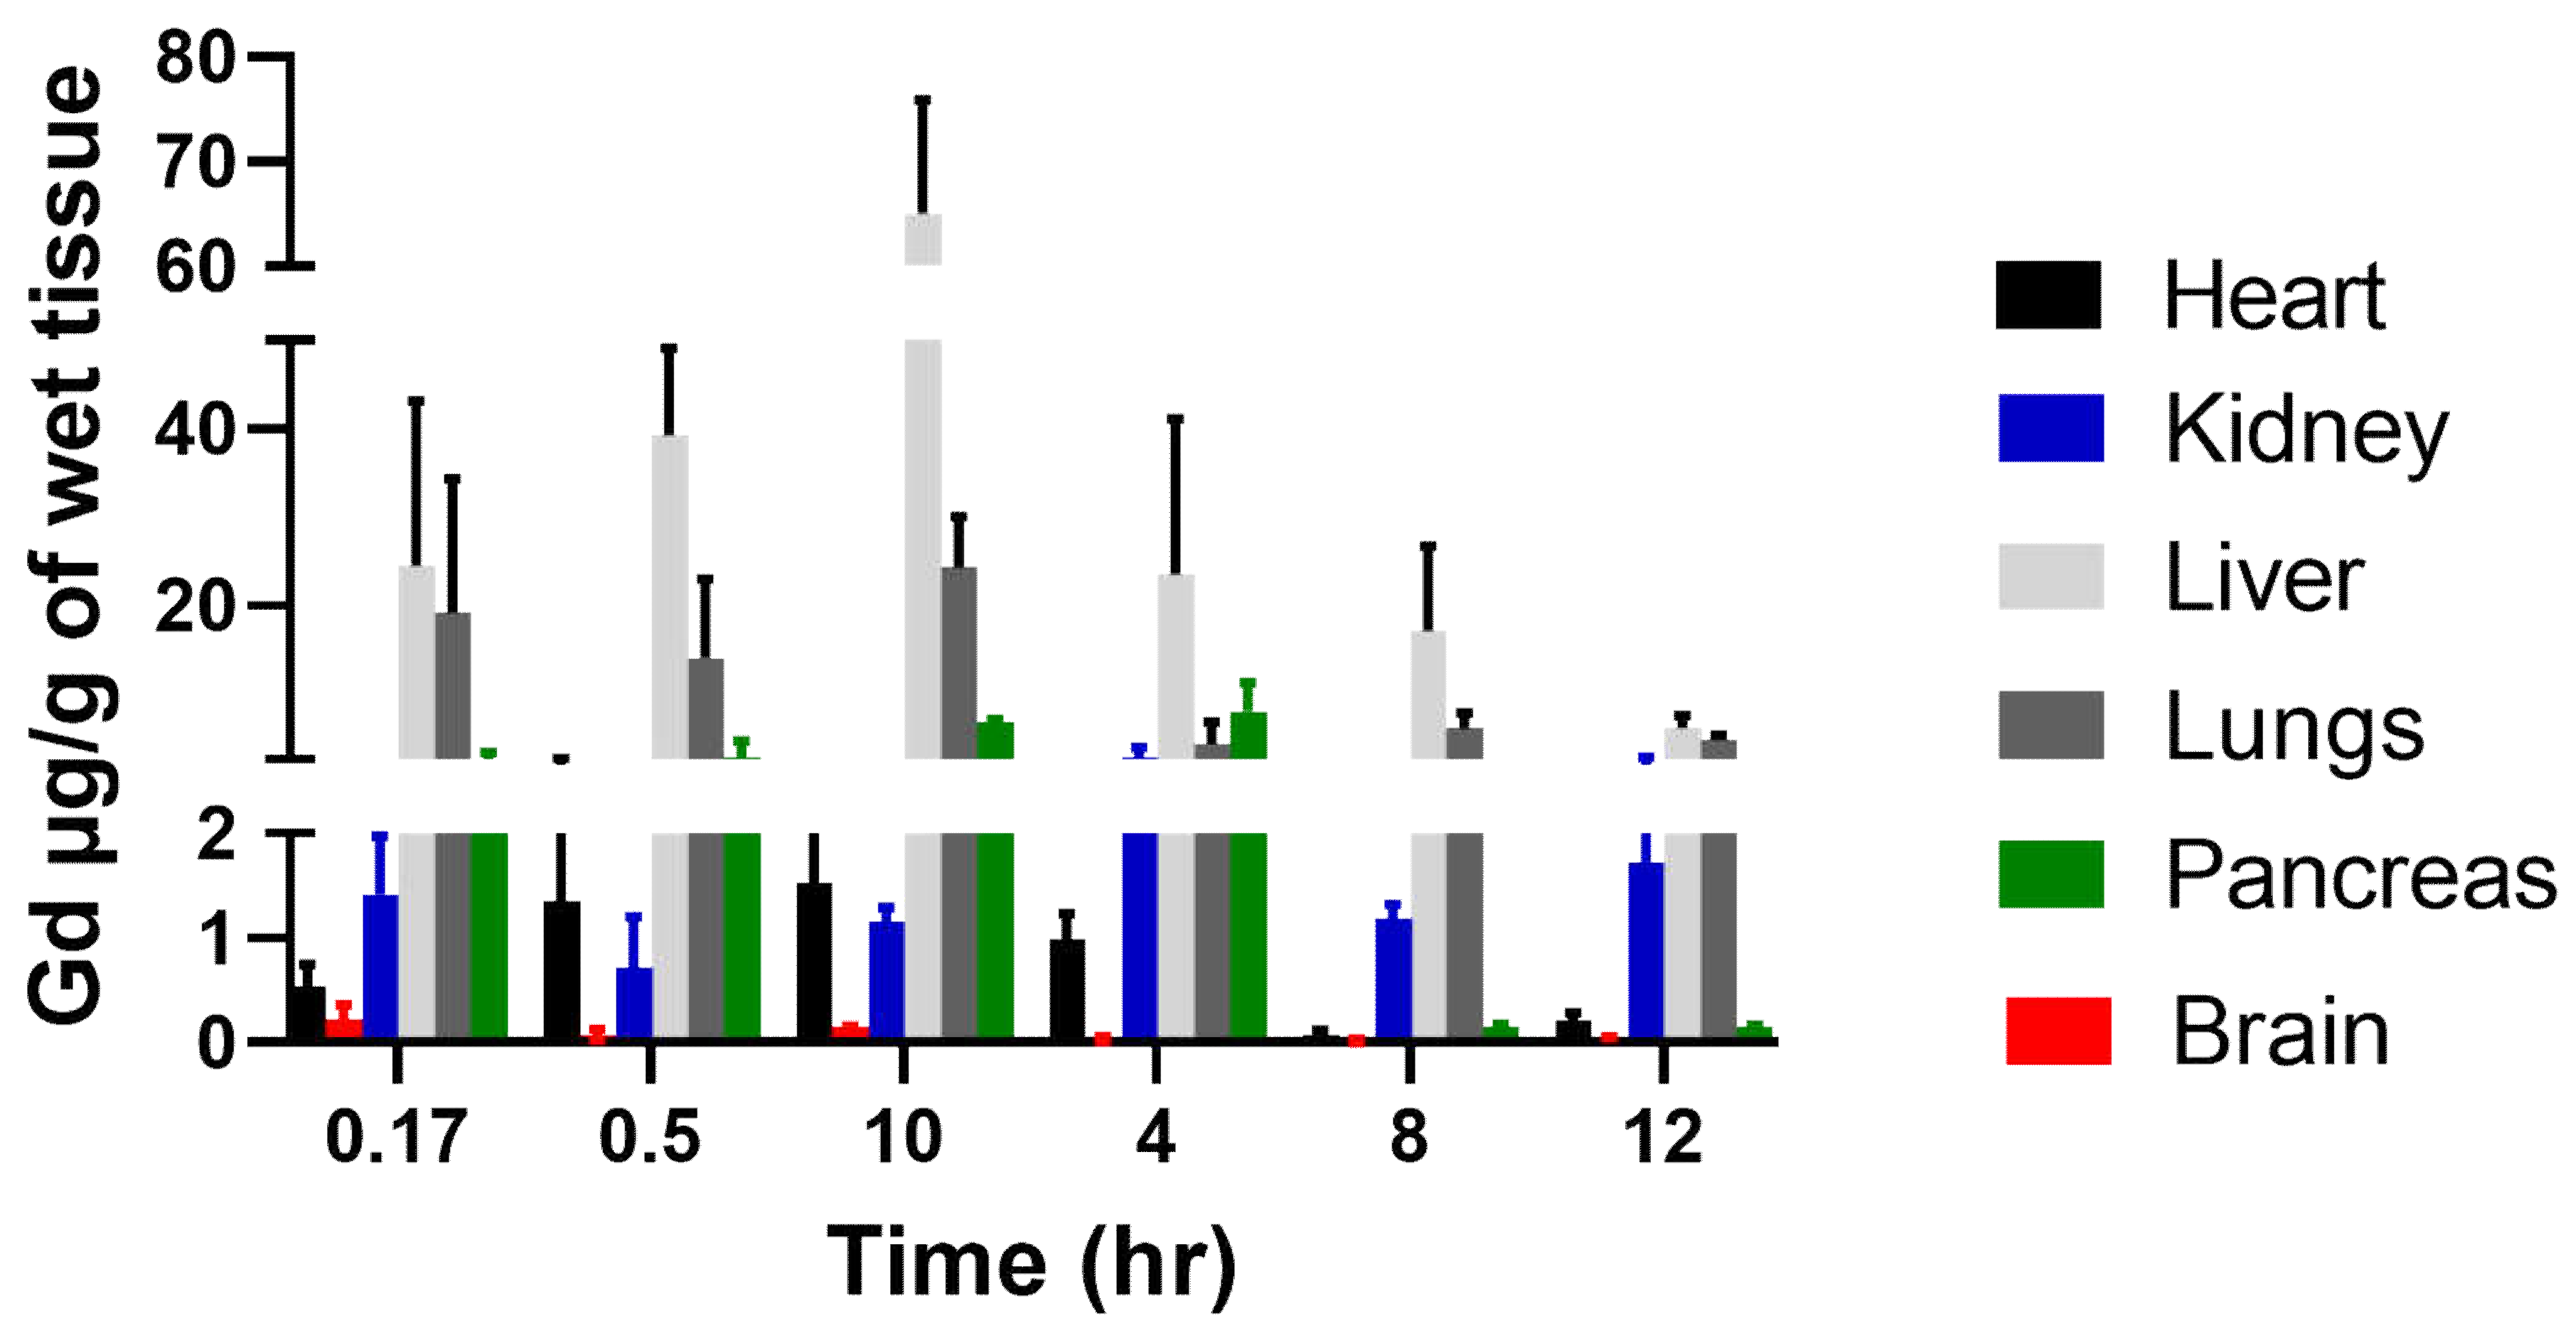

Table 1.
Characterization of LnP and Zhubech.
| Lipid composition | Molar ratio | Hydrodynamic diameter (nm) | PDI | Zeta potential (mV) | E.E (%) | |
|---|---|---|---|---|---|---|
| LnP | DPPC: MPPC: Chol: DSPE-PEG_2000 | 50:25:20:5 | 90.0 ± 0.65 | 0.39 ± 0.01 | 0.02 | - |
| Zhubech | DPPC: MPPC: Chol: DSPE-PEG_2000 | 50:25:20:5 | 124.9 ± 3.2 | 0.16 ± 0.005 | -30.3 ± 12 | 97.2 ± 0.9 |
Data expressed as mean± SD
Table 2.
Physical stability of Zhubech over time
| Day | Temperature | Hydrodynamic diameter (nm) | PDI | MFU content in LnP (%) | Physical appearance |
|---|---|---|---|---|---|
| 0 | 25 ± 1.5˚C | 124.9 ± 3.2 | 0.16 ± 0.005 | 97.2 ± 0.9 | Bluish, clear |
| 30 (Batch 1) | 4 ± 1˚C | 117 ± 2.0 | 0.18 ± 0.04 | 95.2 ± 2.7 | Cream white, clear |
| 25 ± 2˚C | 127.4 ± 2.3 | 0.23 ± 0.08 | 93.4 ± 3.7 | Cream white, clear | |
| 40 ± 3˚C | 126.8 ± 0.9 | 0.47 ± 0.06 | 91.9 ± 0.2 | Cream white, clear | |
| 60 (Batch 2) | 4 ± 1˚C | 129.4 ± 0.6 | 0.27 ± 0.013 | 90.1 ± 1.1 | Cloudy |
| 25 ± 2˚C | 135 ± 6.1 | 0.63 ± 0.031 | 87.1 ± 2.1 | White, coagulated | |
| 40 ± 3˚C | 142.7 ± 2.5 | 0.36 ± 0.021 | 90.3 ± 4.3 | Cream white, clear | |
| 90 (Batch 3) | 4 ± 2˚C | 146.7 ± 1.6 | 0.39 ± 0.07 | 71.1 ± 0.8 | Cloudy |
| 25 ± 2˚C | 162.2 ± 16.0 | 0.42 ± 0.02 | 88.2 ± 3.7 | White, coagulated | |
| 40 ± 3˚C | 169.1 ± 2.1 | 0.15 ± 0.01 | 67.9 ± 6.4 | Cream white, clear |
Data expressed as mean ± SD
Table 3.
Comparing the IC50 values of 5-FU compared to MFU and Zhubech in MiaPaca-2 and Panc-1 cell lines.
Table 3.
Comparing the IC50 values of 5-FU compared to MFU and Zhubech in MiaPaca-2 and Panc-1 cell lines.
 |
Data expressed as mean ± SD *= p-value is significant
Disclaimer/Publisher’s Note: The statements, opinions and data contained in all publications are solely those of the individual author(s) and contributor(s) and not of MDPI and/or the editor(s). MDPI and/or the editor(s) disclaim responsibility for any injury to people or property resulting from any ideas, methods, instructions or products referred to in the content. |
© 2023 by the authors. Licensee MDPI, Basel, Switzerland. This article is an open access article distributed under the terms and conditions of the Creative Commons Attribution (CC BY) license (http://creativecommons.org/licenses/by/4.0/).
Copyright: This open access article is published under a Creative Commons CC BY 4.0 license, which permit the free download, distribution, and reuse, provided that the author and preprint are cited in any reuse.


