Submitted:
20 July 2023
Posted:
25 July 2023
You are already at the latest version
Abstract
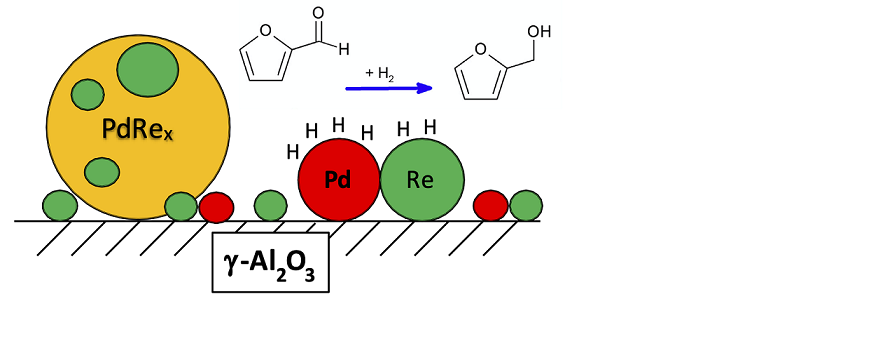
PdRe/Al2O3 catalysts are highly selective for hydrogenation of furfural to furfuryl alcohol (FAL). Moreover, synergy between the metals can result in greater specific activity (higher turnover frequency, TOF) than exhibited by either metal alone. Bimetallic catalyst structure depends strongly on the metal precursors employed and their addition sequence to the support. In this work, PdRe/Al2O3 catalysts were prepared by: (i) co impregnation (CI) and sequential impregnation (SI) of Al2O3 using HReO4 and Pd(NO3)2, (ii) SI using NH4ReO4 and [Pd(NH3)4(NO3)2], (iii) HReO4 addition to a reduced and passivated Pd/Al2O3 catalyst, and (iv) impregnation with the double complex salt (DCS), [Pd(NH3)4(ReO4)2]. Raman spectroscopy and temperature-programmed reduction (TPR) evidence larger supported PdO crystallites in catalysts prepared using Pd(NO3)2 than [Pd(NH3)4(NO3)2]. Surface [ReO4]- species detected by Raman exhibit TPR peak temperatures from ranging 85 to 260°C (versus 375°C for Re/Al2O3). After H2 reduction at 400°C, the catalysts were characterized by chemisorption, temperature-programmed hydride decomposition (TPHD), CO diffuse reflectance infrared Fourier transform spectroscopy (DRIFTS), and scanning transmission electron microscopy (STEM) with energy-dispersive x-ray (EDX) spectroscopy. The CI catalyst containing supported Pd-Re alloy crystallites had a TOF similar to Pd/Al2O3 but higher (61%) FAL selectivity. In contrast, catalysts prepared by methods (ii-iv) containing supported Pd-Re nanoparticles exhibit higher TOFs and up to 78% FAL selectivity.
Keywords:
bimetallic catalyst
; Raman spectroscopy
; TPR
; palladium hydride
; chemisorption
; DRIFTS
; STEM-EDX
1. Introduction
Rhenium is used in supported bimetallic catalysts with other Group VIII metals (such as Rh [1,2,3,4], Ru [5,6] and Pd [7]) to enhance selective hydrogenation and hydrogenolysis of oxygenated organic compounds. Tomishige and coworkers investigated SiO2- and C-supported Re bimetallic catalysts for a variety of reactions, including ester hydrogenolysis [2], ring-opening of cyclic ethers [1,4], hydrogenation of fatty acids to alcohols [7], and glycerol hydrogenolysis [8]. For each reaction, Re addition boosts activity and selectivity to the desired product, e.g., 1,5-pentanediol from ring-opening of tetrahydrofurfuryl alcohol [4]. Similarly, Re addition to Pd/SiO2 increased selectivity to fatty alcohols in fatty acid hydrogenation [7]. Suppression of CO chemisorption (compared to Rh/SiO2) and the observed modification of catalytic activity suggested surface modification of supported Rh particles by Re species. Complementary results from extended x-ray absorption fine structure (EXAFS) spectroscopy, x-ray photoelectron spectroscopy (XPS), x-ray diffraction, and scanning transmission electron microscopy with energy-dispersive x-ray analysis (STEM-EDX) led to the conclusion that low-valent ReOx species in contact with supported Rh particles were the active sites [4,9]. Supported PdRe catalysts also have been investigated for selective hydrogenation of dicarboxylic acids [10,11,12], hydrodechlorination [13,14], and reforming reactions [15].
Structural investigations of PdRe/Al2O3 catalysts have been limited. Meitzner, et al. examined a 0.6 wt.% Pd-1 wt.% Re/Al2O3 catalyst prepared by incipient wetness (IW) co-impregnation (CI) by EXAFS spectroscopy and inferred Pd-Re alloy formation [16]. Ziemecki, et al. investigated PdRe/Al2O3 catalysts prepared by sequential impregnation (SI): depositing a Pd2+ salt on γ-Al2O3, calcining, reducing to Pd0, passivating, and then adding the Re precursor [17,18]. Characterization of the resultant catalyst by temperature-programmed reduction (TPR), H2 uptake measurements and in situ x-ray diffraction (XRD) demonstrated that substitutional alloying with Re was responsible for suppression of bulk palladium hydride (PdHx) formation. Karpinski and coworkers used a similar preparation method and also reported PdHx suppression associated with PdRe alloy formation based on XRD and temperature-programmed hydride decomposition (TPHD) [13,14,15]. Because the addition of small amounts of Re to Pd/Al2O3 suppressed CO chemisorption and inhibited hydroisomerization activity, they concluded that Re occupied the surface of Pd-rich alloy particles [14]. More recently, Holles and coworkers used directed deposition to selectively form Pd overlayers on alumina-supported Re particles [19,20]; the catalysts were characterized primarily by H2 chemisorption and a simple probe reaction (ethylene hydrogenation).
Our previous research on PdRe/Al2O3 catalysts for selective hydrogenation of furfural to furfuryl alcohol (FAL) demonstrated substantial differences in catalyst structure and performance depending on the preparation method, metal precursors, and Pd:Re ratio [21]. A strong correlation between selective hydrogenation activity and suppression of H2 chemisorption was observed. The H/CO chemisorption ratio at 35°C correlated with furfuryl turnover frequency (TOF) and FAL selectivity, and there was an optimum surface composition. PdRe/Al2O3 catalysts with 1:2 Pd:Re molar ratios (exhibiting very low H/CO ratios) had low activity suggesting that the Pd surface was covered by Re. More recently, Kammert, et al. investigated PdRe/SiO2 and PdRe/TiO2 catalysts for hydrogenation of propionic acid and proposed that Pd facilitates the reaction by dissociating H2 providing hydrides and protons to vicinal Re sites [22].
In this work, we further elucidate the structures of PdRe/Al2O3 catalysts for selective hydrogenation of furfural using TPR, TPHD, CO and H2 chemisorption, CO diffuse reflectance infrared Fourier transform spectroscopy (DRIFTS), and STEM-EDX. The roles of the metal precursors, impregnation sequence, and calcination conditions in determining catalyst morphology (i.e., particle size and metal-metal interactions) are investigated. Moreover, we take advantage of the strong Raman bands of the perrhenate ion, [ReO4]-, and PdO crystallites to characterize the as-prepared catalysts. Otto, et al. measured the Raman spectra of a series of Pd/Al2O3 catalysts and found a linear relationship between the intensity of the PdO B1g lattice vibration and Pd loading (up to 2.5 wt.%) [23]. Baylet, et al. used in situ Raman spectroscopy to investigate the dynamics of Pd/Al2O3 oxidation catalysts [24]. Re/Al2O3 catalysts have been probed extensively by Raman spectroscopy [25,26,27], but we are not aware of any studies of PdRe/Al2O3 catalysts. To facilitate Raman spectroscopy, a new series of PdRe/Al2O3 catalysts was prepared using a γ-Al2O3 support that did not fluoresce strongly in the region of interest. Specifically, catalysts were prepared by: (i) CI and SI of γ-Al2O3 using HReO4 and Pd(NO3)2, (ii) SI using NH4ReO4 and [Pd(NH3)4(NO3)2] (intermediate and final calcination steps), (iii) SI via HReO4 addition to a reduced and passivated Pd/Al2O3 catalyst, and (iv) impregnation with the double complex salt (DCS), [Pd(NH3)4(ReO4)2].
2. Results and Discussion
2.1. Catalyst Characterization
The catalysts, metal precursors and loadings are listed in Table 1. The catalyst name denotes the metal(s), target loading(s) (wt.%), and metal precursor(s): nitrate, N or tetraammine nitrate, TA for Pd, and perrhenic acid, H or ammonium perrhenate, N for Re. Co-impregnation and sequential impregnation are indicated by CI and SI, respectively. The impregnation sequence (for SI) is indicated by the order of metals (e.g., Re-first 5 wt.%, Pd 3 wt.% = Re5Pd3). DCS indicates impregnation with the stoichiometric double complex salt, [Pd(NH3)4(ReO4)2].
Raman spectra of the as-prepared 3 wt.% Pd/Al2O3 catalysts (Figure 1a) contain a peak at ~640 cm-1 corresponding to the B1g lattice vibration of PdO crystallites [28]. This peak has negligible intensity in the Raman spectrum of the as-prepared Pd1-N catalyst (not shown). It has been observed at 626 to 651 cm-1 in supported Pd catalysts and PdO thin films [23,24,29,30,31]. A weak Raman peak at ~280 cm-1 is also observed that was attributed by McBride, et al. to a second-order scattering process [28]. Another Raman band at 445 cm-1 was assigned to the Eg lattice vibration; however, McBride, et al. note that the band is extremely weak when employing 632.8 nm (He-Ne laser) excitation [28]. Otto, et al. [23] found that the integrated intensity of the B1g lattice vibration was directly proportional to Pd loading (0.2-2.5 wt.% range) in fully oxidized Pd/Al2O3 catalysts. They suggested that highly dispersed PdO crystallites smaller than ~1.5 nm (containing fewer than ca. 50 metal atoms) interacting with the γ-Al2O3 support were undetectable by Raman spectroscopy.
Despite their similar Pd loadings, the Raman B1g band of Pd3-N is much stronger and shifted slightly to lower wavenumbers than that of Pd3-TA leading us to infer that the Pd3-N catalyst contains larger PdO crystallites. The smaller PdO particle size (i.e., higher dispersion) achieved using the tetraammine nitrate precursor can be explained by strong electrostatic adsorption (SEA) [32]. The pH of the [Pd(NH3)4(NO3)2] impregnation solution was well above the point-of-zero charge (PZC) of γ-Al2O3 (8.0 ± 0.2) resulting in a net negative charge on the support. Specifically, surface hydroxyl groups are deprotonated leaving surface O- ions that electrostatically attract [Pd(NH3)4]2+ cations. In contrast, Pd(NO3)2 solutions are neutral to slightly acidic (pH below PZC of γ-Al2O3), and the SEA effect is negated.
Raman spectra of the as-prepared Re/Al2O3 catalysts (Figure 1a) contain peaks corresponding to rhenium-oxygen stretching and bending modes. The strong sharp peak at 970 cm-1 is assigned to the symmetric Re=O stretching mode (νs) of Td [ReO4]- species [25,26,27]. The peak position corresponds to perrhenate ion in aqueous solution, as expected following exposure to ambient moisture. Additional bands at 920 (vw) and 335 (w) cm-1 are assigned to the antisymmetric Re=O stretching (νas) and O-Re-O bending (δ) modes, respectively. Significantly, no Raman bands indicative of Re-O-Re bonding are observed consistent with submonolayer coverage of isolated perrhenate species on γ-Al2O3. A small peak appears at 1000 cm-1 in the Raman spectrum of Re5-H. The symmetric Re=O stretching peak is shifted to ~1000 cm-1 for a hypothetical C3v [ReO4] species with three identical Re=O bonds and a Re-O-Al bridge to the support [25,33]; however, this species typically is found only under dehydrated conditions [26,27].
The strong PdO band (B1g mode) in the Raman spectrum of Pd3Re5-CI evidences that PdO crystallites are present following calcination (Figure 1b). A strong shoulder at ~550 cm-1 and a weak band at ~280 cm-1 are also observed. A medium-intensity νs(Re=O) band at ~1000 cm-1 and weak δ(O-Re-O) band at 335-cm-1 are observed consistent with isolated [ReO4]- species. An unassigned weak broad feature at ~850 cm-1 is also noted. The Raman spectrum of Re5Pd3N-SI, another bimetallic catalyst prepared from Pd(NO3)2, is closely similar. Qualitatively, the νs(Re=O) bands for these bimetallic catalysts are broader and less intense than those for Re5-H and Re5-N (Figure 1a). The strong intensity of the B1g mode is indicative of supported PdO crystallites. The medium-intensity νs(Re=O) band contains at least two components between 1000 and 970 cm-1 indicating [ReO4]- species in different environments.
In contrast, the PdO B1g mode in the Raman spectrum of Re5Pd3-SI (Figure 1b) is very weak and shifted to slightly higher wavenumbers indicating that only small PdO nanoparticles and/or isolated Pd oxo complexes are present after the final calcination. These results suggest that the size and distribution of PdO particles after calcination is affected more strongly by the metal precursor than by the method of preparation. We infer that SEA of the tetraammine complex to the ReOx-modified support results in highly dispersed Pd oxo species. A strong νs(Re=O) peak is observed at 970 cm-1 with a shoulder at ~1000 cm-1. The νas(Re=O) and δ(O-Re-O) peaks at 920 and 335 cm-1, respectively, allow a definitive assignment to Td [ReO4]-. The PdO B1g band has negligible intensity in the Raman spectrum of Pd3Re5-SI (Figure 1b). Instead, a large, broad feature at 300-700 cm-1 due to fluorescence from the γ-Al2O3 support is observed. Otto, et al. inferred that fluorescence in this region is quenched by a PdO-support interaction [23]. Consistent with this hypothesis, fluorescence is suppressed for the other catalysts examined herein. In Pd3Re5-SI, Pd was reduced and passivated prior to impregnation with HReO4. The absence of a low-temperature TPR peak (vide infra) indicates that the Pd0 particles are not converted to bulk PdO, and we infer that a thin PdOx layer is formed consistent with the oxidation mechanism proposed by Su, et al. [29]. The strong Raman band at 1000 cm-1 is assigned to [ReO4]- species interacting with support and/or the PdOx-covered metal particles.
TPR profiles of the as-prepared 3% Pd/Al O3 catalysts are shown in Figure 2a. Reduction of larger supported PdO crystallites in Pd3-N occurs abruptly at sub-ambient temperatures resulting in a very sharp H2 uptake peak at approximately -10°C. An additional H2 uptake feature at ~30°C is ascribed to reversible PdHx formation; H2 evolution associated with PdHx decomposition is observed at ~55°C. TPR profiles of two Pd3-TA catalysts (A and B) prepared using different alumina supports are also shown. The TPR profile for Pd3-TA (A) (prepared using the same support as the other catalysts in this work) is broader and reduction occurs at higher temperatures consistent with PdO nanoparticles interacting strongly with the γ-Al2O3 support and/or surface-bound Pd oxo complexes. There is a shallow dip in the TCD signal at ~55°C consistent with PdHx decomposition followed by a broad maximum at ~80°C. The small H2 consumption feature at 290°C arises from reduction of carbonate species associated with alkali and alkaline impurities, as confirmed by CH4 evolution [34]. In contrast, H2 consumption during TPR of Pd3-TA (B) occurs primarily at <50°C. Because Pd0 particles are formed at low temperature, H2 is evolved at 55°C (inverse peak) due to β-PdHx decomposition. H2 uptake continues to ~200°C. Because γ-Al2O3 (B) lacks the alkali and alkaline metal impurities of γ-Al2O3 (A), a H2 uptake feature at 290°C is not observed. Quantitative H2 uptake measurements [excluding the 290°C peak for Pd3-TA (A)] (Table 2) indicate complete reduction of Pd2+ to Pd0 following TPR to 400°C. The TPR profile of Re5-N (Figure 2b) contains a well-defined peak at 375°C with a high-temperature tail extending to ~700°C. TPR peak position and shape for Re5-H are similar (not shown). Quantitative H2 uptake measurements (Table 2) indicate incomplete reduction of Re7+ after TPR to 400°C; however, complete reduction to Re0 was achieved after TPR to 800°C.
The TPR profiles of bimetallic catalysts prepared using HReO4 and Pd(NO3)2 are qualitatively similar (Figure 2b). An extremely sharp peak attributed to reduction of PdO crystallites is observed at ~25°C. Although similar to the low-temperature TPR peak observed for Pd3-N, it occurs at ~20°C higher temperature. A second low-temperature TPR peak appears at ~55-60°C that may be assigned to Pd or Re species. The higher temperature (>100°C) TPR features are consistent with Re reduction. The maximum rate of H2 consumption occurs at ~260°C—more than 100°C below the peak reduction temperature of Re5-N. Facilitated reduction of perrhenate species in PdRe/Al2O3 catalysts has been ascribed to (i) hydrogen spillover from Pd particles [21] and (ii) migration of Re2O7 to Pd particles in the presence of adsorbed H2O [18]. In contrast to Re5-N, TPR of Pd3Re5-CI evidences that essentially all supported Re has been reduced after heating to 400°C in 5% H2/Ar (Table 2).
The bimetallic catalysts Re5Pd3-SI and Re5Pd3-SI (350) have similar TPR profiles (Figure 2c) comprising a sharp Pd reduction peak at ~10°C and a broad Re reduction feature at 30-200°C. The Pd reduction peak is sharper and occurs at lower temperature than for Pd3-TA (A) suggesting that the presence of supported perrhenate species affects Pd2+ reduction. Most Re reduction occurs at <200°C consistent with hydrogen spillover from highly dispersed Pd particles [21]. Essentially complete Re reduction is obtained for both catalysts at 400°C (Table 2). Increasing the calcination temperature to 400°C and time to 3 h sharpens the peaks and lowers the Re reduction temperature. The converse would be expected for moisture-dependent diffusion of ReOx species to Pd0 particles. The TPR profile of Pd3Re5-SI exhibits a single symmetric peak with a maximum at ~80°C. Ziemecki, et al. reported a similar TPR profile (47°C peak maximum) for a PdRe/Al2O3 catalyst prepared by impregnation of a reduced 3 wt.% Pd/Al2O3 catalyst with aqueous Re2O7 and dehydration at 110°C [18]. Malinowski, et al. [13] also reported complete reduction of similarly prepared PdRe/Al2O3 catalysts after heating H2 at 400°C for 3 h. Ziemecki, et al. inferred that Re2O7 mobility on the hydroxylated γ-Al2O3 surface was the underlying mechanism of low-temperature Re reduction, because dehydroxylation at 500°C caused reduction to occur at much higher temperatures and PdRe alloy particles were formed [18].
Quantitative H2 uptake measurements on the bimetallic catalysts indicate that >90% of the Re was reduced to the zero-valent state after TPR to 400°C (Table 2). Residual Re7+ species interacting strongly with the support and intermediate Re oxidation states (e.g., Re4+) cannot be completely excluded.
TPHD measurements were performed on the 3 wt.% Pd/Al2O3 catalysts after TPR to 400°C. The TPHD spectrum of Pd3-N comprises a sharp H2 evolution peak at ~55°C with a shoulder at ~50°C. The H/Pd ratio (Table 2) is approximately half that observed in bulk Pd (H/Pd = 0.65) under similar conditions [17,18]. In contrast, the TPHD spectrum of Pd3-TA comprises a broad asymmetric H2 evolution peak centered around ~30°C and a small sharp peak at ~55°C. The H/Pd ratio is less than half that for Pd3-N (Table 2) consistent with highly dispersed supported Pd [35]. We assign the broad low-temperature peak to decomposition of supported PdHx nanoparticles and the small peak at 55°C to larger supported Pd crystallites. A lower decomposition temperature indicates lower stability of the PdHx phase in supported nanoparticles.
Re addition via any of the methods employed herein alters the H/Pd ratio and stability of the bulk PdHx phase. Alloying Pd with other transition metals (e.g., Au) is known to alter its electronic structure and destabilize the bulk hydride phase. The highest concentration of Re in PdRe solid solutions is ~10% [36]; however, bulk thermodynamics may not apply to small particles [37]. Ziemecki, et al. employed H2 uptake during cooling in the TPR apparatus to assess hydride suppression and infer alloy formation in PdAu and PdRe catalysts [17]. Malinowski, et al. [13] used a second TPR (equivalent to our TPHD) to characterize PdRe/Al2O3 catalysts and reported a reduction in H/Pd ratio and destabilization of the hydride phase with increasing Re content. TPHD measurements on bimetallic catalysts prepared by using Pd(NO3)2 are shown in Figure 3a. For both catalysts, there is a significant reduction in Pd/H ratio (Table 2) and low-temperature shift in decomposition temperature relative to Pd3-N. These observations are consistent with a strong PdRe bulk interaction, i.e., alloy formation in Pd-rich particles. TPHD spectra of more highly dispersed bimetallic catalysts are shown in Figure 3b. PdHx formation is completely suppressed in the 2:1 Re:Pd (bulk atomic ratio) catalyst prepared from the DCS [38]. The TPHD spectrum of Pd3Re5-SI suggests a strong PdRe interaction; hydride formation is strongly suppressed and decomposition occurs at much lower temperatures than typical for PdHx nanoparticles. Ziemecki, et al. reported equivalent observations for a similarly prepared PdRe/Al2O3 catalyst lending support to the Re2O7 surface mobility hypothesis [18]. In contrast, the TPHD spectra of Re5Pd3-SI and Re5Pd3-SI (350) contain a single sharp decomposition peak at 40-50°C consistent with PdHx particles, and the H/Pd ratios (Table 2) are equivalent to that of Pd3-TA. These results do not suggest bulk alloy formation and are consistent with low-temperature Re reduction via hydrogen spillover from vicinal Pd nanoparticles.
CO and H2 chemisorption data are provided in Table 3. The data confirm that Pd3-TA is more highly dispersed than Pd3-N, as expected from Raman spectroscopy and TPR. The CO/Pd ratio for Pd1-N is approximately three times higher than for Pd3-N indicating that lowering the Pd loading increases dispersion, as expected. At 35°C, the H/CO ratios are approximately unity for Pd3-N and Pd1-N. H2 chemisorption uptake declined by ~30% for these catalysts at 100°C. The low CO/Re ratio for Re5-N is consistent with previous volumetric chemisorption data on Re/Al2O3 [2016]. The H/CO ratio for Re5-N at 35°C is only ~15%, but H2 uptake increases at 100°C consistent with activated dissociative chemisorption [39].
The CO uptakes of Pd3Re5-CI and Re5Pd3N-SI are greater than Pd3-N indicating either a significant Re-CO contribution and/or smaller Pd particle size. In contrast, Pd3Re5-SI has lower CO uptake than Pd3-TA notwithstanding Re addition. The CO uptakes for Re5Pd3-SI and Re5Pd3-SI (350) are only ~10% lower than Pd3-TA. H2 chemisorption is strongly suppressed (relative to CO chemisorption) on the Pd3Re5-SI, Re5Pd3-SI, Re5Pd3-SI (350) and Pd1.5Re5-DCS catalysts suggesting Re coverage of the supported Pd particles. Re addition to Pd/Al2O3 catalysts is known to suppress H2 chemisorption [13,14], and we have provided evidence that Re blocks surface sites on Pd particles [21]. The H/CO ratios observed for the bimetallic catalysts in this work, except Pd3Re5-CI, are ~0.4 at 35°C and ~0.5 at 100°C consistent with suppression of H2 chemisorption. The chemisorptive properties of Pd3Re5-CI are more consistent with supported Pd than a bimetallic catalyst.
In general, the Kubelka-Munk (K-M) intensities of the CO DRIFT spectra are consistent with the CO chemisorption uptakes (μmol/gcat) of the catalysts. Catalysts prepared using Pd tetraammine (including the DCS) (Figure 4a) have more intense ν(CO) peaks than catalysts prepared from Pd(NO3)2 (Figure 4b). For Pd3-TA, the linear (atop) CO peak (~2080 cm-1) is more intense than the broad bridging CO band (~1930 cm-1) consistent with highly dispersed supported Pd [40,41,42]. The 1930-cm-1 band and its low-frequency tail (extending to 1700 cm-1) are associated with doubly and triply bridging CO species on Pd nanoparticles. The CO DRIFT spectrum of Re5Pd3-SI is closely similar albeit of lower intensity. A significant enhancement of the linear-to-bridging (L/B) ratio and a blueshift of the bridging CO band to ~1950 cm-1 are observed for Pd3Re5-SI. We infer that these trends indicate surface modification by Re adatoms leaving fewer adjacent Pd atoms to accommodate bridging CO species. The CO DRIFT spectrum of Pd1.5Re5-DCS is qualitatively similar, but the peak intensities are much lower consistent with its lower Pd loading. Only a small shoulder at ~2040 cm-1 assigned to CO linearly adsorbed on metallic Re particles is observed for these catalysts [38,43]. There are several potential explanations: [ReO4]- (or Re2O7) species spread over the γ-Al2O3 surface during calcination [54], and reduction of isolated [ReO4]- species is incomplete at 400°C. Alternatively, re-oxidation of Re metal centers (single atoms, clusters) can occur during the He purge at 400°C after in situ reduction [38,44].
The CO DRIFT spectrum of Pd3-N comprises linear and bridging bands (Figure 4b), and the latter are dominant. The prominent 1990-cm-1 peak corresponds to bridging CO on low-index surface planes [e.g., (100) and (111)] of supported Pd crystallites [41,42]. The strong shoulder at 1930 cm-1 is equivalent to that observed for supported Pd nanoparticles (Figure 4a). For Pd1-N, conversely, there is only a medium shoulder at 1990 cm-1, and the 1930-cm-1 bridging band is more prominent. The L/B ratio is also higher consistent with its higher dispersion. The CO DRIFT spectrum of Pd3Re5-CI contains strong peaks at 2080 and 1990 cm-1 assigned to linear and doubly bridging CO, and the L/B ratio is higher when compared to Pd3-N. A medium-intensity peak at ~2040 cm-1 is assigned to linear CO on Re [38,43]. We infer that coverage of Pd particles by Re (or alloying) results in fewer adjacent Pd atoms exposed, thereby increasing the L/B ratio. The CO DRIFT spectrum of Re5Pd3N-SI is qualitatively similar with linear and bridging Pd-CO bands and a small linear Re-CO peak at ~2040 cm-1.
Low-magnification HAADF-STEM images of Pd3Re5-SI and Re5Pd3-CI catalyst particles (Figure 5) provide visual evidence of the much higher metal dispersion and more uniform distribution in the former. Small bright scattering centers (metal particles) are observed uniformly covering the γ-Al2O3 support in Figure 5a. In contrast, larger metal particles are seen near the particle edges in Figure 5b. Figure 6a displays a higher magnification HAADF image of Pd3Re5-CI showing two large (20-30 nm) and many small metal particles (<5 nm) distributed across the support. The composite EDX image (Figure 6b) clearly identifies the small particles as Re, whereas the two large particles (crystallites) contain primarily Pd. The intense yellow pixels associated with the Pd particles result from superposition of red (Pd) and green (Re) pixels. Although this image provides no depth resolution, it is clear that there are patches of Re (or ReOx) on the larger Pd particles. Based on the TPHD results for Pd3Re5-CI (strong suppression of bulk hydride formation), it is probable that the larger bimetallic particles are alloyed. Much smaller (<5 nm) segregated Re and Pd particles are found in other regions of the γ-Al2O3 support, as illustrated in Figure 6c,d.
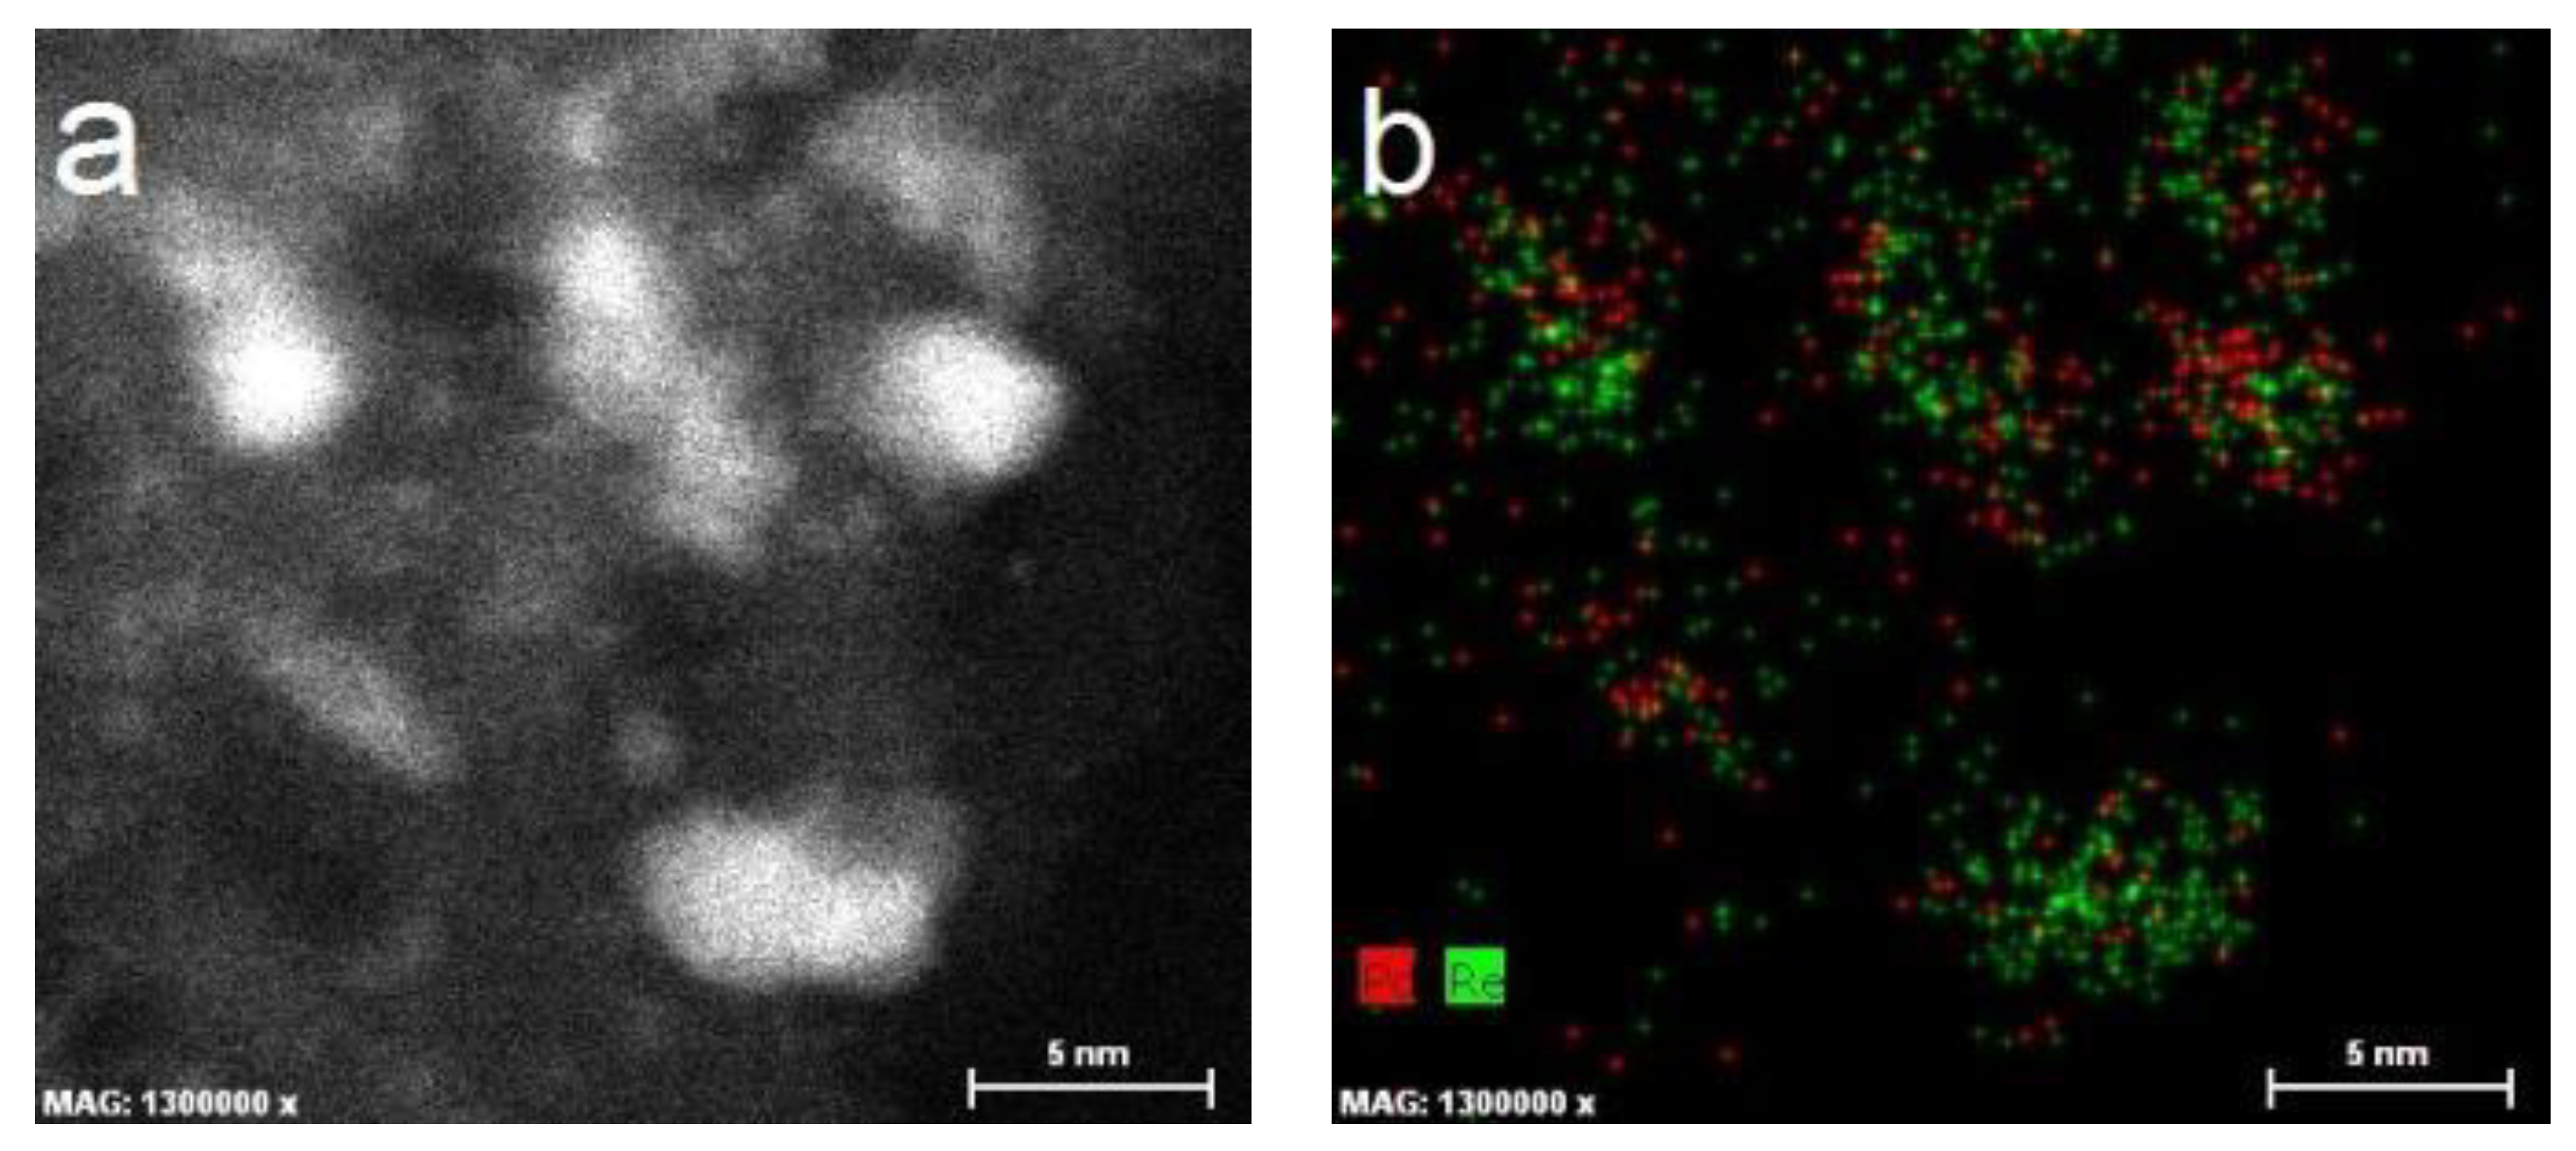
The HAADF image and EDX maps of another Re5Pd3-SI particle (Figure 7) reveal remarkably uniform distributions of Pd and Re nanoparticles on the γ-Al2O3 support. The Pd particles appear discrete, whereas the Re coverage appears nearly continuous. The supported nanoparticles are <5 nm in size, as seen in the high magnification HAADF image in Figure 8a. The EDX map (Figure 8b) suggests that Pd and Re are segregated within the supported bimetallic nanoparticles—consistent with the TPHD results indicating no suppression of hydride formation.
2.2. Furfural hydrogenation catalysis
Three reaction pathways were inferred for furfural conversion over Pd/Al2O3 and PdRe/Al2O3 catalysts under the investigated conditions (Scheme 1). Ring-opening products (e.g., butanols and pentanols) were not observed. Furan (F), furfuryl alcohol (FAL), and tetrahydrofurfuryl alcohol (THFAL) were identified as primary products over Pd/Al2O3 via the Delplot method [21]. Furfural decarbonylation (DCN) produces F and CO. Selective hydrogenation (HYD) to FAL is the desired pathway. A third pathway is direct hydrodeoxygenation (HDO) to 2-methylfuran (2-MF). 2-MF was a primary product only over Pd3-N and the Re-containing catalysts. Selectivity to other ring-saturation products: tetrahydrofuran (THF) and 2-methyl THF (2-MTHF) was generally low indicating secondary products. Re5-N was essentially inactive relative to the Pd/Al2O3 and PdRe/Al2O3 catalysts.
Product formation rates for the Pd/Al2O3 and PdRe/Al2O3 catalysts are shown in Figure 9; the total bar height represents the furfural consumption rate for each catalyst. The Pd/Al2O3 catalysts (irrespective of precursor) and Pd3Re5-CI (Figure 9a) were far less active than the bimetallic catalysts prepared from the DCS and by SI (Figure 9b). The higher activities of the latter are likely because of their higher metal dispersions. The similar activities of the Pd3-N and Pd3-TA catalysts are surprising given the much higher dispersion of the latter. Furan was the main product over the Pd1-N and Pd3-N catalysts, and the order of relative abundance was: F + THF > FAL + THFAL >> 2-MF. Over Pd3-TA, the order was FAL + THFAL > F + THF > 2-MF showing a modest preference for aldehyde group HYD over DCN. Interestingly, F production was suppressed markedly over all the bimetallic catalysts regardless of activity. For example, the Pd3-N and Pd3Re5-CI catalysts both have similar low activities, but the latter has much greater FAL selectivity and far lower F selectivity. All the bimetallic catalysts strongly favored HYD over DCN with the order of relative product abundance: FAL + THFAL >> F + THF ~ 2-MF. This product distribution is more consistent with Re (rather than Pd) catalysis. The DCS-derived catalyst was most selective to FAL (78.3%) and exhibited 93% selectivity to FAL + THFAL. The Pd3Re5-SI and Re5Pd3-SI (350) catalysts had similar activities and FAL selectivities indicating that the impregnation sequence is relatively unimportant. The Re5Pd3-SI catalyst (that was calcined at 400°C for 3 h after each impregnation step) was more active but less selective to FAL; however, its FAL + THFAL selectivity (81%) was comparable to the other SI catalysts. The Pd3Re5-SI catalyst prepared from the Pd(NH3)4(NO3)2 precursor was more active and more selective than a SI catalyst derived from Pd(NO3)2 reported previously [21]. The Re-first SI and the DCS-derived catalysts are modestly (~20%) more active with ~10% greater FAL selectivity than those reported previously [21]. We speculate that this could be a promoter effect of the Group I or IIA metal impurities in γ-Al2O3 (A) [11].
Turnover frequencies (TOFs) for furfural consumption at 150°C are given in Table 4. The TOF(CO) values (based on CO adsorption isotherms measured at 35°C) are in excellent agreement for the Pd1-N and Pd3-N catalysts and in good agreement with those previously reported for Pd/Al2O3 catalysts [21]. Moreover, their TOF(H) values (per H atom based on H2 dissociative chemisorption at 35°C) are also in excellent agreement (with each other and the TOF(CO) values). Overall, the TOF(CO) values of the PdRe/Al2O3 catalysts (except Pd3Re5-CI) are 2-5 times higher than those of the Pd/Al2O3 catalysts. TOF(H) values (per H atom based on H2 dissociative chemisorption at 100°C) are approximately two times higher than TOF(CO) values over the PdRe/Al2O3 catalysts (except Pd3Re5-CI). The TOFs for Pd3Re5-CI are lower and in better agreement with those of the Pd/Al2O3 catalysts. The TOFs for Pd3Re5-SI agree very closely with those reported previously for an analogous catalyst prepared using a 3 wt.% Pd/Al2O3 catalyst derived from Pd(NO3)2 [21]. Finding equivalent TOFs despite large differences in Pd dispersion validates using CO and H2 chemisorption for counting active sites. Both SI methods produce highly active and selective catalysts. The highly dispersed PdRe/Al2O3 prepared by impregnation with the DCS exhibits the highest intrinsic activity and FAL selectivity. We infer that intimate contact between supported Pd and Re nanoparticles results in suppression of Pd-catalyzed decarbonylation and creates Pd-Re sites with high intrinsic activity. Our results are consistent with the proposal that Pd facilitates the reaction via H2 dissociation and spillover of H species onto Re sites [22].
3. Materials and Methods
3.1. Catalyst Preparation
The γ-Al2O3 support (BET surface area and total pore volume of 217 m2/g and 0.47 cm3/g, respectively) was purchased from Strem Chemicals. Elemental analysis by inductively coupled plasma-optical emission spectrometry (ICP-OES) revealed the following alkali metal and alkaline earth metal impurities: 213 ppm Na, 24.0 ppm Mg, 8.32 ppm K, and 132 ppm Ca. The mono- and bimetallic catalysts were prepared by IW impregnation, except for the Pd1.5Re5-DCS catalyst which was prepared by wet impregnation with [Pd(NH3)4(ReO4)2], as described elsewhere [38]. For the bimetallic catalysts, 3 different IW methods and precursors were employed: (i) co-impregnation using Pd(NO3)2 and HReO4, (ii) Re-first sequential impregnation using NH4ReO4 and [Pd(NH3)4(NO3)2], and (iii) HReO4 addition to a reduced and passivated Pd/Al2O3 catalyst. These methods are described in more detail elsewhere [21]. For comparison, a catalyst (Re5Pd3N-SI) was also prepared by Re-first sequential impregnation using HReO4 and Pd(NO3)2. The Pd tetraammine nitrate, Pd(NO3)2, and Pd(NO3)2 + HReO4 impregnation solutions were pH 10, pH 7, and pH 1, respectively. The Typically, after each impregnation step, catalysts were dried at 110°C overnight, crushed with mortar and pestle, and calcined at 400°C for 3 h in flowing zero-grade air. The Pd1.5Re5-DCS and Pd3Re5-SI catalysts were not calcined. All catalysts were stored in a desiccator prior to use. ICP-OES analysis for Pd and Re was performed by Eastman Chemical Company (Kingsport, TN).
3.2. TPR and TPHD
TPR and TPHD experiments were performed using a Micromeritics 2920 Autochem II equipped with a thermal conductivity detector (TCD) for monitoring H2 uptake/evolution. Catalyst samples (100 mg) were cooled to -50°C in ultra-high purity He (National Welders), and the feed gas was switched to 5% H2/Ar (certified mixture, Machine and Welding Supply). Both gases were purified using inline H2O/O2 traps (Oxilab). After waiting for TCD baseline to stabilize, the sample was heated at 10°C/min to 400°C and held for 1 h. Select Re-containing catalysts were heated to 800°C to ensure complete reduction was achieved. After TPR to 400°C, Pd-containing catalysts were cooled to -50°C in 5% H2/Ar and purged with Ar. Subsequently, TPHD spectra were measured using the TCD and a temperature ramp of 10°C/min to 400°C in flowing Ar.
3.3. CO and H2 Chemisorption
Volumetric H2 and CO chemisorption measurements were performed using a Micromeritics ASAP 2020c instrument. Each catalyst was reduced in situ in flowing research-grade H2 (50 sccm) at 400°C for 1 h, evacuated at 400°C for 2 h using a turbomolecular pump, then cooled to 100°C for H2 analysis. Adsorption isotherms were measured before and after evacuation at the analysis temperature; the difference was used to determine strongly adsorbed species. The H2 analysis was repeated at 70°C and 35°C, and the sample was evacuated at 300°C for 1 h between each analysis. Subsequently, CO adsorption isotherms were measured at 35°C.
3.4. CO DRIFTS
DRIFT spectra of adsorbed CO were measured on a Bruker Vertex 70 FTIR with a liquid N2-cooled MCT detector using a Harrick Praying Mantis cell. Prior to measurement, samples were reduced in in situ the DRIFTS cell at 400°C for 1 h in 40 sccm H2 (research grade, National Welders), then purged in He at 40 sccm (UHP, National Welders) for 1 h before cooling to 20°C. Pulses of 5% CO/He (certified, National Welders) were administered five at a time at 20°C until no further changes in spectra were observed. Scans of the reduced catalyst (128 scans at 4 cm-1 resolution) at 20°C in He were subtracted from scans following pulses of CO in order to subtract out signal from H2O.
3.5. Raman Spectroscopy
Raman spectra of the powder samples were recorded on a Horiba Jobin-Yvon LabRAM HR VIS high-resolution confocal Raman microscope using a He-Ne laser (632 nm) excitation source and 100X objective. The laser power was 20 mW, and the confocal hole size was 800 μm. The instrument was calibrated using a Si wafer at 520.7 cm-1. The exposure time was 15 s at a resolution of 0.1 cm-1. Catalyst samples were removed the storage desiccator and handled and scanned in ambient air. No spectral degradation was observed during data collection. Raman bands due to the γ-Al2O3 support were removed by spectral subtraction.
3.6. HAADF-STEM-EDX
High-resolution STEM imaging was performed on an aberration-corrected FEI Titan 80-300 electron microscope. The microscope is equipped with a high-angle annular dark field (HAADF) detector and SuperX EDS system comprising four Bruker silicon drift detectors. Samples were reduced ex situ at 400°C, and handled under N2, except for brief exposure during insertion into the microscope. The powder was supported on carbon-coated copper grids (Ted Pella).
3.7. Furfural hydrogenation
Furfural hydrogenation activity was tested in a continuous flow packed-bed reactor system at 150°C and atmospheric pressure. The catalyst bed comprised 50-250 mg catalyst powder and 1.25 g quartz chips and was supported by quartz wool in a 0.5" stainless steel tube. Catalyst bed temperature was measured by a Type-K thermocouple (Omega) in contact with the catalyst inside the tube. Furfural was fed by a syringe pump, vaporized in a stream of 100% H2, and passed over the catalyst bed. The effluent was monitored by two on-line gas chromatographs (GCs): GC-TCD (SRI 8610C) with a ShinCarbon ST100 (2 m x 1.0 mm ID) column (Restek) measured CO, CH4 and CO2; a GC-FID (Shimadzu 2010) with an EconoCap-1 column (30 m x 0.53 mm ID, Alltech) measured all other products.
4. Conclusions
Highly dispersed PdRe/Al2O3 catalysts for selective hydrogenation of furfural combine synergistically: (1) inhibition of Pd-catalyzed decarbonylation by Re and (2) promotion of Re hydrogenation activity via intimate contact with Pd. Optimum catalysts comprise supported bimetallic nanoparticles; bulk alloy formation is not required. A low-dispersion PdRe/Al2O3 catalyst containing supported Pd-Re alloy crystallites exhibited a furfural TOF similar to Pd/Al2O3 albeit with higher FAL selectivity.
Acknowledgements
This work was funded by Eastman Chemical Company for funding through the Center of Excellence at North Carolina State University. ICP-OES analysis was performed by Eastman Chemical Company. The authors acknowledge the use of the Analytical Instrumentation Facility at NCSU, which is supported by the State of North Carolina and the National Science Foundation, and, in particular, Dr. Xiahan Sang for assistance with STEM-EDX.
References
- K.Y. Chen, S. Koso, T. Kubota, Y. Nakagawa, K. Tomishige, Chemoselective hydrogenolysis of tetrahydropyran-2-methanol to 1, 6-hexanediol over rhenium-modified carbon-supported rhodium catalysts. Chemcatchem, 2 (2010) 547-555. [CrossRef]
- S. Koso, Y. Nakagawa, K. Tomishige, Mechanism of the hydrogenolysis of ethers over silica-supported rhodium catalyst modified with rhenium oxide. J. Catal., 280 (2011) 221-229. https://doi.org/10.1016/j.jcat.2011.03.018. [CrossRef]
- M. Chia, Y.J. Pagan-Torres, D. Hibbitts, Q.H. Tan, H.N. Pham, A.K. Datye, M. Neurock, R.J. Davis, J.A. Dumesic, Selective hydrogenolysis of polyols and cyclic ethers over bifunctional surface sites on rhodium–rhenium catalysts. J. Am. Chem. Soc., 133 (2011) 12675-12689. https://doi.org/10.1021/ja2038358. [CrossRef]
- S. Koso, I. Furikado, A. Shimao, T. Miyazawa, K. Kunimori, K. Tomishige, Chem. Comm., (2009) 2035-2037.
- L. Ma, D.H. He, Z.P. Li, Promoting effect of rhenium on catalytic performance of Ru catalysts in hydrogenolysis of glycerol to propanediol. Catal. Comm., 9 (2008) 2489-2495. https://doi.org/10.1016/j.catcom.2008.07.009. [CrossRef]
- L. Ma, D.H. He, Hydrogenolysis of glycerol to propanediols over highly active Ru–Re bimetallic catalysts. Top. Catal., 52 (2009) 834-844. https://doi.org/10.1007/s11244-009-9231-3. [CrossRef]
- Y. Takeda, Y. Nakagawa, K. Tomishige, Catal. Sci. Tech., 2 (2012) 2221-2223.
- Shimao, S. Koso, N. Ueda, Y. Shinmi, I. Furikado, K. Tomishige, Promoting Effect of Re Addition to Rh/SiO2 on Glycerol Hydrogenolysis. Chem. Lett., 38 (2009) 540-541. https://doi.org/10.1246/cl.2009.540. [CrossRef]
- S. Koso, H. Watanabe, K. Okumura, Y. Nakagawa, K. Tomishige, J. Phys. Chem. C, 116 (2012) 3079-3090.
- B.K. Ly, D.P. Minh, C. Pinel, M. Besson, B. Tapin, F. Epron, C. Especel, Effect of Addition Mode of Re in Bimetallic Pd–Re/TiO2 Catalysts Upon the Selective Aqueous-Phase Hydrogenation of Succinic Acid to 1,4-Butanediol. Top. Catal., 55 (2012) 466-473. https://doi.org/10.1007/s11244-012-9813-3. [CrossRef]
- M.A. Mabry, W.W. Prichard, S.B. Ziemecki, in, E. I. du Pont de Nemours and Company, United States Patent 4550185, 1985.
- M. Kitson, P.S. Williams, in: U.S.P. Office (Ed.), The British Petroleum Company, United States Patent 5149680, 1992.
- A. Malinowski, W. Juszczyk, M. Bonarowska, J. Pielaszek, Z. Karpinski, Pd-Re/Al2O3: Characterization and catalytic activity in hydrodechlorination of CCl2F2. J. Catal., 177 (1998) 153-163. https://doi.org/10.1006/jcat.1998.2062. [CrossRef]
- M. Bonarowska, A. Malinowski, Z. Karpinski, Hydrogenolysis of C–C and C–Cl bonds by Pd–Re/Al2O3 catalysts. Appl. Catal. A, 188 (1999) 145-154. https://doi.org/10.1016/S0926-860X(99)00241-0. [CrossRef]
- W. Juszczyk, Z. Karpinski, Hydrocarbon reactions on Pd–Re/Al2O3 catalysts. App. Catal. A, 206 (2001) 67-78. https://doi.org/10.1016/S0926-860X(00)00584-6. [CrossRef]
- G. Meitzner, G.H. Via, F.W. Lytle, J.H. Sinfelt, Structure of bimetallic clusters. Extended x-ray absorption fine structure (EXAFS) of Pt–Re and Pd–Re clusters. J. Chem. Phys., 87 (1987) 6354-6363. https://doi.org/10.1063/1.453465. [CrossRef]
- S.B. Ziemecki, J.B. Michel, G.A. Jones, Hydride formation as a measure of alloying in bimetallic systems containing palladium. React. Sol., 2 (1986) 187-202. https://doi.org/10.1016/0168-7336(86)80082-1. [CrossRef]
- S.B. Ziemecki, G.A. Jones, J.B. Michel, Surface mobility of Re2O7 in the system Re7+Pd0γ-Al2O3. J. Catal., 99 (1986) 207-217. https://doi.org/10.1016/0021-9517(86)90213-7. [CrossRef]
- M.P. Latusek, B.P. Spigarelli, R.M. Heimerl, J.H. Holles, Correlation of H2 heat of adsorption and ethylene hydrogenation activity for supported Re@Pd overlayer catalysts. J. Catal., 263 (2009) 306-314. https://doi.org/10.1016/j.jcat.2009.02.022. [CrossRef]
- M.D. Skoglund, J.H. Holles, Overlayer Bimetallic Catalysts or Particle Size Effects? A Comparison of Re@Pd Catalysts with Different Particle Sizes. Catal. Lett., 143 (2013) 966-974. https://doi.org/10.1007/s10562-013-1052-0. [CrossRef]
- S.T. Thompson, H.H. Lamb, ACS Catal., 6 (2016) 7438-7447.
- J.D. Kammert, A. Chemburkar, N. Miyake, M. Neurock, R.J. Davis, Reaction Kinetics and Mechanism for the Catalytic Reduction of Propionic Acid over Supported ReOx Promoted by Pd. ACS Catal., 11 (2021) 1435-1455. https://doi.org/10.1021/acscatal.0c04328. [CrossRef]
- K. Otto, C.P. Hubbard, W.H. Weber, G.W. Graham, Raman spectroscopy of palladium oxide on γ-alumina applicable to automotive catalysts: Nondestructive, quantitative analysis; oxidation kinetics; fluorescence quenching. App. Catal. B, 1 (1992) 317-327. https://doi.org/10.1016/0926-3373(92)80056-6. [CrossRef]
- A. Baylet, P. Marecot, D. Duprez, P. Castellazzi, G. Groppi, P. Forzatti, In situ Raman and in situXRD analysis of PdO reduction and Pd° oxidation supported on γ-Al2O3catalyst under different atmospheres . Phys. Chem. Chem. Phys., 13 (2011) 4607-4613. https://doi.org/10.1039/C0CP01331E. [CrossRef]
- F.D. Hardcastle, I.E. Wachs, J.A. Horsley, G.H. Via, The structure of surface rhenium oxide on alumina from laser raman spectroscopy and x-ray absorption near-edge spectroscopy. J. Mol. Catal., 46 (1988) 15-36. https://doi.org/10.1016/0304-5102(88)85081-8. [CrossRef]
- M.A. Vuurman, I.E. Wachs, In situ Raman spectroscopy of alumina-supported metal oxide catalysts. J. Phys. Chem., 96 (1992) 5008-5016. https://doi.org/10.1021/j100191a051. [CrossRef]
- D.S. Kim, I.E. Wachs, Surface rhenium oxide-support interaction for supported Re2O7 catalysts. J. Catal., 141 (1993) 419-429. https://doi.org/10.1006/jcat.1993.1151. [CrossRef]
- J.R. McBride, K.C. Hass, W.H. Weber, Resonance-Raman and lattice-dynamics studies of single-crystal PdO. Phys. Rev. B, 44 (1991) 5016-5028. https://doi.org/10.1103/PhysRevB.44.5016. [CrossRef]
- S.C. Su, J.N. Carstens, A.T. Bell, A Study of the Dynamics of Pd Oxidation and PdO Reduction by H2and CH4. J. Catal., 176 (1998) 125-135. https://doi.org/10.1006/jcat.1998.2028. [CrossRef]
- A.S. Mamede, G. Leclercq, E. Payen, P. Granger, J. Grimblot, In situ Raman characterisation of surface modifications during NO transformation over automotive Pd-based exhaust catalysts. J. Mol. Struc., 651 (2003) 353-364. https://doi.org/10.1016/S0022-2860(03)00111-X. [CrossRef]
- T. Arai, T. Shima, T. Nakano, J. Tominaga, Thermally-induced optical property changes of sputtered PdOx films. Thin Sol. Films, 515 (2007) 4774-4777. https://doi.org/10.1016/j.tsf.2006.11.040. [CrossRef]
- L. Jiao, J.R. Regalbuto, The synthesis of highly dispersed noble and base metals on silica via strong electrostatic adsorption: I. Amorphous silica. J. Catal., 260 (2008) 329-341. https://doi.org/10.1016/j.jcat.2008.09.022. [CrossRef]
- J. Okal, L. Kepinski, L. Krajczyk, W. Tylus, Oxidation and redispersion of a low-loaded Re/γ-Al2O3 catalyst. J. Catal., 219 (2003) 362-371. https://doi.org/10.1016/S0021-9517(03)00165-9. [CrossRef]
- C. Sumner, W. Burchett, Developments in the Pd Catalyzed Hydrogenation of Oxygenated Organic Compounds. Top. Catal., 55 (2012) 480-485. https://doi.org/10.1007/s11244-012-9820-4. [CrossRef]
- J.A. McCaulley, In-situ X-ray absorption spectroscopy studies of hydride and carbide formation in supported palladium catalysts. J. Phys. Chem., 97 (1993) 10372-10379. https://doi.org/10.1021/j100142a018. [CrossRef]
- B. Predel, O.E. Madelung, in: Landolt-Börnstein - Group IV Physical Chemistry, SpringerMaterials.
- J.H. Sinfelt, Bimetallic Catalysts: Discoveries, Concepts, and Applications, John Wiley and Sons, 1983.
- S.T. Thompson, H.H. Lamb, Catalysts for selective hydrogenation of furfural derived from the double complex salt [Pd(NH3)4](ReO4)2 on γ-Al2O3. J. Catal., 350 (2017) 111-121. https://doi.org/10.1016/j.jcat.2017.03.019. [CrossRef]
- G.W. Chadzynski, H. Kubicka, Chemisorption of hydrogen and oxygen on γ-alumina-supported rhenium: Part 1. Chemisorption of hydrogen. Thermochim.Acta, 158 (1990) 353-367. https://doi.org/10.1016/0040-6031(90)80083-B. [CrossRef]
- J.B. Giorgi, T. Schroeder, M. Baumer, H.J. Freund, Study of CO adsorption on crystalline-silica-supported palladium particles. Surf. Sci., 498 (2002) L71-L77. https://doi.org/10.1016/S0039-6028(01)01756-3. [CrossRef]
- G. Agostini, R. Pellegrini, G. Leofanti, L. Bertinetti, S. Bertarione, E. Groppo, A. Zecchina, C. Lamberti, Determination of the Particle Size, Available Surface Area, and Nature of Exposed Sites for Silica−Alumina-Supported Pd Nanoparticles: A Multitechnical Approach. J. Phys. Chem. C, 113 (2009) 10485-10492. https://doi.org/10.1021/jp9023712. [CrossRef]
- T. Lear, R. Marshall, J.A. Lopez-Sanchez, S.D. Jackson, T.M. Klapotke, M. Baumer, G. Rupprechter, H.J. Freund, D. Lennon, J. Chem. Phys., 123 (2005) 13.
- W. Daniell, T. Weingand, H. Knozinger, Redox properties of Re2O7/Al2O3 as investigated by FTIR spectroscopy of adsorbed CO. J. Mol. Catal., 204 (2003) 519-526. https://doi.org/10.1016/S1381-1169(03)00334-0. [CrossRef]
- S.R. Bare, S.D. Kelly, F.D. Vila, E. Boldingh, E. Karapetrova, J. Kas, G.E. Mickelson, F.S. Modica, N. Yang, J.J. Rehr, Experimental (XAS, STEM, TPR, and XPS) and Theoretical (DFT) Characterization of Supported Rhenium Catalysts. J. Phys. Chem. C, 115 (2011) 5740-5755. https://doi.org/10.1021/jp1105218. [CrossRef]
Figure 1.
Raman spectra of Pd/Al2O3 and Re/Al2O3 catalysts (a) and PdRe/Al2O3 catalysts (b).
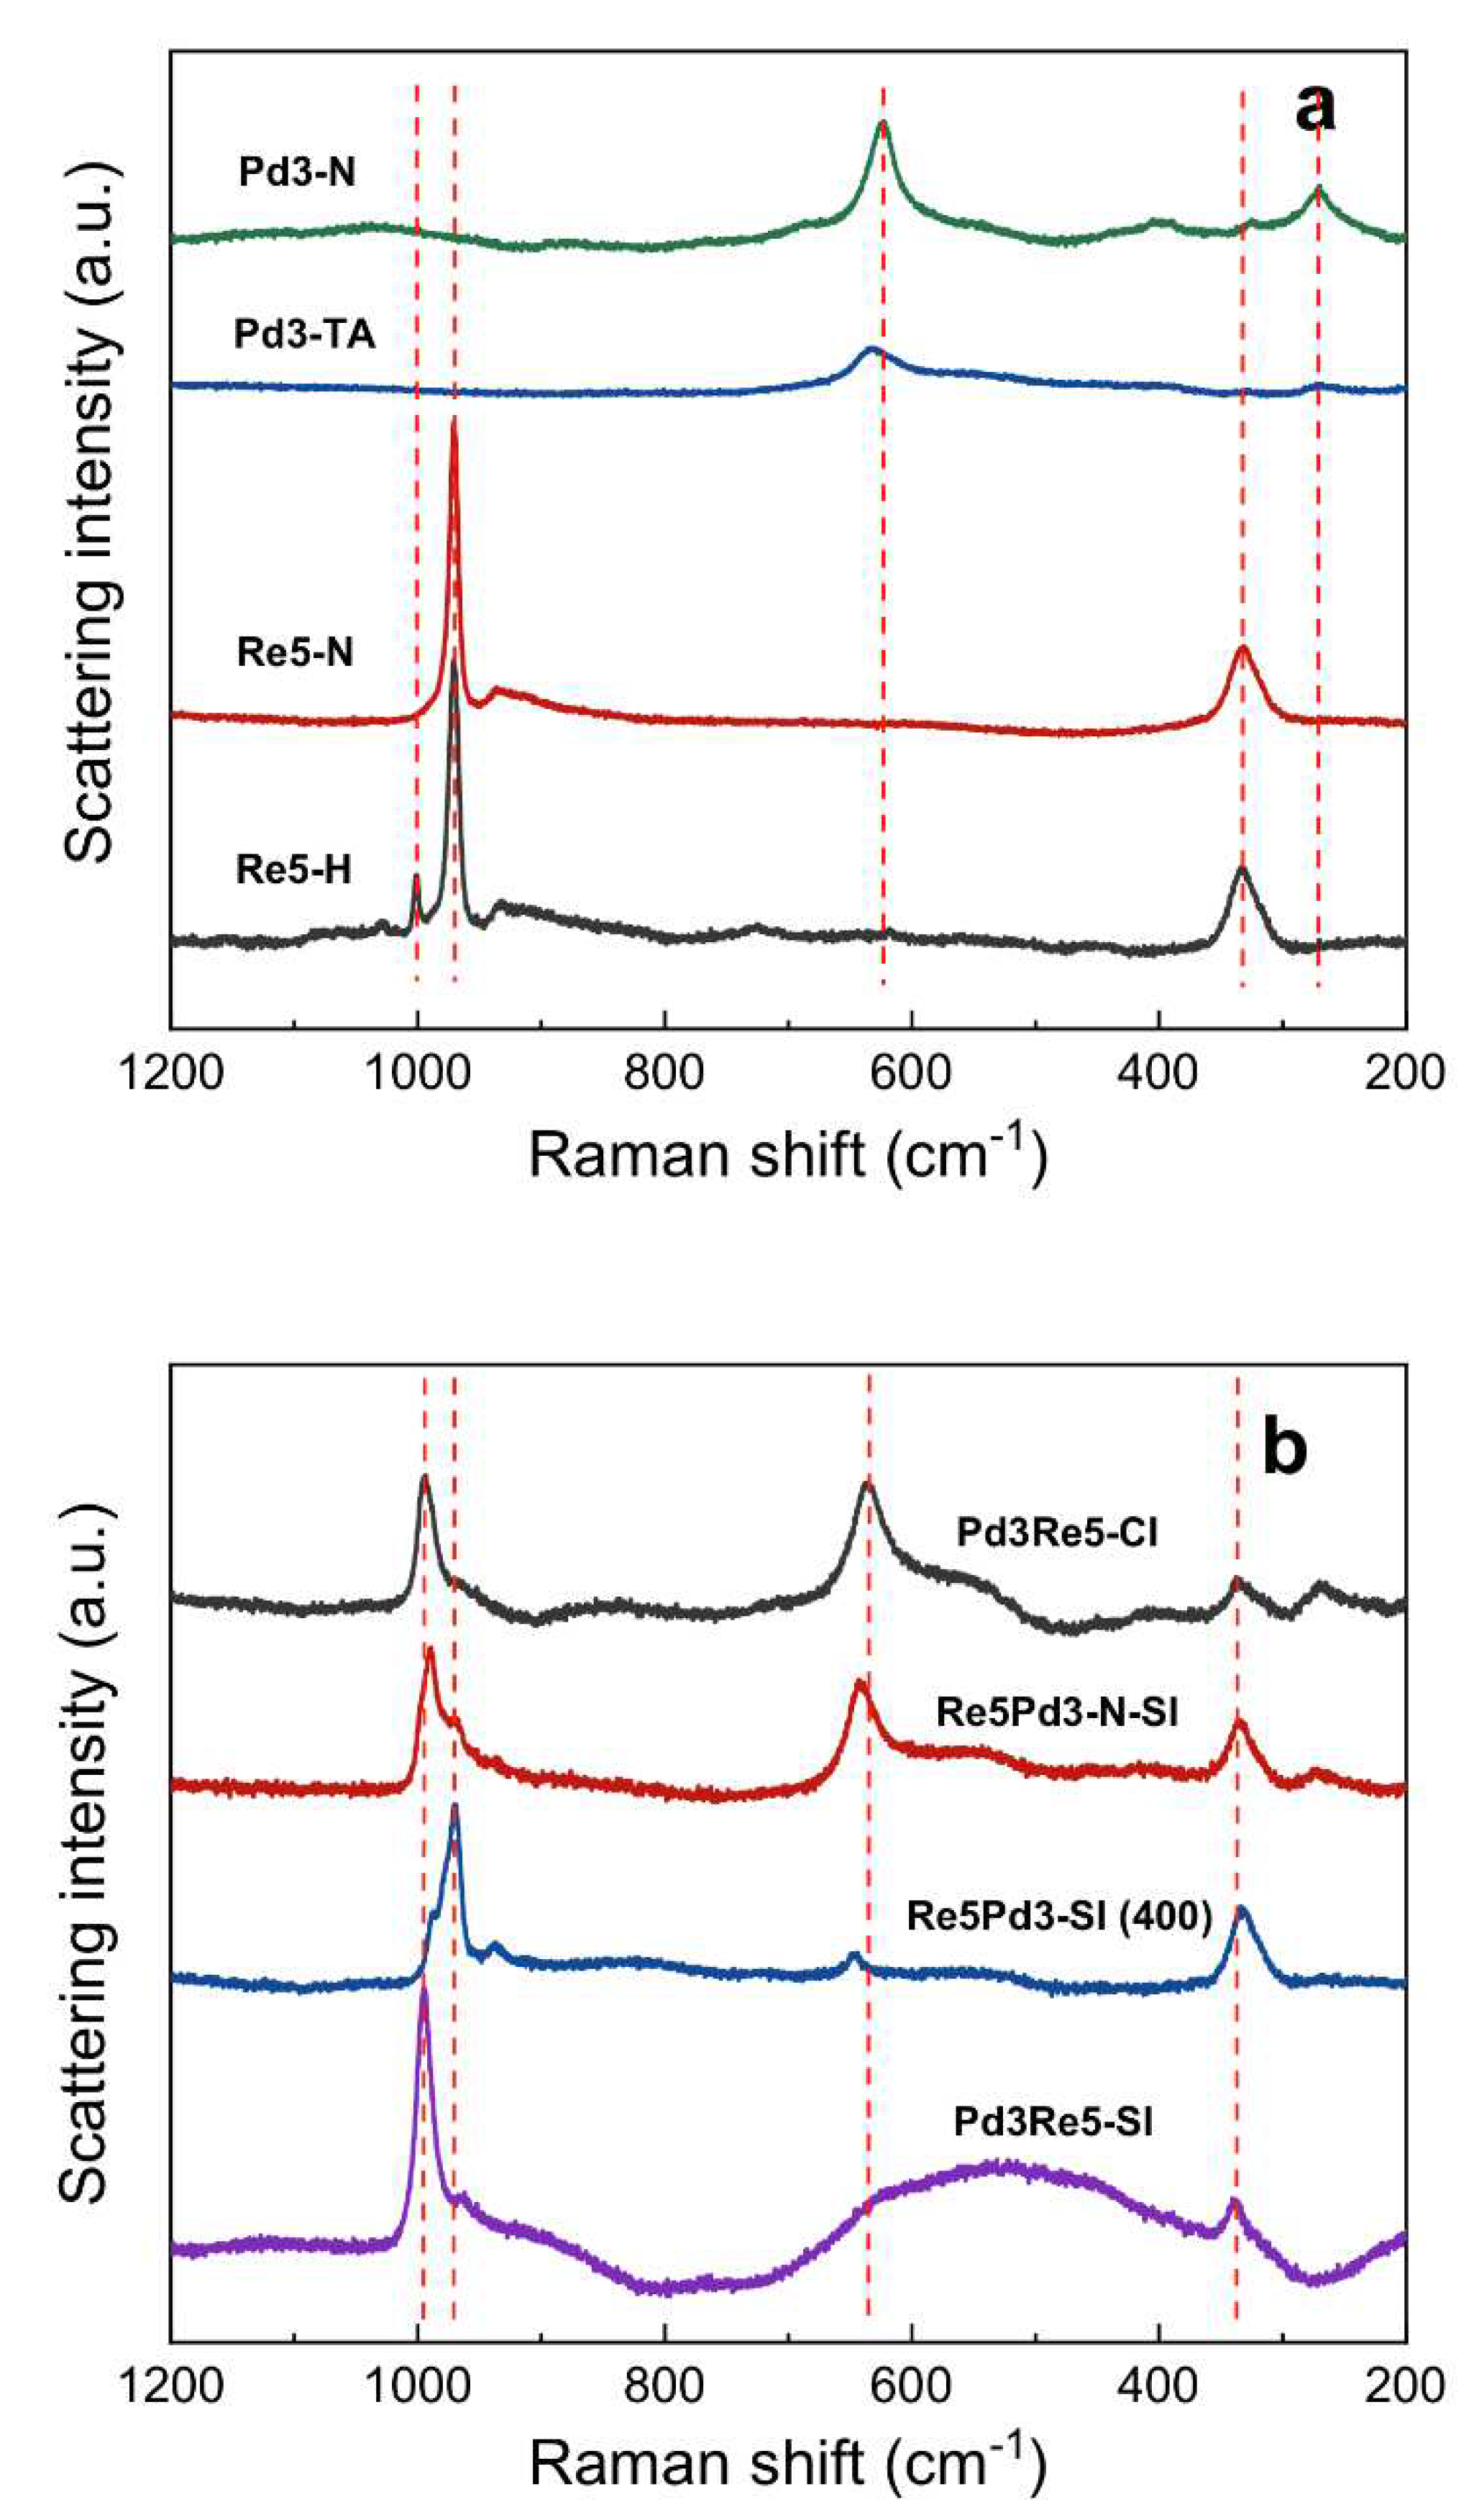
Figure 2.
TPR profiles of Pd/Al2O3, Re/Al2O3, and PdRe/Al2O3 catalysts. Pd3-N (b) is described in [21].
Figure 2.
TPR profiles of Pd/Al2O3, Re/Al2O3, and PdRe/Al2O3 catalysts. Pd3-N (b) is described in [21].
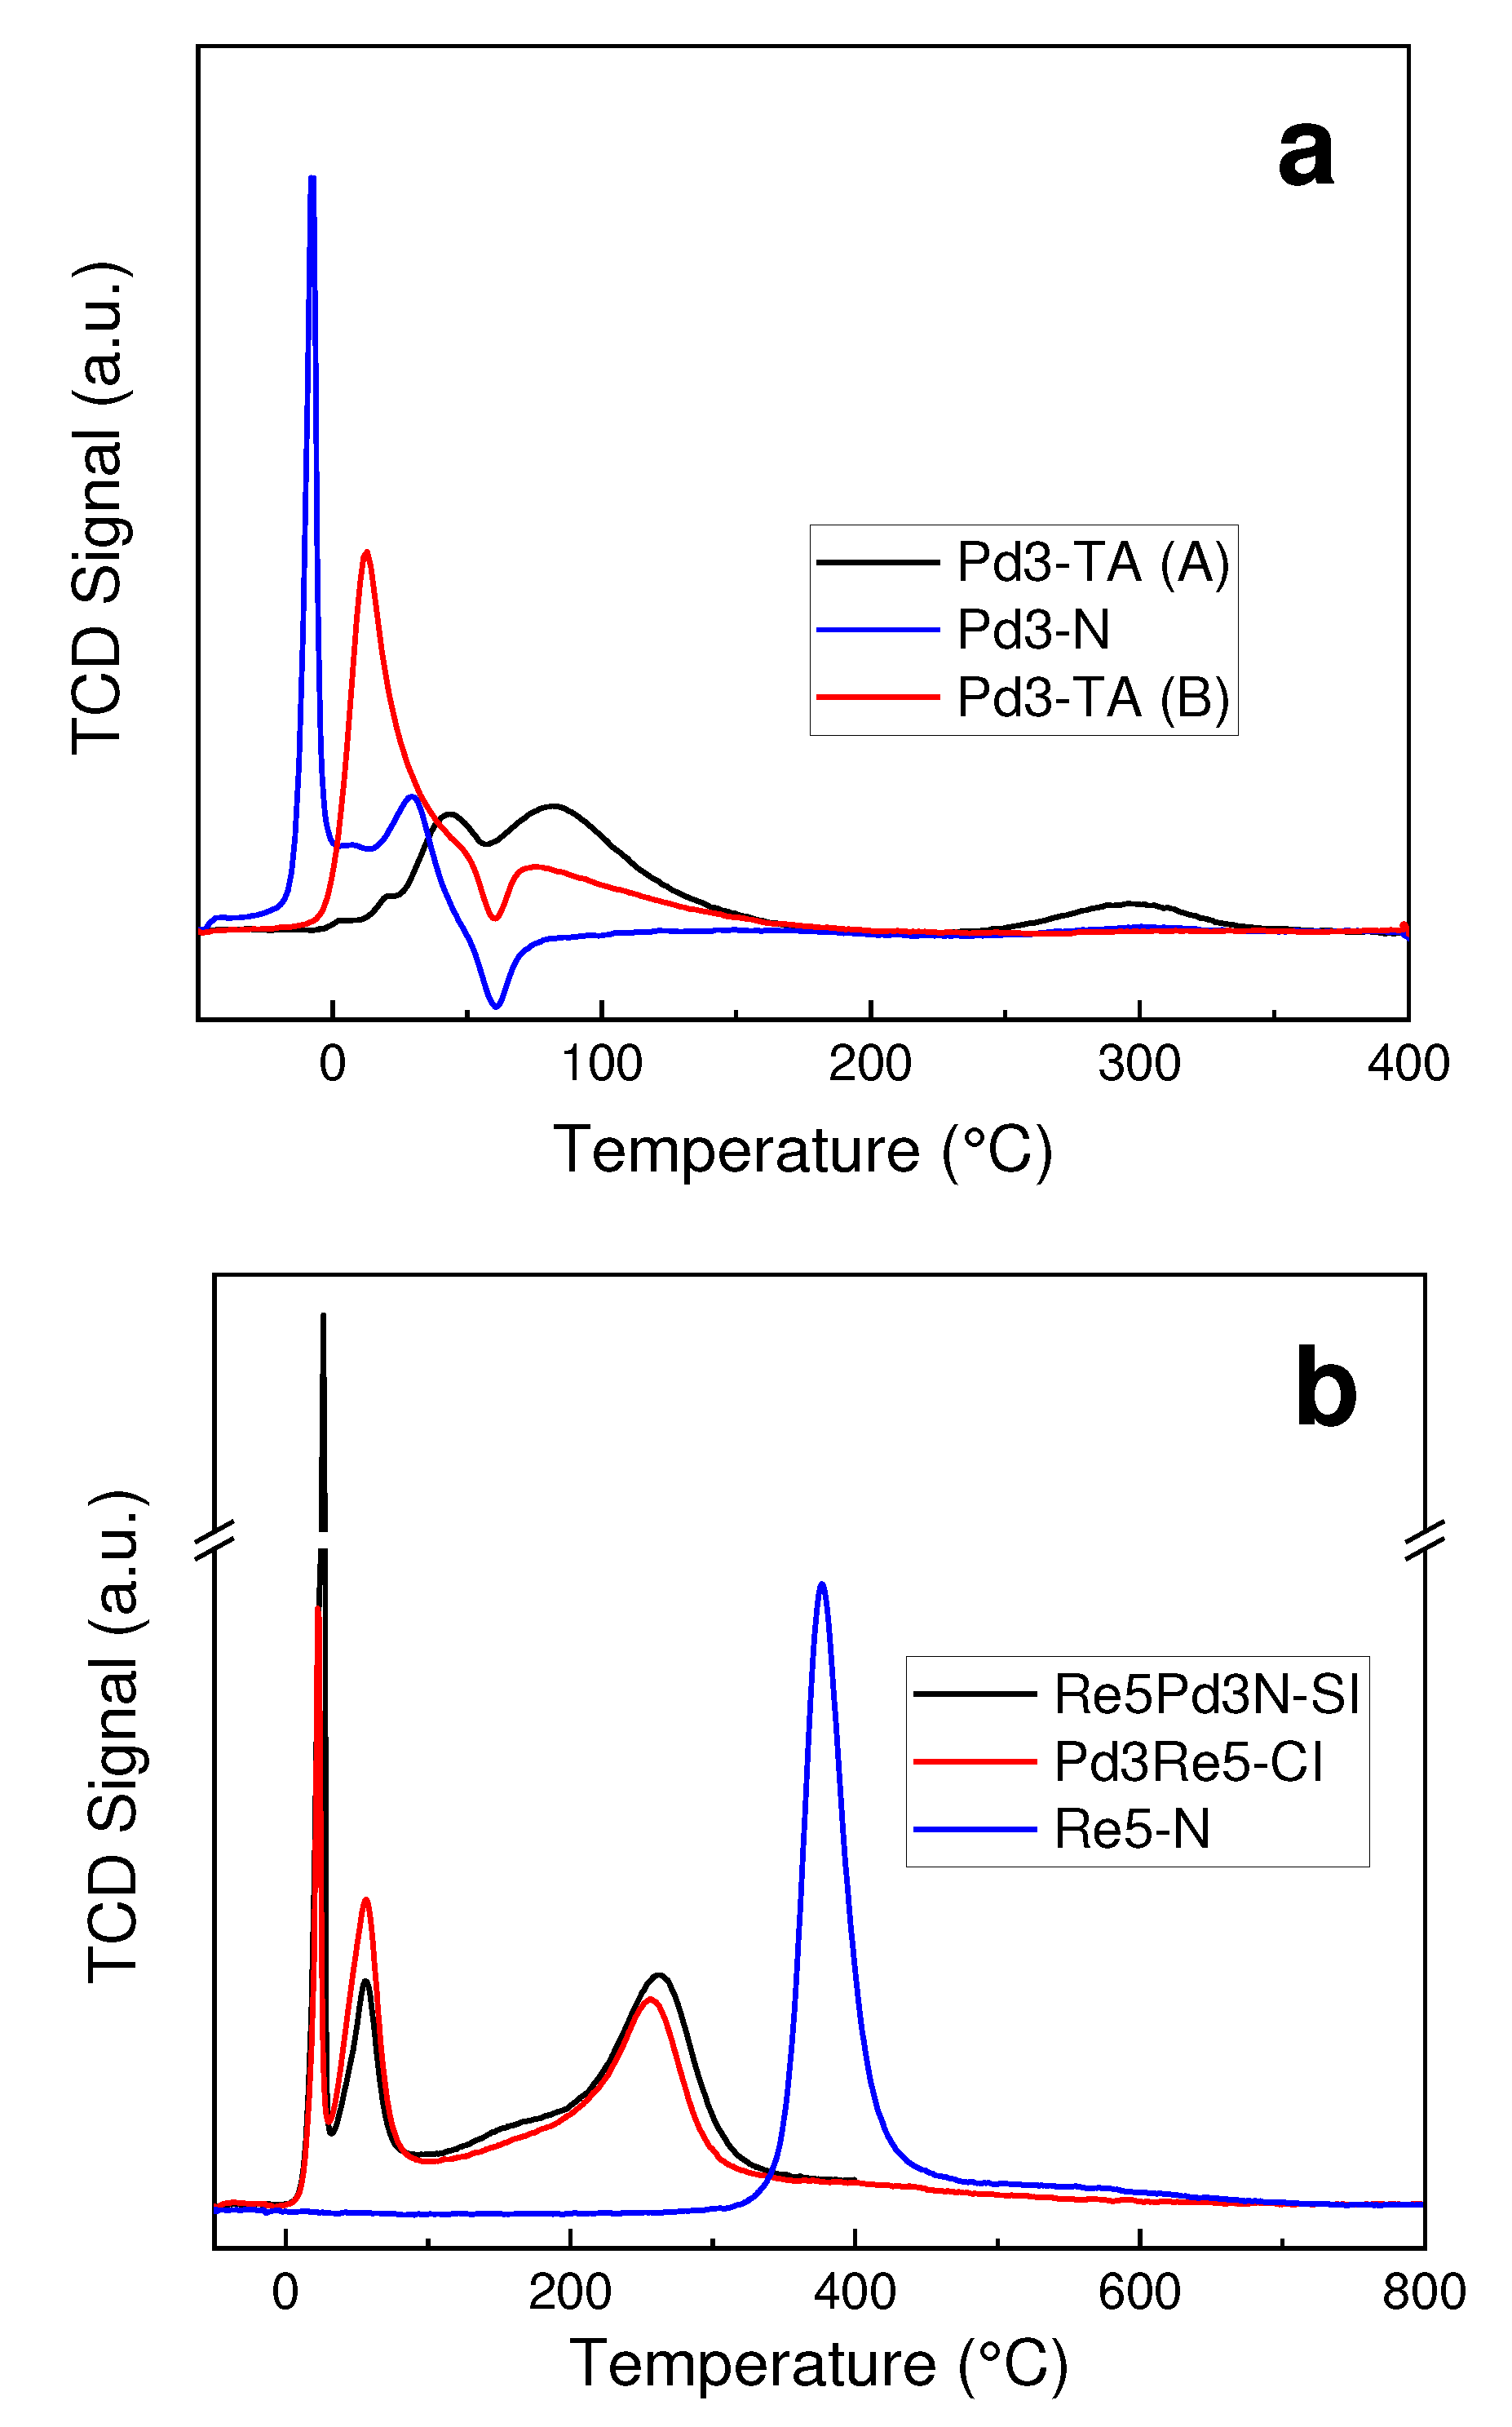
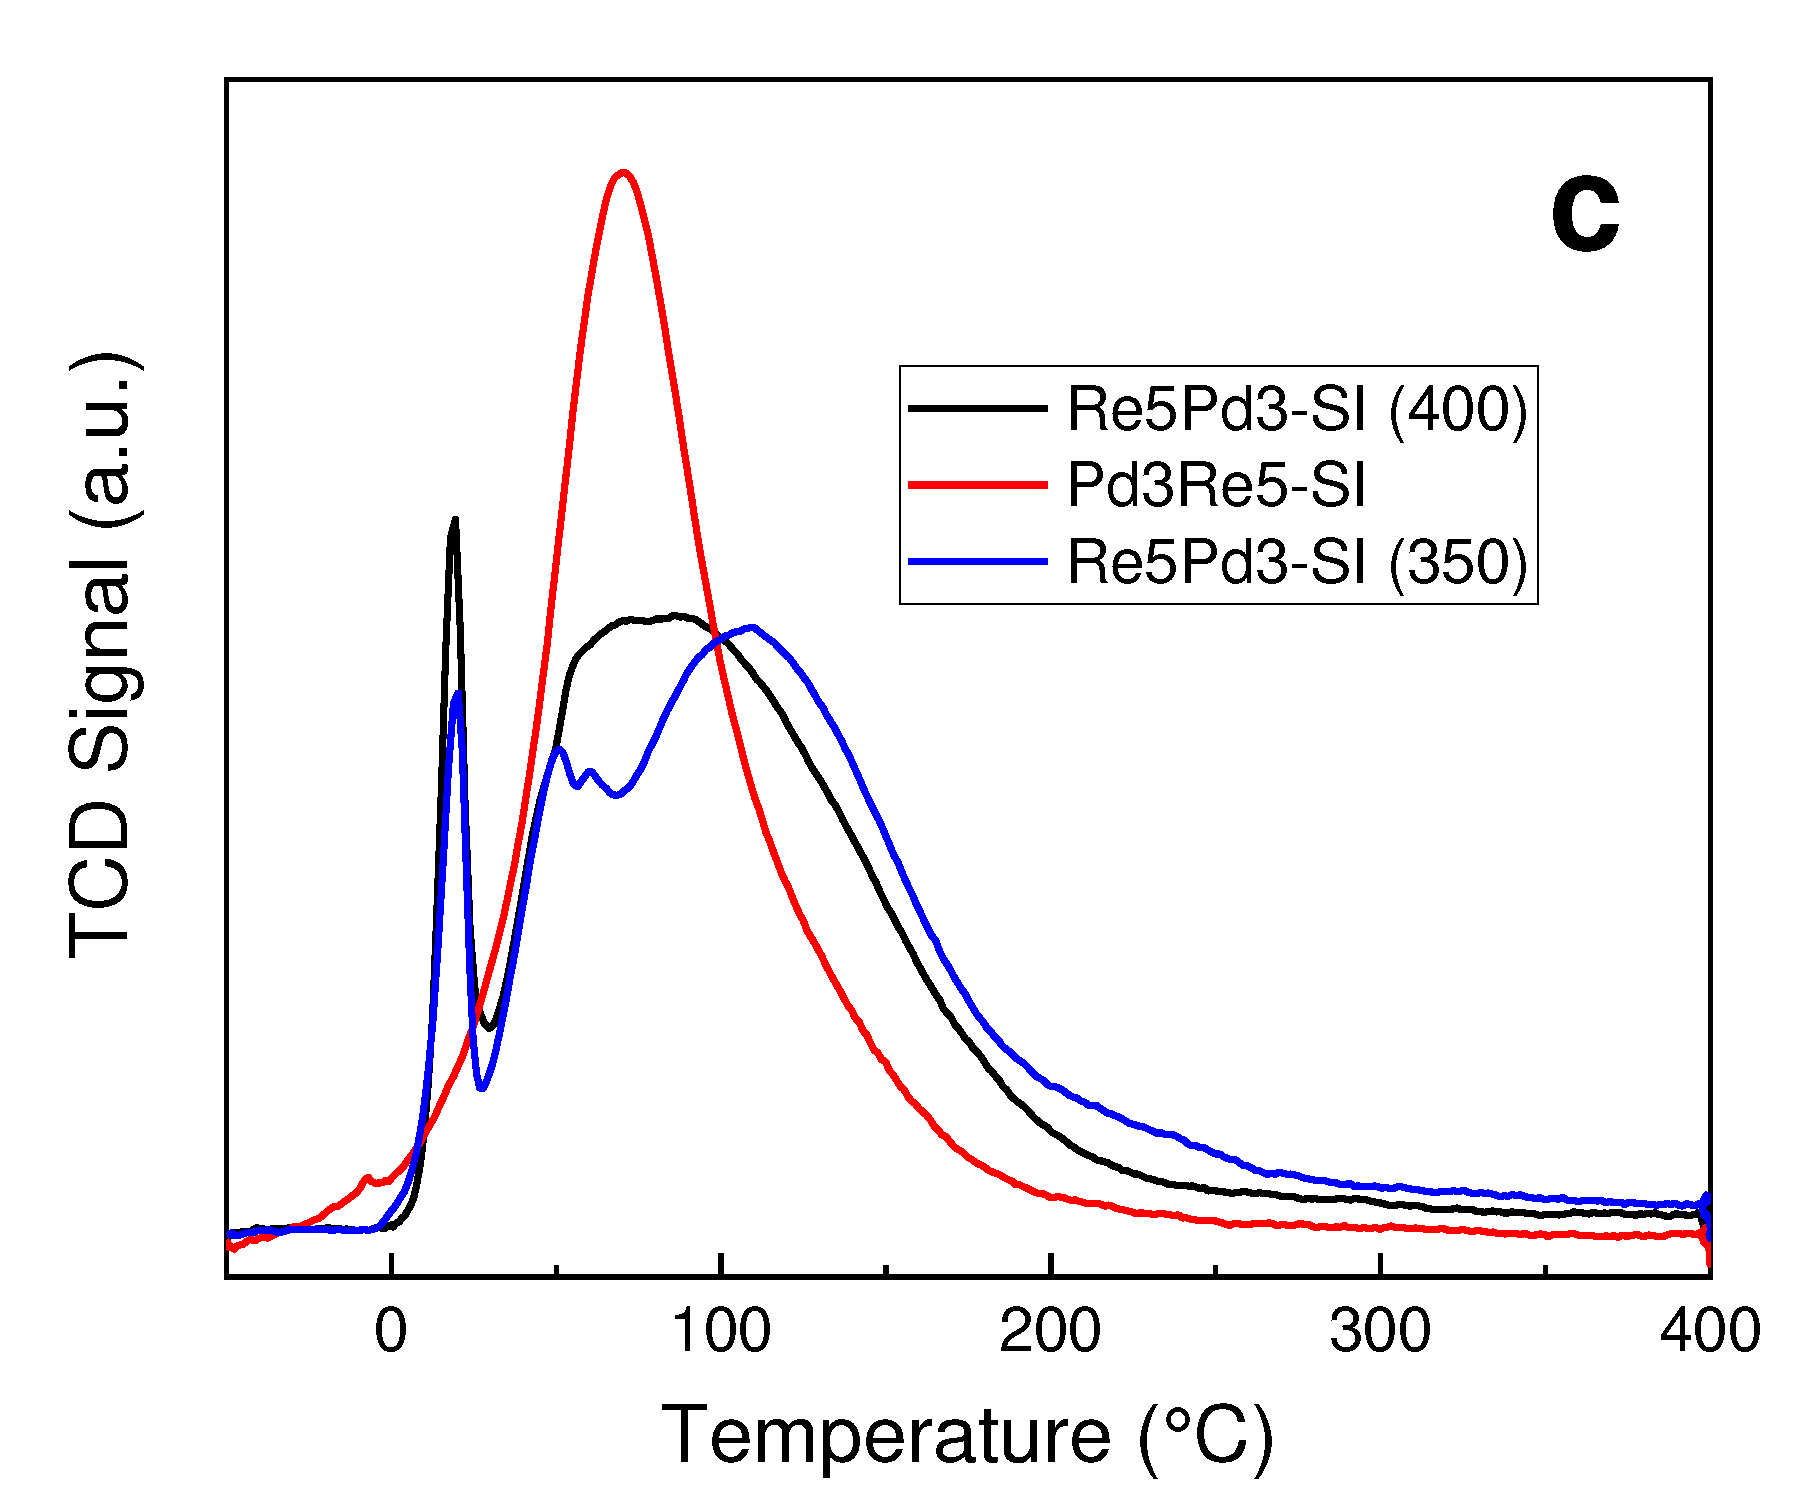
Figure 3.
TPHD spectra for catalysts after TPR to 400°C and cooling in 5% H2/Ar.
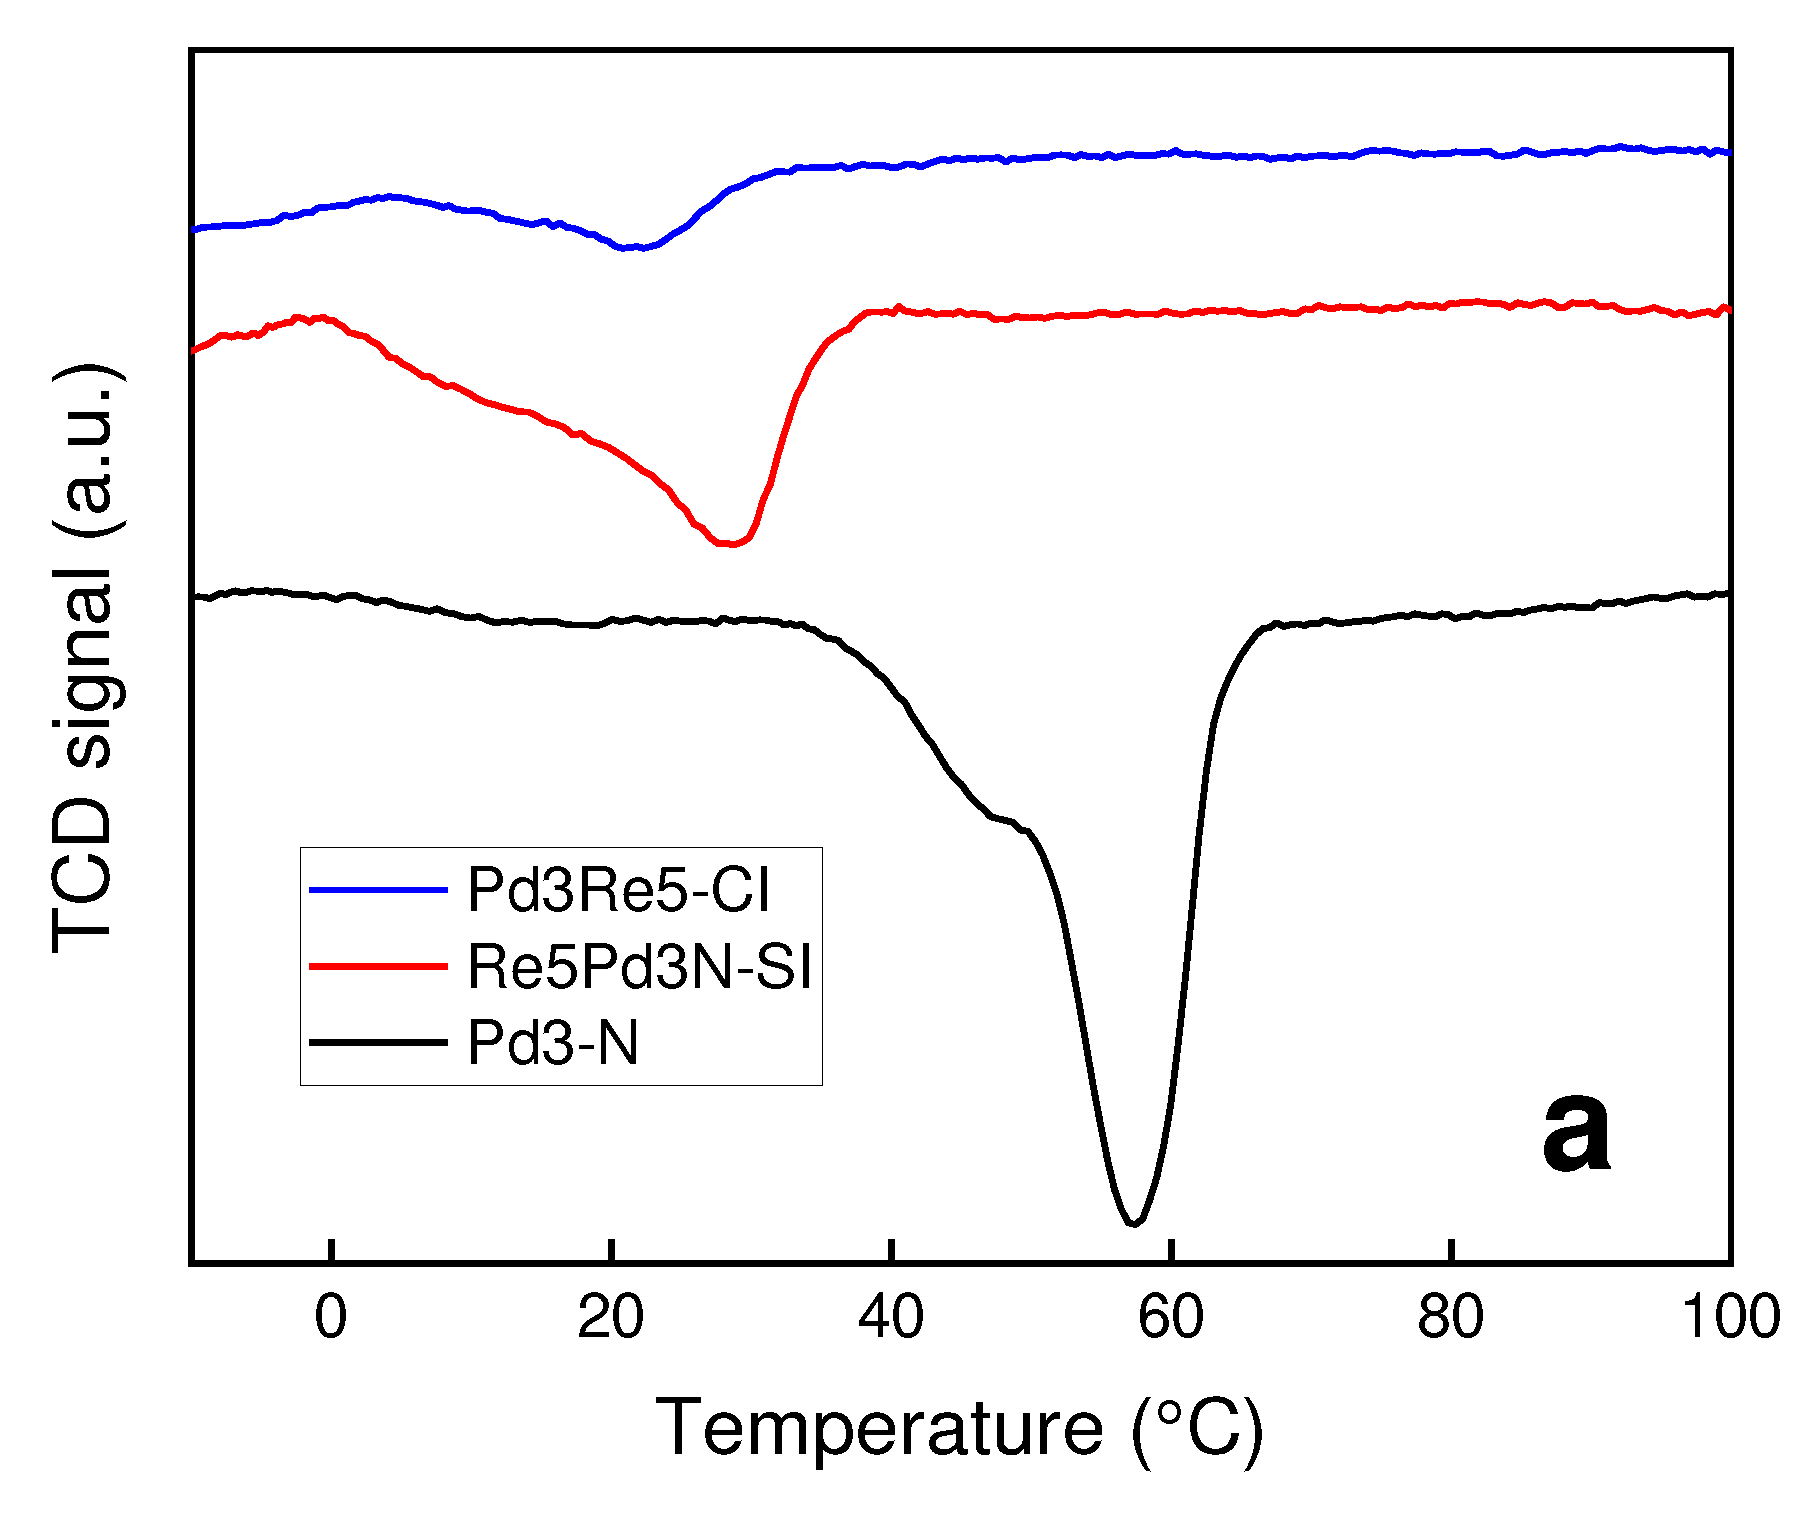
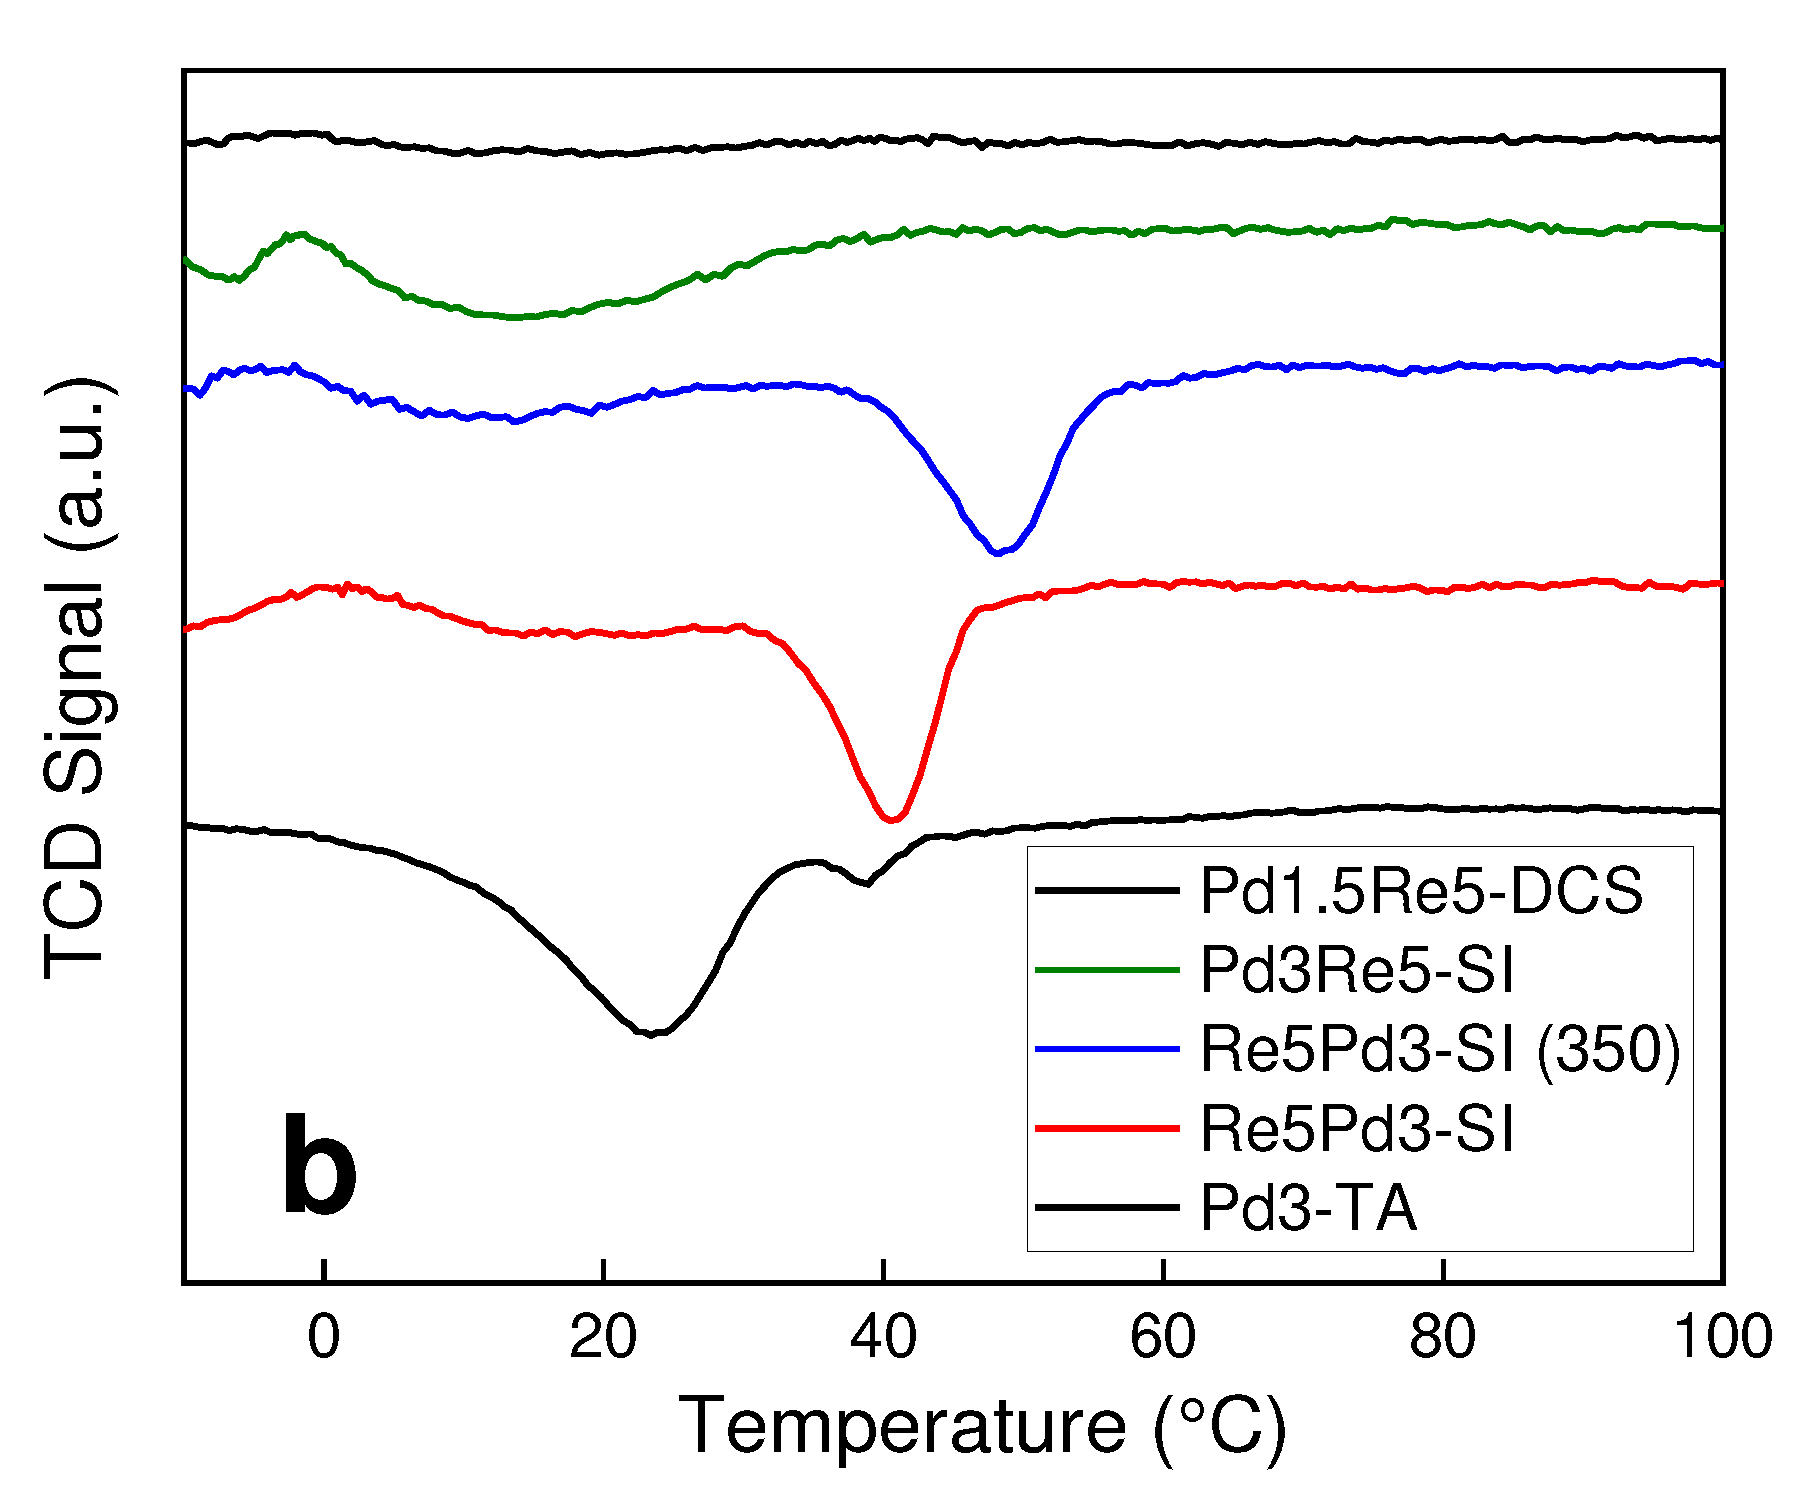
Figure 4.
DRIFT spectra of adsorbed CO at 20°C on Pd/Al2O3 and PdRe/Al2O3 catalysts following in situ H2 reduction at 400°C.
Figure 4.
DRIFT spectra of adsorbed CO at 20°C on Pd/Al2O3 and PdRe/Al2O3 catalysts following in situ H2 reduction at 400°C.
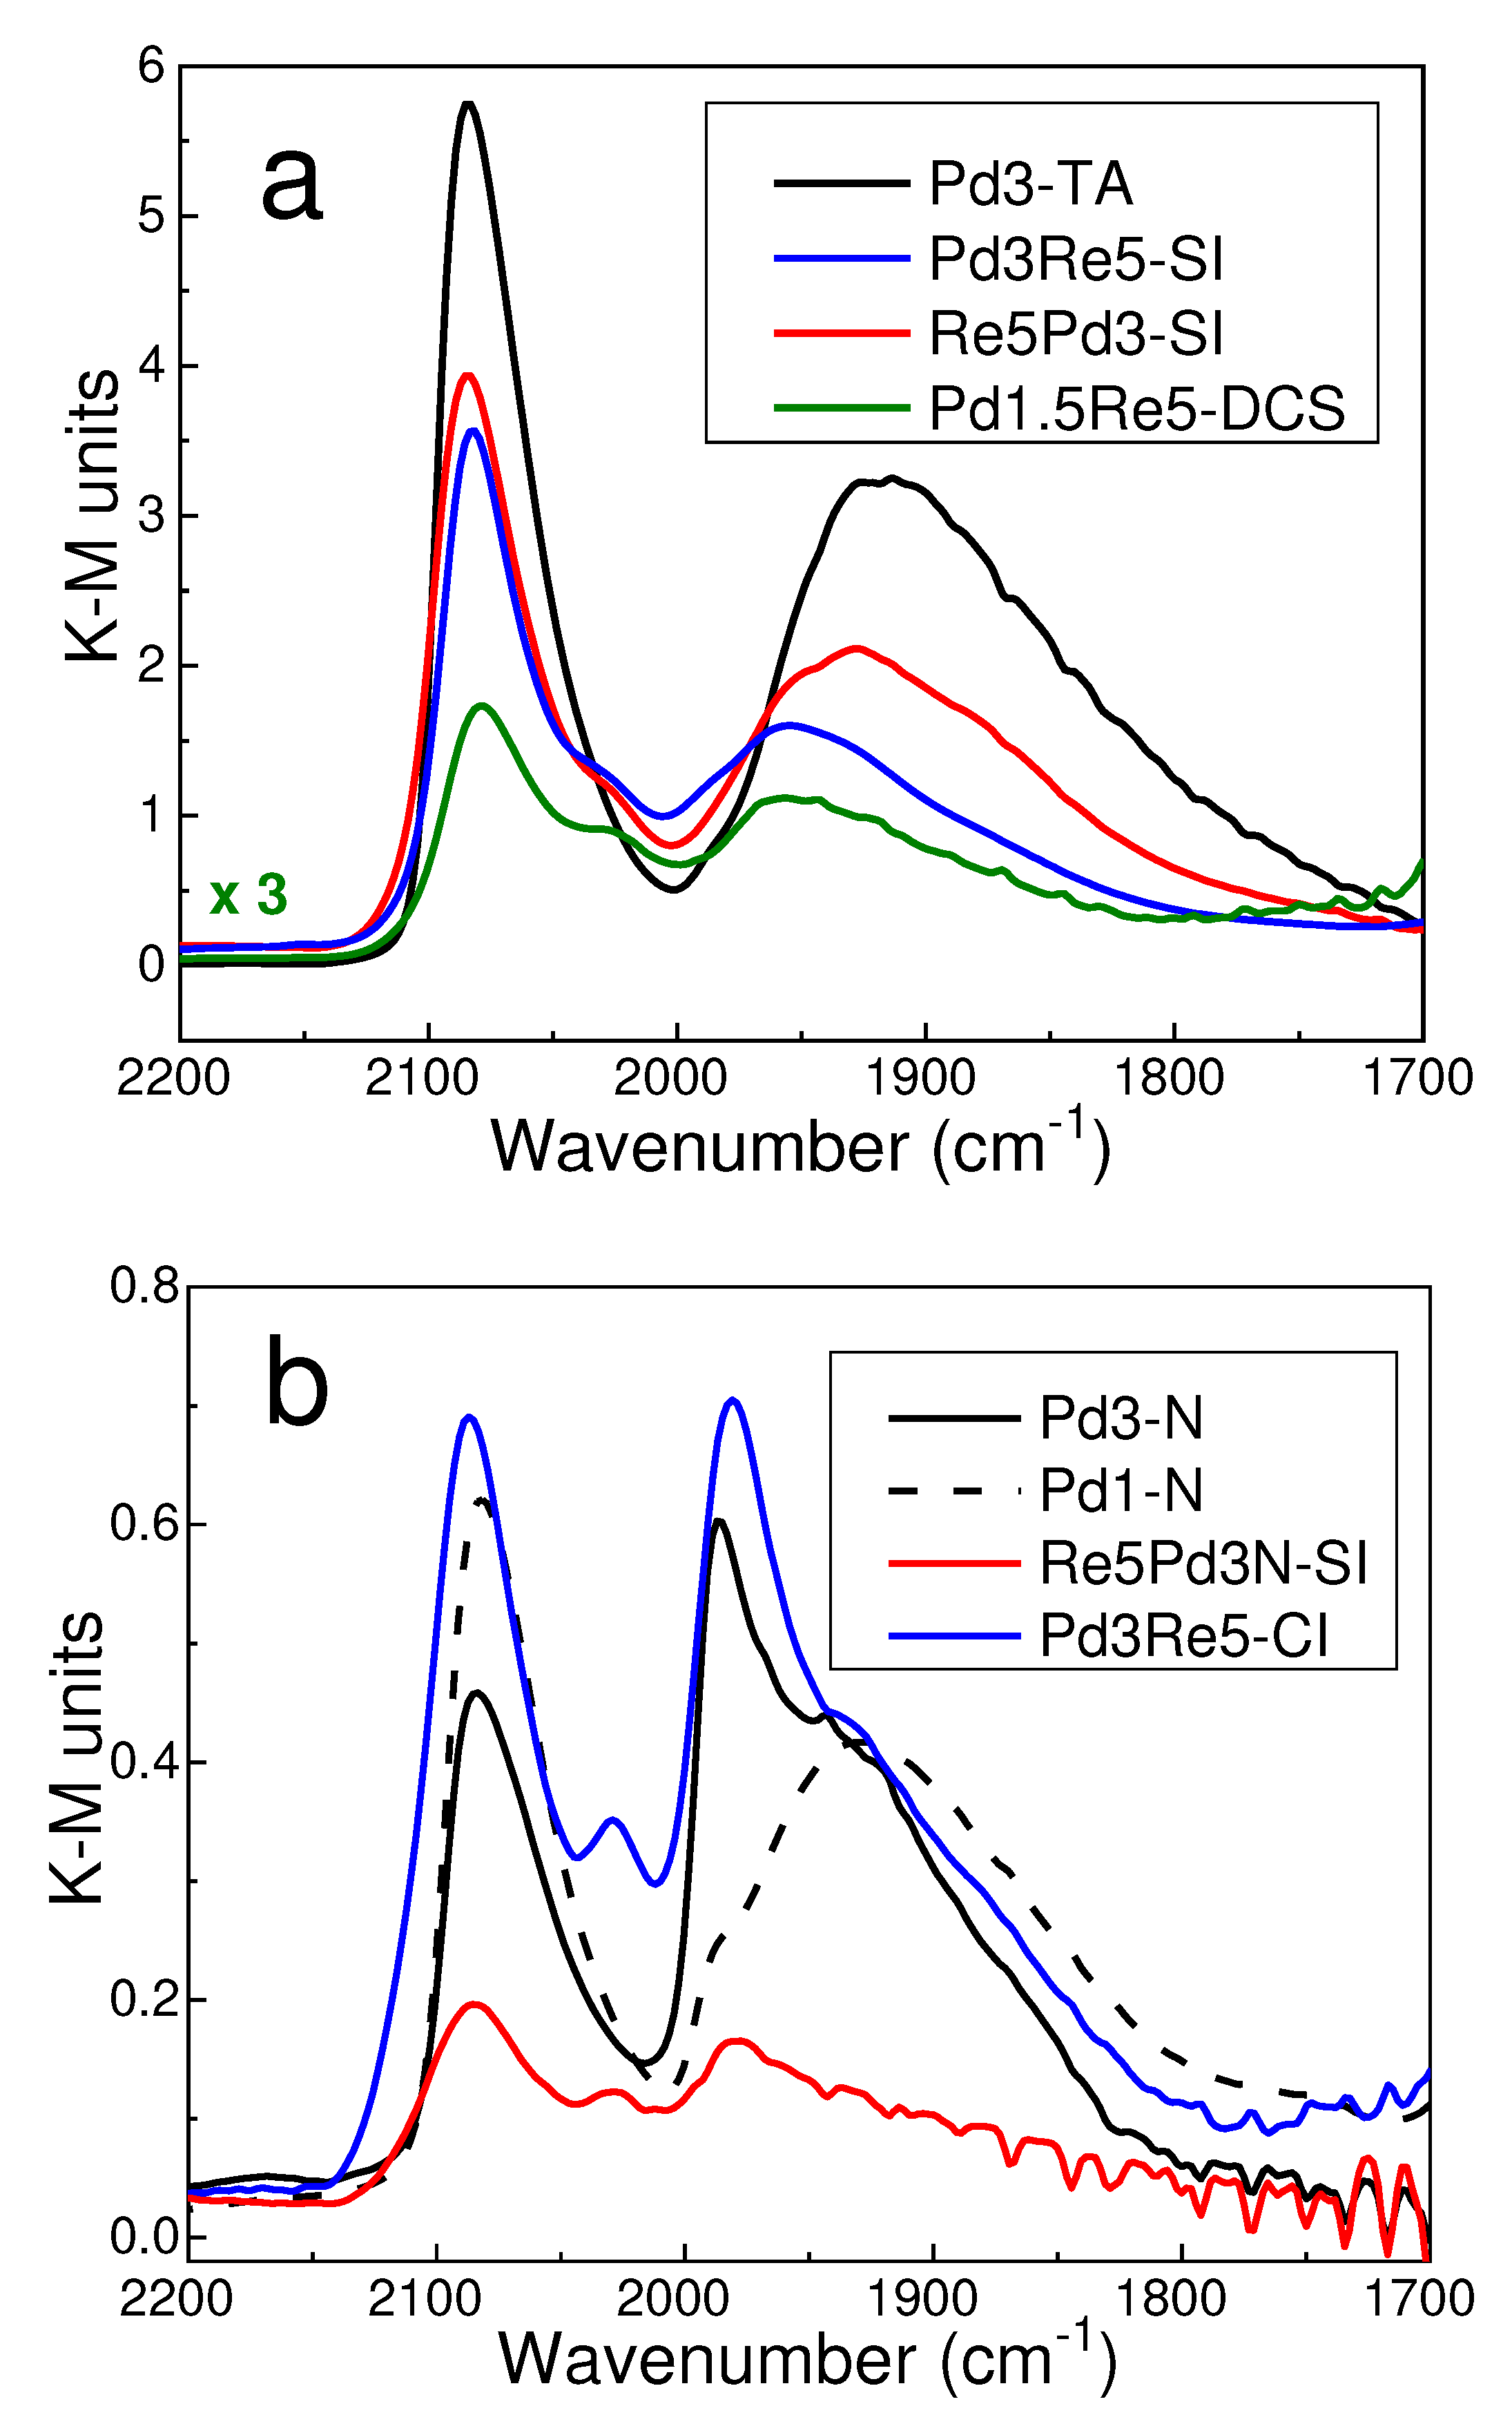
Figure 5.
Low-magnification HAADF-STEM images of individual catalyst particles: (a) Re5Pd3-SI and (b) Pd3Re5-CI.
Figure 5.
Low-magnification HAADF-STEM images of individual catalyst particles: (a) Re5Pd3-SI and (b) Pd3Re5-CI.
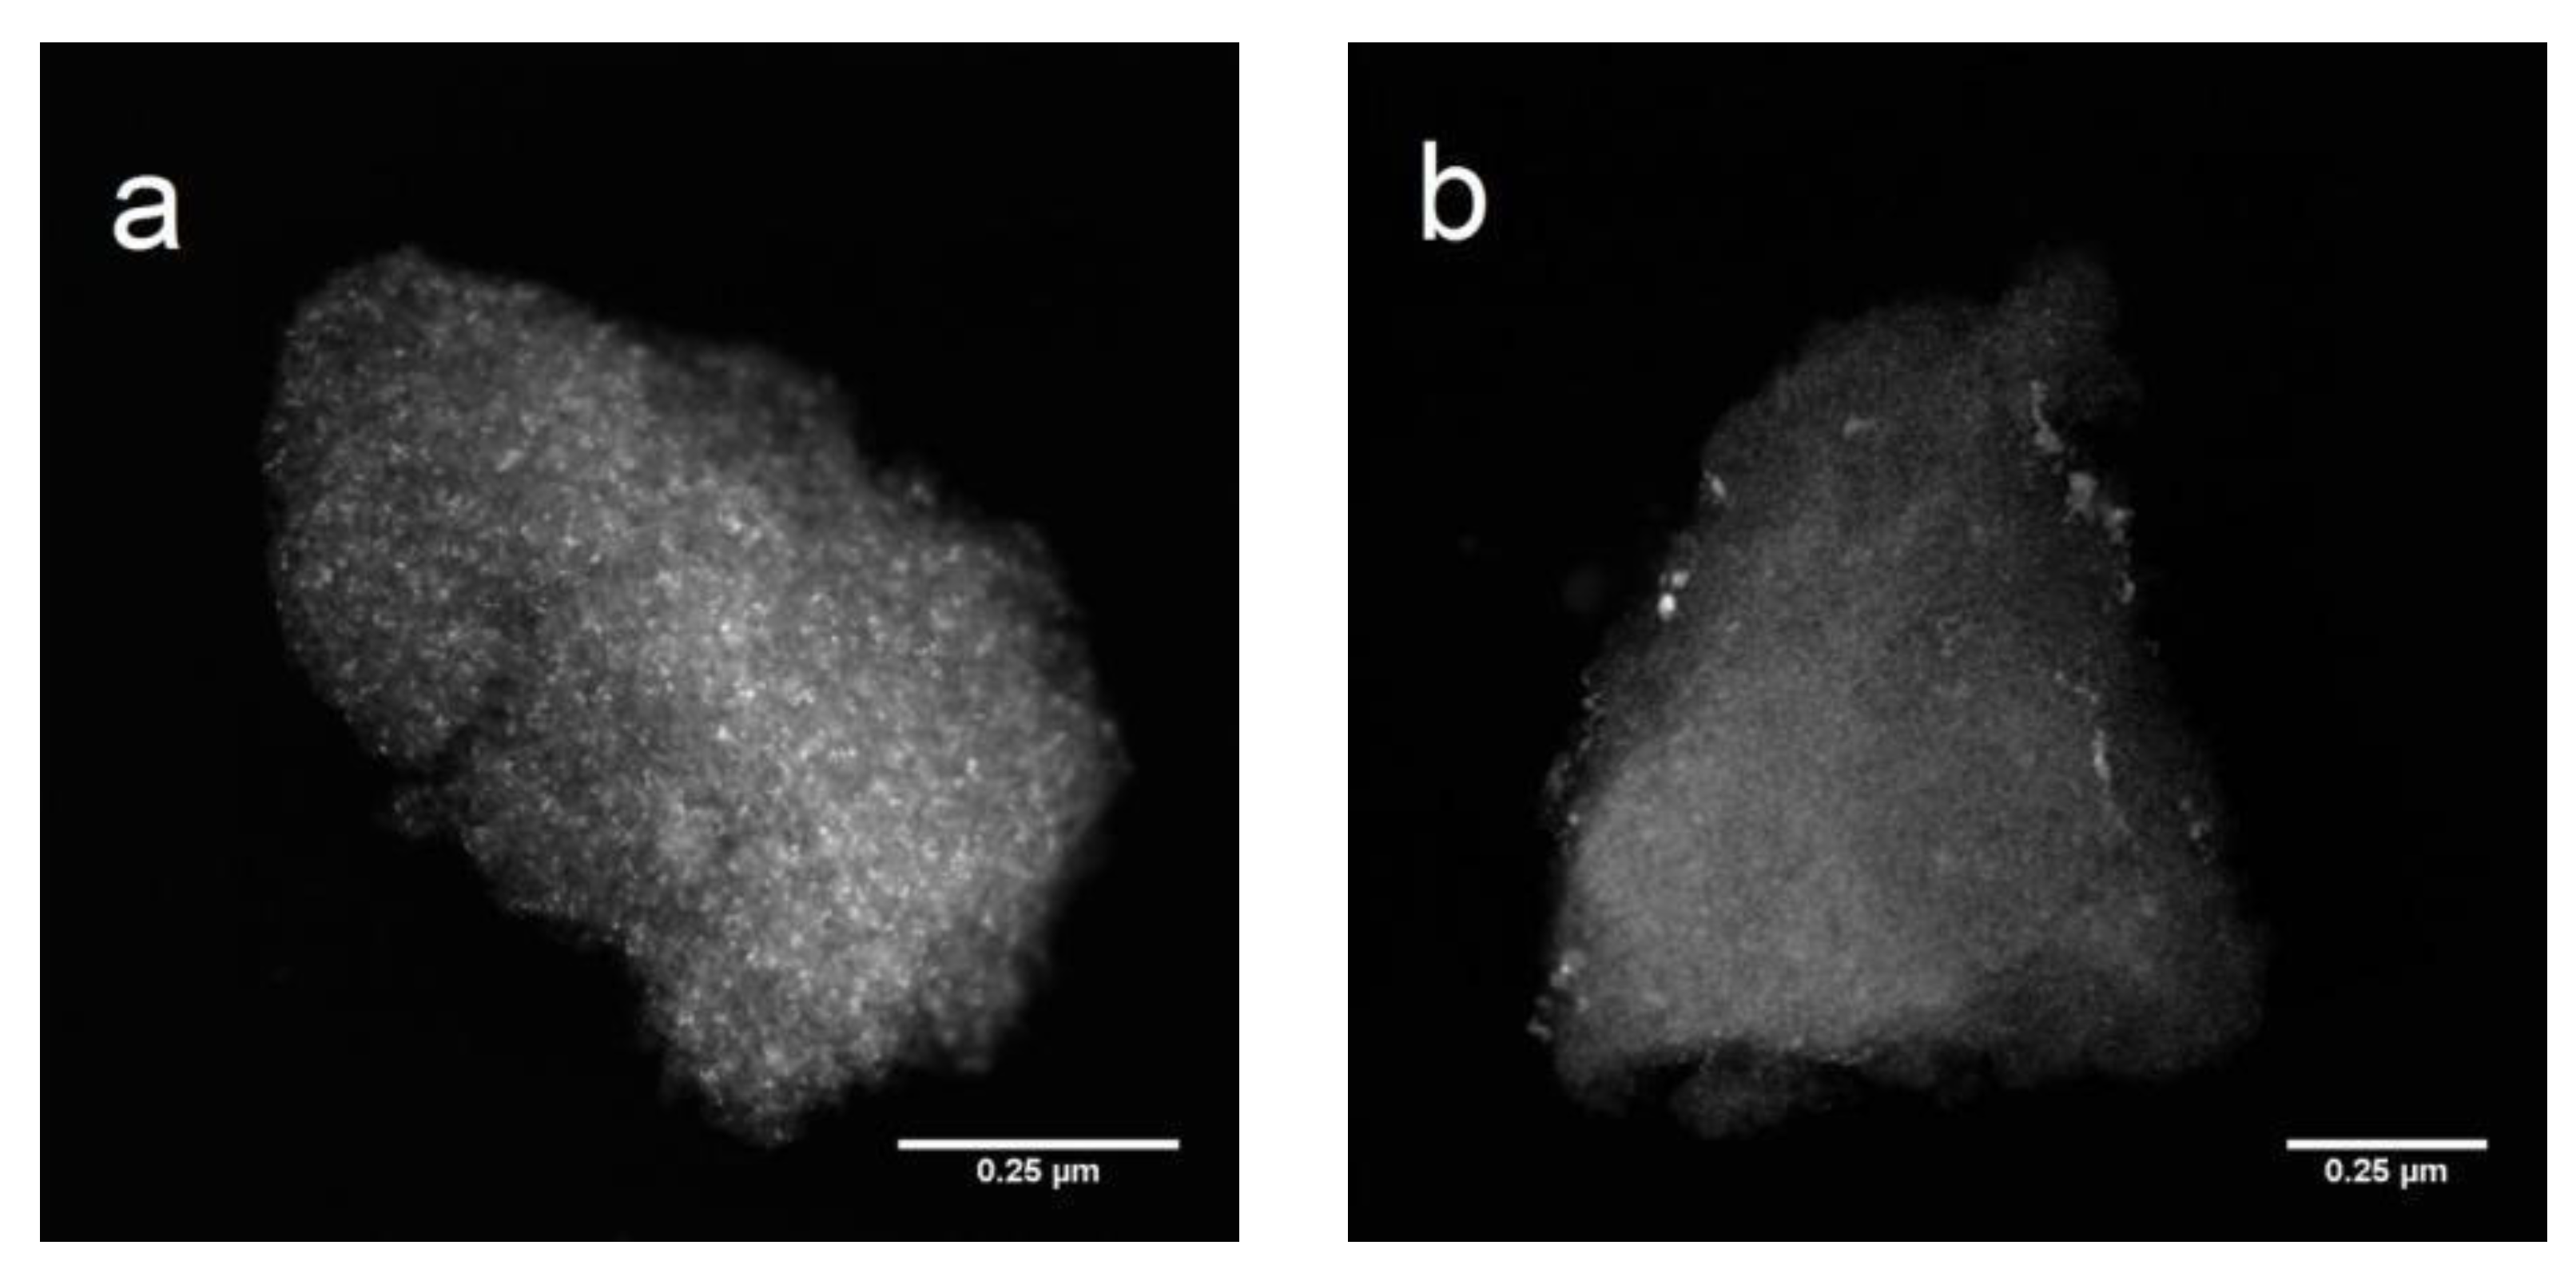
Figure 6.
STEM images of Pd3Re5-CI: HAADF images (a,c) and composite EDX images (b,d). Colors: red—Pd, green—Re, yellow—superposition.
Figure 6.
STEM images of Pd3Re5-CI: HAADF images (a,c) and composite EDX images (b,d). Colors: red—Pd, green—Re, yellow—superposition.
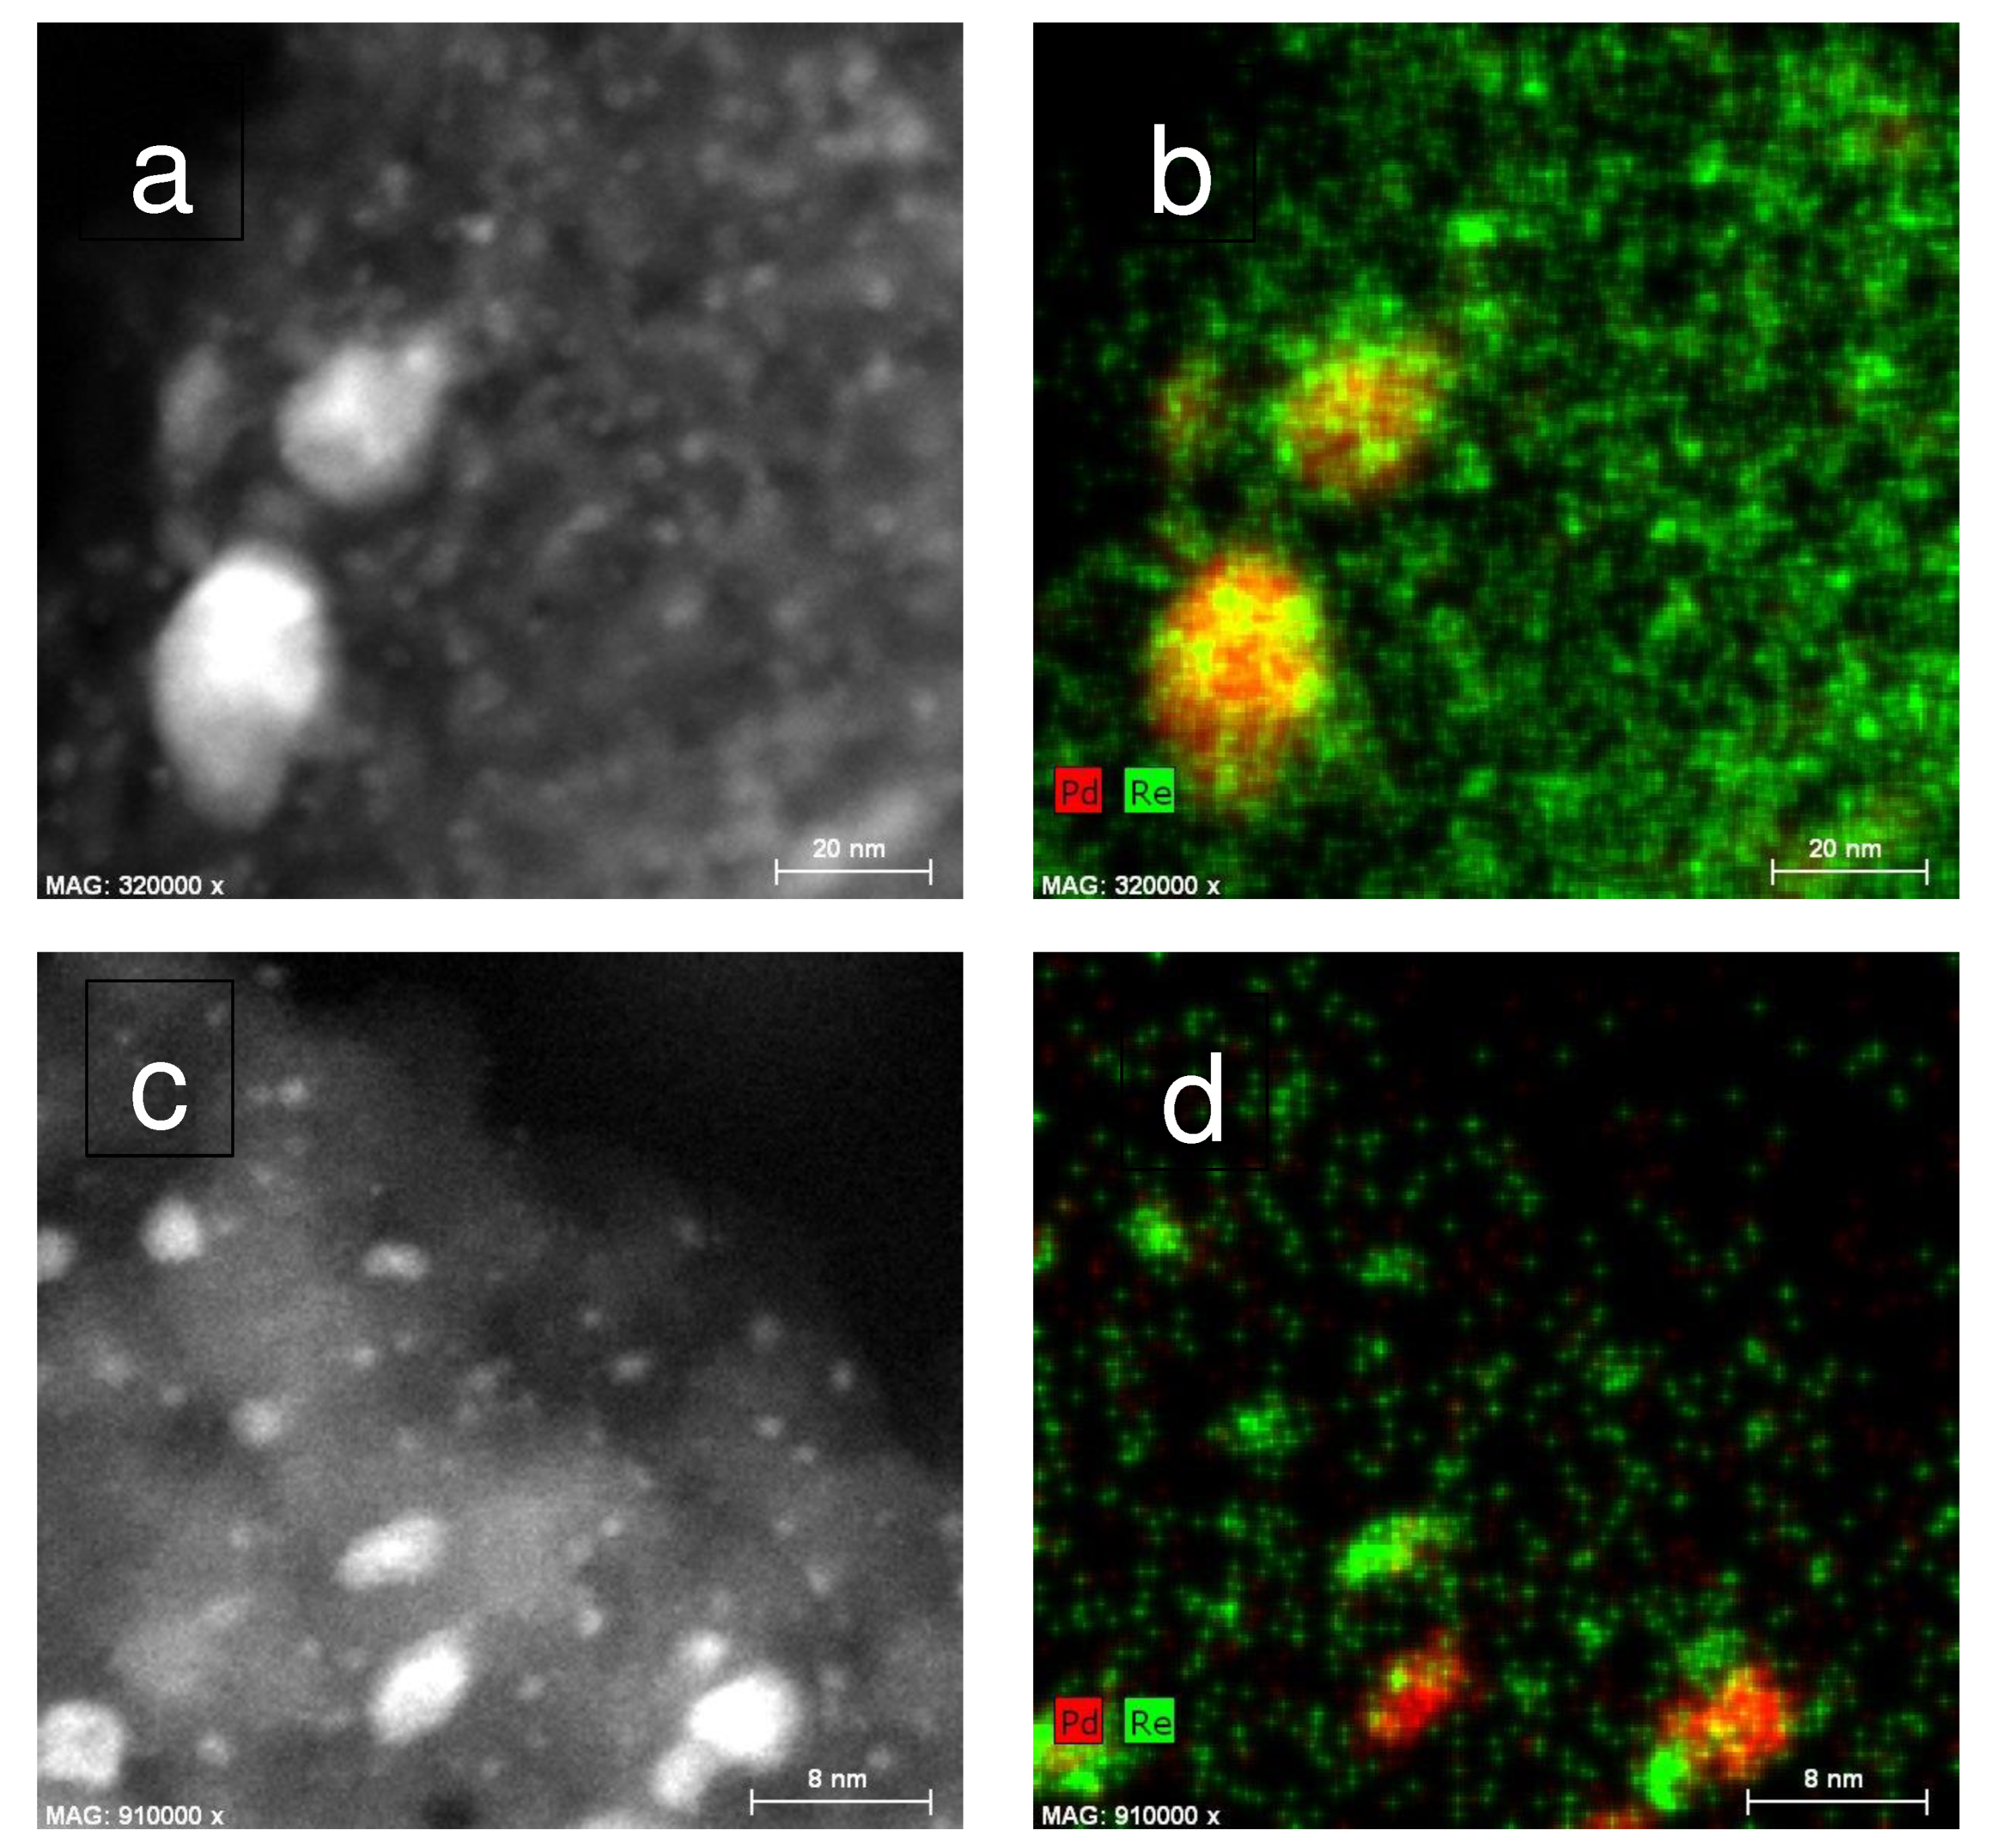
Figure 7.
STEM of Re5Pd3-SI catalyst: HAADF image (a), composite EDX map (b), Pd EDX map (c) and Re EDX map (d).
Figure 7.
STEM of Re5Pd3-SI catalyst: HAADF image (a), composite EDX map (b), Pd EDX map (c) and Re EDX map (d).
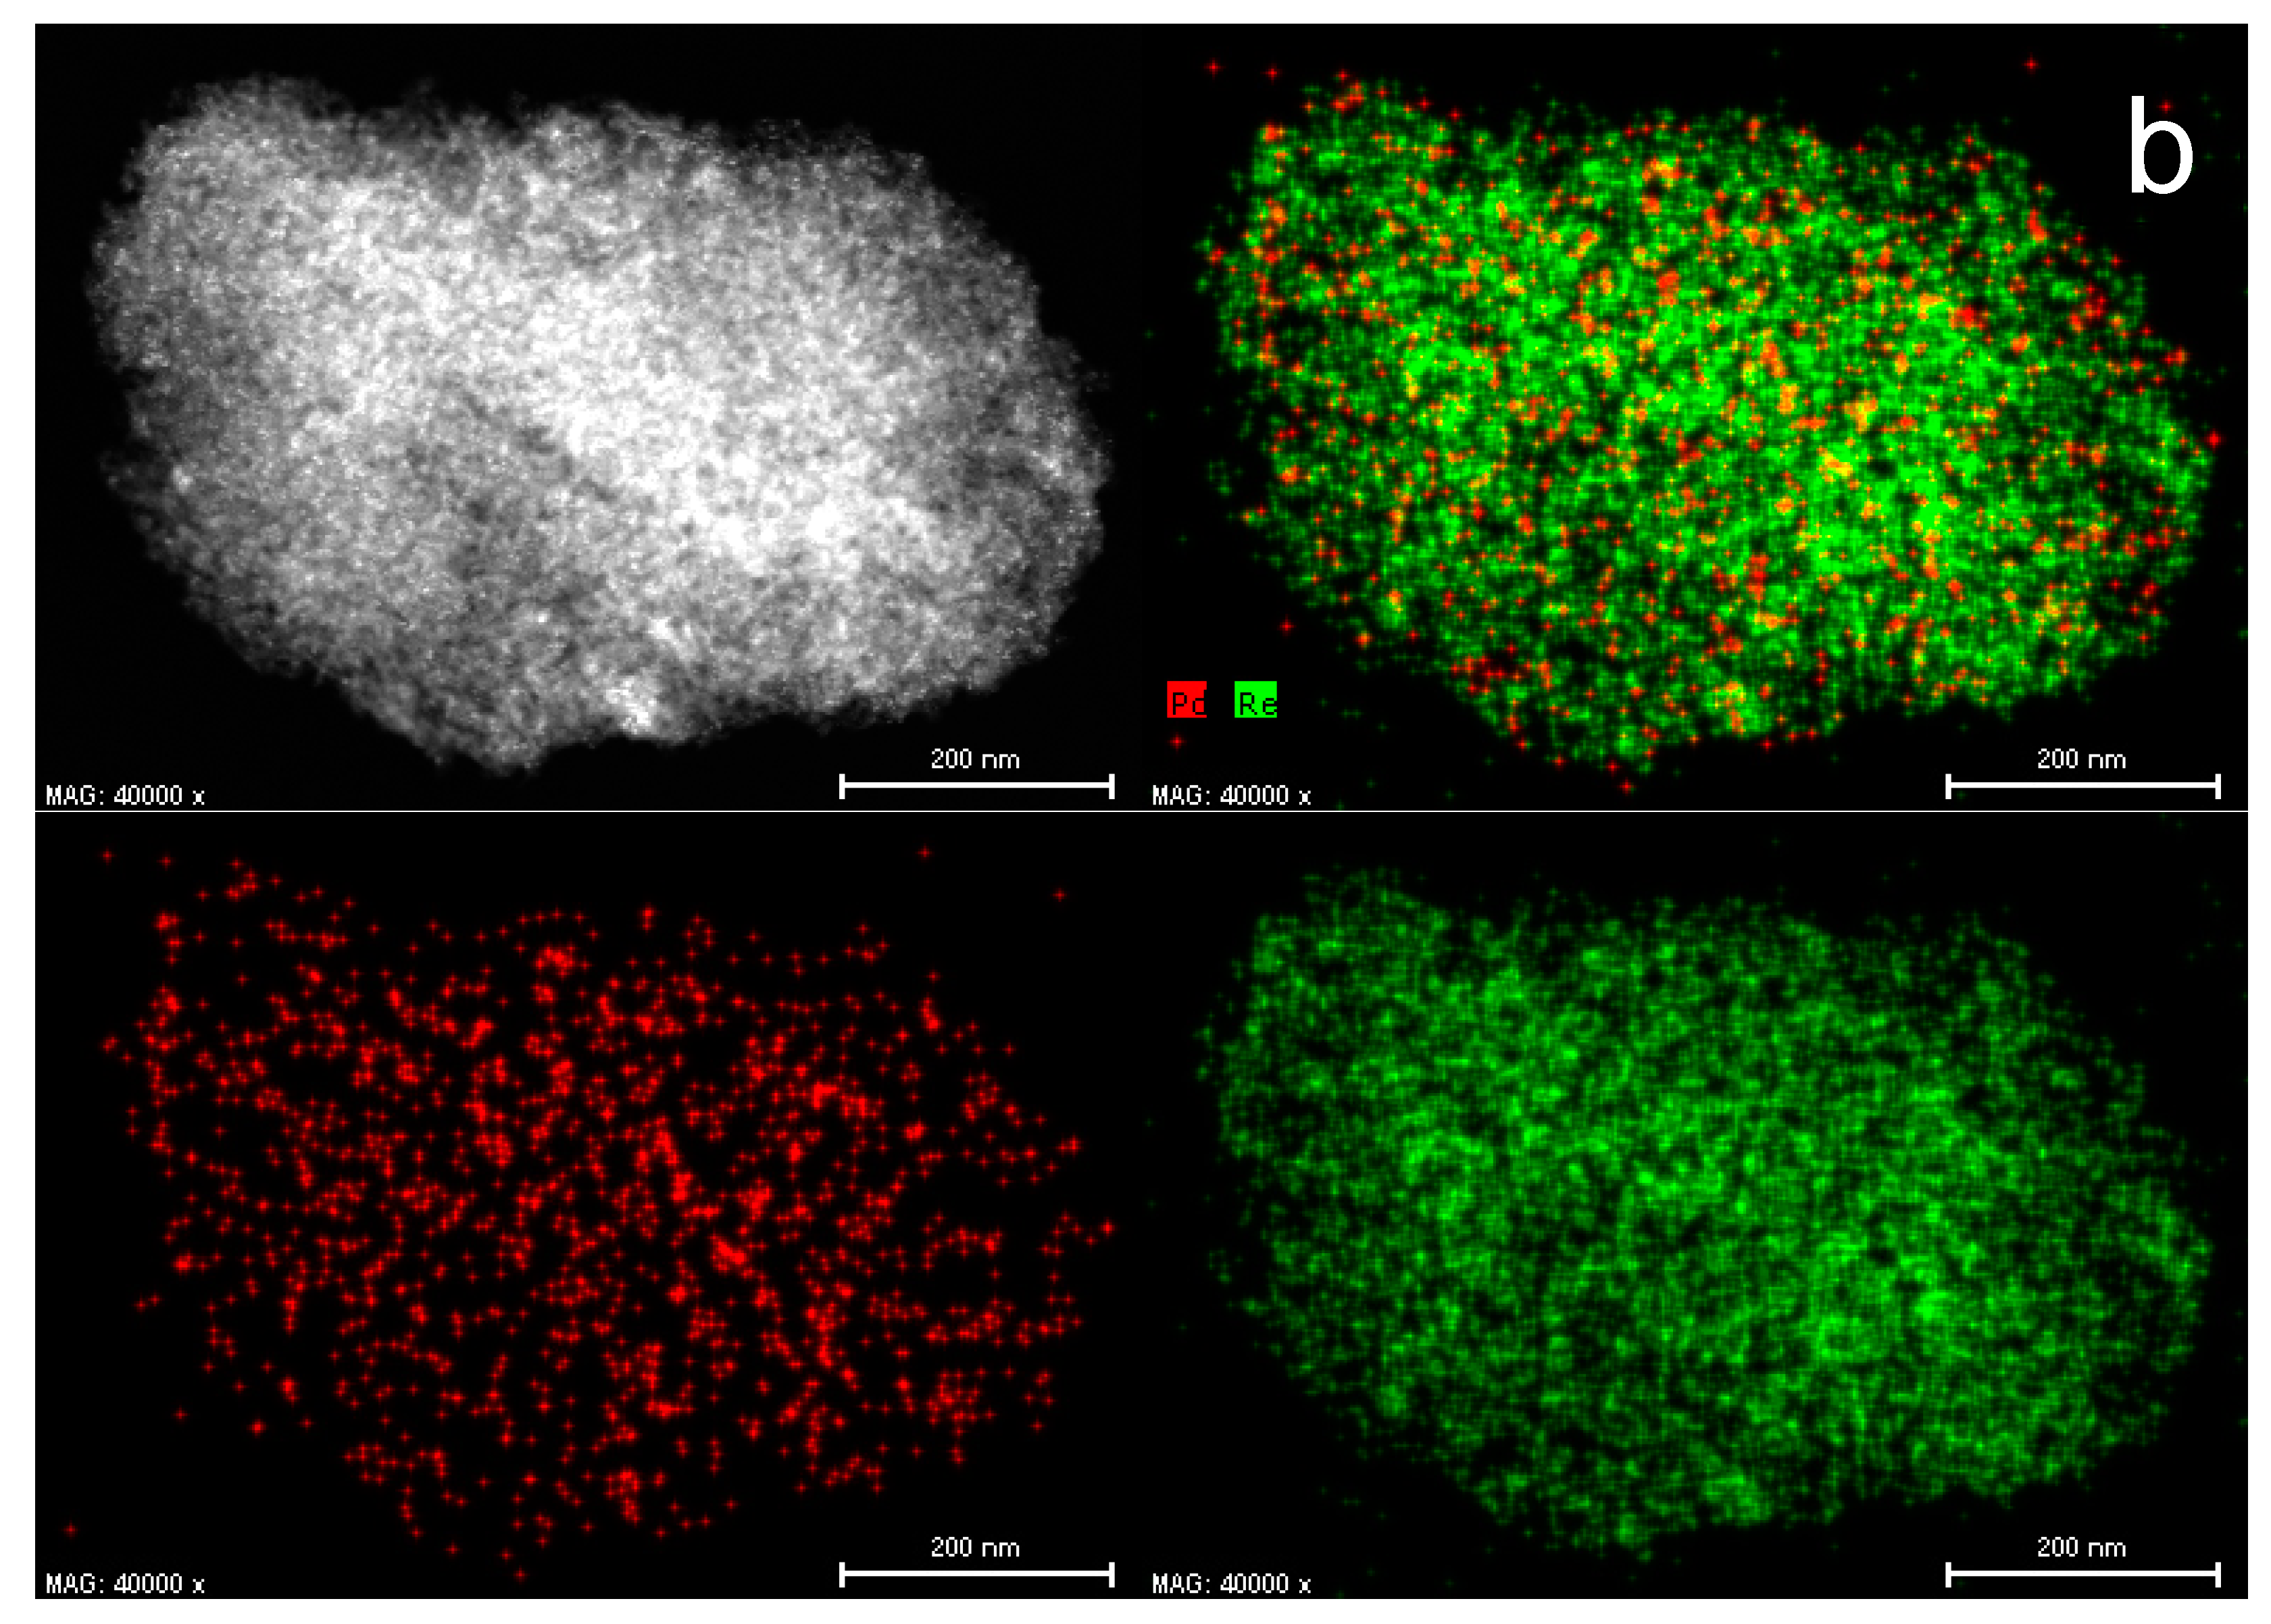
Figure 8.
High-magnification STEM of Re5Pd3-SI catalyst: HAADF image (a) and corresponding EDX map (b) showing Pd (red) and Re (green).
Figure 8.
High-magnification STEM of Re5Pd3-SI catalyst: HAADF image (a) and corresponding EDX map (b) showing Pd (red) and Re (green).
Scheme 1.
Furfural catalytic reaction pathways: decarbonylation (DCN), hydrogenation (HYD), and hydrodeoxygenation (HDO). Only primary products are shown.
Scheme 1.
Furfural catalytic reaction pathways: decarbonylation (DCN), hydrogenation (HYD), and hydrodeoxygenation (HDO). Only primary products are shown.
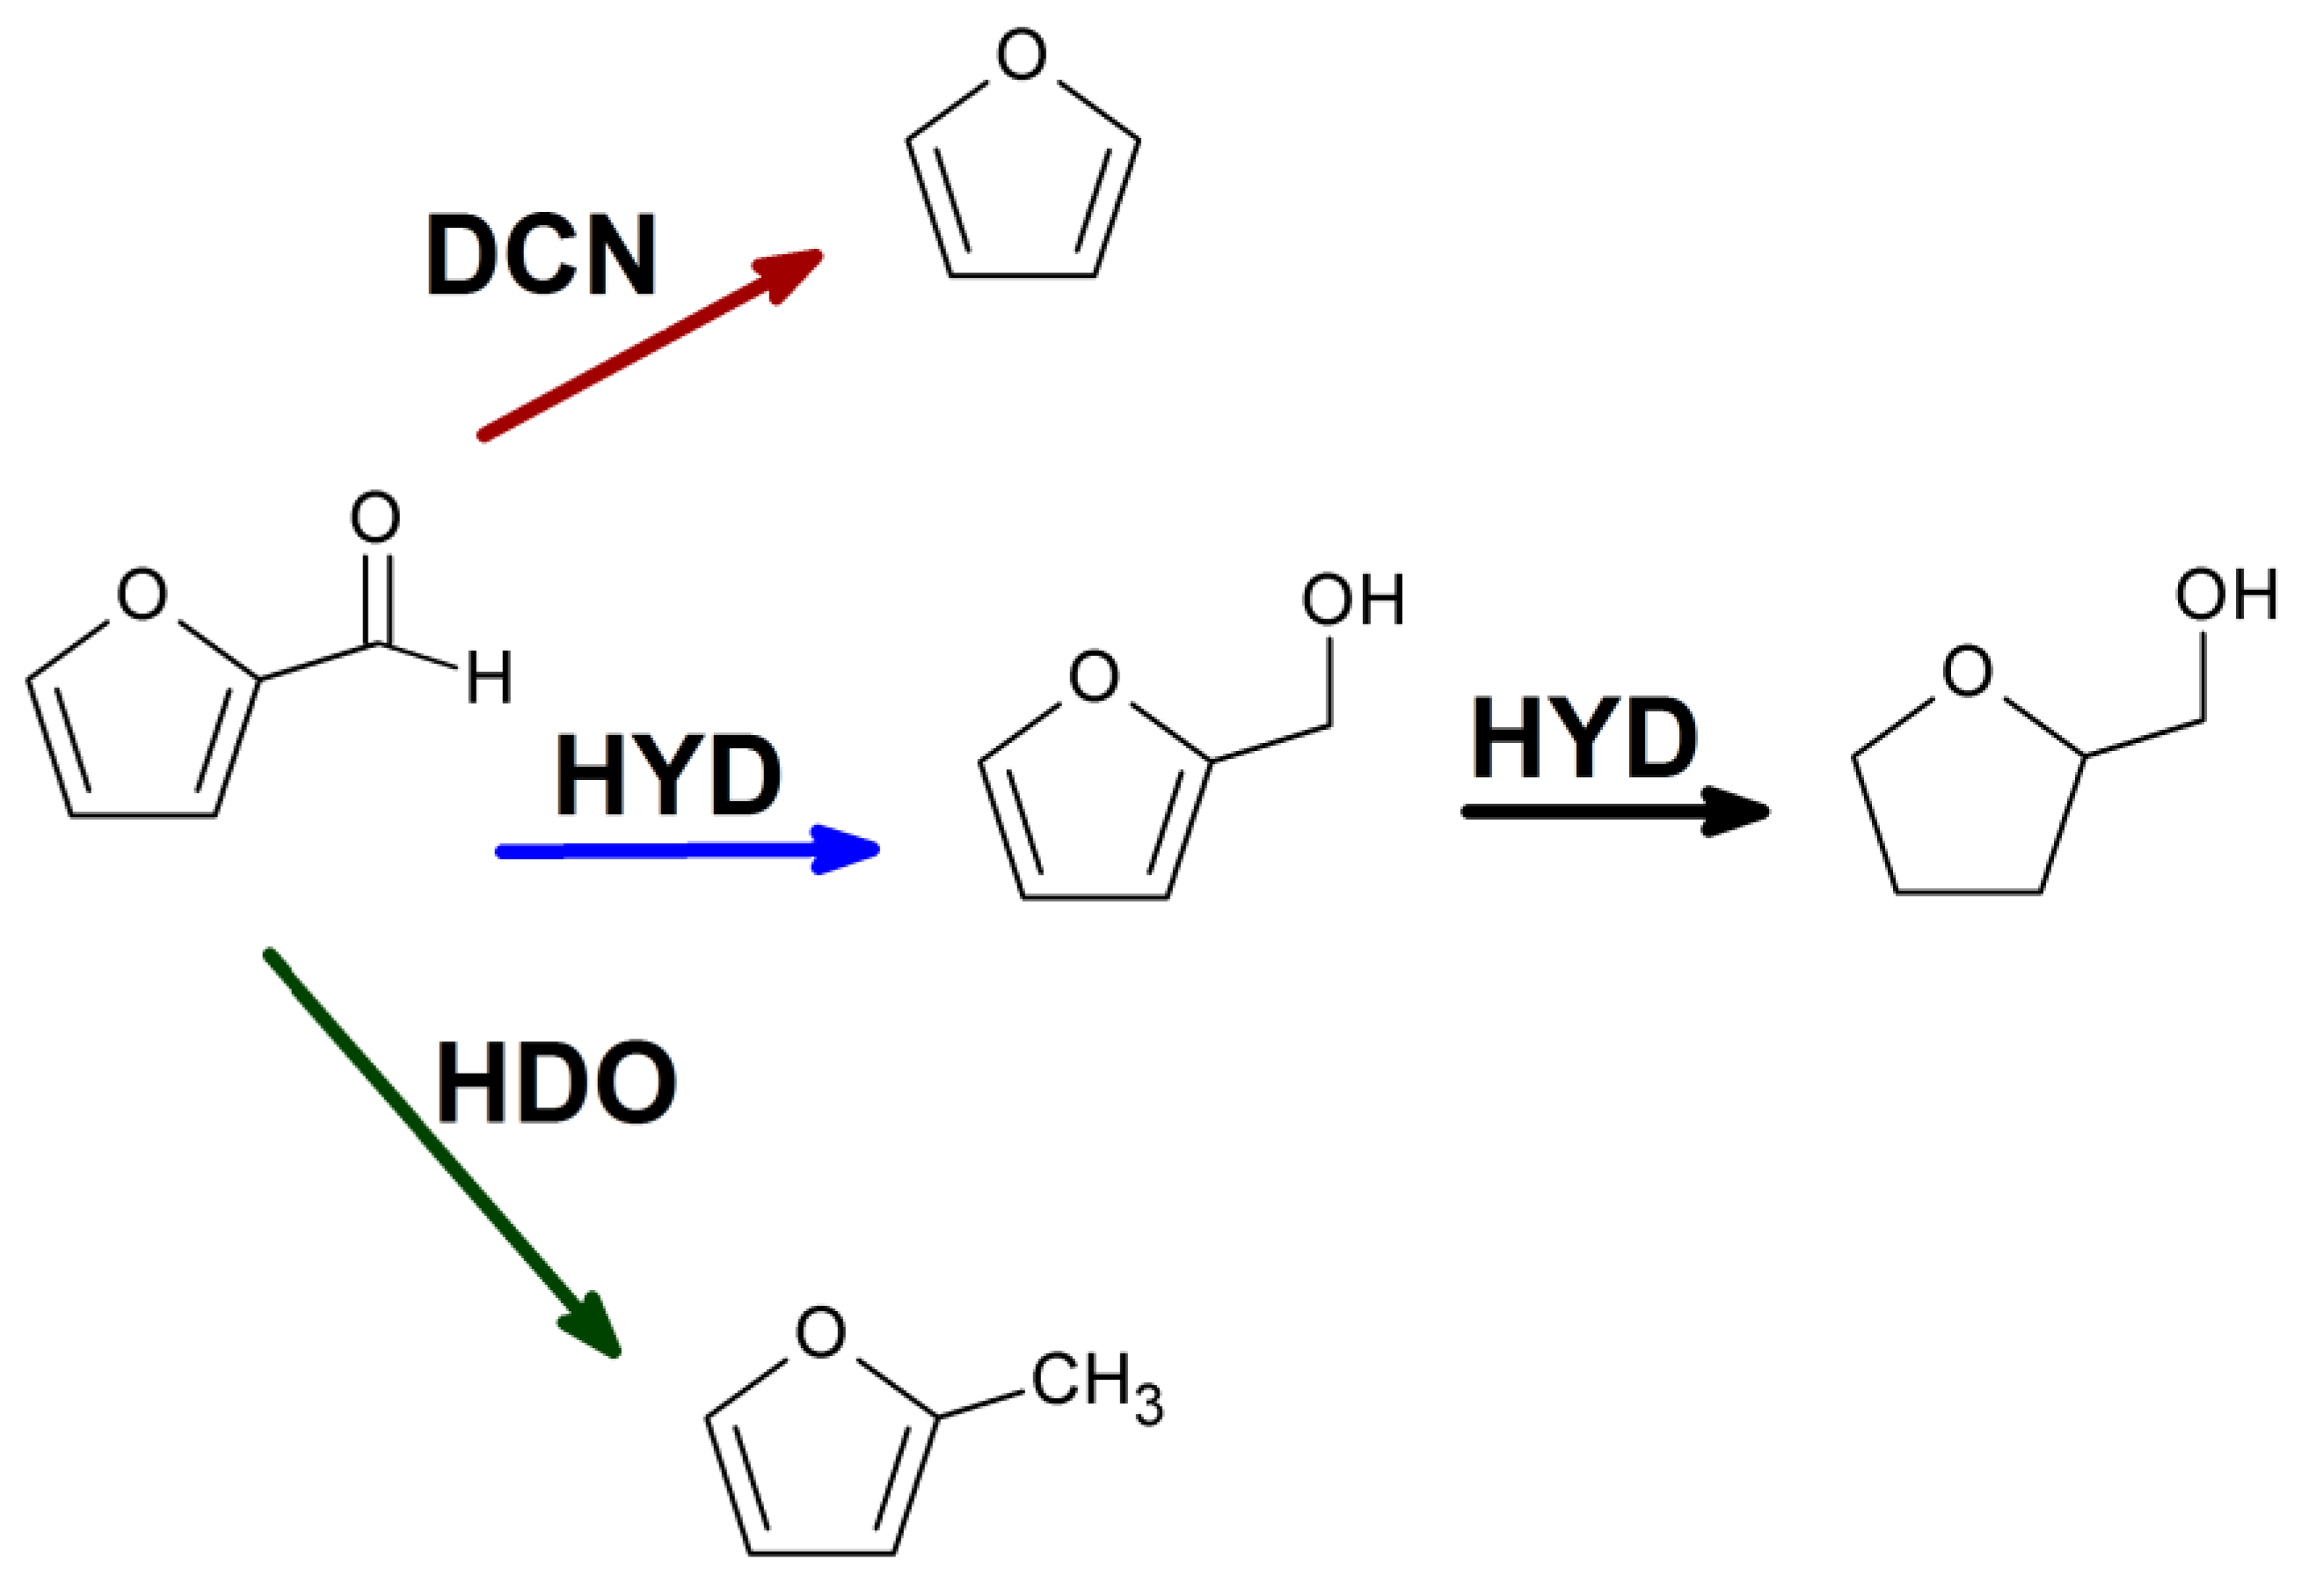
Figure 9.
Furfural consumption rates and product formation rates at 150°C and 1 atm at differential (<10%) conversion. FAL selectivities are indicated above the bars.
Figure 9.
Furfural consumption rates and product formation rates at 150°C and 1 atm at differential (<10%) conversion. FAL selectivities are indicated above the bars.
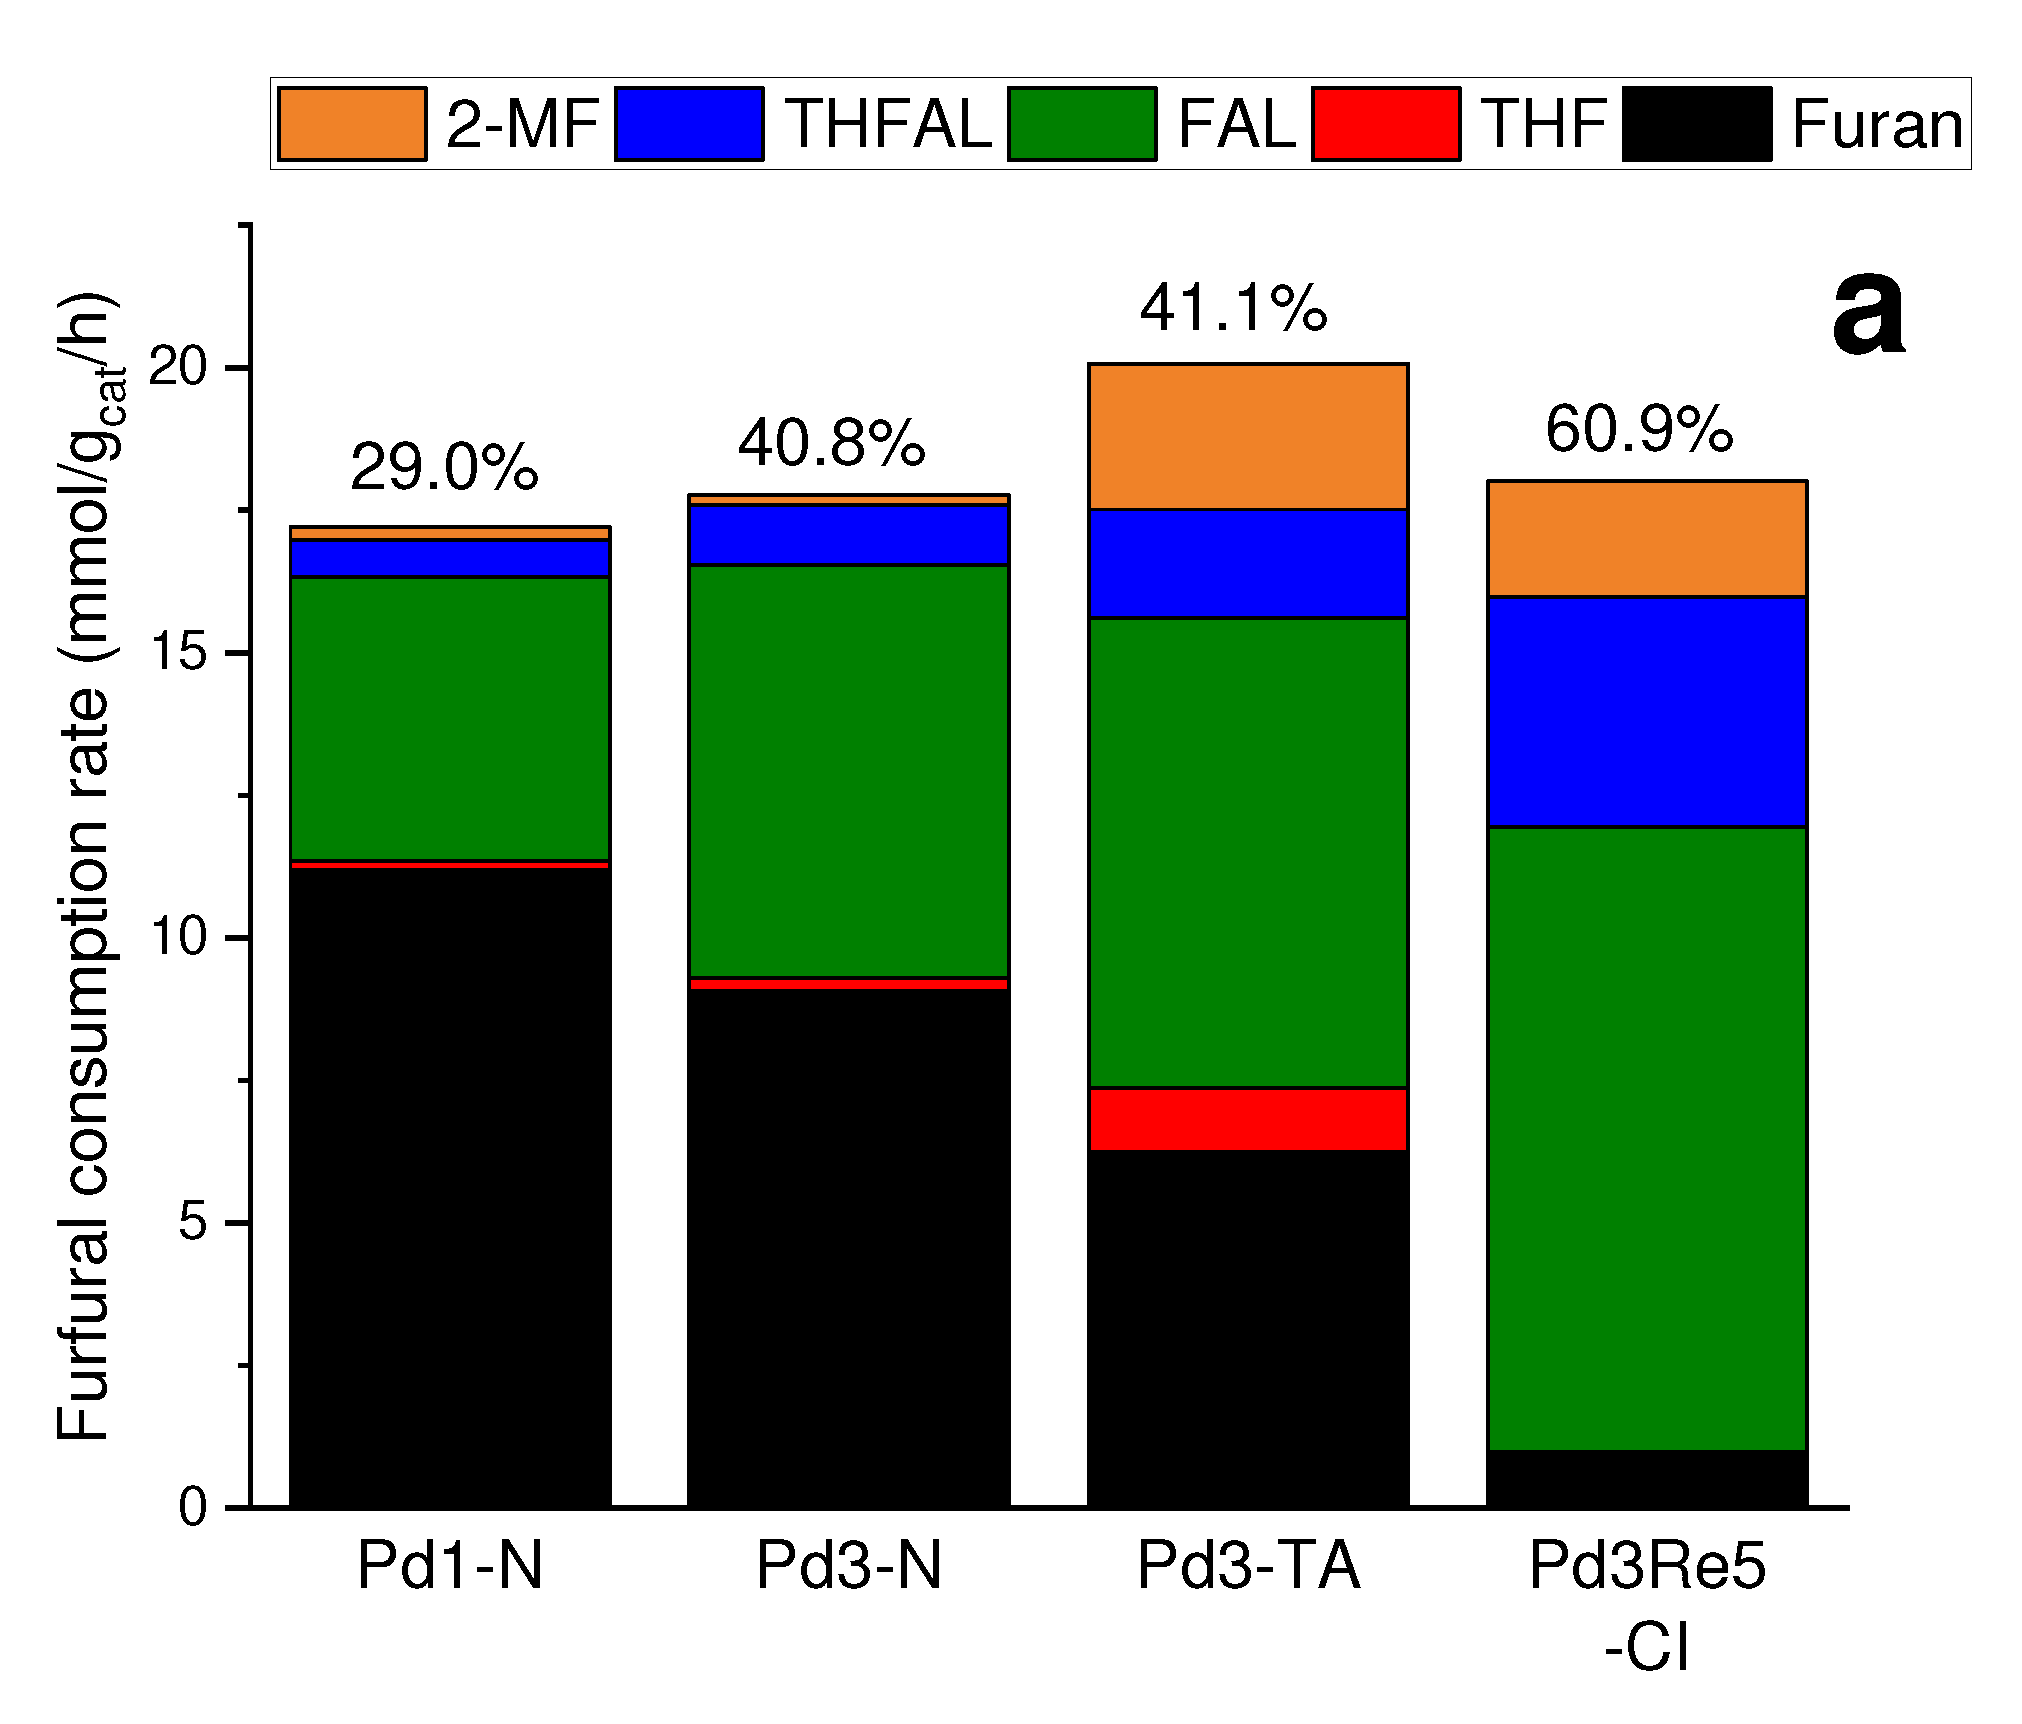
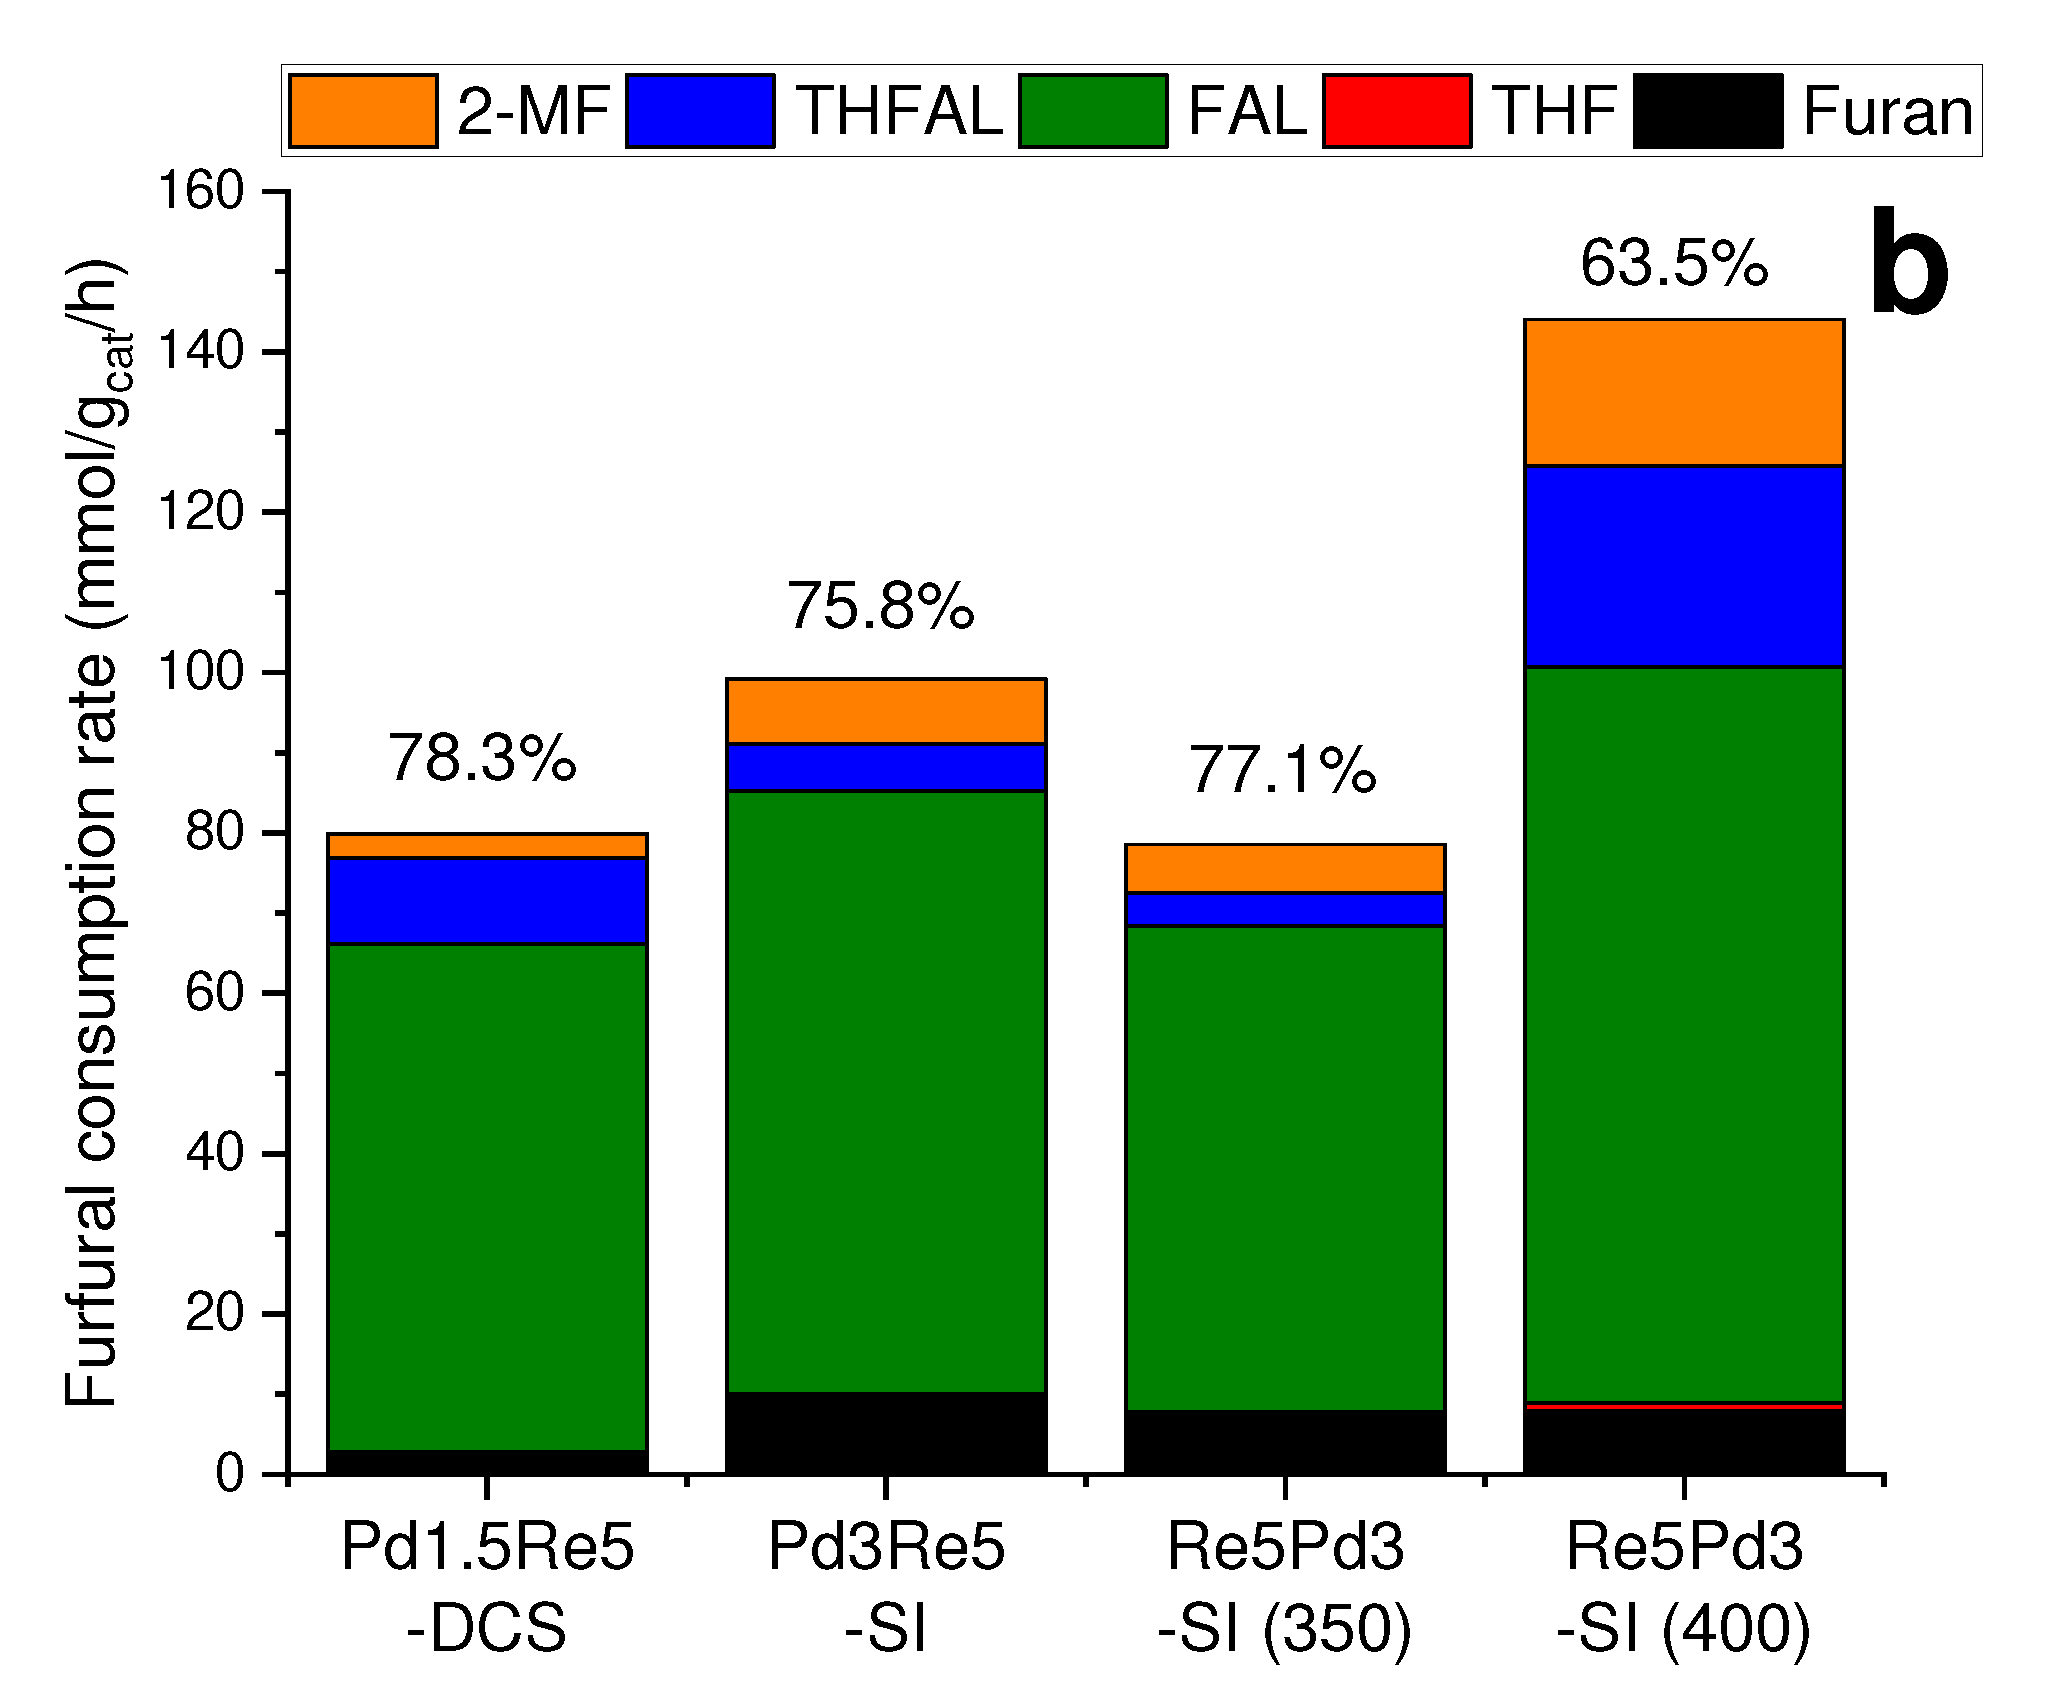

Table 1.
Precursors and compositions of γ-Al2O3-supported catalysts.
| Catalyst | Metal precursor(s) | Pd loading (wt%) | Re loading (wt%) |
|---|---|---|---|
| Pd1-N | Pd(NO3)2 | 0.91 | --- |
| Pd3-N | Pd(NO3)2 | 2.66 | --- |
| Pd3-TA | Pd(NH3)4(NO3)2 | 2.34 | --- |
| Pd3Re5-CI | Pd(NO3)2 and HReO4 | 2.43 | 4.41 |
| Pd3Re5-SI | Pd(NH3)4(NO3)2 and HReO4 | 2.80 | 4.63 |
| Re5Pd3N-SI | HReO4 and Pd(NO3)2 | 2.15 | 5.73 |
| Re5Pd3-SI (350) | NH4ReO4 and Pd(NH3)4(NO3)2 | 2.56 | 4.23 |
| Re5Pd3-SI | NH4ReO4 and Pd(NH3)4(NO3)2 | 2.27 | 4.24 |
| Re5Pd1.5-DCS | Pd(NH3)4(ReO4)2 | 1.42 | 4.65 |
| Re5-H | HReO4 | --- | 5.29 |
| Re5-N | NH4ReO4 | --- | 4.54 |
Table 2.
TPR and TPHD results for selected catalysts.
| Catalyst | H/metal ratio(TPR)1 | Re oxidation state (TPR)2 | H/Pd(TPHD)4 |
|---|---|---|---|
| Pd3-N | 2.1 | -- | 0.32 |
| Pd3-TA | 2.4 | -- | 0.13 |
| Pd3Re5-CI | 4.4 | 0.4 | 0.063 |
| Pd3Re5-SI | 3.6 | 0.73 | 0.058 |
| Re5Pd3N-SI | 5.0 | 0.7 | 0.18 |
| Re5Pd3-SI (350) | 4.3 | 0.3 | 0.11 |
| Re5Pd3-SI | 4.5 | 0.2 | 0.12 |
| Re5-N | 4.9 | 2.1 | -- |
1 Based on TPR H2 consumption to 400°C. 2 For PdRe catalysts, assume 2.0 H/Pd with the balance to Re7+ reduction. 3 Based on TPR H2 consumption by Pd3-TA after reduction and passivation. 4 Based on H2 evolution at >0°C.
Table 3.
CO and H2 chemisorption results.
| Catalyst | CO chemisorption | H2 chemisorption | ||||||
|---|---|---|---|---|---|---|---|---|
| 35°C | 35°C | 100°C | ||||||
| CO uptake a | CO/metal | H2 uptakea | H/metal | H/CO | H2 uptake | H/metal | H/CO | |
| Pd1-N | 28.5 | 0.333 | 12.7 | 0.297 | 0.89 | 8.8 | 0.204 | 0.62 |
| Pd3-N | 32.4 | 0.130 | 16.7 | 0.133 | 1.03 | 12.4 | 0.100 | 0.76 |
| Pd3-TA | 103 | 0.469 | n/a | -- | -- | n/a | -- | -- |
| Pd3Re5-CI | 59.0 | 0.127 | 26.7 | 0.115 | 0.90 | 27.3 | 0.117 | 0.92 |
| Pd3Re5-SI | 80.5 | 0.157 | 17.9 | 0.070 | 0.44 | 21.6 | 0.084 | 0.54 |
| Re5Pd3N-SI | 50.5 | 0.099 | n/a | -- | -- | n/a | -- | -- |
| Re5Pd3-SI (350) | 96.2 | 0.206 | 20.9 | 0.089 | 0.43 | 26.7 | 0.114 | 0.56 |
| Re5Pd3-SI | 92.6 | 0.210 | 20.3 | 0.092 | 0.44 | 21.1 | 0.096 | 0.46 |
| Pd1.5Re5-DCS | 44.6 | 0.116 | 7.6 | 0.040 | 0.34 | 11.0 | 0.057 | 0.49 |
| Re5-N | 33.8 | 0.139 | 2.3 | 0.019 | 0.14 | 14.5 | 0.119 | 0.86 |
a units: μmol/g.
Table 4.
TOFs for furfural consumption at 150°C measured under differential conversion (<10%) conditions.
Table 4.
TOFs for furfural consumption at 150°C measured under differential conversion (<10%) conditions.
| Catalyst | TOF (min-1)a | |
|---|---|---|
| CO | H | |
| Pd1-N | 10.1 | 11.3b |
| Pd3-N | 9.1 | 8.9b |
| Pd3-TA | 3.2 | n/a |
| Pd3Re5-CI | 5.1 | 5.5 |
| Pd3Re5-SI | 20.5 | 38.3 |
| Re5Pd3-SI (350) | 13.6 | 24.5 |
| Re5Pd3-SI | 26.0 | 57.0 |
| Pd1.5Re5-DCS | 29.9 | 60.6 |
a Basis: CO chemisorption at 35°C and H2 dissociative chemisorption at 100°C (unless otherwise noted). b Basis: H2 dissociative chemisorption at 35°C.
Disclaimer/Publisher’s Note: The statements, opinions and data contained in all publications are solely those of the individual author(s) and contributor(s) and not of MDPI and/or the editor(s). MDPI and/or the editor(s) disclaim responsibility for any injury to people or property resulting from any ideas, methods, instructions or products referred to in the content. |
© 2023 by the authors. Licensee MDPI, Basel, Switzerland. This article is an open access article distributed under the terms and conditions of the Creative Commons Attribution (CC BY) license (http://creativecommons.org/licenses/by/4.0/).
Copyright: This open access article is published under a Creative Commons CC BY 4.0 license, which permit the free download, distribution, and reuse, provided that the author and preprint are cited in any reuse.


