Submitted:
23 July 2024
Posted:
24 July 2024
You are already at the latest version
Abstract
X-ray absorption fine structure (XAFS) spectroscopy, temperature-programmed reduction (TPR) and temperature-programmed hydride decomposition (TPHD) were employed to elucidate the structures of a series of PdRe/Al2O3 bimetallic catalysts for selective hydrogenation of furfural. TPR evidenced low-temperature Re reduction in the bimetallic catalysts consistent with migration of [ReO4]- (perrhenate) species to hydrogen-covered Pd nanoparticles on highly hydroxylated Al2O3. TPHD revealed strong suppression of β-PdHx formation in the reduced catalysts prepared by (i) co-impregnation and (ii) [HReO4] impregnation of reduced Pd/Al2O3 indicating formation of Pd-rich alloy nanoparticles; however, reduced catalysts prepared by (iii) [Pd(NH3)4]2+ impregnation of calcined Re/Al2O3 and subsequent re-calcination did not. Re LIII X-ray absorption edge shifts were used to determine average Re oxidation states after reduction at 400°C. XAFS spectroscopy and high-angle annular dark field (HAADF)-scanning transmission electron microscopy (STEM) revealed that a reduced 5 wt.% Re/Al2O3 catalyst contained small Re clusters and nanoparticles comprising Re atoms in low positive oxidation states (~1.5+) and incompletely reduced Re species (primarily Re4+). XAFS spectroscopy of the bimetallic catalysts evidenced Pd-Re bonding consistent with Pd-rich alloy formation. Pd and Re total first-shell coordination numbers suggest that either Re is segregated to the surface (and Pd to the core) of alloy nanoparticles and/or segregated Pd nanoparticles are larger than Re nanoparticles (or clusters). The Cowley short-range order parameters are strongly positive indicating a high degree of heterogeneity (clustering or segregation of metal atoms) in these bimetallic catalysts. Catalysts prepared using the Pd(NH3)4[ReO4]2 double complex salt (DCS) exhibit greater Pd-Re intermixing but remain heterogeneous on the atomic scale.
Keywords:
TPR
; TPHD
; PdHx
; EXAFS
; XANES
; CO chemisorption
; HAADF-STEM
1. Introduction
Over the past 10 to 15 years, rhenium has been investigated extensively in monometallic and bimetallic heterogeneous catalysts for (selective) hydrogenation reactions [1]. Concurrently, catalytic production of fuels and chemicals from biomass became an area of intense research. Pyrolysis of hemicellulose leads to furfural and related compounds, and furfuryl alcohol is a monomer for resins with many applications [2]. Selective hydrogenation of furfural to furfuryl alcohol poses the challenge of selective aldehyde hydrogenation without either decarbonylation to furan or ring-opening to diols. Determining the nature of the active site in Re catalysts poses a challenge, as it is difficult to reduce oxophilic Re completely, especially on γ-Al2O3. In most cases, metallic Re species coexist with ReOx species, e.g., Re4+ and Re7+. A detailed study of a 0.7 wt.% Re/MOR/Al2O3 catalyst by Bare, et al. used X-ray absorption fine structure (XAFS) spectroscopy, scanning transmission electron microscopy (STEM), X-ray photoelectron spectroscopy (XPS) and temperature-programmed reduction (TPR) in conjunction with density functional theory (DFT) calculations to develop a model of supported Re species (perrhenate ions, Re atoms, and metal clusters) in the calcined and reduced catalysts [3]. Dumesic and coworkers have studied hydrogenolysis and ring-opening of tetrahydrofurfuryl alcohol and the related compound tetrahydropyran-2-methanol over RhRe/SiO2 [4]. Coupled with DFT calculations, their experimental results indicated that in an aqueous reaction medium ReOx species are hydroxylated and because of the strong Re-O bond Re-OH effectively acts as a Bronsted acid and adjacent Rh sites provide the hydrogenation-dehydrogenation function. Tomishige and coworkers have studied several Group VIII-Re bimetallic catalysts using XAFS spectroscopy and XPS, including Rh-Re [5,6], Ir-Re [7], Pt-Re [8], and, in particular, Pd-Re/SiO2 for the selective hydrogenation of fatty acids to alcohols [9]. They inferred that the active sites were at the interface between ReOx clusters and Group VIII metal nanoparticles. Previous research has shown that PdRe/Al2O3 catalysts prepared using a variety of precursors and preparation methods exhibit much higher activity for selective hydrogenation of furfural to furfuryl alcohol than either of the respective monometallic catalysts [10,11,12]. We inferred from the results of TPR, H2 and CO chemisorption, CO diffuse reflectance infrared Fourier transform spectroscopy (DRIFTS) and high-angle annular dark field (HAADF)-STEM with energy-dispersive X-ray (EDX) spectroscopy that Re clusters decorate the surfaces of supported Pd nanoparticles in these catalysts.
The structures of PdRe/Al2O3 catalysts are expected to be highly heterogeneous based on the large asymmetric miscibility gap in the palladium-rhenium phase diagram [13,14]. Alloys containing up to 16% Re-84% Pd are reported, and two solid solutions are present above 14% Re-86% Pd. X-ray diffraction (XRD) data are only reported for a 88 at.% Pd-12 at.% Re alloy [13]. The solid solubility of Pd in Re is much lower (<5% and some authors claim <1% [15]). The strong interaction of Re with γ-Al2O3 provides another driving force for Re segregation. Early research on PdRe/Al2O3 catalysts was performed contemporaneously by Ziemecki, et al. [15,16] and Meitzner, et al. [17]. Ziemecki, et al., prepared catalysts using a sequential impregnation method wherein an aqueous solution of the Re precursor (Re2O7) was added to a reduced and passivated Pd/Al2O3 catalyst [16]. Ziemecki, et al., observed decreased H/Pd ratios for β-PdHx formed during cooling after TPR in H2 and repeating the ramp [15]. The decreased desorption of H2 was correlated to alloy formation in a PdRe/Al2O3 catalyst as well as bulk samples made by impregnation Pd black with Re2O7 and KReO4. In situ XRD spectra suggested that two PdRe solid solutions had formed [16]. Using EXAFS spectroscopy, Meitzner, et al. [17] inferred alloy formation in a 1:1 atomic ratio Pd-Re catalyst prepared by incipient wetness co-impregnation using a solution of Pd(NO3)2 and HReO4. Karpinski and coworkers [18,19,20] investigated a series of PdRe/Al2O3 catalysts prepared by sequential impregnation for hydrodechlorination and alkane reforming. Their work also relied heavily on the suppression of hydride formation and XRD to detect alloy formation.
In this work, we investigated a series of PdRe/Al2O3 catalysts prepared by co-impregnation and sequential impregnation using pulse CO chemisorption, TPR, temperature-programmed hydride decomposition (TPHD), X-ray absorption near edge structure (XANES) spectroscopy, and extended X-ray absorption fine structure (EXAFS) spectroscopy. These catalysts (with one exception) are the same ones described in our previous publications on selective furfural hydrogenation [10,11]. Increased furfural hydrogenation activity and selectivity was hypothesized to result from Re adatoms (and clusters) on the surfaces of Pd metal particles, as evidenced CO and H2 chemisorption, CO DRIFTS and HAADF-STEM with EDX mapping. Herein, TPHD and EXAFS spectroscopy provide complementary evidence of PdRe alloy formation and Re segregation in this series of catalysts.
2. Experimental
2.1. Catalyst Preparation
The supported metal catalysts were prepared by incipient wetness impregnation of γ-Al2O3 (183 m2/g BET surface area, 0.80 cm3/g total pore volume) purchased from Grace Davison (MI-309). The bimetallic catalyst preparation methods have been described previously including co-impregnation (CI) and various sequential impregnation (SI) methods [10,11]. Two palladium precursors: [Pd(NH3)4(NO3)2] (tetraammine, TA) [10 wt% solution, 99% Pd (metals basis) Aldrich)] and Pd(NO3)2 (nitrate, N) [99.9% Pd (metals basis), Strem)] and one rhenium precursor: HReO4 (perrhenic acid, H) [76.5 wt% solution, 99.99% Re (metals basis), Acros Organics] were used. After impregnation, the resultant pastes were dried overnight at 110°C, then crushed and calcined typically at 350°C for 1 h (5°C/min heating rate) in 0.6 L/min zero-grade air (National Welders). Pd3Re5-SI and Pd3Re5-SI* were not calcined after HReO4 addition to the previously reduced Pd3-N and Pd3-TA catalysts, respectively. PdRe/Al2O3 catalyst preparation using the double-salt complex (DCS), Pd(NH3)4[ReO4]2, has described previously [11]. The resultant Re5Pd1.5-DCS catalyst was not calcined before reduction.
2.2. Catalyst Characterization
Specific surface areas were measured by N2 physisorption using a Micromeritics ASAP 2020c instrument. Catalysts were degassed at 200°C for 2 h prior to N2 (National Welders, research grade) adsorption measurements over a pressure range of 0.06-0.26 atm at -196°C. Specific surface areas were determined using a standard 5-pt. Brunauer-Emmett-Teller (BET) analysis. Pulse CO chemisorption was performed using a Micromeritics 2920 Autochem II . After in situ reduction at 400°C for 1 h in 5% H2/Ar (certified, National Welders), the sample was cooled to 35°C and 0.5 mL pulses of 5% CO/He (certified, National Welders) were administered until the peak area did not change between consecutive pulses.
2.6. TPR and TPHD
TPR and TPHD experiments were performed using a Micromeritics 2920 Autochem II equipped with a thermal conductivity detector (TCD) for monitoring H2 uptake/desorption. Catalysts were cooled to -50°C in flowing He (UHP, National Welders), and then, the gas was switched to 5% H2/Ar (Machine and Welding Supply, certified mixture). Both gases were purified using H2O/O2 traps (Oxilab). Once the TCD baseline was stable, the sample was heated at 10°C/min to 400°C and held for 1 h. Some samples, particularly Re/Al2O3 catalysts, were heated to 800°C. Hydride decomposition experiments were performed on Pd-containing samples by cooling to -50°C in H2/Ar after 400°C reduction. A second ramp at 10°C/min to 400°C then proceeded to give TPHD profiles.
2.7. XAFS Spectroscopy
XAFS spectra were measured at the Advanced Photon Source at Argonne National Laboratory on beamline MR-CAT-10BM. Catalyst samples were reduced in a stream of 3.5% H2/He (certified, Airgas), cooled to room temperature, and purged in He (UHP, Airgas). Pd foil (0.05 mm thick) and Re metal powder (350 mesh, 99.99% Re Strem) were used to calibrate the monochromator and served as references during experiments. Catalysts were measured in transmission mode after being pressed into a cylindrical “six-shooter” as described in [21] to enable simultaneous reduction of six samples and measurement at the Pd K- and Re LIII-edges. During scans at the Pd K-edge (24350 eV), the I0 chamber was filled with a mixture of 40% N2- 60% Ar and the It chamber with 100% Ar; for the Re LIII-edge (10535 eV), mixtures of 95% N2-5% Ar in I0 and 30% N2-70% Ar in It were used.
The EXAFS signal was removed from the background using Athena data processing software [22]. Fourier transforms of the EXAFS were fit using Artemis [23] and FEFF references generated by ATOMS [23] and the appropriate lattice parameters for Re and Pd [24] and for NH4ReO4 [25]. A Pd-Re FEFF reference was generated by substituting 6 of the 12 nearest neighbors in an fcc lattice at the average Pd-Pd and Re-Re bond length (2.75 Å). The amplitude reduction factors, S02, 0.76 for Pd and 0.78 for Re, were determined using Pd foil and Re metal powder. The coordination number (N), bond length or interatomic distance (R), Debye-Waller factor (σ2) and inner potential shift (ΔE0) are reported for each path based on simultaneous kn (n=1-3) fitting of the Fourier transform. The Pd K-edge fitting ranges were: k-space 2.7-14.0 Å-1 and R-space 1.0-3.0 Å. The Re LIII-edge fitting ranges were k-space 3.6-14.1 Å-1 and R-space 1.3-3.1 Å.
2.8. HR-STEM-EDX
An aberration-corrected FEI Titan 80-300 electron microscope was used for high-resolution STEM. EDX spectra were captured using the microscope’s HAADF detector equipped with SuperX EDS system comprising four Bruker silicon drift detectors. The voltage was set to 200 kV. Samples were reduced ex situ at 400°C, transferred to a glove box in a N2-purged glove bag. Carbon-coated copper grids (Ted Pella) were dipped into the dry catalyst powder in the glove box under N2. Grids were briefly exposed to ambient air when putting the grid into the sample holder and inserting the holder into the microscope.
3. Results and Discussion
3.1. Catalyst Composition and Pulse CO Chemisorption
The metal precursor(s), calcination conditions and metal loadings (as determined by ICP-OES) of the catalysts are provided in Table 1. These catalysts (except Pd3Re5-SI*) are the same ones described in our previous publications on selective furfural hydrogenation [10,11]. The catalyst nomenclature is consistent with that used in previous publications [10,12] and indicates the metal(s), nominal weight loadings, precursors (monometallics and DCS) and order of impregnation (for SI catalysts only). The BET surface areas of selected catalysts (Table 2) are equivalent (or nearly so) to that of the γ-Al2O3 support (183 ± 10 m2/g).
Pulse CO chemisorption data (Table 2) were measured after in situ reduction in flowing 5% H2/He at 400°C for 1 h and cooling to 35°C to avoid potential re-oxidation of Re during in vacuo heating for volumetric chemisorption measurements. When compared to previous volumetric CO chemisorption results [10,11], the CO/M values are ~25% greater for the Pd/Al2O3 and PdRe/Al2O3 catalysts; however, the pulse CO/Re value for Re5-H is ~100% higher than the volumetric value (0.098). The CO/Re ratio of Re5-H suggests a low dispersion and relatively large supported Re particles; however, we will demonstrate (vide infra) that the low CO/Re ratio is because of other factors (e.g., incomplete reduction, metal-support interactions). In situ CO DRIFTS experiments (Figure S1, Supplementary Materials) indicate that heating the reduced Re5-H catalyst to 400°C in flowing He results in ~50% loss of CO chemisorption capacity. This behavior is consistent with oxidation of the supported Re nanoparticles by surface hydroxyl groups [26,27]. We suggest that in vacuo heating to 400°C during the volumetric chemisorption experiments similarly resulted in oxidation of supported Re nanoparticles and loss of CO chemisorption capacity. Previous in situ DRIFTS studies have evidenced linear and doubly bridged CO species on Pd and linear CO species on Re [10,11]. The pulse CO chemisorption uptakes also include contributions from segregated Re species (atoms, clusters, nanoparticles) on γ-Al2O3 which were not included in volumetric uptake measurements. We speculate that Re associated with Pd particles mainly contributed to volumetric CO chemisorption by the bimetallic catalysts [10,11].
The pulse CO chemisorption data reveal that the Pd precursor has a determining influence on the dispersions of the Pd/Al2O3 and PdRe/Al2O3 catalysts. The CO/Pd ratios for Pd3-TA and Pd3-N indicate that the former has a much higher dispersion that we attribute to strong electrostatic adsorption of [Pd(NH3)4]2+[28]. The smaller Pd particle size in Pd3-TA was confirmed by HAADF-STEM imaging of the catalysts (Figure S2, Supplemental Materials). The Pd3-N catalyst contains 10-nm and larger Pd nanoparticles, whereas the Pd3-TA catalyst contains a bimodal distribution of small 1- and ~4-nm Pd nanoparticles. For Pd1.5-TA, the combined effects of the TA precursor and its lower loading result in the highest dispersion. The CO uptakes of bimetallic catalysts prepared from the N precursor are greater than that of Pd3-N, but less than the sum of the CO uptakes of the respective monometallic catalysts (Pd3-N and Re5-H). In contrast, the CO uptakes of the bimetallic catalysts prepared from the TA precursor are equivalent to (or slightly less than) that of the respective Pd/Al2O3 catalysts (Pd3-TA and Pd1.5-TA). Consequently, the CO/M (M = Pd + Re) ratios of the Pd3Re5-CI and Pd3Re5-SI catalysts are equivalent to that of Pd3-N, whereas the CO/M values for Re5Pd3-SI and Re5Pd1.5-DCS are lower than that of Pd3-TA and Pd1.5-TA, respectively. Moreover, the Pd3Re5-CI and Pd3Re5-SI catalysts have lower CO/M ratios than the Re5Pd3-SI and Re5Pd1.5-DCS catalysts. Interestingly, the CO/Pd ratios of Re5Pd3-SI and Re5Pd1.5-DCS are closely similar to those of Pd3-TA and Pd1.5-TA, respectively.
3.2. Temperature-Programmed Reduction (TPR)
The TPR profiles of the PdRe/Al2O3 catalysts (Figure 1) exhibit a wide range of strong H2 uptake features between 0 and 400°C. TPR profiles for these catalysts (except Pd3Re5-SI*) have been reported elsewhere [10,11]; however, some important comparisons were omitted and H2 uptakes were not quantified. The remarkable diversity of the profiles belies the closely similar catalyst compositions. The low-temperature TPR peaks (0-50°C) are assigned Pd reduction, as verified by the profiles of monometallic Pd catalysts [10]. The TPR peak temperature for Re5-H is ~295°C; however, H2 uptake continues above 400°C indicating reduction of isolated Re ions interacting strongly with the γ-Al2O3 support [3,29]. Re reduction in the bimetallic catalysts occurs at lower temperatures than in Re/Al2O3. This effect has been explained by migration of [ReO4]- (perrhenate) species to hydrogen-covered Pd nanoparticles on highly hydroxylated γ-Al2O3 [16]. For example, Pd3Re5-SI* which contains small Pd nanoparticles derived from the TA precursor and was not calcined after aqueous HReO4 addition exhibits a single broad TPR peak centered at ~70°C. In contrast, Pd3Re5-SI which was similarly prepared except contained larger Pd nanoparticles derived from the N precursor has Re reduction features at higher temperatures that are closely similar to those of Pd3Re5-CI. All of the bimetallic catalysts except Re5Pd1.5-DCS contain low-temperature Pd reduction peaks (or contained pre-reduced Pd nanoparticles) and Re reduction features at higher temperatures. Thus, Pd nanoparticles are formed (or present) first and subsequently Re reduction occurs via migration of perrhenate ions to hydrogen-covered Pd particles. As reported previously, the reductive decomposition of the DCS precursor in Re5Pd1.5-DCS begins at ~100°C and peaks at ~160°C with shoulders at ~200 and ~250°C evidencing nearly simultaneous and complete reduction of Pd2+ and Re7+ species [11].
Quantitative H2 uptake data for the PdRe/Al2O3 and Re/Al2O3 catalysts during TPR to 400°C in 5% H2/Ar are given in Table 3. The average Re oxidation state (n+) after TPR was estimated by assuming that Pd reduction was complete (consuming 2H/Pd) and that the remaining H2 consumption went toward reduction of Re7+ to Ren+. The resulting values decrease from +2.25 for Re5-H to -0.42 for Re5Pd1.5-DCS in the order: Re5-H > Re10Pd3-SI > Re5Pd3-SI > Pd3Re5-SI* > Pd3Re5-SI > Pd3Re5-CI > Re5Pd1.5-DCS. Bare, et al. [3] reported a similar quantitative TPR results for Re/MOR/Al2O3 after reduction at 500 and 700°C. The Re5Pd1.5-DCS catalyst was completely reduced and Pd3Re5-CI nearly so. The Re5Pd3-SI and Re10Pd3-SI catalysts contain more Re in higher oxidation states after reduction. The final Re oxidation states for Pd3Re5-SI and Pd3Re5-SI* may be overestimated because of the initial presence of reduced Pd. The percentage Re7+ reduction for each catalyst was calculated as: (1-n+/7) x 100% (Table 3).
3.3. Temperature-Programmed Hydride Decomposition (TPHD)
Supported Pd nanoparticles form bulk hydride phases (α- and β-PdHx) [30]. The stoichiometry depends on particle surface-to-volume ratio and hence particle size [31]. The H/Pd ratio increases with Pd particle size [31,32] ultimately saturating at the bulk value (β-PdHx ~0.65). The H/Pd ratio is diminished by alloying Pd with another transition metal, such as Au, Ag, or Re [15,30]. Ziemecki and coworkers first exploited this effect to infer that PdRe alloy particles were formed in PdRe/Al2O3 catalysts [15]; however, Re and Pd are only partially miscible in the bulk, and the bulk PdRe alloy phase(s) contains a maximum of ~16% Re. More recently, Malinowski, et al. [19] used TPHD (referred to as differential TPR) to characterize a series of PdRe/Al2O3 catalysts having a wide range of compositions prepared by SI using a procedure similar to that employed for Pd3Re5-SI. In this section, we use TPHD to detect disruption of β-PdHx formation associated with Pd-Re interactions (i.e., alloy and near-surface alloy formation) in a series of PdRe/Al2O3 catalysts.
The large asymmetric H2 evolution peak at 50-55°C in the TPHD profile of Pd3-N (Figure 2a) is assigned to β-PdHx decomposition [15,19]. The corresponding peak for Pd3-TA (Figure 2b) is smaller, and the hydride decomposes at lower temperature (~40°C) indicating lower stability and consistent with a smaller Pd particle size. Moreover, the main peak is broad and strongly skewed toward lower temperatures, and there is a weak low-temperature H2 evolution feature at approximately -25°C. The TPHD spectrum of Pd1.5-TA (not shown) contains an even smaller β-PdHx decomposition peak at ~45°C. The quantitative H/Pd ratios for the main β-PdHx decomposition peak (at >0°C) and the total hydrogen evolved in TPHD are given in Table 3. Because Peaks A and B (Figure 2a) overlap in some catalysts (e.g., Pd3-TA), we have chosen to combine the areas and report the sum (as >0°C) in Table 3. For the Pd/Al2O3 catalysts, there is a very strong linear correlation of the H/Pd (>0°C) ratio with the pulse chemisorption CO/Pd ratio with a slope of -1.0 and an intercept of 0.71 (near bulk maximum)—consistent with the expected Pd particle size effect [31,32].
The TPHD spectra of the PdRe/Al2O3 catalysts prepared using the N precursor (Figure 2a) show strong suppression of Peak A (when compared to Pd3-N) and the appearance Peaks B and C at approximately 15 and -25°C, respectively. H2 evolution at these low temperatures evidences decomposition of less stable hydrides, e.g., those associated with Pd-Re alloy or bimetallic nanoparticles. For Pd3Re5-SI (prepared by impregnating a reduced Pd3-N catalyst with HReO4), Peak A is strongly suppressed but not completely eliminated indicating that some unalloyed Pd particles remain in this catalyst; however, the ~2/3 reduction in the H/Pd ratio (Peak A) indicates that these are a minority. In contrast, Peak A is entirely eliminated in the TPHD spectrum of Pd3Re5-CI leaving only Peaks B and C which we infer are associated with Pd-Re alloy nanoparticles with different compositions. Thus, co-impregnation provides for better intermixing of Pd and Re in this catalyst; however, the alloy particles are relatively large consistent with the pulse CO chemisorption data and as seen previously in HAADF-STEM images [10].
As reported previously, the TPHD spectrum of Re5Pd1.5-DCS (Figure 2b) does not contain any peaks indicating complete suppression of Pd hydride formation in the very small bimetallic (alloy) clusters [11]. In contrast, the β-PdHx decomposition feature at ~45°C (Figure 2b) in the PdRe/Al2O3 catalysts prepared using the TA precursor is not suppressed completely. For Re5Pd3-SI and Re10Pd3-SI, Peak A is narrower and shifted to higher temperatures relative to Pd3-TA, and the H/Pd ratios are lower and higher than Pd3-TA, respectively. We infer from these results that Re5Pd3-SI contains small Pd nanoparticles (similar to Pd3-TA) and PdRe alloy nanoparticles. The Pd particles in Re10Pd3-SI are larger, as confirmed by HAADF-STEM [10] and EXAFS spectroscopy (vide infra). In contrast, the TPHD spectrum of Pd3Re5-SI* comprises a strong Peak B and a very weak Peak C indicating that this catalyst contains primarily PdRe alloy nanoparticles.
3.4. X-ray Absorption Near-Edge Structure (XANES) Spectroscopy
The Re LIII XANES spectra of the Re/Al2O3 and select PdRe/Al2O3 catalysts (Figure 3a) contain intense white lines (edge resonances) located just above the absorption threshold. This resonance feature arises from p to d electronic transitions and provides a measure of Re oxidation state; a larger (more intense) white line indicates a higher oxidation state. The XANES spectrum of Re metal powder measured in transmission mode is shown for comparison; however, its white line has likely been truncated somewhat by thickness effects [3]. All the catalysts, except Re5Pd3-DCS, have similar white line intensities, and the subtle differences correlate with small shifts in the Re LIII edge position (absorption threshold). The white line intensity of Re5Pd3-DCS is lower than the others, and its edge position is lower. Re LIII edge shifts were used to determine average Re oxidation states (Figure 3b). Measurements of Re oxidation state from edge shifts are based on a calibration curve generated using several Re compounds: Re metal, ReO2, ReO3, and Re2O7. An edge shift of 4.0 eV was observed for the Re7+ compound consistent with the literature [3] and for the calcined Re5-H catalyst (datum not shown). Average Re oxidation states for the catalysts estimated using this calibration curve are shown in Figure 3b. Following pretreatment in 3.5% H2 at 400°C for 1 h, the average Re oxidation state in Re5-H was +2.4, equivalent to the average oxidation state estimated by H2 uptake in TPR up to 400°C of +2.2. Edge shifts for the PdRe/Al2O3 catalysts after reduction are less than for Re5-H. The average oxidation states determined for Re5Pd3-SI and Re10Pd3-SI are equivalent (+2.0) and slightly higher than Pd3Re5-SI* (+1.9) and Pd3Re5-CI (+1.8). Interestingly, the fully reduced Re5Pd1.5-DCS catalyst has the lowest average Re oxidation state (+1.6), but it is nonzero. A strong linear correlation between the XANES-derived Re oxidation states and TPR final oxidation states in Table 3 is observed (Figure 4). The y intercept indicates that fully reduced Re species in each catalyst have an oxidation state of approximately +1.5 units. From these data, we infer that there are two contributions to the average Re oxidation state after reduction: incompletely or unreduced Re species (e.g., Re4+ and Re7+) and a metal-support interaction leading to positively charged Re clusters [3]. This hypothesis is further elucidated using EXAFS spectroscopy in the next section.
3.5. EXAFS Spectroscopy
The k2-weighted EXAFS spectra and corresponding Fourier transform (FT) magnitudes of the PdRe/Al2O3 catalysts at the Pd K edge (Figure 5) exhibit very similar features. The main peak corresponds to the first-shell Pd-Pd distance in the metal; however, there are significant low-R side lobes. The most evident differences are the chi amplitudes and corresponding FT magnitudes that decrease in order Re10Pd3-SI > Pd3Re5-CI > Re5Pd3-SI > Pd3Re5-SI*. The Pd higher shells exhibit a similar trend. In comparison, the k2-weighted chi data and FTs of the Re/Al2O3 and PdRe/Al2O3 catalysts at the Re LIII edge (Figure 6) indicate the presence of multiple backscatterers (e.g., Re, Pd, O) in the first coordination shell. The lower EXAFS amplitudes at high k (Figure 6a) for the bimetallic catalysts arise from interference between the Re-Re and Re-Pd backscattering contributions. Destructive interference is maximum near the node at ~11-Å-1. Of course, smaller Re nanoparticles with lower Re-Re coordination numbers will also have lower the high-k amplitudes. The FT peaks at ~2.4 and 2.8 Å are comprised of Re-Re (major) and Re-Pd (minor) contributions, and strong interference affects their magnitudes and shapes. To illustrate, simulated FTs were generated using FEFF6 and an fcc model by replacing Pd atoms with Re atoms in the first coordination shell at a weighted average bond distance (Figure S3a), and vice versa at the Re edge (Figure S3b). These simulations are meant only for semiquantitative illustration, and fits to the experimental data are discussed later; however, it is clear that the greatest destructive interference occurs with the insertion of ~3 Pd atoms within the 12-member first coordination shell of Re. The analogous spectra generated at the Pd K-edge show that significant destructive interference only exists for Re backscatterers about a Pd absorber at high Re:Pd ratios, i.e., 1:1 or greater. A small fraction of Re around a Pd absorber only creates minimal destructive interference consistent with the experimental spectra in Figure 5. Because the bulk thermodynamics of PdRe alloys limits the heteroatom concentration to ~16% [13], strong destructive interference is only expected at the Re LIII edge. The Re LIII EXAFS spectra of the catalysts are complicated further by the presence of O backscatterers in the first coordination shell. The peak at ~1.9 Å in the FT of Re5-H is indicative of Re-O bonding; smaller Re-O contributions are found also in the EXAFS spectra of the bimetallic catalysts.
The Re LIII FT EXAFS spectrum of Re10Pd5-SI most closely resembles that of Re5-H, indicating the presence of segregated metallic Re species, as previously inferred from TPR and HAADF-STEM [10]. The 2.8-Å peak appears broader with lower intensity in the spectrum of Pd3Re5-CI. This peak is diminished further in the FT spectra of Pd3Re5-SI* and Re5Pd3-SI, and the residual intensity shifts to ~3.0 Å. Conversely, the peak at ~2.4 Å has maximum intensity for Pd3Re5-CI and remains relatively strong for Pd3Re5-SI* and Re5Pd3-SI. The peak at ~1.9 Å associated with Re-O contributions is very similar for the three 1:1 Pd:Re bimetallic catalysts. The higher coordination shell peaks (i.e., features at >3.5 Å) are more intense for Re5-H and Re10Pd3-SI indicating the presence of larger Re nanoparticles in these catalysts. To a first approximation, the magnitudes of the higher shell peaks scale with the first-shell peak at 2.8 Å. Next, we will discuss quantitative fitting of the EXAFS spectra using FEFF6 models for the Re-O, Re-Re and Re-Pd paths.
The Re LIII first-shell EXAFS spectrum of the as-prepared Re5-H catalyst (after calcination and measured in air) could be fit very well using 4 Re-O backscatterers at 1.73 Å consistent with the structure of perrhenate ion, [ReO4]- (Table 4). The overall best fit to the Re LIII first-shell EXAFS spectrum of Re5-H after reduction in flowing 3.5% H2 at 400°C for 1 h is compared with the experimental data in r space in Figure 7 [FT magnitude (a) and real (Re) part (b)]. This fit was achieved using only the Re-Re and Re-O1 paths shown. The fitting parameters (Table 4) indicate a mixture of small metallic Re particles and ReOx species. The average Re-Re distance (2.74 Å) is equal to the average of the two Re-Re distances in the hcp metal. The Re-O1 distance (2.01 Å) is equivalent to that found in bulk ReO2 suggesting that Re4+ is most prevalent non-zero oxidation state. Incomplete reduction of Re7+ to Re4+ has been observed in previous studies of Re/Al2O3 catalysts by electron spin resonance [33] and XPS [34]. A similar Re-O distance was also reported by Bare, et al. [3] and Chen, et al. [5]. Adding a second Re-O2 path with a bond distance corresponding to Re7+ oxide (1.73 Å) improved the fit slightly (Table 4). The EXAFS spectroscopy results for Re5-H are consistent with HAADF-STEM images of this catalyst showing ~1-nm Re clusters (Figure 8a) and some larger Re nanoparticles (Figure 8b). The Re clusters are relatively uniform in size. The composite particle size distribution derived from these images is shown in Figure S4.
Excellent simultaneous fits at the Pd K and Re LIII edges were obtained for the bimetallic catalysts using two homometallic backscattering paths (Pd-Pd and Re-Re), two heterometallic paths (Pd-Re and Re-Pd), and a single Re-O path. Debye-Waller factors were evaluated for each homometallic bond. The heterometallic bond distances and Debye-Waller factors were constrained to be equal at the Pd K and Re LIII edges. The Pd-Re partial coordination number was constrained to be equal to the Re-Pd partial coordination number multiplied by the molar ratio of Re to Pd in the catalyst, i.e., the Via criterion [35], ensuring consistency in fitting the heterometallic coordination numbers at each edge. The Debye-Waller factor for Re-O was set to 0.005 Å2 based on experience and fitting the EXAFS spectrum of the calcined Re5-H catalyst. The overall best fits to the Pd K edge and Re LIII edge first-shell EXAFS spectra after reduction in flowing 3.5% H2 at 400°C for 1 h are compared with the experimental data in r space for Pd3Re5-CI and Re5Pd3-SI in Figure 9 and Figure 10, respectively. The fits clearly evidence that the homometallic backscattering paths are the dominant contributions; however, the heterometallic paths are significant, especially at the Re LIII edge. Destructive interference between the Re-Re and Re-Pd paths can be seen by comparing the real parts of the Fourier transforms. The Re-O backscattering paths are minor contributions for both catalysts.
The quantitative fitting results (Table 4) show good consistency in the homometallic and heterometallic distances and Debye-Waller factors across the series of bimetallic catalysts. The R factors (one at each edge) evidence excellent agreement with the experimental data. In agreement with previous reports [15,16,17,19], the heterometallic and Re-Re distances are shorter than in the bulk metals. An early EXAFS spectroscopy investigation of a PdRe/Al2O3 catalyst prepared by co-impregnation observed contraction of the Pd-Re and Re-Re bonds from 2.74 Å in the metals to 2.72 Å for Re-Re and 2.67 Å for Pd-Re [17]. Our fitting parameters evidence heterometallic distances of 2.69 to 2.71 Å depending on the preparation. Only in Re10Pd3-SI, which contains segregated Re nanoparticles, is the Re-Re distance equivalent to the bulk metal (or nearly so). Ziemecki, et al. employed in situ XRD of reduced PdRe/Al2O3 (prepared by impregnating Pd/Al2O3 with Re2O7) and observed two distinct alloy phases, both with smaller lattice parameters (3.84 and 3.88 Å) than Pd (3.89 Å) [15,16]. These lattice parameters correspond to metal-metal distances of 2.71 and 2.73 Å, respectively, which are equivalent to the Pd-Re and Pd-Pd bond distances from EXAFS spectroscopy of Pd3Re5-CI. A shorter Pd-Re distance (relative to the bulk metals) also was reported by Malinowski, et al. [19] based on XRD. Interestingly, static and dynamic disorder (as measured by Debye-Waller factors) is consistently lower for the heterometallic backscattering paths than for the homometallic paths. Combining these data with the TPHD results, the Pd3Re5-CI and Pd3Re5-SI* catalysts appear to contain PdRe alloy nanoparticles albeit with different compositions.
The total first-shell coordination numbers, heteroatom compositions and Cowley short-range order parameters at the Pd K edge and Re LIII edge are provided in Table 5. Data based on our previous EXAFS analysis of Re5Pd1.5-DCS are included for comparison [11]. The first observation is that the Pd total coordination number (NPd-M) is higher (and in most cases significantly) than the Re total coordination number (NRe-M) for each catalyst, except Re5Pd1.5-DCS where the total coordination numbers are equivalent. NPd-M > NRe-M indicates that either Re is segregated to the surface (and Pd to the core) of alloy nanoparticles and/or segregated Pd nanoparticles are larger than Re nanoparticles (or clusters). The former hypothesis appears to explain the data for Pd3Re5-CI and Pd3Re5-SI, and the latter the data for Re5Pd3-SI and Re10Pd3-SI. For Pd3Re5-CI, the coordination numbers are indicative of relatively large nanoparticles and are consistent with HAADF-STEM images showing (up to 30-nm) alloy particles [10]. For Pd3Re5-SI*, both NPd-M and NRe-M are smaller suggesting small Pd-Re alloy nanoparticles (consistent with TPHD and CO chemisorption) with Re surface segregation. For Re5Pd3-SI, NPd-Pd is much greater than NRe-Re consistent with a mixture of Pd nanoparticles and small Re clusters (consistent with TPHD and CO chemisorption) as observed by HAADF-STEM [10]. The segregated Re particles are largest in Re10Pd3-SI and smallest in Re5Pd3-SI as evidenced by the decreasing 2.9-Å peak in Figure 6b. For the 1:1 Pd:Re catalysts, there are ~11% Re nearest neighbors (NN) in the first coordination shell of Pd and ~15% Pd NN in the first coordination shell of Re. These values are also consistent with Pd-Re alloy formation via Re dissolution in Pd with either Re surface enrichment and/or the presence of segregated Re species (clusters, nanoparticles). The %Re NN (Pd) is similar for Re10Pd3-SI; however, the %Pd NN (Re) is lower than expected which we attribute to the prevalence of segregated Re nanoparticles. In contrast, the Re5Pd1.5-DCS catalyst has a much higher %Re NN (Pd) and a somewhat higher %Pd NN (Re) indicating greater intermixing in these smaller bimetallic clusters than in bulk PdRe alloys [11]. The Cowley short-range order parameter (α) was calculated from the partial coordination numbers and overall composition, as follows:
where NAB is the partial coordination number of Type A atoms (by Type B atoms), NAM is total coordination number of Type A atoms (M = A + B), and is the mole fraction of type B atoms [36]. The Cowley short-range order parameter can vary on the interval: -1 < α < 1 indicating homogeneous alloying to complete segregation of the metals. The crossover point, α = 0, distinguishes between homogeneous and heterogeneous nanoalloys. The αPd-Re) and αRe-Pd) values for the bimetallic catalysts prepared by co-impregnation and sequential impregnation are 0.67 to 0.85 (Table 5) indicating heterogeneity in local composition (e.g., segregation and clustering of like atoms). The heterogeneity seems to be slightly greater for Re atoms around Pd and for the Re10Pd5-SI catalyst. In contrast, the Cowley parameters are much smaller (but still positive) for the Re5Pd1.5-DCS catalyst indicating a tendency toward homogeneity; however, the bimetallic clusters remain heterogeneous on the local composition scale as evidenced by HAADF-STEM [11].
As evidenced by TPR and XANES, not all Re in these catalysts is reduced to metal at 400°C, and this is reflected in the Re-O contributions. The Re-O bond length is nearly constant at 2.01-2.03 Å consistent with the average first-shell Re-O bond in ReO2 [37]. This Re-O bond is similar to that found by Tomishige and coworkers in fitting the Re LIII-edge spectra of RhRe-, PtRe-, and IrRe/SiO2 catalysts [5,6,7,8]. Adding a Re-O path with a bond length of 1.73 Å (corresponding to perrhenate ion) did not improve our fits. When a second unrestricted Re-O path was added and the fit repeated, two bond lengths were found: 1.91 Å and 2.08 Å—the equatorial and axial Re-O distances in ReO2. The Re-O coordination number decreases in the order: Re5-H > Re10Pd3-SI > Pd3Re5-SI* > Re5Pd3-SI > Pd3Re5-CI > Re5Pd1.5-DCS. Average Re oxidation states were calculated using the Re-O coordination numbers assuming the ReO2 structure with octahedral coordination of Re4+ by oxygen. The results (including a datum for Re5-H) are plotted using oxidation states determining by TPR on the abscissa in Figure 4. We find a linear correlation with a closely similar slope to that found using the XANES-derived oxidation states; however, the y intercept (+0.29) is much smaller consistent with a very small residual concentration of Re4+ in Re5Pd1.5-SI. The difference in the y intercepts (+1.26) suggests a net positive charge on the supported Re clusters (including potentially single atoms). Electrostatic interaction (charge transfer) between small Re particles (clusters) and the alumina support has been posited by Bare, et al. [3], to explain edge shifts and higher-than-expected white line intensities for Re/MOR/Al2O3 catalysts reduced at 500 and 700°C in dry H2. We suggest that these cationic Re species may explain the higher oxidation state inferred from Re LIII XANES edge shifts despite the relatively low Re-O coordination numbers indicated by EXAFS spectroscopy.
4. Conclusions
The structures of PdRe/Al2O3 catalysts after reduction are highly complex and heterogeneous. Those prepared by conventional methods (co-impregnation or sequential impregnation) contain Pd-rich alloy nanoparticles with Pd@Re core-shell structures, as evidenced by EXAFS spectroscopy and suppression of β-PdHx formation. These bimetallic catalysts all exhibit low-temperature Pd TPR peaks (or contained pre-reduced Pd nanoparticles) and Re reduction features at higher temperatures. Thus, Pd nanoparticles are formed first (or initially present) and subsequently Re reduction occurs via migration of perrhenate ions to hydrogen-covered Pd particles resulting in Pd@Re core-shell alloy nanoparticles. These catalysts, however, also contain segregated Re species (similar to those found in reduced Re/Al2O3 catalysts), i.e., small clusters comprising Re atoms in low positive oxidation states (~1.5+) and incompletely reduced Re species (primarily Re4+). Employing the DCS precursor results in small PdRe clusters with compositions not predicted by the PdRe phase diagram and with greater short-range homogeneity.
Supplementary Materials
The following supporting information can be downloaded at the website of this paper posted on Preprints.org.
Acknowledgments
This work was funded by the Eastman Chemical Company through a Center of Excellence at North Carolina State University. ICP-OES analysis was performed at Eastman Chemical Company in Kingsport, TN. This research used resources of the Advanced Photon Source, a U.S. Department of Energy (DOE) Office of Science User Facility operated for the DOE Office of Science by Argonne National Laboratory under Contract No. DE-AC02-06CH11357. We gratefully acknowledge the loan of EXAFS equipment from Dr. Jeffrey Miller, and the assistance of Dr. Joshua Wright and Dr. John Katsoudas in operating beamline MR-CAT-10BM. The authors acknowledge the use of the Analytical Instrumentation Facility at NCSU, which is supported by the State of North Carolina and the National Science Foundation, and, in particular, Dr. Xiahan Sang for assistance with STEM-EDX.
References
- J. Luo, C. Liang, ACS Catal., 14 (2024) 7032-7049.
- N.E. Raymond, P.I. Angelo, in: Masonite Corporation, United States Patent 2538302, 1951.
- S.R. Bare, S.D. Kelly, F.D. Vila, E. Boldingh, E. Karapetrova, J. Kas, G.E. Mickelson, F.S. Modica, N. Yang, J.J. Rehr, J. Phys. Chem. C, 115 (2011) 5740-5755.
- M. Chia, Y.J. Pagan-Torres, D. Hibbitts, Q.H. Tan, H.N. Pham, A.K. Datye, M. Neurock, R.J. Davis, J.A. Dumesic, J.Am. Chem. Soc., 133 (2011) 12675-12689.
- K.Y. Chen, S. Koso, T. Kubota, Y. Nakagawa, K. Tomishige, Chemcatchem, 2 (2010) 547-555.
- S. Koso, H. Watanabe, K. Okumura, Y. Nakagawa, K. Tomishige, J. Phys. Chem. C, 116 (2012) 3079-3090.
- Y. Amada, H. Watanabe, M. Tamura, Y. Nakagawa, K. Okumura, K. Tomishige, J. Phys. Chem. C, 116 (2012) 23503-23514.
- T. Ebashi, Y. Ishida, Y. Nakagawa, S.-i. Ito, T. Kubota, K. Tomishige, J. Phys. Chem. C, 114 (2010).
- Y. Takeda, Y. Nakagawa, K. Tomishige, Catal. Sci. Tech., 2 (2012) 2221-2223.
- S.T. Thompson, H.H. Lamb, ACS Catal., 6 (2016) 7438-7447.
- S.T. Thompson, H.H. Lamb, J. Catal., 350 (2017) 111-121.
- S.T. Thompson, H.H. Lamb, Catalysts, 13 (2023) 1239-1257.
- Tylkina, M.A., Tsyganova, I.A., Savitskii, E.M.: Zh. Neorg. Khim. 7 (1962) 1917.
- Massalski, T.B. (editor-in-chief): “Binary Alloy Phase Diagrams”, Second Edition, Vol. 3, T.B. Massalski (editor-in-chief), Materials Information Soc., Materials Park, Ohio (1990).
- S.B. Ziemecki, J.B. Michel, G.A. Jones, React. Solid., 2 (1986) 187-202.
- S.B. Ziemecki, G.A. Jones, J.B. Michel, J. Catal., 99 (1986) 207-217.
- G. Meitzner, G.H. Via, F.W. Lytle, J.H. Sinfelt, J. Chem. Phys., 87 (1987) 6354-6363.
- M. Bonarowska, A. Malinowski, Z. Karpinski, App. Catal. A, 188 (1999) 145-154.
- A. Malinowski, W. Juszczyk, M. Bonarowska, J. Pielaszek, Z. Karpinski, J. Catal., 177 (1998) 153-163.
- W. Juszczyk, Z. Karpinski, App. Catal. A, 206 (2001) 67-78.
- E. Bus, J.T. Miller, A.J. Kropf, R. Prins, J.A. van Bokhoven, Phys. Chem. Chem. Phys., 8 (2006) 3248-3258.
- M. Newville, J. Synch. Rad., 8 (2001) 322-324.
- B. Ravel, M. Newville, J. Synch. Rad., 12 (2005) 537-541.
- C. Kittel, Introduction to Solid State Physics, J. Wiley & Sons, Inc., 5th ed., 1996, pp. 23.
- G.J. Kruger, E.C. Reynhardt, Acta Crystall., 34 (1978) 259-261.
- F. Solymosi, T. Bansagi, J. Phys. Chem., 96 (1992) 1349-1355.
- J. Okal, L. Kepinski, L. Krajczyk, W. Tylus, J. Catal., 219 (2003) 362-371.
- L. Jiao, J.R. Regalbuto, J. Catal., 260 (2008) 329-341.
- B. Mitra, X.T. Gao, I.E. Wachs, A.M. Hirt, G. Deo, Phys. Chem. Chem. Phys., 3 (2001) 1144-1152.
- F.A. Lewis, Platinum Metals Rev., 26 (1982) 20-27.
- M. Boudart, H.S. Hwang, J. Catal., 39 (1975) 44-52.
- G. Fagherazzi, A. Benedetti, S. Polizzi, A. Dimario, F. Pinna, M. Signoretto, Catal. Lett., 32 (1995) 293-303.
- M.S. Nacheff, L.S. Kraus, M. Ichikawa, B.M. Hoffman, J.B. Butt, W.M.H. Sachtler, J. Phys. Chem. C, 106 (1987) 263-272.
- J. Okal, W. Tylus, L. Kepinski, J. Catal., 225 (2004) 498-509.
- G.H. Via, K.F. Drake, G. Meitzner, F.W. Lytle, J.H. Sinfelt, Catal. Lett., 5 (1990) 25-33.
- A.I. Frenkel, Q. Wang, S.I. Sanchez, M.W. Small, R.G. Nuzzo, J. Chem. Phys., 138 (2013) 06420, and references therein.
- A. Magneli, Acta Chem. Scand., 11 (1957) 28-33.
Figure 1.
TPR profiles of the Re/Al2O3 and PdRe/Al2O3 catalysts. Original data from [10,11], except Pd3Re5-SI*.
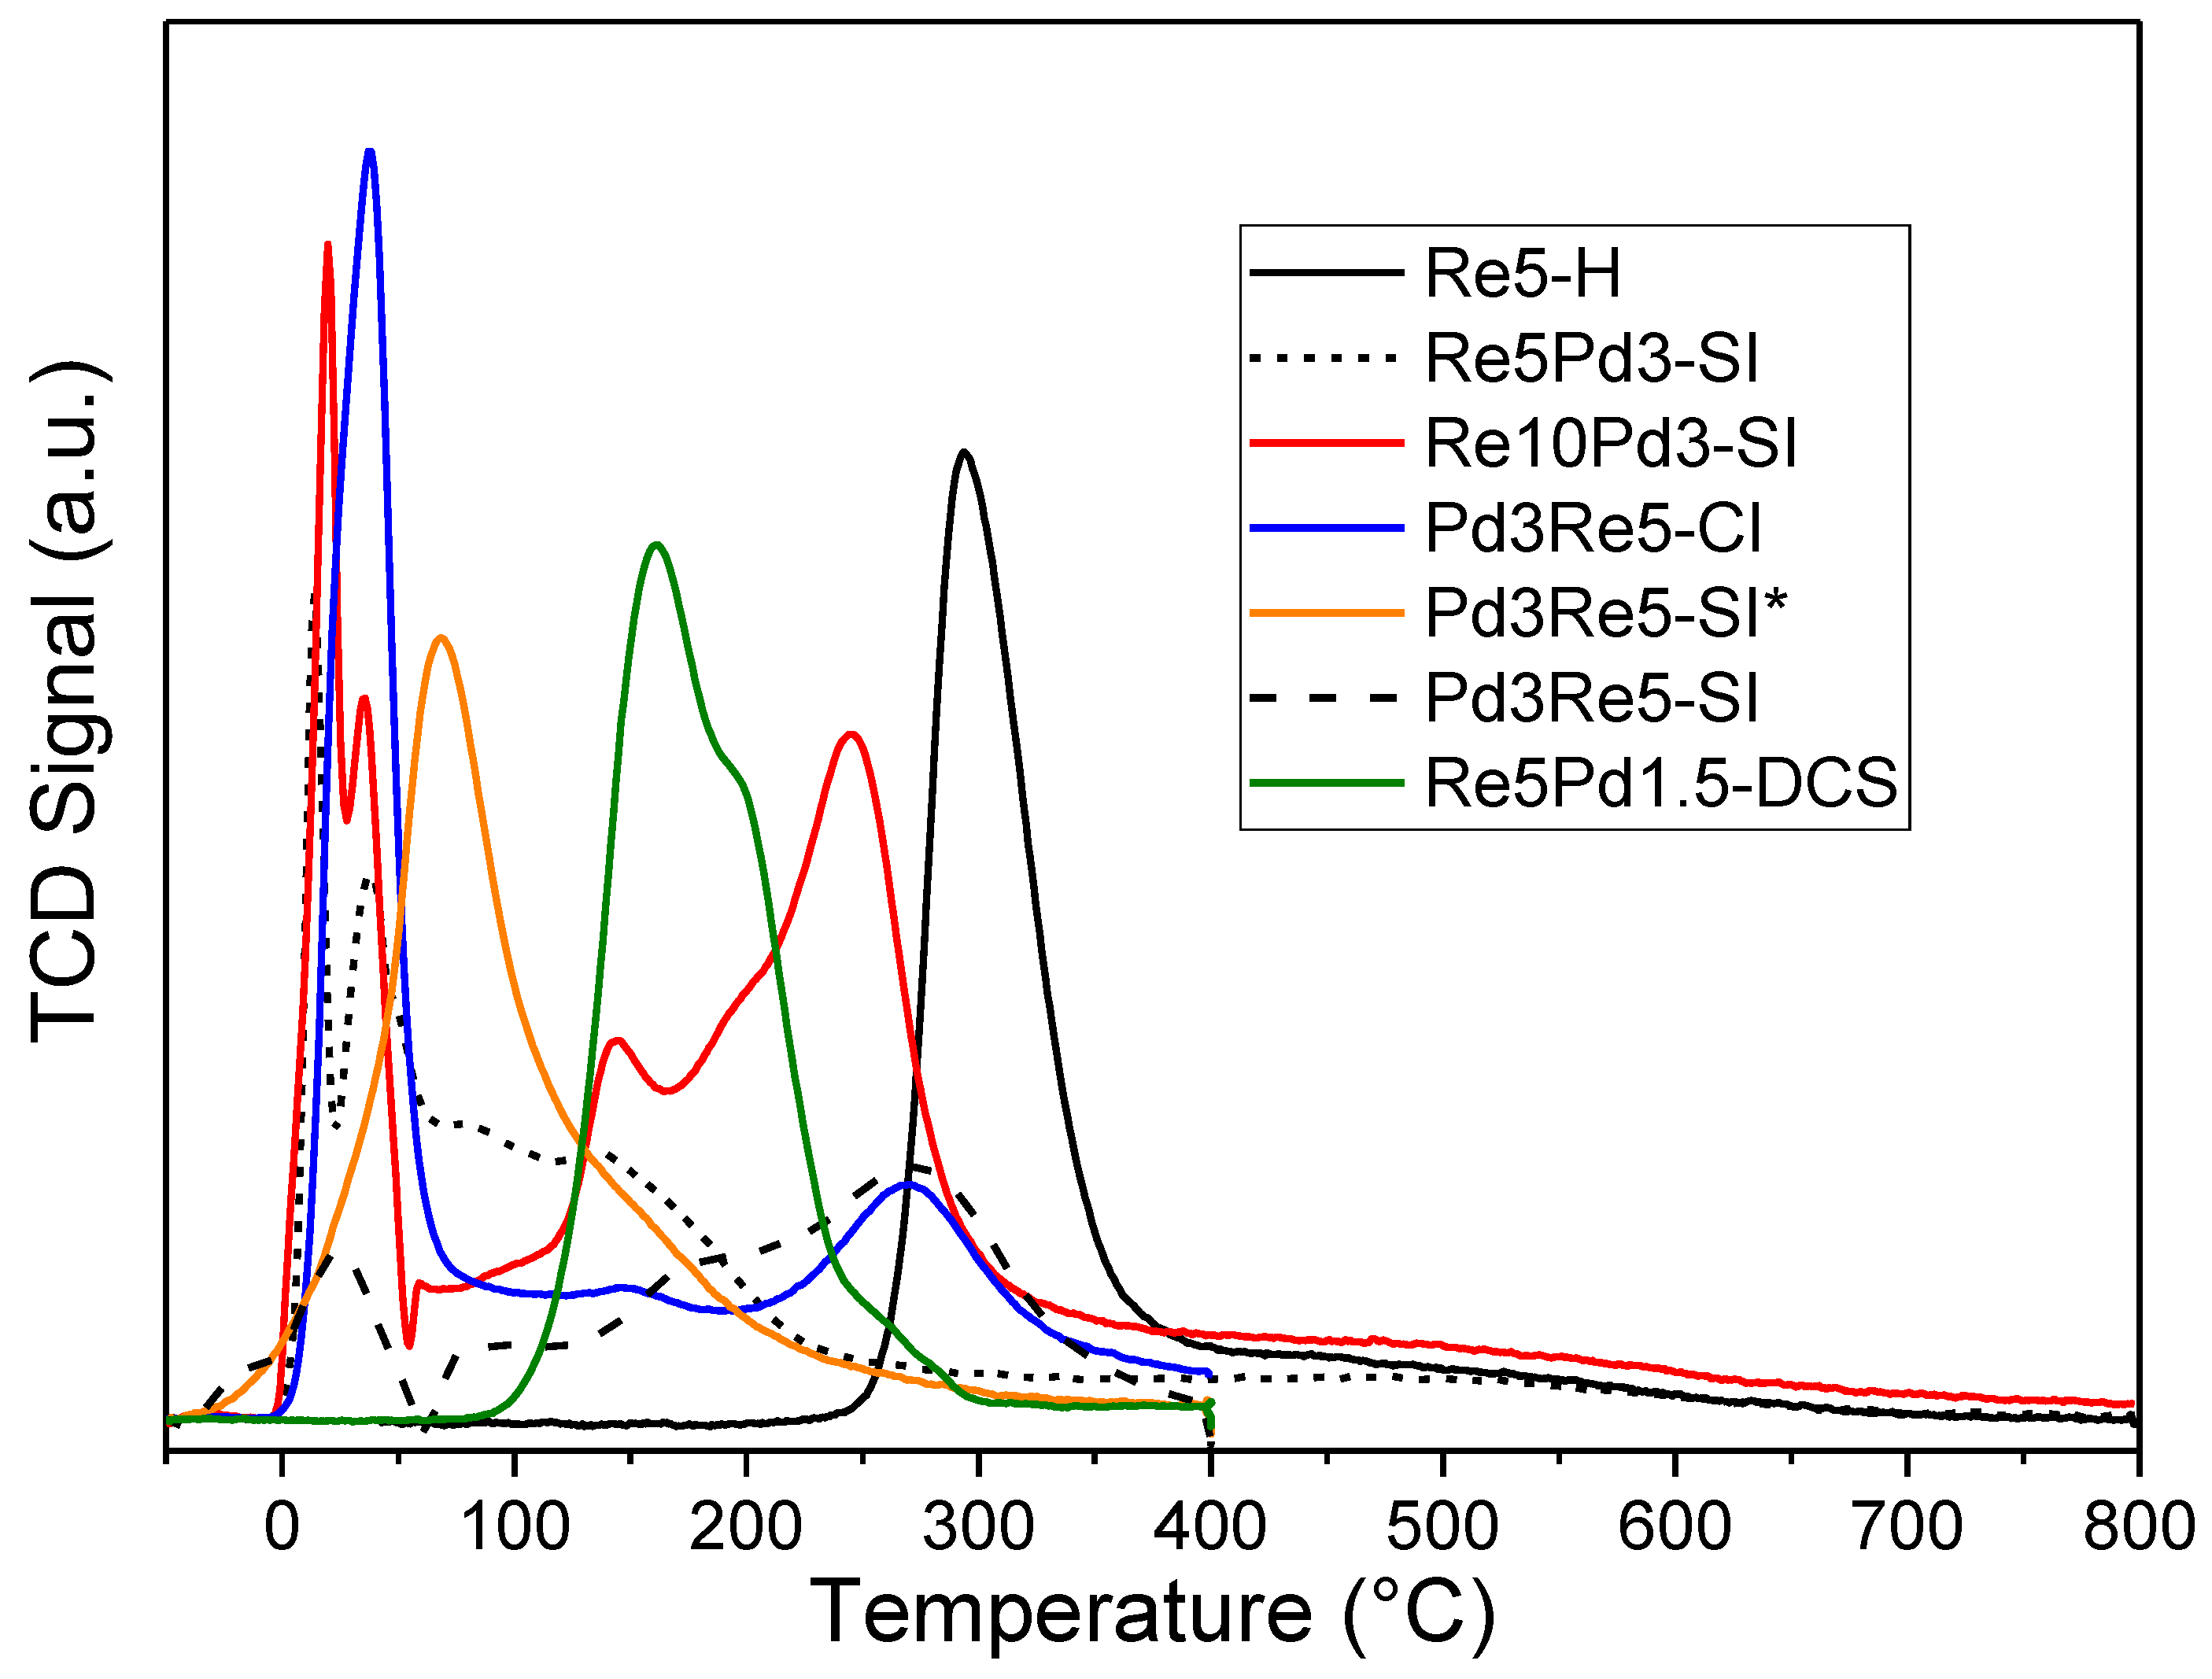
Figure 2.
TPHD spectra of catalysts following TPR and cooling in 5% H2/Ar to -50°C.
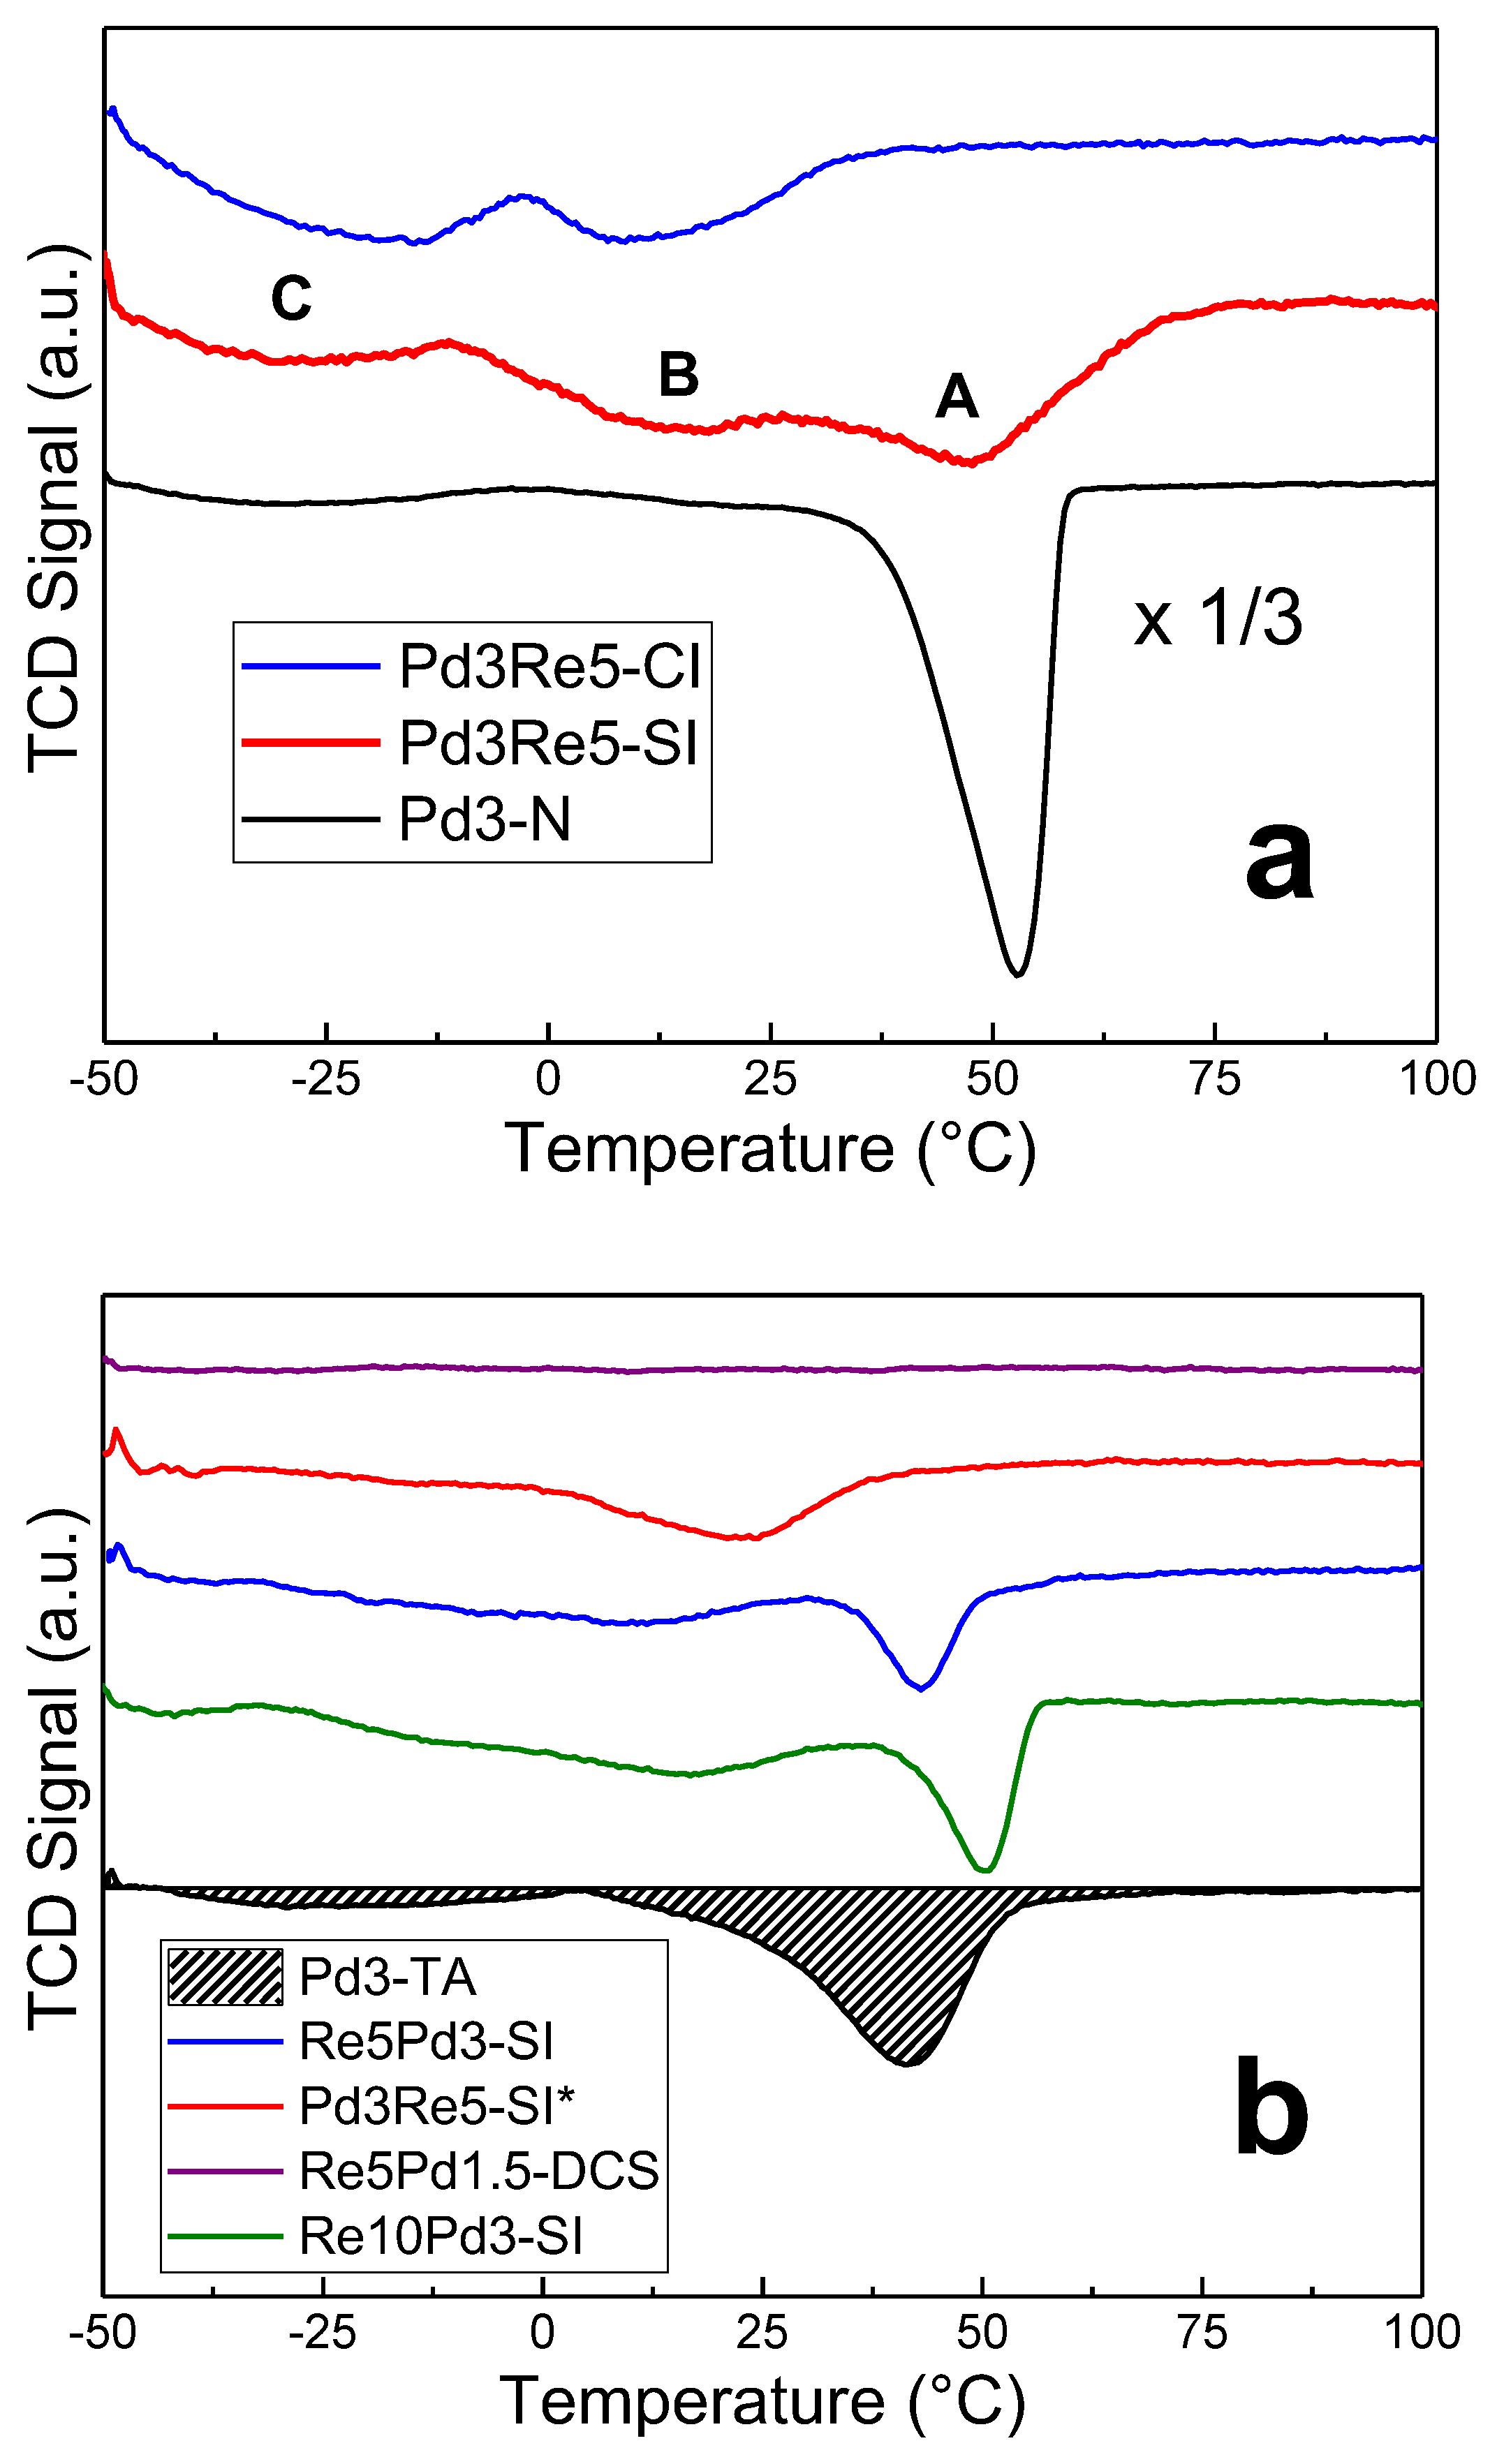
Figure 3.
Re LIII XANES of Re/Al2O3 and PdRe/Al2O3 catalysts measured after in situ reduction at 400°C (a) and Re LIII edge-shift calibration with Re standards and PdRe/Al2O3 catalysts following 400°C reduction and He purge (b).
Figure 3.
Re LIII XANES of Re/Al2O3 and PdRe/Al2O3 catalysts measured after in situ reduction at 400°C (a) and Re LIII edge-shift calibration with Re standards and PdRe/Al2O3 catalysts following 400°C reduction and He purge (b).
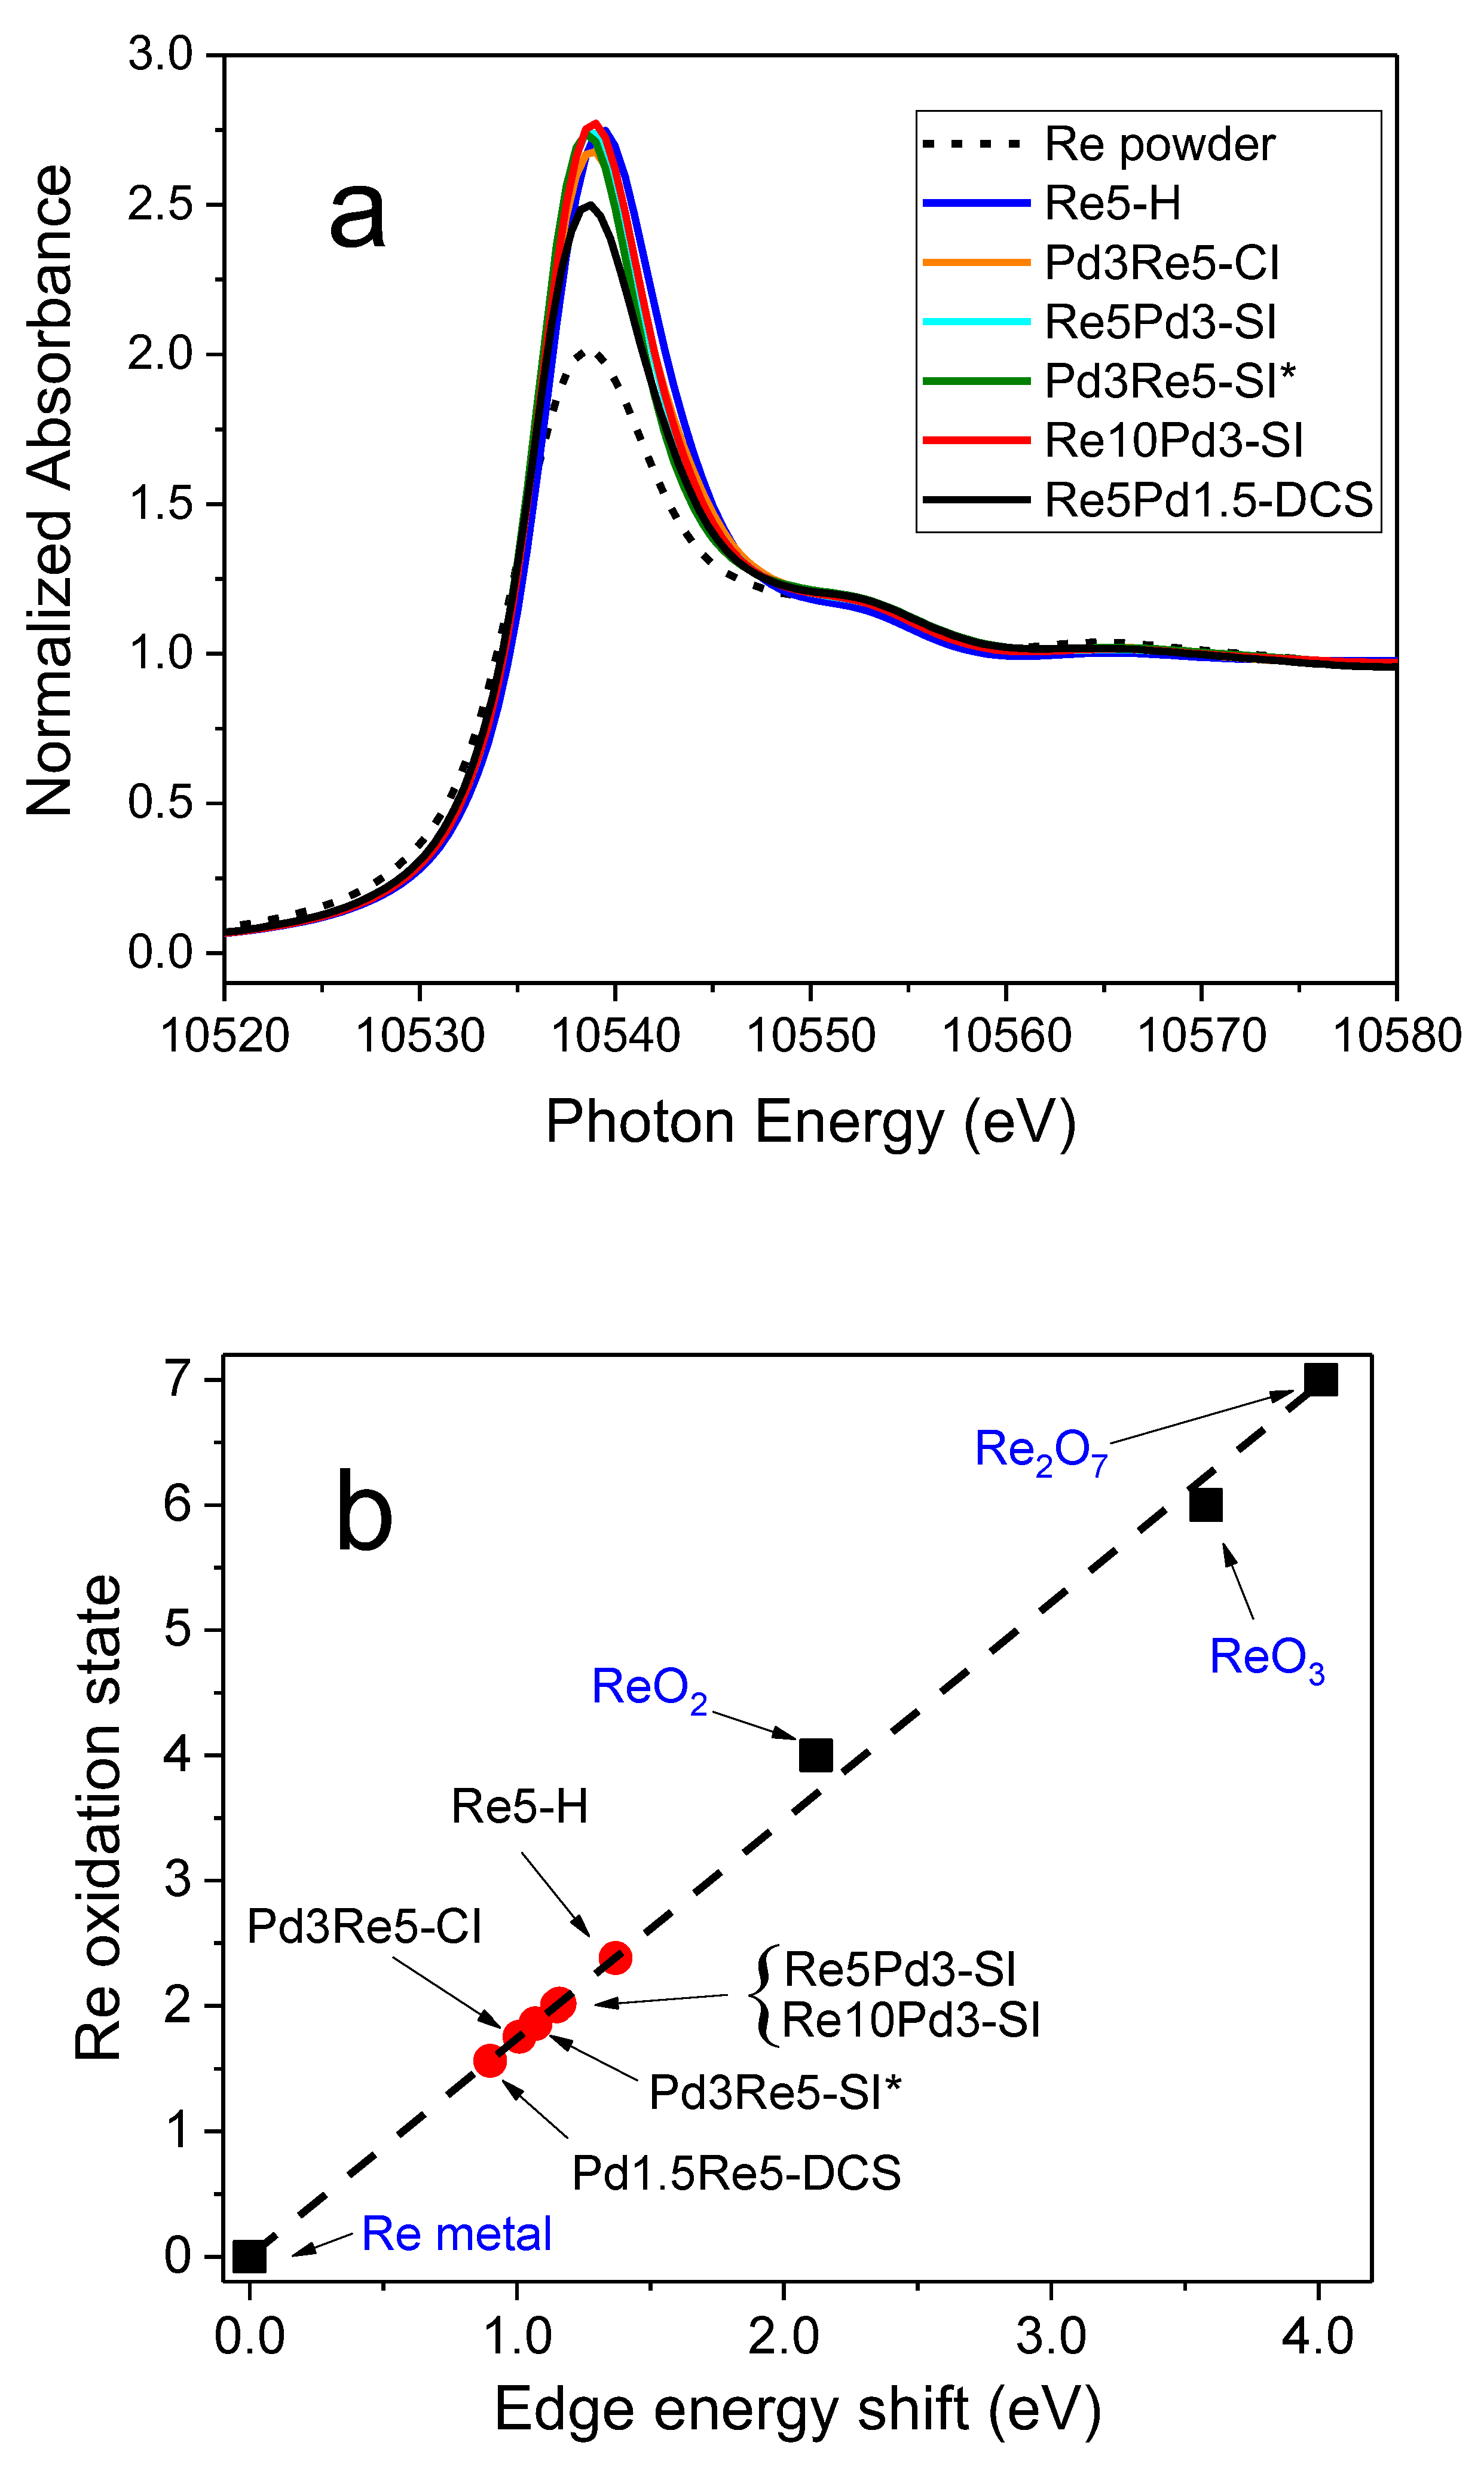
Figure 4.
Correlation of Re oxidation states determined by XANES and EXAFS spectroscopies with Re oxidation states determined by TPR for Re/Al2O3 and PdRe/Al2O3 catalysts.
Figure 4.
Correlation of Re oxidation states determined by XANES and EXAFS spectroscopies with Re oxidation states determined by TPR for Re/Al2O3 and PdRe/Al2O3 catalysts.
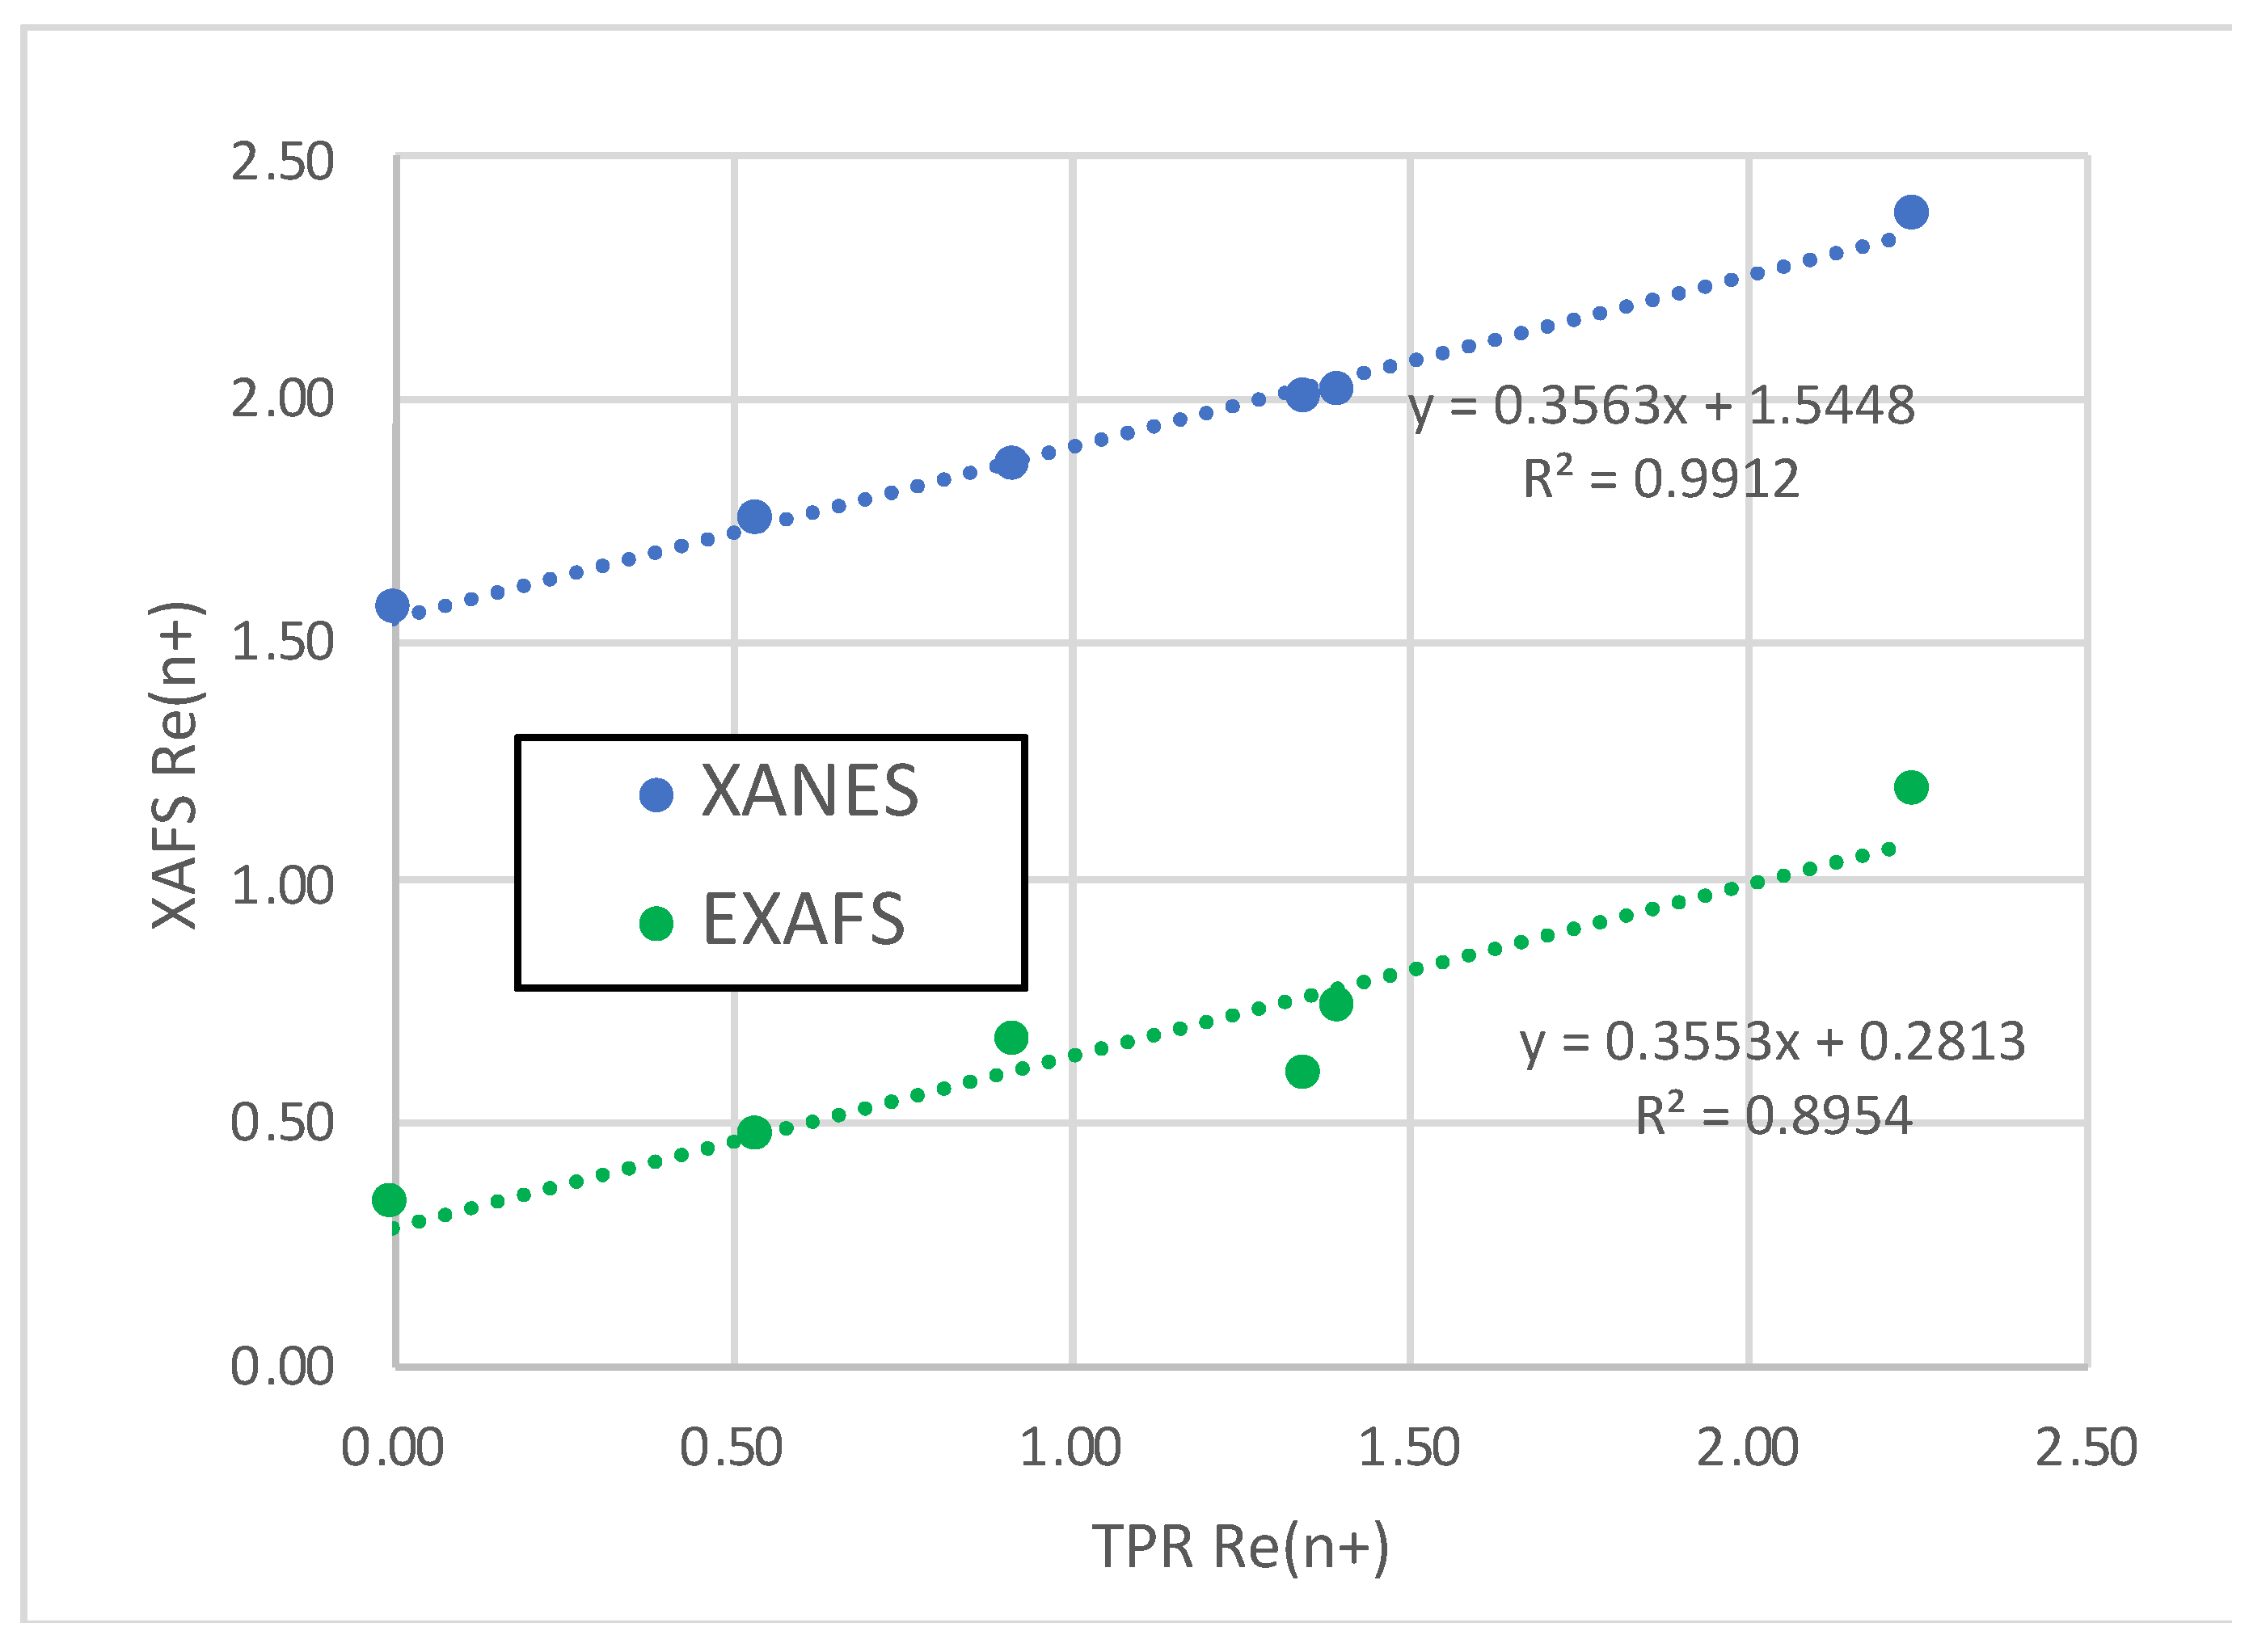
Figure 5.
Pd K EXAFS spectra of PdRe/Al2O3 catalysts measured after in situ reduction at 400°C: k2 chi data (a) and corresponding Pd phase-corrected Fourier transforms (3.1-14 Å-1) (b).
Figure 5.
Pd K EXAFS spectra of PdRe/Al2O3 catalysts measured after in situ reduction at 400°C: k2 chi data (a) and corresponding Pd phase-corrected Fourier transforms (3.1-14 Å-1) (b).
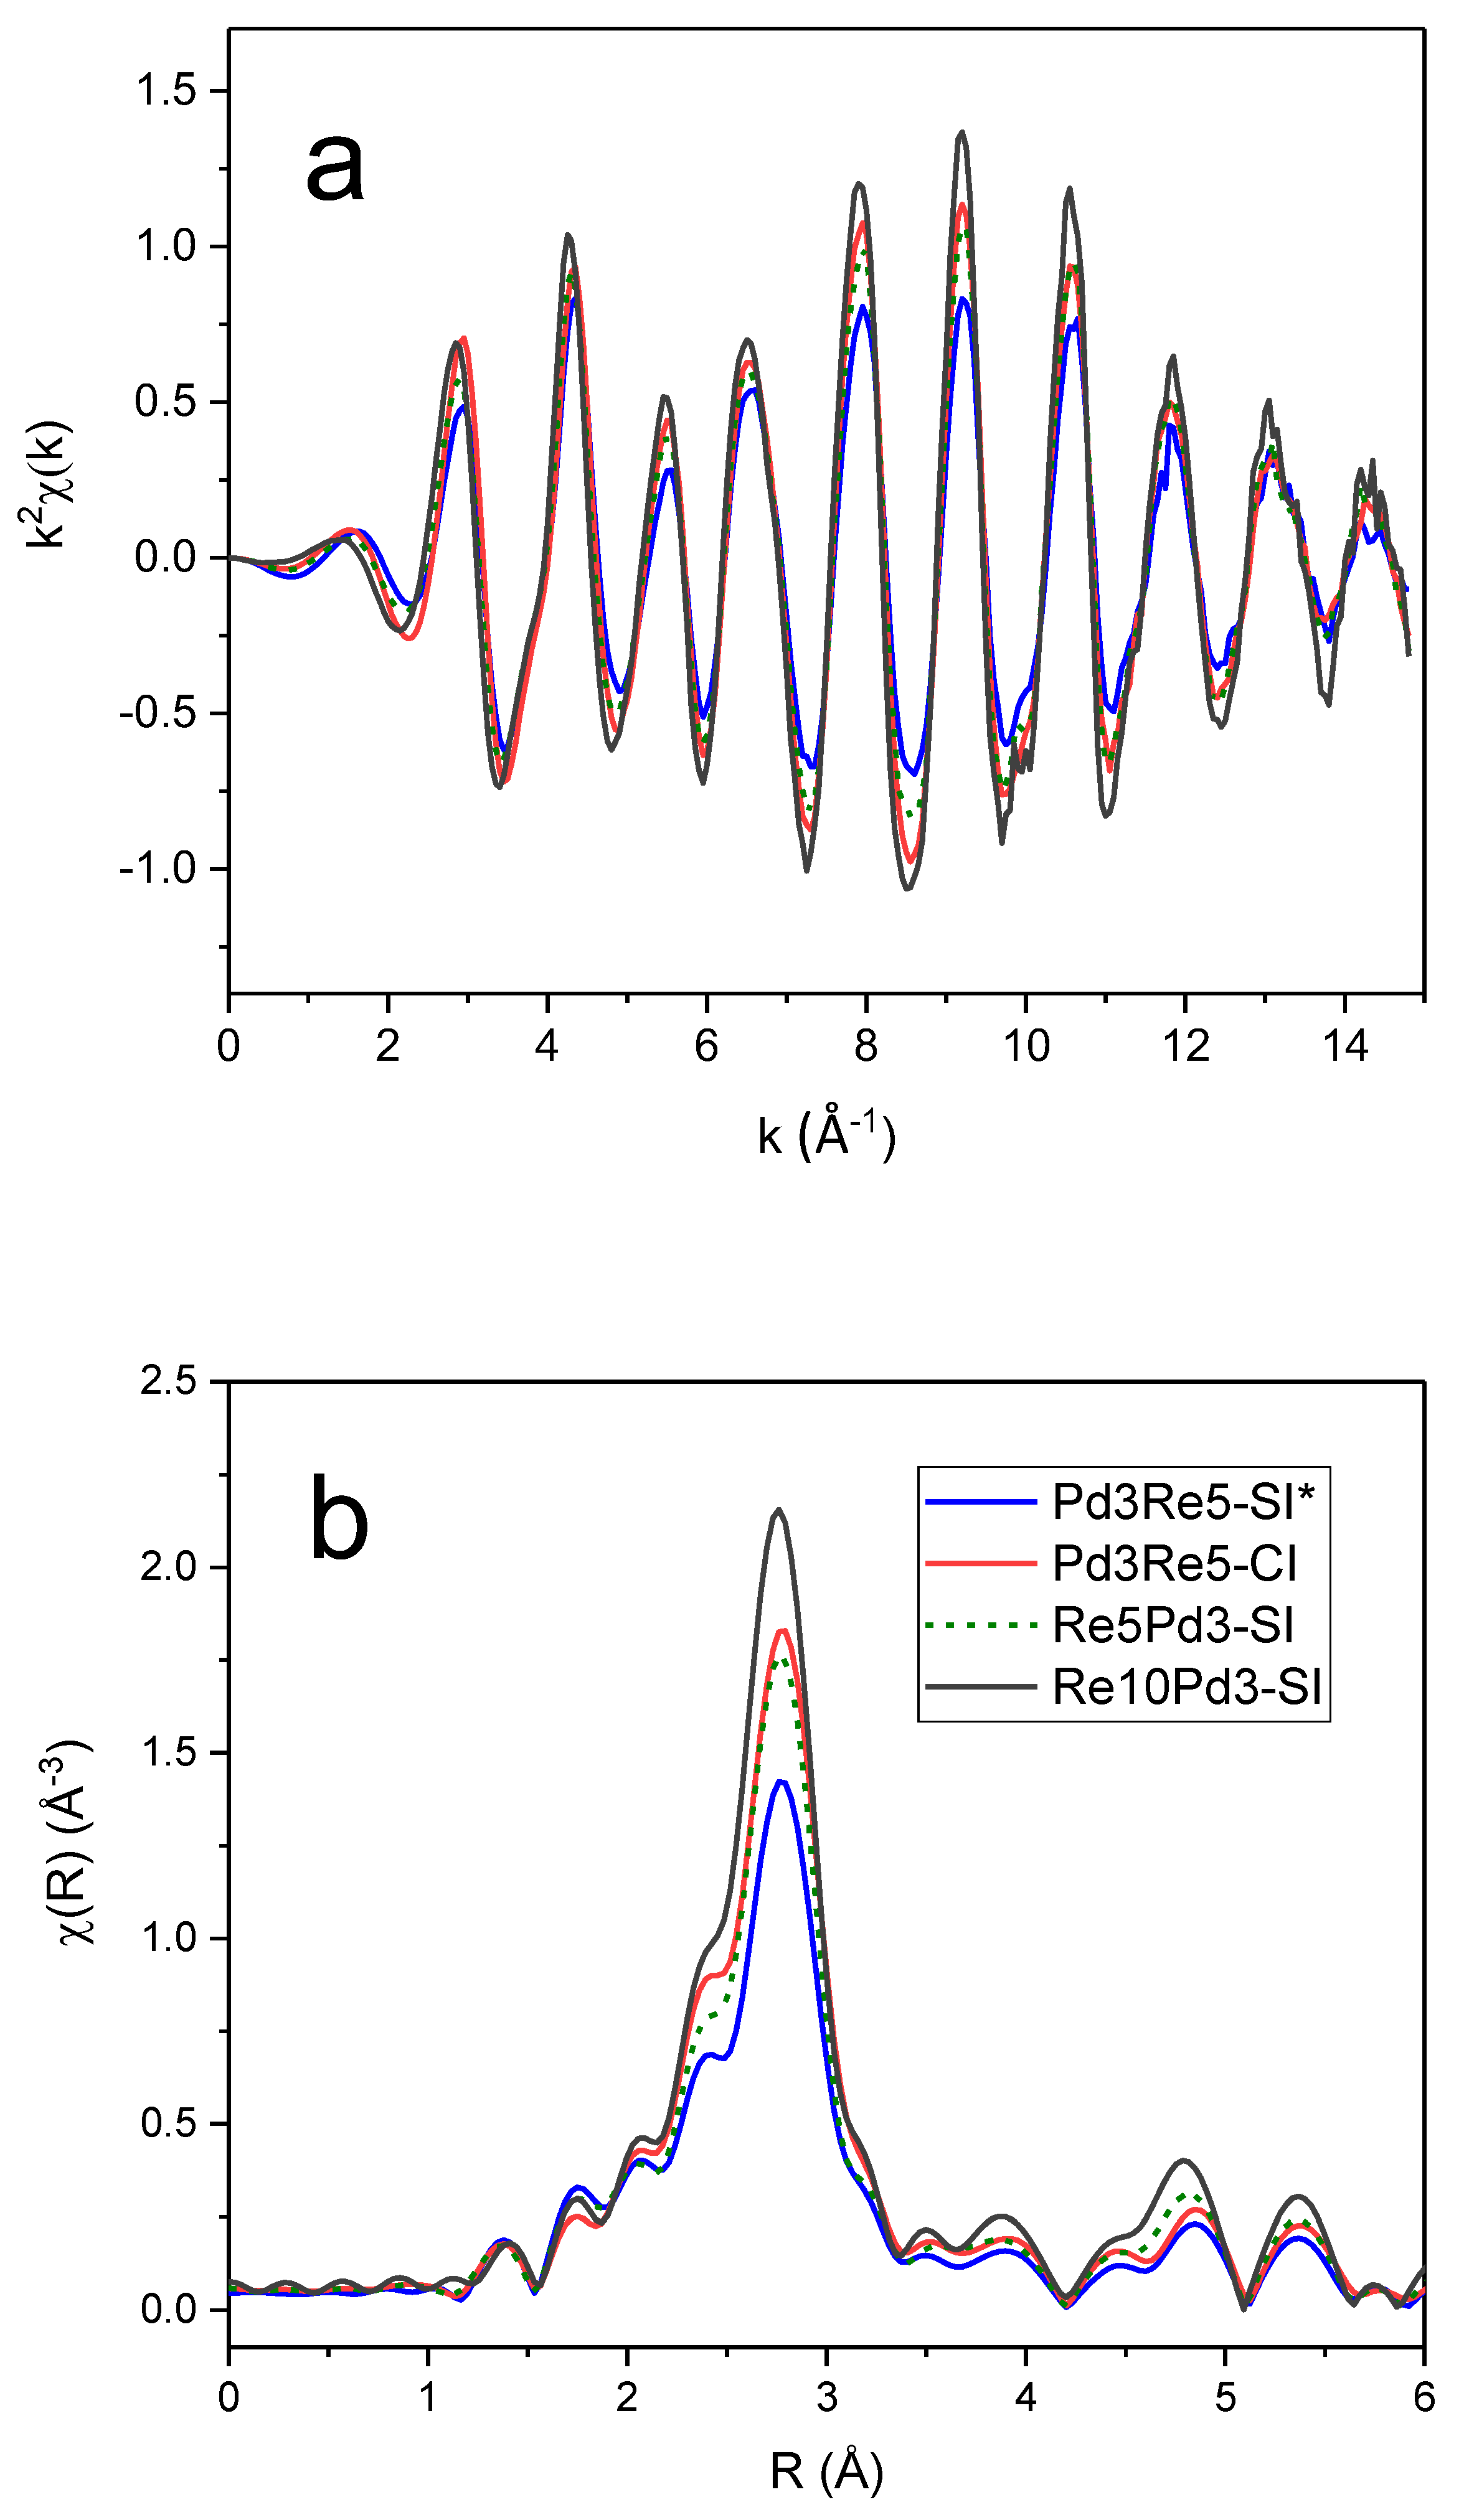
Figure 6.
Re LIII EXAFS spectra of Re/Al2O3 and PdRe/Al2O3 catalysts measured after in situ reduction at 400°C: k2 chi data (a) and corresponding Re phase-corrected FT magnitudes (3.5-14 Å-1) (b).
Figure 6.
Re LIII EXAFS spectra of Re/Al2O3 and PdRe/Al2O3 catalysts measured after in situ reduction at 400°C: k2 chi data (a) and corresponding Re phase-corrected FT magnitudes (3.5-14 Å-1) (b).
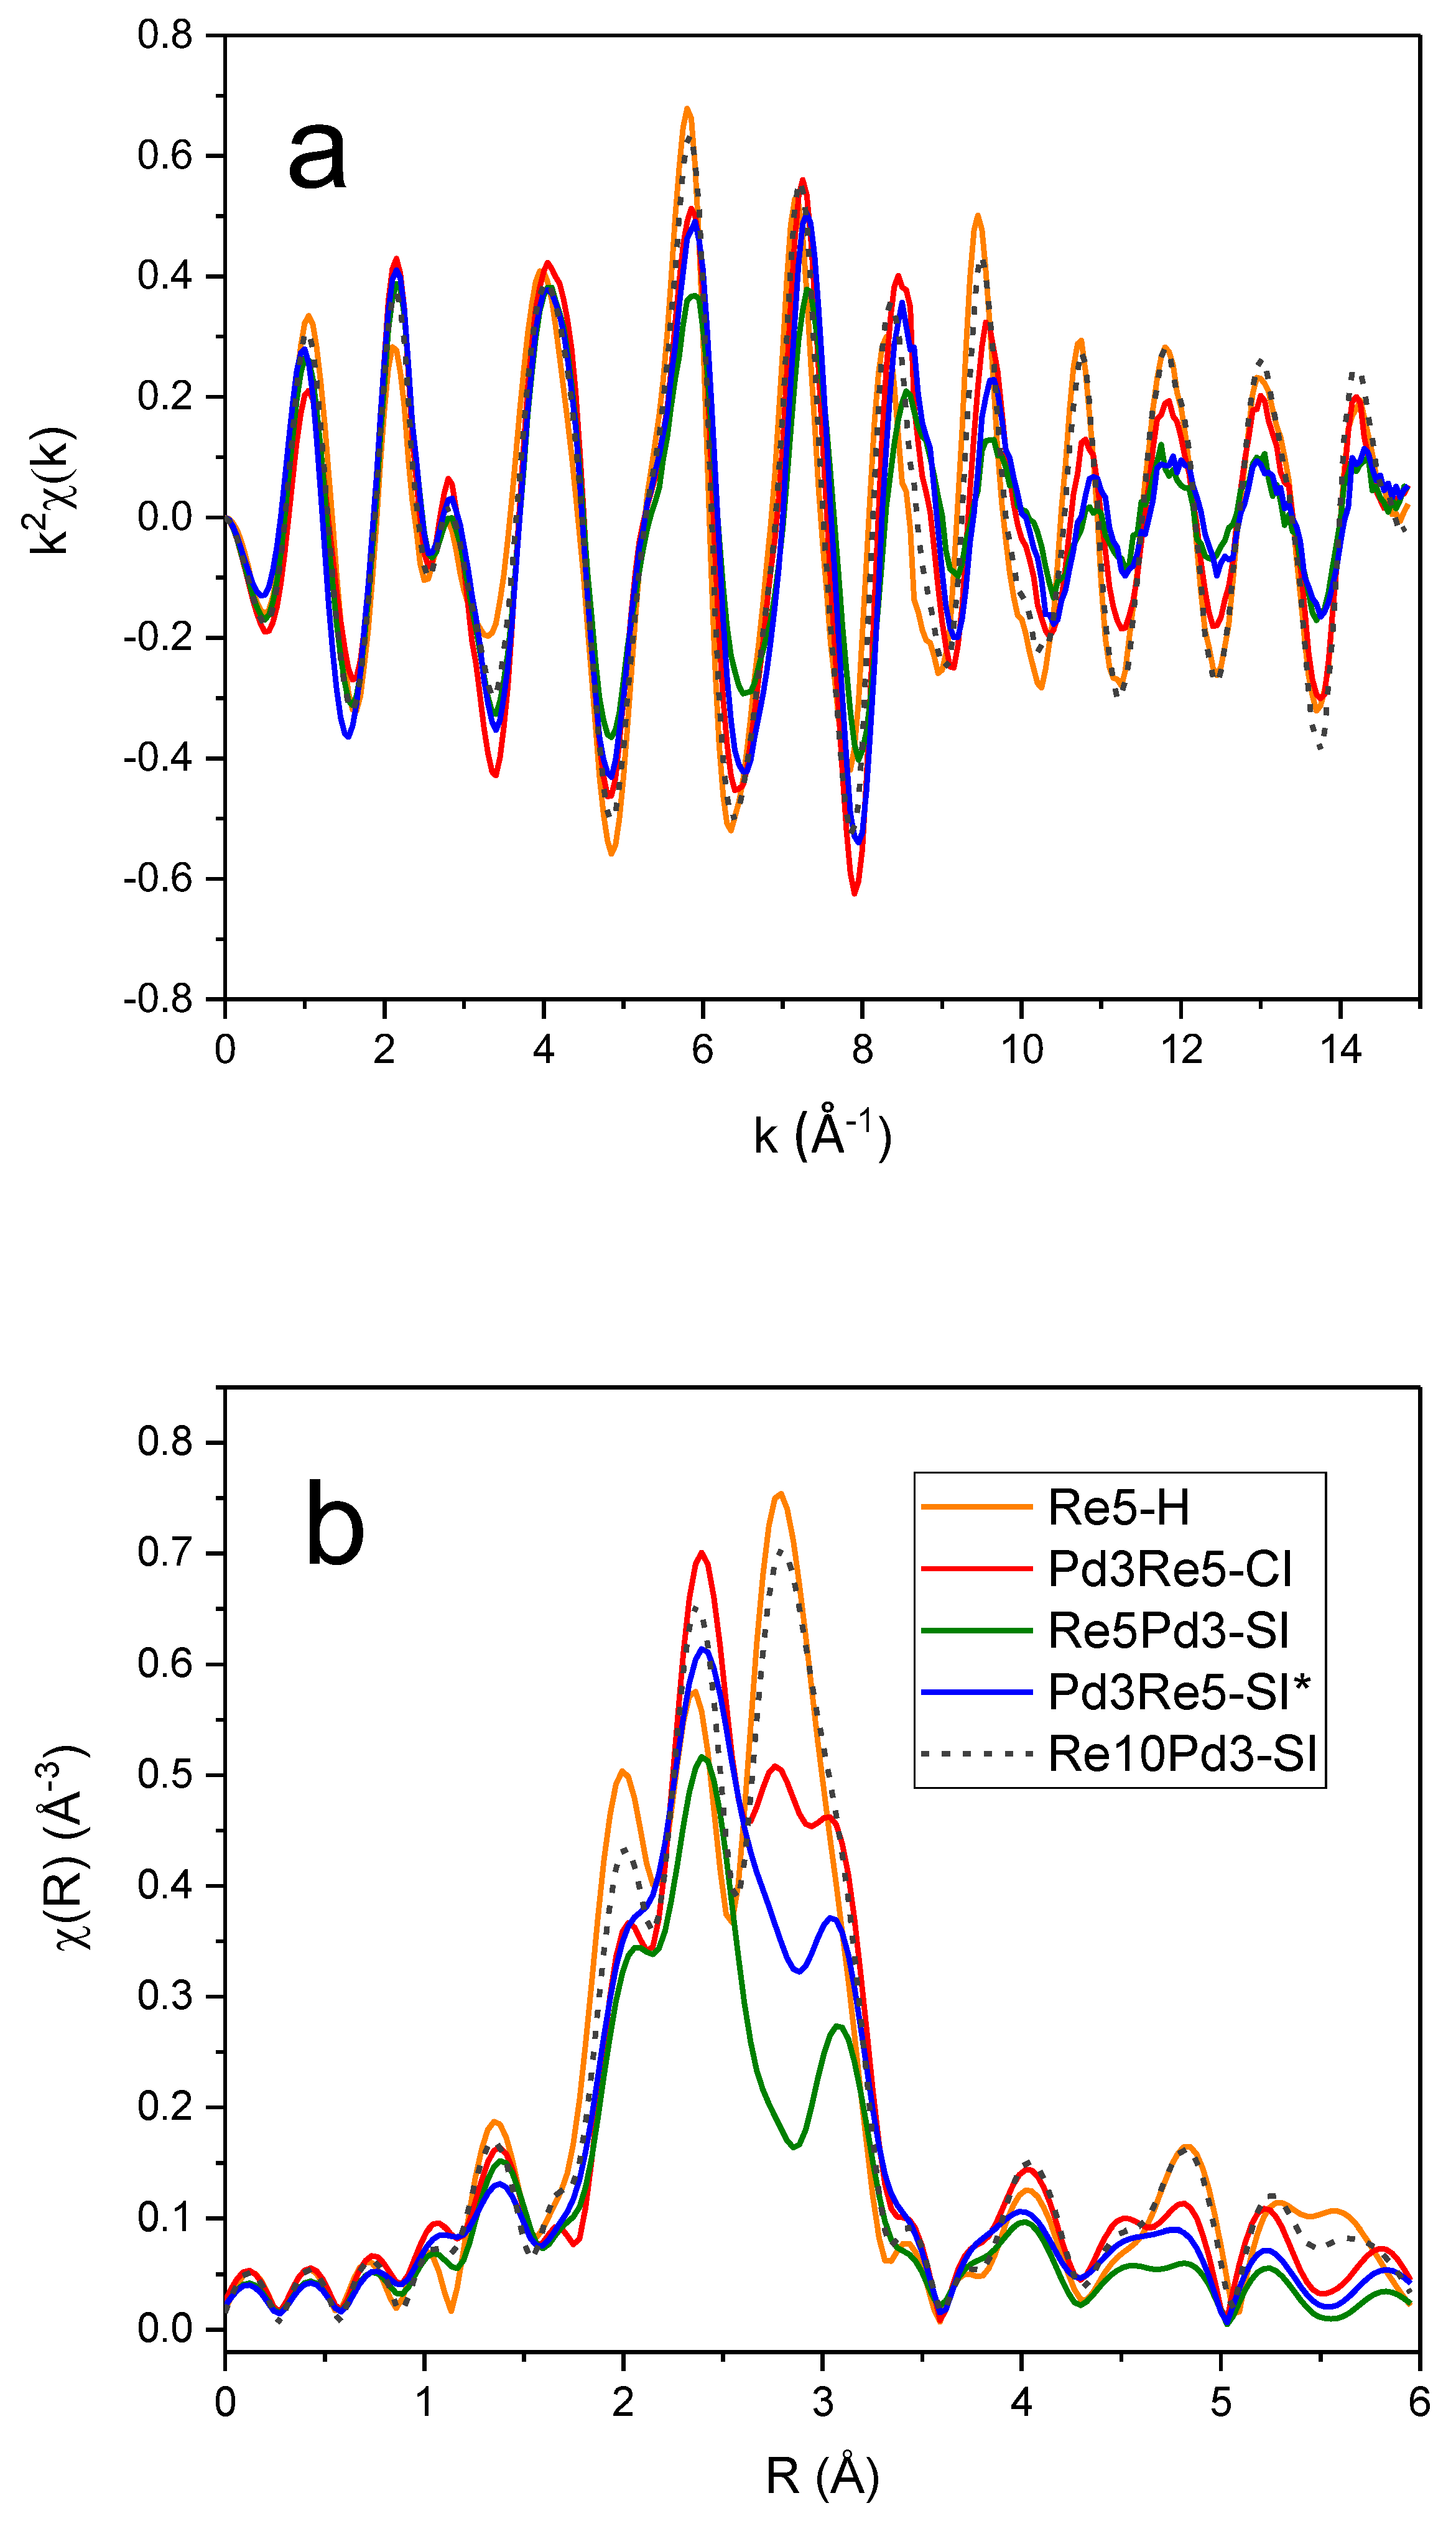
Figure 7.
EXAFS spectra and fit for Re5-H after reduction and He purge at 400°C: k2-weighted Re LIII Fourier transform magnitude (a) and real part (b) with individual backscattering paths shown (offset).
Figure 7.
EXAFS spectra and fit for Re5-H after reduction and He purge at 400°C: k2-weighted Re LIII Fourier transform magnitude (a) and real part (b) with individual backscattering paths shown (offset).
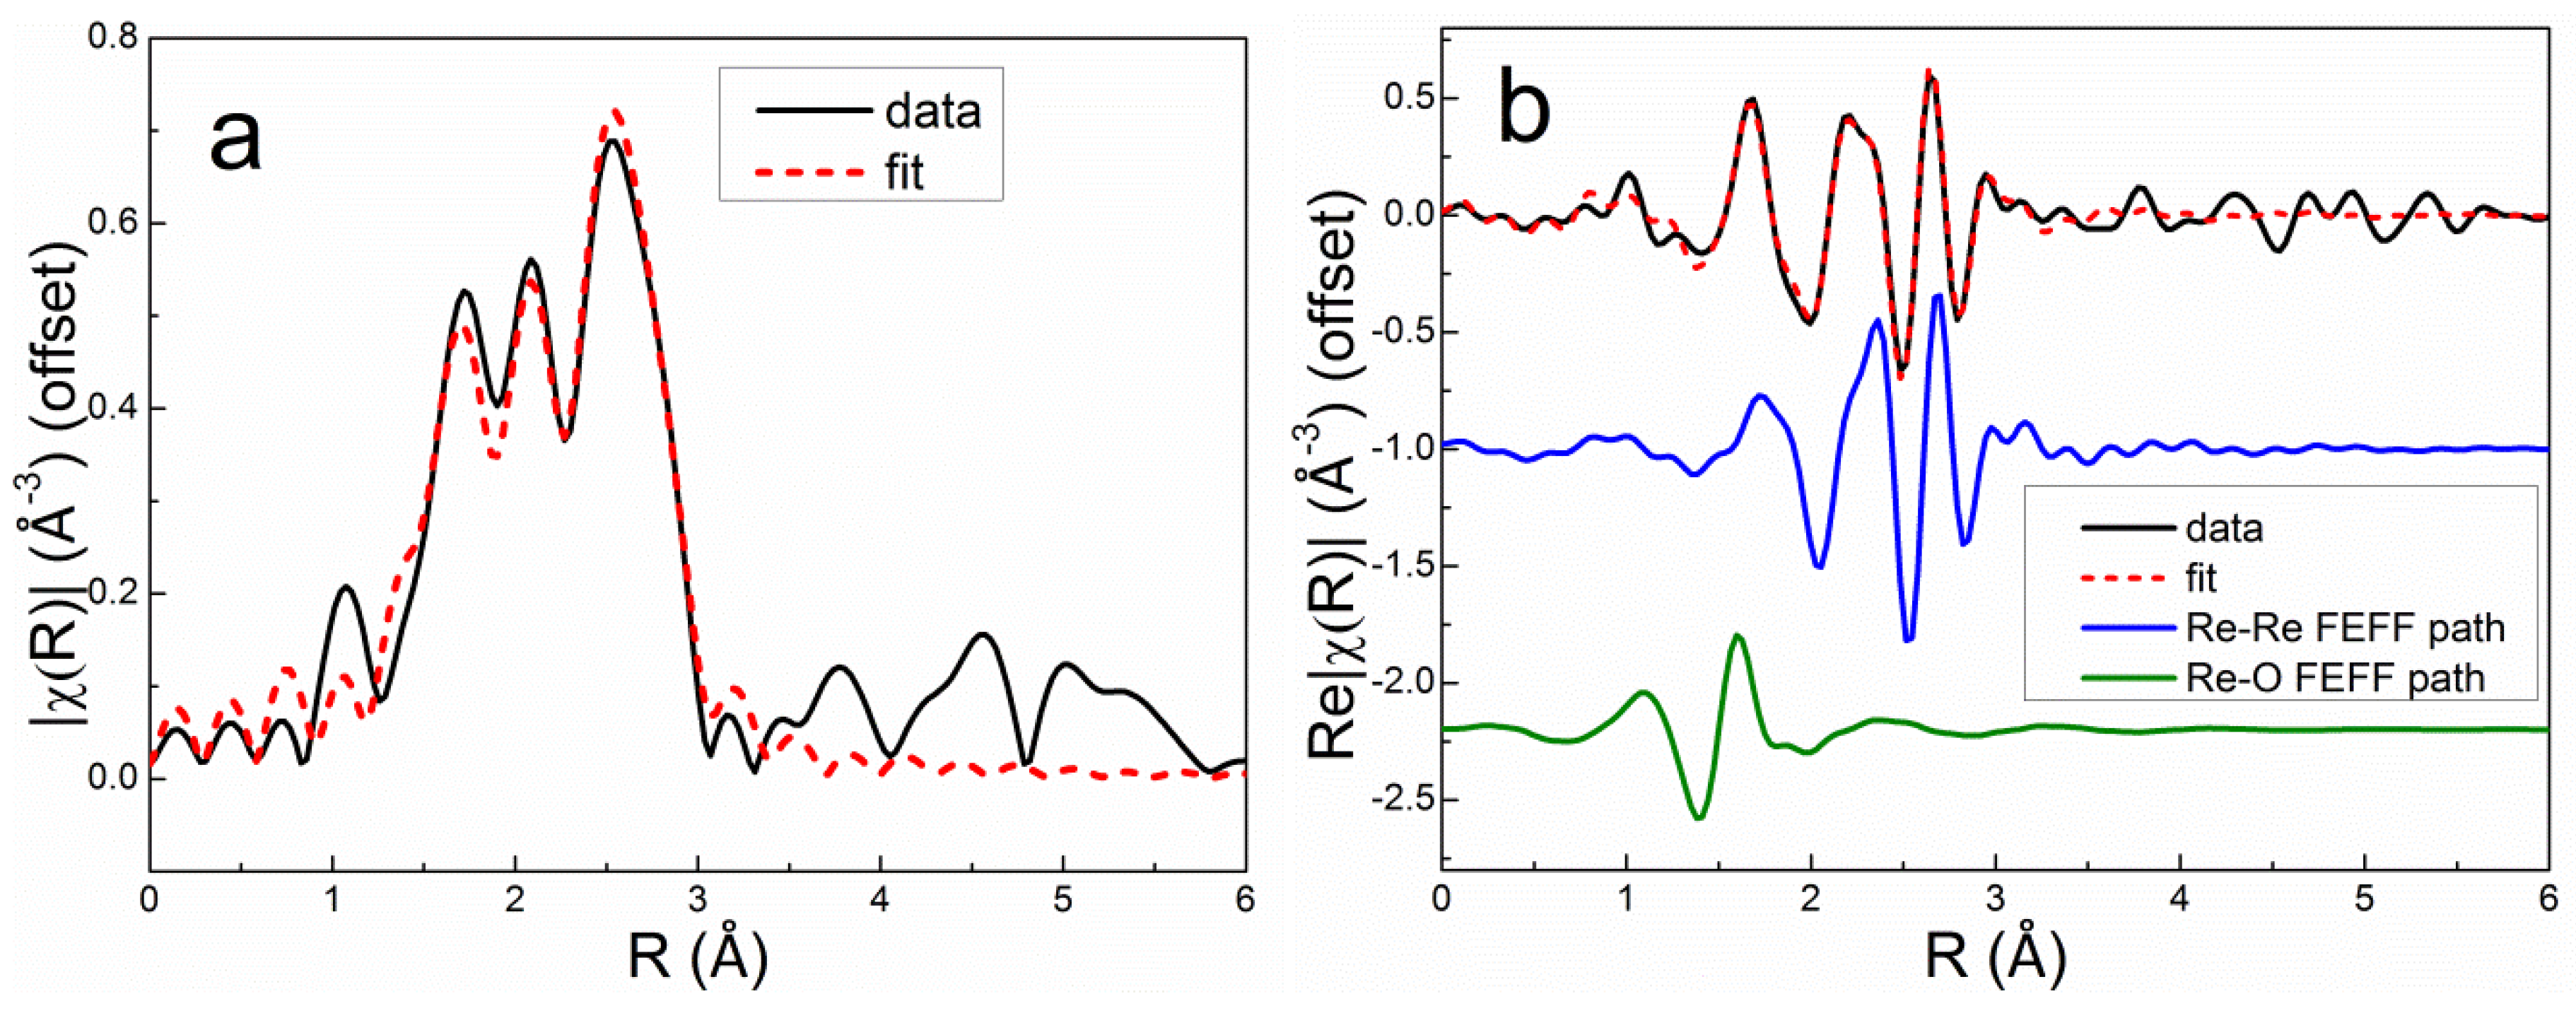
Figure 8.
HAADF-STEM images of Re5-H after reduction in H2 at 400°C for 1 h. See Figure S4 (Supplemental Information) for the composite particle size distribution derived from these images.
Figure 8.
HAADF-STEM images of Re5-H after reduction in H2 at 400°C for 1 h. See Figure S4 (Supplemental Information) for the composite particle size distribution derived from these images.
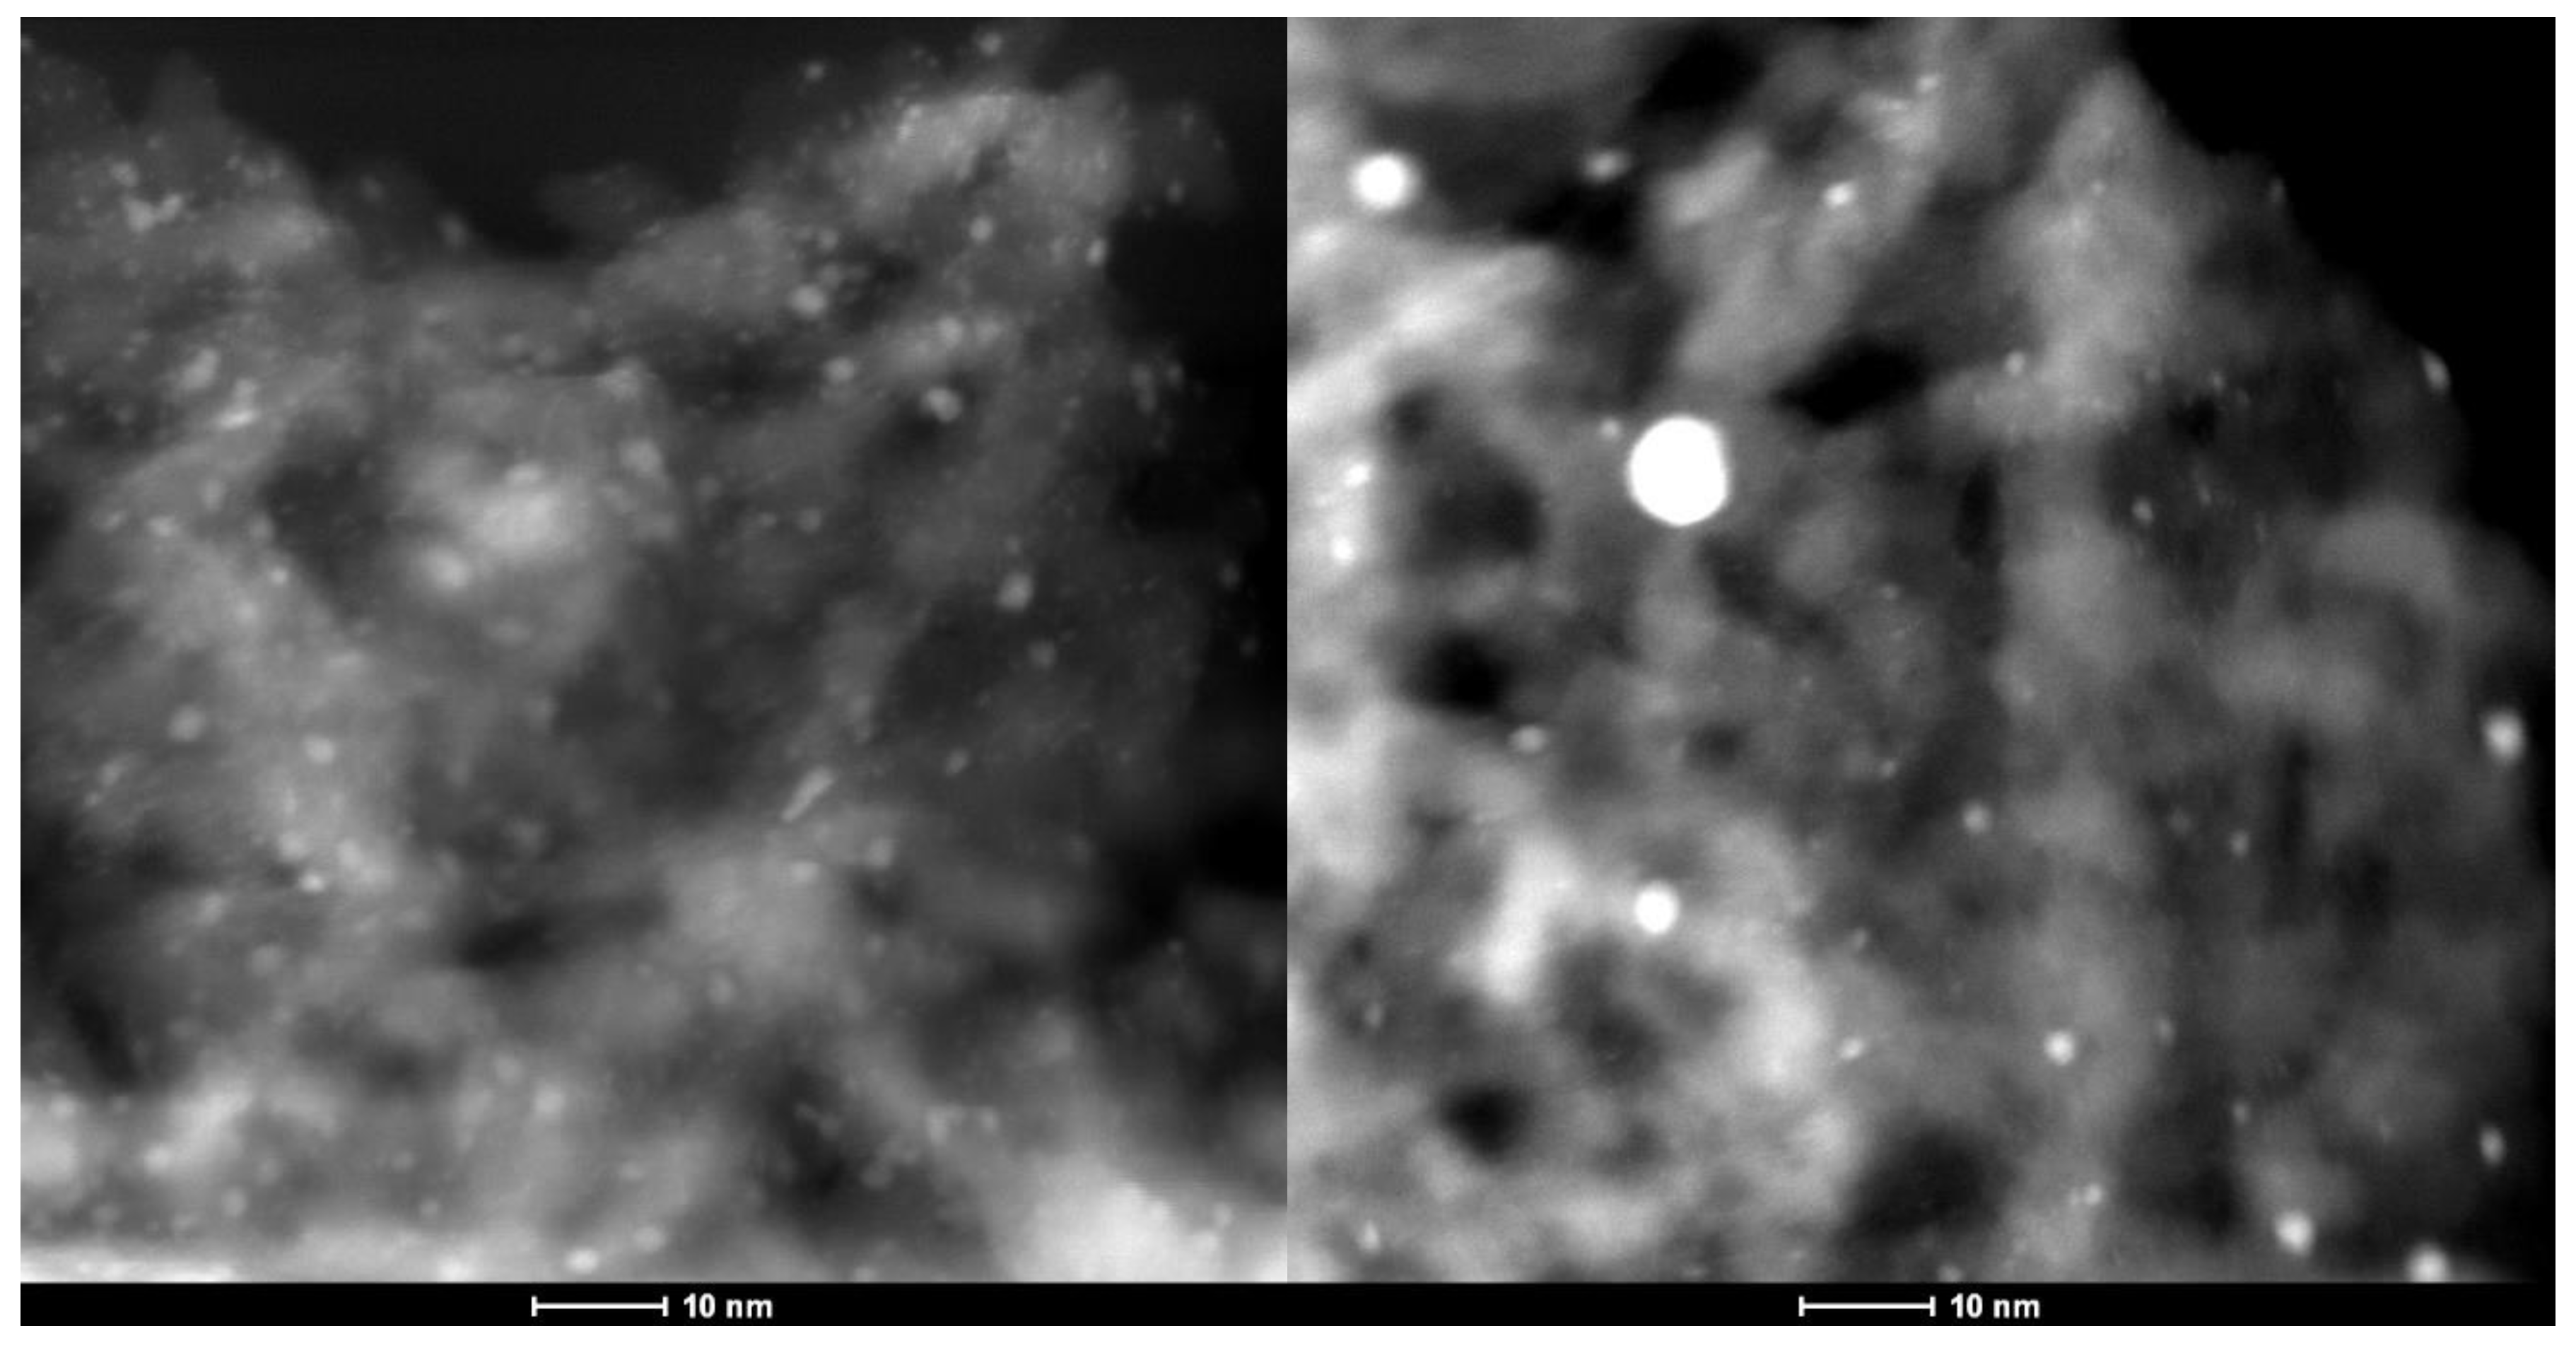
Figure 9.
EXAFS spectra and fits for Pd3Re5-CI measured after reduction and He purge at 400°C: k2-weighted Pd K and Re LIII FT magnitudes (a) and real parts (b and c, respectively) with individual backscattering paths shown (offset).
Figure 9.
EXAFS spectra and fits for Pd3Re5-CI measured after reduction and He purge at 400°C: k2-weighted Pd K and Re LIII FT magnitudes (a) and real parts (b and c, respectively) with individual backscattering paths shown (offset).
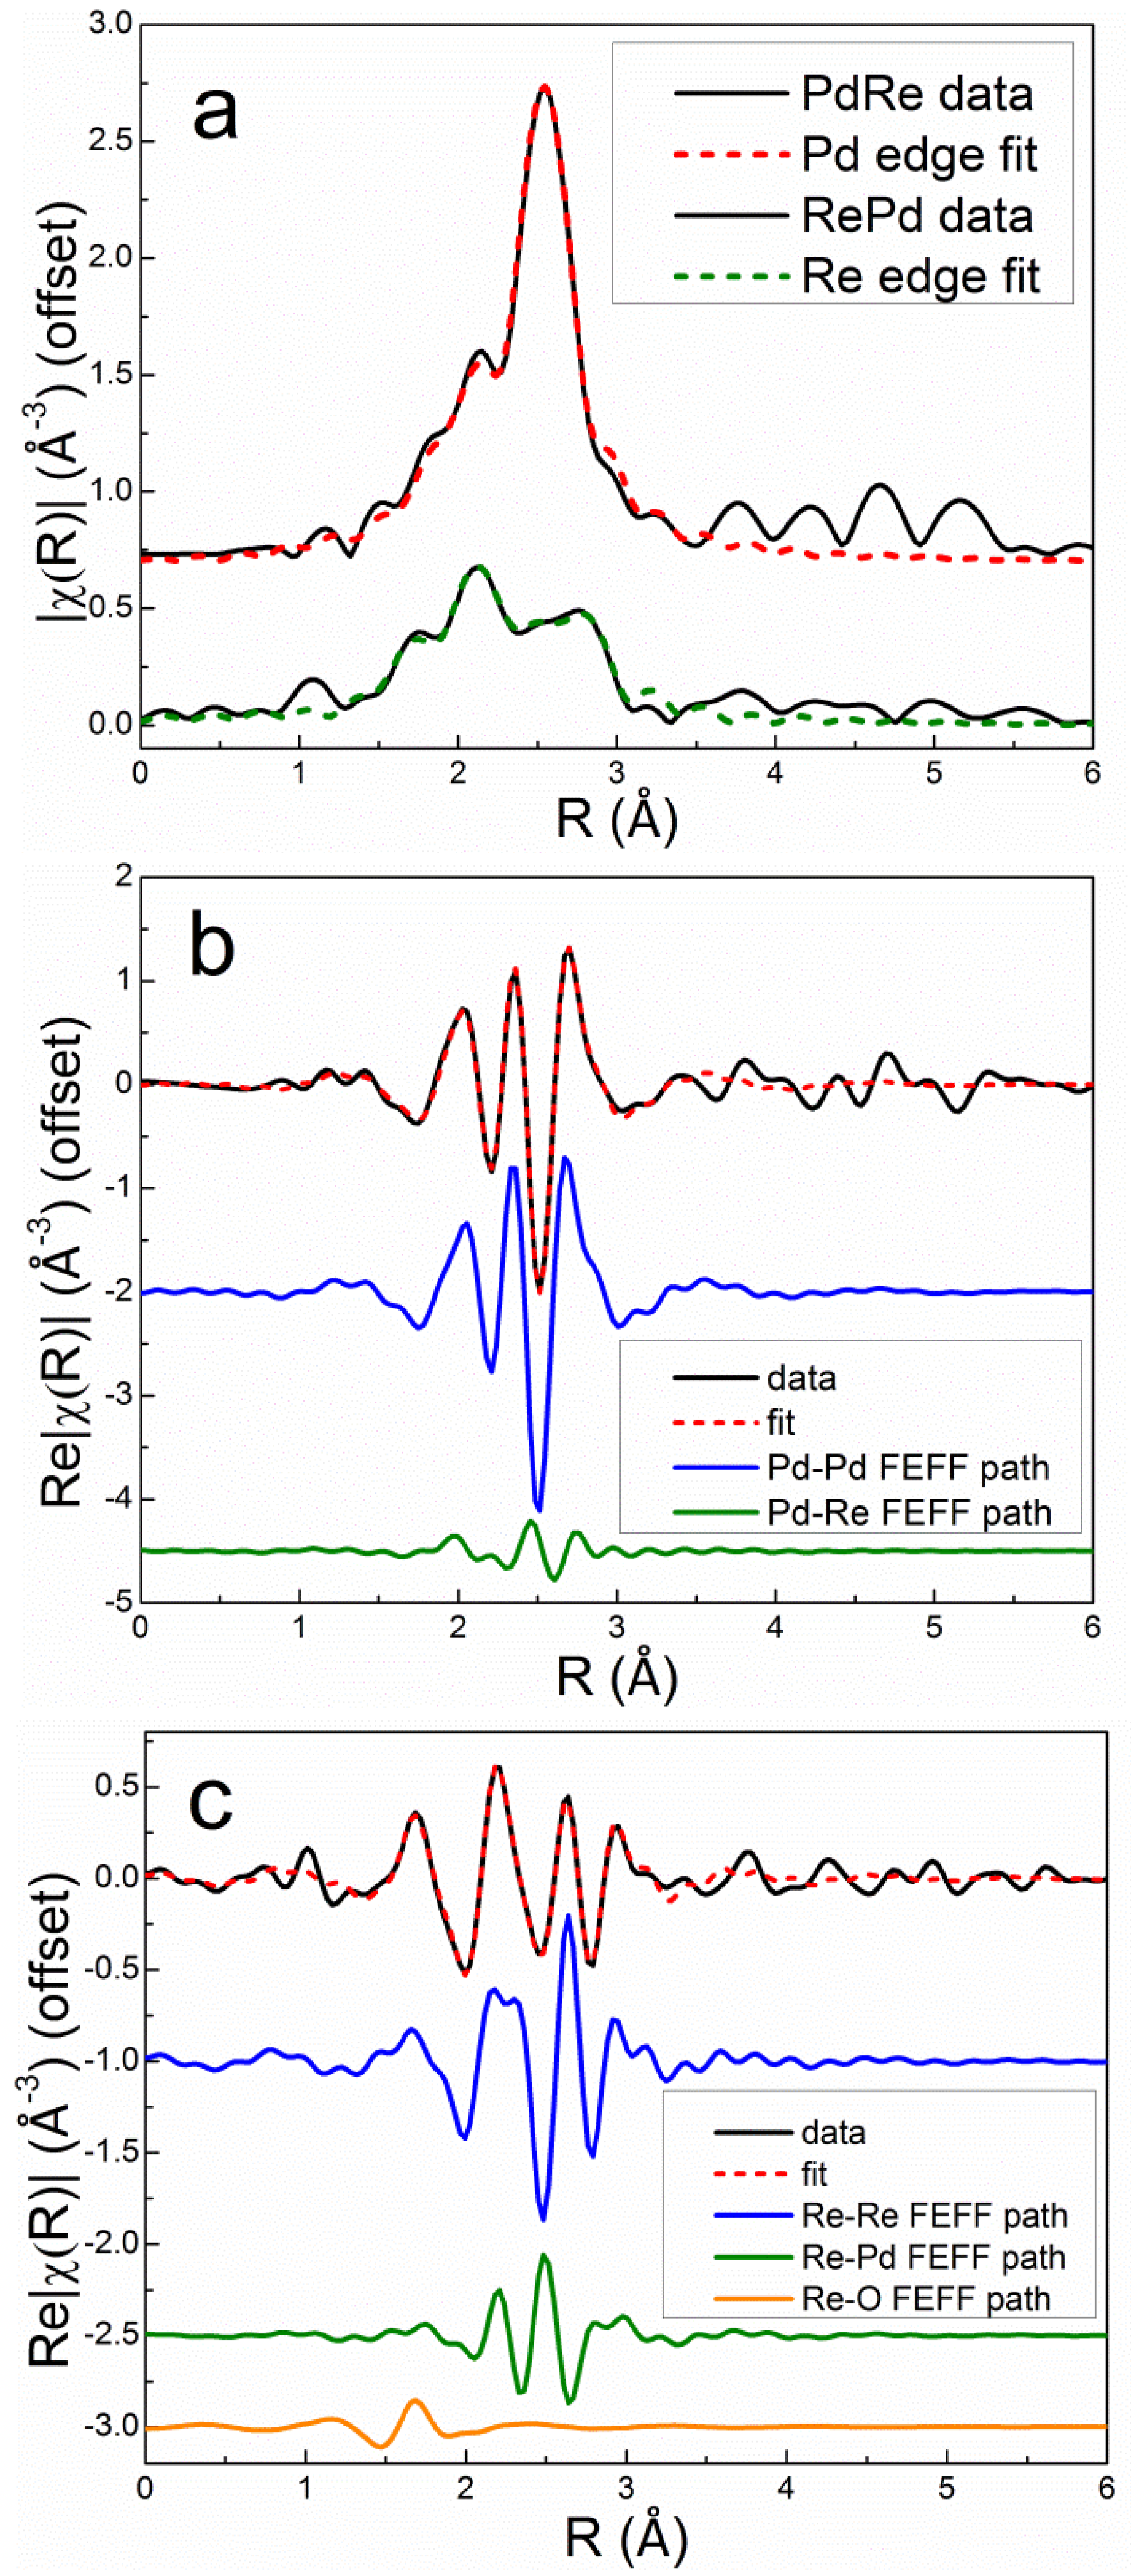
Figure 10.
EXAFS spectra and fits for Re5Pd3-SI measured after reduction and He purge at 400°C: k2-weighted Pd K and Re LIII Fourier transform magnitudes (a) and real parts (b and c, respectively) with individual backscattering paths shown (offset).
Figure 10.
EXAFS spectra and fits for Re5Pd3-SI measured after reduction and He purge at 400°C: k2-weighted Pd K and Re LIII Fourier transform magnitudes (a) and real parts (b and c, respectively) with individual backscattering paths shown (offset).
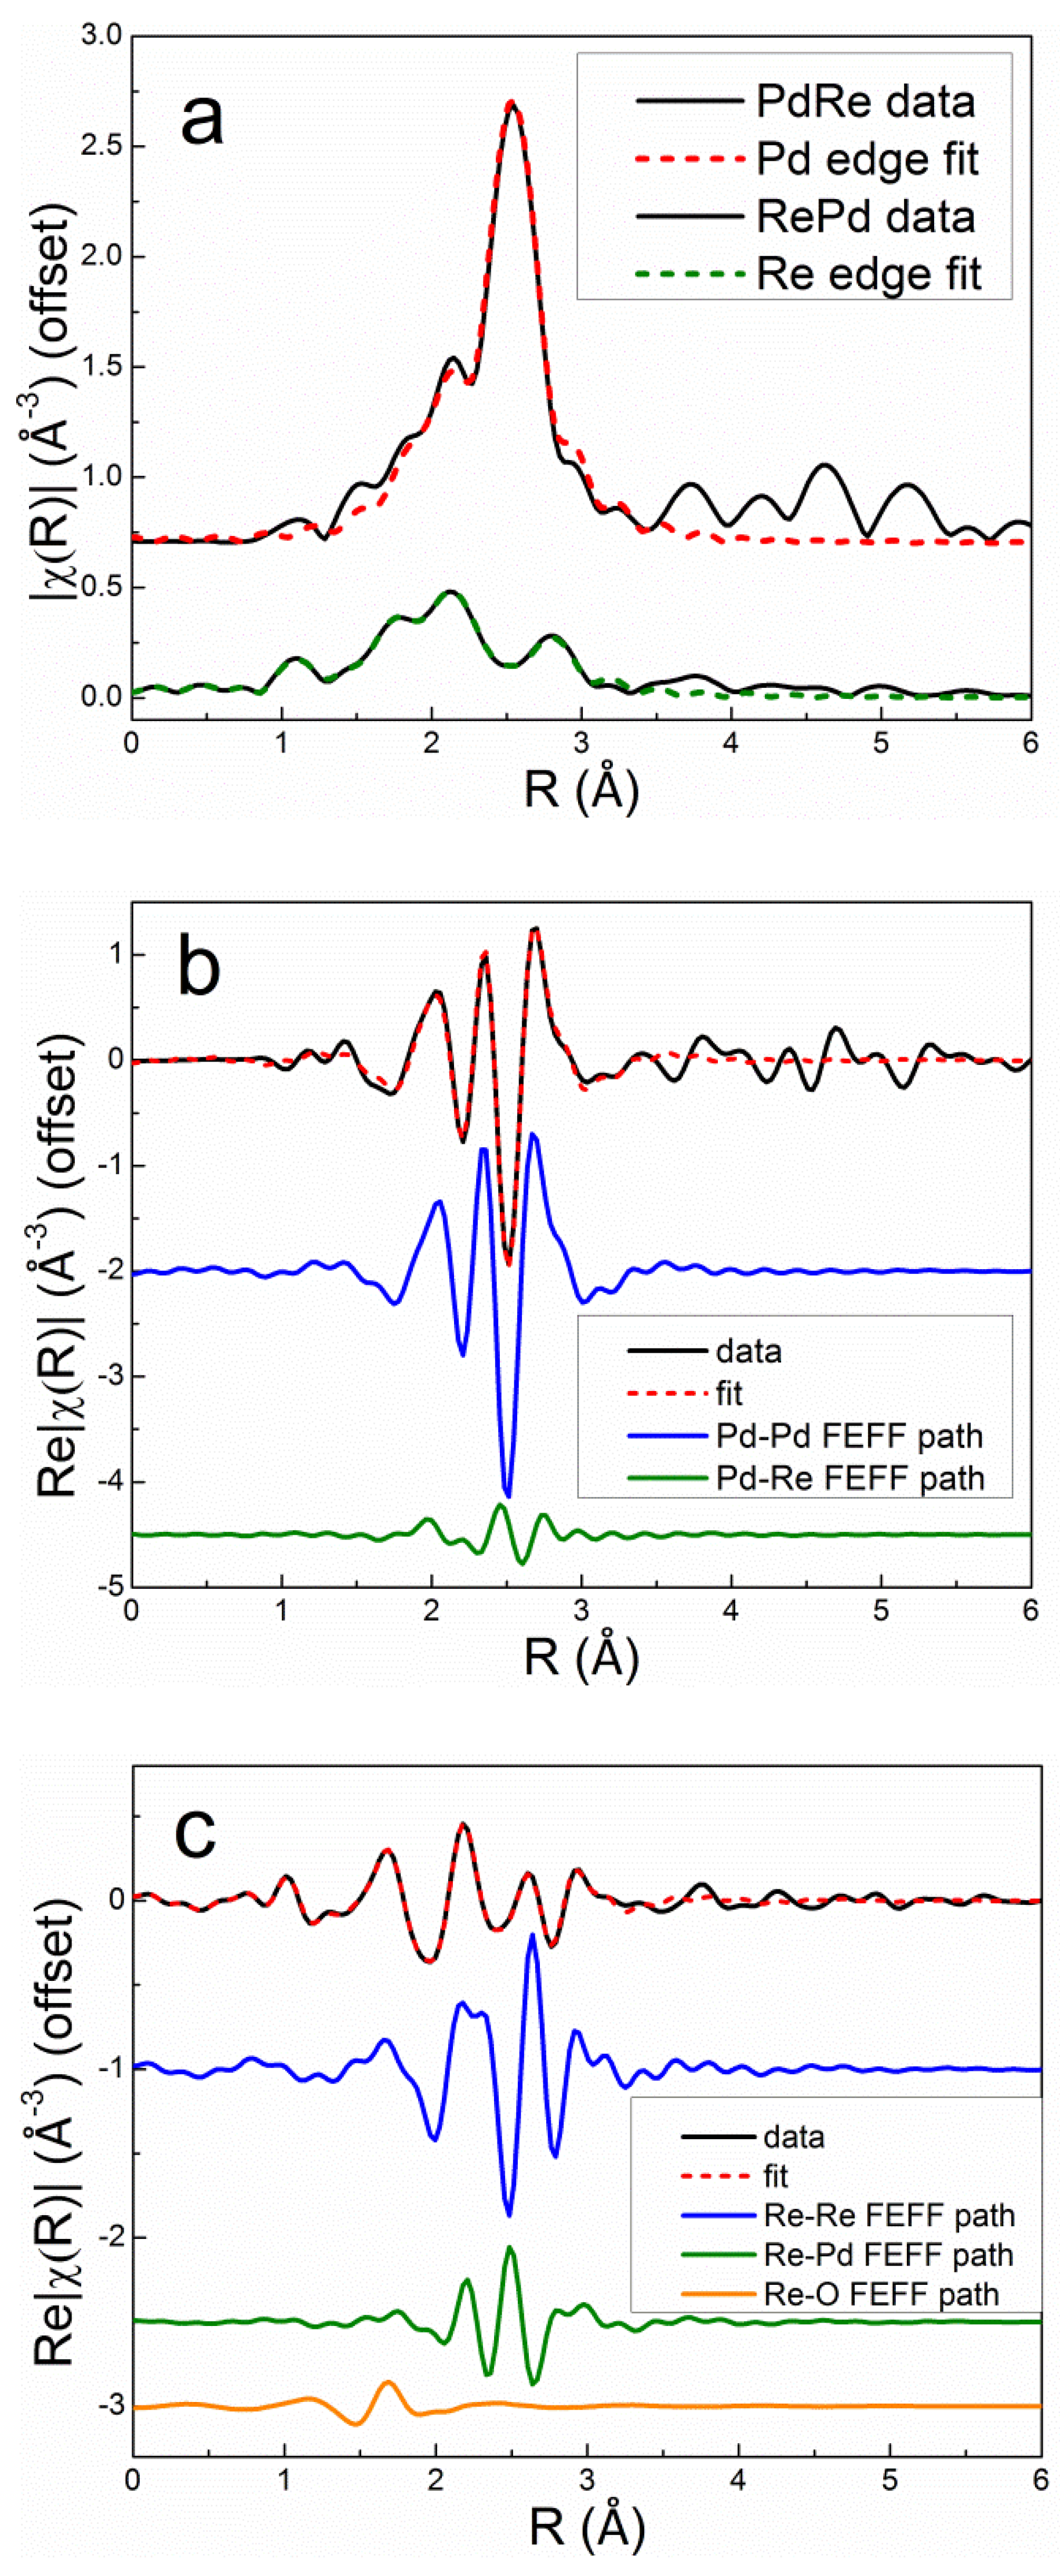

Table 1.
Catalyst precursors, calcination conditions and metal loadings.a.
| Catalyst. | Calcination conditions | Metal precursors | Pd loading (wt%) | Re loading (wt%) |
|---|---|---|---|---|
| Pd3-N | 350°C, 1 h | Pd(NO3)2 | 3.04 | --- |
| Pd1.5-TA | 400°C, 3 h | Pd(NH3)4(NO3)2 | 1.49 | |
| Pd3-TA | 350°C, 1 h | Pd(NH3)4(NO3)2 | 3.00 | --- |
| Pd3Re5-CI | 350°C, 1 h | Pd(NO3)2 and HReO4 | 3.02 | 5.00 |
| Pd3Re5-SI | --- | Pd(NO3)2 and HReO4 | 2.53 | 4.92 |
| Pd3Re5-SI* | --- | Pd(NH3)4(NO3)2 and HReO4 | 2.87 | 5.36 |
| Re5Pd3-SI | 350°C, 1 h | NH4ReO4 and Pd(NH3)4(NO3)2 | 2.84 | 4.55 |
| Re5Pd1.5-DCS | --- | Pd(NH3)4[ReO4]2 | 1.41 | 4.72 |
| Re5Pd1.5-SI | 400°C, 3 h | NH4ReO4 and Pd(NH3)4(NO3)2 | 1.50 | 4.85 |
| Re10Pd3-SI | 350°C, 1 h | NH4ReO4 and Pd(NH3)4(NO3)2 | 3.02 | 9.21 |
| Re5-N | 400°C, 3 h | NH4ReO4 | --- | 5.02 |
| Re5-H | 350°C, 1 h | HReO4 | --- | 5.47 |
Table 2.
BET surface areas and pulse CO chemisorption results.
| Catalyst | BETa (m2/g) |
CO uptakeb,c (μmol/g) |
CO/Pd | CO/Md |
|---|---|---|---|---|
| Pd3-N | --- | 32.0 | 0.112 | 0.112 |
| Pd3Re5-CI | 182 | 62.2 | 0.219 | 0.113 |
| Pd3Re5-SI | --- | (42.4) | 0.178 | 0.084 |
| Pd1.5-TA | --- | 77.3 | 0.552 | 0.552 |
| Re5Pd1.5-DCS | --- | 62.5 | 0.472 | 0.162 |
| Re5Pd1.5-SI | --- | 82.4 | 0.585 | 0.205 |
| Pd3-TA | 183 | (131.4) | 0.466 | 0.466 |
| Pd3Re5-SI* | --- | 106.7 | 0.396 | 0.191 |
| Re5Pd3-SI | 191 | 132.1 | 0.472 | 0.245 |
| Re10Pd3-SI | 172 | (120.6) | 0.425 | 0.155 |
| Re5-H | 181 | 59.5 | --- | 0.203 |
aBrunauer-Emmett-Teller (BET) specific surface area (SA) from N2 physisorption at 77K. bPulse CO chemisorption uptake at 35°C. cValues in parentheses estimated as 1.25 times volumetric CO uptake [10]. dM = Pd + Re [=] μmol/g.
Table 3.
Summary of quantitative TPR and TPHD results.
| Catalyst | H2 uptake (cm3 STP/g)a |
Re final oxidation stateb |
Re7+ reduction (%)c |
TPHD H/Pd (>0°C) |
TPHD H/Pd (Total) |
|---|---|---|---|---|---|
| Pd3-N | --- | --- | --- | 0.593 | 0.641 |
| Pd3-TA | --- | --- | --- | 0.243 | 0.281 |
| Pd1.5-TA | --- | --- | --- | 0.144 | 0.175 |
| Pd3Re5-CI | 25.8 | 0.54 | 92.9 | 0.065 | 0.135 |
| Pd3Re5-SI | 23.7 | 0.80 | 88.6 | 0.184 | 0.387 |
| Pd3Re5-SI* | 25.6 | 0.92 | 86.9 | 0.127 | 0.150 |
| Re5Pd3-SI | 21.5 | 1.35 | 80.7 | 0.186 | 0.186 |
| Re10Pd3-SI | 37.4 | 1.40 | 80.0 | 0.341 | 0.359 |
| Re5Pd1.5-DCS | 24.0 | -0.42 | 106.0 | 0.000 | 0.000 |
| Re5-Hd | 17.4 | 2.25 | 67.9 | --- | --- |
aNet H2 consumption during TPR in 5% H2/Ar to 400°C. bBasis: 2.0 H/Pd; remainder of H uptake goes toward reduction of Re7+ to final oxidation state (n+).cCalculated as: (1-n+/7) x 100%. dICP-OES Re loading was 6.08 wt.%.
Table 4.
EXAFS spectroscopy fitting parameters. Catalysts measured after in situ reduction in 3.5% H2/He at 400°C, unless otherwise noted.
Table 4.
EXAFS spectroscopy fitting parameters. Catalysts measured after in situ reduction in 3.5% H2/He at 400°C, unless otherwise noted.
| Patha | N | R (Å) | σ2 (10-3 Å2)b | ΔE0 (eV) | R-factor | |
|---|---|---|---|---|---|---|
| Re5-H (as-prepared) | ||||||
| Re-O | 3.9 ± 0.3 | 1.73 ± 0.01 | (1.0) | 6.9 ± 2.6 | 0.009 | |
| Re5-H | ||||||
| Re-Re | 7.0 ± 0.8 | 2.74 ± 0.01 | 7.8 ± 0.7 | 7.5 ± 1.3 | 0.016 | |
| Re-O1 | 1.7 ± 0.2 | 2.00 ± 0.01 | (5.0) | 7.5 ± 1.3 | ||
| Re-O2 | 0.2 ± 0.1 | (1.73) | (1.0) | 7.5 ± 1.3 | ||
| Pd3Re5-CI | ||||||
| Pd-Pd | 8.7 ± 0.4 | 2.73 ± 0.01 | 6.2 ± 0.3 | 2.3 ± 0.4 | 0.0053 | |
| Pd-Re | 1.3 ± 0.2 | 2.71 ± 0.01 | 3.8 ± 0.9 | 2.3 ± 0.4 | ||
| Re-Re | 6.5 ± 0.4 | 2.72 ± 0.01 | 6.6 ± 0.4 | 7.0 ± 0.8 | 0.0042 | |
| Re-Pd | 1.3 ± 0.2 | 2.71 ± 0.01 | 3.8 ± 0.9 | 7.0 ± 0.8 | ||
| Re-O | 0.7 ± 0.1 | 2.02 ± 0.01 | (5.0) | 7.0 ± 0.8 | ||
| Pd3Re5-SI* | ||||||
| Pd-Pd | 7.0 ± 0.8 | 2.73 ± 0.01 | 6.5 ± 0.8 | 2.0 ± 0.7 | 0.015 | |
| Pd-Re | 0.9 ± 0.3 | 2.70 ± 0.02 | 2.6 ± 1.6 | 2.0 ± 0.7 | ||
| Re-Re | 5.6 ± 0.5 | 2.70 ± 0.01 | (7.0) | 6.8 ± 2.0 | 0.005 | |
| Re-Pd | 0.9 ± 0.3 | 2.70 ± 0.02 | 2.6 ± 1.6 | 6.8 ± 2.0 | ||
| Re-O | 1.0 ± 0.3 | 2.02 ± 0.02 | (5.0) | 6.8 ± 2.0 | ||
| Re5Pd3-SI | ||||||
| Pd-Pd | 8.3 ± 0.5 | 2.73 ± 0.01 | 6.4 ± 0.5 | 2.3 ± 0.4 | 0.0073 | |
| Pd-Re | 0.8 ± 0.3 | 2.69 ± 0.02 | 3.5 ± 1.8 | 2.3 ± 0.4 | ||
| Re-Re | 4.5 ± 1.0 | 2.71 ± 0.01 | 7.9 ± 1.5 | 8.0 ± 2.5 | 0.0022 | |
| Re-Pd | 0.8 ± 0.3 | 2.69 ± 0.02 | 3.5 ± 1.8 | 8.0 ± 2.5 | ||
| Re-O | 0.9 ± 0.3 | 2.03 ± 0.02 | (5.0) | 8.0 ± 2.5 | ||
| Re10Pd3-SI | ||||||
| Pd-Pd | 9.8 ± 1.2 | 2.73 ± 0.01 | 6.0 ± 0.8 | 2.6 ± 0.8 | 0.0048 | |
| Pd-Re | 1.1 ± 0.6 | 2.70 ± 0.02 | 3.8 ± 3.0 | 2.6 ± 0.8 | ||
| Re-Re | 6.8 ± 0.6 | 2.73 ± 0.01 | 6.9 ± 0.6 | 7.5 ± 1.1 | 0.017 | |
| Re-Pd | 0.6 ± 0.3 | 2.70 ± 0.02 | 3.8 ± 3.0 | 7.5 ± 1.1 | ||
| Re-O | 1.1 ± 0.2 | 2.01 ± 0.02 | (5.0) | 7.5 ± 1.1 | ||
aAbsorber-backscatterer pairs. bValues in parentheses were fixed during fitting.
Table 5.
Comparison of EXAFS first-shell partial coordination numbers (N), nearest neighbor (NN) heteroatom percentage, and Cowley short-range order parameters (α).
Table 5.
Comparison of EXAFS first-shell partial coordination numbers (N), nearest neighbor (NN) heteroatom percentage, and Cowley short-range order parameters (α).
| Catalyst | Pd3Re5-CI | Pd3Re5-SI* | Re5Pd3-SI | Re10Pd3-SI | Re5Pd1.5-DCS |
| NPd-M | 10.0 | 7.9 | 9.1 | 10.9 | 7.0 |
| %Re NN (Pd) | 13.0 | 11.4 | 8.8 | 10.1 | 37.1 |
| αPd-Re) | 0.74 | 0.77 | 0.82 | 0.85 | 0.45 |
| NRe-M | 7.8 | 6.5 | 5.3 | 7.4 | 6.7 |
| %Pd NN (Re) | 16.7 | 13.8 | 15.1 | 8.1 | 19.4 |
| αRe-Pd) | 0.67 | 0.72 | 0.70 | 0.75 | 0.41 |
Disclaimer/Publisher’s Note: The statements, opinions and data contained in all publications are solely those of the individual author(s) and contributor(s) and not of MDPI and/or the editor(s). MDPI and/or the editor(s) disclaim responsibility for any injury to people or property resulting from any ideas, methods, instructions or products referred to in the content. |
© 2024 by the authors. Licensee MDPI, Basel, Switzerland. This article is an open access article distributed under the terms and conditions of the Creative Commons Attribution (CC BY) license (http://creativecommons.org/licenses/by/4.0/).
Copyright: This open access article is published under a Creative Commons CC BY 4.0 license, which permit the free download, distribution, and reuse, provided that the author and preprint are cited in any reuse.


