Submitted:
17 July 2023
Posted:
18 July 2023
Read the latest preprint version here
Abstract
The paper considers the issues of structural stability, electronic properties, and phonon dispersion of the cubic, tetragonal, and monoclinic phases of ZrO2. It was found that the monoclinic phase of zirconium dioxide is the most stable among the other two phases in terms of total energy, lowest enthalpy, highest entropy, and other thermodynamic values. The smallest negative modes were found for m-ZrO2. An analysis of the electronic properties showed that during the m–t phase transformation of ZrO2, the Fermi level first shifts by 0.125 eV towards higher energies, and then decreases by 0.08 eV in the t–c cross section. The band gap for c-ZrO2, t-ZrO2, and m-ZrO2 is 5.140 eV, 5.898 eV, and 5.288 eV, respectively. Calculations based on the analysis of the influence of doping 3.23, 6.67, 10.35 and 16.15 mol. %Y2O3 on the m-ZrO2 structure showed that the enthalpy of m-YSZ decreases linearly, which accompanies further stabilization of monoclinic ZrO2 and an increase in their defectiveness. In this case, the position of the Fermi level changes abruptly, and the energy gap decreases. It has been established that not only for pure systems, including those doped with Y2O3, the main contribution to the formation of the conduction band is made by the p-states of electrons. An analysis of the mechanism of water adsorption on the surface of t-ZrO2 (101) and t-YSZ (101) showed that H2O on unstabilized t-ZrO2 (101) is adsorbed dissociatively with an energy of -1.22 eV, as well as by the method of molecular chemadsorption with an energy of -0 .69 eV and the formation of a hydrogen bond with a bond length of 1.01 Å. In the case of t-YSZ (101), water is molecularly adsorbed onto the surface with an energy of -1.84 eV. Dissociative adsorption of water occurs at an energy of -1.23 eV, near the yttrium atom.
Keywords:
zirconia
; stability
; yttrium-stabilized zirconia
; phase transition
; Fermi level shift
; water adsorption on the surface
1. Introduction
Zirconium ceramics have been extensively studied in recent years because of their excellent electrical, optical and mechanical properties. They are also biocompatible and have a wide range of biomedical applications. Tetragonal phase yttria stabilized zirconia (Y-TZP) has been used in various medical applications since the 1980s, particularly for dental crowns [1,2]. In addition, bulk materials and nanocomposites based on ZrO2 are used in electrochemical cells because of their high oxide ion conductivity and catalytic activity, low thermal conductivity and mechanical/chemical stability, as well as compatibility with electrolytes [3,4], which makes them from a structural point of view [3,4].
One of the most remarkable properties of ceramics based on zirconia is the presence of three crystalline forms with different properties [5,6,7,8,9]. There are the most stable monoclinic (mineral baddeleyite; m-ZrO2), metastable tetragonal (medium temperature) and unstable cubic structure of zirconium dioxide (high temperature). High-pressure induced zirconium phases in the form of brookite (orthorhombic-I) and cotunnite (orthorhombic-II) are also known [10,11].
Pure zirconium dioxide undergoes a phase transformation from monoclinic to tetragonal (about 1173°C), and then to cubic (about 2370°C), accompanied by a change in volume and, accordingly, their strength [12,13,14]:
For the application of zirconia in advanced zirconia ion-conducting ceramic devices, it is important that the stabilized material has an adequate level of conductivity and the desired mechanical-chemical stability in both oxidizing and reducing atmospheres. Obtaining a stable material from zirconia is difficult due to a noticeable change in volume during the phase transition. Stabilization of zirconium dioxide is achieved by replacing some Zr4+ ions with larger ions in the crystal lattice [15,16,17,18]. For example, numerous studies have shown that doping with polyvalent oxides, including certain concentrations of yttrium oxide, stabilizes the high-temperature cubic and tetragonal phases of ZrO2 at room temperature. This also leads to an increase in the concentration of oxygen vacancies and oxygen-ion conductivity, which makes it possible to use stabilized ZrO2 as an electrolyte in fuel cells [17]). The ionic conductivity of ZrO2 strongly depends on the phase modification and the content of stabilizing additives in the system, which is also evidenced by the phase diagram given in [18].
Many technological applications of zirconia (pure ZrO2 or their stabilized alloys) are directly related to interaction with water. Examples are internal steam reforming in solid oxide fuel cells [19], catalysis [20], gas sensors [21], or their use as a biocompatible material [22]. ZrO2 surfaces are also proposed as suitable materials for hydrogen storage [21,22,23]. However, little is known about the interaction of water with ZrO2 surfaces at a fundamental level, which is mainly due to the lack of suitable samples. This is quite different for other oxide substrates [23,24,25]. Water is weakly adsorbed on many defect-free oxide surfaces; in ultrahigh vacuum, then stripped at a temperature below room temperature. Usually, at 160–250 K [26], water can bind more strongly to surfaces with defects, as was shown for rutile TiO2 (110) [27]. In these cases, H2O dissociates into an OH group, which fills the oxygen vacancy, and into a hydrogen atom, which binds to surface oxygen and forms a second OH group. On TiO2, these OH groups are stable up to 490 K [28]. On a defect-free surface oxide (a-Cr2O3(001) [29], a-Fe2O3(012) [30] and oxides of alkaline earth metals, including Ca3Ru2O7(001) [31]), water can be strongly bound if the end of the surface includes highly active cations. Then it can easily dissociate. On the surface of RuO2(110), PdO(101), and Fe3O4(001), water binds coordinatively unsaturated cations and partially dissociated forms of the structure stabilized by hydrogen bonds [32,33,34]. Very high enthalpy adsorption of low H2O powder materials (≥ 2 eV on monoclinic and ≈ 1.5 eV on tetragonal ZrO2) has been reported decreasing to liquid-water binding (0.45 eV) at coverages of approximately 2–4 H2O/nm2 [35]. In another work, Droshkevich A.S. and others [36] reported on the chemoelectric conversion of water adsorption energy into electricity on the surface of zirconium dioxide nanopowders when doped with 3 mol. %Y2O3, which were synthesized with sizes of 7.5 nm.
However, despite numerous works in this direction, such detailed studies of water adsorption on the ZrO2 surface have not yet been carried out, and only a few reports on H2O adsorption can be found in the literature. In particular, studies of H2O adsorption on well-defined monoclinic surfaces of zirconia (m-ZrO2 (101) and m-ZrO2 (101) and their doped structures) have not yet been carried out. For example, it is especially difficult to study experimentally pure ZrO2 single crystals grown from a melt; they exhibit phase transformations upon cooling; therefore, their doped structures (eg YSZ) are usually investigated. However, the surface chemistry of YSZ is much more complex than that of pure ZrO2, as shown for CO and CO2 adsorption [37]. In another work, Kobayashi et al. [38] found that YSZ slowly decomposed at about 250°C due to the t-m transformation. This t-m transformation is accompanied by microcracks and loss of material strength in a humid atmosphere, and this discovery cooled the excitement caused by the discovery of PPT in zirconia-based ceramics. This t-m transformation due to the presence of water or a humid environment in zirconia-based ceramic materials has been termed low-temperature degradation or aging of ZrO2 crystals. A lot of work has been done on this topic over the past couple of decades, including many hypotheses and discussions, and the most reliable hypothesis on the topic of YSZ is based on filling oxygen vacancies that were present in the matrix to maintain a stable t-YSZ phase. Thus, the filling of these O-vacancies with water radicals, either O2 or OH, destabilizes the t-YSZ phase. However, the YSZ stabilization mechanism itself has not been fully studied and is still the subject of numerous discussions. Therefore, the theoretical study and modeling of water adsorption on these surfaces is necessary as a starting point for a good understanding of the ongoing processes and phenomena from a fundamental point of view. On the other hand, aspects of the shift of the Fermi level after doping with yttrium oxide in ZrO2, as well as under the influence of water adsorption, are still not clear due to the difficulty of their detection in the experiment.
For these reasons, in order to obtain detailed information on the process of adsorption of water molecules on the surface of ZrO2 and YSZ, as well as on the effect of doping on their electronic and structural properties, quantum chemical calculations were carried out in this work within the framework of the DFT.
2. Modeling details
Ab initio quantum chemical calculations were carried out on the basis of the density functional theory [39]. All three modifications of ZrO2 (Figure 1a–c) were first relaxed using the GGA functionals (PBE) [40] and strictly bounded normalized potential (SCAN) [41]. To obtain the most accurate value of the ground state energy, the total energy was calculated within the framework of the GGA exchange-correlation potential, and SCAN was used to correctly estimate the lattice parameters. The calculations were carried out using the Vienna Ab-initio Simulation Package (VASP 6.3.2) [42]. By comparing the total energy in the unit cell, a stable ZrO2 phase was found, and for stabilization to room temperature, a 2x2x2 supercell was created to simulate the effect of 3.23, 6.67, 10.34 and 16.15 mol. %Y2O3 on the stability of ZrO2 and evaluate influence of Y2O3 doping on the position of the Fermi level. An orbital analysis was performed by summing the contributions of the individual atomic species in the unit cell and showing the contributions of the main atoms at the meeting point of the valence and conduction bands. Vacancies were taken into account by removing one O atom with each subsequent substitution of 2 Y3+ ions to the Zr4+ position. The atomic orbitals H (1s), O (2s, 2p), Zr (4d, 5s), and Y (4s, 4p, 4d, 5s) were considered valence electrons, while the remaining electrons were considered nuclear electrons and remained frozen. The PAW method has been used to describe the interaction between valence electrons and electrons in the nucleus. The kinetic energy cutoff was fixed at the level of 600 eV, and all calculations were carried out taking into account spin-polarized effects.
Next, ab initio calculations were carried out to study the mechanism of adsorption of a water molecule on the surface of ZrO2 and ZrO2 by stabilized Y2O3, where the adsorption energies of a water molecule on the surface of ZrO2 and YSZ were found, as well as an orbital analysis was carried out and the shift of the Fermi level was estimated.
For such specific problems, the choice of an adsorbed surface is very important, and in order to obtain results consistent with experiment, we must accurately select a surface suitable for us, with the lowest density of surface broken bonds and electrostatic repulsion of neighboring layers, taking into account the thermodynamic stability of this surface. The higher the surface energy, the more thermodynamically unstable it is [43] and the more difficult it is to create the corresponding surface, namely, the surface energy is closely related to the number of atoms in the surface structure and the depth of the vacuum layer.
In this work, in order to select a suitable optimal surface for water adsorption and study its behavior on this surface, we also calculated the surface energy (σ) using equation 1 taken from [44]:
where S — total surface area of the plate, — total plate energy, – total energy of an optimized bulk structure. N and n respectively represent the total number of atoms in the surface structure and unit cell, and 2 represents the two surfaces of the calculated structure in the direction of the Z axis.
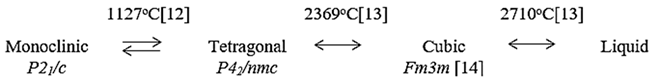
Models of the crystal wafer surface were constructed based on an extended 2 × 2 supercell with a vacuum space of 35 Å along the z direction to minimize the interaction of neighboring layers. Taking into account the accuracy and calculation time, the lower layers of the surface plate were frozen, and the upper part was allowed to relax. Monkhorst-Pack grids with a 3 × 3 × 1 k-point grid were used to sample the reciprocal space for 2 × 2 plate calculations. Each molecule in the gas phase was placed in a large box (11 × 13 × 10 Å3) to avoid side interactions.
Single H2O molecules were initially located at a height of 2.5 Å above the chosen surface, and different orientations, relaxing H2O molecules, and the upper layers of the plate were compared for each initial adsorption site. For each molecule, four initial adsorption centers were tested (above the Zr atom, above the terminal oxygen Ou (top) or Od (bottom), and also in the center above the Zr position (see Figure 1d)). For the YSZ surface model, various initial adsorption sites were also investigated: above the Zr atom, the extreme oxygen Ou (top), Od (bottom), in the oxygen vacancy position, the yttrium atom and the Ou-Od-Zr center (see Figure 1e) to find the most favorable adsorption sites leading to stable configurations. Nonequivalent initial adsorption sites have not been studied in detail.
The adsorption energy () was calculated as the difference between the energy of the plate with adsorbed water () and the sum of the energies of the surface () and the H2O molecule (), according to the following equation:
To take into account long-range uncoupled interactions, the van der Waals effects were taken into account as the difference between the calculated van der Waals energy of a plate with adsorbed H2O molecules () and the sum of the calculated van der Waals energies of the surface () and H2О molecules ():
where the interaction energy is taken into account by the Leonard-Jones potential.
3. Results and discussion
3.1. Structural stability and electron-phonon properties of ZrO2
At the first stage of modeling, the structural-energy relaxation of pure ZrO2 phases was carried out using the VASP package. To find the optimal cutoff energy for the ENCUT plane wave basis functions and the corresponding number of k-points in the Brillouin zone, we tested the convergence of the total unit cell energy as a function of ENCUT and KPOINTS.
The results of the k-point convergence test for ZrO2 cubic phases are shown in Figure 3, 2 and performed to build a grid from k-point data with an initial value of ENCUT = 1.3*ENMAX. Based on the results obtained, it can be concluded that for a 4x4x4 k-point grid with the Monkhrost-Pack scheme, it is optimal for the geometric relaxation of ZrO2. However, when calculating the electronic structure of these compounds, the number of k-points was at least doubled in order to obtain a better density of states (DOS).
Figure 2.
The total energy of the c-ZrO2 unit cell as a function of the number of k-points under the condition ENCUT=1.3*ENMAX.
Figure 2.
The total energy of the c-ZrO2 unit cell as a function of the number of k-points under the condition ENCUT=1.3*ENMAX.
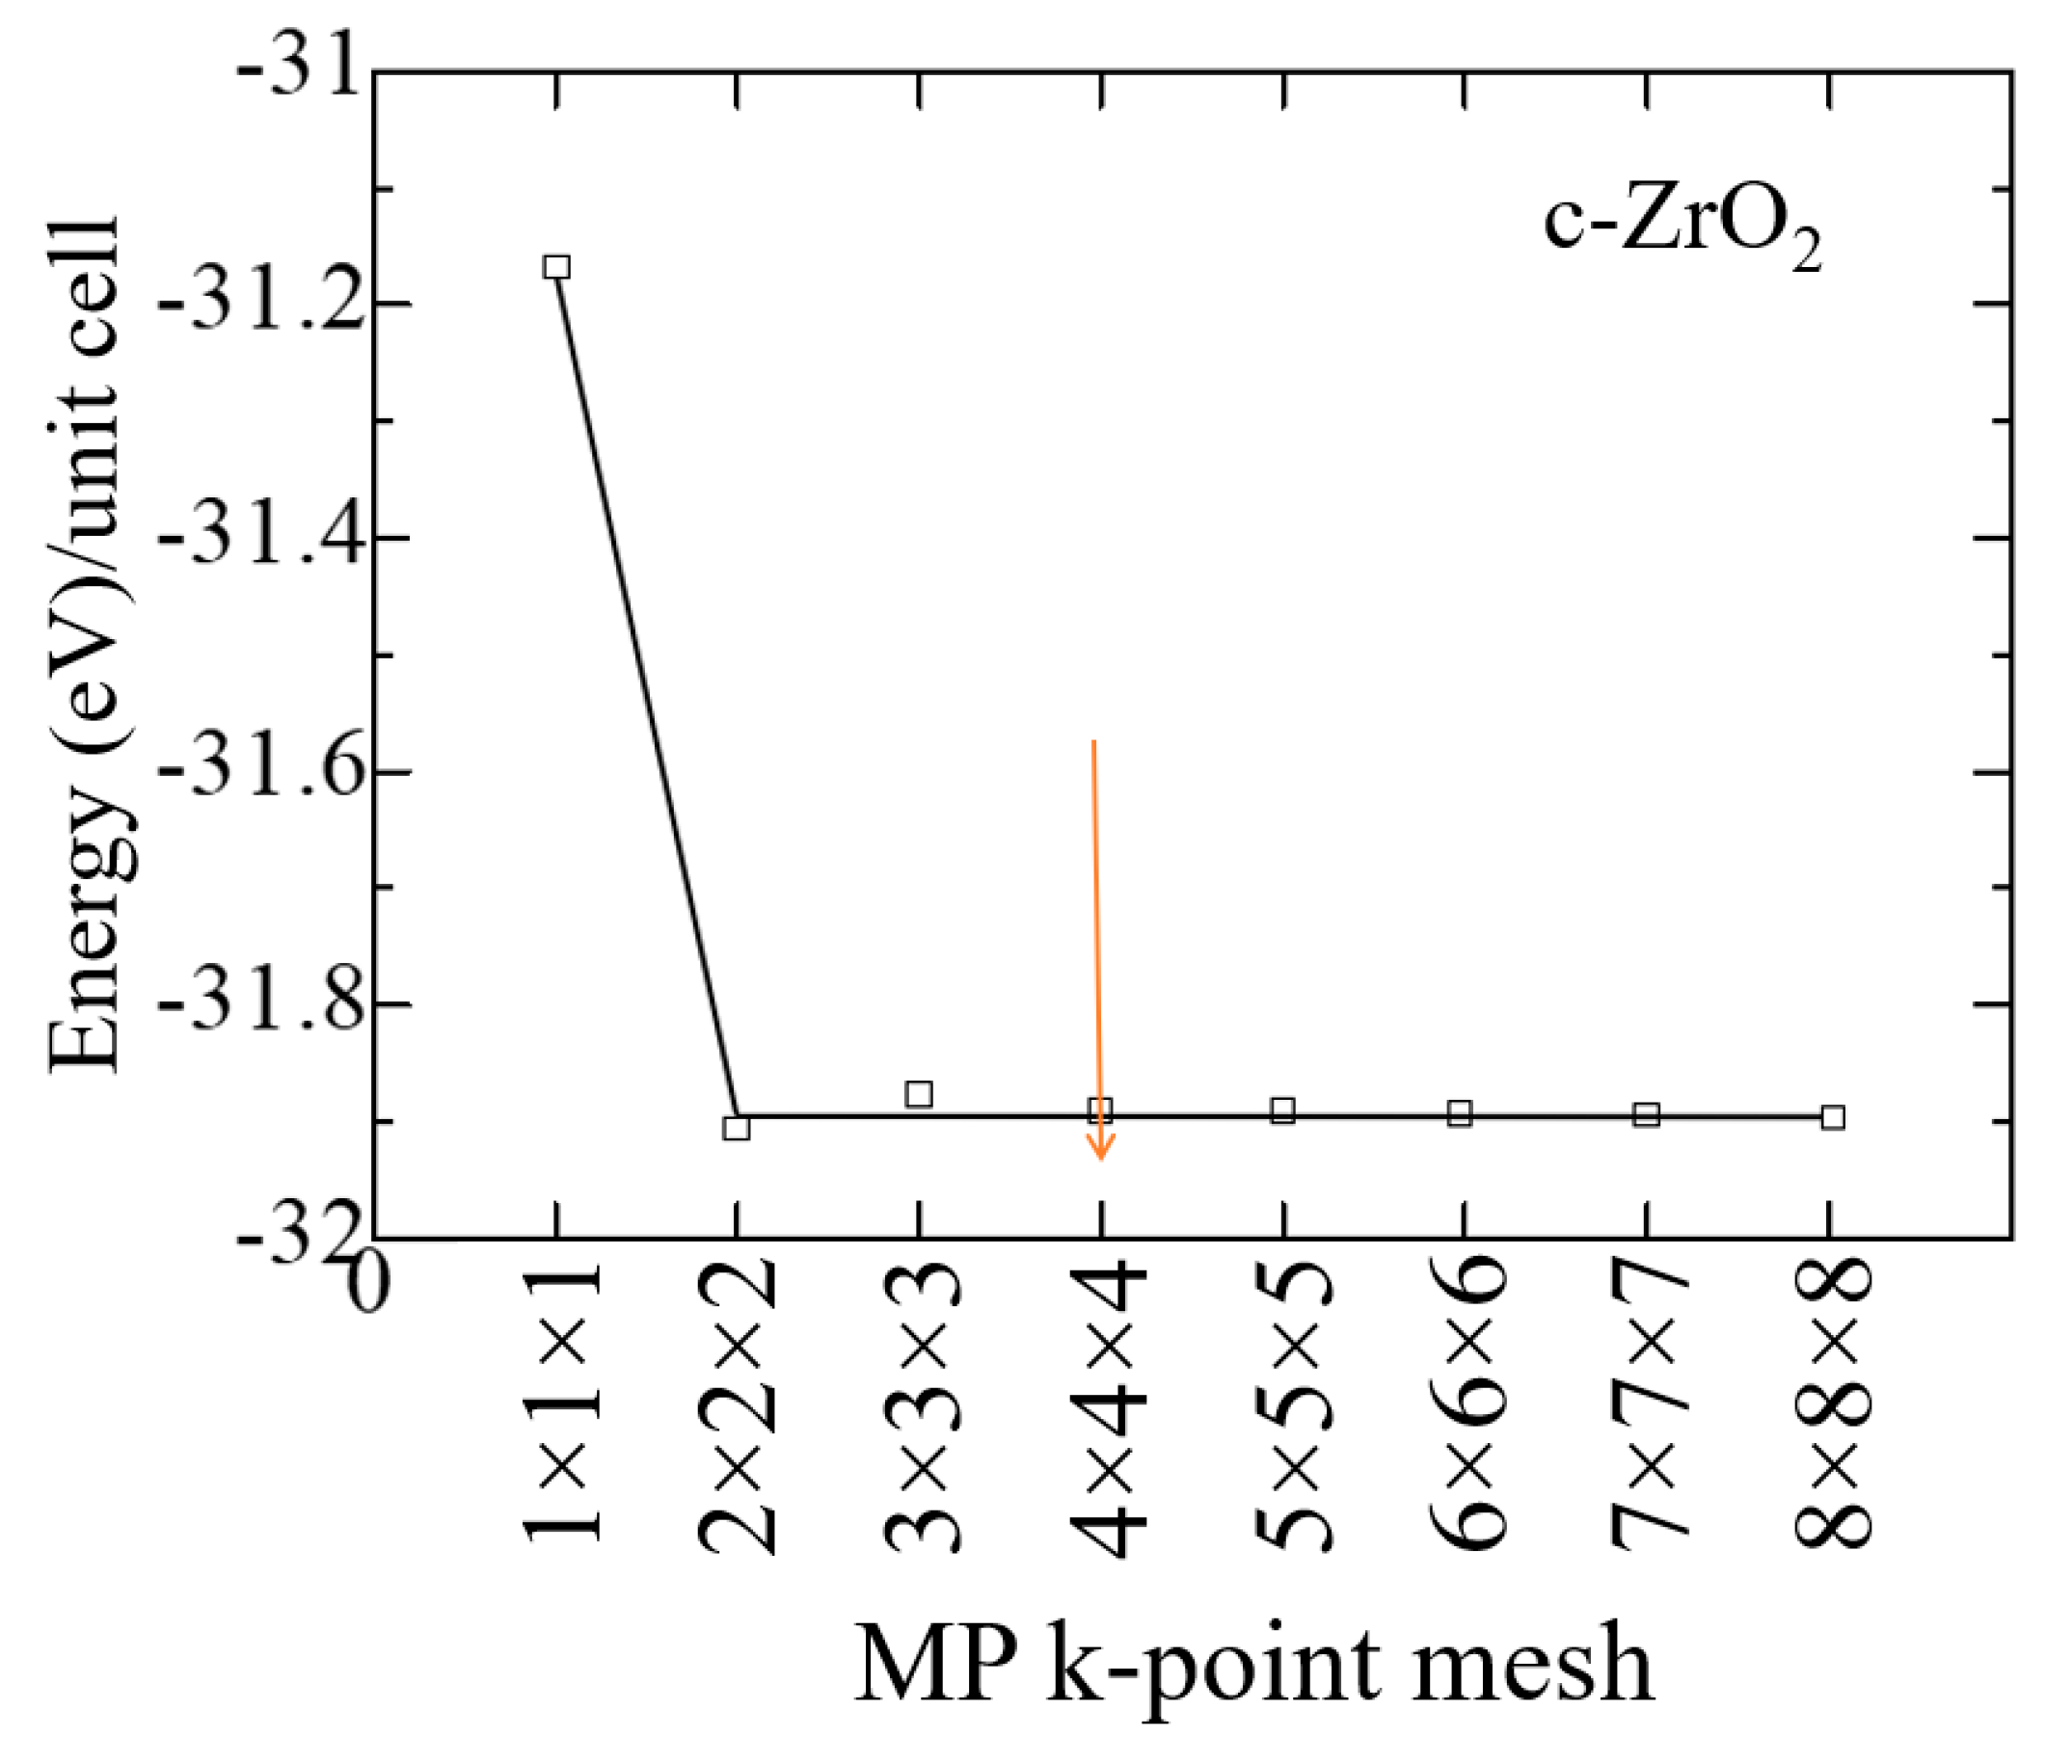
Similar tests were carried out to establish the cutoff energy, which shows that the choice of 600 eV is suitable for calculations, and a further increase in this energy increases the cost of the calculation without affecting its accuracy (Figure 3). Therefore, all further calculations were carried out at ENCUT = 600 eV.
Similar convergence tests were also carried out for the tetragonal and monoclinic phases of ZrO2 using the GGA potential. In Table 1 compares the calculated values of the crystal lattice constants of the ZrO2 phase, obtained from two exchange-correlation potentials, with the literature results.
According to the results given in Table 1, it can be seen that during the transition from the high-temperature phase to the low-temperature phase, the lattice distortion leads to a displacement of O ions in the c direction by the value of dz, expressed in relative units. As a result of distortion in the tetragonal phase, all Zr-O bonds will become nonequivalent. According to Table 3, the SCAN functionality describes the geometry much better than the standard GGA-PBE. However, it is also seen from the available data that GGA and SCAN almost identically describe the energy difference between the monoclinic and tetragonal phases of ZrO2. Since the SCAN exchange-correlation functional describes the structural properties well, we decided to use this functional in the future when describing the geometry of other systems.
Table 2 compares the total energies calculated by the GGA method for systems of the monoclinic, tetragonal, and cubic phases of ZrO2. It can be seen that among all systems, the most stable phase with the lowest energy is m-ZrO2, that is, in fact, in terms of the field energy at low temperatures, the stable phase is monoclinic with the space group P21/c.

Table 2.
GGA- calculated total electronic energies of c-ZrO2, t-ZrO2, m-ZrO2.
| System | Energy | ΔE |
|---|---|---|
| m-ZrO2 | -115.179 | 0 |
| t-ZrO2 | -114.754 | 0.425 |
| c-ZrO2 | -114.346 | 0.833 |
Further, using the Phonopy code in the VASP package, the thermodynamic properties and phonon spectra of the ZrO2 phase were calculated for a more detailed discussion and substantiation of the structural stability of the ZrO2 monoclinic phase. Figure 4 shows the change in the entropy of the unit cells of the ZrO2 phase as a function of temperature.
According to Figure 4, as the transition from monoclinic to tetragonal and cubic phases, the entropy of these compounds decreases, which corresponds to the criterion of inverse dependence of enthalpy or direct dependence of entropy and stability of solid systems [53]. Thus, the monoclinic phase is the most stable with the highest entropy among other ZrO2 phases. This pattern can be clearly observed after analyzing the pattern of phonon frequencies of the three phases of ZrO2 (Figure 5a–c), from which it is clearly seen that the monoclinic phase has the smallest negative modes than the other two phases.
Figure 6a–c shows the temperature dependence of the free energy, entropy, and heat capacity of a 12-atom supercell for m-ZrO2, t-ZrO2, and m-ZrO2.
The results of calculations of the density of phonon states presented in Figure 7a–c indicate that as the transition from monoclinic to tetragonal and cubic phases, the density of electronic states increases, and they also agree well with the results shown in Figure 5 and confirm that the monoclinic phase is the most stable among the other phases of ZrO2. This is also confirmed by the result of the Energy/Volume diagram presented in Figure 8. Therefore, for further stabilization by doping with Y2O3, it is reasonable to choose a monoclinic phase.
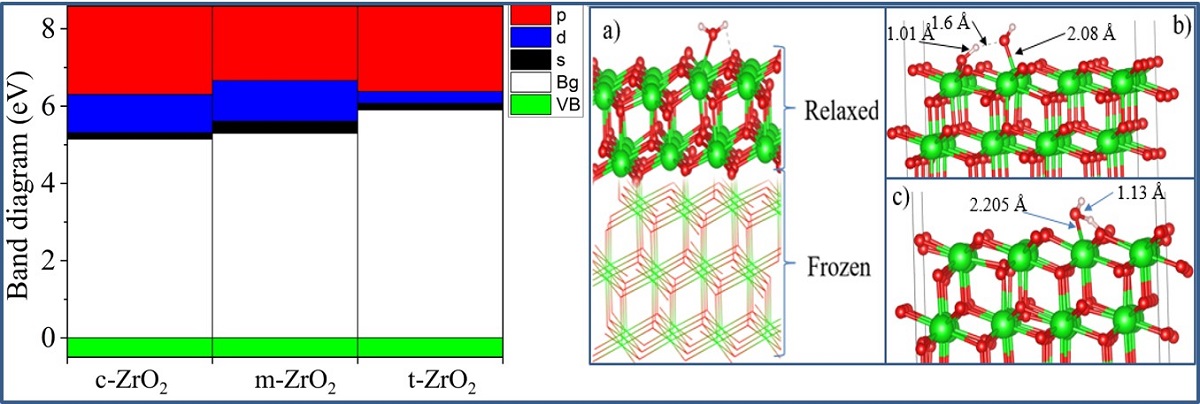
Next, using the well-optimized structures of the three phases of ZrO2, we performed calculations to study their electronic properties. Using the GGA and SCAN functionals and the HSE06 hybrid functional, we found the band gaps of these systems (Table 3), analyzed their orbital structure, and modeled the change in the position of the Fermi level in these systems.
Table 3.
Calculated and experimental band gap of c-ZrO2, t-ZrO2, m-ZrO2 in eV.
| System | This work | Experiment [55] | ||
|---|---|---|---|---|
| GGA | SCAN | HSE06 | VUV | |
| m-ZrO2 | 3.9 | 3.8 | 5.288 | 5.78 |
| t-ZrO2 | 4.42 | 4.37 | 5.898 | 5.83 |
| c-ZrO2 | 4.03 | 3.93 | 5.140 | 6.10 |
According to the results presented in Table 3, the GGA and SCAN functionals showed a rather small band gap compared to the HSE06 hybrid functional [56], which makes it possible to overcome the underestimation of the band gap. On the other hand, it is obvious that the standard SCAN and GGA functionals greatly underestimate the band gap. Given the suitability of HSE06 for estimating the band gap energy, we further used this hybrid functional to describe all the problems associated with the electronic properties of the systems under study.
Next, for ZrO2 structures relaxed using the SCAN functional, calculations were made of the density of available electronic states at the Fermi level (Figure 9), which is crucial for interpreting the electronic properties of ZrO2 and the transport characteristics of electronic devices based on this.
According to Figure 9, the density of electronic states for c-ZrO2 is somewhat overestimated compared to other phases. In addition, secondary energy gaps are observed in the energy diagram of the tetragonal and cubic phases. Also, this gap increases during the transition from the tetragonal to the cubic phase.
Next, the position of the Fermi level in ZrO2 crystals and the shift of this level during their phase transformation were determined. As can be seen from Figure 10, if we take the position of the Fermi level (maximum of the valence band) for the monoclinic phase as a reference point, then during the m-t phase transformation of ZrO2, this level first shifts by 0.125 eV towards higher energies (towards the valence band), and then , in the t-c section, decrease by 0.08 eV. This is also observed in detail from the band stacking results for the orbital analysis, which are shown in Figure 11 for the three phases of ZrO2.
It can be seen that as the transition from the monoclinic to the tetragonal and cubic phases, the contribution of the p orbitals becomes more significant in CB, and the s orbitals make a small contribution, while the d state shows a different trend. It is assumed that this behavior may be associated with a change in the crystal field and covalence of ZrO2 during the phase transformation.
3.2. Structural and energy properties of Y2O3 doped with m-ZrO2. Electronic properties of YSZ.
Next, supercells with a size of 2x2x2 of 96 atoms were created to simulate the effect of Y2O3 on the stability and electronic properties of the most stable (monoclinic) modification of ZrO2. To dope yttrium, it was necessary to replace some formula units of Y2O3 with ZrO2 in a 2x2x2 supercell, with each replacement creating one oxygen vacancy. A schematic description of the generation of YSZ structures is given below:
which can be considered as the union of x ZrO2 formula units with k Y2O3 formula units located on the initial lattice of x + k ZrO2 units, which leads to the formation of m oxygen defects. Based on this, we determine the percentage of vacancies equal to the percentage of yttrium units in the final structure. Thus, starting with a pure 96-atom ZrO2 supercell, we mainly focused on 4 different concentrations of Y2O3 in our calculations (Table 4).
After the final preparation of the YSZ structures, geometric optimization and doping relaxation of the Y2O3 supercell were performed using the GGA and SCAN potentials. Figure 12 shows a diagram of the dependence of the change in the enthalpy of formation of YSZ on the concentration of Y2O3, calculated by formula 4:
from which it is clearly seen that doping with Y2O3 reduces the enthalpy and leads to the stabilization of zirconium dioxide. The empirical formula obtained by the least squares method says that the enthalpy of formation energy decreases linearly according to the law ΔН = -1.0407x + 63.532, where x is the concentration of Y2O3 in YSZ.
Thus, with an increase in the Y2O3 concentration, the number of oxygen vacancies in YSZ increases, and the growth of these O vacancies is considered as a stabilizing mechanism of the monoclinic zirconium phase, as evidenced by a decrease in the enthalpy of formation.
Numerical values of the enthalpy formation energy are given in Table 6. Table 5 shows the geometric parameters of the ZrO2 and YSZ supercells at various Y2O3 concentrations after thorough relaxation using the SCAN functional.
After obtaining the optimized structures, the energy of formation (Ef) for ZrO2 and YSZ and the energy of formation of vacancies (Ev) for YSZ were calculated as:
where - total energy of the system, – total energy of individual components, δ is the number of vacancies (defects) in the crystal. The calculated values of and for each atom are given in Table 6.
Table 6.
GGA-calculated value of enthalpy (ΔН) and energy of formation () for ZrO2 and YSZ. Oxygen vacancy formation energy () for YSZ.
Table 6.
GGA-calculated value of enthalpy (ΔН) and energy of formation () for ZrO2 and YSZ. Oxygen vacancy formation energy () for YSZ.
| System | ΔН | ||
|---|---|---|---|
| 0 | 64.02917222 | -4.747216667 | 0 |
| 3.23 mol. %Y2O3 | 59.91124404 | -4.848422632 | -1.874577368 |
| 6.67 mol. %Y2O3 | 56.13271879 | -4.967857447 | -3.739875532 |
| 10.35 mol. %Y2O3 | 52.7041267 | -5.106527419 | -5.596013441 |
| 16.15 mol. %Y2O3 | 47.00229139 | -5.384704945 | -9.220196154 |
Figure 13 shows the nature of the change in and from the concentration of yttrium oxide, from which the regularity of their linear decrease is clearly visible.
Next, calculations were performed to study the electronic structure of Y2O3-stabilized ZrO2 supercells to reveal the effect of doping on the density of states, the behavior of the Fermi energy, and the orbital components. Figure 14 shows plots of changes in the density of electronic states YSZ for all doping concentrations of Y2O3.
According to the results presented in Figure 14, it can be noted that after doping with Y2O3, new energy states do not appear in the TDOS patterns due to the introduction of defects, that is, there are no noticeable changes, except for a decrease in the band gap , which can be understood in detail after orbital analysis (Figure 16) and Fermi level mixing estimates (Figure 15). The band gap is 4.71 eV, 4.92 eV, 4.75 eV, and 4.72 eV, respectively, for ZrO2 doped with 3.23, 6.67, 10.34, and 16.15 mol. %Y2O3.
According to Figure 15, after doping with 3.23 mol. %Y2O3 into pure m-ZrO2, the Fermi level drops by 0.067 eV and then shifts by 0.007 eV towards the conduction band upon doping with 6.67 mol. %Y2O3. Then, at a doping concentration of 10.34 mol. %Y2O3, it still increases by 0.01 eV, which is 0.017 eV more than in the case of 3.23 mol. %Y2O3. However, after doping with 16.15 mol. %Y2O3, it drops to 0.012 eV. The PDOS diagram also interprets the stepped conduction band pattern in terms of the contribution of the s, p, and d orbitals. Understanding these features makes it possible to tune the Fermi energies in the band structure to solve the most important problems of materials science and instrumentation.
The problems of studying the influence of doping of yttrium oxide on the properties and stability of tetragonal and cubic zirconia remain the subject of our future research.
3.3. Water adsorption on ZrO2 and YSZ surfaces
As already mentioned, the most important point is the choice of the surface with the lowest surface energy in order to correctly model the mechanism of water adsorption on the corresponding surface. To select the optimal adsorbed surface, we calculated the surface energy (σ) for several different surface models according to the equation after their geometric relaxation. The calculated value of the surface energy for ZrO2 is shown in Table 7.
According to the results presented in Table 7, it can be seen that the most stable surfaces can be obtained due to the tetragonal and monoclinic phases, namely, t-ZrO2 (101) and m-ZrO2 (111). The results obtained are in qualitative agreement with the work of Maliki et al. [57], who report that the most stable surface can be obtained from t-ZrO2 (101). As for the comparison of the results with experimental data, there were no data for comparison in the literature. This is due to the fact that the surface energy of solid metal oxides is difficult to measure experimentally. In total, the measurement of the surface energy of some types of zirconium dioxide surfaces by the method of multiphase balancing at high temperatures was reported [58]. Based on the results obtained, the t-ZrO2 (101) surface was chosen for this study as the most stable surface for the adsorption of water molecules.
After the final surface preparation, single H2O molecules were initially located at a height of 2.5 Å above the selected surface with different orientations, which is greater than the bond distance between Zr and O (2.12 Å) in the solid state. The structures were then optimized by freezing the bottom layers of the wafer (Figure 17a).
The optimized structure of the H2O + t-ZrO2 (101) system is shown in Figure 17b, which shows that the H2O molecule is dissociatively adsorbed with an energy of -1.221 eV even in the most favorable region (where the system has the minimum energy of the stable configuration). Dissociative adsorption of water on ZrO2 was also observed by Korhonen et al. [59], where it was experimentally and theoretically proven that water dissociates on the surface of m-ZrO2 at low coverage, and the adsorption energy calculated by us on t-ZrO2 (101) for [H+OH]-ZrO2(101) is similar to their results for monoclinic (111) and (101) surfaces with energy -1.20 eV. It was also found that water is adsorbed on this surface by the method of molecular chemisorption, in which water oxygen coordinates the surface cation, and a slight elongation of one O–H water bond (1.13 Å) occurs in the form of hydrogen bonding water with the surface oxygen ion (Figure 17c). In this case, the adsorption energy is 0.69 eV, and the distance between the oxygen of the water molecule and the surface zirconium atom is 2.205 Å. In this case, the proton (H) in the water molecule and oxygen from the surface of the plate form a hydrogen bond with a bond length of 1.01 Å.
Further, in order to study the mechanism of water adsorption on the surface of t-YSZ, we replaced two Zr (from the uppermost and subsurface O-Zr-O trilayers by Y with the removal of one oxygen from the third atomic layer nearest neighbor of Y atoms) to obtain a surface similar to t-YSZ(101). The results showed that the water molecule is molecularly adsorbed and also dissociated on the t-YSZ(101) surface. Molecular adsorption of water at the most optimal configuration occurs from an energy of -1.84 eV, and the bond length of water with the t-YSZ (101) surface increases to 2.73 Å (Figure 18a). In this case, the O-H distance in water molecules will remain unchanged.
The dissociative adsorption of water was accompanied by the movement of oxygen in the area of the plate vacancies, which leads to a very strong adsorption of -1.23 eV, blocking surface areas for oxygen activation. In both cases, H2O is adsorbed near the yttrium atom (Figure 18b).
Unlike water adsorption on t-ZrO2(101), H2O is more stably adsorbed on t-YSZ(101), since the adsorption energy of H2O-YSZ(101) is more favorable than that of (H+OH)-YSZ(101).
Doping with Y2O3 stabilizes t-ZrO2(101) and is accompanied by large relaxations of O atoms. Calculations based on the GGA functional greatly underestimate the band gap of the system (3.24 eV for the H2O-ZrO2(101) system and 3.21 eV for H2O-YSZ(101 )), however, despite the presence of the Oth vacancy, the average gap energy states did not appear in the t-YSZ band diagram, as is observed in the systems under study. A comparative analysis of the electronic structure of the H2O-ZrO2(101) and H2O-YSZ(101) systems indicates that the interaction of H2O practically does not change the electronic configuration of the system (with the exception of an increase in the density of state) during the transition of the system to being modified by Y impurities (Figure 19). However, water molecules are predominantly prone to molecular adsorption on the t-YSZ (101) surface, and more often dissociatively on t-ZrO2(101). Table 8 lists some key data obtained by modeling water adsorption on t-ZrO2(101) and t-YSZ surfaces.
In such studies, it is also important to take into account the hydrophilic nature of ZrO2. Studies show that, in addition to physically adsorbed water, the substrate surface contains terminal, bibridging, and triple bridging OH groups, which are actively involved in the surface reaction [60,61]. Surface hydroxyl groups and H2O adsorbed on the surface can partially block active sites (lattice oxygen ions on the surface) of YSZ oxidation. The surface configuration model for fully hydroxylated t-YSZ(101) is shown in Figure 20a. The results show that the OH groups form strong bonds on the surface. Figure 20b shows the adsorption structure of a single water molecule on a fully hydroxylated YSZ surface.
It can be seen that the repulsive forces of oxygen and hydrogen atoms in a water molecule and OH atoms on a completely hydroxylated surface do not prevent the adsorption of an H2O molecule on t-YSZ (101). When water is adsorbed on a hydroxylated surface, two strong hydrogen bonds are formed at a distance of 1.56 and 1.63 Å from each other. In this case, water is adsorbed with an adsorption energy of 0.34 eV. The adsorption model of a single water molecule and other similar systems will help in the future to study in detail more complex models, including the multilayer hydration structure of the interface (Figure 20). Although this model requires large computational power for DFT calculations, nevertheless, it can be assumed that in the layer closest to the surface (hydroxyl hydration layer), most of the water molecules can be adsorbed dissociatively. Further, due to hydrogen bonds, H2O molecules will continue to be adsorbed and regularly located on the hydroxylated surface, forming primary and secondary hydrated layers. The regular arrangement of H2O molecules in the outer layer can be considered as a transition layer, and the hydration structure of the first three H2O layers located near the surface can be considered as a group of water molecules capable of being stably adsorbed and existing on the m-NSC surface (101). However, a detailed study of the complete model of t-YSZ(101) surface hydration remains the subject of our future research.
Conclusions
The stability, electronic properties and dispersion of phonons in the three phases of the ZrO2 phases were investigated using quantum chemical calculations. The stable phase is defined in terms of the total energy, enthalpy, entropy, and band structure of phonons. It has been established that during the m-t-phase transformation of ZrO2, the Fermi level first shifts by 0.125 eV towards higher energies, and then decreases by 0.08 eV in the t-c region. Analysis of Tthe influence of doping 3.23, 6.67, 10.35 and 16.15 mol. %Y2O3 on the m-ZrO2 structure showed that the m-YSZ enthalpy decreases linearly, which accompanies further stabilization of monoclinic ZrO2.An analysis of the mechanism of water adsorption on the surface of t-ZrO2 (101) and t-YSZ (101) showed that H2O on unstabilized t-ZrO2 (101) is adsorbed dissociatively with an energy of -1.22 eV, as well as by the method of molecular chemisorption with an energy of -0 .69 eV and the formation of a hydrogen bond with a bond length of 1.01 Å. In the case of t-YSZ (101), water is molecularly adsorbed onto the surface with an energy of -1.84 eV. Dissociative adsorption of water occurs at an energy of -1.23 eV, near the yttrium atom. Thus, with an increase in the Y2O3 concentration, the number of oxygen vacancies in YSZ increases, and the growth of these O vacancies is considered as a stabilizing mechanism of the monoclinic zirconium phase, as evidenced by a decrease in the enthalpy. The presence of these oxygen vacancies also gives YSZ a high ionic conductivity property, making YSZ suitable for use in full solid oxide cells. This study will help in the future to build a more accurate calculation model for other types of surfaces like YSZ by characterizing their structural and electronic properties.
Funding
The research leading to these results has received funding from the European Union’s Horizon 2020 research and innovation programme under the Marie Sklodowvska-Curie grant agreement 871284 project SSHARE.
References
- Chevalier, J.; Gremillard, L.; Deville, S. Low-Temperature Degradation of Zirconia and Implications for Biomedical Implants. Annu. Rev. Mater. Res. 2007, 37, 1–32. [Google Scholar] [CrossRef]
- Volpato, C. Â. M. , Garbelotto, L. G. D., Fredel, M. C., & Bondioli, F. (2011). Application of zirconia in dentistry: biological, mechanical and optical considerations. Advances in ceramics-electric and magnetic ceramics, bioceramics, ceramics and environment, 17, 397-415.
- Nikumbh, A.K.; Adhyapak, P.V. Formation characterization and rheological properties of zirconia and ceria-stabilized zirconia. Nat. Sci. 2010, 2, 694. [Google Scholar] [CrossRef]
- Lee, W. E., & Rainforth, M. (1994). Ceramic microstructures: property control by processing. Springer Science & Business Media. p. 317.
- Yashima, M. , Ohtake, K., Arashi, H., Kakihana, M., & Yoshimura, M. (1993). Determination of cubic-tetragonal phase boundary in Zr1− XYX O2− X/2 solid solutions by Raman spectroscopy. Journal of applied physics, 74(12), 7603-7605.
- Yashima, M. , Sasaki, S., Kakihana, M., Yamaguchi, (1994). Oxygen-induced structural change of the tetragonal phase around the tetragonal–cubic phase boundary in ZrO2–YO1. 5 solid solutions. Acta Crystallographica Section B: Structural Science, 50(6), 663-672.
- Yashima, M.; Kakihana, M.; Yoshimura, M. Metastable-stable phase diagrams in the zirconia-containing systems utilized in solid-oxide fuel cell application. Solid State Ionics 1996, 86-88, 1131–1149. [Google Scholar] [CrossRef]
- Yashima, M.; Ohtake, K.; Kakihana, M.; Arashi, H.; Yoshimura, M. Determination of tetragonal-cubic phase boundary of Zr1− XRXO2− X2 (R= Nd, Sm, Y, Er and Yb) by Raman scattering. J. Phys. Chem. Solids 1996, 57, 17–24. [Google Scholar] [CrossRef]
- Yashima, M. , Ishizawa, N., & Yoshimura, M. (1993). High-Temperature X-ray Study of the Cubic-Tetragonal Diffusionless Phase Transition in the ZrO2─ ErO1. 5 System: I, Phase Change between Two Forms of a Tetragonal Phase, t′-ZrO2 and t ″-ZrO2, in the Compositionally Homogeneous 14 mol% ErO1. 5-ZrO2. Journal of the American Ceramic Society, 76(3), 641-648.
- Leger, J.M.; Tomaszewski, P.E.; Atouf, A.; Pereira, A.S. Pressure-induced structural phase transitions in zirconia under high pressure. Phys. Rev. B 1993, 47, 14075–14083. [Google Scholar] [CrossRef]
- Liu, L. G. (1980). New high pressure phases of ZrO2 and HfO2. Journal of Physics and Chemistry of Solids, 41(4), 331-334.
- Yashima, M.; Mitsuhashi, T.; Takashina, H.; Kakihana, M.; Ikegami, T.; Yoshimura, M. Tetragonal-Monoclinic Phase Transition Enthalpy and Temperature of ZrO2-CeO2 Solid Solutions. J. Am. Ceram. Soc. 1995, 78, 2225–2228. [Google Scholar] [CrossRef]
- Du, Y. , Jin, Z., & Huang, P. (1991). Thermodynamic Assessment of the ZrO2─ YO1. 5 System. Journal of the American Ceramic Society, 74(7), 1569-1577.
- Yashima, M. , Hirose, T., Katano, S., Suzuki, Y.(1995). Structural changes of ZrO 2-CeO 2 solid solutions around the monoclinic-tetragonal phase boundary. Physical Review B, 51(13), 8018.
- Clearfield, A. Crystalline Hydrous Zirconia. Inorg. Chem. 1964, 3, 146–148. [Google Scholar] [CrossRef]
- Doroshkevich, A.; Nabiev, A.; Shylo, A.; Pawlukojć, A.; Doroshkevich, V.; Glazunova, V.; Zelenyak, T.; Doroshkevich, N.; Rahmonov, K.; Khamzin, E.; et al. Frequency modulation of the Raman spectrum at the interface DNA - ZrO2 nanoparticles. Egypt. J. Chem. 2019, 62, 13–15. [Google Scholar] [CrossRef]
- A. Kvist, in: Physics of Electrolytes, Vol. 1, ed. J. Hladik (Academic Press, London, 1972) p. 319.
- Lughi, V.; Sergo, V. Low temperature degradation -aging- of zirconia: A critical review of the relevant aspects in dentistry. Dent. Mater. 2010, 26, 807–820. [Google Scholar] [CrossRef]
- Hecht, E.S.; Gupta, G.K.; Zhu, H.; Dean, A.M.; Kee, R.J.; Maier, L.; Deutschmann, O. Methane reforming kinetics within a Ni–YSZ SOFC anode support. Appl. Catal. A: Gen. 2005, 295, 40–51. [Google Scholar] [CrossRef]
- Tanabe, K. Surface and catalytic properties of ZrO2. Mater. Chem. Phys. 1985, 13, 347–364. [Google Scholar] [CrossRef]
- Liu, Y.; Parisi, J.; Sun, X.; Lei, Y. Solid-state gas sensors for high temperature applications – a review. J. Mater. Chem. A 2014, 2, 9919–9943. [Google Scholar] [CrossRef]
- Hisbergues, M.; Vendeville, S.; Vendeville, P. Zirconia: Established facts and perspectives for a biomaterial in dental implantology. J. Biomed. Mater. Res. Part B: Appl. Biomater. 2009, 88, 519–529. [Google Scholar] [CrossRef] [PubMed]
- Henderson, M.A. The interaction of water with solid surfaces: fundamental aspects revisited. Surf. Sci. Rep. 2002, 46, 1–308. [Google Scholar] [CrossRef]
- Mu, R.; Zhao, Z.-J.; Dohnálek, Z.; Gong, J. Structural motifs of water on metal oxide surfaces. Chem. Soc. Rev. 2017, 46, 1785–1806. [Google Scholar] [CrossRef]
- Nematov, D.D.; Kholmurodov, K.T.; Husenzoda, M.A.; Lyubchyk, A.; Burhonzoda, A.S. Molecular Adsorption of H2O on TiO2 and TiO2:Y Surfaces. J. Human, Earth, Futur. 2022, 3, 213–222. [Google Scholar] [CrossRef]
- Campbell, C.T.; Sellers, J.R.V. Enthalpies and Entropies of Adsorption on Well-Defined Oxide Surfaces: Experimental Measurements. Chem. Rev. 2013, 113, 4106–4135. [Google Scholar] [CrossRef]
- Zhang, Z.; Bondarchuk, O.; Kay, B.D.; White, J.M.; Dohnálek, Z. Imaging Water Dissociation on TiO2(110): Evidence for Inequivalent Geminate OH Groups. J. Phys. Chem. B 2006, 110, 21840–21845. [Google Scholar] [CrossRef]
- Henderson, M.A. Structural Sensitivity in the Dissociation of Water on TiO2 Single-Crystal Surfaces. Langmuir 1996, 12, 5093–5098. [Google Scholar] [CrossRef]
- Henderson, M.A.; Chambers, S.A. HREELS, TPD and XPS study of the interaction of water with the α-Cr2O3 (001) surface. Surf. Sci. 2000, 449, 135–150. [Google Scholar] [CrossRef]
- Henderson, M. A. , Joyce, S. A., & Rustad, J. R. (1998). Interaction of water with the (1× 1) and (2× 1) surfaces of α-Fe2O3 (012). Surface Science, 417(1), 66-81.
- Hu, X.L.; Carrasco, J.; Klimeš, J.; Michaelides, A. Trends in water monomer adsorption and dissociation on flat insulating surfaces. Phys. Chem. Chem. Phys. 2011, 13, 12447–12453. [Google Scholar] [CrossRef]
- Lobo, A.; Conrad, H. Interaction of H2O with the RuO2(110) surface studied by HREELS and TDS. Surf. Sci. 2003, 523, 279–286. [Google Scholar] [CrossRef]
- Kan, H. H. , Colmyer, R. J., Asthagiri, A., & Weaver, J. F. (2009). Adsorption of water on a PdO (101) thin film: Evidence of an adsorbed HO− H2O complex. The Journal of Physical Chemistry C, 113(4), 1495-1506.
- Meier, M., Hulva, J., Jakub, Z., Pavelec, J., Setvin, M., Bliem, R., ... & Parkinson, G. S. (2018). Water agglomerates on Fe3O4 (001). Proceedings of the National Academy of Sciences, 115(25), E5642-E5650.
- Radha, A.V.; Bomati-Miguel, O.; Ushakov, S.V.; Navrotsky, A.; Tartaj, P. Surface Enthalpy, Enthalpy of Water Adsorption, and Phase Stability in Nanocrystalline Monoclinic Zirconia. J. Am. Ceram. Soc. 2009, 92, 133–140. [Google Scholar] [CrossRef]
- Doroshkevich, A.S.; Asgerov, E.B.; Shylo, A.V.; Lyubchyk, A.I.; Logunov, A.I.; Glazunova, V.A.; Islamov, A.K.; Turchenko, V.A.; Almasan, V.; Lazar, D.; et al. Direct conversion of the water adsorption energy to electricity on the surface of zirconia nanoparticles. Appl. Nanosci. 2019, 9, 1603–1609. [Google Scholar] [CrossRef]
- Köck, E. M. , Kogler, M.(2013). In situ FT-IR spectroscopic study of CO2 and CO adsorption on Y2O3, ZrO2, and yttria-stabilized ZrO2. The Journal of Physical Chemistry C, 117(34), 17666-17673.
- Kobayashi, K.; Kuwajima, H.; Masaki, T. Phase change and mechanical properties of ZrO2-Y2O3 solid electrolyte after ageing. Solid State Ionics 1981, 3-4, 489–493. [Google Scholar] [CrossRef]
- Hohenberg, P.; Kohn, W. Inhomogeneous Electron Gas. Phys. Rev. 1964, 136, B864–B871. [Google Scholar] [CrossRef]
- Perdew, J.P.; Burke, K.; Ernzerhof, M. Generalized gradient approximation made simple. Phys. Rev. Lett. 1996, 77, 3865–3868. [Google Scholar] [CrossRef]
- Sun, J.; Ruzsinszky, A.; Perdew, J.P. Strongly Constrained and Appropriately Normed Semilocal Density Functional. Phys. Rev. Lett. 2015, 115, 036402. [Google Scholar] [CrossRef]
- Kresse, G.; Furthmüller, J. Efficiency of ab-initio total energy calculations for metals and semiconductors using a plane-wave basis set. Comput. Mater. Sci. 1996, 6, 15–50. [Google Scholar] [CrossRef]
- Liu, J.; Gong, G.; Han, Y.; Zhu, Y. New Insights into the Adsorption of Oleate on Cassiterite: A DFT Study. Minerals 2017, 7, 236. [Google Scholar] [CrossRef]
- Zhu, Y.; Luo, B.; Sun, C.; Liu, J.; Sun, H.; Li, Y.; Han, Y. Density functional theory study of α-Bromolauric acid adsorption on the α-quartz (1 0 1) surface. Miner. Eng. 2016, 92, 72–77. [Google Scholar] [CrossRef]
- Howard, C.J.; Hill, R.J.; Reichert, B.E. Structures of ZrO2 polymorphs at room temperature by high-resolution neutron powder diffraction. Acta Crystallogr. Sect. B Struct. Sci. 1988, 44, 116–120. [Google Scholar] [CrossRef]
- Teufer, G. The crystal structure of tetragonal ZrO2. Acta Crystallogr. 1962, 15, 1187–1187. [Google Scholar] [CrossRef]
- Martin, U.; Boysen, H.; Frey, F. Neutron powder investigation of tetragonal and cubic stabilized zirconia, TZP and CSZ, at temperatures up to 1400 K. Acta Crystallogr. Sect. B Struct. Sci. 1993, 49, 403–413. [Google Scholar] [CrossRef]
- Aldebert, P.; Traverse, J.-P. Structure and Ionic Mobility of Zirconia at High Temperature. J. Am. Ceram. Soc. 1985, 68, 34–40. [Google Scholar] [CrossRef]
- Arroyave, R. , Kaufman, L., & Eagar, T. W. (2002). Thermodynamic modeling of the Zr O system. Calphad, 26(1), 95-118.
- Martin, U.; Boysen, H.; Frey, F. Neutron powder investigation of tetragonal and cubic stabilized zirconia, TZP and CSZ, at temperatures up to 1400 K. Acta Crystallogr. Sect. B Struct. Sci. 1993, 49, 403–413. [Google Scholar] [CrossRef]
- Molodetsky, I.; Navrotsky, A.; Lajavardi, M.; Brune, A. (1998). The energetics of cubic zirconia from solution calorimetry of yttria-and calcia-stabilized zirconia. Zeitschrift fuer Physikalische Chemie, 207(1- 2), 59-65. [CrossRef]
- Ding, H.; Virkar, A.V.; Liu, F. Defect configuration and phase stability of cubic versus tetragonal yttria-stabilized zirconia. Solid State Ionics 2012, 215, 16–23. [Google Scholar] [CrossRef]
- Pascal, R.; Pross, A. Stability and its manifestation in the chemical and biological worlds. Chem. Commun. 2015, 51, 16160–16165. [Google Scholar] [CrossRef]
- Teter, D. M. , Gibbs, G. V., Boisen Jr, M. B., Allan, D. C., & Teter, M. P. (1995). First-principles study of several hypothetical silica framework structures. Physical Review B, 52(11), 8064.
- French, R. H., Glass, S. J., Ohuchi, F. S., Xu, Y. N., & Ching, W. Y. (1994). Experimental and theoretical determination of the electronic structure and optical properties of three phases of ZrO 2. Physical Review B, 49(8), 5133.
- Heyd, J.; Scuseria, G.E.; Ernzerhof, M. Hybrid functionals based on a screened Coulomb potential. J. Chem. Phys. 2003, 118, 8207–8215. [Google Scholar] [CrossRef]
- Maleki, F.; Pacchioni, G. Characterization of Acid and Basic Sites on Zirconia Surfaces and Nanoparticles by Adsorbed Probe Molecules: A Theoretical Study. Top. Catal. 2020, 63, 1717–1730. [Google Scholar] [CrossRef]
- Tsoga, A.; Nikolopoulos, P. Surface and grain-boundary energies in yttria-stabilized zirconia (YSZ-8 mol%). J. Mater. Sci. 1996, 31, 5409–5413. [Google Scholar] [CrossRef]
- Korhonen, S.T.; Calatayud, M.; Krause, A.O.I. Stability of Hydroxylated (1̄11) and (1̄01) Surfaces of Monoclinic Zirconia: A Combined Study by DFT and Infrared Spectroscopy. J. Phys. Chem. C 2008, 112, 6469–6476. [Google Scholar] [CrossRef]
- Kim, G. , Kwon, G., & Lee, H. (2021). The role of surface hydroxyl groups on a single-atomic Rh 1/ZrO 2 catalyst for direct methane oxidation. Chemical Communications, 57(13), 1671-1674.
- Zhu, J.; Vanommen, J.; Lefferts, L. Effect of surface OH groups on catalytic performance of yittrium-stabilized ZrO2 in partial oxidation of CH4 to syngas. Catal. Today 2006, 117, 163–167. [Google Scholar] [CrossRef]
Figure 1.
Optimized cells of three ZrO2 phases (a-c), 2 × 2 × 2 monoclinic ZrO2 supercell model doped with Y2O3 (d), yttrium substitution sites in the surface matrix (e-f) and a box with the addition of a 35 Å vacuum containing water molecules from the surface of the ZrO2 substrate (g).
Figure 1.
Optimized cells of three ZrO2 phases (a-c), 2 × 2 × 2 monoclinic ZrO2 supercell model doped with Y2O3 (d), yttrium substitution sites in the surface matrix (e-f) and a box with the addition of a 35 Å vacuum containing water molecules from the surface of the ZrO2 substrate (g).
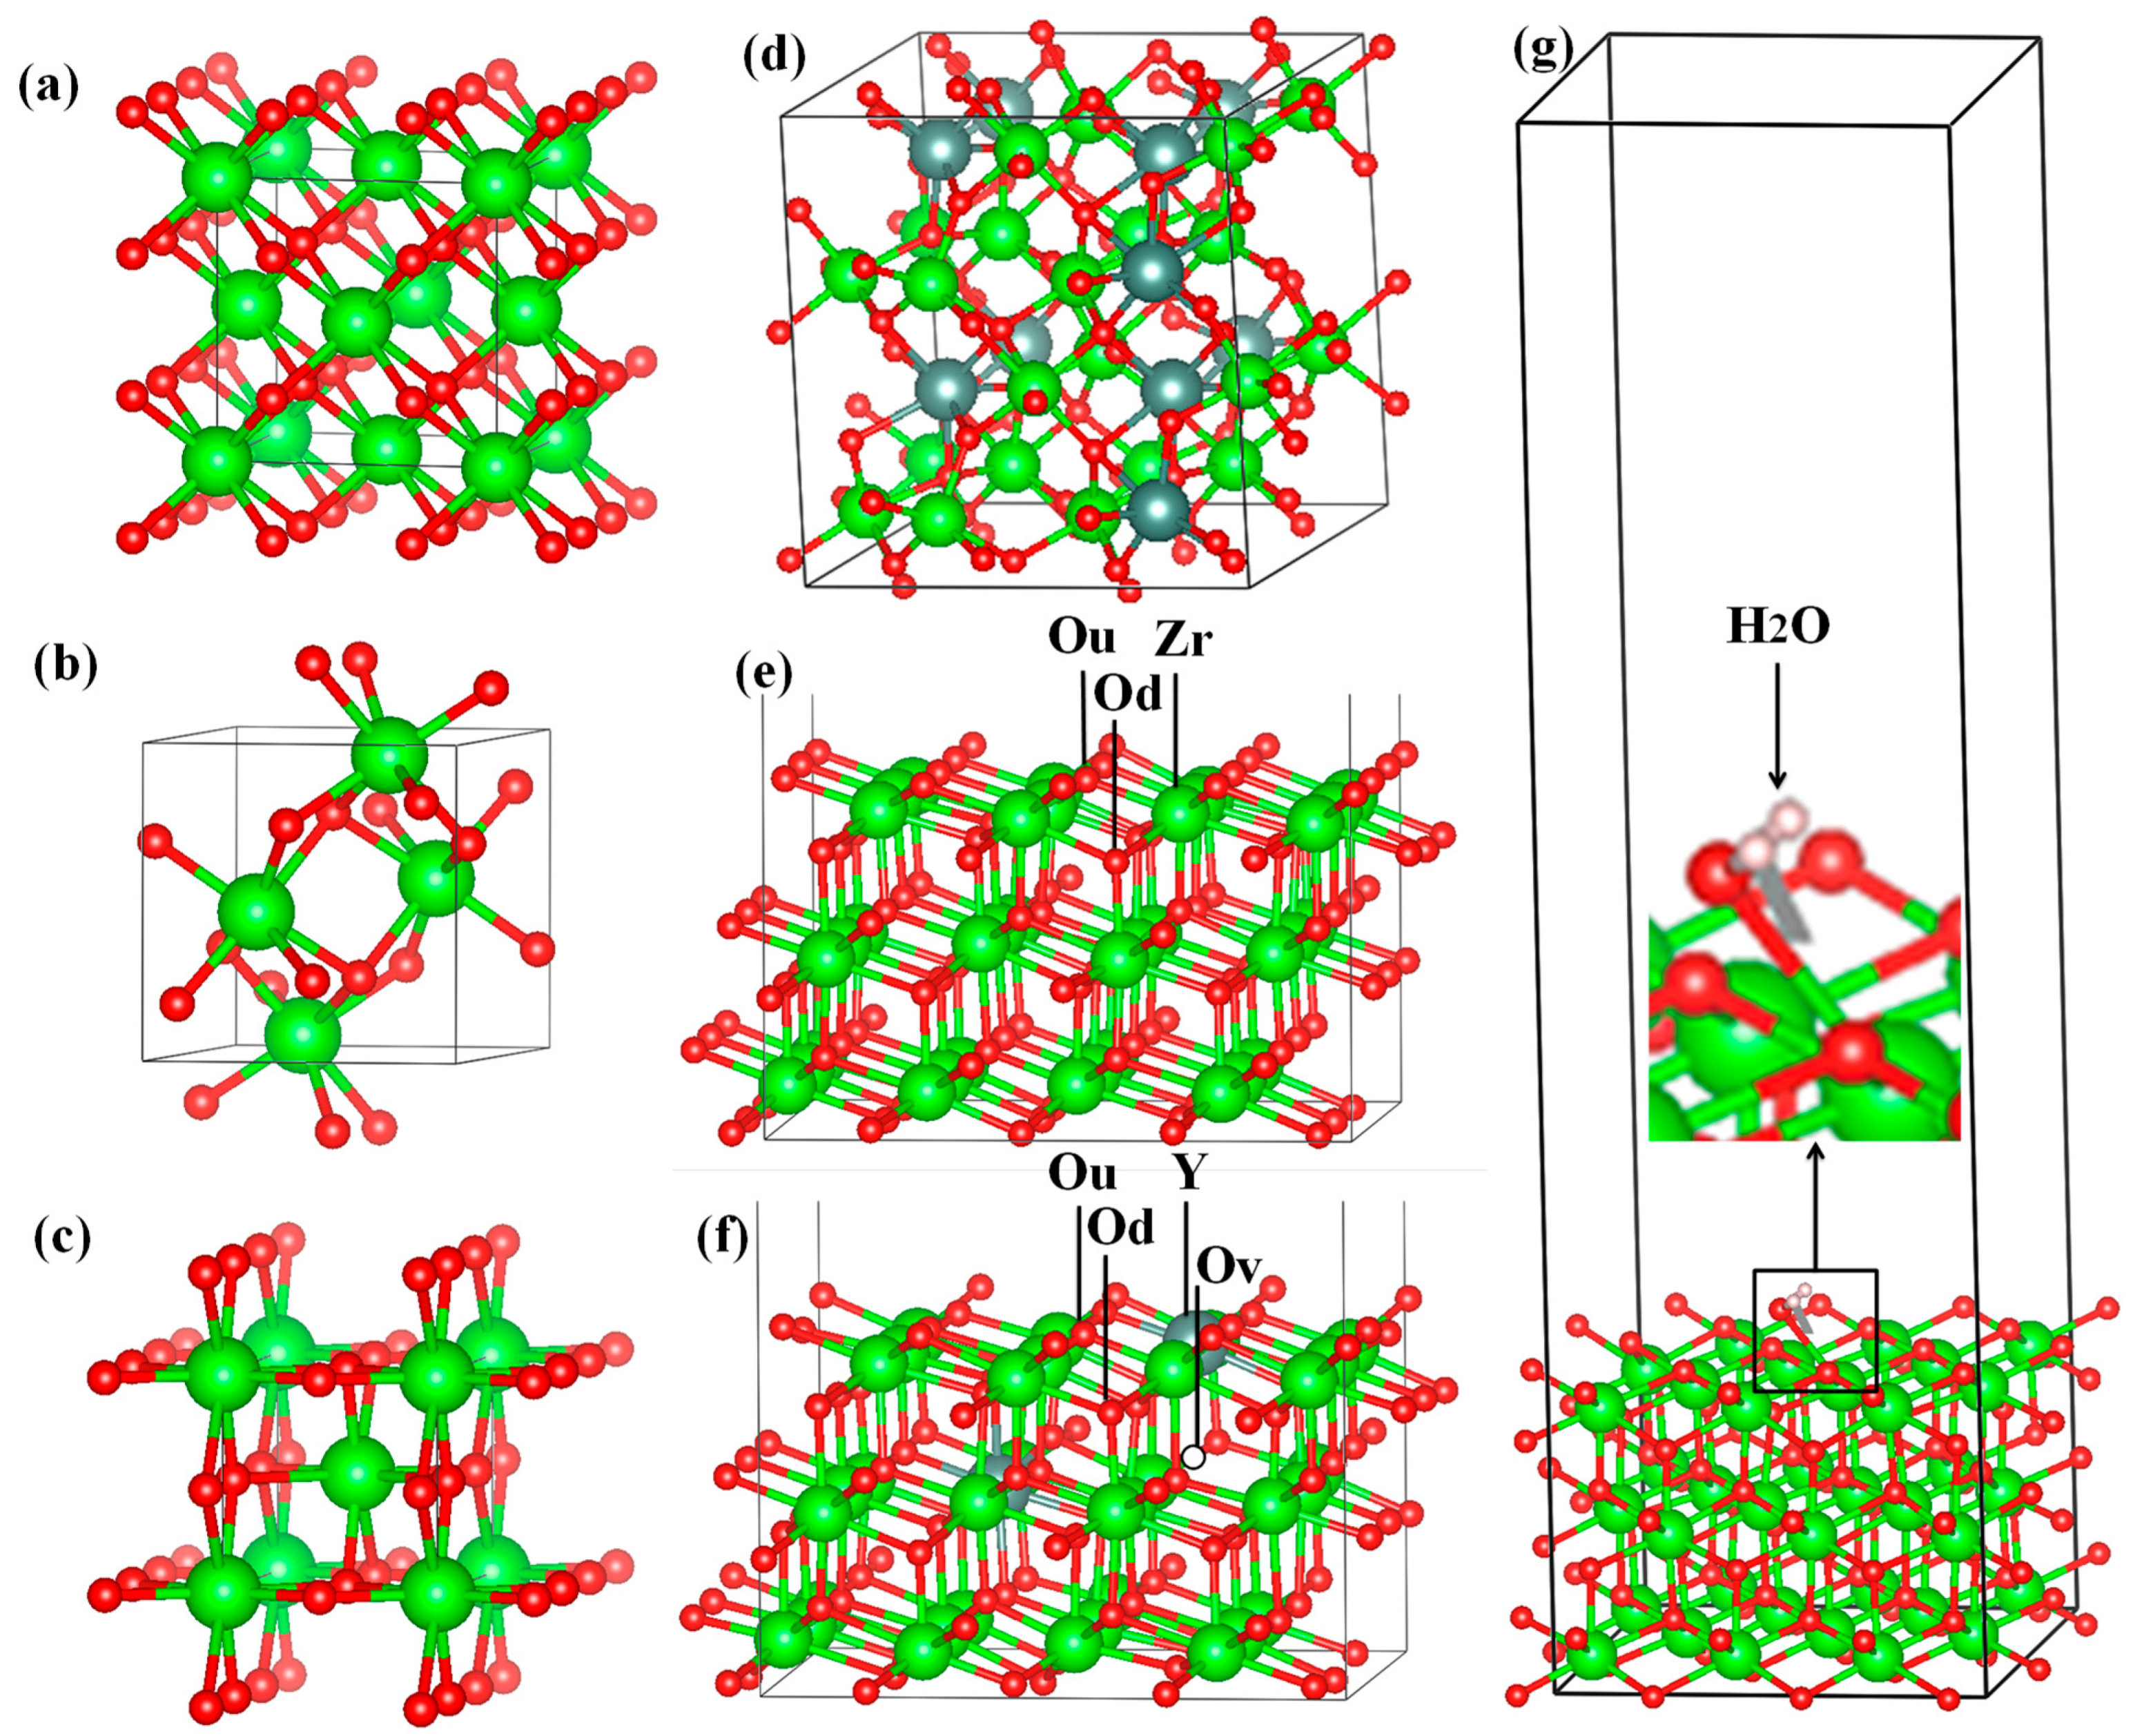
Figure 3.
Total energy of the c-ZrO2 unit cell as a function of the cutoff energy (4 × 4 × 4 k-points).
Figure 3.
Total energy of the c-ZrO2 unit cell as a function of the cutoff energy (4 × 4 × 4 k-points).
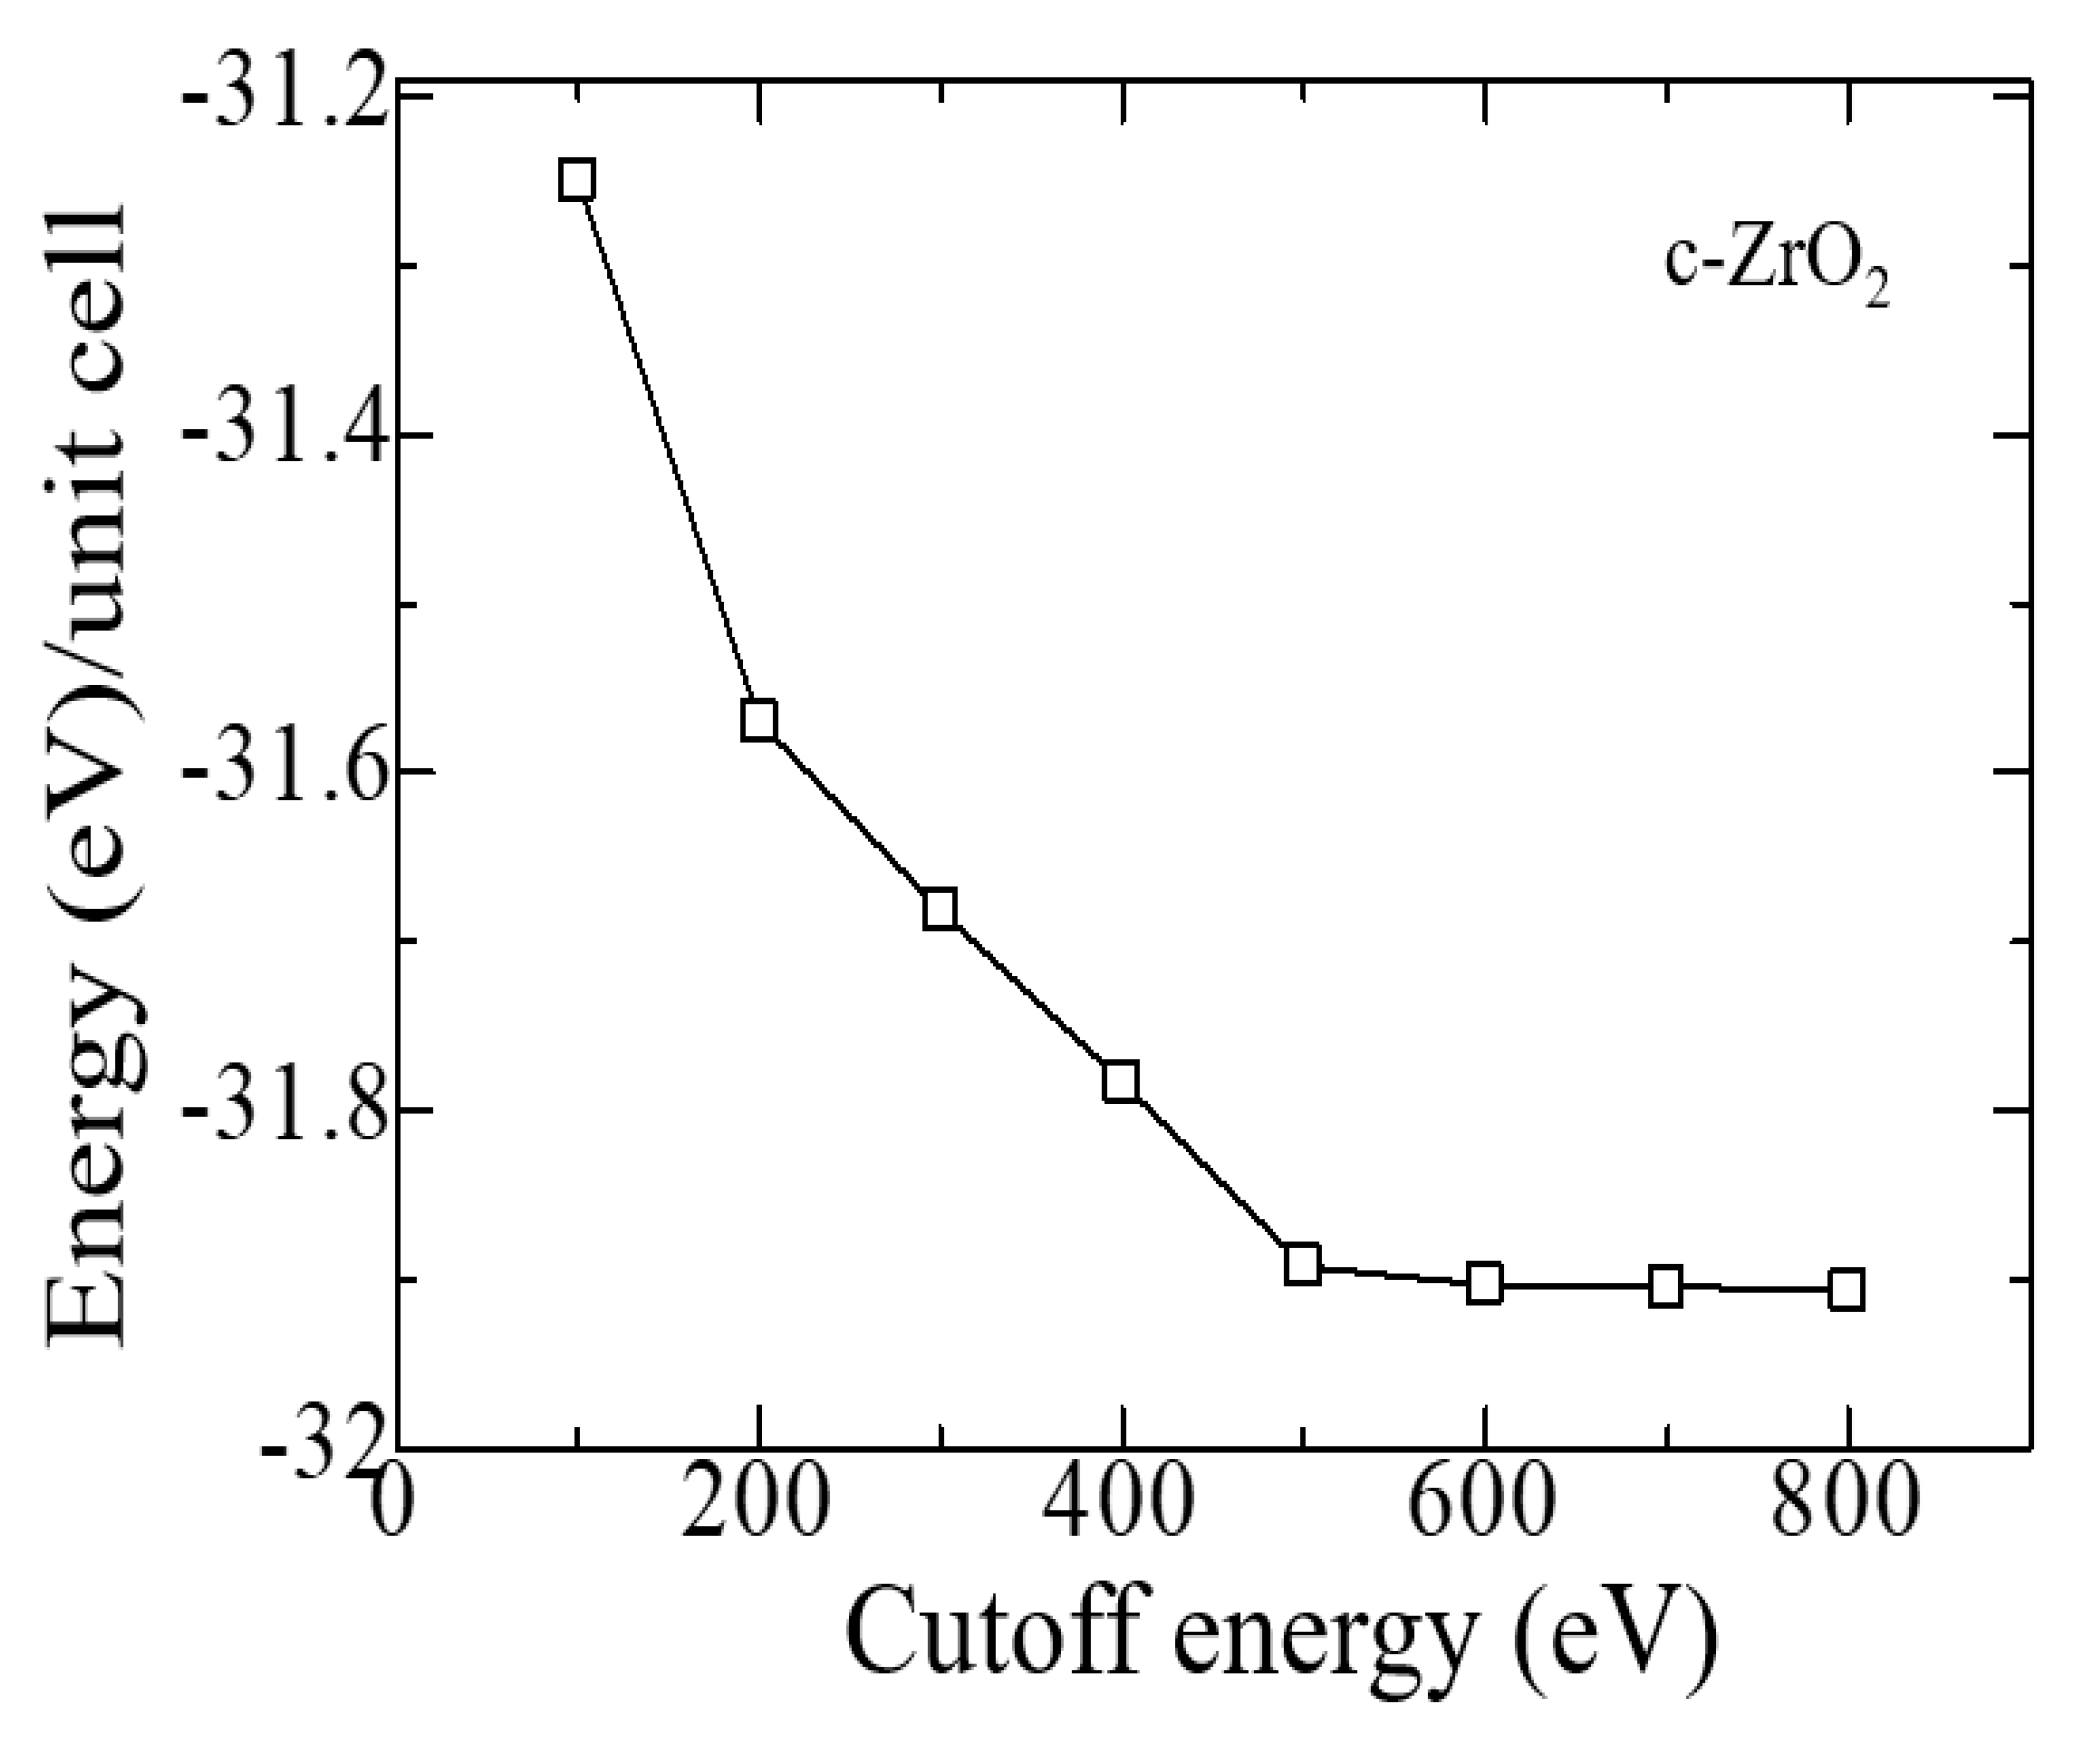
Figure 4.
Entropy as a function of absolute temperature per unit cell.
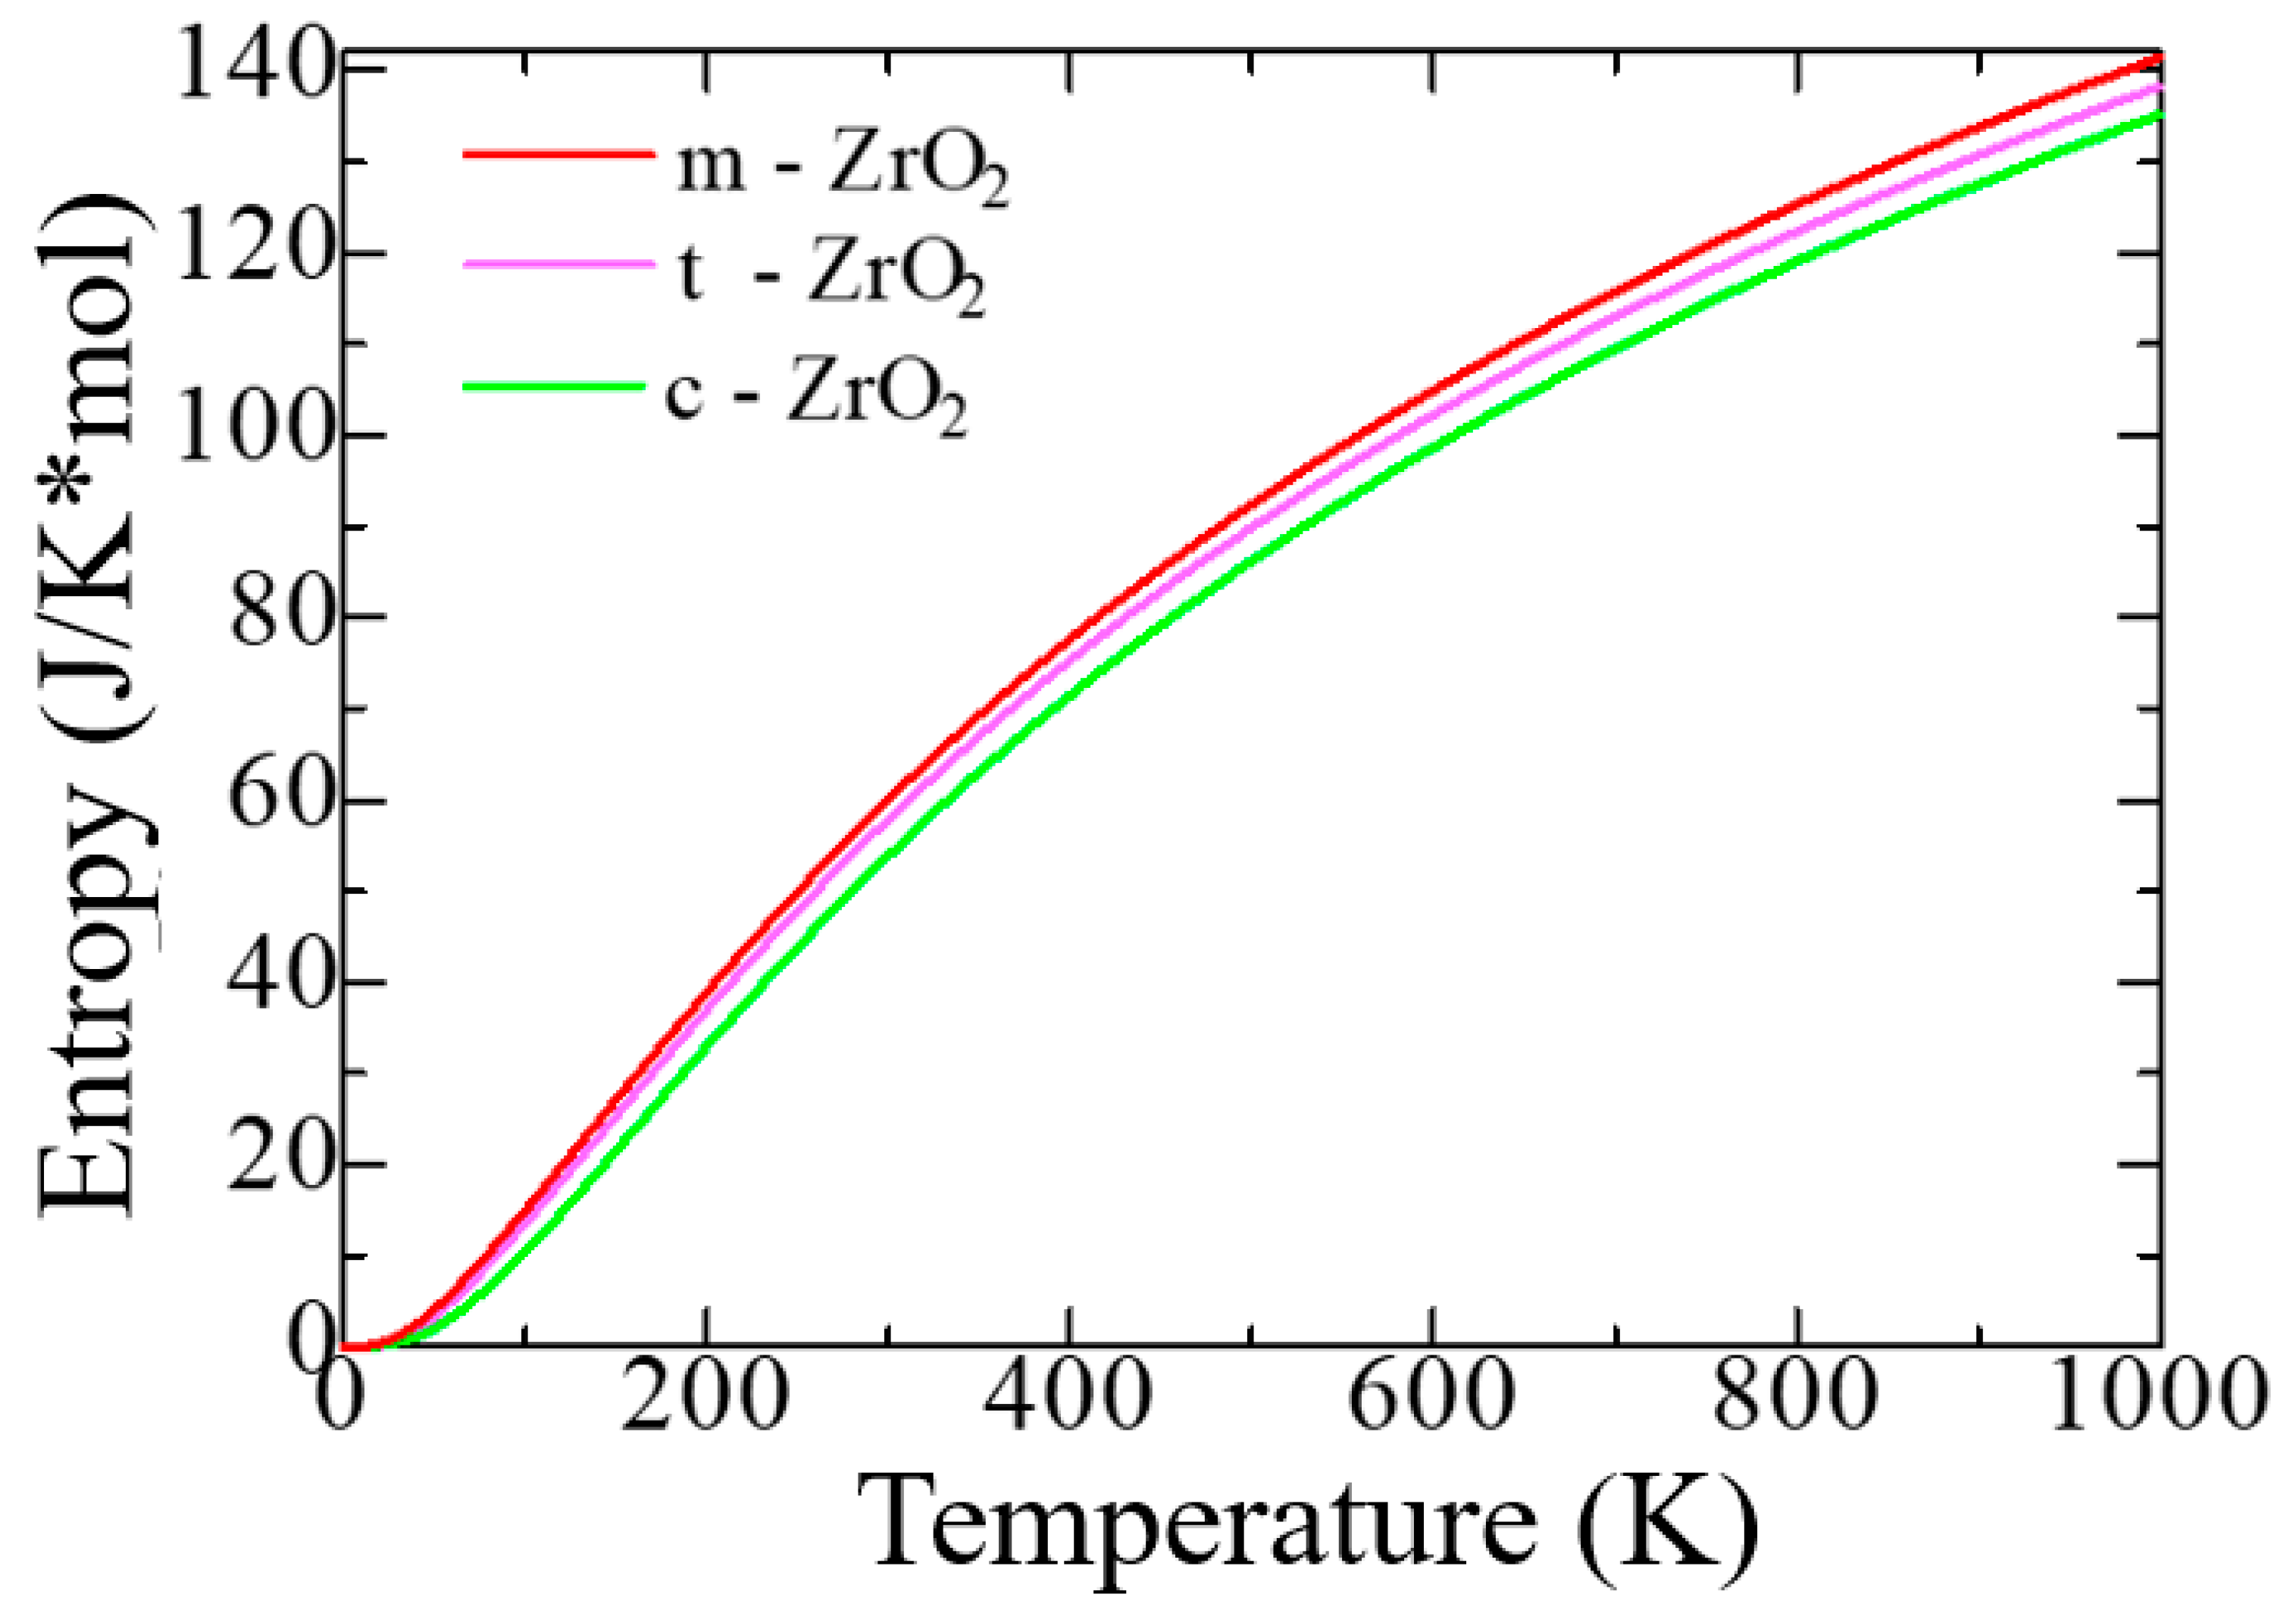
Figure 5.
Phonon dispersion relations of (a) monoclinic, (b) tetragonal, and (c) cubic ZrO2 at 0 K.
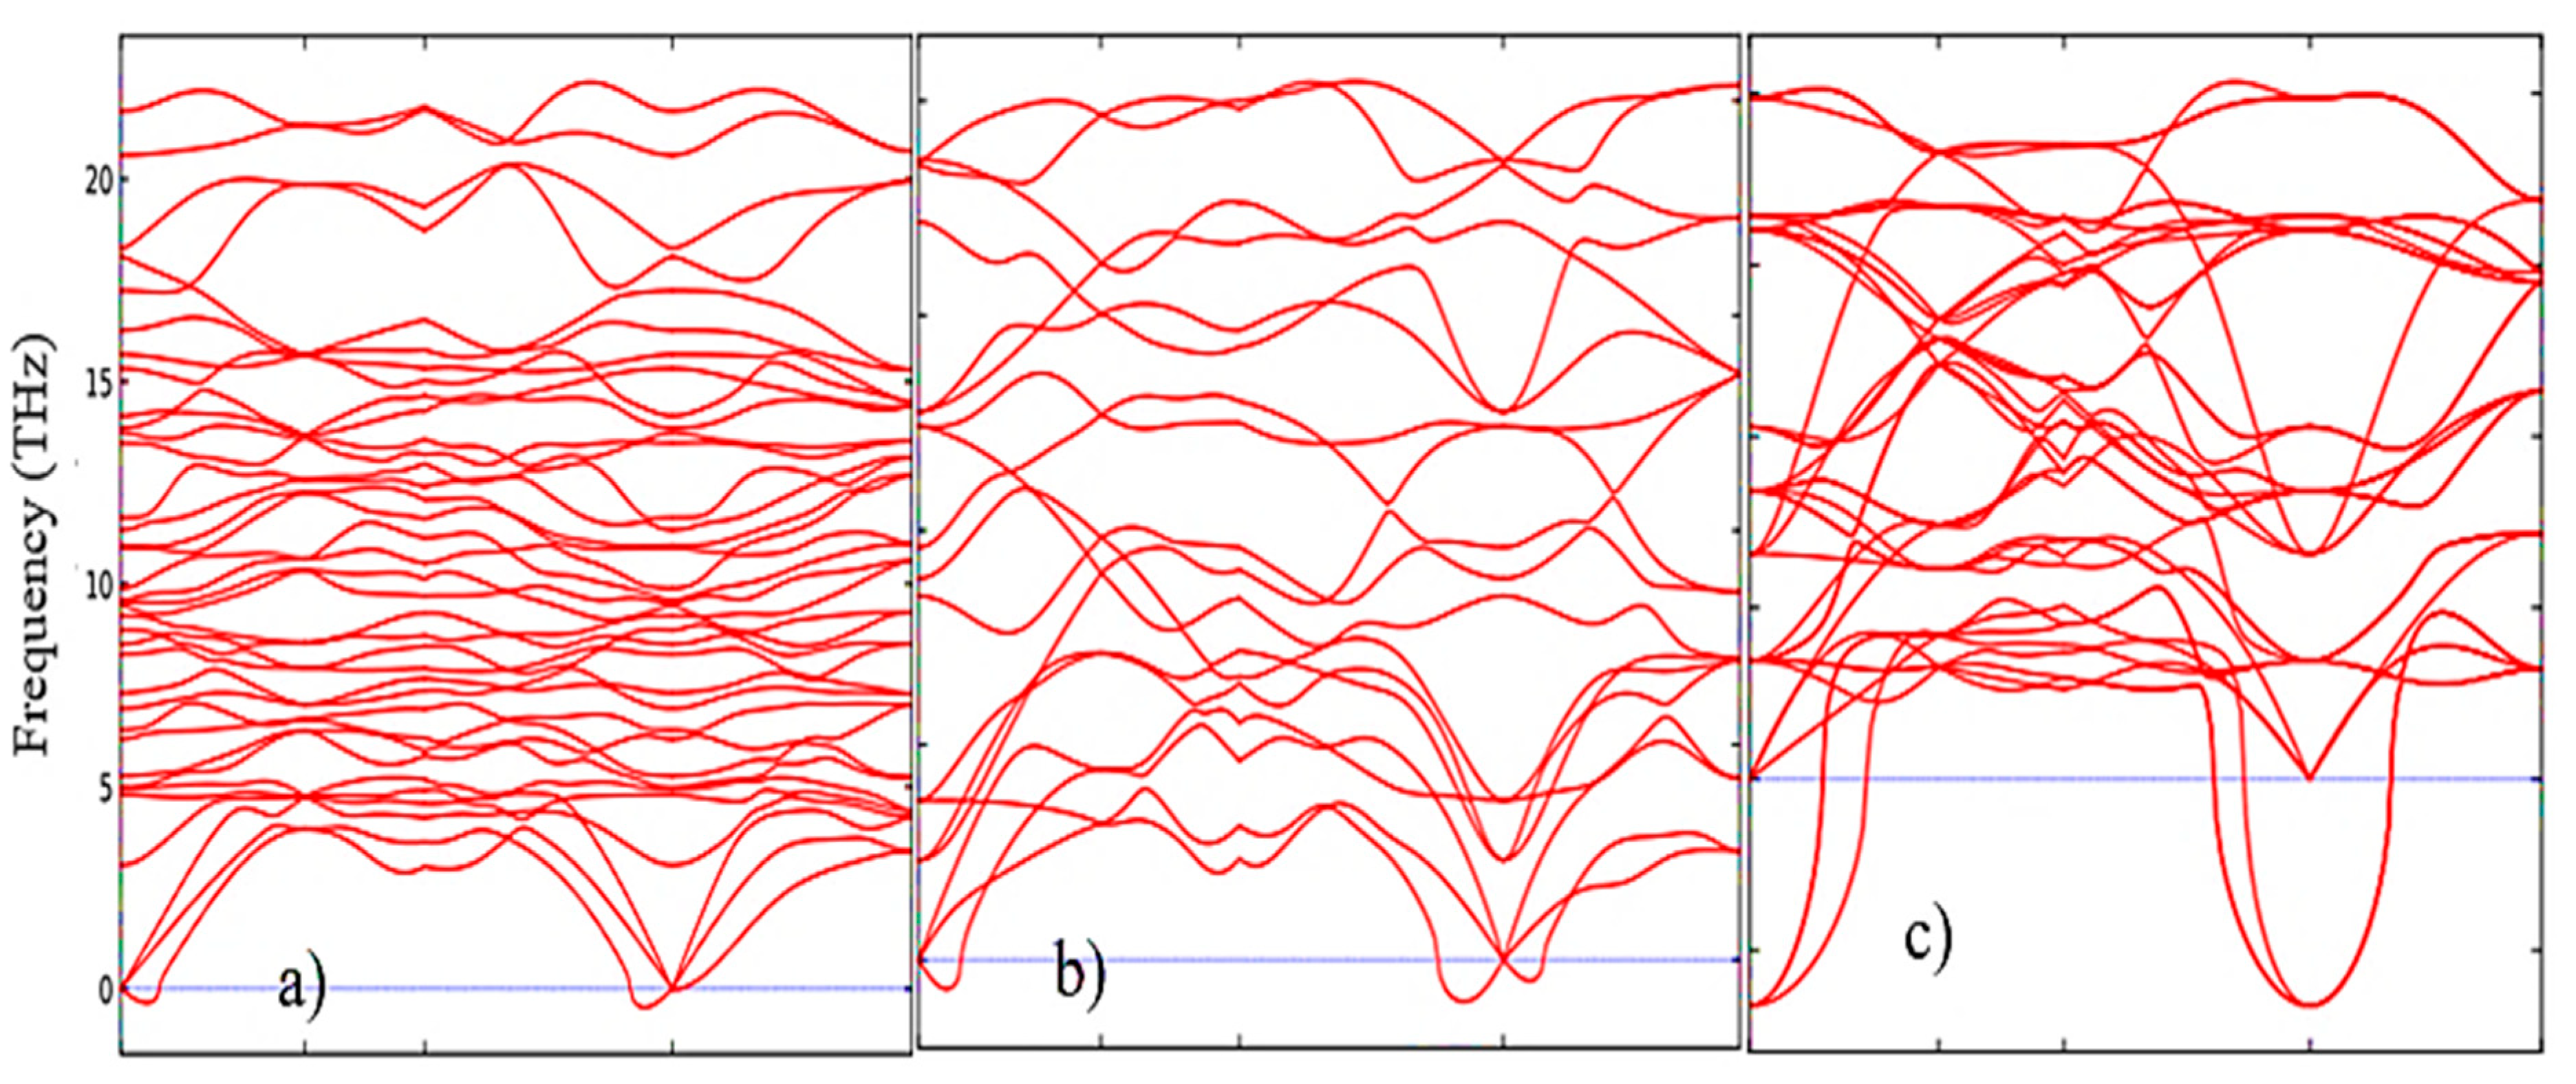
Figure 6.
Temperature dependence of free energy, entropy and heat capacity of a 12-atomic supercell for: m-ZrO2 (a), t-ZrO2 (b), and m-ZrO2 (c).
Figure 6.
Temperature dependence of free energy, entropy and heat capacity of a 12-atomic supercell for: m-ZrO2 (a), t-ZrO2 (b), and m-ZrO2 (c).
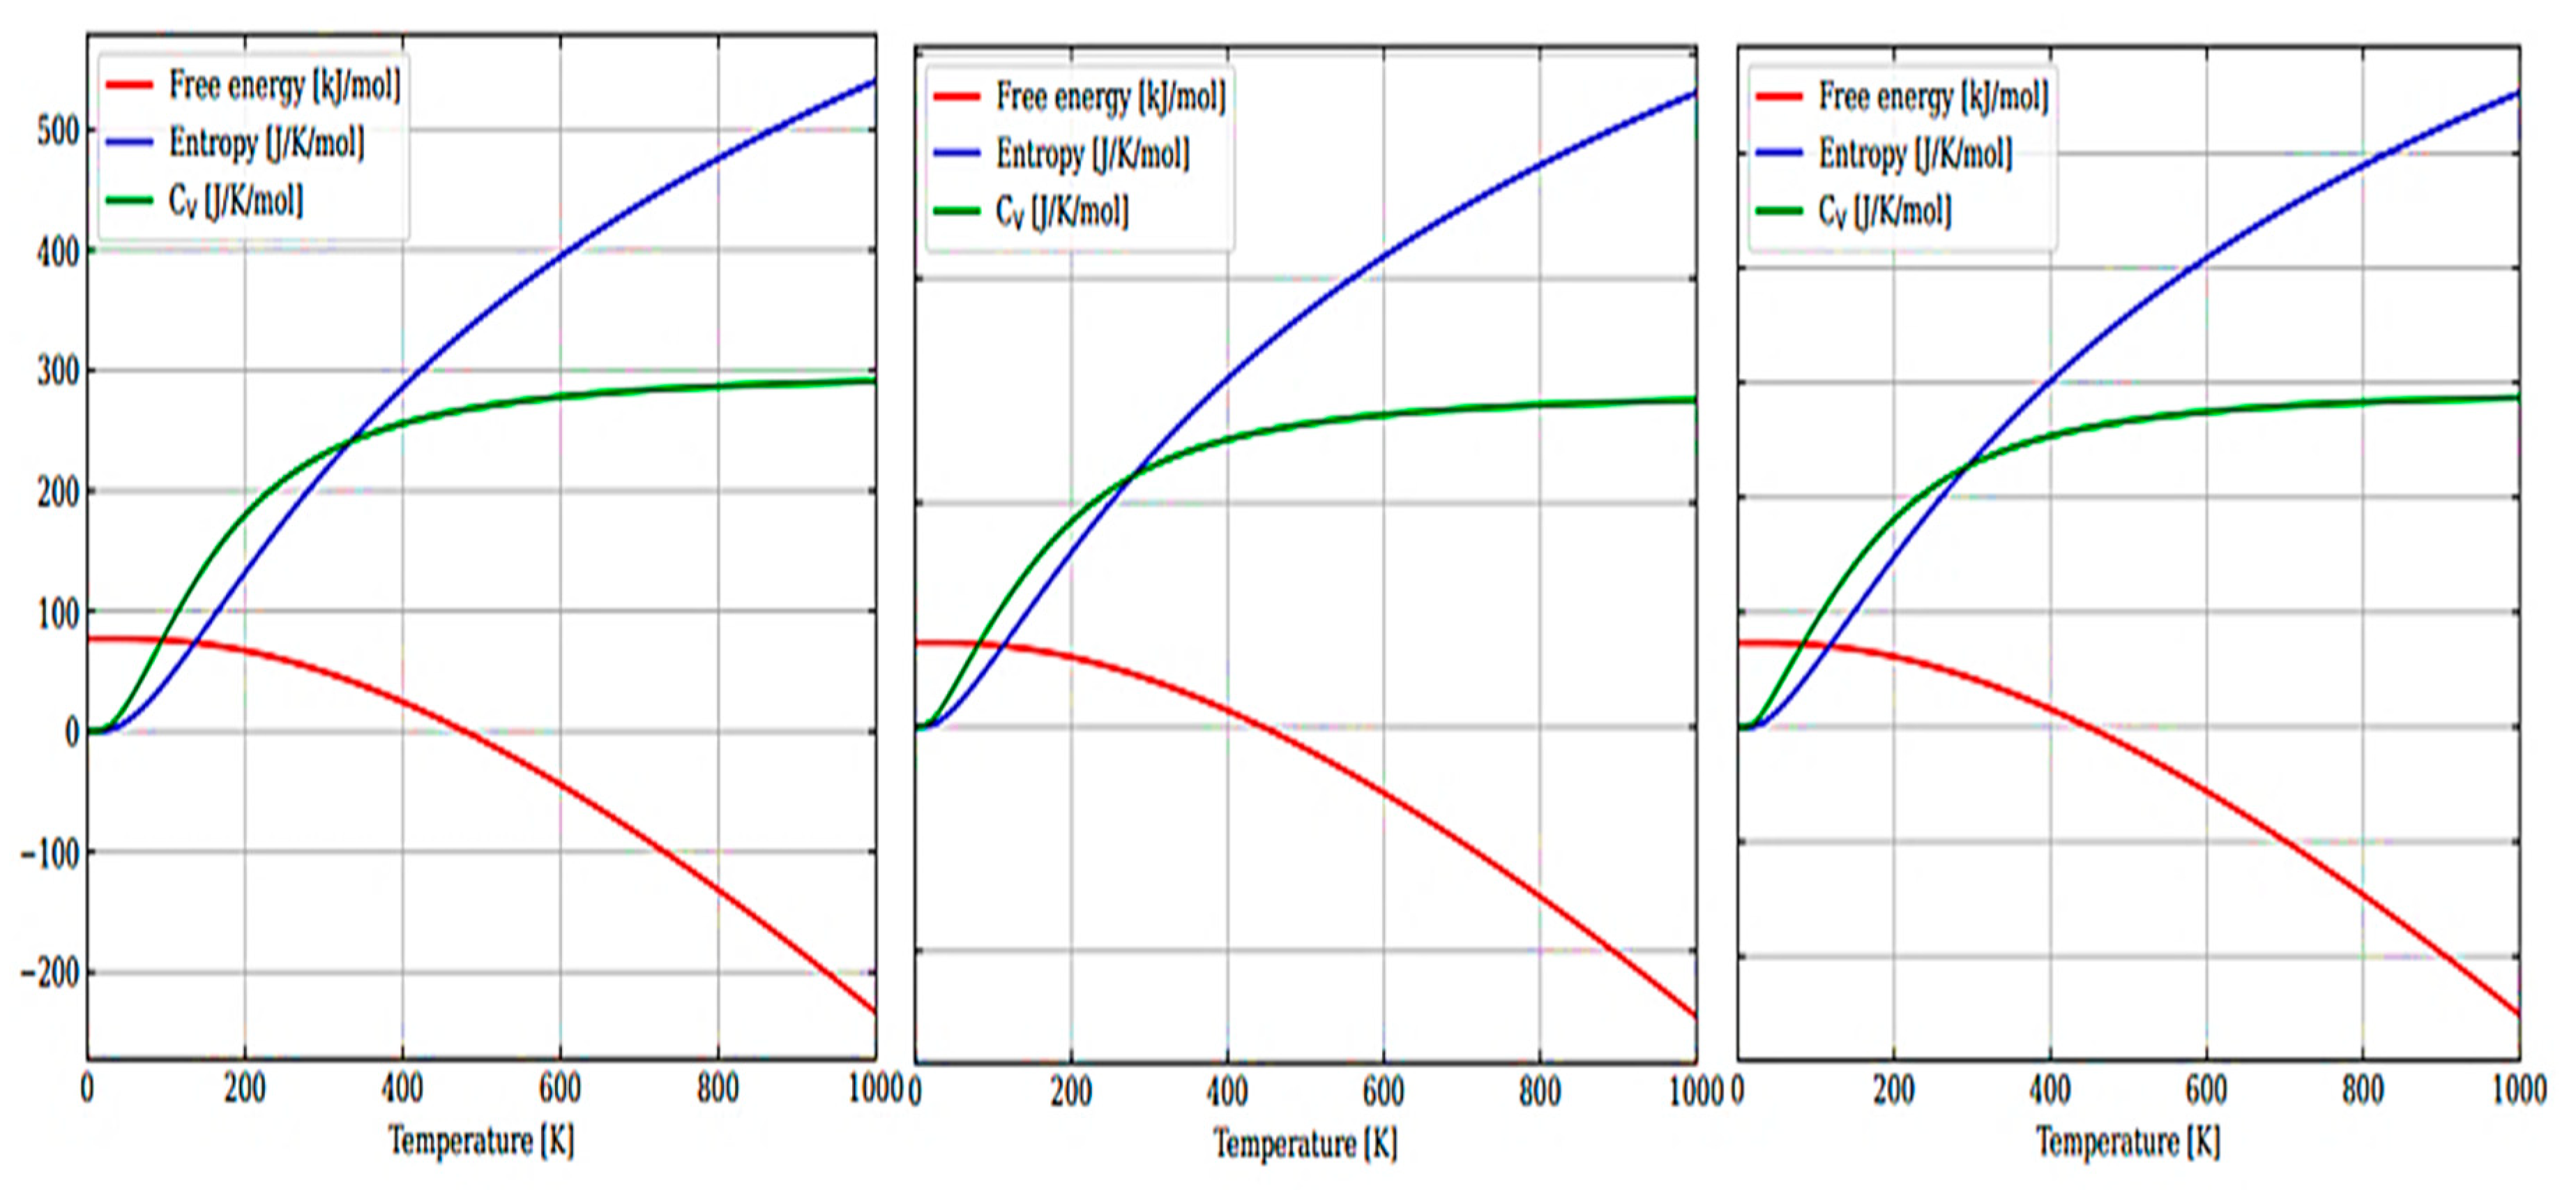
Figure 7.
Phonon density of state for: m-ZrO2 (a), t-ZrO2 (b), and m-ZrO2 (c).
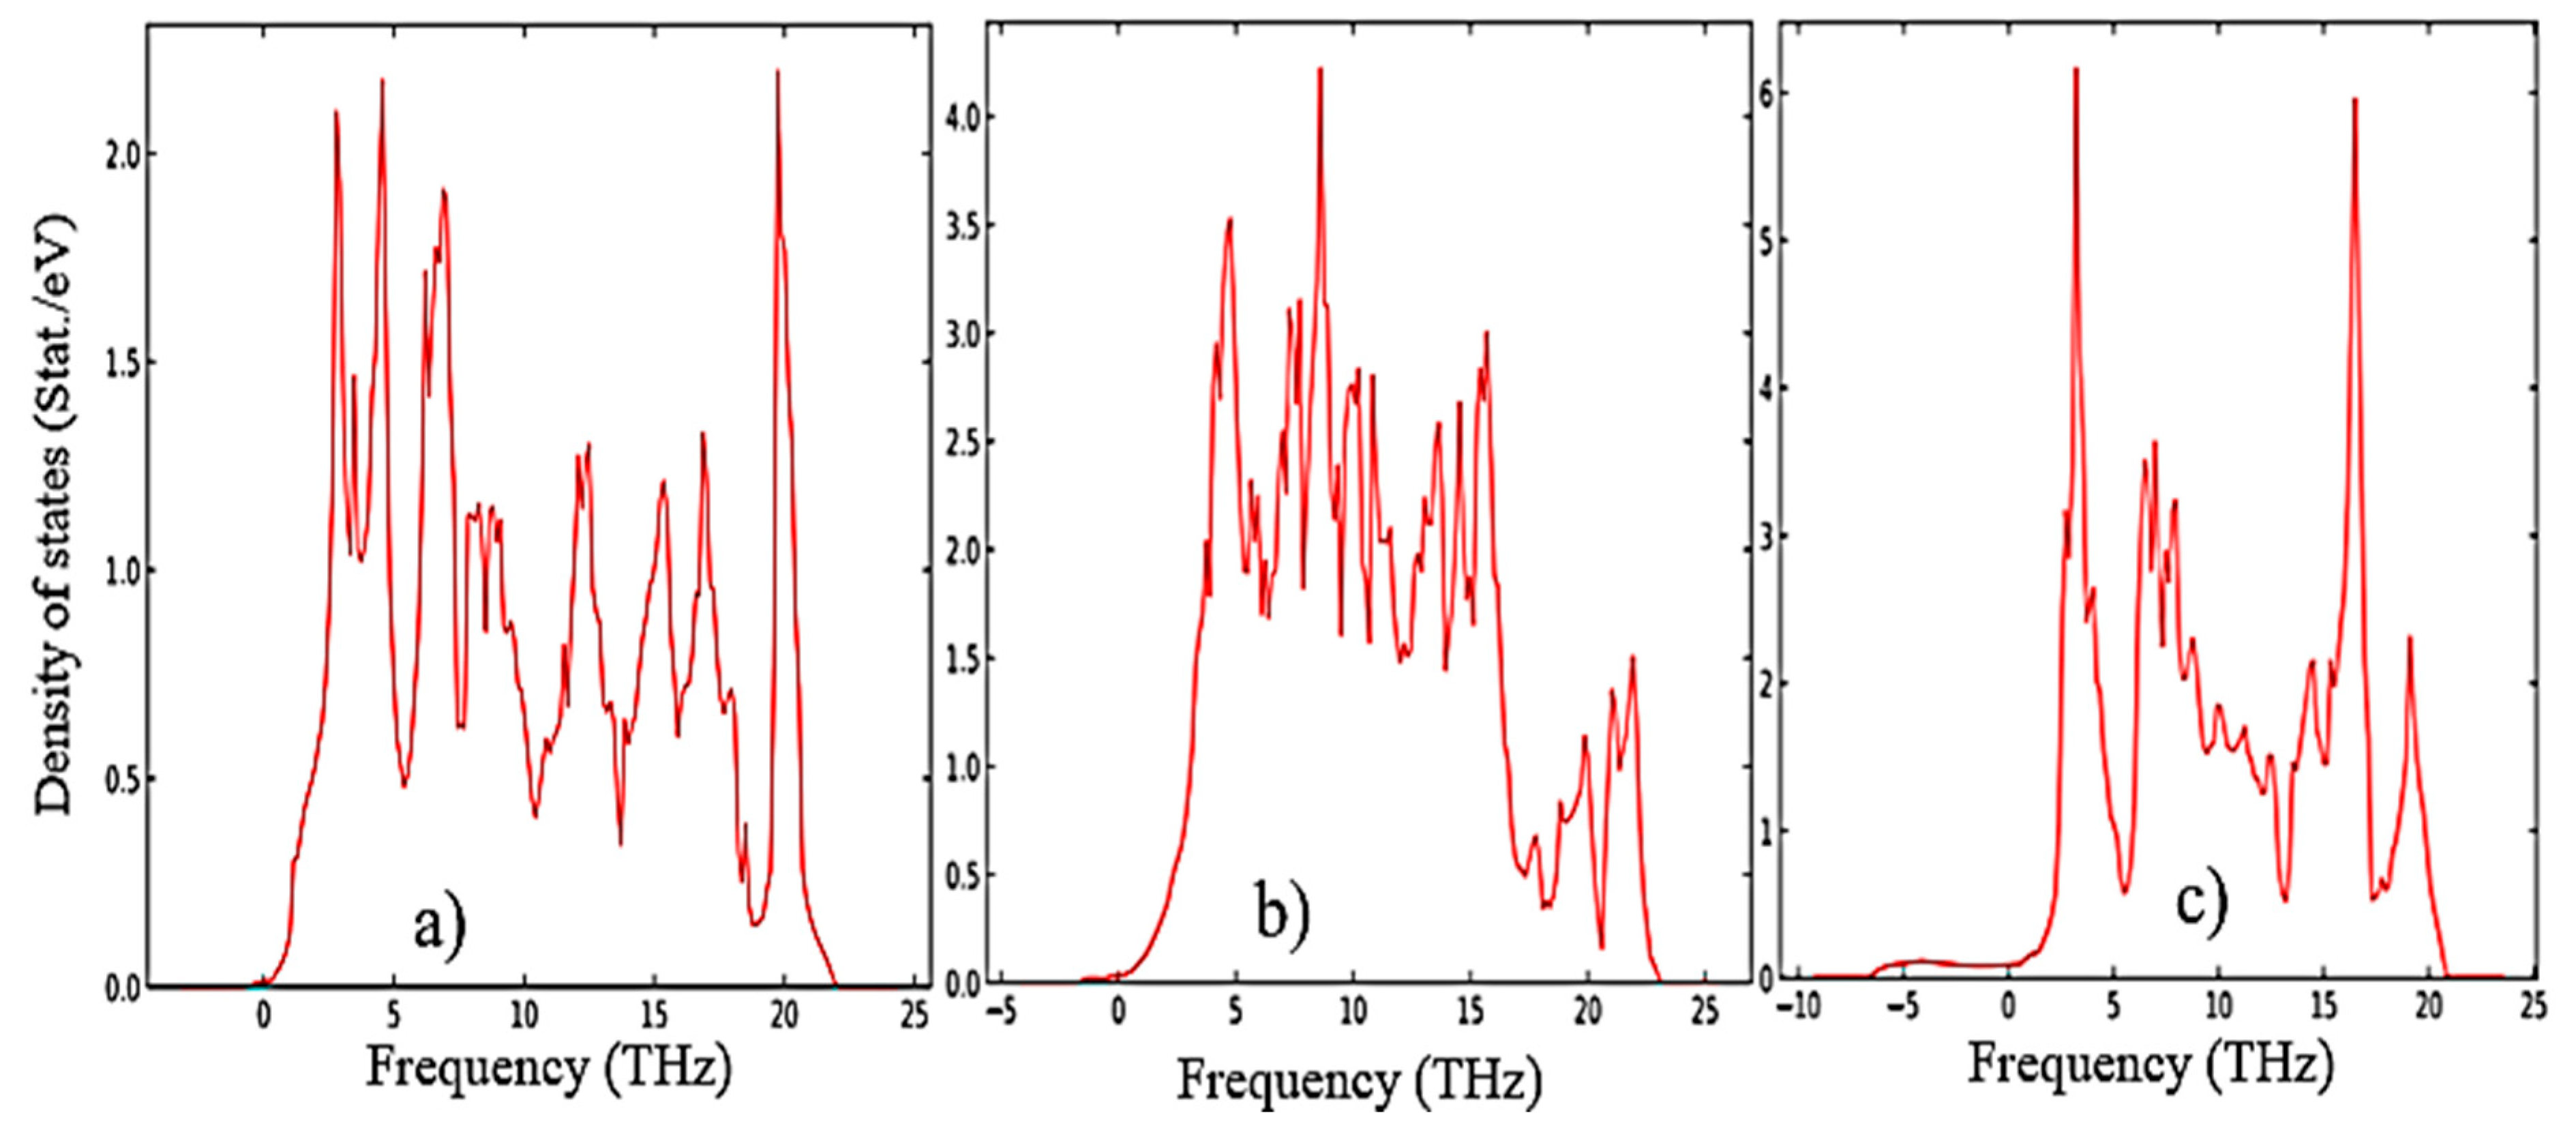
Figure 8.
Total energy as function of volume [54].
Figure 8.
Total energy as function of volume [54].
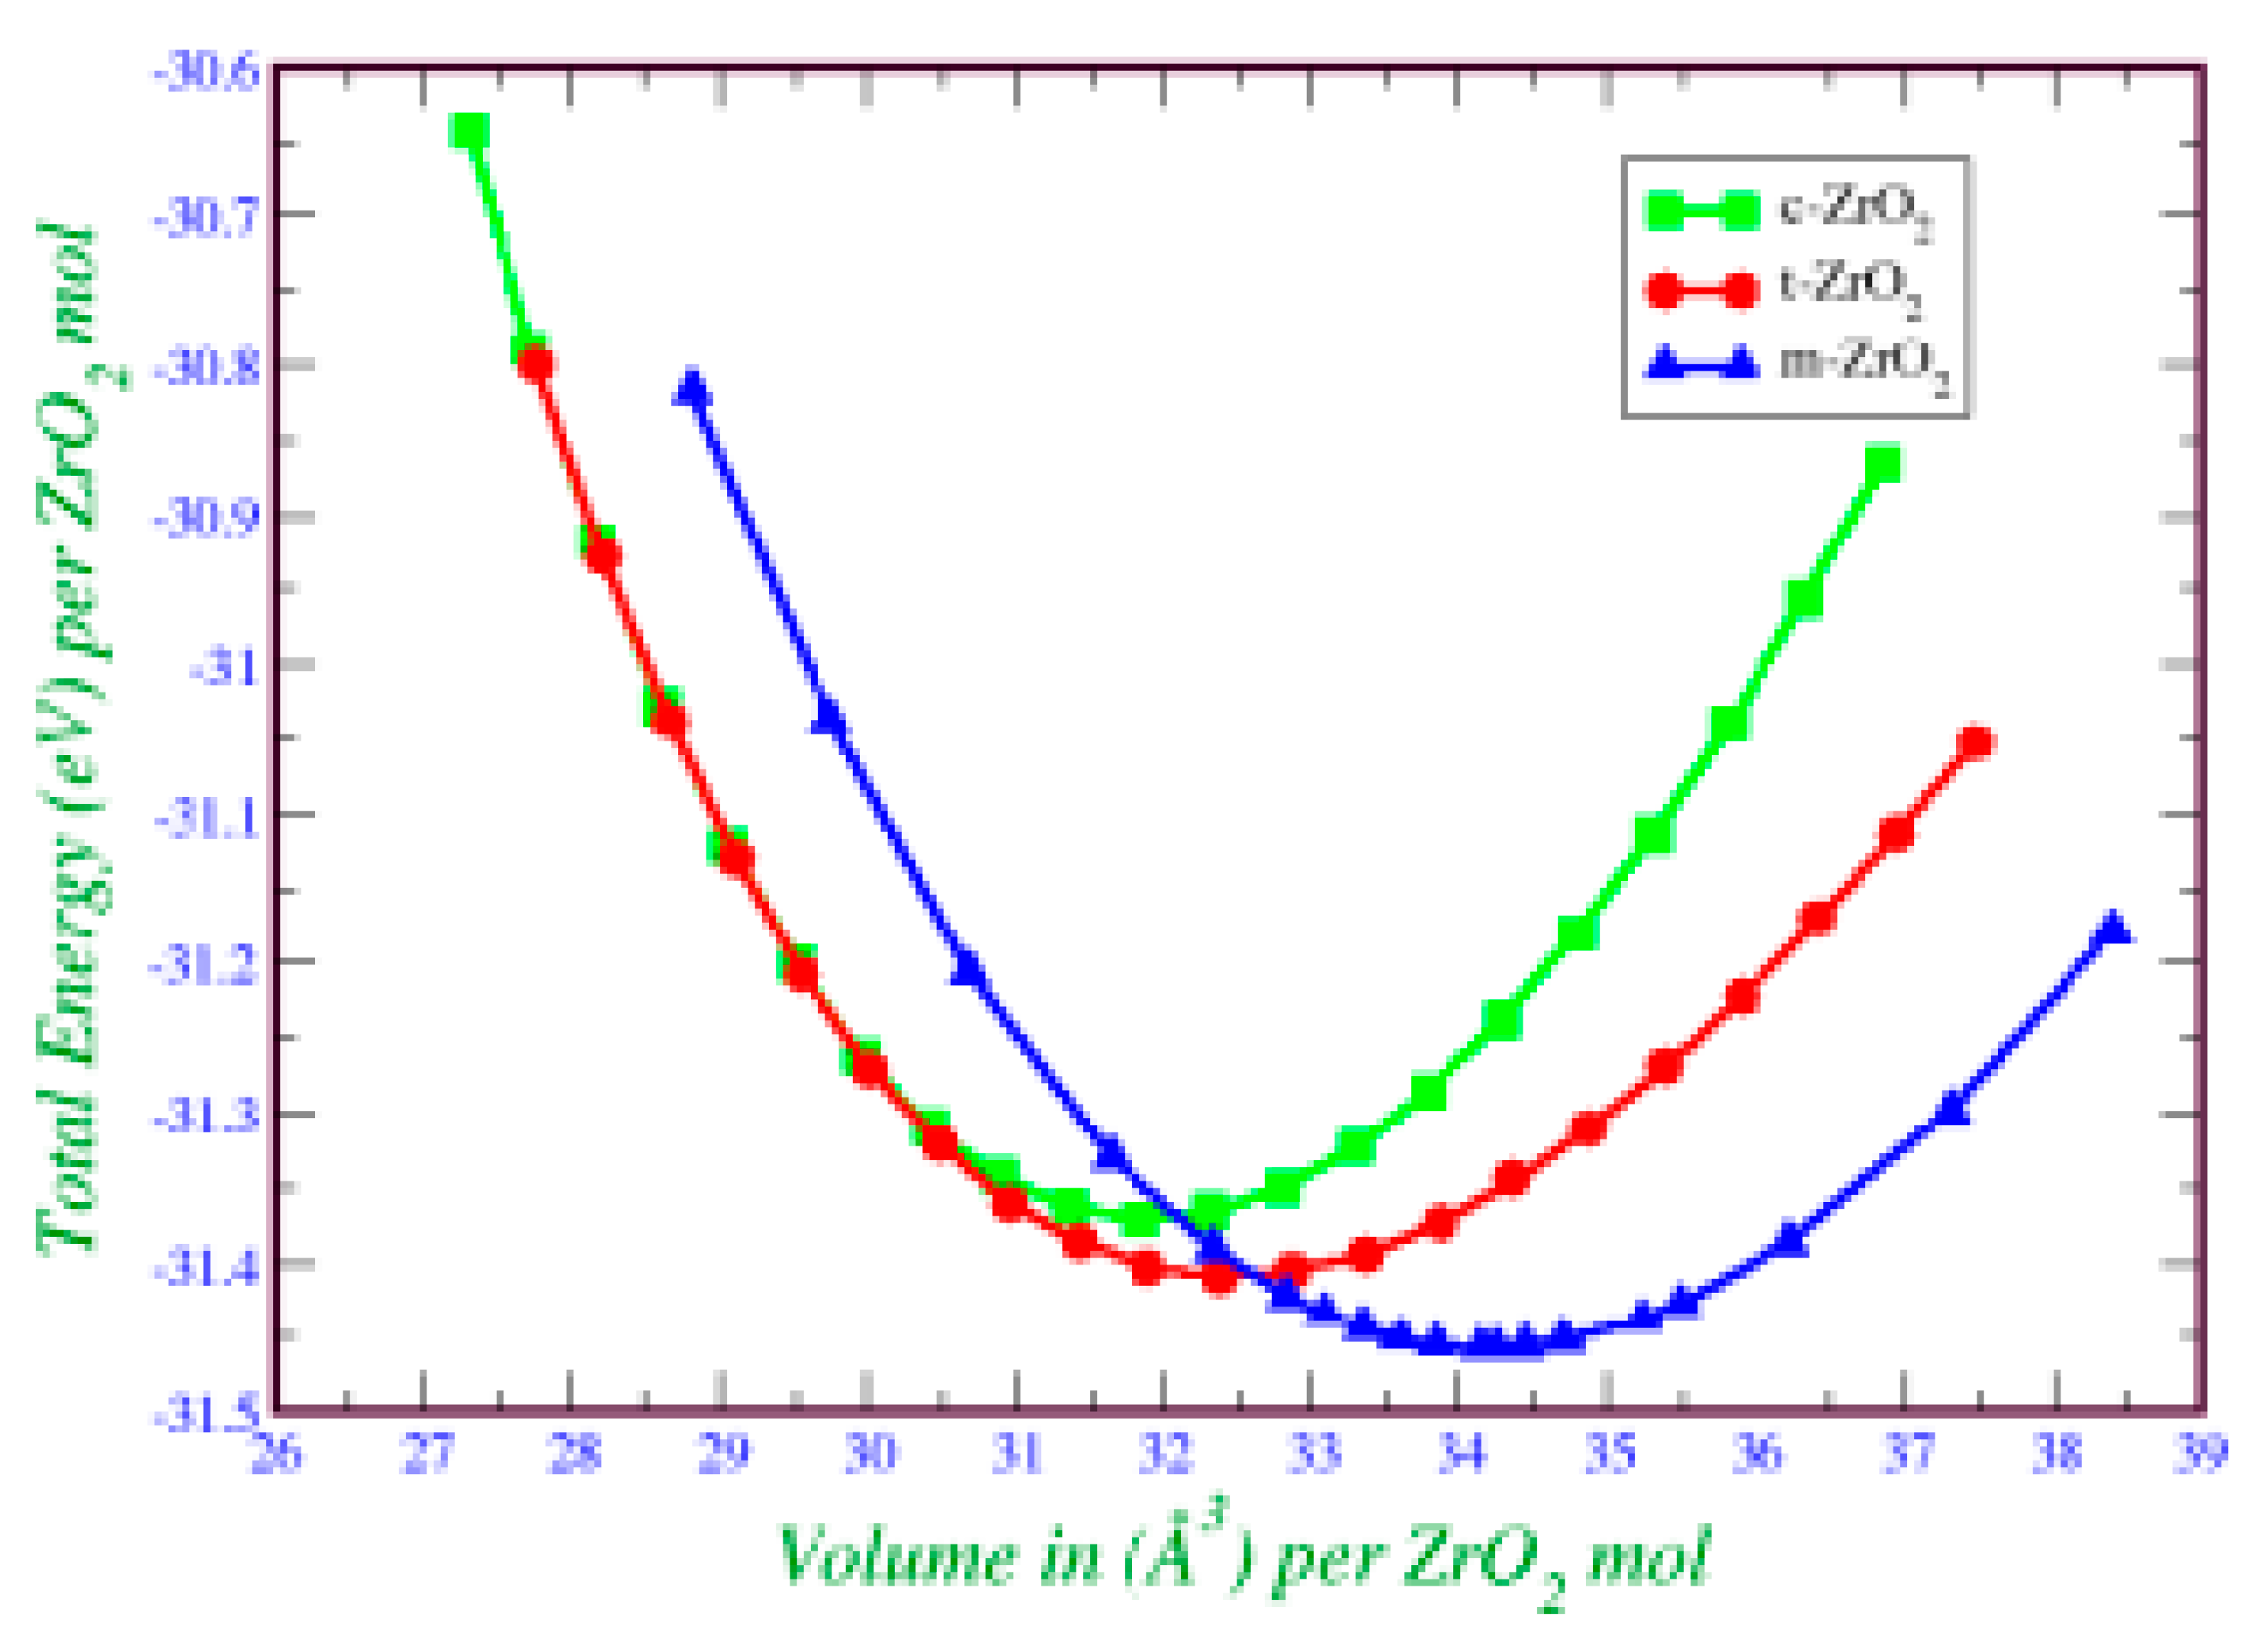
Figure 9.
Total Density of Electronic States (TDOS) for: (a) monoclinic, (b) tetragonal, and (c) cubic ZrO2.
Figure 9.
Total Density of Electronic States (TDOS) for: (a) monoclinic, (b) tetragonal, and (c) cubic ZrO2.
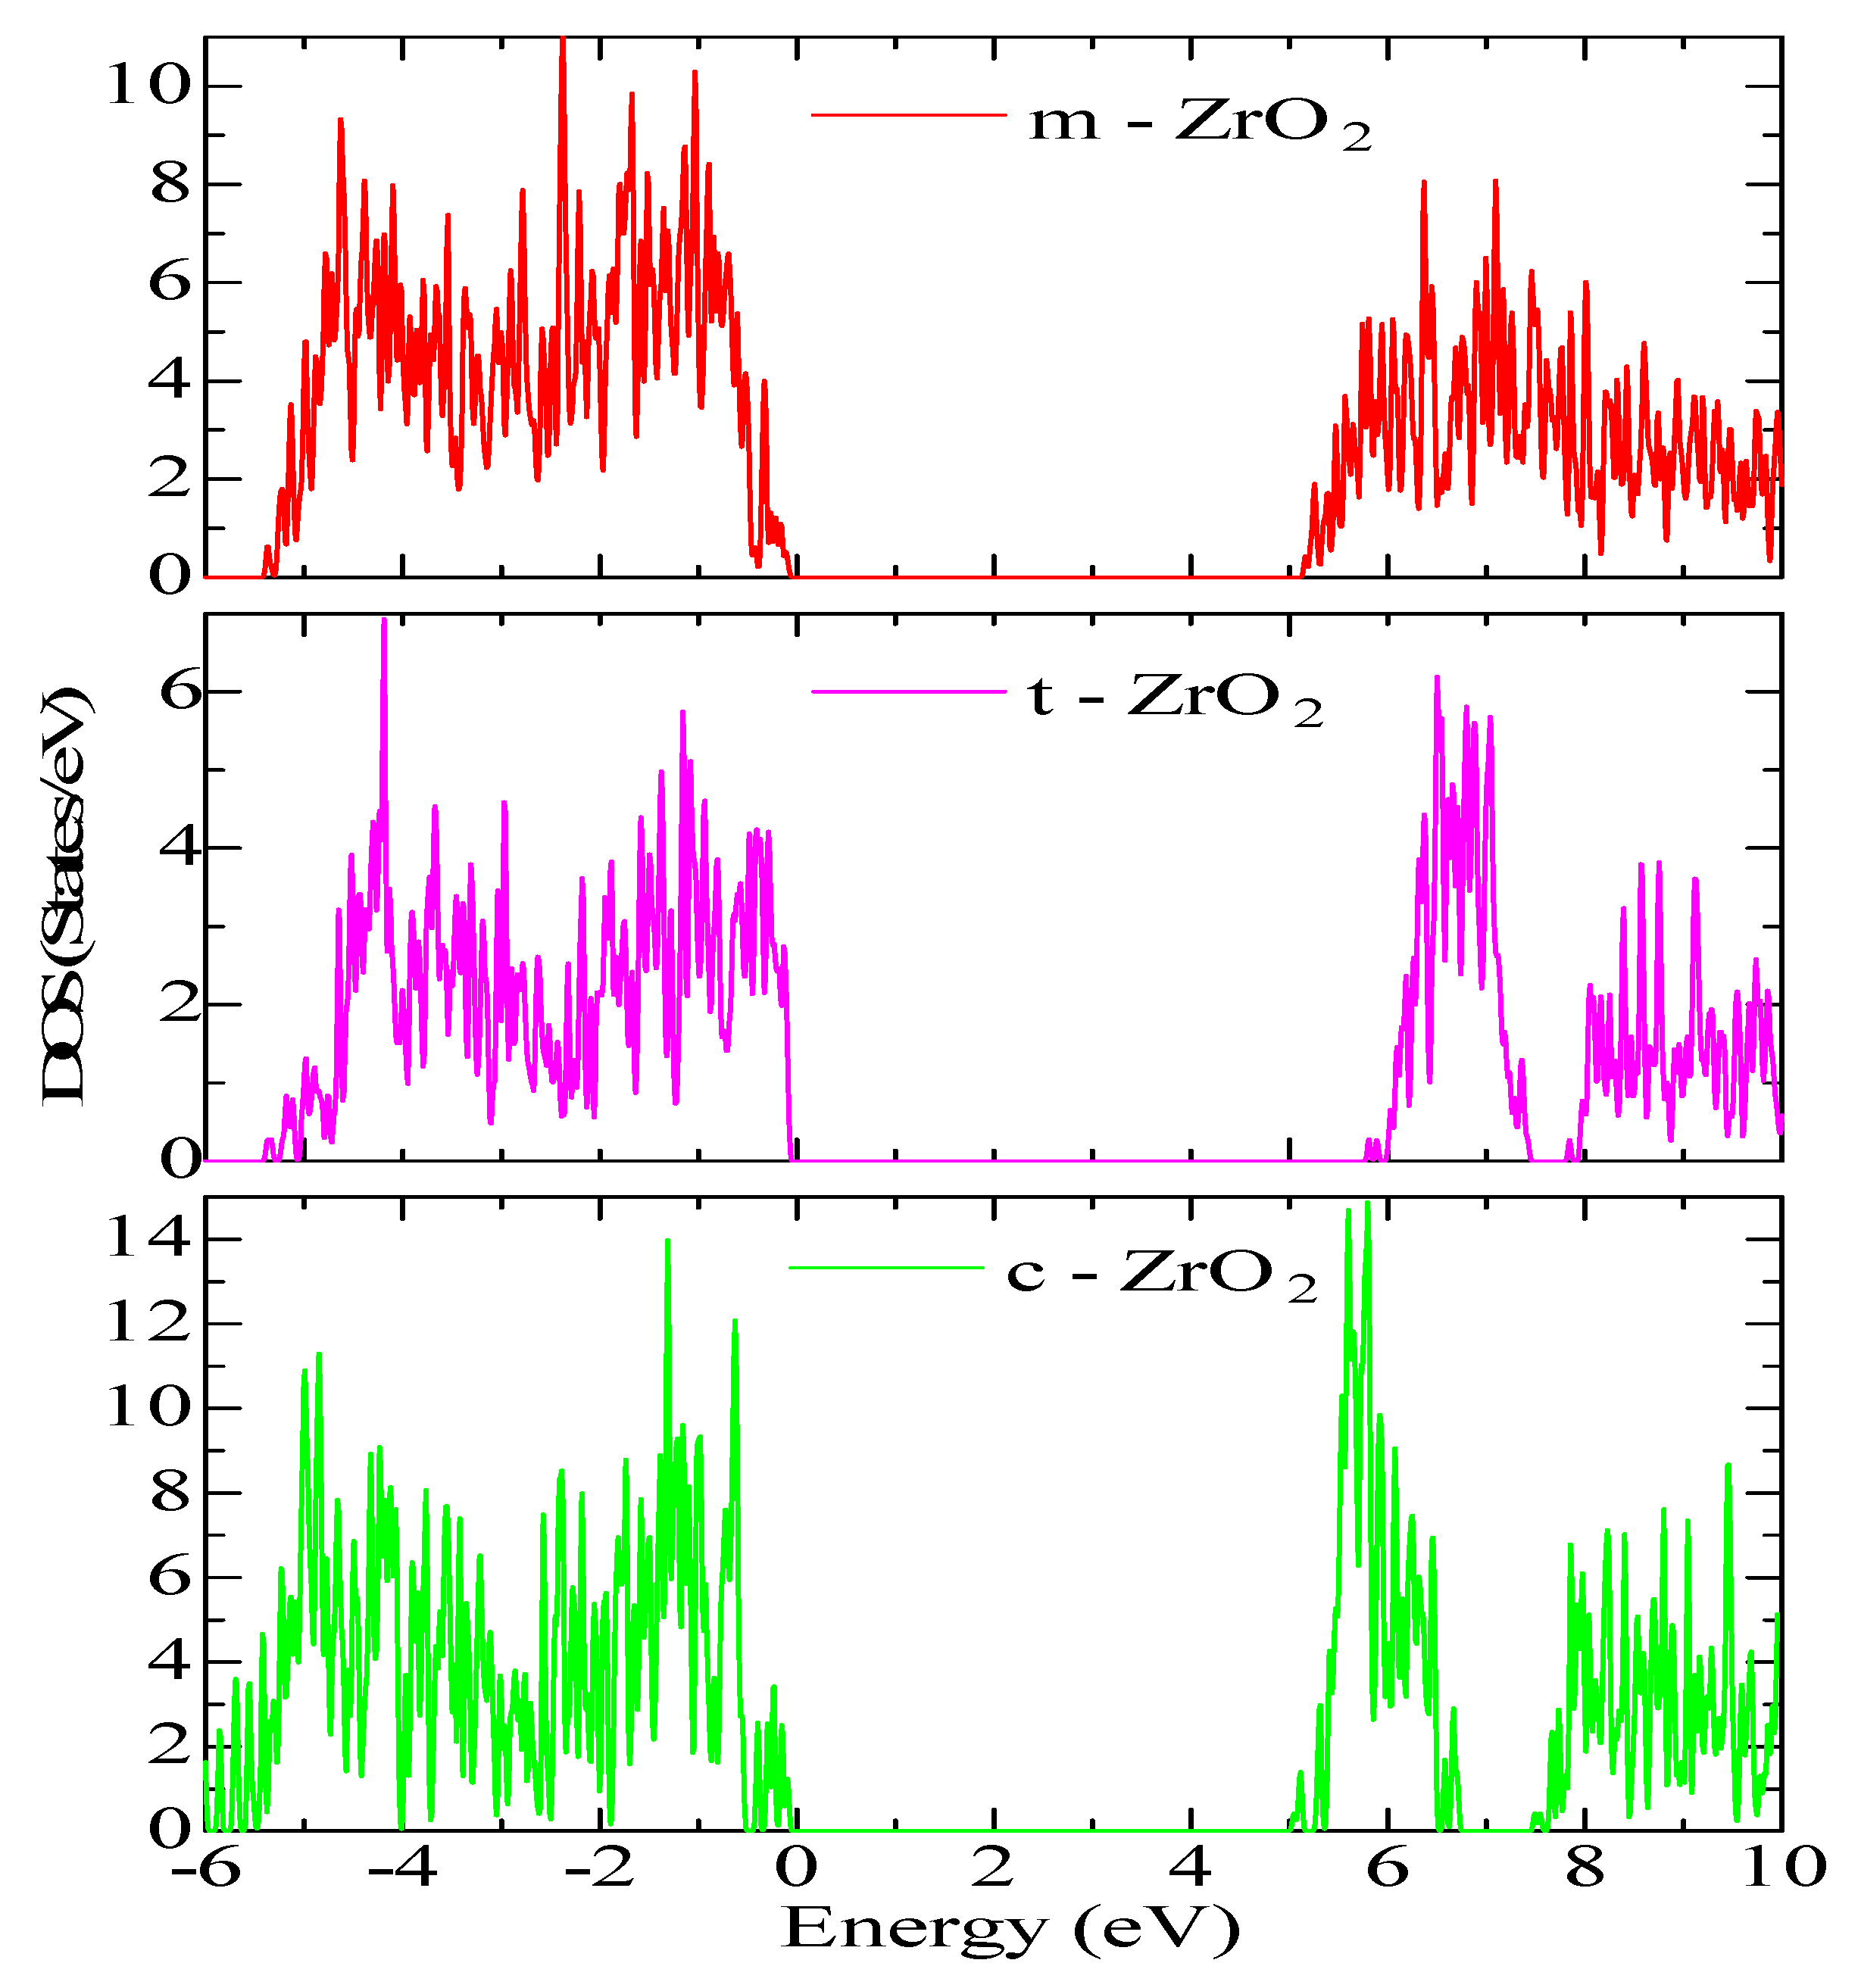
Figure 10.
Conduction (red) - and valence (green)-band change for c-ZrO2, t-ZrO2, m-ZrO2. The position of the Fermi level corresponds to the maximum of the valence band at each of the sites.
Figure 10.
Conduction (red) - and valence (green)-band change for c-ZrO2, t-ZrO2, m-ZrO2. The position of the Fermi level corresponds to the maximum of the valence band at each of the sites.
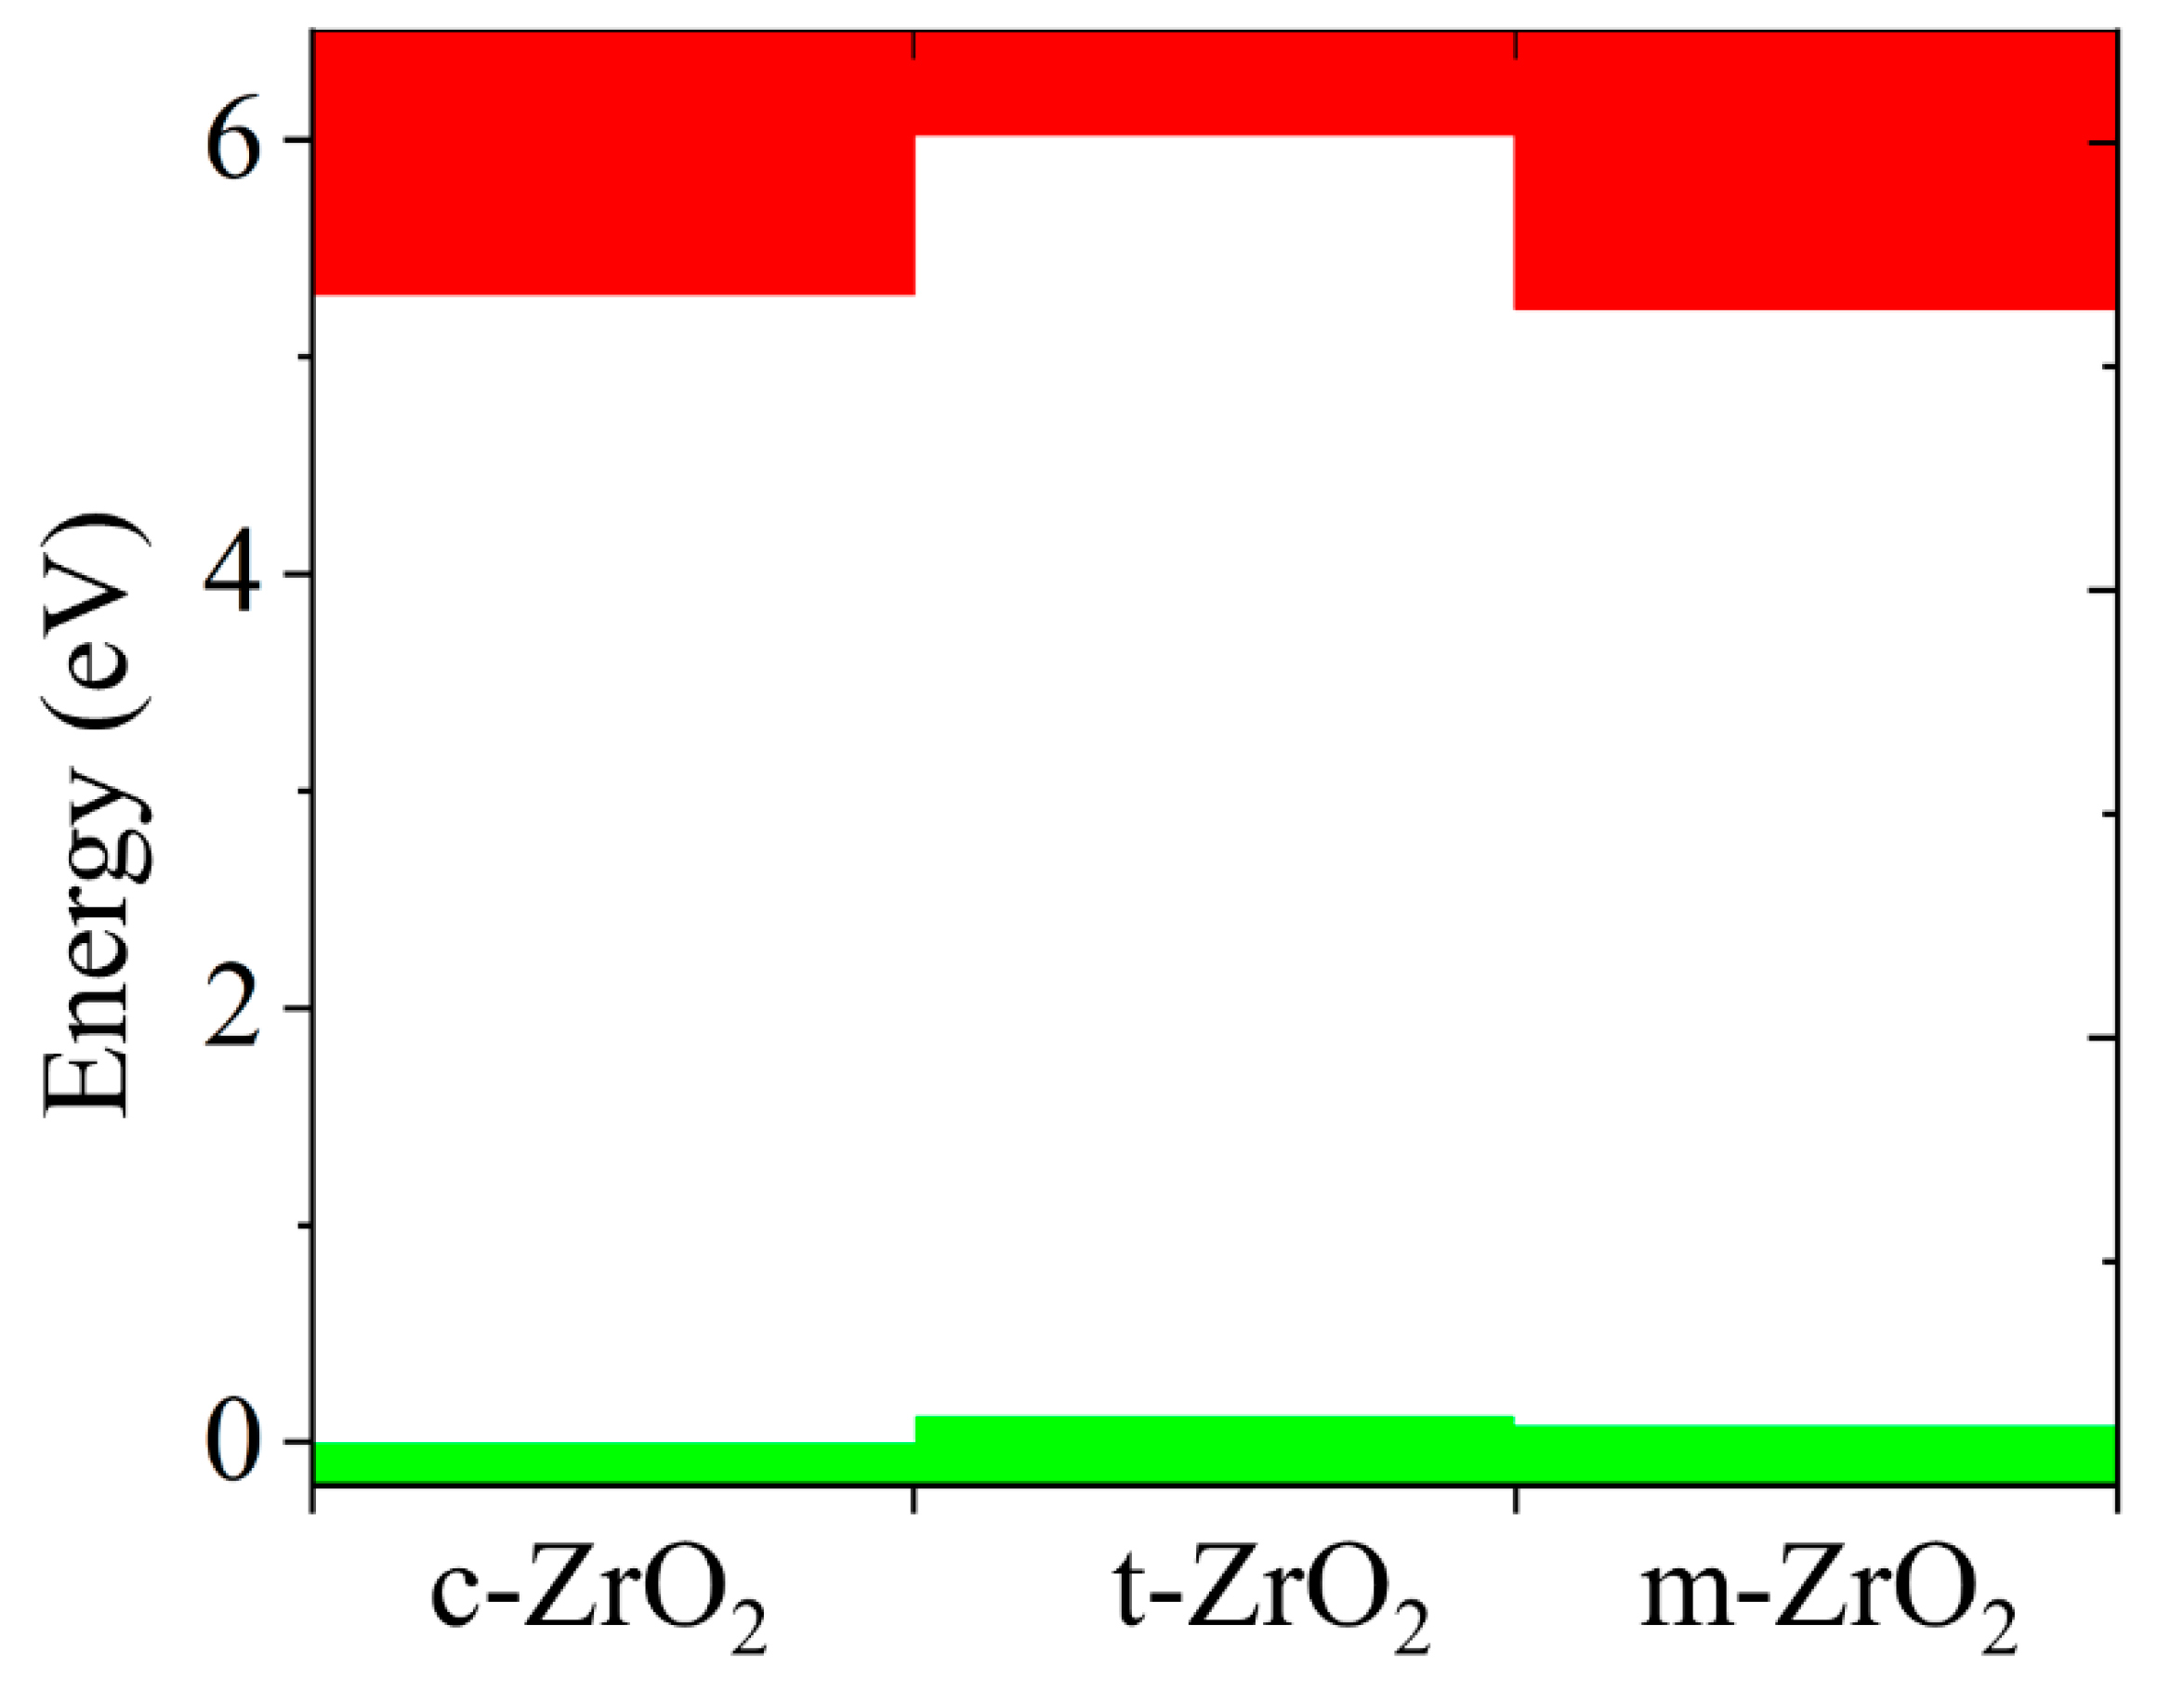
Figure 11.
Composite PDOS diagram showing the main contributions of the s-, p-, and d-orbitals to the states that form the CB bottom for c-ZrO2, t-ZrO2, and m-ZrO2. Top VB (green) scaled to zero.
Figure 11.
Composite PDOS diagram showing the main contributions of the s-, p-, and d-orbitals to the states that form the CB bottom for c-ZrO2, t-ZrO2, and m-ZrO2. Top VB (green) scaled to zero.
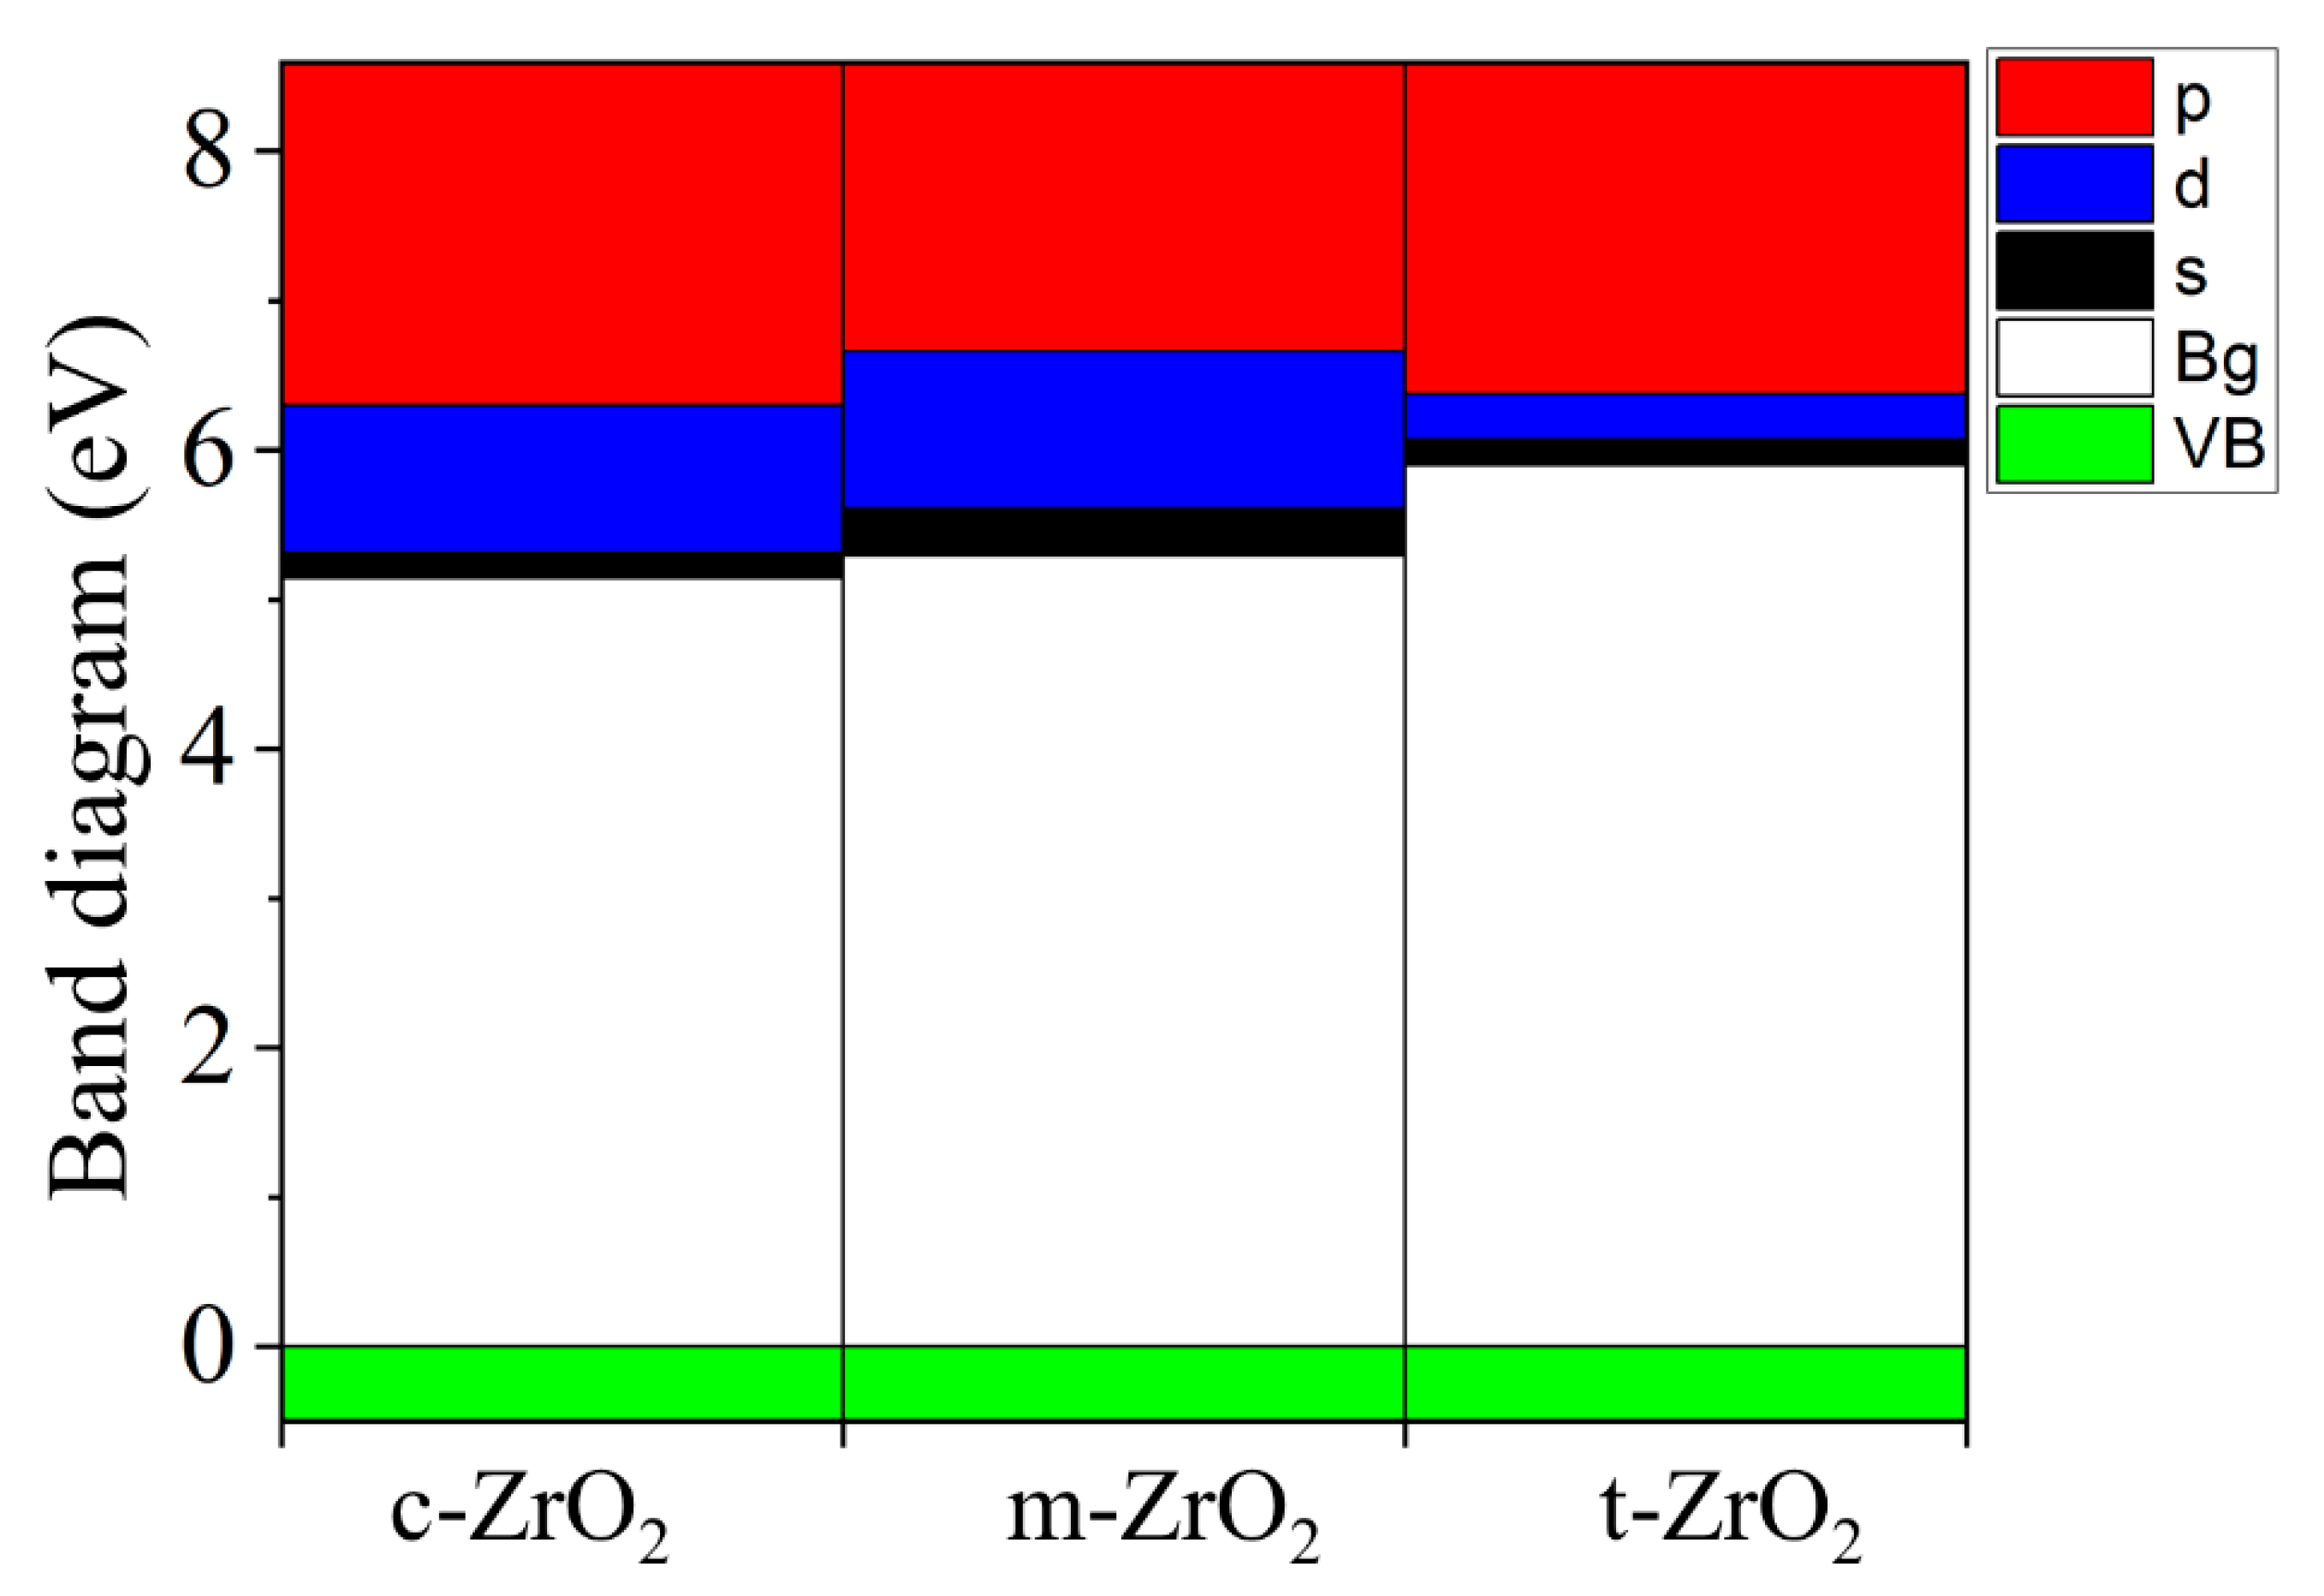
Figure 12.
Energy of YSZ formation as a function of Y2O3 concentration.
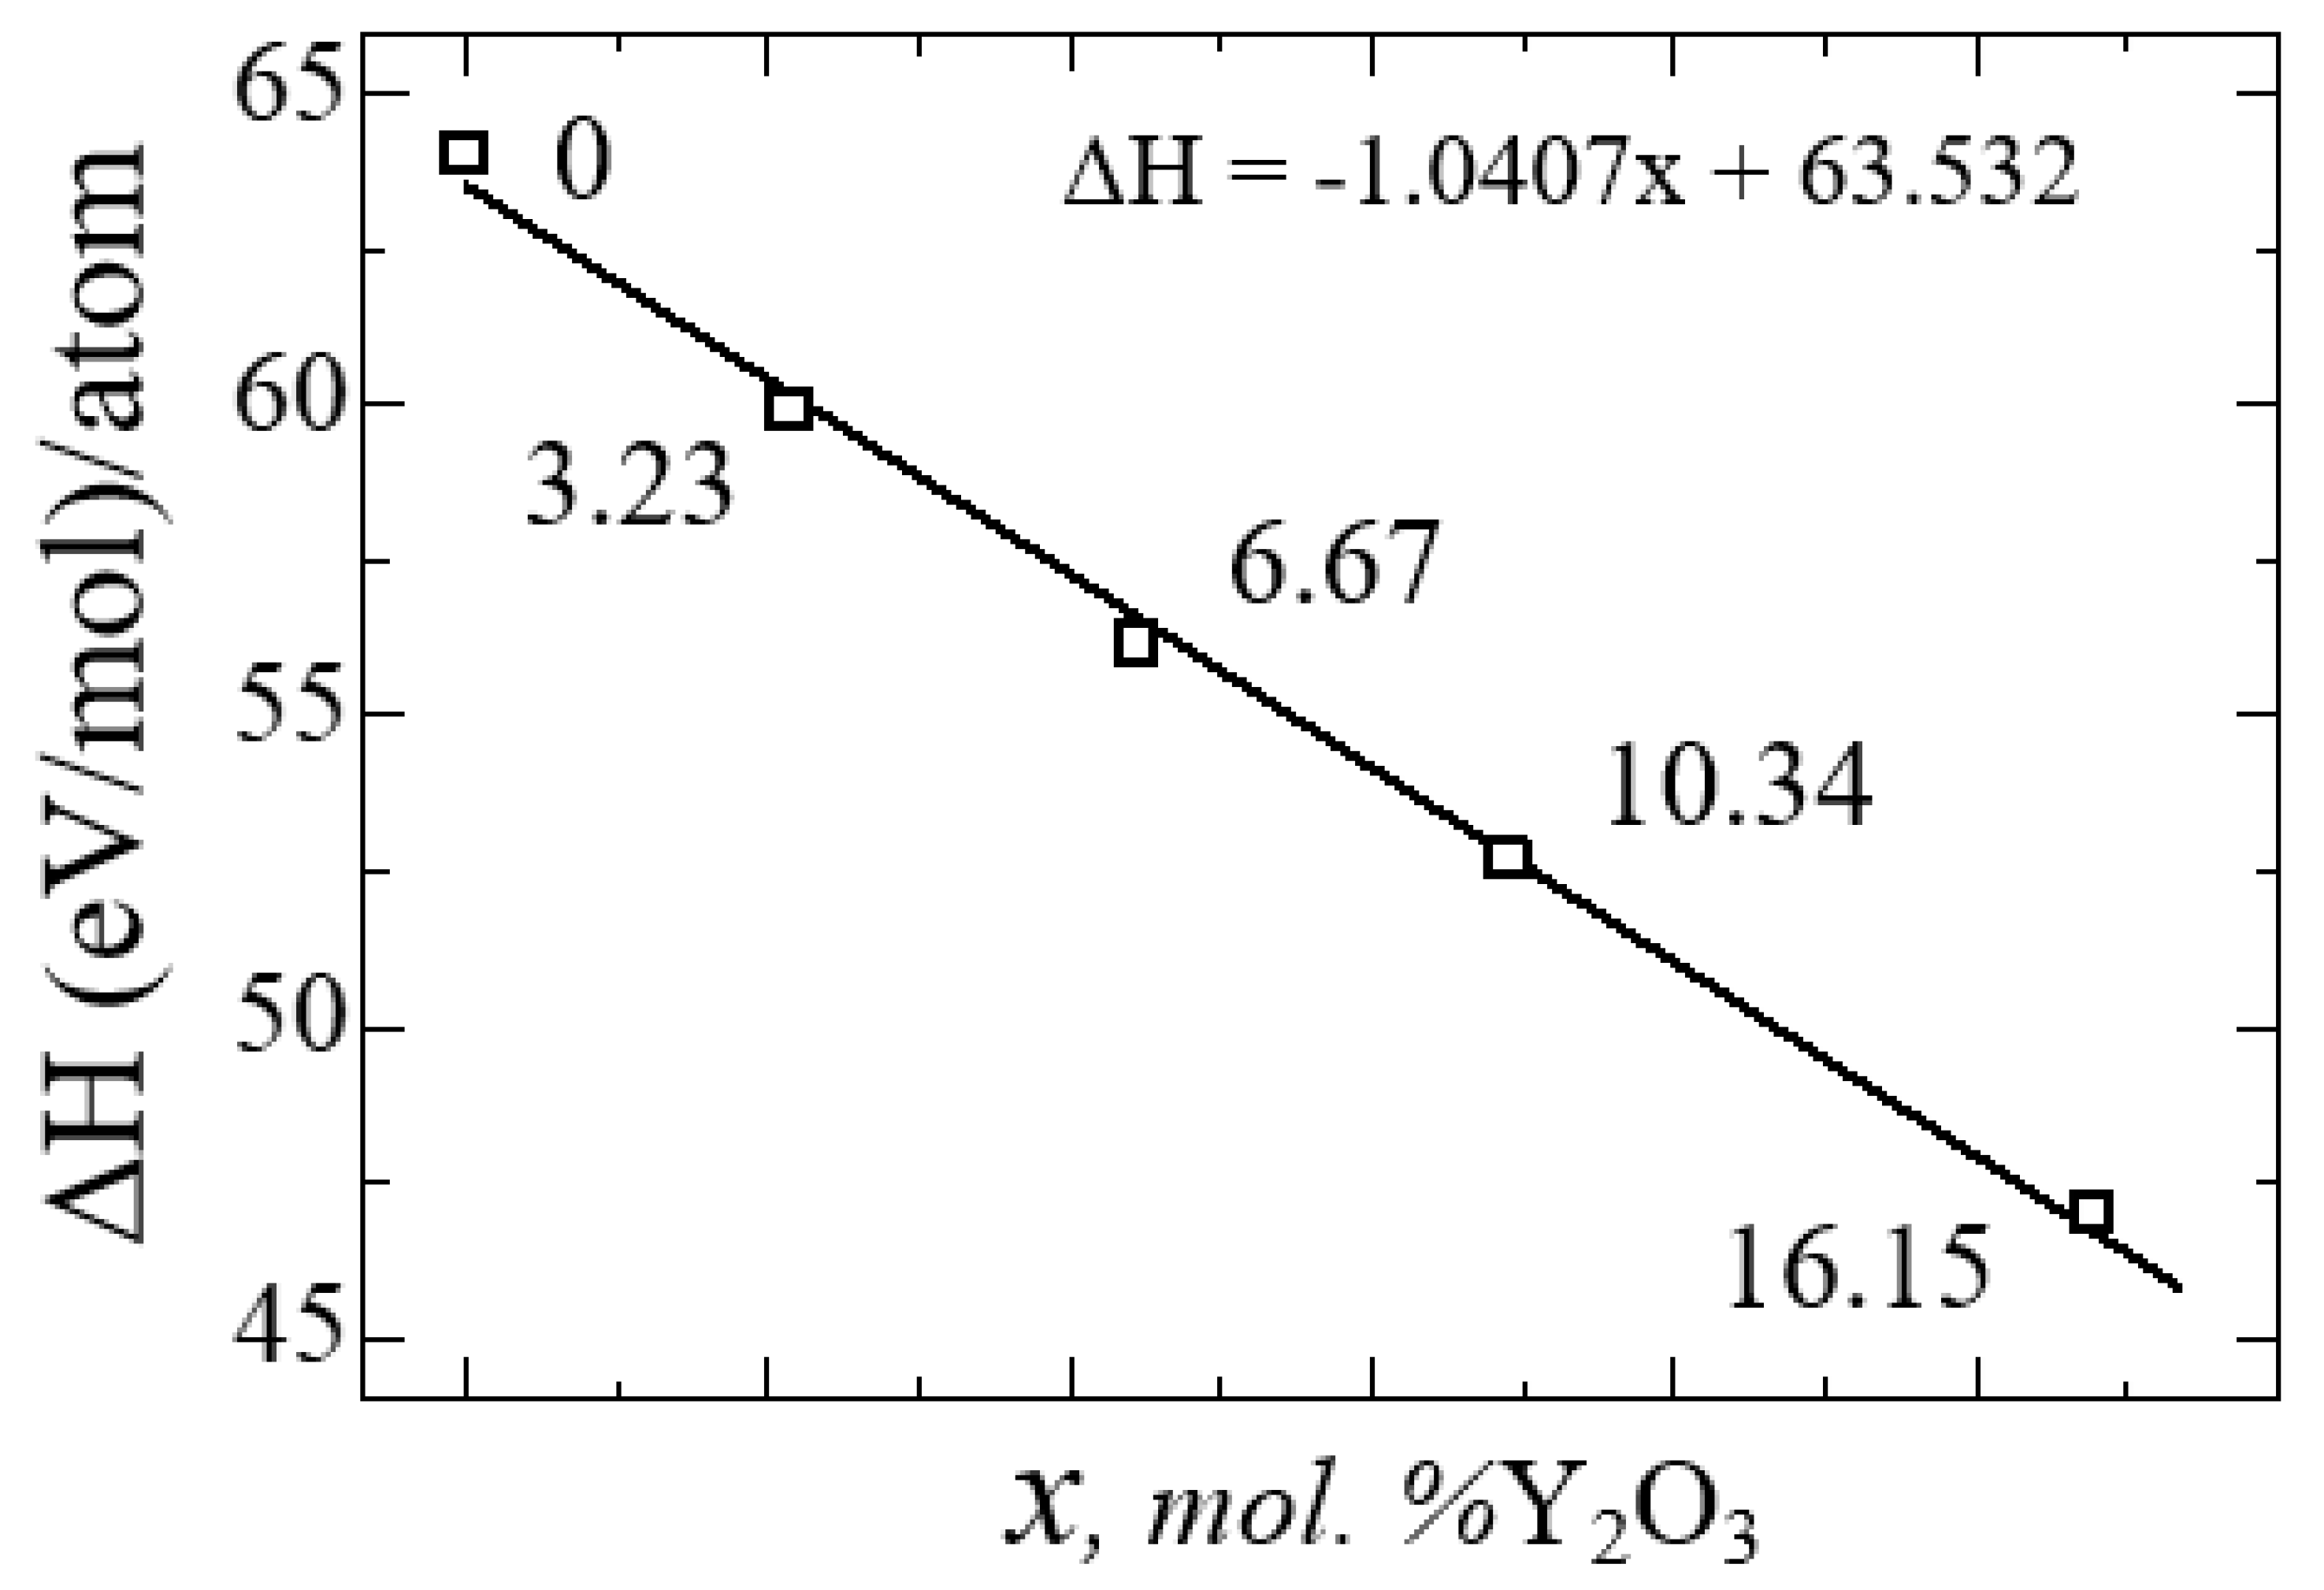
Figure 13.
Formation energies and formation energy of an oxygen vacancy for YSZ as a function of Y2O3 concentration.
Figure 13.
Formation energies and formation energy of an oxygen vacancy for YSZ as a function of Y2O3 concentration.
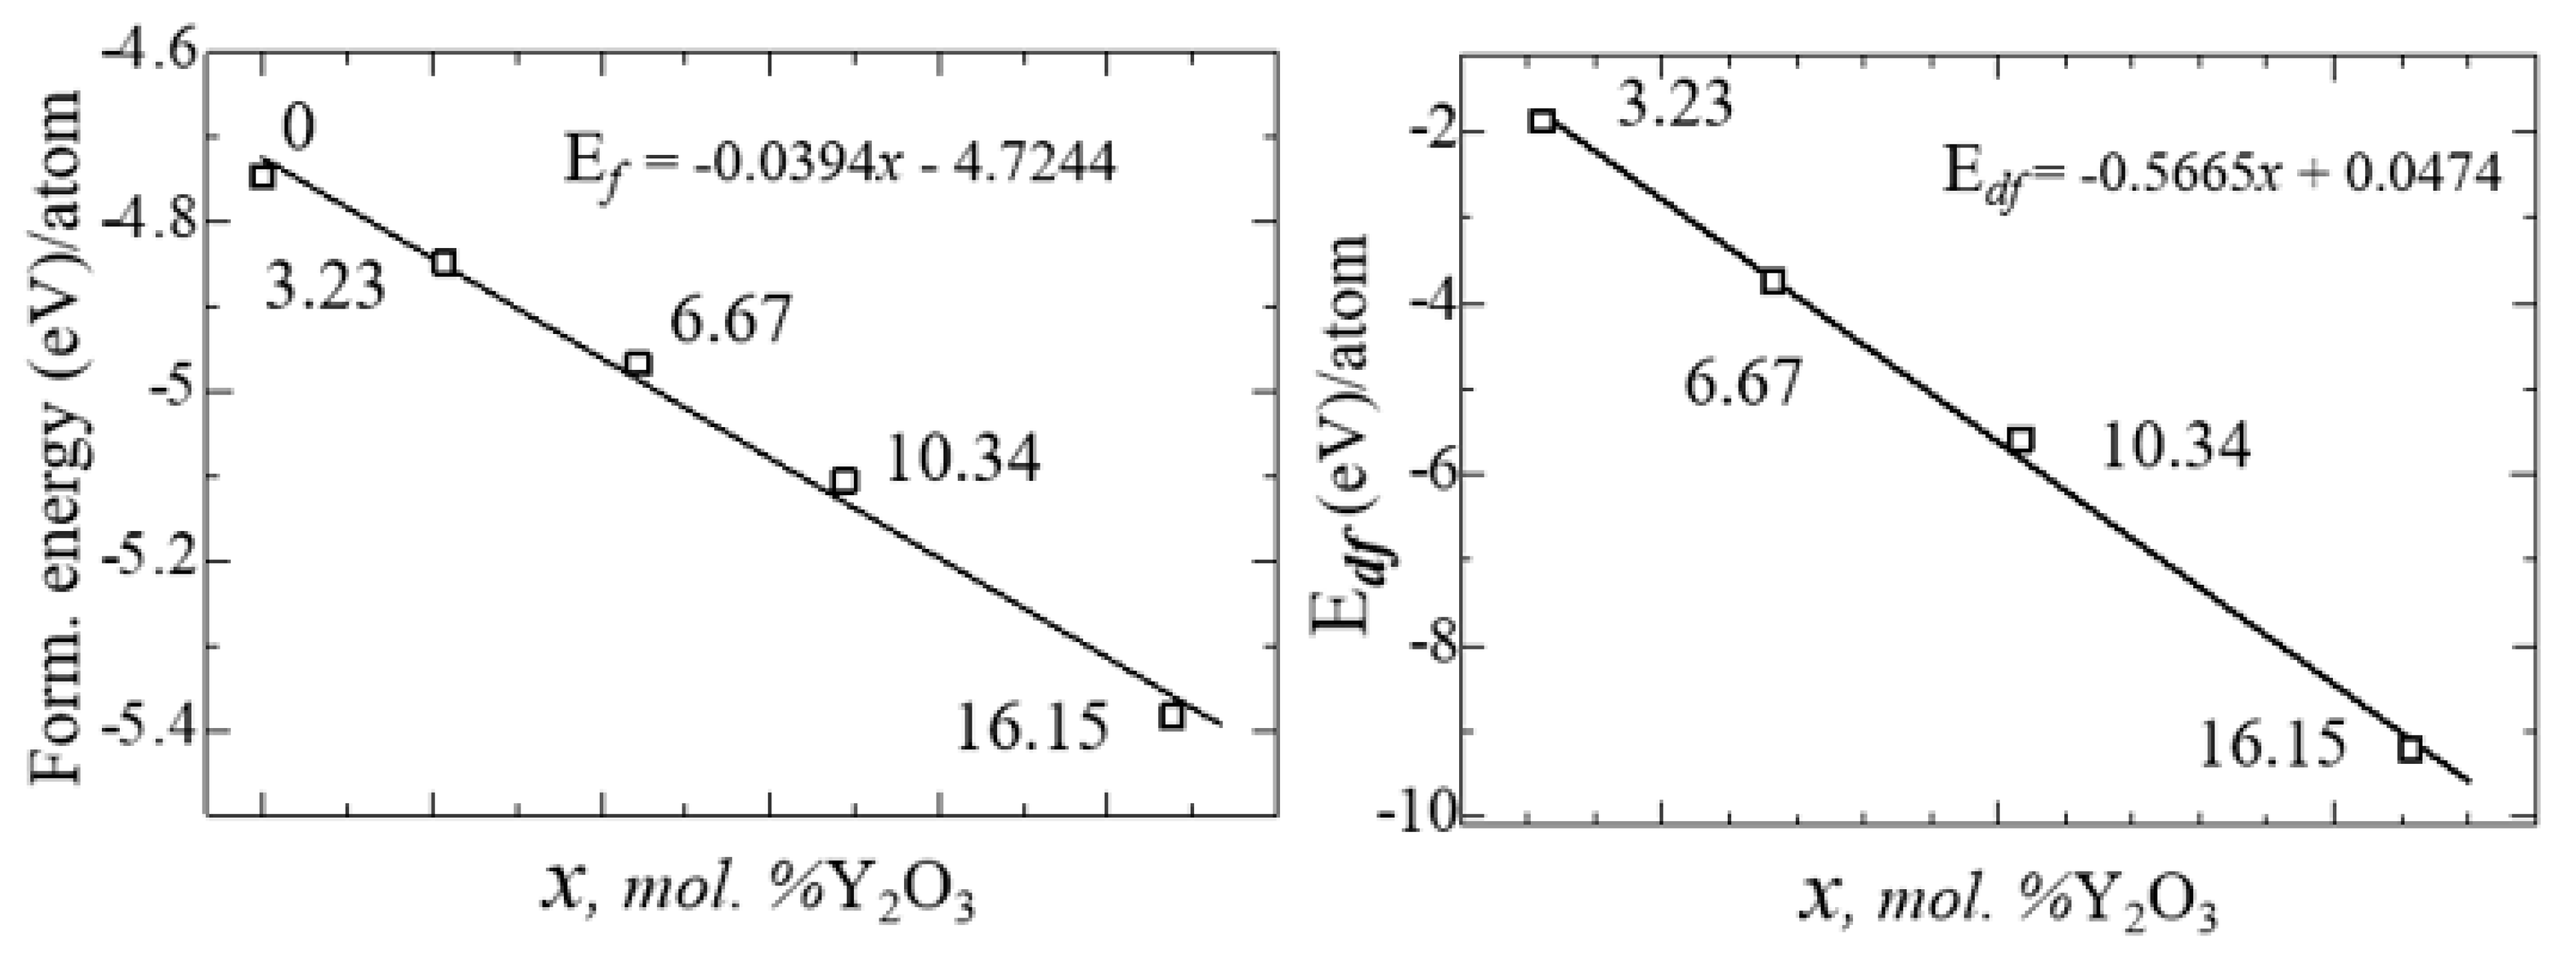
Figure 14.
Total density of electronic states (TDOS) for ZrO2 doped with 3.23, 6.67, 10.34 and 16.15 mol. %Y2O3.
Figure 14.
Total density of electronic states (TDOS) for ZrO2 doped with 3.23, 6.67, 10.34 and 16.15 mol. %Y2O3.
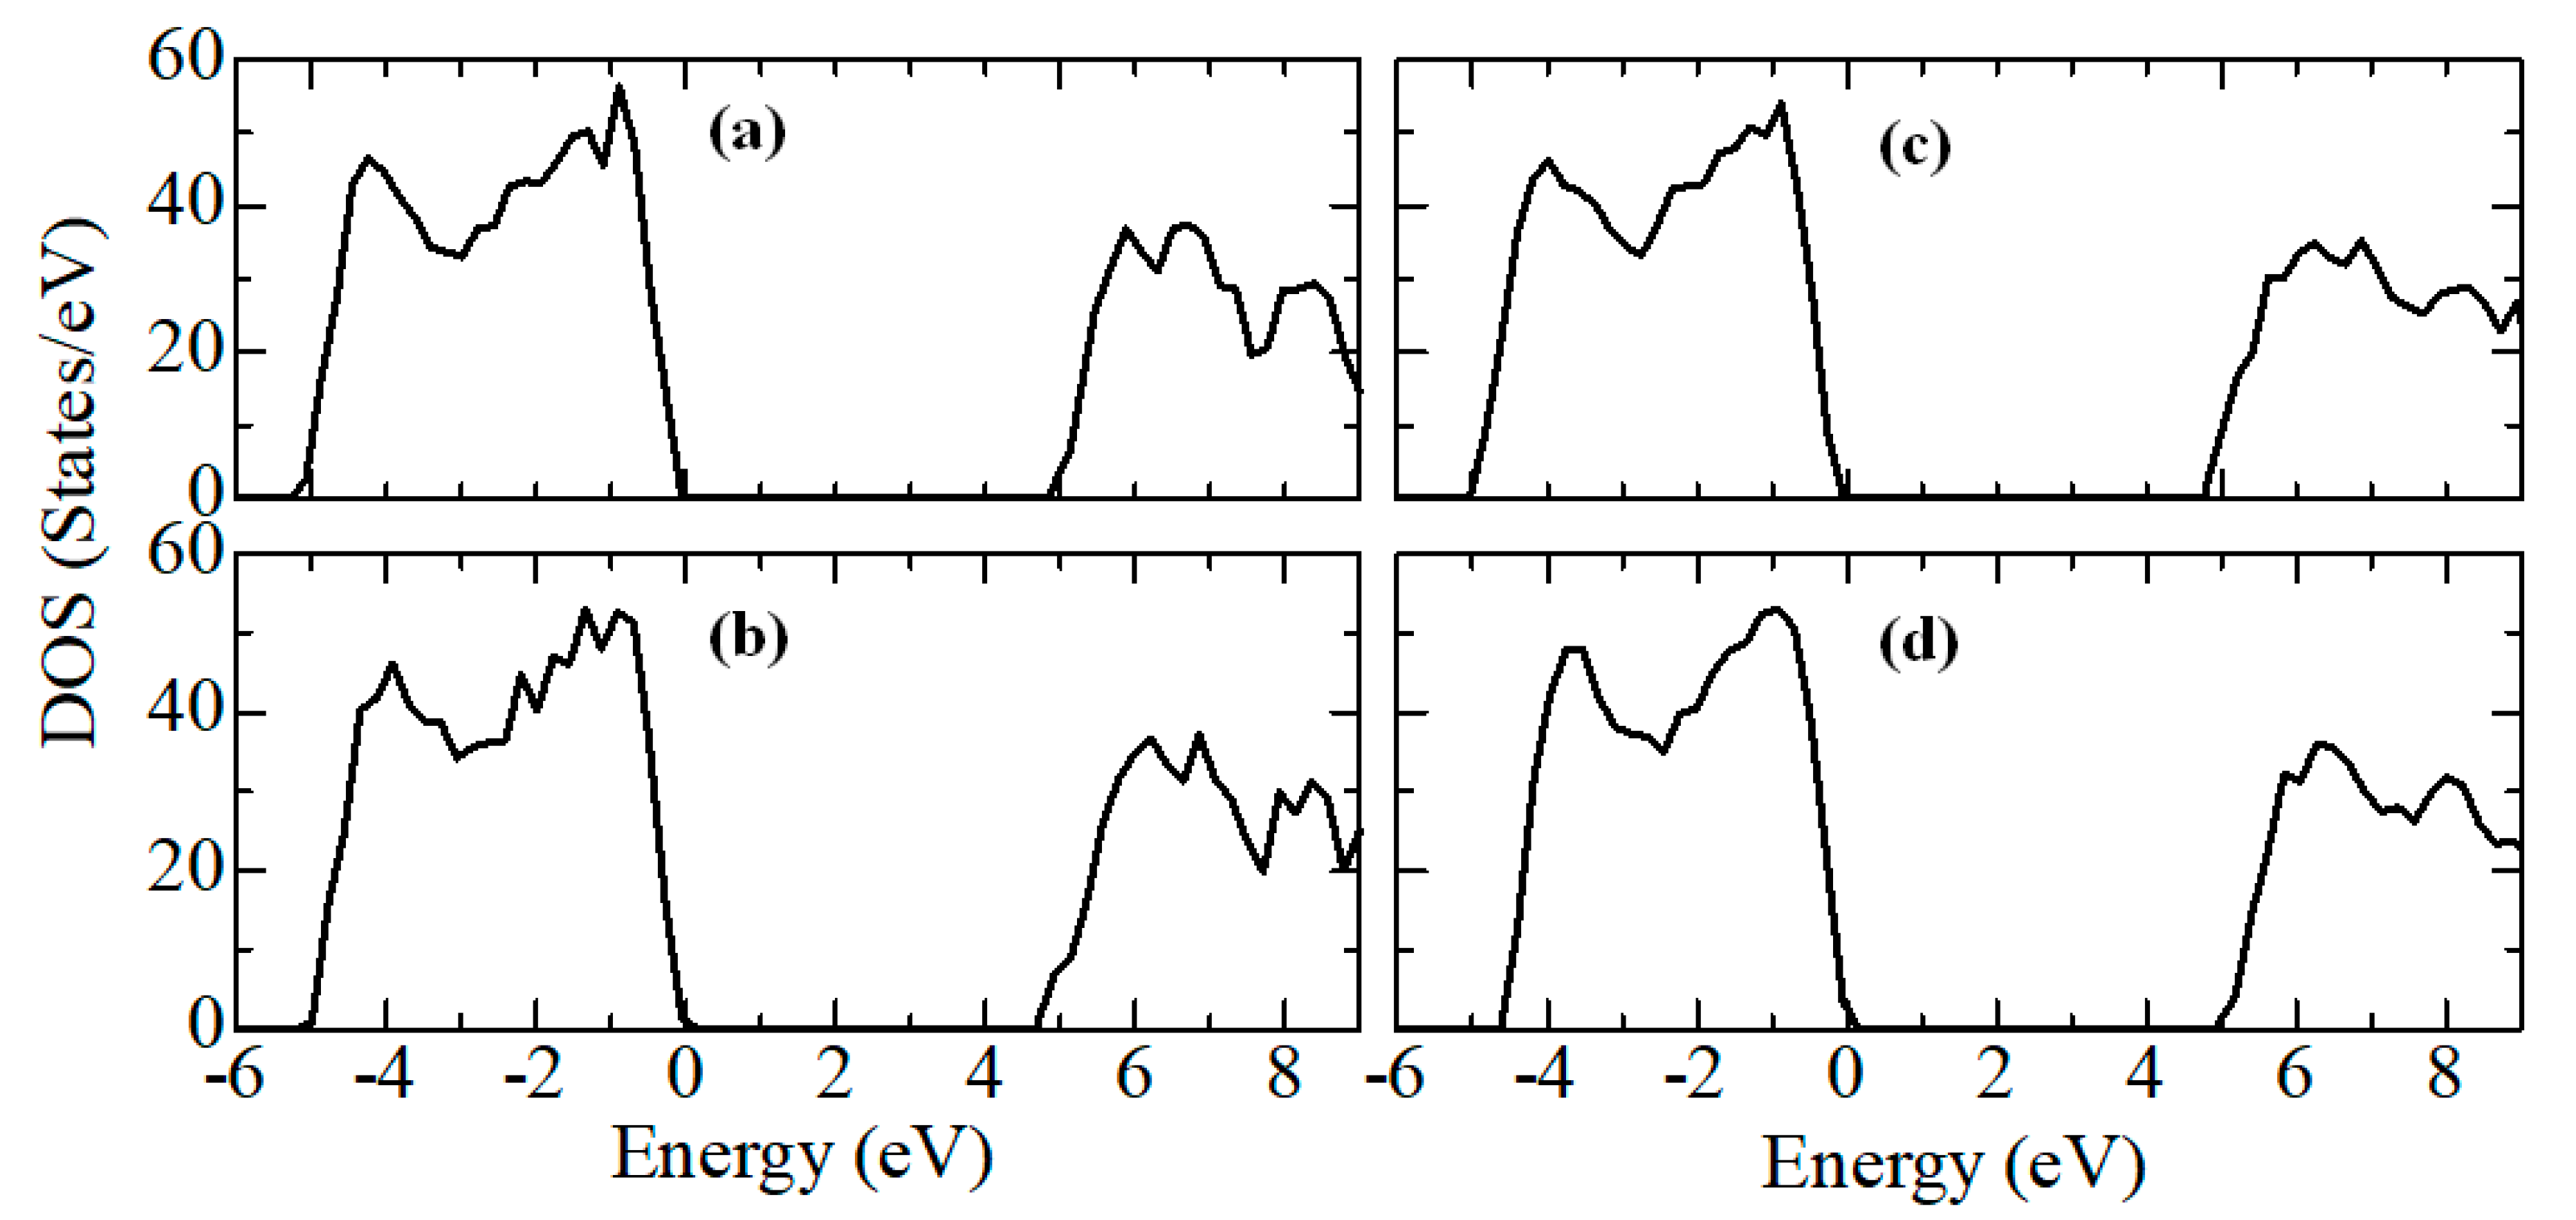
Figure 15.
Conduction (red) - and valence (green)-band change for ZrO2 doped with 3.23, 6.67, 10.34 и 16.15 mol. %Y2O3. The position of the Fermi level corresponds to the maximum of the valence band in each section.
Figure 15.
Conduction (red) - and valence (green)-band change for ZrO2 doped with 3.23, 6.67, 10.34 и 16.15 mol. %Y2O3. The position of the Fermi level corresponds to the maximum of the valence band in each section.
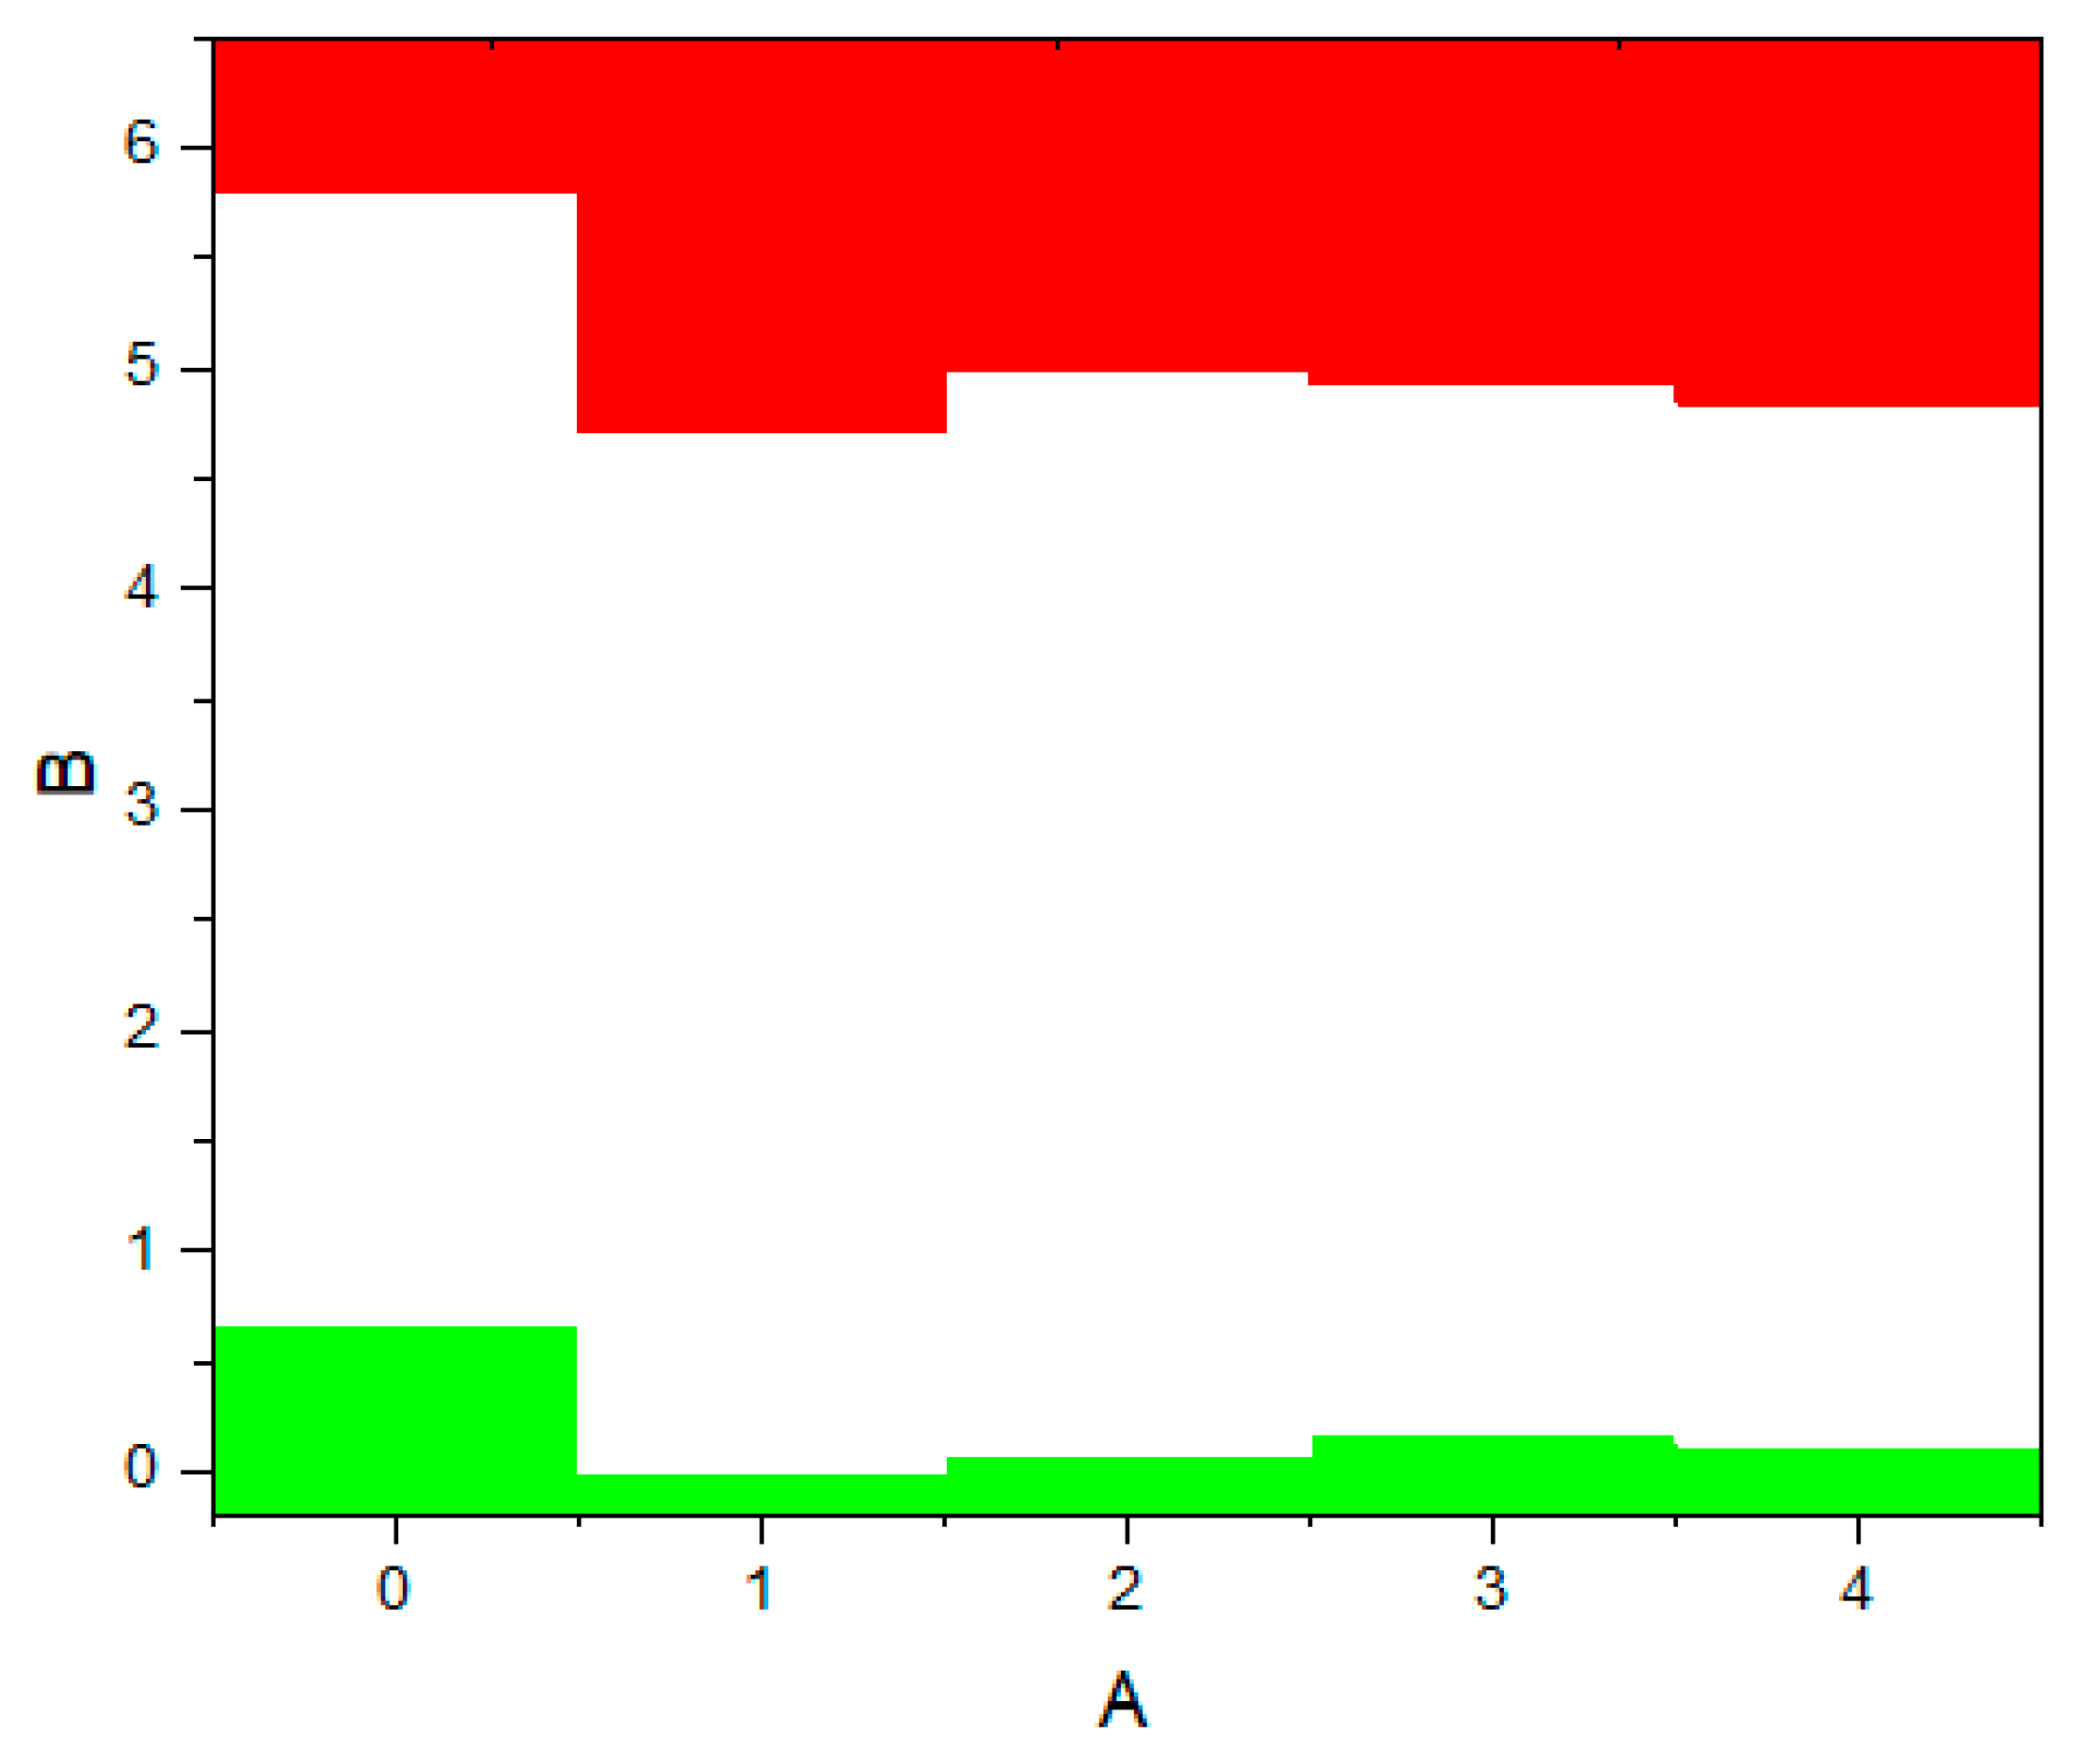
Figure 16.
Composite PDOS diagram showing the main contributions of the s-, p- and d-orbitals to the states forming the CB bottom for ZrO2 doped with 3.23, 6.67, 10.34 and 16.15 mol. %Y2O3. Top VB (green), scaled to zero.
Figure 16.
Composite PDOS diagram showing the main contributions of the s-, p- and d-orbitals to the states forming the CB bottom for ZrO2 doped with 3.23, 6.67, 10.34 and 16.15 mol. %Y2O3. Top VB (green), scaled to zero.
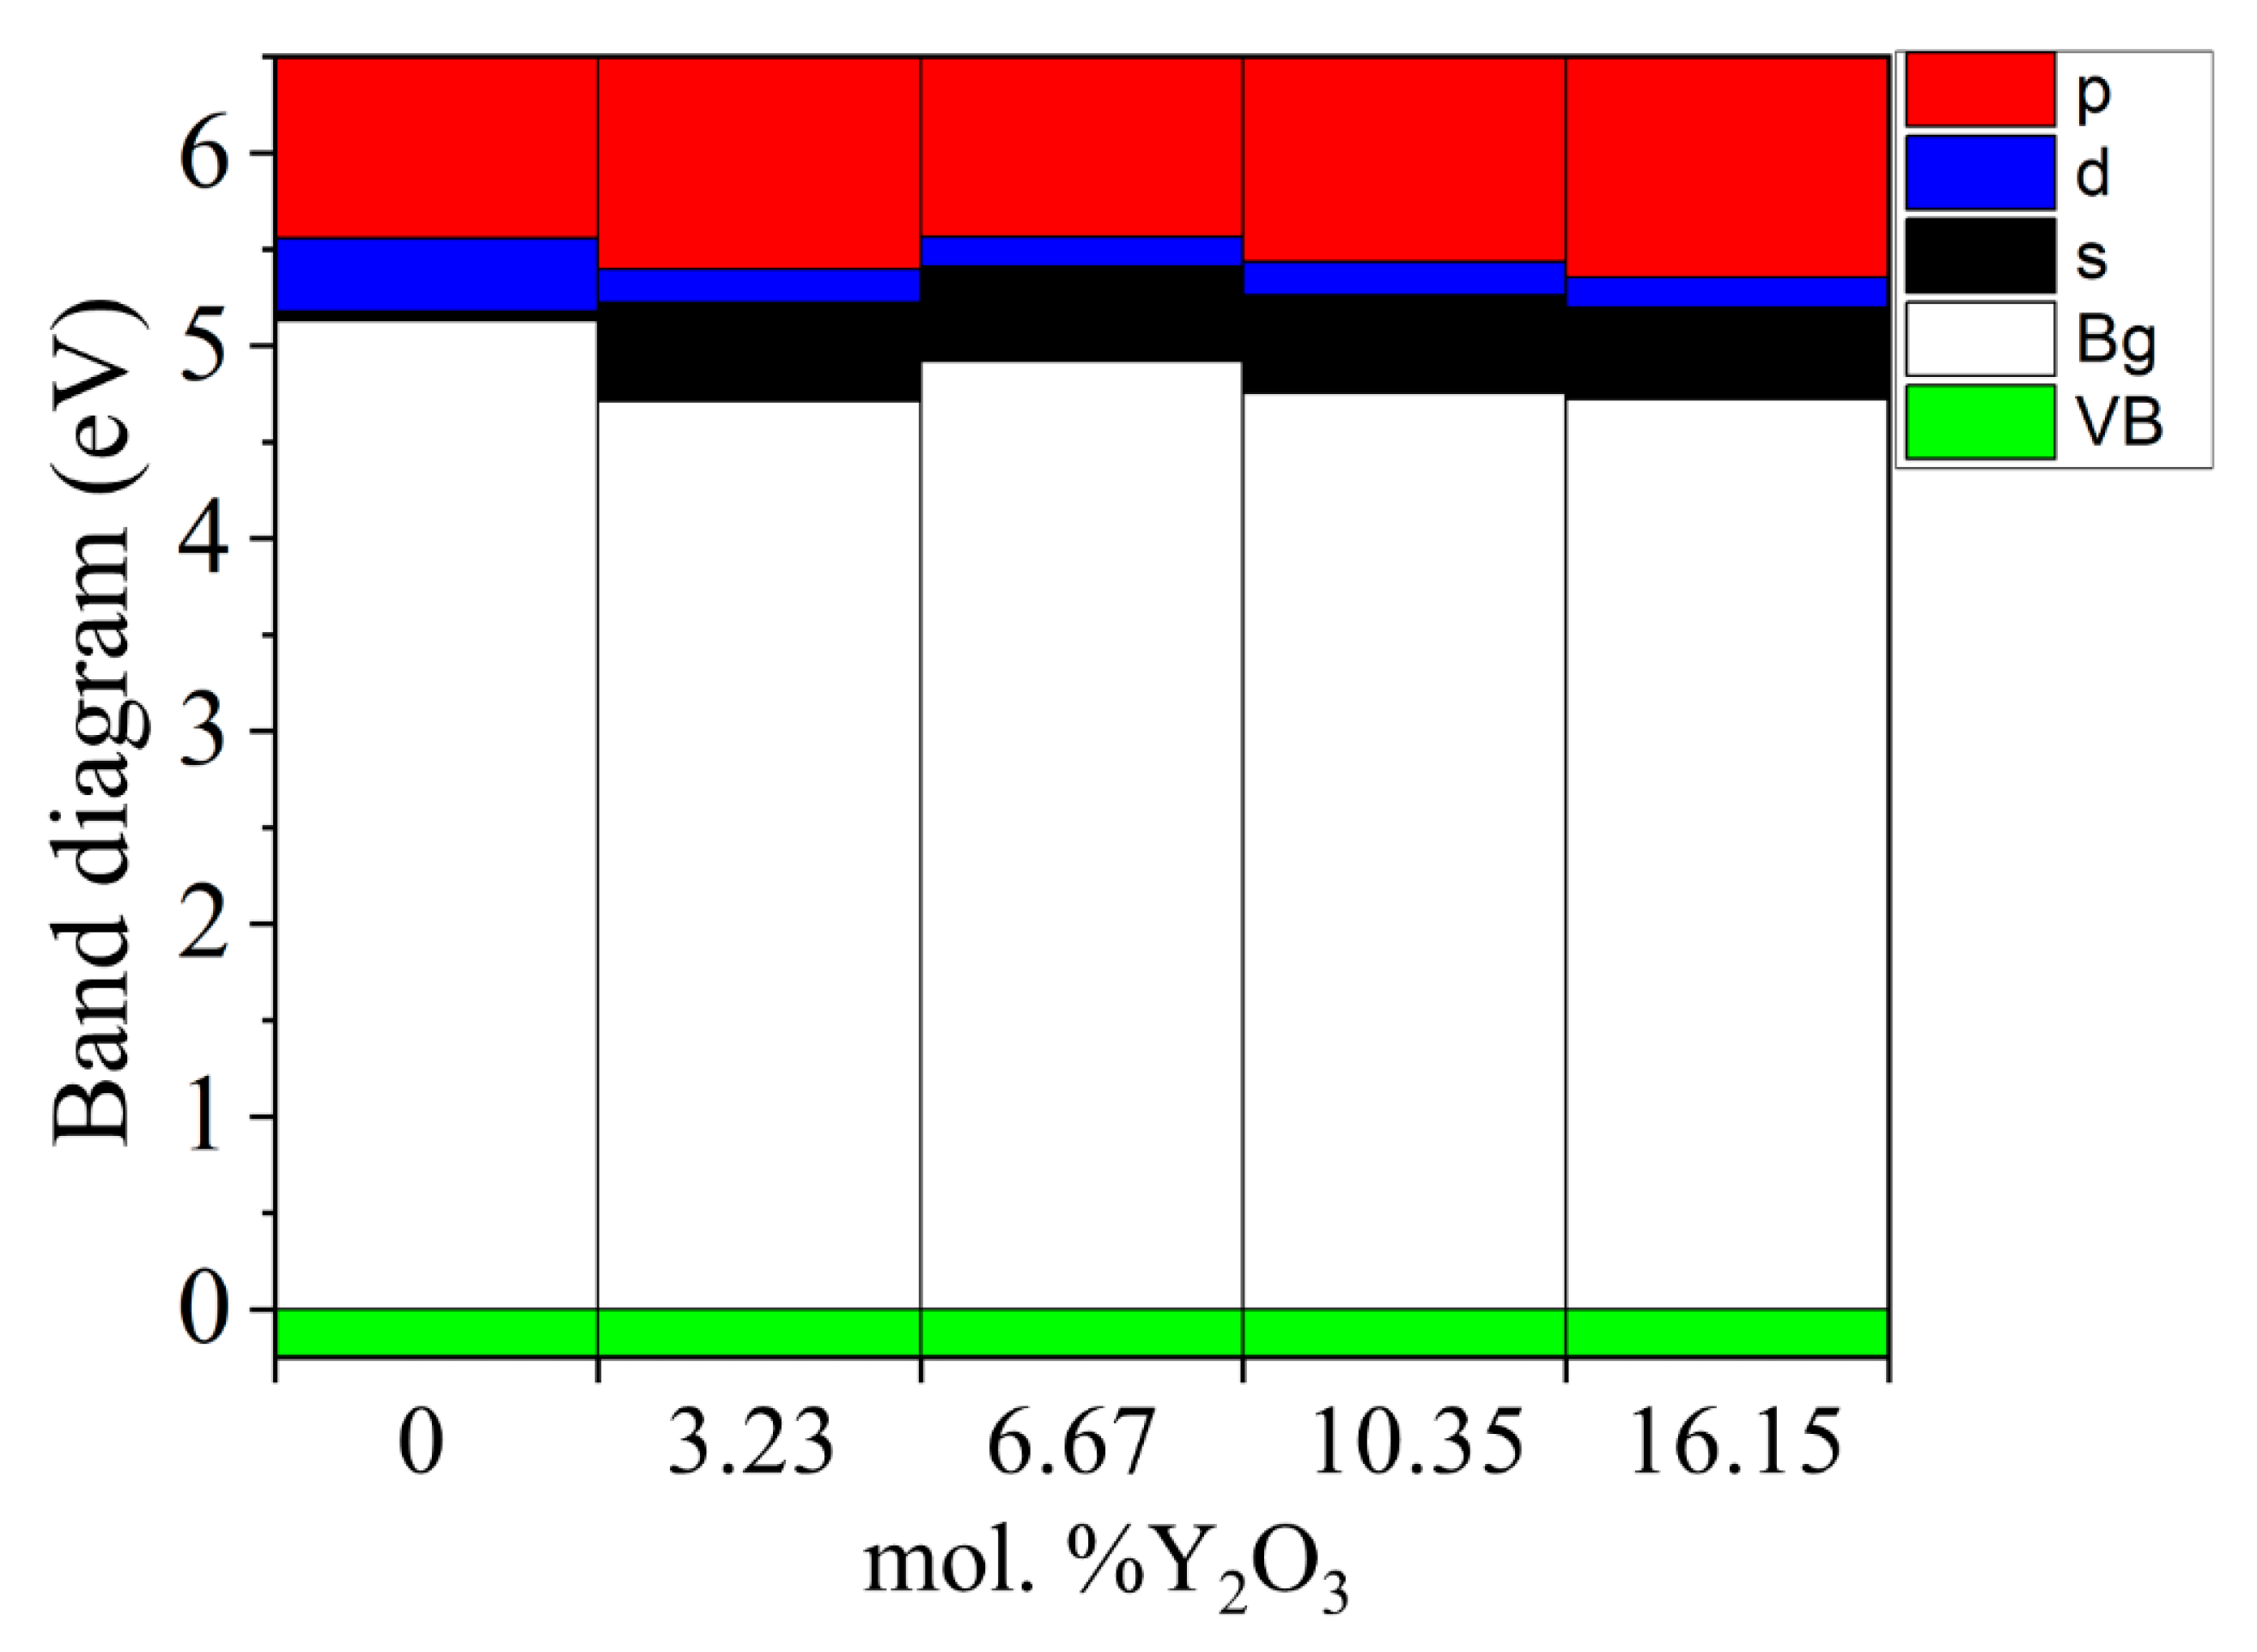
Figure 17.
Configuration of adsorption of a water molecule on the surface of t-ZrO2 (101): (a) model of a lamellar t-ZrO2 (101) cell with the initial configuration of water on its surface, (b) dissociative adsorption in a side view, (c) model of molecular physisorption water on the surface of t-ZrO2 in side view.
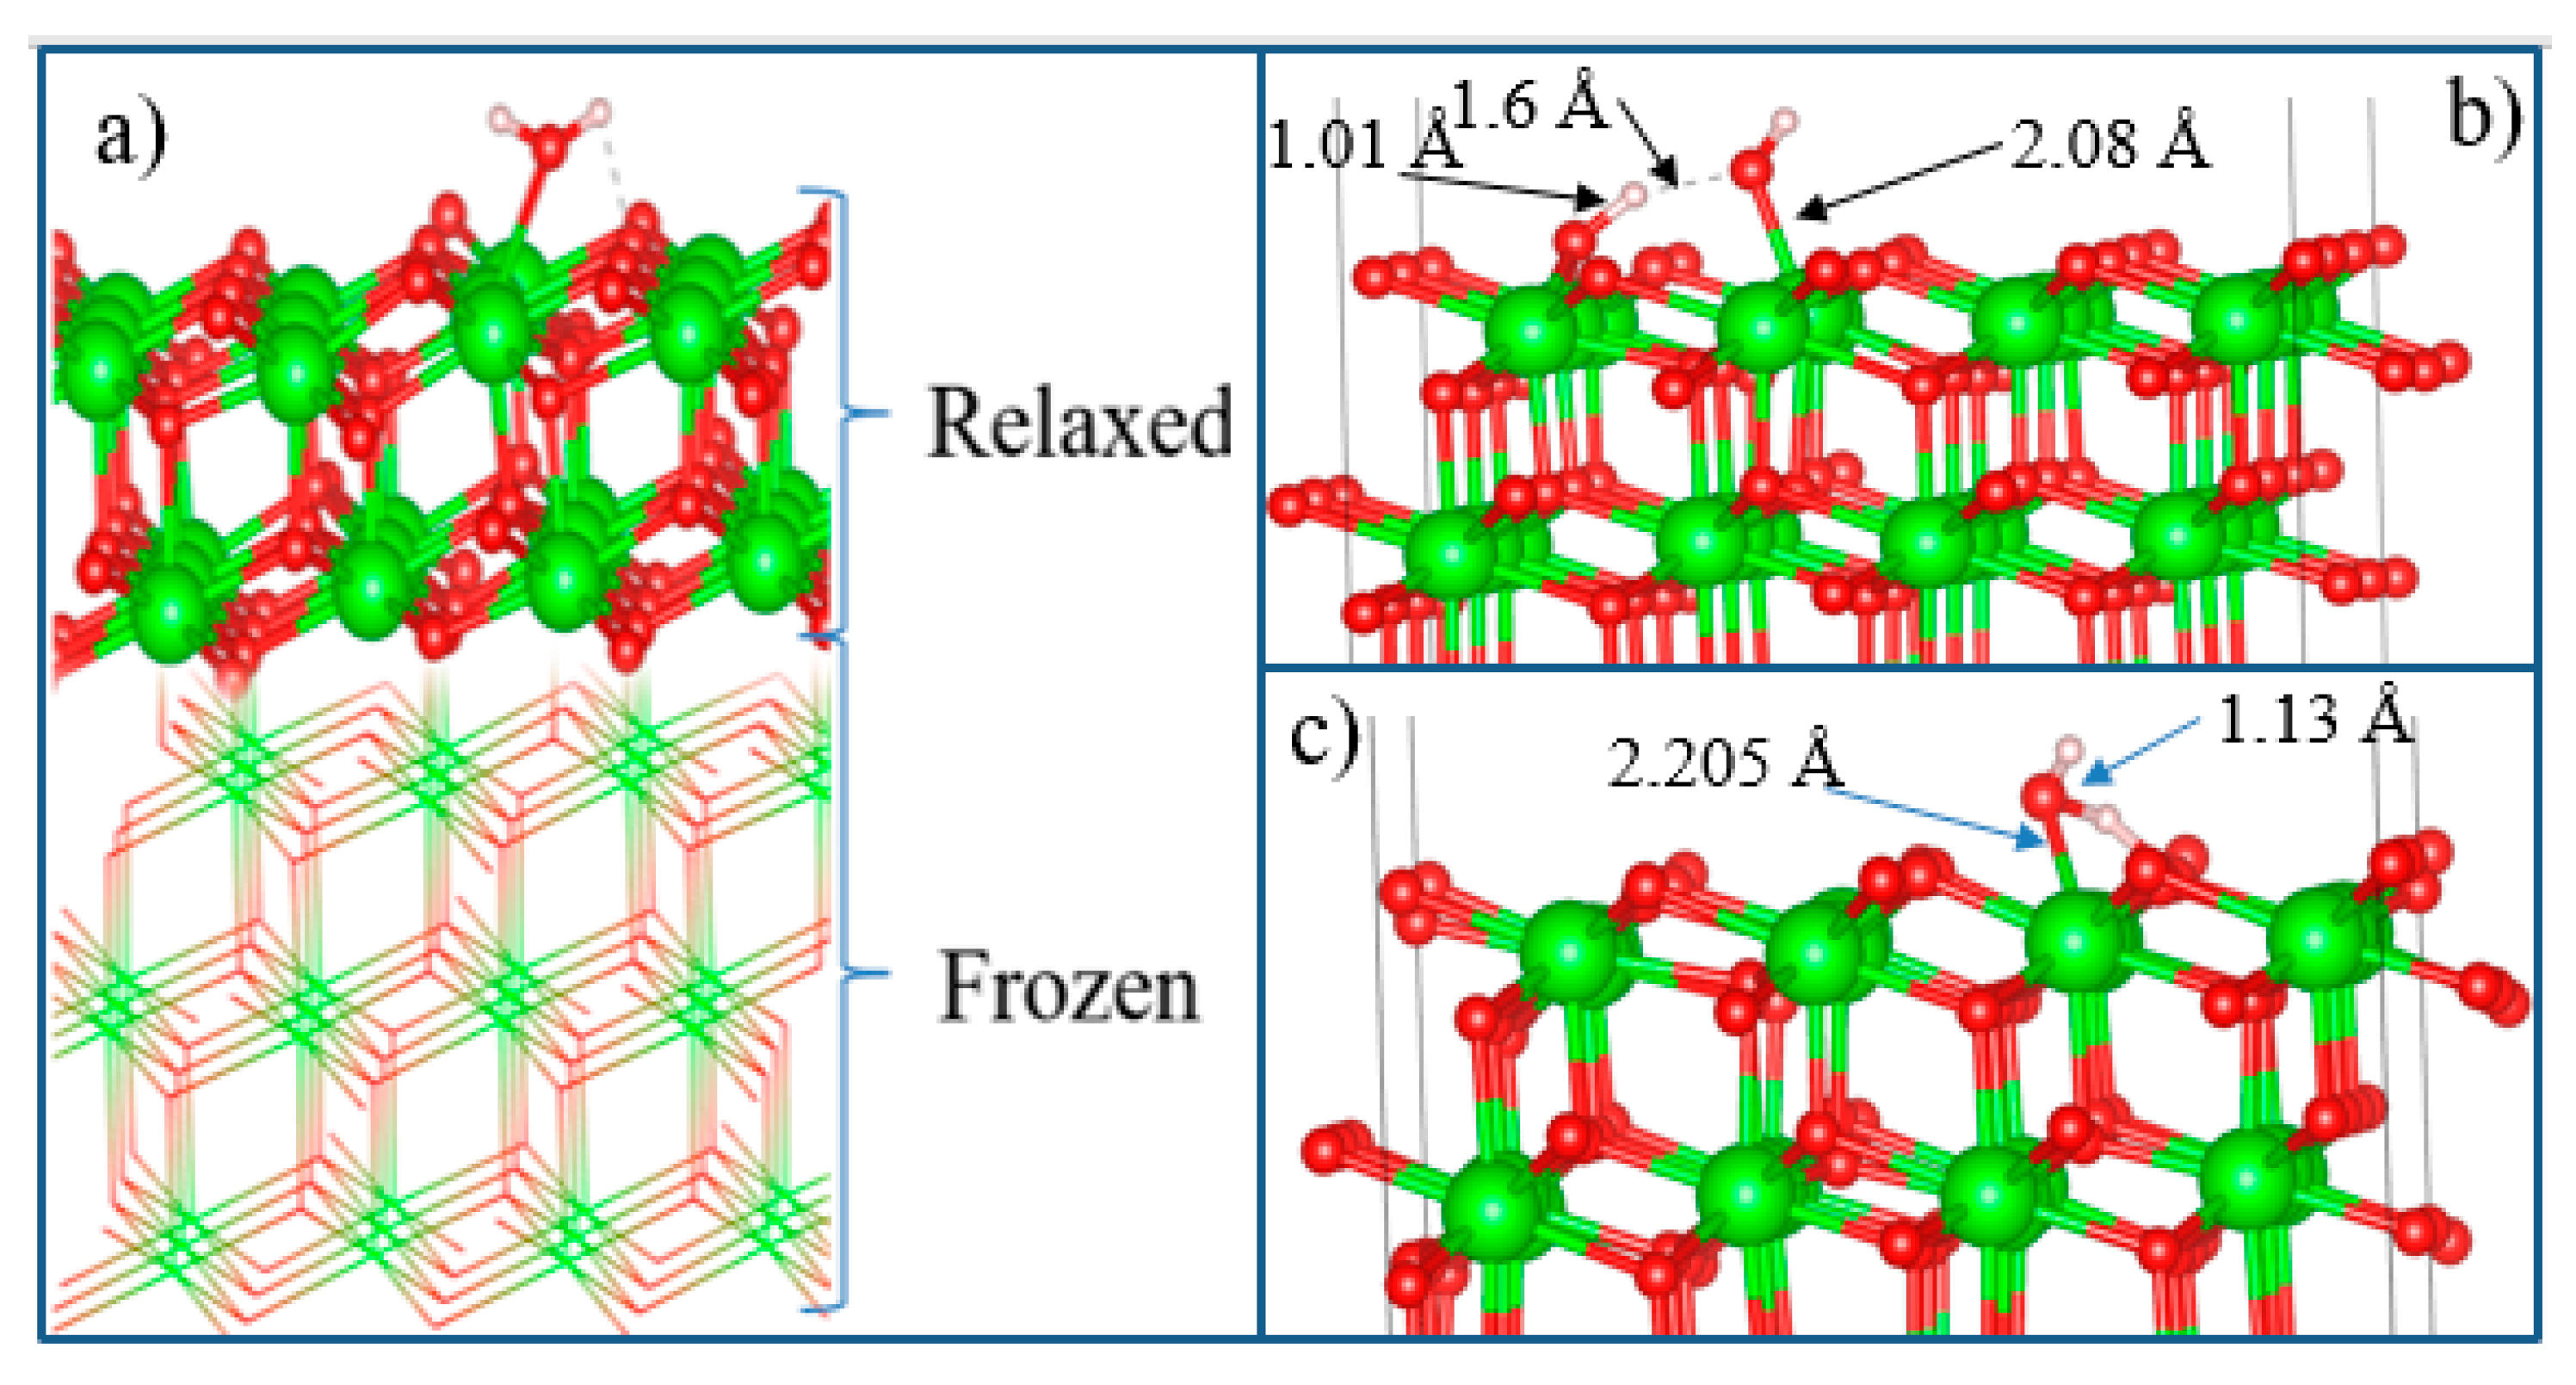
Figure 18.
Molecularly adsorbed water (a) and dissociated surface hydroxyls. (b) in the H2O-YSZ (101) model/.
Figure 18.
Molecularly adsorbed water (a) and dissociated surface hydroxyls. (b) in the H2O-YSZ (101) model/.
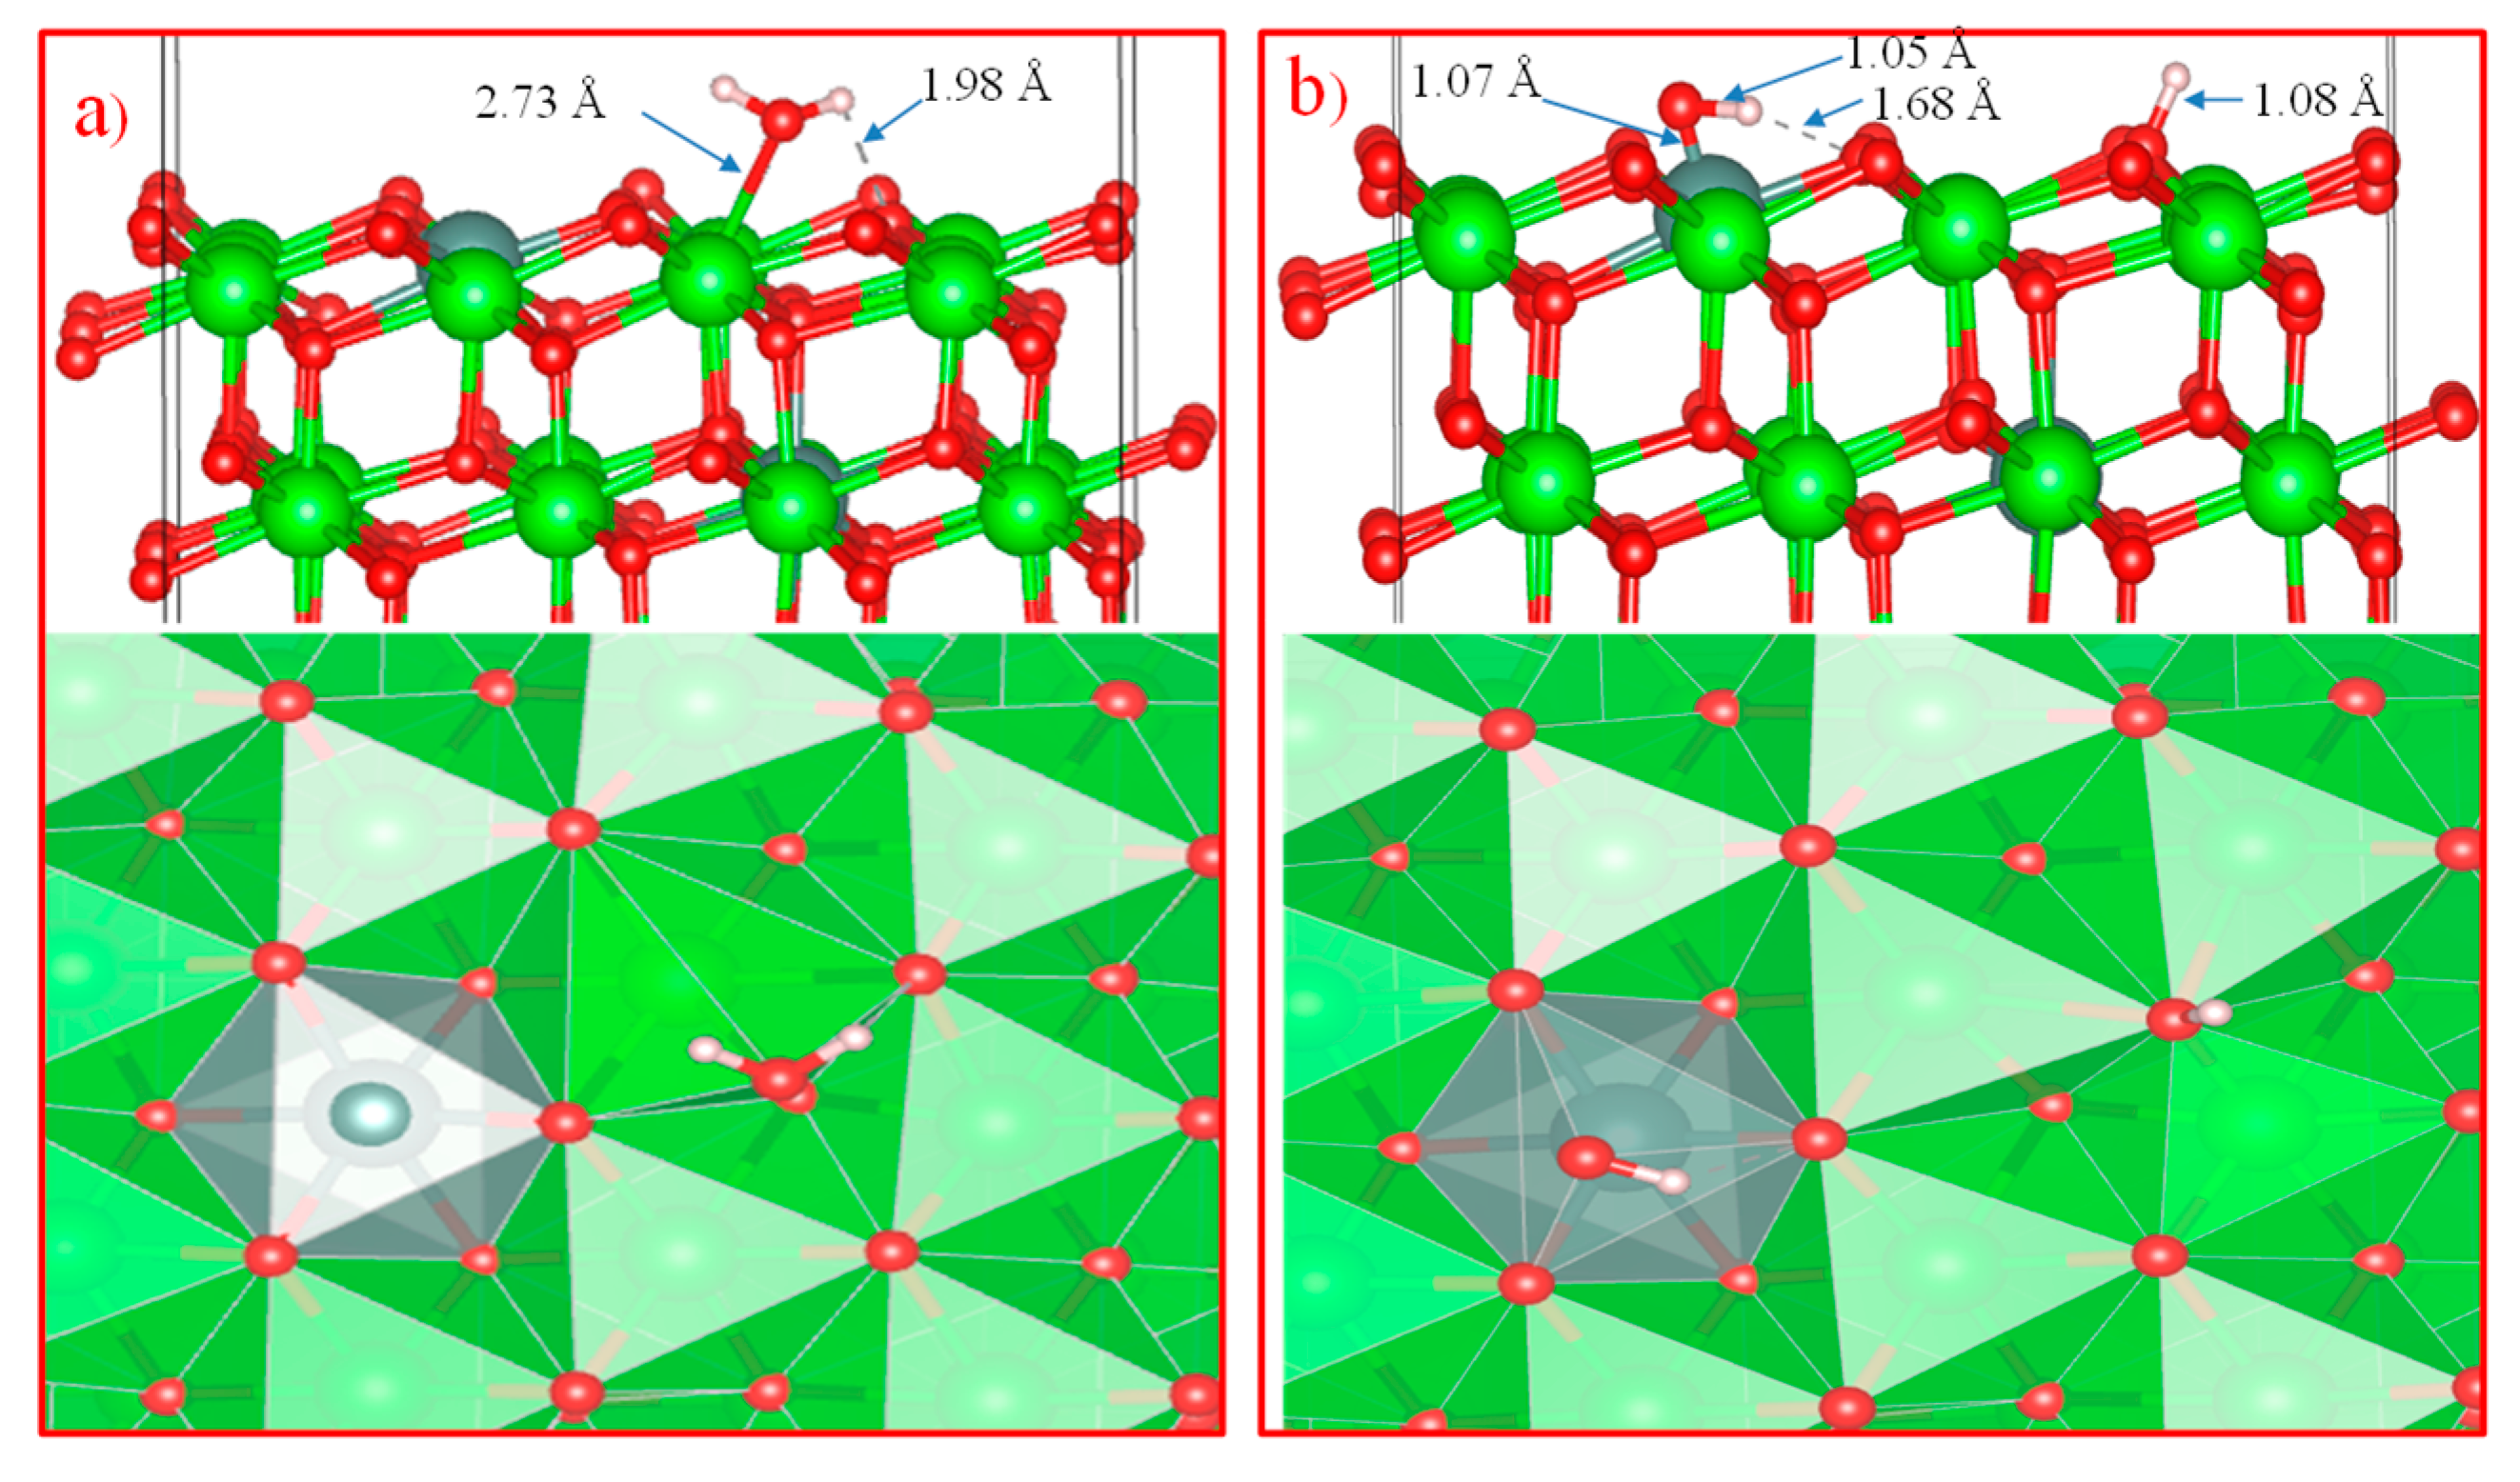
Figure 19.
Total density of states (TOS) calculated by the GGA for H2O molecules adsorbed on t-ZrO2(101) and t-YSZ (101).
Figure 19.
Total density of states (TOS) calculated by the GGA for H2O molecules adsorbed on t-ZrO2(101) and t-YSZ (101).
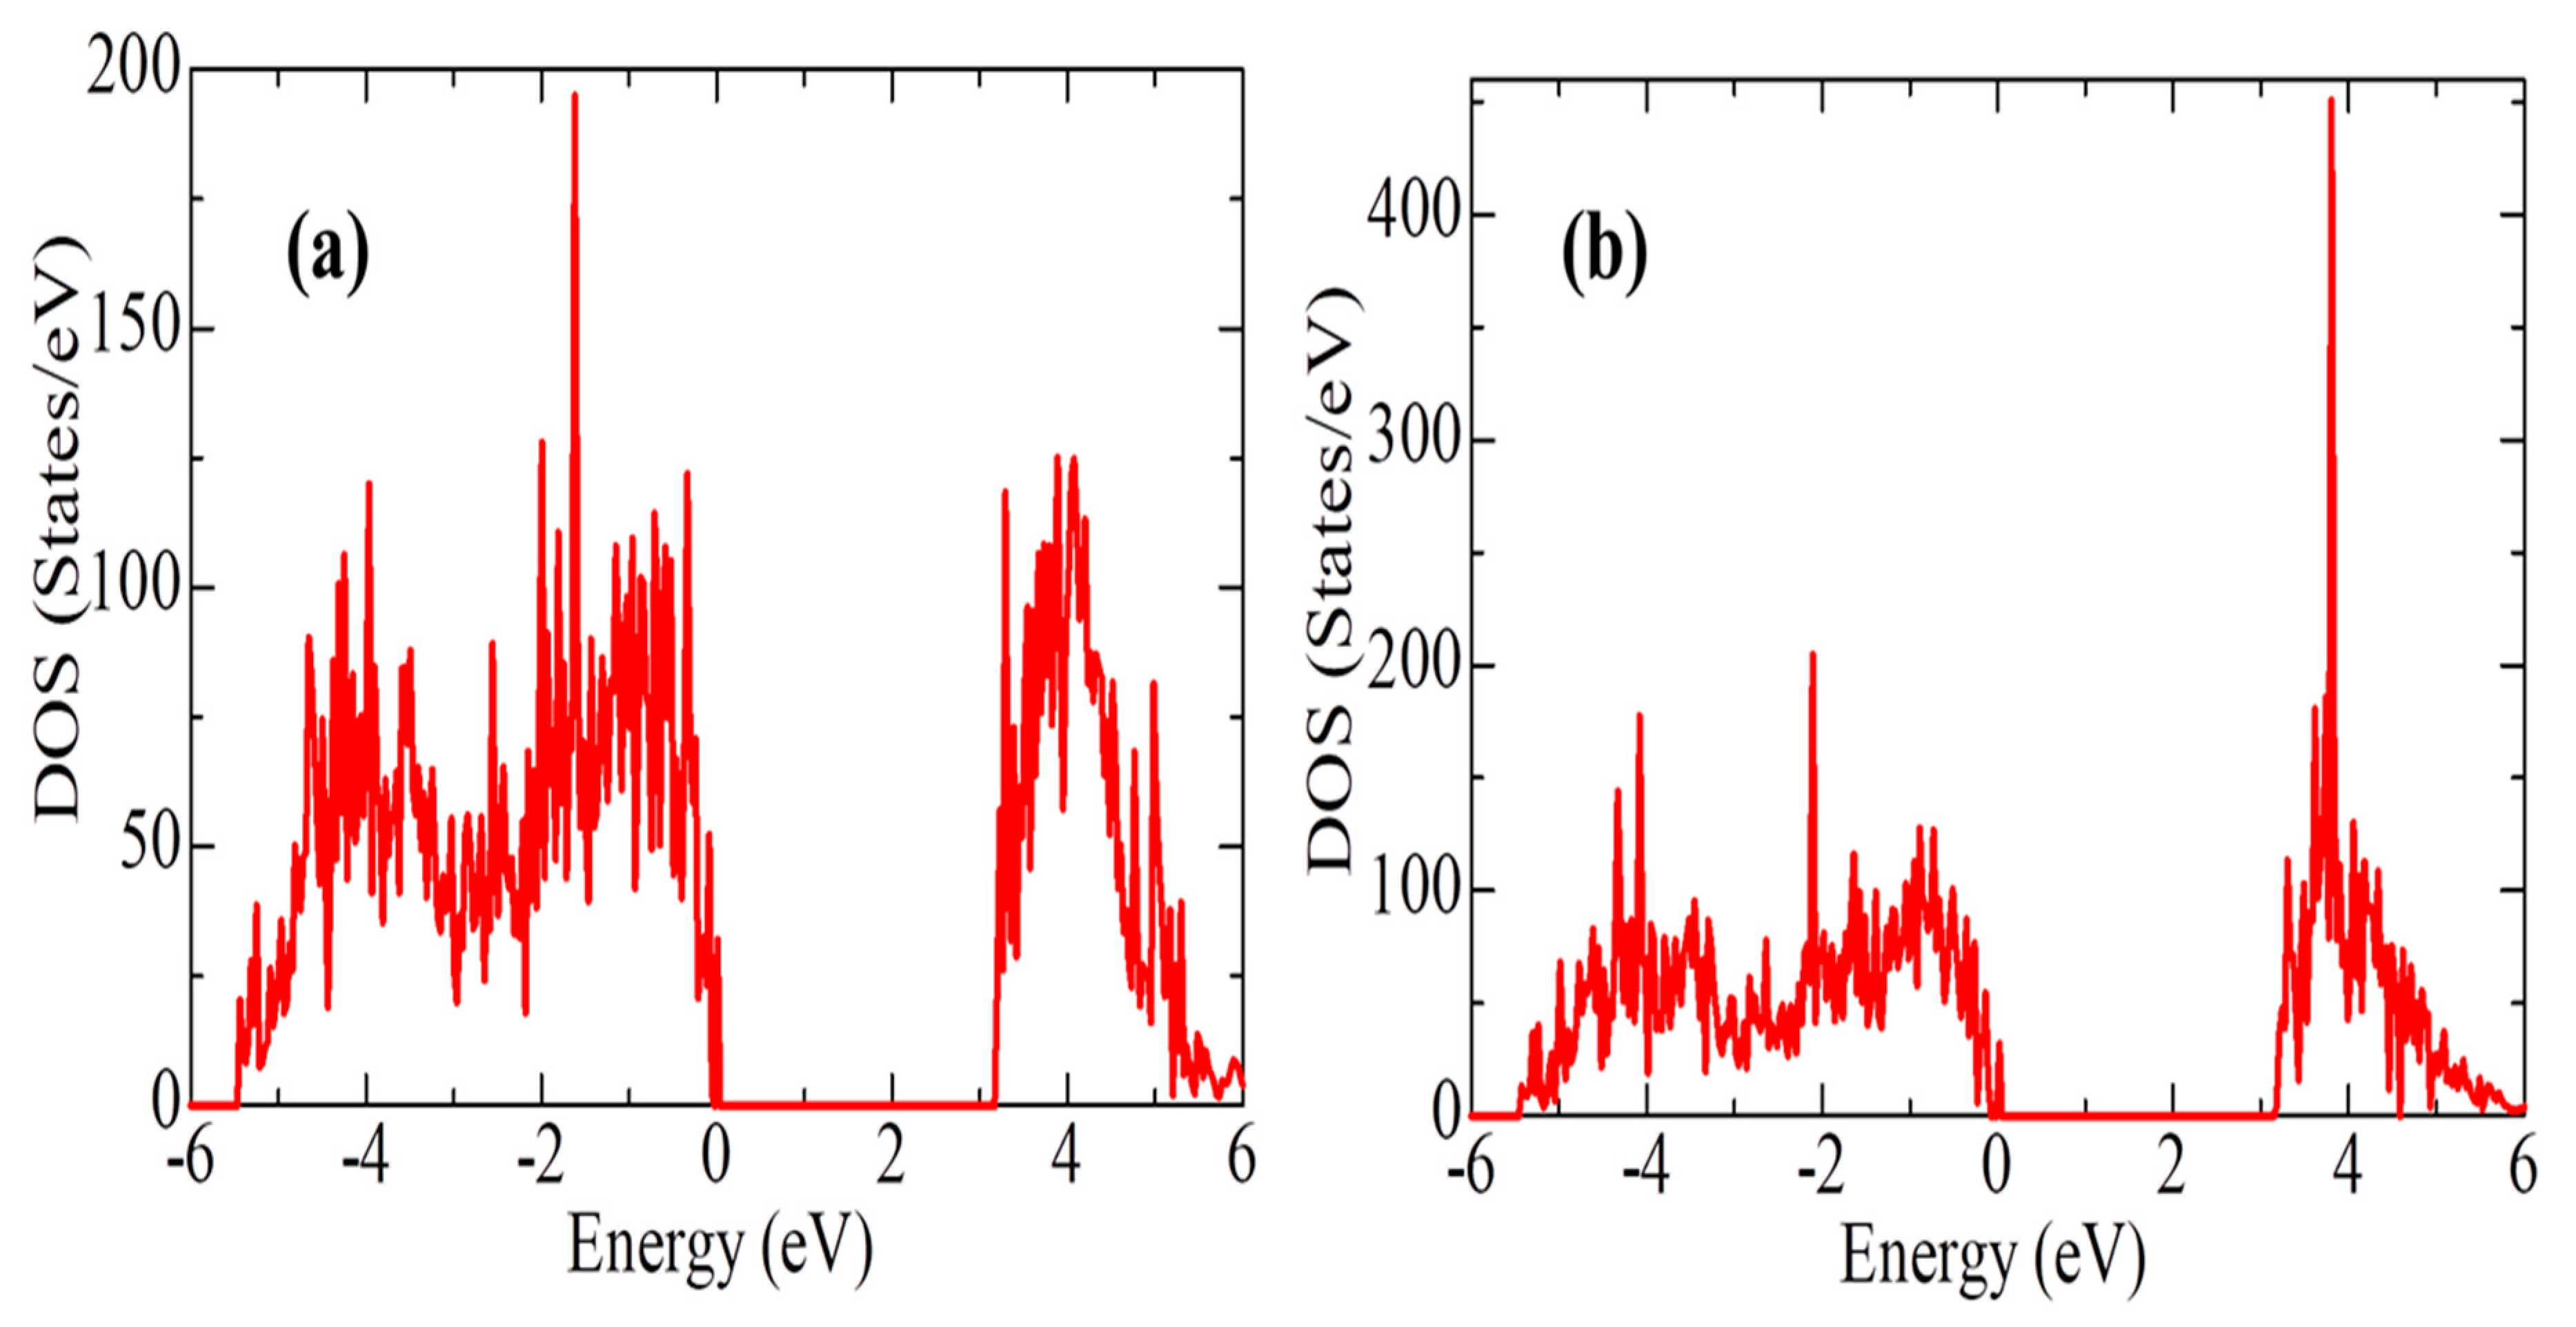
Figure 20.
Relaxation configurations: (a) fully hydroxylated t-YSZ (101), (b) single water adsorption on a fully hydroxylated t-YSZ (101) surface, and (c) t-YSZ(101) surface hydration model.
Figure 20.
Relaxation configurations: (a) fully hydroxylated t-YSZ (101), (b) single water adsorption on a fully hydroxylated t-YSZ (101) surface, and (c) t-YSZ(101) surface hydration model.
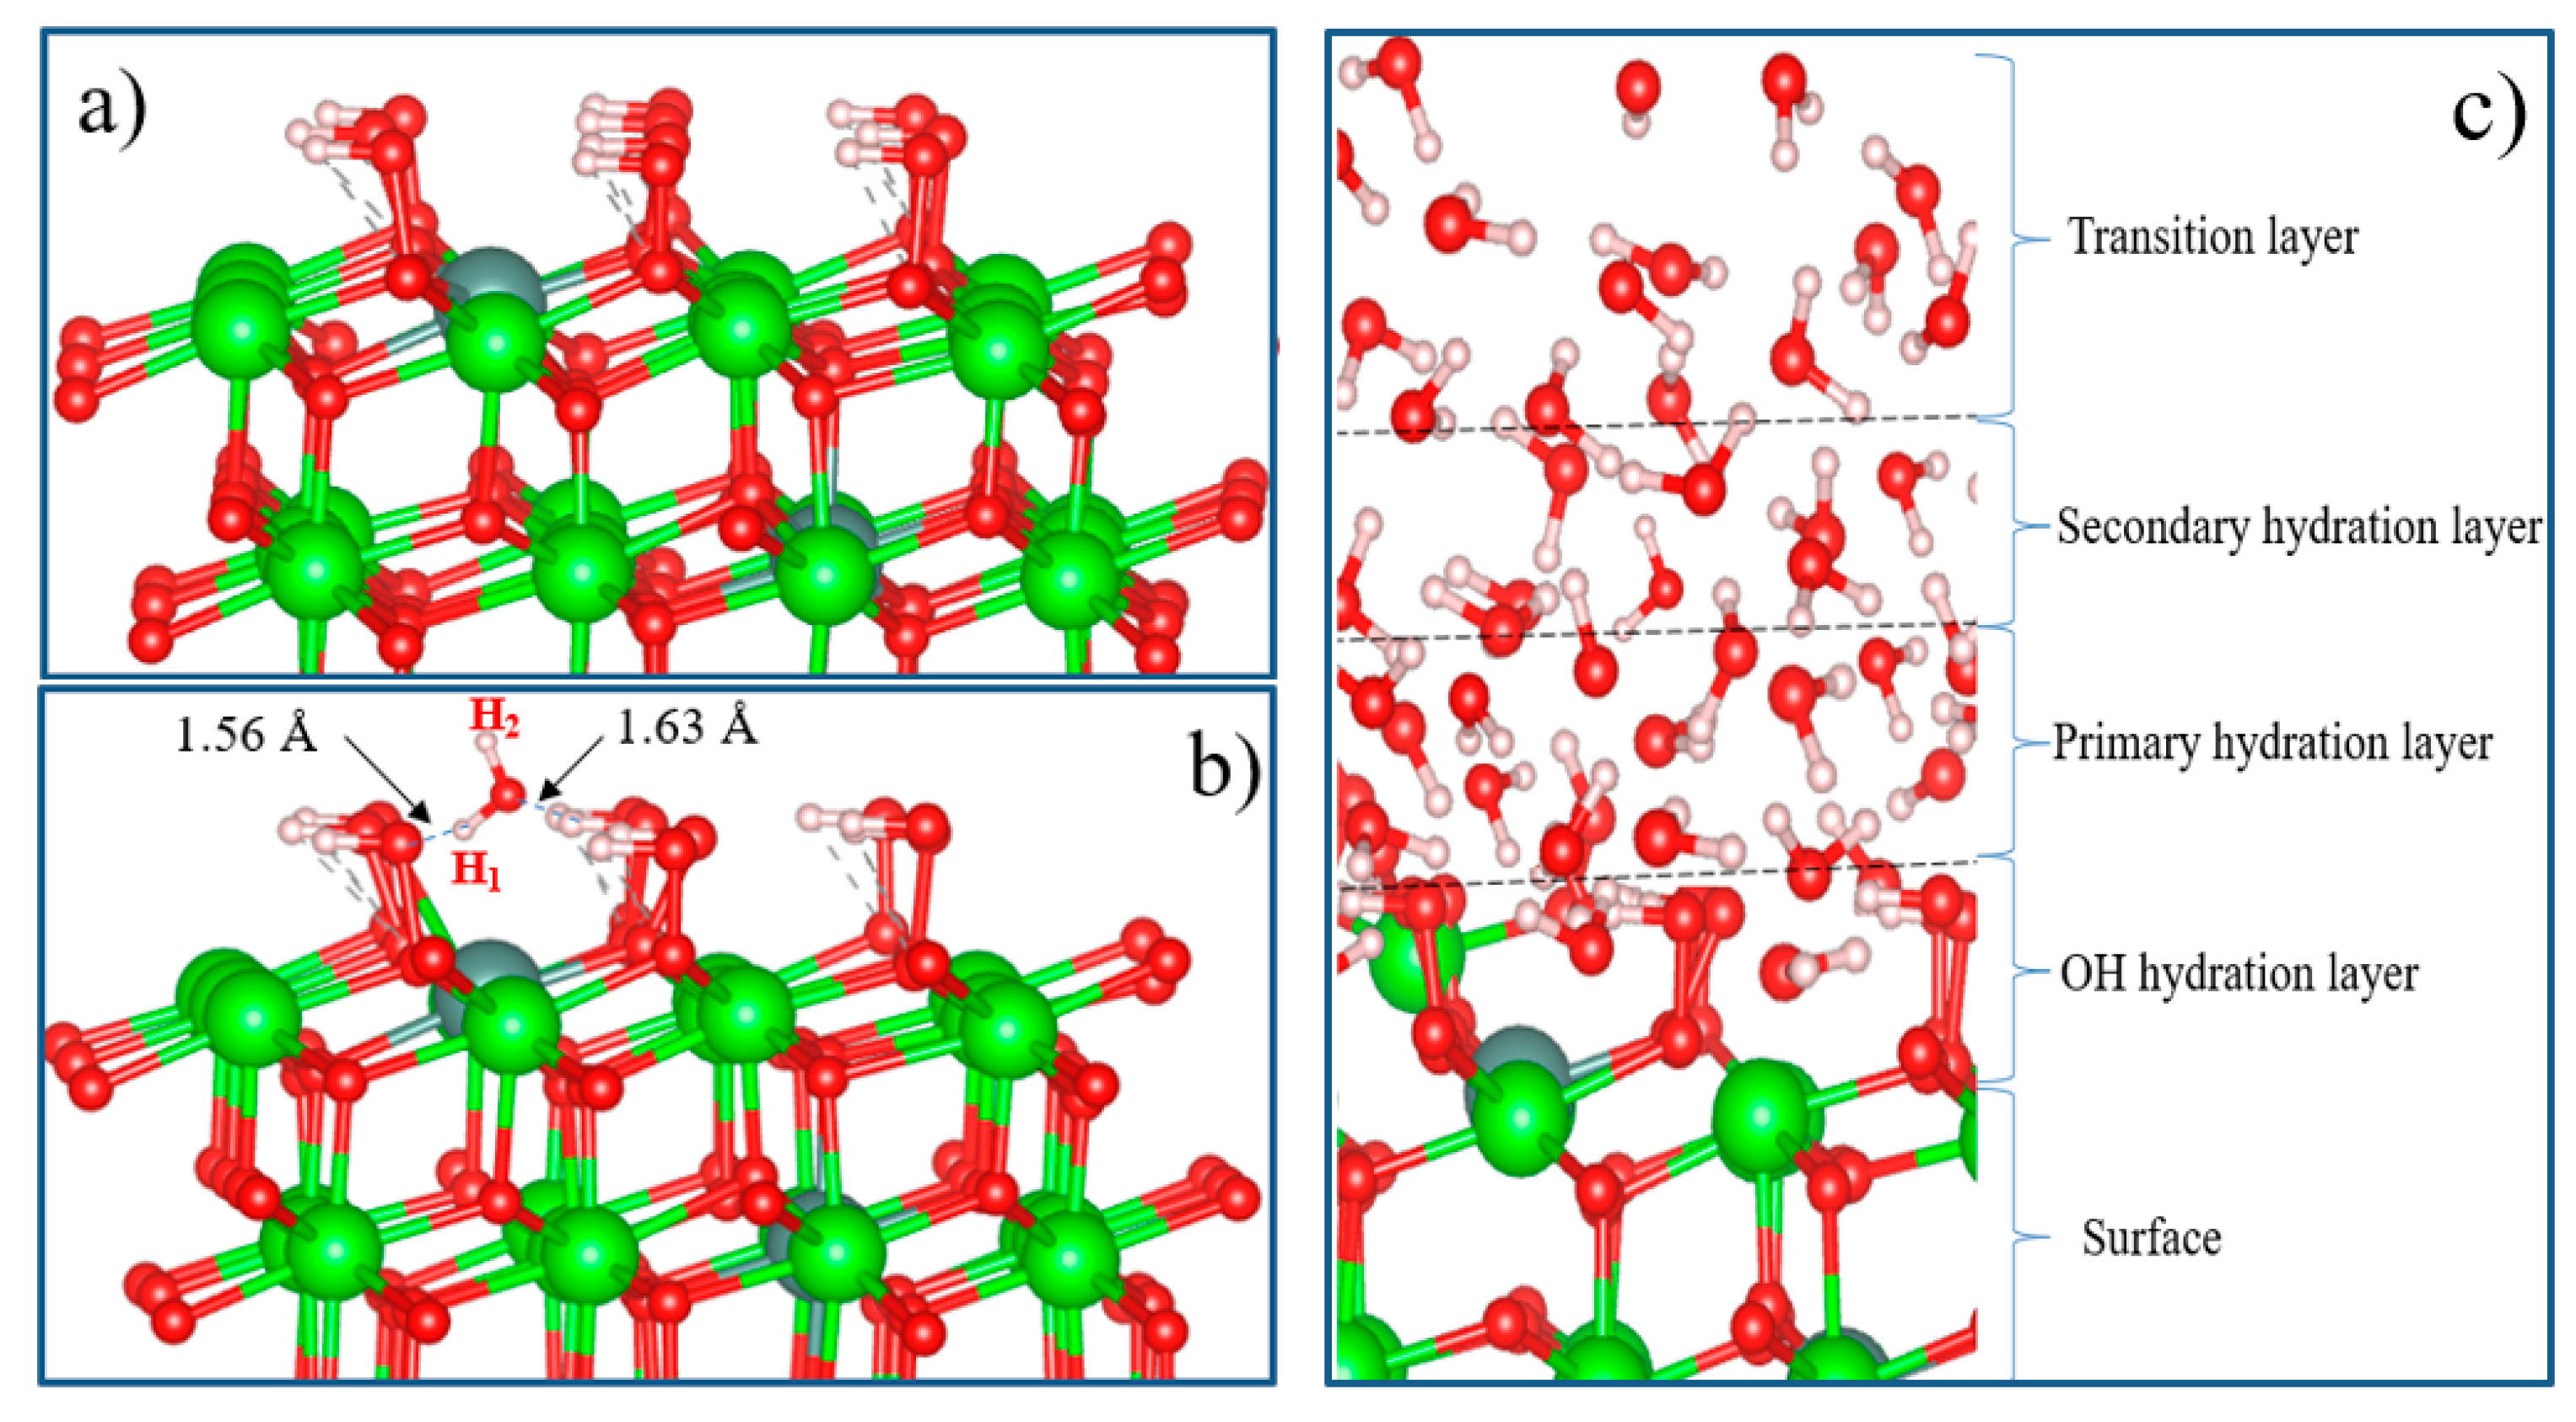
Table 1.
Relaxation parameters of the ZrO2 phase. The calculation results are compared with experimental and previous theoretical results.
Table 1.
Relaxation parameters of the ZrO2 phase. The calculation results are compared with experimental and previous theoretical results.
| Lattice constants | This work | Another Calc. [52] | Exp. | ||
|---|---|---|---|---|---|
| GGA | SCAN | ||||
| m-ZrO2 [P2_1/c] | a (Å) | 5.191 | 5.115 | 5.090 | 5.0950[45] |
| b (Å) | 5.245 | 5.239 | 5.187 | 5.2116[45] | |
| c (Å) | 5.202 | 5.304 | 5.243 | 5.3173[45] | |
| β◦ | 99.639 | 99.110 | 99.432 | 99.230[45] | |
| V (Å3) | 144.410 | 139.400 | 137.76 | 140.88[45] | |
| E − Em (eV/ZrO2) | 0 | 0 | 0 | 0 | |
| t-ZrO2 [P4_2/nmc] | a=b (Å) | 3.593 | 3.622 | - | 3.64[46] |
| с (Å) | 5.193 | 5.275 | - | 5.27[46] | |
| c/a | 1.445 | 1.456 | - | 1.45[46] | |
| V (Å3) | 67.05 | 69.214 | - | 69.83[46] | |
| dz | 0.012 | 0.013 | 1.011 | 0.046[47] | |
| E − Em (eV/ZrO2) | 0.4257 | 0.4257 | 0.048 | 0.065[49] | |
| c-ZrO2 [Fm-3m] | a=b=c (Å) | 5.075 | 5.12 | 5.031 | 5.129[50] |
| V(Å3) | 130.709 | 134.06 | 127.36 | 134.9[50] | |
| E − Em (eV/ZrO2) | 0.833 | 0.833 | 0.087 | 0.14[51] | |
Table 4.
The number of Zr, Y and O ions for various mol. %Y2O3 taking into account the oxygen vacancy.
Table 4.
The number of Zr, Y and O ions for various mol. %Y2O3 taking into account the oxygen vacancy.
| mol. %Y2O3 | Zr | Y | O | O vacancy | Formula |
|---|---|---|---|---|---|
| 0 | 32 | 0 | 64 | 0 | Zr32O64 |
| 3.23 | 30 | 2 | 63 | 1 | Zr30Y2O63 |
| 6.67 | 28 | 4 | 62 | 2 | Zr28Y4O62 |
| 10.35 | 26 | 6 | 61 | 3 | Zr26Y6O61 |
| 16.15 | 22 | 10 | 59 | 5 | Zr22Y10O59 |
Table 5.
Lattice parameters of 2x2x2 ZrO2 and YSZ supercells at various Y2O3 concentrations.
| System | Lattice parameters | Structure | |||||
|---|---|---|---|---|---|---|---|
| a (Å) | b(Å) | c (Å) | α(◦) | β (◦) | γ(◦) | ||
| 0 | 10.382 | 10.491 | 10.757 | 90 | 99.64 | 90.00 | m - YSZ |
| 3.23 mol. %Y2O3 | 10.274 | 10.524 | 10.536 | 90.21 | 98.84 | 89.94 | m - YSZ |
| 6.67 mol. %Y2O3 | 10.512 | 10.544 | 10.603 | 89.90 | 90.12 | 89.62 | t - YSZ |
| 10.35 mol. %Y2O3 | 10.529 | 10.541 | 10.546 | 89.98 | 90.09 | 90.08 | t - YSZ |
| 16.15 mol. %Y2O3 | 10.540 | 10.541 | 10.543 | 90.08 | 90.00 | 90.02 | c - YSZ |
Table 7.
Surface energies (σ) of the main phases of ZrO2.
| Phase | Miller indices | |||||
|---|---|---|---|---|---|---|
| m-ZrO2 | [010] | [100] | [110] | [101] | [011] | [111] |
| σ, 1019 Эв/м2 | 1.54 | 1.16 | 1.10 | 1.23 | 1.08 | 0.81 |
| t-ZrO2 | [001] | [010] | [101] | [100] | [111] | |
| σ, 1019 Эв/м2 | 0.98 | 0.95 | 0.78 | 1.01 | 0.79 | |
| c-ZrO2 | [100] | [110] | [111] | |||
| σ, 1019 Эв/м2 | 1.51 | 1.34 | 1.12 | |||
Table 8.
Adsorption energies (Eads) and structural characteristics of t-ZrO2(101) and t-YSZ (101) with adsorbed water.
Table 8.
Adsorption energies (Eads) and structural characteristics of t-ZrO2(101) and t-YSZ (101) with adsorbed water.
| t-ZrO2(101) | t- YSZ (101) | |
|---|---|---|
| Eads (H2O), eV | - | - 1.84 |
| Eads (H+OH), eV | - 1.22 | - 1.23 |
| Dist O(H2O)-surf, Å | 2.08 | 2.73 |
| Dist O(H2O)-H1(H2O), Å | 0.97 | 0.96 |
| Dist O(H2O)-H2(H2O), Å | 1.13 | 0.97 |
| H-O-H bond angle, (°) | 111.3 | 105.54 |
Disclaimer/Publisher’s Note: The statements, opinions and data contained in all publications are solely those of the individual author(s) and contributor(s) and not of MDPI and/or the editor(s). MDPI and/or the editor(s) disclaim responsibility for any injury to people or property resulting from any ideas, methods, instructions or products referred to in the content. |
© 2023 by the authors. Licensee MDPI, Basel, Switzerland. This article is an open access article distributed under the terms and conditions of the Creative Commons Attribution (CC BY) license (http://creativecommons.org/licenses/by/4.0/).
Copyright: This open access article is published under a Creative Commons CC BY 4.0 license, which permit the free download, distribution, and reuse, provided that the author and preprint are cited in any reuse.


