
Submitted:
25 May 2023
Posted:
26 May 2023
You are already at the latest version
Abstract
To accomplish IMO's emissions reduction targets, the Chinese government has established emission control areas and implemented strict sulfur limitation policies. Faced with the downturn in the shipping industry and the challenge of insufficient supply of compliant fuel, Hong Kong and Shenzhen in China have implemented different low-sulfur fuel subsidy policies. Therefore, it is particularly important to study the air pollution control mechanism considering low sulfur fuel subsidy policy. Firstly, the non-cooperative game models considering low-sulfur fuel subsidies are constructed. Secondly, the mechanisms of various factors affecting port pricing, throughput and profit are analyzed. Then, a case study is conducted by using AIS data of container ships in Shanghai Port and Ningbo Zhoushan Port. The study reveals that whether the container service price of the leader port increases or decreases, the follower port always take corresponding follow-up measures. In both sequential and simultaneous game, the profit difference of the leader port is positively related to the subsidy ratio of the port’s own and negatively related to the coefficient of the competitor's subsidy. In conclusion, the low-sulfur fuel subsidy policy has a significant positive impact on the step-by-step implementation of more stringent pollution reduction policies in port waters.
Keywords:
ship emissions
; air pollution
; ship emission control policies
; emission reduction
; non-cooperative game
; green shipping
; low sulfur fuel
1. Introduction
International shipping contributes significantly to the world economy, but it also brings serious air pollution problems to ports and nearby cities. Various air pollutants and greenhouse gases, such as , , , , etc., produced by vessels have a negative impact on the environment and public health in port cities. In California, the cardiovascular disease and premature death caused by ship emissions have sparked protests from local residents. Although more pollutants are emitted when the vessel is sailing than when it is in port, the density of the population around the port is particularly high and the population is very large, so the emission pollution around the port cannot be ignored [1,2].
IMO has been concerned about vessel-source emissions since 1960s, and from then on early targets for greenhouse gas reductions were set, advocating that emissions from vessels should be reduced by at least 50% from 2008 to 2030. In response to the IMO's plan, the United States, the European Union, Singapore, China and the Mediterranean Sea have enacted a number of bills to reduce air pollutants emitted by vessels [3]. At present, there are two internationally popular means of reducing emissions from vessels: switching to shore power for vessels in port and using low-sulfur fuel [4].
As early as 2014, U.S. Law has implemented mandatory restrictions on the number of transfers to shore power for ships calling at California ports, covering cargo ships, container ships and cruise ships. In July 2019, the Ministry of Transport and other environmental protection sectors of China also issued a series of regulatory policies for vessels calling at ports to switch to shore power. Subsequently, Hong Kong, Shenzhen and Guangzhou released a series of subsidy policies to give different subsidies to vessels that switch to shore power and to ports that renovate shore power facilities, aiming to increase the motivation of ports and shipping enterprises to reduce emissions. The emission reduction effect of switching to shore power for vessels in port is significant, but the construction cost of shore power equipment in port and the cost of renovation of ship facilities are expensive.
Switching to low sulfur fuel for vessels can effectively reduce and emissions from vessels [5, 6]. In May 2019, the IMO released a mandatory sulfur restriction requiring that starting from January 1, 2020, the sulfur content of marine fuel for vessels outside the specific Emission Control Area (ECA) does not exceed 0.5%. In October 2019, the Ministry of Transport and the environmental protection departments of China released the regulation on sulfur restriction of fuel for vessels, which stipulates that from January 1, 2020, the sulfur content of marine fuel used by vessels on international voyages entering port waters in China shall not exceed 0.5% [7]. In December 2019, the European Commission released "The European Green Deal", which calls for zero emissions from vessels calling at ports by 2030. In December 2022, The MEPC has established the Mediterranean ECA, requiring that from 1 May 2025, vessels should use marine fuel with less than 0.1% sulfur content in the ECA. A large number of studies have shown that the enactment of such regulatory policies is very effective and has resulted in significant environmental benefits for port cities and residents.
The application of transferring low-sulfur fuel to vessels calling at ports is extremely widespread, but the challenges encountered are: insufficient supply of low sulfur fuel in some ports, the cost of retrofitting ship equipment and low sulfur fuel is extremely high. Therefore, port authorities have adopted various subsidy policies to increase the incentive for vessels calling at ports. The Port of Shenzhen in China has implemented a 75% or 100% fuel price differential subsidy for vessels that switch to low-sulfur fuel with 0.1% sulfur content in 2019 if the port's supply of low-sulfur fuel with 0.5% is insufficient. In this scenario, the study is essential when stricter fuel regulation policies are planned, or when compliant fuel supplies are inadequate and shipping companies are in a slump.
Up to now, there has been a great deal of research on ship exhaust emission control, and these studies mainly focus on the establishment of vessel-source emission inventories [8-11]. At present, a bottom-up approach to calculating emissions from vessels has become very popular [12-15]. Taking Port of Oslo as an example, López-Aparicio et al. [16] used a classic bottom-up approach to estimate the emissions of , , , , , and from vessels and explored the impact of emission reduction measures on air pollutant emissions, including switching to shore power, speed optimization and the use of LNG. Zhang et al. [17] calculated the vessel-source emissions, evaluated it’s impact on air quality in Portugal, and finally revealed that air pollutants emitted from unidentified vessels accounted for about 49% of the total emissions from Pearl River. Monteiro et al. [18] assessed the impact of vessel emissions on air quality in Portugal and simulated the marine emission scenarios by using the WRF-CHIMERE system. Chen et al. [19] developed the vessel-source emission inventory in Qingdao port, and the WRF model was applied to investigate the impact of vessel-source emissions on the environment of Qingdao port. Tichavska et al. [20] applied the classic STEAM to calculate , , and emissions from vessels in ports such as St. Petersburg and Hong Kong ports based on data collected by automatic identification system (AIS), and finally they suggested the need to revise the existing emission reduction policies.
It was found that there were some differences in the ship exhausts emissions using different models. Kwon et al. [21] applied two methods to calculate the emissions from vessels entering and leaving Incheon port, one is the fuel consumption method and the other is the emission calculation method based on the basic activities of vessels. The study has shown that emissions estimated by the fuel consumption method are typically lower than that based on the vessel's activities. Ekmekcioğlu et al.[22] has collected AIS data for vessels arriving at Kocaeli port from 2017 to 2018, calculated the emissions produced by these vessels using ENTEC method and AERMOD model, and found that the emissions estimated by the ENTEC method are not accurate, and showed that the emission factor of in the ENTEC method should be corrected.
Ship exhaust emissions and their external costs have also been a hot topic in recent years. Dragovic et al. [23] analyzed vessel-source emissions as well as external costs in two Nordic cruise ports and found that factors, such as berth availability and berth accessibility, mutually affect the level of ship emissions. Progiou et al. [24] estimated the emissions in the Piraeus port, calculated the external costs, and showed that the increase in emissions from the passenger port is mainly due to the increase of the number of ship calls, while the decrease in emission levels is mainly due to the significant reduction in the sulfur content of the marine fuel.
Regulatory policies issued by the maritime sectors can effectively reduce the vessel-source emissions [25-27], and it is urgent to improve the detection technology and adjust the regulatory policies released by maritime departments [28]. Jiang et al. [29] constructed an evolutionary game model to analyze the difference in benefits obtained by the government and shipping companies, and the study showed that lower costs for switching to low-sulfur marine fuel can help improve the effectiveness of emission reduction measures. Meng et al. [30] has built an evolutionary game model, and concluded that measures such as government regulation and implementation of subsidies to shipping enterprises can help improve the emission reduction effect. By developing a pricing decision model, Lin et al. [31] revealed that companies that only consider revenue maximization get lower revenue returns compared to liner companies that focus on green emission reduction strategies. Yu et al. [32] focused on the cost-benefit problems, and applied both cooperative and non-cooperative game theory to show that regional collaborative mode is much more effective compared to independent non-cooperative mode. In reality, many shipping companies choose to switch to low-sulfur marine fuel, install scrubbers, or refuel with LNG to reduce air pollutants from vessels. However, because many shipping enterprises lack sufficient funds for renovation, more shipping companies choose to use low sulfur marine fuel. Zhou et al. [33] argue that switching to low-sulfur marine fuel puts a lot of economic pressure on shipping enterprises, and government subsidies help to motivate these companies to adopt the strategy of switching to low-sulfur marine fuel for emission reduction.
In conclusion, at present, most of the literatures on the reduction of vessel-source air pollutants in ports are mostly focuses on ship emission inventories and multi-stakeholder game strategies. Studies analyzing the mechanism of competition and cooperation in ports considering with the actual low-sulfur fuel subsidy policies released by the maritime sectors are relatively scarce. Moreover, in many literatures, the values of the parameters taken for the case study differ significantly from the real situation. Therefore, this work firstly constructs a simultaneous game model and a sequential game model for ports considering different subsidy ratios, then analyzes the AIS data of container ships in Shanghai Port and Ningbo Zhoushan Port, and finally, develops a case study by collecting the operation data of ports. The study can be used as a reference for maritime sectors and environmental protection agencies to develop scientific and feasible incentive policies.
2. Materials and Methods
2.1. Non-Cooperative Game Models in Ports for Air Pollution Control Considering Low-Sulfur Marine Fuel Subsidies
Assumption 1. For the simultaneous game, the participants are ports 1 and 2, the two ports make price decisions independently and unaware of the competitor's price at the time of the decision. The payment is calculated by a profit function.
Assumption 2. For the sequential game, the participants are Port 1 and Port 2. Port 1 is a Leader, while Port 2 is a Follower. Port 1 makes the price decision first, while Port 2 makes the decision based on the observed price of Port 1. Port 1 set service prices knowing that Port 2 will take the follow-up strategy. The payment is calculated by a profit function [34].
Assuming that there are two ports in the region, according to the ECA’s regulation policy issued by the Ministry of Transport in 2018, vessels calling at port should switch to low-sulfur marine fuel. The parameters, decision variables and functions in the model are listed in Table 1.
The According to the Bertrand model [34], the demand function of port i is shown as follows
where, . denotes the price impact factor of the port on its own throughput and denotes the price impact factor of the port on its competitors. As the impact on itself is much greater compared to the competitor, so .
indicates the total consumption of fuel by berthing vessels in port i, which can be shown as follows
Where, denotes the average fuel consumption per hour per ship (ton/hour), and represents the total berthing time for all the vessels regardless of congestion (hour). In fact, is equal to the average power of all auxiliary engines (AE, kW) multiplied by the load factor (LF, %) and the average hourly fuel consumption of auxiliary engines (ton/kW·hour).
The subsidy given by port i to the vessels switching to ultra-low marine fuel is
Let , it follows that
The profit function of port i is
After some simplification, it turns out that
2.2. A simultaneous Game Model for Two Ports
The two ports simultaneously make price decisions that maximize the profits of the ports, and the price response function of the two ports to their competitors can be obtained as
Let , the optimal price is shown as
Inserting the optimal price into the demand function, the optimal throughput of the two ports can be obtained as
Substituting equations (9)-(12) into equation (6) respectively, the profit functions of the two ports can be easily calculated.
2.3. A Sequential Competitive Game Model for Two Ports
The leader Port 1 makes the price decision first, and the follower Port 2 sets price according to Port 1's decision such that Port 2's profit is maximized, i.e.
The price response function for port 2 is shown as follows
Port 1 predicts the follower behavior of Port 2, and then makes a price decision that maximizes Port 1's profit, thus
where, represents the price response function of port 2, so the optimal price of sequential competition between the two ports is found to be
Inserting the optimal price into the demand function, the optimal throughput in the sequential competition model of the two ports can be obtained as
Substituting equations (16)-(19) into equation (6) respectively, the profit functions of the two ports can be easily calculated.
3. Results
This section may be divided by subheadings. It should provide a concise and precise description of the experimental results, their interpretation, as well as the experimental conclusions that can be drawn.
3.1. Analysis of the Factors Influencing the Optimal Prices of Ports
Proposition 1.
For both the simultaneous and the sequential games, the optimal prices , , and of container services are positively related to and and negatively related to . The optimal prices , , and are positively correlated with the difference of fuel prices , low sulfur fuel subsidy ratio , , and the fuel consumption rate of a ship at berth, , and negatively correlated with the port handling efficiency , .
Proof:
The optimal prices in the simultaneous game competition model are shown as
The optimal prices of the two ports in the sequential competition model are shown as follows
Using MATLAB software to find the first order derivatives separately, it is easy to find that the conclusion holds. The study shows that reducing the difference in fuel prices, decreasing the ratio of low-sulfur fuel subsidies, and improving the efficiency of container handling at ports can keep the optimal price of container services lower. □
3.2. Comparative Analysis of the Simultaneous Game Model and Sequential Game Model
Proposition 2.
If the optimal service price of Port 1 in the sequential game is higher than the service price in the simultaneous game, Port 2 will choose to increase the service price in the sequential competition.
Proof:
Based on the calculated optimal service prices of the two models, the difference between the optimal service prices and for sequential competition and simultaneous game competition are calculated respectively
Therefore,
In this case, if , then . This means that if Port 1 as the "Leader" implements a low-sulfur fuel subsidy policy for vessels calling at the port, the price change trend of Port 2 as the "Follower" is the same as that of Port 1, which means that Port 1 has a leading role in adopting the subsidy policy. □
Proposition 3.
When the optimal service price of the leader Port 1 in sequential competition is higher than the optimal service price of the simultaneous game, the optimal throughput of Port 1 in sequential competition is lower than the throughput in the simultaneous game, but the profit gained by Port 1 in sequential competition is higher than the profit gained by the simultaneous game.
Proof:
Using MATLAB software, it is obtained that
Thus,
It can be seen that if Port 1 chooses to raise the price in the sequential game, i.e., , then 2, thus , then , which means that when the optimal service price in sequential competition is higher than that in simultaneous game, the optimal throughput of port 1 in sequential competition decreases compared to the throughput in simultaneous game, and the optimal strategy for the follower Port 2 makes its optimal throughput in sequential game greater than the throughput in simultaneous game.
Since , it follows that
It can be easily deduced that if the optimal service price in sequential game in Port 1 is higher than that in simultaneous game, the profit in sequential game in Port 1 is greater than that in simultaneous game. □
There are many factors affecting the difference between the optimal profits of Port 2, and it is theoretically impossible to determine whether the optimal profits of Port 2 increase during the sequential competition, so this study conducts a numerical analysis in the case study section.
4. Discussion and Case Analysis
The AIS data of the vessels calling at these two ports were provided from HiFleet, and the data such as the number of vessels calling at the ports were divided into 5 categories according to the gross tonnage of the vessels. Then, the values of parameters such as the average handling efficiency of container bridge cranes were analyzed by consulting a large number of statistical yearbooks and other reference materials. Finally, a case study of air pollution prevention in ports was conducted.
4.1. Data Source
For simplicity, it is assumed that port 1 is Shanghai port and port 2 is Ningbo Zhoushan port, and then, the AIS data of container ships calling at the two ports are analyzed respectively.
4.1.1. AIS Data of Container Ships in Shanghai Port and Ningbo Zhoushan Port
With the support of HiFleet, the AIS data of container ships calling at Shanghai and Ningbo Zhoushan ports in January 2018 were obtained in this study, and the data about callsign, gross tonnage, net tonnage, the main engine power, building year, etc. were obtained. The sample AIS data of these container ships are given in Table 2.
According to statistics, a total of 603 container ships called at Shanghai port in January 2018. Removing the abnormal data of 26 vessels, the number of ships analyzed in the case study is 577. The data shows that the number of container ships with a gross tonnage greater than 50,000 is the highest, with 285 ships in total, accounting for 49.39%. The container ships have the second largest number with the gross tonnage lies within [10,000, 49,999], with a total of 218 vessels, accounting for 37.78%. There are fewer container ships below 2,999 GT, accounting for 0.17%, as shown in Table 3.
The number of container ships calling at Ningbo Zhoushan port is 229 in January. The number of valid data after excluding abnormal values is 221. The container ships calling at Ningbo Zhoushan Port have the most ships in the range of 50,000 gross tons or above, with 168 ships in total, accounting for 76.02%. The next is the ships in the range of 10,000-49,999 GT, with a total of 46 ships, accounting for 20.81%. There are no container ships below 2,999 GT, and the detailed results are shown in Table 4.
4.1.2. Price of Marine Fuel
Take VLSFO and MGO as examples, the Emission Control Area implementation plan requires vessels calling at port to use fuel with no more than 0.5% sulfur content. If VLSFO is not available, vessels calling at port are required to refill with MGO with 0.1% sulfur content. The vessels can apply for economic subsidies from the port where the vessels are calling based on the fuel price difference. The port subsidizes container ships that switch to MGO at a percentage of the difference in fuel price. By using Clarkson to get the price of bunker fuel, it is obtained that from 2019 to early 2023, the average bunker prices of VLSFO and MGO in Shanghai port is USD 587/ton and USD 728/ton, respectively.
Therefore, the bunker prices of VLSFO and MGO are taken as million USD/ton and million USD/ton, respectively, so the subsidy cost of Shanghai port and Ningbo Zhoushan port is
where is the subsidy ratio, , is the hourly fuel consumption of container ships in berthing period, respectively, and , are the handling efficiency of each bridge crane per hour, and the monthly throughput of containers, respectively.
4.1.3. Parameter Values
In 2018, the container throughput of Shanghai port is 42.01million TEUs, and the container throughput of Ningbo Zhoushan port is 26.35million TEUs, therefore, the average regional monthly average demand million TEUs. Referring to Negenborn and Zheng [35], the price impact factor is , the competitor's price impact factor . The service cost and fuel subsidy ratio per TEU for Shanghai port and Ningbo Zhoushan port are taken as USD/TEU, USD/TEU,, i.e., the fuel difference is fully subsidized. The average fuel consumption per hour per ship during berthing period, , is taken to be 0.20, 0.20, 0.21, 0.54 and 0.63 ton/hours, for each of the five gross tonnage classifications. The larger the gross tonnage, the greater the fuel consumption rate is. Up to now, it is reported that each crane in Yangshan port area has a daily handling quantity of more than 1000 TEUs, so it is assumed that the average handling efficiency is about 42 TEUs for each crane per hour. The handling efficiency of cranes in Shanghai and Ningbo Zhoushan Ports are taken as million TEUs/hour, and million TEUs/hour. Table 5 summarizes the values of the parameters used in the case study.
4.2. A Case Study of Non-Cooperative Game Considering Low Sulfur Fuel Subsidies in Ports
In this section, firstly, the case analysis of the simultaneous game competition model and the sequential competition model are conducted respectively. Then the results of the empirical analysis of the two competitive models are compared to further refine the mechanism of the impact of the low-sulfur fuel subsidy policy on the optimal price, throughput and profit of the ports.
4.2.1. Discussion of the Case Analysis
To analyze the effects of gross tonnage of ships on the optimal price (), optimal throughput () and optimal profit () of container services under two competition models, the ships are first classified according to gross tonnage. Then, the optimal service price, optimal throughput and optimal profit of Shanghai port and Ningbo Zhoushan port under the two game competition models are calculated. Finally, the obtained numerical results are compared.
- Simultaneous competition between two ports.
The results of the case study are shown in Table 6. When the two ports play the simultaneous game, the increase of the gross tonnage of ships makes the optimal service price of Shanghai port and Ningbo Zhoushan port increase slightly, and the optimal throughput of the leader port 1 decrease. The larger the gross tonnage and the more the number of ships, the more significant the effect is. The optimal throughput and profit of port 2 show a trend of decreasing with the increase of gross tonnage.
- 2.
- Sequential competition between two ports
The results are shown in Table 7. When the two ports compete sequentially, the increase in the gross tonnage of ships makes the optimal service prices of Shanghai and Ningbo Zhoushan ports increase slightly, and the optimal throughput and optimal profit of leader port 1 decrease. With the increase of gross tonnage of ships, the container throughput and optimal profit of port 2, show a trend of decreasing, and the larger the gross tonnage and the more the number of ships, the more significant the influence. This result is similar to the result when two ports compete simultaneously.
- 3.
- Comparative analysis of the two non-cooperative game models
The results of the comparative analysis are shown in Table 8. indicates that regardless of whether the gross tonnage of ships takes a large or small value, the optimal service price of container ships increases in sequential competition compared to simultaneous competition, regardless of whether it is the port of Shanghai or Ningbo Zhoushan. shows that and are positively correlated, whether the container service price of Shanghai port increases or decreases, Ningbo Zhoushan port will take corresponding follow-up measures. Moreover, the fluctuation of the optimal service price of Shanghai port, which plays the role of "Leader", is much larger than the fluctuation of the optimal service price of Ningbo Zhoushan port.
and indicate that the optimal throughput of Shanghai port decreases and the optimal throughput of Ningbo Zhoushan port increases in sequential competition compared to simultaneous competition regardless of whether the gross tonnage is taken as large or small. indicates that for container ships, the decrease in the optimal throughput of Shanghai port is greater than the increase in that of Ningbo Zhoushan port.
and indicates that the optimal profit of both Shanghai and Ningbo Zhoushan ports increases in sequential competition compared to simultaneous competition, regardless of whether the value of gross tonnage is taken as large or small. means that the trend of the optimal profit of the two ports is the same, and the difference of the optimal profit of Shanghai port is smaller than the difference of that of Ningbo Zhoushan port.
4.2.2. The Impact of the Subsidy Ratios on the Profit of the Two Ports
The impact of the subsidy percentage ratio on the profits of the two ports is analyzed using container vessels of 50,000 gross tonnage or more as an example. Figure 1 vividly depicts the interaction between , and the low sulfur fuel subsidy ratios, . The figure shows that the profit gained by Port 1 is much greater than the profit gained by Port 2 during the simultaneous game. The numerical results show that the profit of port 1 is positively correlated with and negatively correlated with , and vice versa. The implication is that the implementation of low-sulfur fuel subsidies by a port can attract more ships to call at this port, making it more profitable.
Figure 2 reveals that the conclusions in the sequential game are similar to those in the simultaneous game. The low sulfur fuel subsidy ratio has a positive effect on the profit of the port itself, to the detriment of competitor ports. The profit gained by the leader port is higher than those gained by the follower port.
Figure 3(a) illustrates that regardless of the subsidy ratios, there is always , i.e., , which means that if the leader port 1 chooses to raise prices in the sequential game, the optimal profit of the leader port 1 in the sequential competition is higher than the profit obtained in the simultaneous competition. Figure 3(b) shows that regardless of the subsidy ratios, there is always holds, i.e., . Moreover, the profit difference for port 1 is positively correlated with and negatively correlated with , and vice versa. That is to say, the greater the port's subsidy ratio, the larger the difference in profit between the two games becomes, implying that the sequential game is more favorable to this port in this scenario.
4.2.3. Uncertainty Analysis
This study takes container ships in Shanghai port and Ningbo Zhoushan port as an example, and analyzes the influence of container handling cost, fuel subsidy ratio, fuel price, price impact factor of throughput and price impact factor of competitors on service price, throughput and profit. However, in reality, bunker prices, subsidy rates, handling costs, exchange rates and other factors will change, which will have an impact on service prices, throughput and profits, and maritime sectors should take these factors into account for decision-making.
4.3. Conclusions
This study constructs a simultaneous game model and a sequential game model for air pollution prevention considering low-sulfur fuel subsidies, and conducts a case study of Shanghai port and Ningbo Zhoushan port as examples, and the findings are shown below:
(1) If Shanghai Port, which plays the role of Leader, implements the price increase strategy of service price first, Ningbo Zhoushan Port will also follow the price increase strategy, but the price increase is lower than that of Shanghai Port, resulting in the decrease of the throughput of Shanghai Port and the increase of the throughput of Ningbo Zhoushan Port. Moreover, the decrease of the throughput of Shanghai Port is larger than the increase of the throughput of Ningbo Zhoushan Port.
(2) The increase in the gross tonnage makes the optimal service prices of the two ports under both simultaneous and sequential games, increase, the optimal throughput and profit of leader port 1 decrease, and the throughput and profit of follower port 2 first increases and then decreases. However, the absolute changes in optimal price, throughput, and profit of the two game models become smaller, and the relative changes do not change much when the gross tonnage of ships increases.
(3) The profit difference of the leader port 1 in both sequential and simultaneous game models is positively related to the port's own subsidy ratio and negatively related to the competitor's subsidy ratio, and vice versa. The results show that the subsidized behavior of the port is also exemplary and will prompt neighboring ports to implement subsidies as well to attract more ships to call at the port.
Funding
This work was supported by the Key Projects of Shanghai Soft Science Research Program (No. 18692106600).
Acknowledgments
Sincerely thanks the editors and the reviewers, especially for their efforts to improve the quality of the work.
References
- Mirabelli, M. C.; Boehmer, T. K. , Damon; S. A.; Sircar, K. D.; Wall, H. K., Yip, F. Y.;... & Garbe, P. L. Air quality awareness among US adults with respiratory and heart disease. Am. J. Prev. Med 2018, 54, 679–687. [Google Scholar] [CrossRef] [PubMed]
- Cai, Y.; Hodgson, S.; Blangiardo, M.; Gulliver, J.; Morley, D.; Fecht, D. & Elliott, P. Road traffic noise, air pollution and incident cardiovascular disease: a joint analysis of the hunt, epic-oxford and UK biobank cohorts. Environ Int 2018, 114, 191–201. [Google Scholar] [CrossRef] [PubMed]
- Chen, D.; Zhao, N. , Lang; J., Zhou, Y.; Wang, X.; Li, Y.; Zhao, Y.; Guo, X. Contribution of ship emissions to the concentration of PM2.5: a comprehensive study using AIS data and WRF/Chem model in Bohai Rim Region, China. Sci. Total Environ 2018, 610-611, 1476–1486. [Google Scholar] [CrossRef]
- Peng, Y.; Dong, M.; Li, X. Cooperative optimization of shore power allocation and berth allocation: A balance be-tween cost and environmental benefit. J. Clean Prod 2020, 279, 123816. [Google Scholar] [CrossRef]
- Durmaz, M. , Kalender, S.S., Ergin, S. Experimental study on the effects of ultra-Low sulfur diesel fuel to the exhaust emissions of a ferry. Fresen. Environ. Bull (PDF) Experimental Study on the Effects of Ultra-Low Sulfur Diesel Fuel to the Exhaust Emissions of a Ferry (researchgate.net). 2017, 26, 5833–5840. [Google Scholar]
- Nicholas, R. Gysel et al. Detailed analysis of criteria and particle emissions from a very largecrude carrier using a novel ECA fuel. Environ. Sci. Technol 2017, 51, 1868–1875. [Google Scholar] [CrossRef]
- The Ministry of Transport of China, Implementation Scheme of the Domestic Emission Control Areas for Atmospheric Pollution from Vessels 2018. Implementation Scheme of the Domestic Emission Control Areas for Atmospheric Pollution from Vessels--China Maritime Safety Administration (msa.gov.cn).
- Shi, K.; Weng, J. Impacts of the COVID-19 epidemic on merchant ship activity and pollution emissions in Shanghai port waters. Sci. Total Environ 2021, 790, 148198. [Google Scholar] [CrossRef]
- Weng, J.; Shi, K.; Gan, X.; Li, G.; Huang, Z. Ship emission estimation with high spatial-temporal resolution in the Yangtze River estuary using AIS data. J. Clean. Prod 2020, 248, 119297. [Google Scholar] [CrossRef]
- Wan, Z.; Zhang, Q.; Xu, Z.; Chen, J.; Wang, Q. Impact of emission control areas on atmospheric pollutant emissions from major ocean-going ships entering the Shanghai Port, China. Mar. Pollut. Bull 2019, 142, 525–532. [Google Scholar] [CrossRef]
- Wan, Z.; Ji, S.; Liu, Y.; Zhang, Q.; Chen, J. Wang, Q. Shipping emission inventories in China’s Bohai Bay, Yangtze River Delta, and Pearl River Delta in 2018. Mar. Pollut. Bull 2020, 151, 110882. [Google Scholar] [CrossRef]
- Schwarzkopf, D.A; Petrik, R.; Matthias, V.; Quante, M.; Majamäki, E. , Jalkanen J.P. A ship emission modeling system with scenario capabilities. Atmos. Environ-X 2021, 12, 100132. [Google Scholar] [CrossRef]
- Toscano, D.; Murena, F.; Quaranta, F.; Mocerino, L. Assessment of the impact of ship emissions on air quality based on a complete annual emission inventory using AIS data for the port of Naples. Ocean. Eng 2021, 232, 109166. [Google Scholar] [CrossRef]
- Yang, L.; Zhang, Q.; Zhang, Y.; Lv, Z.Y.; Wang,Y. N.; Wu,L.; Feng, X.; Mao,H.J. An AIS-based emission inventory and the impact on air quality in Tianjin port based on localized emission factors. Sci. Total Environ 2021, 783, 146869. [Google Scholar] [CrossRef]
- Murenaa, F.; Mocerinob, L.; Quarantab, F.; Toscanoa, D. Impact on air quality of cruise ship emissions in Naples, Italy. Atmos. Environ 2018, 187, 70–83. [Google Scholar] [CrossRef]
- López-Aparicio, S.; Tønnesen, D.; Thanh, T.N.; Neilson, H. Shipping emissions in a Nordic port: assessment of mitigation strategies. TRANSPORT RES D 2017, 53, 205–216. [Google Scholar] [CrossRef]
- Zhang,Y. ; Fung, J.C.H.; Chan, J.W.M.; Lau. A.K.H. The significance of incorporating unidentified vessels into AIS-based ship emission inventory. Atmos. Environ 2019, 203, 102–113. [Google Scholar] [CrossRef]
- Monteiro, A.; Russo, M.; Gama, C.; Borrego, C. How important are maritime emissions for the air quality: At European and national scale. Environ. Pollut 2018, 242, 565–575. [Google Scholar] [CrossRef]
- Chen, D.; Wang, X.; Nelson, P.; Li, Y.; Guo, X. Ship emission inventory and its impact on the PM2.5 air pollution in Qingdao PortNorth China. Atmos. Environ 2017, 166, 351–361. [Google Scholar] [CrossRef]
- Tichavska, M.; Tovara, B.; Gritsenkob, D. Air emissions from ships in port: does regulation make a difference? Transp. Policy 2017, 75, 128–140. [Google Scholar] [CrossRef]
- Kwona, Y.; Limb, H.; Limc,Y. ; Lee, H. Implication of activity-based vessel emission to improve regional air inventory in a port area. Atmos. Environ 2019, 203, 262–270. [Google Scholar] [CrossRef]
- Ekmekçioğlu,A. ; Levent Kuzu, S.; Ünlügençoğlu, K.; Çelebi, U.B. Assessment of shipping emission factors through monitoring and modelling studies. Sci. Total Environ 2020, 743, 140742. [Google Scholar] [CrossRef] [PubMed]
- Dragovic, B.; Tzannatos, E.; Tselentis, V.; Meštrovic, R.; Škuric, M. Ship emissions and their externalities in cruise ports. Transport Res. D 2015, 61, 289–300. [Google Scholar] [CrossRef]
- Progiou, A.G.; Bakeas, E.; Evangelidou, E. Air pollutant emissions from Piraeus port: external costs and air quality levels. Transport Res. D 2021, 91, 102586. [Google Scholar] [CrossRef]
- Carr, E. W.; Corbett, J. J. Ship compliance in emission control areas: technology costs and policy instruments. Environ. Sci. Technol 2015, 49, 9584–9591. [Google Scholar] [CrossRef] [PubMed]
- Shi, K.; Weng, J.; Li, G. Exploring the effectiveness of ECA policies in reducing pollutant emissions from merchant ships in Shanghai port waters. Mar. Pollut. Bull., 2020, 155, 111164. [Google Scholar] [CrossRef] [PubMed]
- Bing, Q.; He, W.; Tian, Y. Ship emission reduction effect evaluation of air pollution control countermeasures. Transportation Research Procedia 2017, 25, 3606–3618. [Google Scholar] [CrossRef]
- Chen, W.; Yang, R. Evolving Temporal–Spatial Trends, Spatial Association, and Influencing Factors of Carbon Emissions in Mainland China: Empirical Analysis Based on Provincial Panel Data from 2006 to 2015. Sustainability 2018, 10, 74–84. [Google Scholar] [CrossRef]
- Jiang,B. ; Wang,X,Q.; Xue,H.L.; Li, J.; Gong, Y. An evolutionary game model analysis on emission control areas in China. Mar. Policy 2020, 118, 104010. [Google Scholar] [CrossRef]
- Meng, L.; Liu, K.; He, J.L.; Han; C. F.; Liu,P.H. Carbon emission reduction behavior strategies in the shipping industry under government regulation: A tripartite evolutionary game analysis. J. Clean Prod 2022, 378, 134556. [Google Scholar] [CrossRef]
- Lin, D.; and Juan, C.G. and Ng., M.W. Evaluation of green strategies in maritime liner shipping using evolutionary game theory. J. Clean Prod 2021, 279, 123268. [Google Scholar] [CrossRef]
- Yu, L.; Zheng, S.; and Gao, Q. Independent or collaborative management? Regional management strategy for ocean carbon sink trading based on game theory. Ocean Coast. Manage 2023, 235, 106484. [Google Scholar] [CrossRef]
- Zhou, Q.; Yuen, K.F. Low-sulfur fuel consumption: Marine policy implications based on game theory. Mar. Policy 2021, 124, 104304. [Google Scholar] [CrossRef]
- Dong, G.; and Zhong, D. Tacit collusion of pricing strategy game between regional ports: the case of Yangtze River economic belt [J]. Sustainability 2019, 11, 365. [Google Scholar] [CrossRef]
- Negenborn, R. R. & Zheng, S. Centralization or decentralization: a comparative analysis of port regulation modes. Transport Res. E 2014, 69, 21–40. [Google Scholar] [CrossRef]
Figure 1.
The impact of low sulfur fuel subsidy ratios on the profit of the two ports in simultaneous game. (a) Interaction between and the subsidy ratios and ; (b) Interaction between and the subsidy ratios and .
Figure 1.
The impact of low sulfur fuel subsidy ratios on the profit of the two ports in simultaneous game. (a) Interaction between and the subsidy ratios and ; (b) Interaction between and the subsidy ratios and .
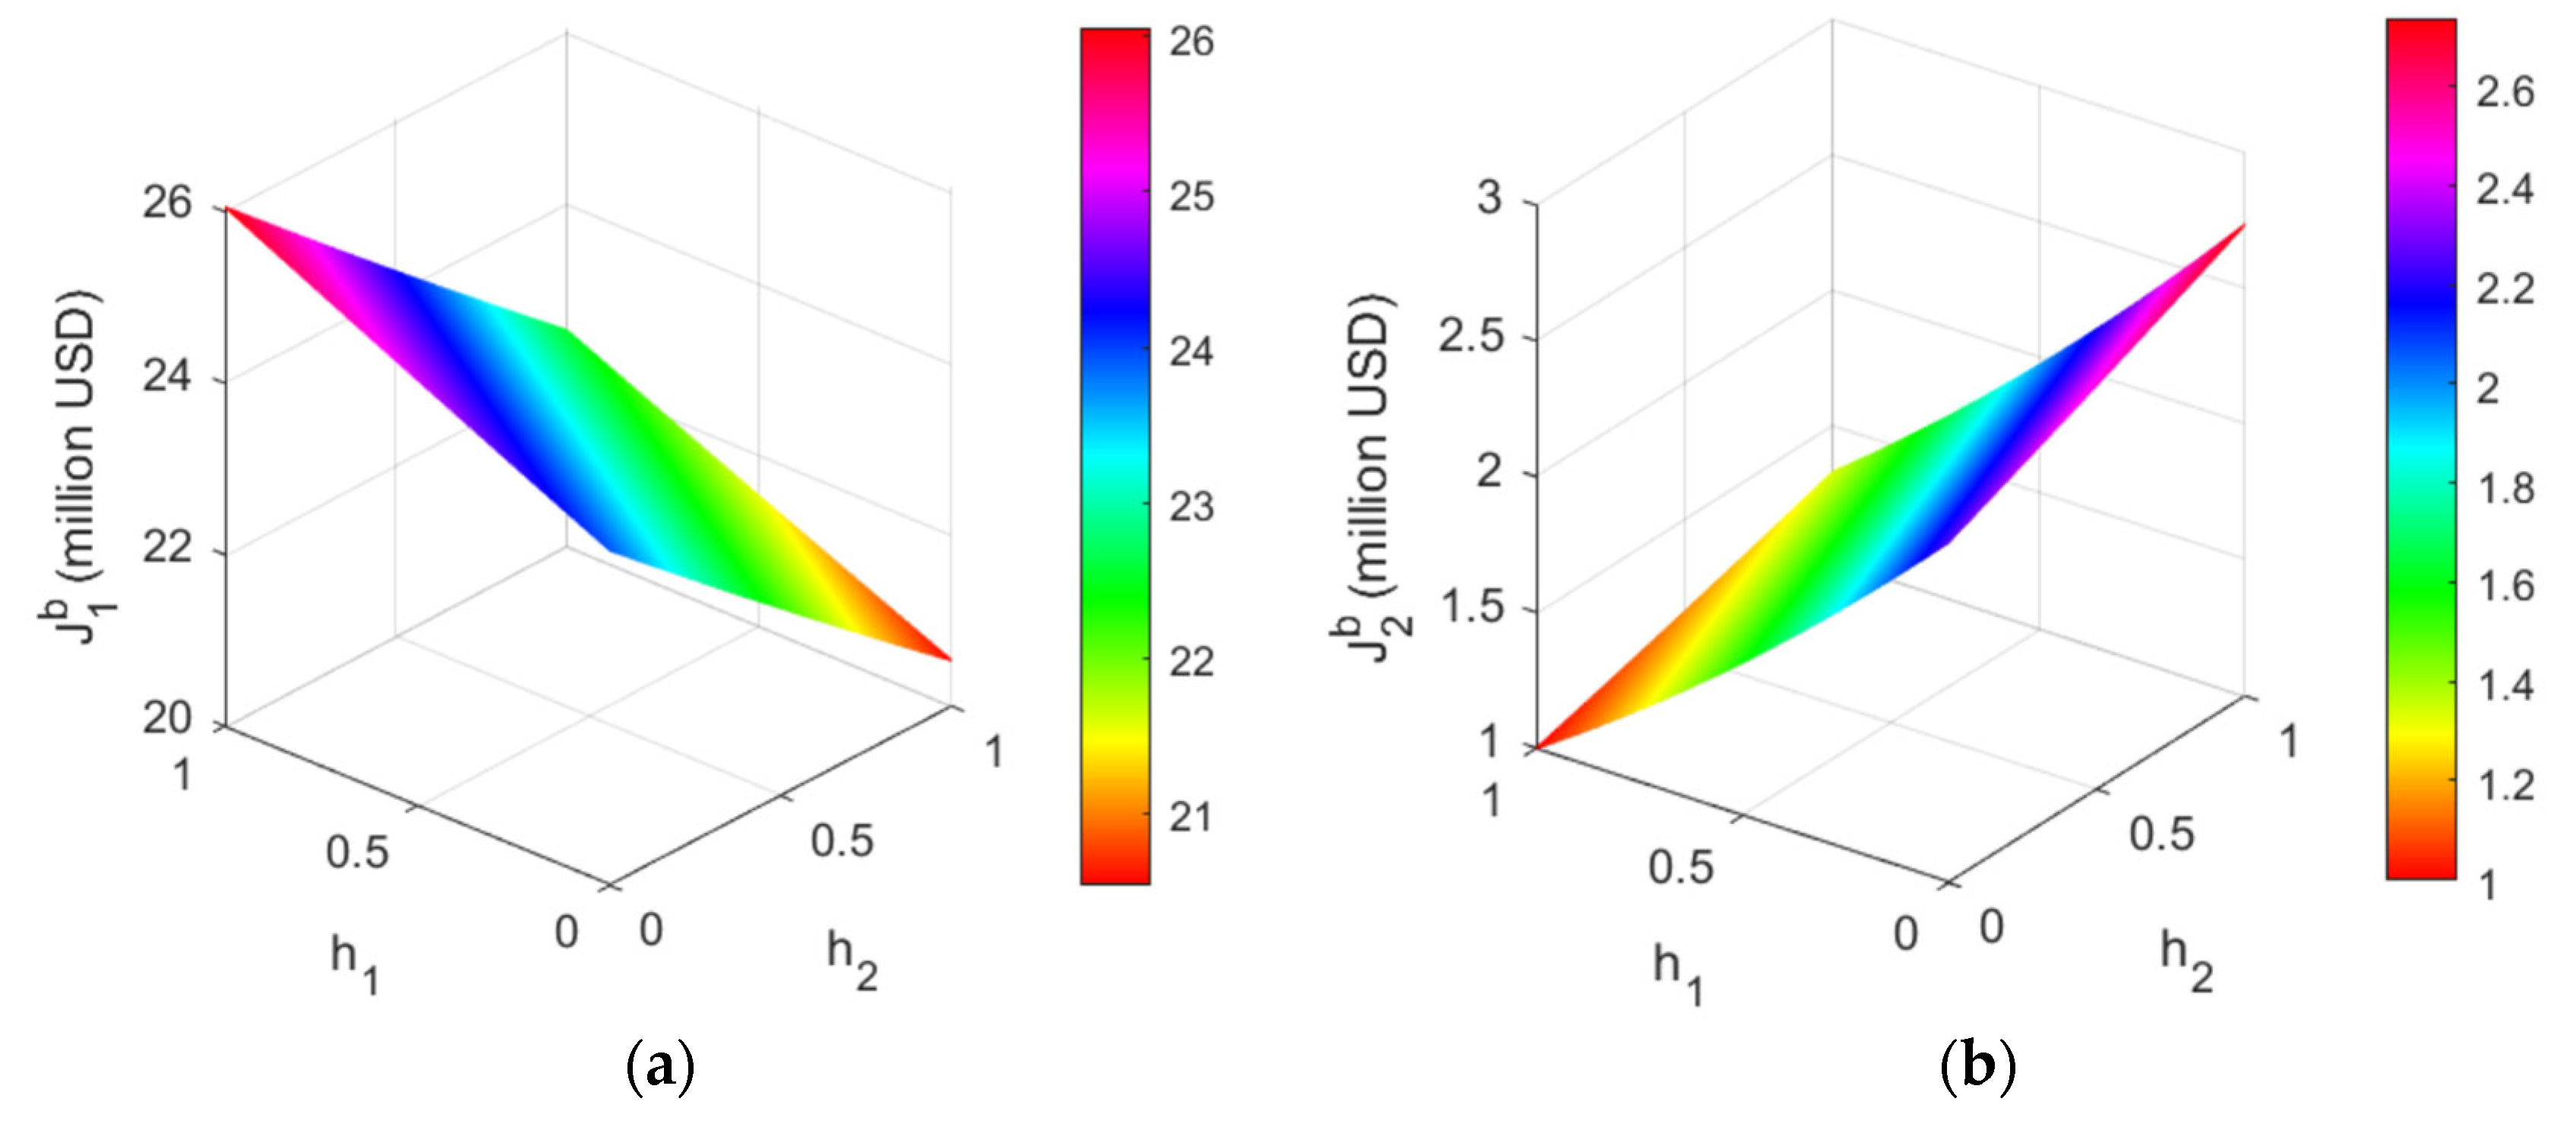
Figure 2.
The impact of low sulfur fuel subsidy ratios on the profit of two ports in sequential game. (a) Interaction between and the subsidy ratios and ; (b) Interaction between and the subsidy ratios and .
Figure 2.
The impact of low sulfur fuel subsidy ratios on the profit of two ports in sequential game. (a) Interaction between and the subsidy ratios and ; (b) Interaction between and the subsidy ratios and .
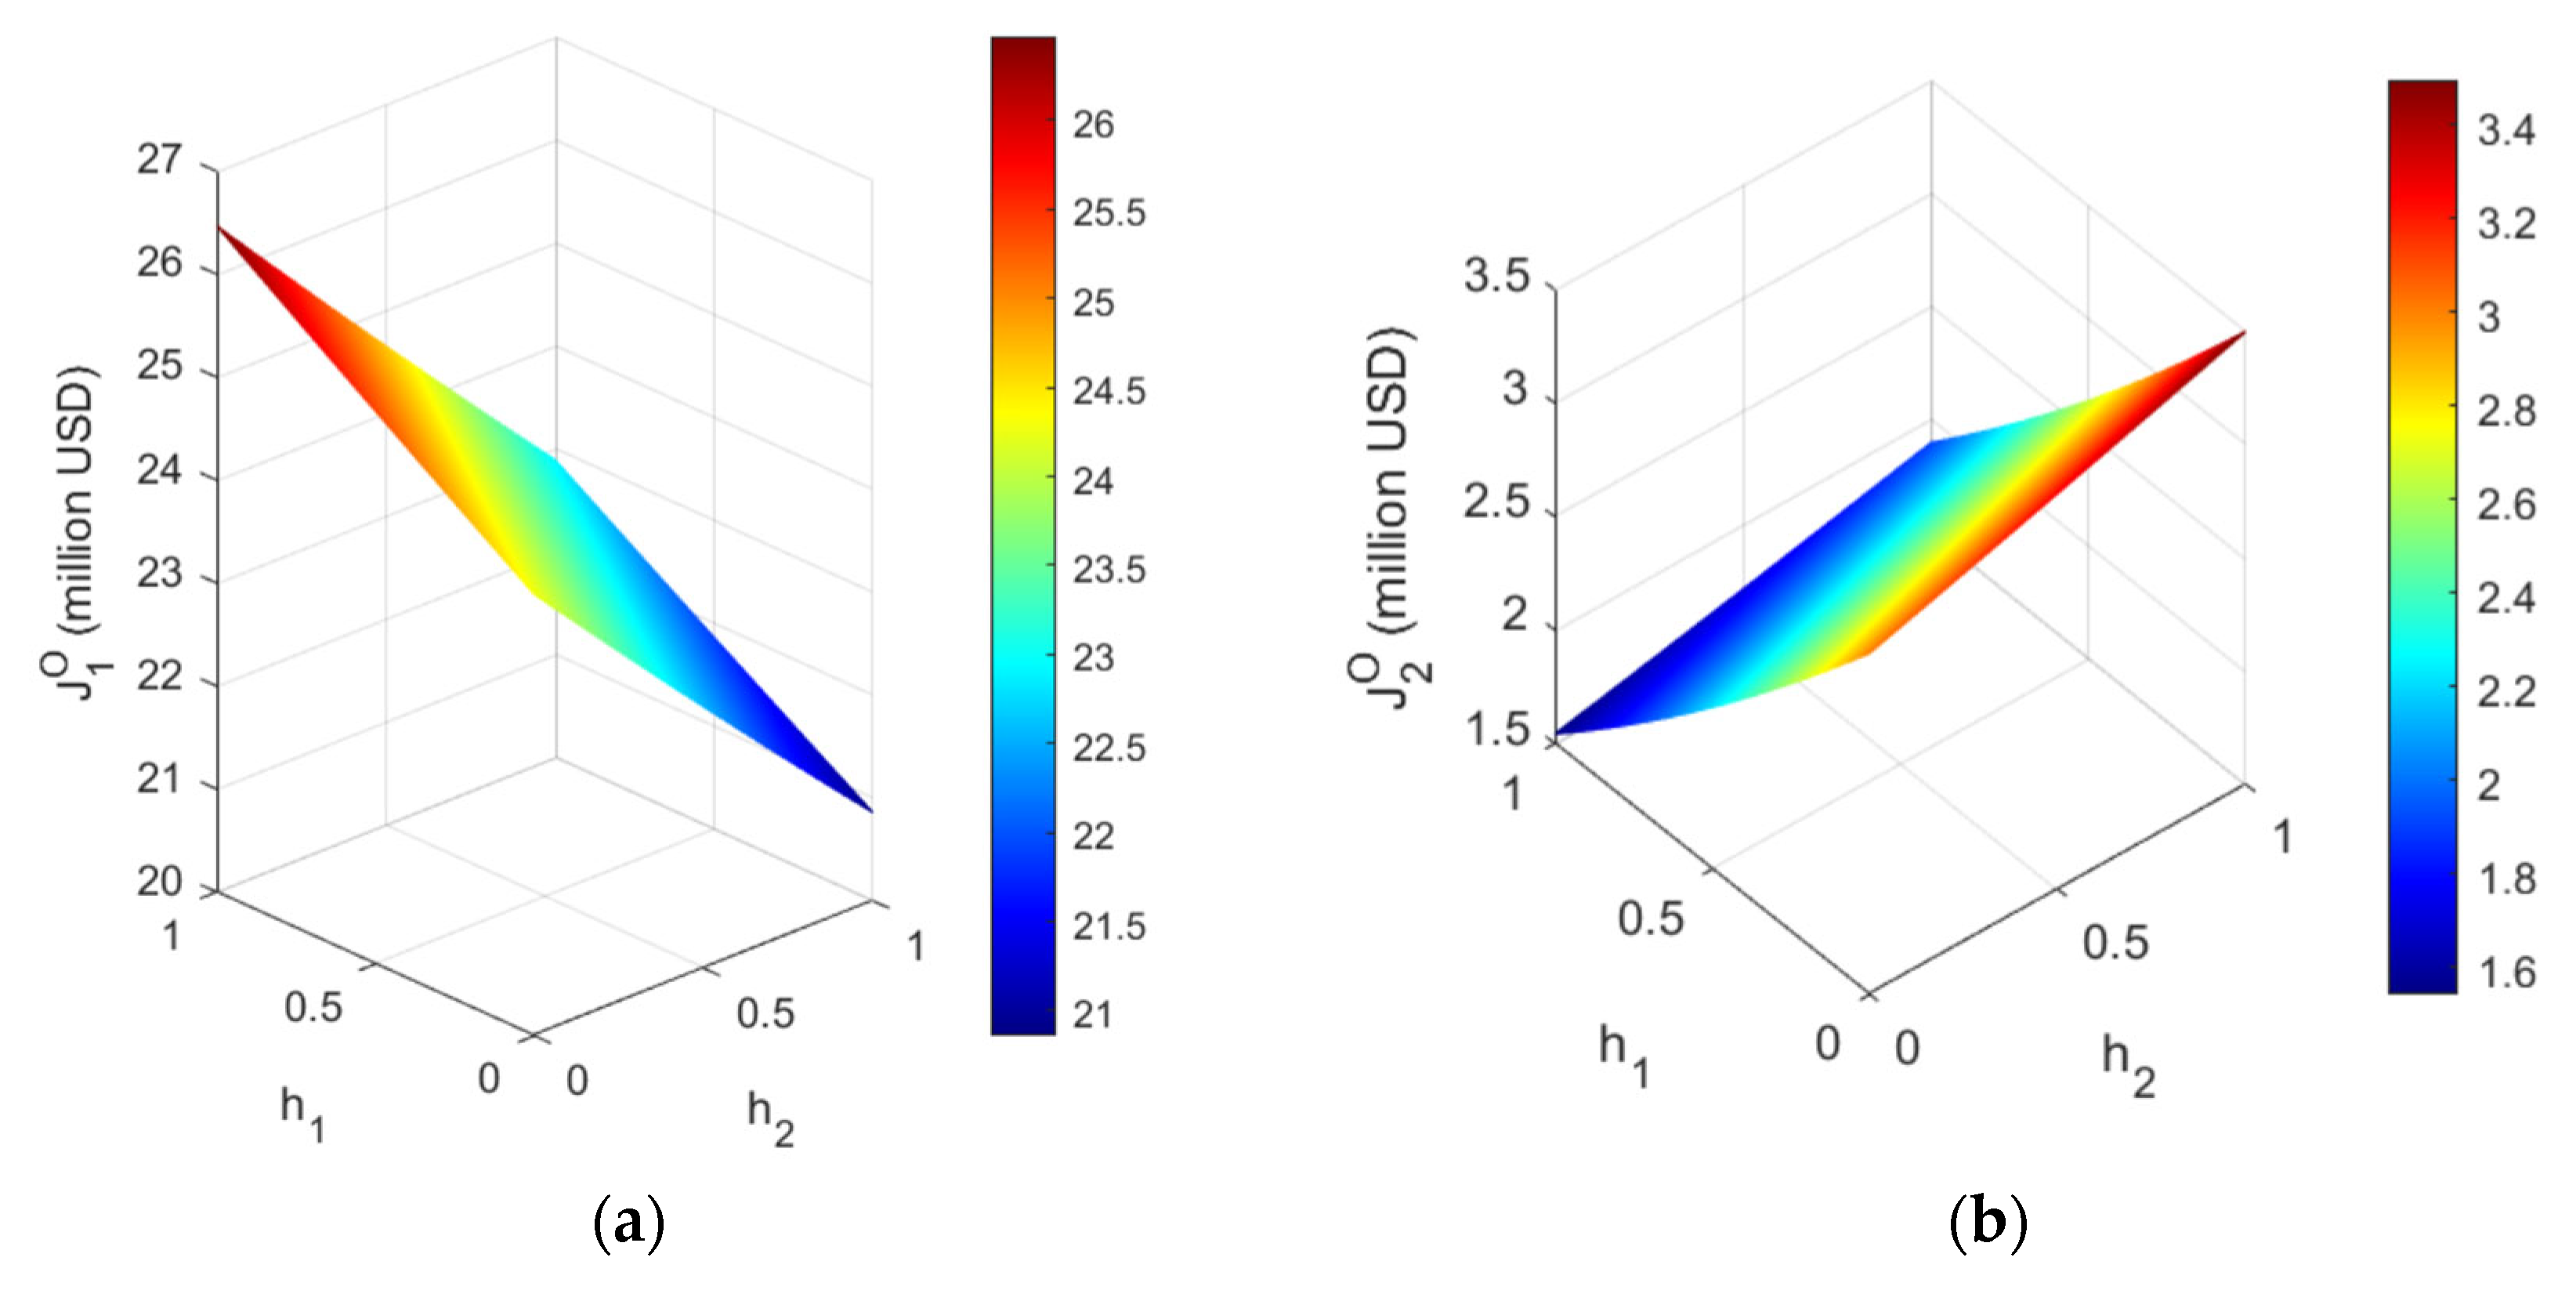
Figure 3.
The impact of fuel subsidy ratios on the difference in profit between two ports. (a) Interaction between and the subsidy ratios and ; (b) Interaction between and the subsidy ratios and .
Figure 3.
The impact of fuel subsidy ratios on the difference in profit between two ports. (a) Interaction between and the subsidy ratios and ; (b) Interaction between and the subsidy ratios and .
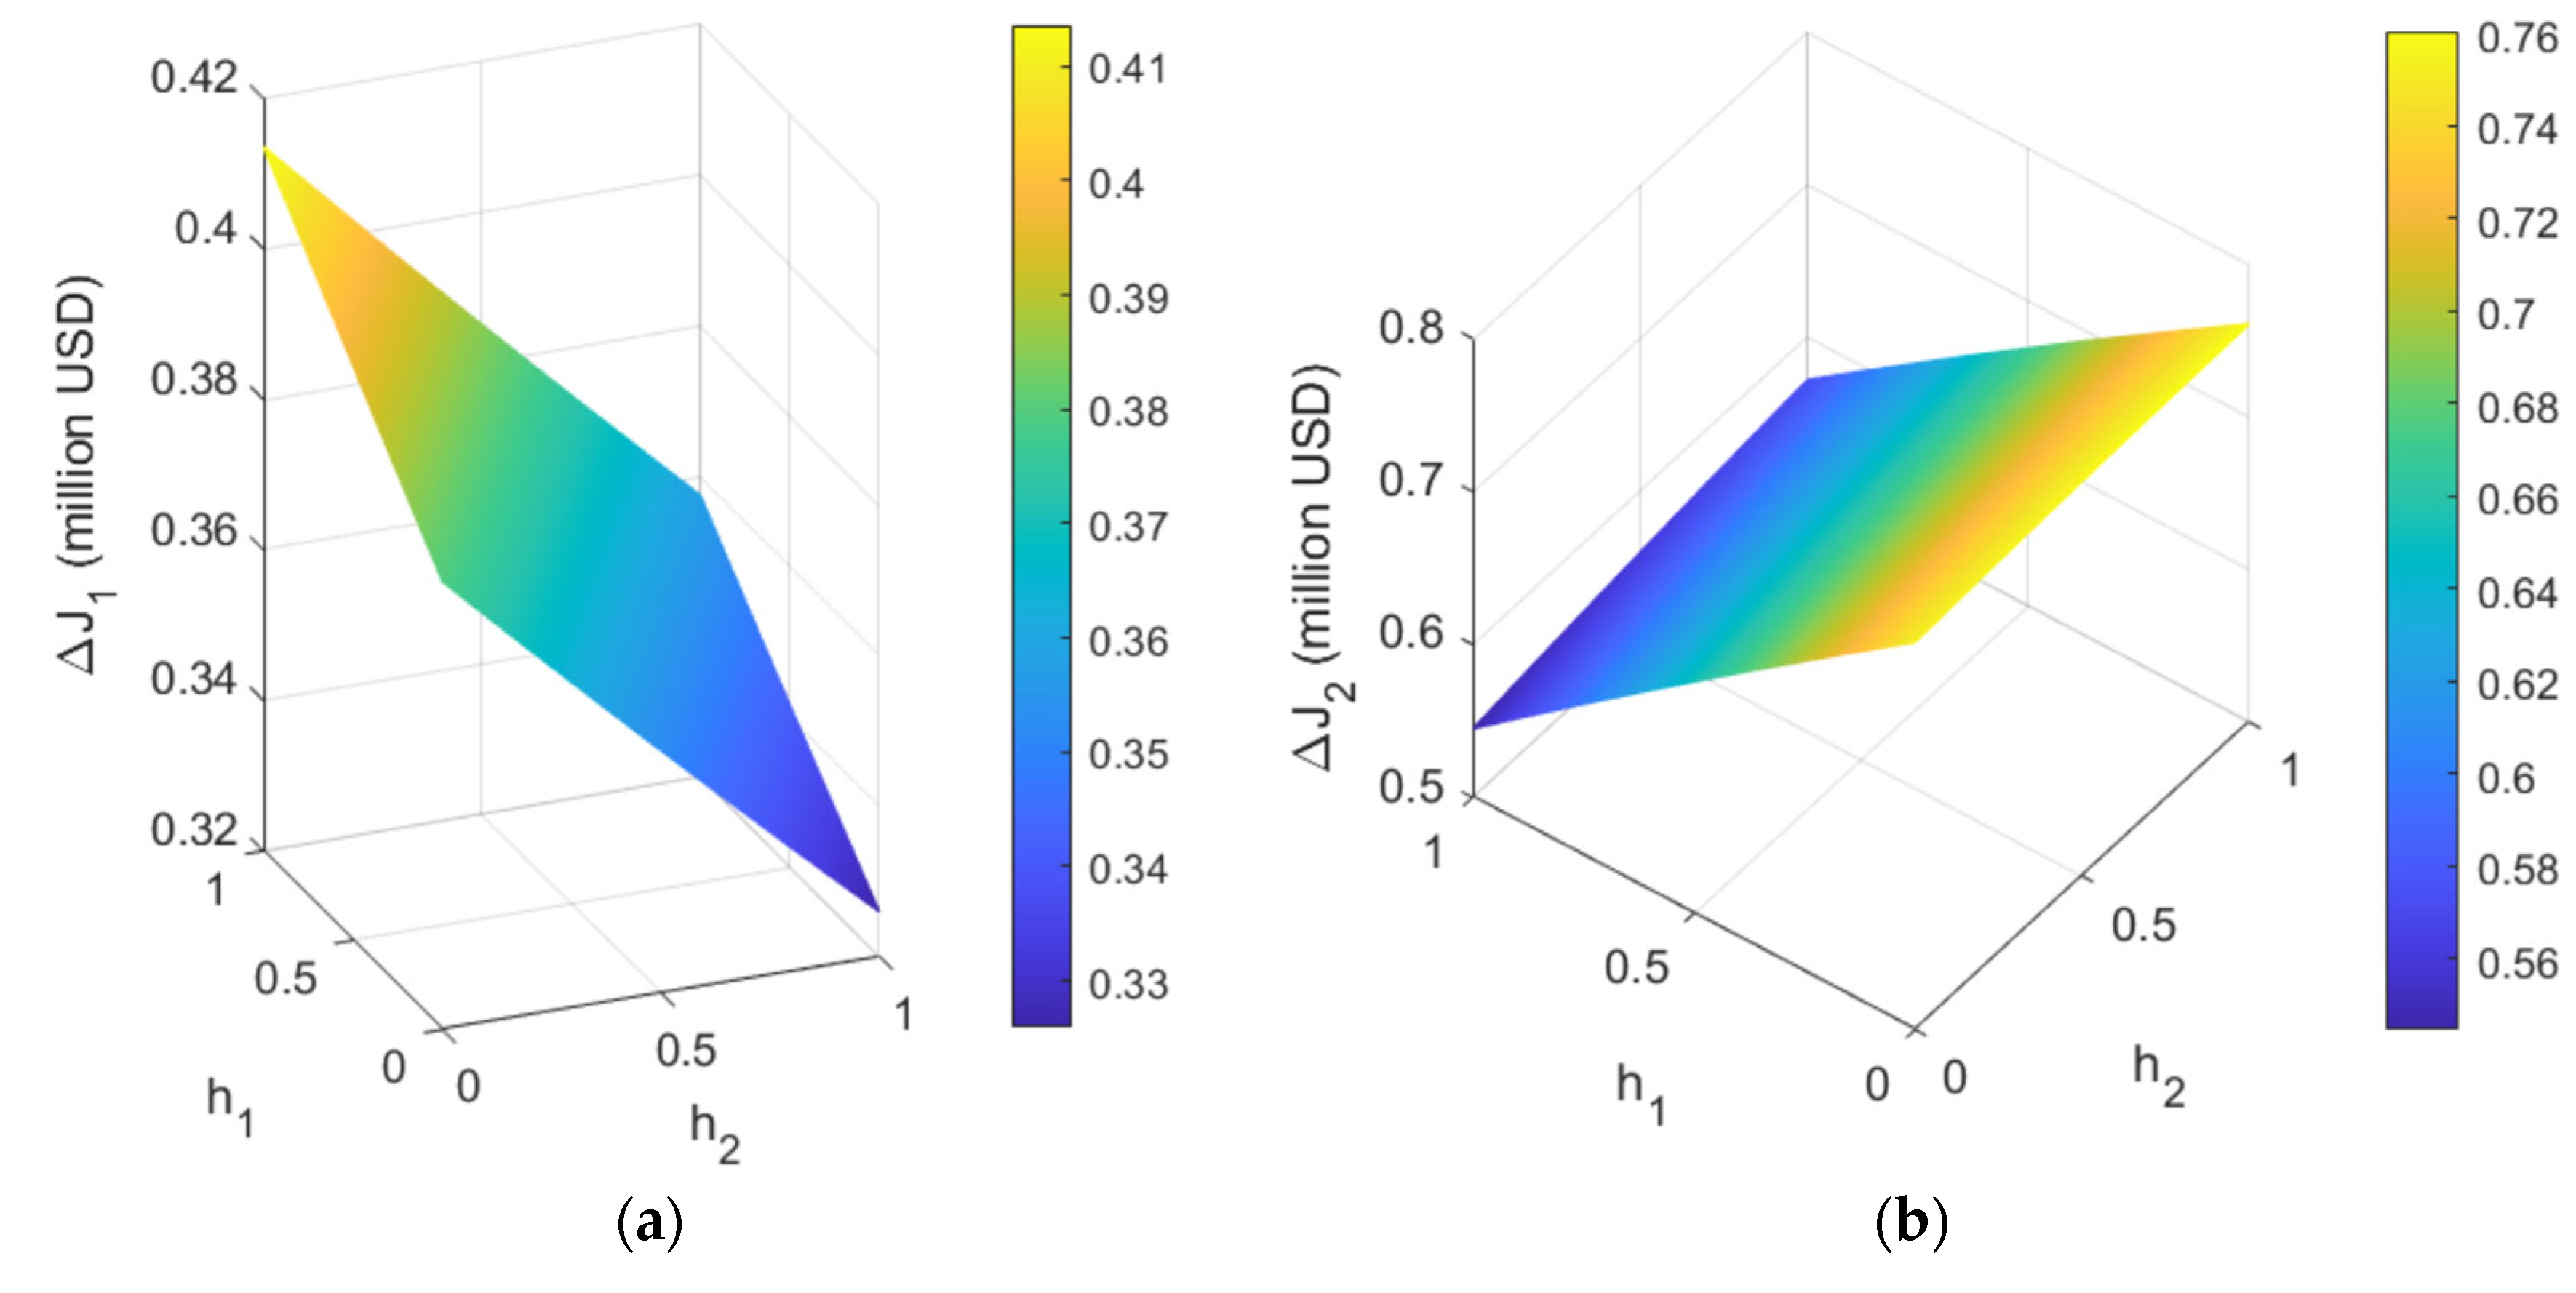

Table 1.
Parameters, variables and functions in the non-cooperative game models in ports.
| Notations | Explanation |
|---|---|
| Monthly throughput of regional ports | |
| Price impact factor on throughput | |
| Competitor's price impact factor | |
| Service cost per TEU for port | |
| The average fuel consumption per hour per ship during berthing period | |
| Handling efficiency of a crane per hour in port | |
| Fuel subsidy ratio in port | |
| Price of ultra-low sulfur diesel with a sulfur content 0.5% | |
| Price of low sulfur fuel (0.5%) | |
| Variables and functions | Explanation |
| Service price per TEU at port | |
| Monthly throughput of port | |
| Total fuel consumption by vessels in port | |
| Subsidies from ports for switching to ultra-low marine fuel when the supply of compliant fuel at port is insufficient | |
| Profit function of port |
Table 2.
Sample values of AIS data for container ships calling at the two ports.
| Callsign | IMO | MMSI | Gross Tonnage |
Net Tonnage |
DWT | Berth | Building Year | Distance (n mile) |
||
|---|---|---|---|---|---|---|---|---|---|---|
| BLBX | 8901755 | 416260000 | 17123 | 7336 | 23692 | Waigaoqiao | 1990 | 121.30 | ||
| BIBP7 | 9159878 | 413378250 | 16705 | 9118 | 24336 | Wusong | 1997 | 164.18 | ||
| D5IR9 | 9189500 | 636016980 | 66526 | 29460 | 67712 | Yangshan | 2000 | 139.74 | ||
| 3EB09 | 9320403 | 371860000 | 50963 | 30224 | 59587 | Changxing | 2006 | 125.34 | ||
| 9LU2532 | 9258210 | 667001729 | 1510 | 705 | 2212 | Baoshan | 2001 | 147.41 | ||
Table 3.
Data of container ships calling at Shanghai port.
| GT | ||||||
|---|---|---|---|---|---|---|
| Container ships | ||||||
| Number of ships | 0 | 1 | 73 | 218 | 285 | |
| Percentage | 0 | 0.17% | 12.65% | 37.78% | 49.39% | |
Table 4.
Data of container ships calling at Ningbo Zhoushan Port.
| GT | ||||||
|---|---|---|---|---|---|---|
| Container ships | ||||||
| Number of ships | 0 | 0 | 7 | 46 | 168 | |
| Percentage | 0 | 0 | 3.17% | 20.81% | 76.02% | |
Table 5.
Parameter values.
| Notations | Explanation | Value |
|---|---|---|
| Monthly throughput of regional ports | million TEUs | |
| Price impact factor on throughput | 0.15 million TEUs/$ | |
| Competitors' price impact factor | 0.1 million TEUs/$ | |
| Handling efficiency in Shanghai Port | millionTEUs/hour | |
| Handling efficiency in Ningbo Zhoushan Port | millionTEUs/hour | |
| Service cost per TEU in Shanghai Port | USD/TEU | |
| Service cost per TEU in Ningbo Zhoushan Port | USD/TEU | |
| Fuel subsidy ratio of Shanghai Port | ||
| Fuel subsidy ratio of Ningbo Zhoushan Port | 0.75 | |
| Price of MGO | 0.000 million USD/ton | |
| Price of VLSFO | 0.000 million USD/ton |
Table 6.
Results of simultaneous competition between two ports.
| GT | Unit | ||||||
|---|---|---|---|---|---|---|---|
| Parameters | |||||||
| USD | 87.13 | 87.13 | 87.16 | 88.00 | 88.23 | ||
| USD | 92.40 | 92.40 | 92.42 | 93.29 | 93.52 | ||
| million TEUs | 1.87 | 1.87 | 1.87 | 1.83 | 1.82 | ||
| million TEUs | 0.55 | 0.55 | 0.55 | 0.51 | 0.50 | ||
| million USD | 23.30 | 23.30 | 23.27 | 22.29 | 22.02 | ||
| million USD | 2.05 | 2.05 | 2.04 | 1.72 | 1.63 | ||
Table 7.
Results of sequential competition between two ports.
| GT | Unit | ||||||
|---|---|---|---|---|---|---|---|
| Parameters | |||||||
| USD | 88.92 | 88.92 | 88.94 | 89.74 | 89.96 | ||
| USD | 92.99 | 92.99 | 93.02 | 93.87 | 94.10 | ||
| million TEUs | 1.66 | 1.66 | 1.66 | 1.63 | 1.62 | ||
| million TEUs | 0.64 | 0.64 | 0.64 | 0.59 | 0.58 | ||
| million USD | 23.67 | 23.67 | 23.64 | 22.64 | 22.37 | ||
| million USD | 2.76 | 2.76 | 2.74 | 2.36 | 2.25 | ||
Table 8.
| GT | Unit | ||||||
|---|---|---|---|---|---|---|---|
| Parameters | |||||||
| USD | 1.78 | 1.78 | 1.78 | 1.74 | 1.73 | ||
| USD | 0.59 | 0.59 | 0.59 | 0.58 | 0.58 | ||
| million TEUs | 3 | 3 | 3 | 3 | 3 | ||
| million TEUs | -0.21 | -0.21 | -0.21 | -0.20 | -0.20 | ||
| million USD | 0.09 | 0.09 | 0.09 | 0.09 | 0.09 | ||
| million USD | -2.33 | -2.33 | -2.33 | -2.33 | -2.33 | ||
| USD | 0.37 | 0.37 | 0.37 | 0.35 | 0.35 | ||
| USD | 0.71 | 0.71 | 0.71 | 0.64 | 0.62 | ||
| / | 0.52 | 0.52 | 0.52 | 0.55 | 0.56 | ||
Disclaimer/Publisher’s Note: The statements, opinions and data contained in all publications are solely those of the individual author(s) and contributor(s) and not of MDPI and/or the editor(s). MDPI and/or the editor(s) disclaim responsibility for any injury to people or property resulting from any ideas, methods, instructions or products referred to in the content. |
© 2023 by the authors. Licensee MDPI, Basel, Switzerland. This article is an open access article distributed under the terms and conditions of the Creative Commons Attribution (CC BY) license (http://creativecommons.org/licenses/by/4.0/).
Copyright: This open access article is published under a Creative Commons CC BY 4.0 license, which permit the free download, distribution, and reuse, provided that the author and preprint are cited in any reuse.


