
Submitted:
27 November 2023
Posted:
27 November 2023
You are already at the latest version
Abstract
The International Maritime Organization (IMO) is enforcing increasingly stringent regulations on ship carbon emissions, The International Maritime Organization (IMO) has been implementing progressively strict regulations on ship carbon emissions, leading to the adoption of the virtual arrival (VA) method by many vessels to reduce their carbon footprint. However, the effectiveness of the traditional VA method often varies in busy ports with complex traffic organization scenarios. To address this, our study presents a novel, comprehensive model that integrates vessel scheduling with the VA approach. This model is designed to achieve a dual objective: reducing carbon emissions through Virtual Arrival and simultaneously minimizing vessel waiting times. In addition to these goals, it incorporates essential aspects of safety, efficiency, and fairness in port management, utilizing the NSGA-2 algorithm to find optimal solutions. This model has been tested and validated through a case study at Ningbo-Zhoushan port, employing its dataset. The results demonstrate that our innovative model and algorithm significantly outperform traditional scheduling methods, such as First-Come-First-Serve (FCFS) and Virtual-Arrival Last-Serve (VALS), particularly in terms of operational efficiency and reduction in vessel carbon emissions.
Keywords:
Virtual Arrival
; traffic organization
; carbon emission reduction
; waiting time
; multi-objective optimization
1. Introduction
Sea-going trade contributes approximately 2.9% of global CO2 emissions. Mitigating greenhouse gas emissions (GHG) from the international shipping industry constitutes a prominent and multifaceted challenge within both business and policy domains. This critical issue stands as a focal point in contemporary research endeavours[1,2,3].The International Maritime Organisation (IMO) has set ambitious targets to reduce emissions from sea-going vessels by 50% in 2050 compared to 2008, with a gradual decline in emissions from 2030 onwards[4,5]. To achieve the emission reduction goals set by the IMO and mitigate environmental impact, it is imperative to reduce vessels emissions. Current research [6,7,8,9,10] suggests that significant potential exists for emission reductions by improving navigational efficiency (traveling at the minimum speed necessary). In general, fuel consumption of a ship is linearly related to the third or fourth power of the speed, and currently ships tend to travel to ports at a higher speed and have to wait at anchor, which increases fuel consumption and carbon emissions both when sailing in the sea near the port and during the waiting period of the ship. One promising approach is Virtual Arrival (VA), which is a concept used in maritime operations to reduce carbon emissions and improve efficiency in shipping. VA allows vessels to adjust their speed during voyages to meet a Required Time of Arrival at their destination, considering known delays at the port. By utilizing the time spent waiting to berth as extra sailing time, VA can reduce average sailing speeds, thus speed optimization can low fuel consumption and CO2 emissions. It was estimated that around 15% of the total emissions of vessels are produced during port visits [11].
Central to this method is the utilization of sophisticated communication and planned coordination, enabling ships to adjust their speed according to the latest port availability updates. In contrast to the traditional approach where ships maintain their speed and subsequently wait at the port, Virtual Arrival dictates a reduction in speed during transit, synchronizing the ship's arrival with the availability of a berth. This strategy not only reduces the time ships spend idling and waiting, leading to operational cost savings, but also substantially decreases fuel consumption, thereby contributing to a reduction in carbon emissions. However, the success of this method relies heavily on the precision of the information received and the effective coordination among various maritime stakeholders. This can present challenges, especially in scenarios with stringent schedules. Consequently, while the Virtual Arrival method has emerged as a key strategy in the maritime industry for its potential to optimize operational efficiency and environmental sustainability, its implementation and effectiveness can vary depending on the specific logistical circumstances.
At some mega ports like Ningbo-Zhoushan, the effectiveness of the Virtual Arrival (VA) method is further shaped by a diverse set of factors, extending well beyond the simple availability of berths. These factors encompass pilotage requirements, the accessibility of deep-water channels, and the intricacies of port traffic organization. For example, the use of deep-water channels, essential for larger vessels, is often constrained by both natural conditions and existing traffic, requiring detailed timing and coordination. To enhance operational efficiency of such ports, traffic organization is usually adopted, which is designed to coordinate vessel movements through Vessel Traffic Service (VTS). Such a multifaceted environment poses significant challenges to the VA method, as it introduces additional variables that may impact the optimal speed adjustments for incoming vessels. Given these intricate conditions, there is a pressing need for further research on the VA method in the context of traffic organization at busy ports, focusing on specialized optimization method for vessel entry scheduling to ensure that the VA method remains effective in optimizing efficiency and reducing environmental impact under traffic organization scenarios.
Given the research gaps and challenges outlined, this paper aims to explore and propose an advanced Virtual Arrival optimization method in the traffic organization scenarios of the core port area of Ningbo-Zhoushan. To achieve this, we have developed a sophisticated mathematical model that considers a range of factors such as channel navigation rules, tidal resources, and other important constraints. We proposed solution utilizes an advanced heuristic elite selection genetic algorithm, known as Non-dominated Sorting Genetic Algorithm II (NSGA-2), which utilizes a vessel service sequence as the code to effectively optimize the problem.
The rest of this paper is organized as follows. In Section 2, a review of the literature related to traffic organization optimization and virtual arrival is provided. Section 3 describes and analyzes the studied problem, along with an explanation of the relevant factors. In Section 4, a mathematical optimization model is constructed, considering complex navigation rules and channel constraints. Section 5 introduces a heuristic algorithm that has been proposed for solving the model. In Section 6, actual inbound data from the core port area of Ningbo-Zhoushan is utilized to build a specific model and conduct a case study. The model is then compared with other models, such as FSFC, to validate its effectiveness under different scenarios. Section 7 ends the study with conclusion and future work.
2. Literature review
2.1. Virtual Arrival
VA differs from scheduled voyages in that its purpose is not to reserve berthing time in advance but only to adjust speed in response to known delays to avoid ships waiting at anchor in advance. Firstly, as VA only minimizes the time spent at anchor before berthing by slowing down the sailing speed, transport capacity is not affected; secondly, because the total voyage time remains the same, the cargo in-transit inventory costs will not increase as in the case of slow-steaming[12]. In addition, VA has lower investment costs and is easier to implement compared to other technologies aimed at reducing the carbon intensity of ship operations[13,14].
The fuel savings potential of VA has been analyzed in several studies. Alvarez[15] used a simulation model where berth allocation, land-side equipment assignment, and speed optimization were considered; their results suggest that the virtual arrival policy can reduce fuel consumption by about 6% compared to the traditional FCFS policy.
Johnson and Styhre [16]conducted a case study in which they analyzed the effect of VA on two 5,000 gross tonnage ships in short-sea shipping. They combined interviews with Statement of Facts data to quantify the total waiting time during port calls for the two ships. Through interviews, three "likely scenarios" were developed, estimating the potential reduction in port call duration hours achieved by adopting slower sailing speeds. The findings revealed a fuel reduction ranging from 2% to 8%, contingent on the chosen scenario. These estimates were derived from ship-specific operational and design specifications, enhancing the credibility of the results with empirical data from the case study. However, the methodology and sample size limits the generalizability of the results.
In a study by Jia[8], 5,066 worldwide reductions in fuel consumption and emissions were empirically assessed for a fleet of 483 VLCCs between 2013 and 2015 using Automatic Identification System (AIS) vessel position data, which was based on the potential reduction in fuel consumption and emissions from the implementation of a virtual arrival policy. The average sailing speed was reduced by using non-productive waiting time at the destination port, assuming that the vessel speed could be adjusted throughout the voyage. Their results show that fuel savings depend on how much unnecessary waiting time can be utilized while sailing, with 7.26% fuel savings if waiting time is reduced by 25% and 19% fuel savings if all waiting time is eliminated.
Andersson and Ivehammar[17] conducted a study using AIS data from Baltic Sea countries to estimate the impact of the VA strategy and compared it with traditional methods that involve significant waiting times. In analyzing speed reduction scenarios, they assumed possible reductions of 5%, 10%, 25%, and 50%. Additionally, they considered situations where ships could reduce speed 1, 4, 12, and 24 hours before their estimated arrival time. According to their research findings, if vessels reduce speed by 5% 12 hours before arrival, it could lead to annual fuel savings of 4,826 tons and 15,106 tons of carbon dioxide emissions.
Merkel[12] estimated the actual time spent by the ship at anchor waiting to berth. Secondly, speed-related elasticities are applied to estimate the speed/fuel function at different speeds to assess the potential for fuel savings from VA measures compared to when waiting at anchor to sail. Using data from Swedish ports as an example, the potential for fuel reduction (savings as a share of total voyage consumption) is considered to be about 4.7 - 4.12% when speed is reduced 1 - 7 hours prior to planned arrival.
Based on research above, the abatement potential of a virtual arrival vessels depends primarily on:
- The extent to which vessels can reduce their speed.
- How far in advance of the estimated arrival time vessels receive reliable information.
2.2. Vessel traffic optimisation
Vessel traffic optimization refers to organizing a large number of vessels to enter and leave the canal in an orderly manner within a given period of time so that waiting time is shorter, thus reducing vessel delays and improving the efficiency of vessel traffic. The target of the traffic organization is all the ships of different types and sizes that pass through the canal every day, some of which enter the port via the canal from the outer sea or outer anchorage[18,19,20,21].
Lübbecke[22] studied the vessel traffic control problem in the Kiel Canal, considering constraints such as channel environment and safety intervals to minimize the total vessel waiting time and navigation rules, and constructed a heuristic combination algorithm to solve the traffic problem in an optimization study of vessel traffic organization. Zhang[23] developed a mixed integer linear programming (MILP) model to improve ship transport efficiency with the shortest total waiting time as the optimization objective while considering the constraints of navigation rules and safety intervals. A heuristic algorithm combined with a simulated annealing algorithm and genetic algorithm is also used to solve the port ship transportation scheduling model. Zhang and Zheng[24] developed an optimization model for traffic organization considering tides, aiming to achieve the shortest total vessel waiting time. The model considers constraints such as tidal time windows and navigation rules, and the results show that the scheduling is more efficient than other strategies, including first-come, first-served (FCFS) and random scheduling. Liu[25] proposed a MILP model for one-way channel vessel scheduling in ports. The model aims to reduce the weighted dwell time of all vessels, considering constraints such as berths, navigation rules, and tidal time windows. An adaptive large neighborhood search algorithm is constructed to solve the model.
Studies of vessel scheduling have primarily focused on improving the traffic efficiency of ships in waterways, the constraints of the studies are time slot allocation, tide[26,27,28], berth[29], vessel speed, traffic conflict and capacity of sidings. However, there is a significant gap in the literature when it comes to integrating the ship emissions problem with ship scheduling optimization. Recent studies have showed that incorporating ship emissions reduction into the scheduling process can yield a comprehensive and effective ship emission reduction method. For instance, Jiang[30] considered the complex problem of vessel scheduling in a restricted channel and the berth allocation problem and a combined model that considers carbon emissions, proposed an adaptive, double-population, multi-objective genetic algorithm NSGA-II-DP to calculate the mathematical model. Xia[31] propose a ship scheduling with speed reduction (SCR) model aimed at optimizing ship arrival sequences and reducing ship speeds to achieve the objectives of reducing the total scheduling time and carbon emissions of ships in port. Through a series of experiments based on accurate port data, they have validated the effectiveness of this novel ship emission reduction method, which can lead to a reduction in ship emissions by 8.0% to 11.9% and an improvement in traffic efficiency by 3.8% to 6.2%.
However, as mentioned in the previous section, the speed reduction of vessels may affect their voyage planning. It leads to an increase in the inventory cost of the ships compared to the virtual arrivals. Therefore, this paper summarizes the emission reduction measures for virtual arrivals and establishes a new method for reducing vessel emissions in ports by combining it with the traffic organization problem.
3. Problem description
In the studies on the optimization of the entry sequence, FCFS criterion is usually applied, in which vessels entering the port area earlier are given priority to cross the channel reporting line over those entering later. However, in the process of vessel traffic organization, there is a virtual arrival of the vessel that has been expected to arrive but has not yet actually entered the port state of the vessel. A rudimentary example is used to illustrate the existence of the solution set under the optimization model. Traffic organization is actually the coordination of the timing and sequence of the passage of two types of ships approaching the port through the reporting line, as shown in Figure 1. Nonetheless, as the number of vessel increases, it can be inferred from the knowledge of permutations that the number of inbound orders will continue to grow. By considering factors such as reporting line time and speed, there are increased possibilities for effective vessel traffic organization.
The primary focus of this study is to ascertain how to determine the necessity for virtual arrival and the waiting time for two types of vessels in the anchorage area to enter the port. This includes optimizing the speed of the virtual arrival vessel in accordance with the entry time window.
FCFS principle can cause issues as the depth of the channel varies over time. To ensure safe passage through tidal waterways, vessel with large draughts often have to rely on the tide. Precise calculation of time windows for each vessel is imperative to determine their safe passage. Safety is ensured by maintaining a certain distance between successive ships, which can be converted from space to time to create a safe time interval. Optimal traffic organization involves coordinating the sequence and start time of vessel entries to match the tidal time windows. Furthermore, this study assume that the virtual arrival vessel is able to change its speed immediately after obtaining the order of traffic organization.
In summary, the following factors should be considered in our model.
- Vessel speed limit.
- Port navigation rules.
- Safe time intervals to ensure navigation safety.
- The tidal time window of large vessels.
4. Mathodology
4.1. Vessel fuel consumption calculation
The amount of fuel that ships consume while at sea is influenced by various factors, including the type of engine, ship design and size, sailing resistance and navigation conditions[32]. The Admiralty formula is used to determine the specific fuel consumption per unit of time shown as Eq. (1).
where is the hourly propulsive fuel demand of the vessel while sailing at the current speed , is the design speed for the vessel , and is the current to maximum draft ratio. The parameter m is set to 3, and the parameter n is set to 2/3(Psaraftis and Kontovas, 2014; Merkel et al., 2022).
4.2. Modeling approach for implementation of VA
For VA vessels, a counterfactual 'pseudo' speed is constructed, representing the speed at which the vessel could have sailed to avoid waiting at anchor. The basic formulation of the pseudo speed for vessel is given in Eq. (2):
where represents the counterfactual pseudo speed for vessel , represents the sailing distance between the vessel's position when speed optimization can begin, and the port of call,represents the original sailing time to port at the time when speed optimization can begin, represents the time spent by vessel at anchor andrepresents a lower bound with a minimum threshold beyond which speed reduction does not generate fuel savings. The expression thus shows the speed which would be required for a vessel to eliminate.
Based on the vessel's initial sailing speed in the traffic organization and the calculated virtual arrival speed, The difference in expected fuel consumption resulting from speed adjustments can be estimated . To achieve this estimation, the main engine fuel consumption is computed at both speeds during the period from speed adjustment to arrival, as shown in Eq.(3), clearly,thus obtaining the fuel consumption reduction, where is a vessel-specific constant.
To calculate the potential decrease in CO2 emissions, we can utilize the fuel savings calculation while also taking into consideration the emission factor (EF). The EF is a representation of the amount of CO2 released for each kilogram of fuel that is consumed. By factoring in the type of fuel utilized by the vessel, we can accurately determine the potential CO2 reduction in the Eq.(4):
4.3. Model assumptions
The organization of vessel traffic in waterways involves multiple departments and resources, such as waterways, anchorages, berths, loading and unloading equipment, etc. At the same time, many factors affect the passage of ships through waterways. Based on a comprehensive analysis of the mechanisms of traffic organization in multiple waterways, key common factors are extracted, and some other special factors are simplified. To facilitate this study, the proposed model has the following assumptions.
(1) The organization of ship traffic involves key resource factors such as waterways, berths, anchorages, and loading and unloading equipment. Generally speaking, anchorage resources are relatively abundant, while berths and loading and unloading equipment are generally subject to interference from many factors, including the stacking area of goods at the port and the nature of the berth. Typically, berths and loading and unloading equipment are often predetermined, so berth issues have been resolved before traffic organization work begins. Therefore,so factors such as like berths, anchorages, and loading and unloading equipment are not considered. The primary focus of this study is to explore how to organize more ships to pass through the waterway in an orderly manner through virtual arrival.
(2) Weather, visibility, and other factors (such as flow velocity, flow direction) can also have an impact on ships passing through waterways. For example, many waterway regulations prohibit navigation when the wind force is greater than 7 degrees. However, this is a special situation and does not belong to the normal state of ship traffic organization. The impact of flow direction and flow velocity on ships is difficult to quantify. Therefore, the ship traffic organization studied in this article does not consider wind. The influence of factors such as visibility and flow.
(3) Since it is impossible to determine whether a ship is a virtual arrival ship based on the existing ship information, this paper assumes that the virtual arrival ship meets the speed greater than the average speed of incoming ships by 10knots, and the distance to the port is more than 100 nautical miles. In addition, it is assumed that the virtual arriving vessel starts to optimize the sailing speed immediately after learning the traffic organization scheme.
4.4. Mathematical model
We simplify the planning time by discretizing it into equal periods. The length of each period is determined as the maximum common unit time for the relevant operation duration. This approach allows us to represent various arrival times in a standardized manner, streamlining the planning process.
: the number of incoming ships that need to be dispatched at the current stage;
: set of all inbound ships, we use the index ;
: the length of the vessel ;
: the draft depth of the vessel ;
: the estimated arrival time of the vessel ;
: the safety time interval between the vessel and the preceding vessel;
: the distance of the vessel from the anchorage to the waterway;
: the average speed of vessel ;
: the distance between the vessel and the port when adjusting its speed;
: the vessel parameters;
: the length of the waterway;
: the original depth of the waterway ;
: the tidal height considering time;
: the actual depth of the waterway considering time
: the surplus water depth of vessel
if vessel is a virtual arrival vessel, it is 1,otherwise it is 0
Decision variables:
: the start of vessel dispatch time (from the time of entering the port from the outer anchorage);
/: the time when the vessel arrives at the beginning and end of the waterway;
: the entry and exit sequence of vessel and vessel , whereindicates that ship is scheduled before vessel , and=0 indicates that vessel is scheduled after vessel;
The mathematical model of vessel optimal scheduling is as follows:
Eq. (5) represents the maximization of the total reduction of carbon emissions from vessels; Eq.(6) represents the minimization of the total waiting time for vessels ; Eq.(7) indicates the reduction of carbon emissions from ships; Eq.(8) denotes the speed limit for virtual arrival; Eq. (9) indicates that the vessel dispatch time is greater than the expected arrival time; Eq. (10) means the safe time interval between the two vessels entering the port; Eq.(11) indicates the time when the ship enters the waterway (reporting line); Eq.(12) represents the safe time interval between two vessels entering the port, and the difference between the time when the vessels that arrive later on the channel go on the channel and the time when the preceding vessels arrive on the channel meets the safety time interval requirements; Eq.(13) represents the actual water depth of the channel considering the time of the tide, used to calculate whether the water depth of the channel meets the requirements for safe navigation of ships during navigation, avoiding grounding. Eq.(14) denotes that the depth of the channel meets the requirements for vessel navigation considering safety margin when the vessel enters the channel; Eq.(15) ensures that the depth of the channel meets the navigation requirements when the vessel leaves the channel; Eq. (16) and Eq.(17) ensure that the depth of the vessel 's navigation channel meets the requirements during navigation; due to the periodic changes in tides, it is not only necessary to ensure that the water depth meets the requirements when entering and leaving the channel, but also to ensure that the water depth that changes during the navigation of the ship must always meet the navigation requirements; Eq.(18) and Eq. (19) indicate the sequence in which vessel and vessel entered the port.
5. Algorithm design
Due to the inherent complexity of the port vessel scheduling problem, it involves a multitude of variables and constraints, contributing to substantial temporal intricacies. Consequently, the scheduling of vessels at ports is recognized as a challenging and uncertain polynomial (NP) problem, given its intricate nature and the multitude of factors influencing scheduling decisions[34,35]. The solution of the model for this problem mainly involves the sequence of ships entering and leaving the port and the model is a multi-objective optimization. Considering the model constraints and the complexity of the multiple optimization objectives, it is not possible to use some exact solution software for the solution. Employing heuristic algorithms, including genetic algorithms, list search methods, and particle swarm optimization algorithms, facilitates the identification and comparison of a spectrum of feasible solutions. This enables the determination of a relatively optimal solution through a comparative analysis. Consequently, the quest for a more optimal ship scheduling algorithm necessitates the design of an enhanced and efficient approach.
Currently, multi-objective optimization algorithms are more commonly used in dealing with multiple-objective optimization problems. Deb[36] proposed NSGA-II algorithm It is widely used in many fields, the main feature of this algorithm is the fast non-dominated sorting idea NSGA-II algorithm searches along the direction of Pareto's front, and obtains an optimal solution set in line with the model optimization after many iterations. Hence, this study opts for the application of NSGA-II to address the proposed model. The specific steps are shown in Figure 2.
5.1. NSGA-II algorithm.
Following fast non-dominated sort, the process involves selection, crossover, and mutation. The resulting offspring is then amalgamated with the initial group, doubling the population size. The new group undergoes hierarchical organization through fast non-dominated sort and crowding distance calculation. This stratification categorizes the population based on the level of individual non-inferior solutions. During selection, the new groups are sequentially added according to their hierarchical levels. Subsequently, through iteration, the Pareto front is derived, culminating in the final output.as shown in Figure 3.
5.2. Gene coding and population initialization
Vessels are assigned numbers based on the quantity set and the chronological order of their application to enter the port. In Figure 4, vessel numbers serve as gene codes. To create a chromosome, the number sequence is intentionally disrupted, generating a random permutation (with ! possible combinations). The inbound times of vessels are then arranged according to this sequence, adhering to the constraint that the scheduling time of a vessel is influenced by the scheduling times of vessels preceding it. This process is iterated to generate the specified number of chromosomes, collectively forming the initial population.
5.3. Non dominated sorting and congestion calculation
By non-dominated sorting, a set of excellent non-dominated solutions can be obtained, which outperform multiple objective functions and are not dominated by other solutions.
The set of individuals of different Pareto ranks is obtained by fast non-dominated sorting, but for the ranking order of individuals in the set of the same rank it is necessary to introduce the calculation of crowding distance. In the calculation of the crowding distance for each rank, the maximum and minimum solutions of each objective function are assigned infinite values; the crowding distance of the intermediate part of the solutions is equal to the absolute difference between the function values of the two neighboring solutions after normalization.
5.4. Fitness, selection, crossover, and mutation
Fitness: Eq. (1) is to maximize the carbon emission reduction value, and its fitness is the objective function itself; Eq. (2) is to minimize the total waiting time; Therefore, the fitness function is the reciprocal of Eq. (2), and the smaller the objective function value, the higher the fitness value, the fitness function of Eq. (21) is defined as follows:
Selection: The criterion used to select individuals for reproduction is Roulette Wheel Selection. Therefore, the higher the fitness value it has, the greater the probability to be selected.
Crossover: The two-point crossover is used in the GA. First, it randomly generates two integers as two crossover points, then the chromosome is divided into 2 segments; second, the middle genes are exchanged while the rest of the genes are retained and mapped, thus ensuring that the chromosome remains valid.
Mutation: First, two mutation points are generated randomly, and then, the genes on the positions are exchanged.
6. Case study
The actual port ship scheduling is relatively complex, and the proposed model cannot fully meet the actual situation. Therefore, this article uses simulation methods to validate the model and algorithm. Using the ship data information of a particular channel in Ningbo Port for one day, the calculation results of the model algorithm are compared with those based on the FCFS principle and Virtual Arrival Last-Served (VALS) principle. In this case, the length of the channel is 20 nmail , the initial depth in the nautical mile is 11.5m, the anchorage is 10 nmail from the harbor, and the tidal equation is shown below.
The basic information about the ship is obtained by processing AIS data, as shown in Table 1, including vessel number, average sailing speed, draft, estimated arrival time, etc. The virtual arrival vessel has a virtual vessel value of 1.
The optimization algorithm in this article was implemented using Python 3.7 programming, and all experiments were run on a 2.20GHz Intel Core i7-8750H CPU and 8GB memory computer. The relevant parameter values of the algorithm are: the population size is 50; The probability of crossing is 0.8; The probability of variation is 0.1; The number of iterations is 500.The calculation results are as follows:
By analyzing Figure 5., we can observe that the population converges rapidly within 300 generations, indicating the exceptional effectiveness of the heuristic elite selection genetic algorithm in optimizing vessel traffic organization for virtual arrival. This convergence ensures that the optimized solution is attained within a reasonable number of generations. Furthermore, Figure 6. illustrates the correlation between the total waiting time and the optimized speed of virtual arrival ships. As the total waiting time increases, the optimized speed tends to decrease towards the lower speed limit. However, it's worth noting that when the total waiting time reaches 9000 minutes, although the carbon emission reduction attains its maximum value, it may not be practical due to the prolonged waiting periods. Such extended waiting times could adversely impact the overall efficiency of the port operations.
Table 2 shows the information of the Pareto optimal solution set obtained. Each Pareto optimal solution represents the entry order of the ship in sequence. The Pareto frontiers of the 11 optimal solutions are shown in Figure 7. It demonstrates a pattern observed in the NSGA-II results, where improving one objective leads to a weakening of the other objective: the lower the carbon emissions, the lower the fuel consumption, the slower the ship, the longer the voyage time will increase and the longer the total waiting time will be.
The objectives values under different traffic organization schemes can be seen in Figure 8. The detailed schedule for the 1st Pareto-optimal solution for ship scheduling can be found in Table 3. This table displays the scheduled times for each ship in the sequence, as well as a comparison to the results obtained through the FCFS and VALS approaches. By utilizing the Pareto-optimal solutions provided by the proposed model, the total waiting time can be reduced by up to 31.41% compared to FCFS, and up to 65.37% compared to VALS. Additionally, all virtual arrival ships can reduce their CO2 emissions by at least 23.29% compared to the original sailing conditions. Table 4 shows the results of vessel speed optimization.
7. Conclusion
This paper proposes the vessel scheduling problem considering virtual arrivals and optimizes the sailing speeds of virtual arrival ships, which is of significant importance for port management and shipping companies. To address this problem, an improved NSGA-II-based vessel scheduling model is established, and the model's reliability is verified using actual data provided by Ningbo Port VTS. The validation results show that the model and algorithm developed in this study outperform the FCFS and VALS scheduling strategies, reducing total waiting time and higher efficiency. Additionally, the proposed scheduling strategy based on the model optimizes the sailing speeds of virtual arrival ships, effectively reducing fuel consumption and CO2 emissions.
However, due to data limitations includes insufficient detailed information on factors such as ships,tugs, berths, pilots, etc and the drawback of the Admiralty formula for estimating the fuel efficiency potential of speed reduction in low sailing speed markets.this study still possesses several shortcomings. In the future, research can be conducted from the following aspects: (1) Considering other factors influencing vessel scheduling, including tugs, berths, pilots, and other port resources. (2) In actual scheduling scenarios, vessel arrivals should be considered in conjunction with departures and account for different channels, including two-way and compound channels. (3) After adjusting the sailing speeds of virtual arrival ships, it is essential to consider different ship speed-fuel consumption curves to avoid overestimating the impact of virtual arrivals.
Author Contributions
Conceptualization, T.S., W.D. and P.Z.; methodology, T.S. and Y.Y.; software, H.L.; validation, Y.Y. and G.L.; formal analysis, P.Z.; data curation, J.D.; writing—original draft preparation, T.S.; writing—review and editing, W.D., Y.Y. and G.L.; supervision, P.Z.; funding acquisition, P.Z., W.D. and G.L. All authors have read and agreed to the published version of the manuscript.
Funding
This research was funded in part by the National Natural Science Foundation of China (52272334), National Key Research and Development Program of China (2017YFE0194700), EC H2020 Project (690713), International Scientific & Technological Cooperation Projects of Ningbo (2023H020).
Institutional Review Board Statement
Not applicable.
Informed Consent Statement
Not applicable.
Data Availability Statement
Not applicable.
Acknowledgments
We would like to thank the National “111” Centre on Safety and Intelligent Operation of Sea Bridges (D21013), the Zhejiang 2011 Collaborative Innovation Center for Port Economy for the financial support in publishing this paper. The authors would like to thank the K.C. Wong Magna Fund in Ningbo University for sponsorship.
Conflicts of Interest
The authors declare no conflict of interest.
References
- Pettit, S.; Wells, P.; Haider, J.; Abouarghoub, W. Revisiting History: Can Shipping Achieve a Second Socio-Technical Transition for Carbon Emissions Reduction? Transportation Research Part D: Transport and Environment 2018, 58, 292–307. [CrossRef]
- Han, Y.; Ma, W.; Ma, D. Green Maritime: An Improved Quantum Genetic Algorithm-Based Ship Speed Optimization Method Considering Various Emission Reduction Regulations and Strategies. Journal of Cleaner Production 2023, 385, 135814. [CrossRef]
- Jing, D.; Dai, L.; Hu, H.; Ding, W.; Wang, Y.; Zhou, X. CO2 Emission Projection for Arctic Shipping: A System Dynamics Approach. Ocean & Coastal Management 2021, 205, 105531. [CrossRef]
- Serra, P.; Fancello, G. Towards the IMO’s GHG Goals: A Critical Overview of the Perspectives and Challenges of the Main Options for Decarbonizing International Shipping. Sustainability 2020, 12, 3220. [CrossRef]
- Poulsen, R.T.; Sampson, H. ‘Swinging on the Anchor’: The Difficulties in Achieving Greenhouse Gas Abatement in Shipping via Virtual Arrival. Transportation Research Part D: Transport and Environment 2019, 73, 230–244. [CrossRef]
- Bui, K.Q.; Perera, L.P.; Emblemsvåg, J. Life-Cycle Cost Analysis of an Innovative Marine Dual-Fuel Engine under Uncertainties. Journal of Cleaner Production 2022, 380, 134847. [CrossRef]
- Du, Y.; Chen, Q.; Lam, J.S.L.; Xu, Y.; Cao, J.X. Modeling the Impacts of Tides and the Virtual Arrival Policy in Berth Allocation. Transportation Science 2015, 49, 939–956. [CrossRef]
- Jia, H.; Adland, R.; Prakash, V.; Smith, T. Energy Efficiency with the Application of Virtual Arrival Policy. Transportation Research Part D: Transport and Environment 2017, 54, 50–60. [CrossRef]
- Yuan, Q.; Wang, S.; Peng, J. Operational Efficiency Optimization Method for Ship Fleet to Comply with the Carbon Intensity Indicator (CII) Regulation. Ocean Engineering 2023, 286, 115487. [CrossRef]
- Fagerholt, K.; Psaraftis, H.N. On Two Speed Optimization Problems for Ships That Sail in and out of Emission Control Areas. Transportation Research Part D: Transport and Environment 2015, 39, 56–64. [CrossRef]
- Arjona Aroca, J.; Giménez Maldonado, J.A.; Ferrús Clari, G.; Alonso i García, N.; Calabria, L.; Lara, J. Enabling a Green Just-in-Time Navigation through Stakeholder Collaboration. Eur. Transp. Res. Rev. 2020, 12, 22. [CrossRef]
- Merkel, A.; Kalantari, J.; Mubder, A. Port Call Optimization and CO2-Emissions Savings – Estimating Feasible Potential in Tramp Shipping. Maritime Transport Research 2022, 3, 100054. [CrossRef]
- Schroer, M.; Panagakos, G.; Barfod, M.B. An Evidence-Based Assessment of IMO’s Short-Term Measures for Decarbonizing Container Shipping. Journal of Cleaner Production 2022, 363, 132441. [CrossRef]
- Schwartz, H.; Gustafsson, M.; Spohr, J. Emission Abatement in Shipping – Is It Possible to Reduce Carbon Dioxide Emissions Profitably? Journal of Cleaner Production 2020, 254, 120069. [CrossRef]
- Alvarez, J.F.; Longva, T.; Engebrethsen, E.S. A Methodology to Assess Vessel Berthing and Speed Optimization Policies. Marit Econ Logist 2010, 12, 327–346. [CrossRef]
- Johnson, H.; Styhre, L. Increased Energy Efficiency in Short Sea Shipping through Decreased Time in Port. Transportation Research Part A: Policy and Practice 2015, 71, 167–178. [CrossRef]
- Andersson, P.; Ivehammar, P. Green Approaches at Sea – The Benefits of Adjusting Speed Instead of Anchoring. Transportation Research Part D: Transport and Environment 2017, 51, 240–249. [CrossRef]
- Zhang, Y.; Zheng, Q.-Q.; He, L.-J.; Tian, H.-W. Ship Traffic Optimization Method for Solving the Approach Channel and Lock Co-Scheduling Problem of the Three Gorges Dam on the Yangzi River. Ocean Engineering 2023, 276, 114196. [CrossRef]
- Jiang, X.; Zhong, M.; Shi, G.; Li, W.; Sui, Y. Vessel Scheduling Model with Resource Restriction Considerations for Restricted Channel in Ports. Computers & Industrial Engineering 2023, 177, 109034. [CrossRef]
- Li, J.; Zhang, X.; Yang, B.; Wang, N. Vessel Traffic Scheduling Optimization for Restricted Channel in Ports. Computers & Industrial Engineering 2021, 152, 107014. [CrossRef]
- Jia, Q.; Li, R.; Li, J.; Li, Z.; Liu, J. Vessel Traffic Scheduling Optimization for Passenger RoRo Terminals with Restricted Harbor Basin. Ocean & Coastal Management 2023, 246, 106904. [CrossRef]
- Lübbecke, E.; Lübbecke, M.E.; Möhring, R.H. Ship Traffic Optimization for the Kiel Canal. Operations Research 2019, 67, 791–812. [CrossRef]
- Zhang, X.; Lin, J.; Guo, Z.; Liu, T. Vessel Transportation Scheduling Optimization Based on Channel–Berth Coordination. Ocean Engineering 2016, 112, 145–152. [CrossRef]
- Zhang, B.; Zheng, Z. Model and Algorithm for Vessel Scheduling through a One-Way Tidal Channel. Journal of Waterway, Port, Coastal, and Ocean Engineering 2020, 146, 04019032. [CrossRef]
- Liu, B.; Li, Z.-C.; Sheng, D.; Wang, Y. Integrated Planning of Berth Allocation and Vessel Sequencing in a Seaport with One-Way Navigation Channel. Transportation Research Part B: Methodological 2021, 143, 23–47. [CrossRef]
- Zhang, B.; Zheng, Z.; Wang, D. A Model and Algorithm for Vessel Scheduling through a Two-Way Tidal Channel. Maritime Policy & Management 2020, 47, 188–202. [CrossRef]
- Du, Y.; Chen, Q.; Lam, J.S.L.; Xu, Y.; Cao, J.X. Modeling the Impacts of Tides and the Virtual Arrival Policy in Berth Allocation. Transportation Science 2015. [CrossRef]
- Muñuzuri J.; Barbadilla E.; Escudero-Santana A.; Onieva L. Planning Navigation in Inland Waterways with Tidal Depth Restrictions. The Journal of Navigation 2018, 71, 547–564. [CrossRef]
- Rahimikelarijani, B.; Abedi, A.; Hamidi, M.; Cho, J. Simulation Modeling of Houston Ship Channel Vessel Traffic for Optimal Closure Scheduling. Simulation Modelling Practice and Theory 2018, 80, 89–103. [CrossRef]
- Jiang, X.; Zhong, M.; Shi, J.; Li, W.; Sui, Y.; Dou, Y. Overall Scheduling Model for Vessels Scheduling and Berth Allocation for Ports with Restricted Channels That Considers Carbon Emissions. Journal of Marine Science and Engineering 2022, 10, 1757. [CrossRef]
- Xia, Z.; Guo, Z.; Wang, W.; Jiang, Y. Joint Optimization of Ship Scheduling and Speed Reduction: A New Strategy Considering High Transport Efficiency and Low Carbon of Ships in Port. Ocean Engineering 2021, 233, 109224. [CrossRef]
- Yu, H.; Fang, Z.; Fu, X.; Liu, J.; Chen, J. Literature Review on Emission Control-Based Ship Voyage Optimization. Transportation Research Part D: Transport and Environment 2021, 93, 102768. [CrossRef]
- Psaraftis, H.N.; Kontovas, C.A. Ship Speed Optimization: Concepts, Models and Combined Speed-Routing Scenarios. Transportation Research Part C: Emerging Technologies 2014, 44, 52–69. [CrossRef]
- Lalla-Ruiz, E.; Shi, X.; Voß, S. The Waterway Ship Scheduling Problem. Transportation Research Part D: Transport and Environment 2018, 60, 191–209. [CrossRef]
- Unsal, O.; Oguz, C. An Exact Algorithm for Integrated Planning of Operations in Dry Bulk Terminals. Transportation Research Part E: Logistics and Transportation Review 2019, 126, 103–121. [CrossRef]
- SrinivasN; DebKalyanmoy Muiltiobjective Optimization Using Nondominated Sorting in Genetic Algorithms. Evolutionary Computation 1994. [CrossRef]
Figure 1.
Diagram of inbound ship traffic organization through channel.
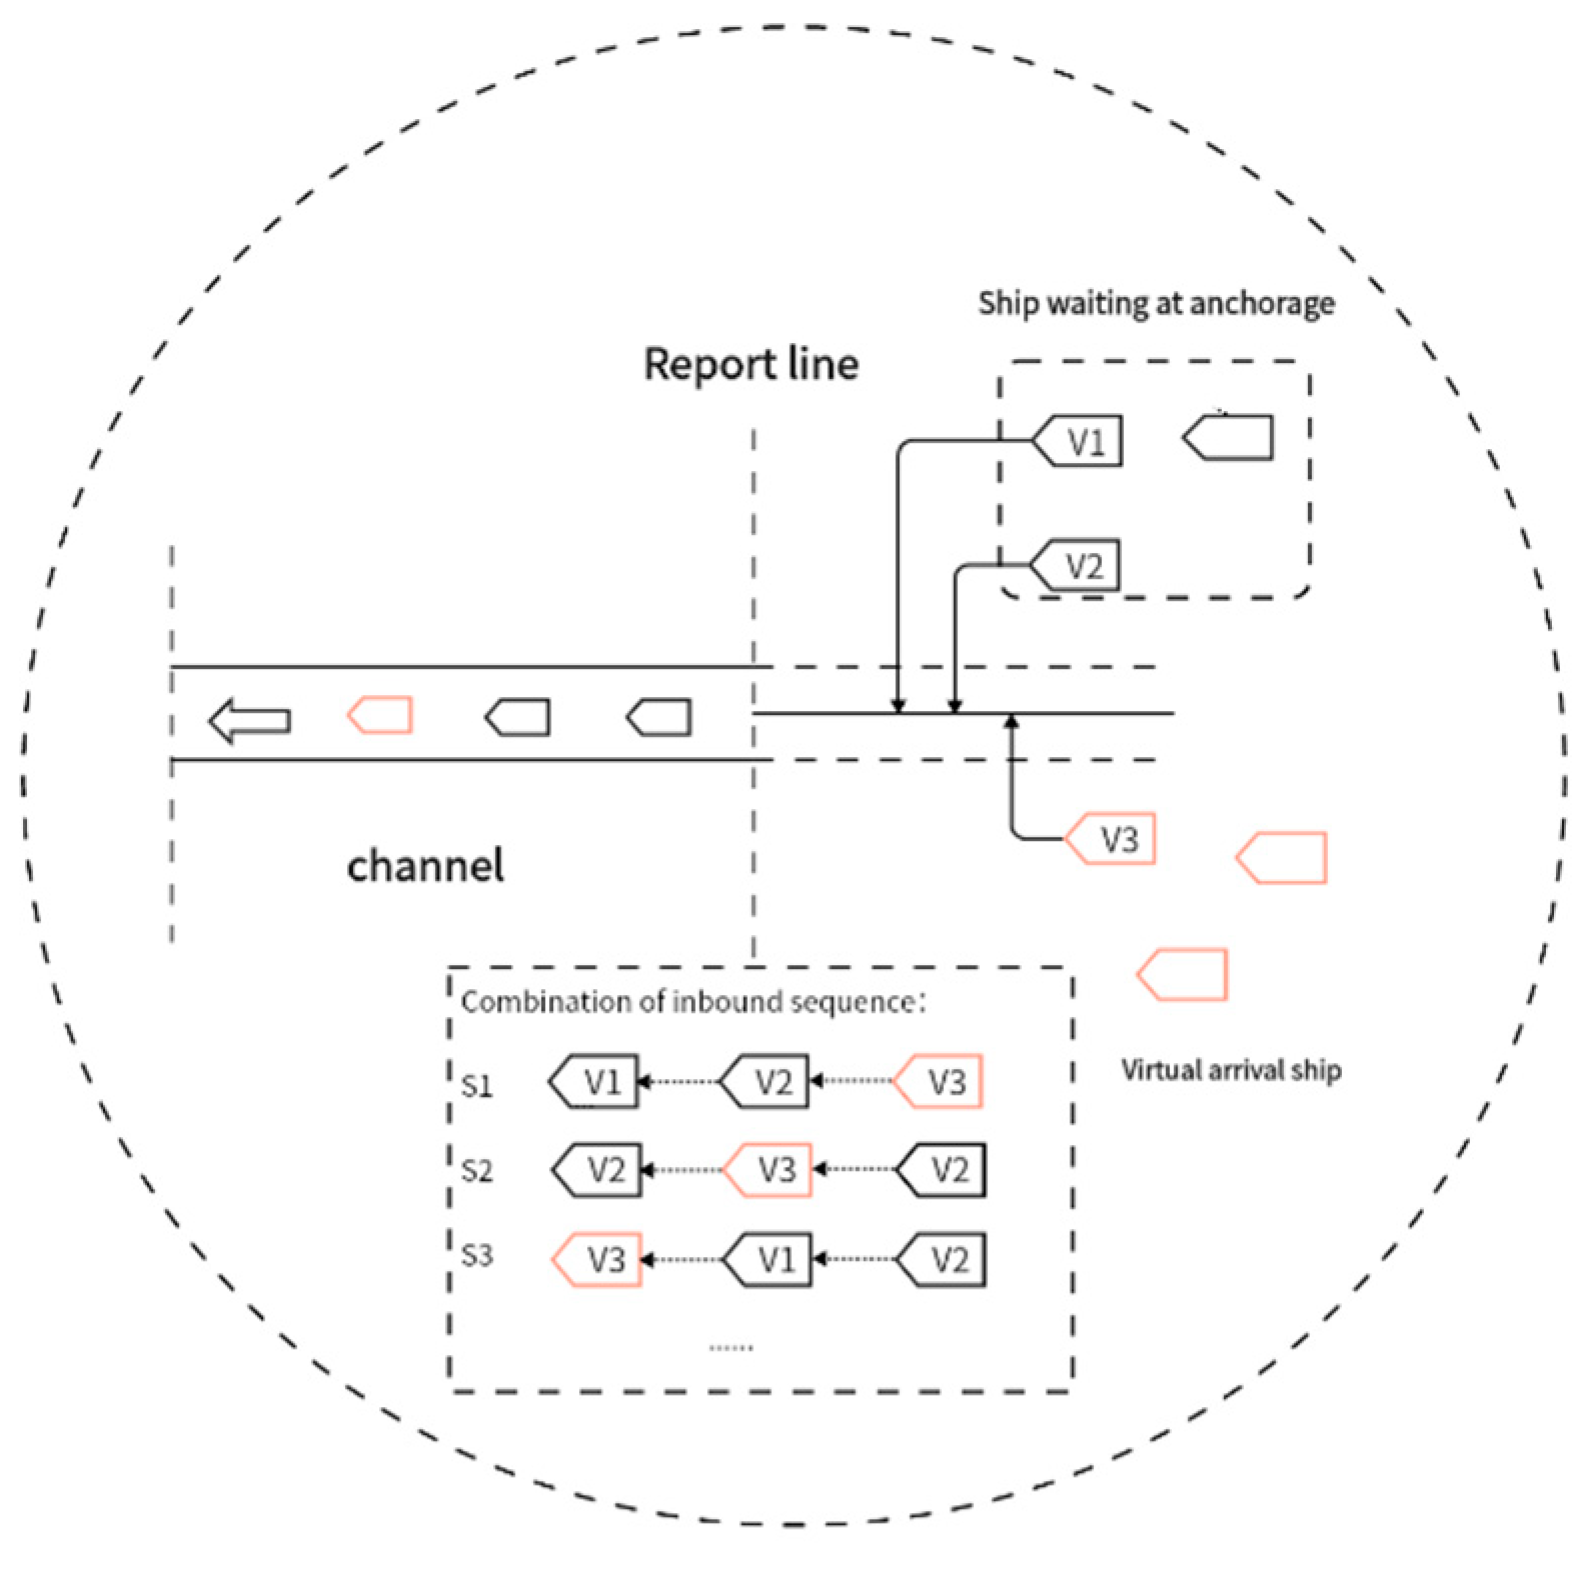
Figure 2.
NSGA-II Flowchart.
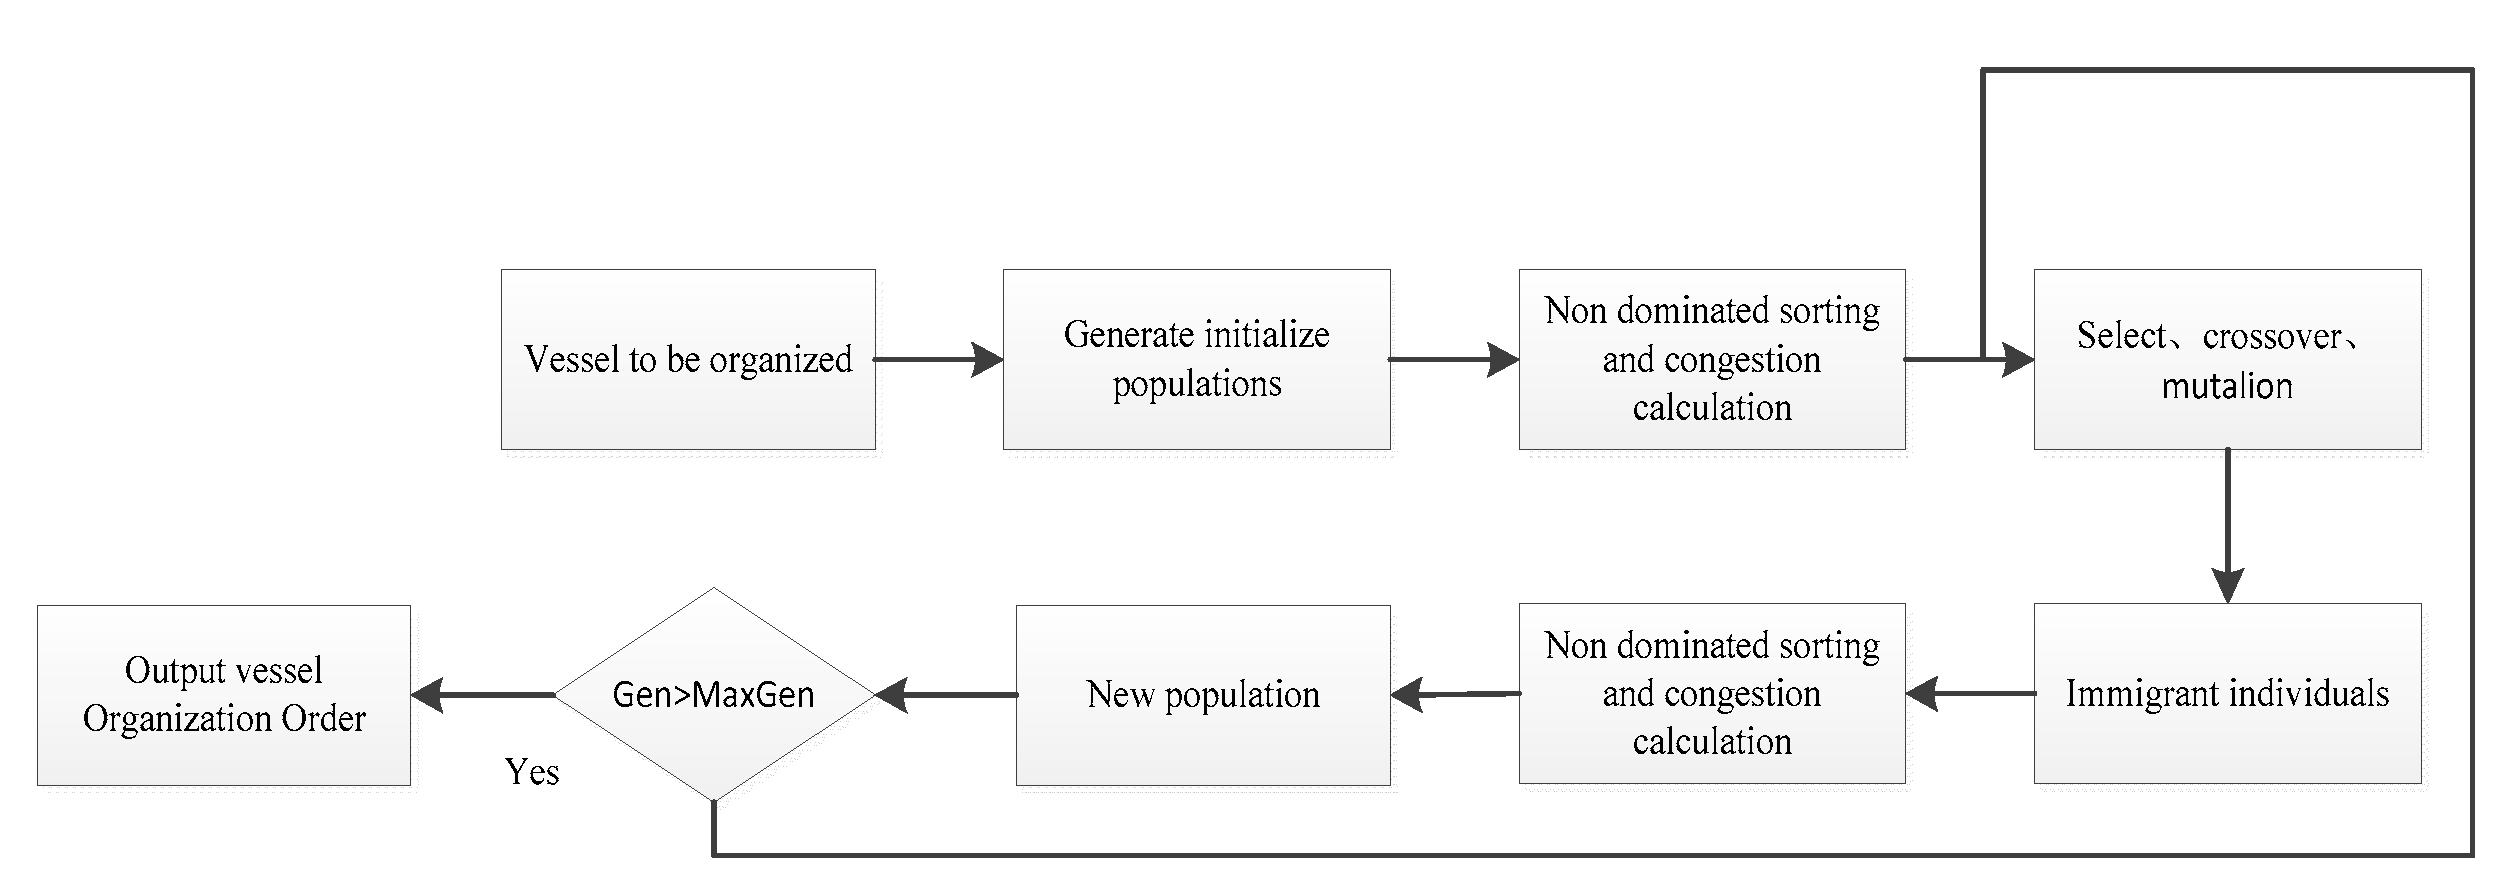
Figure 3.
Group change in NSGA-II algorithm.
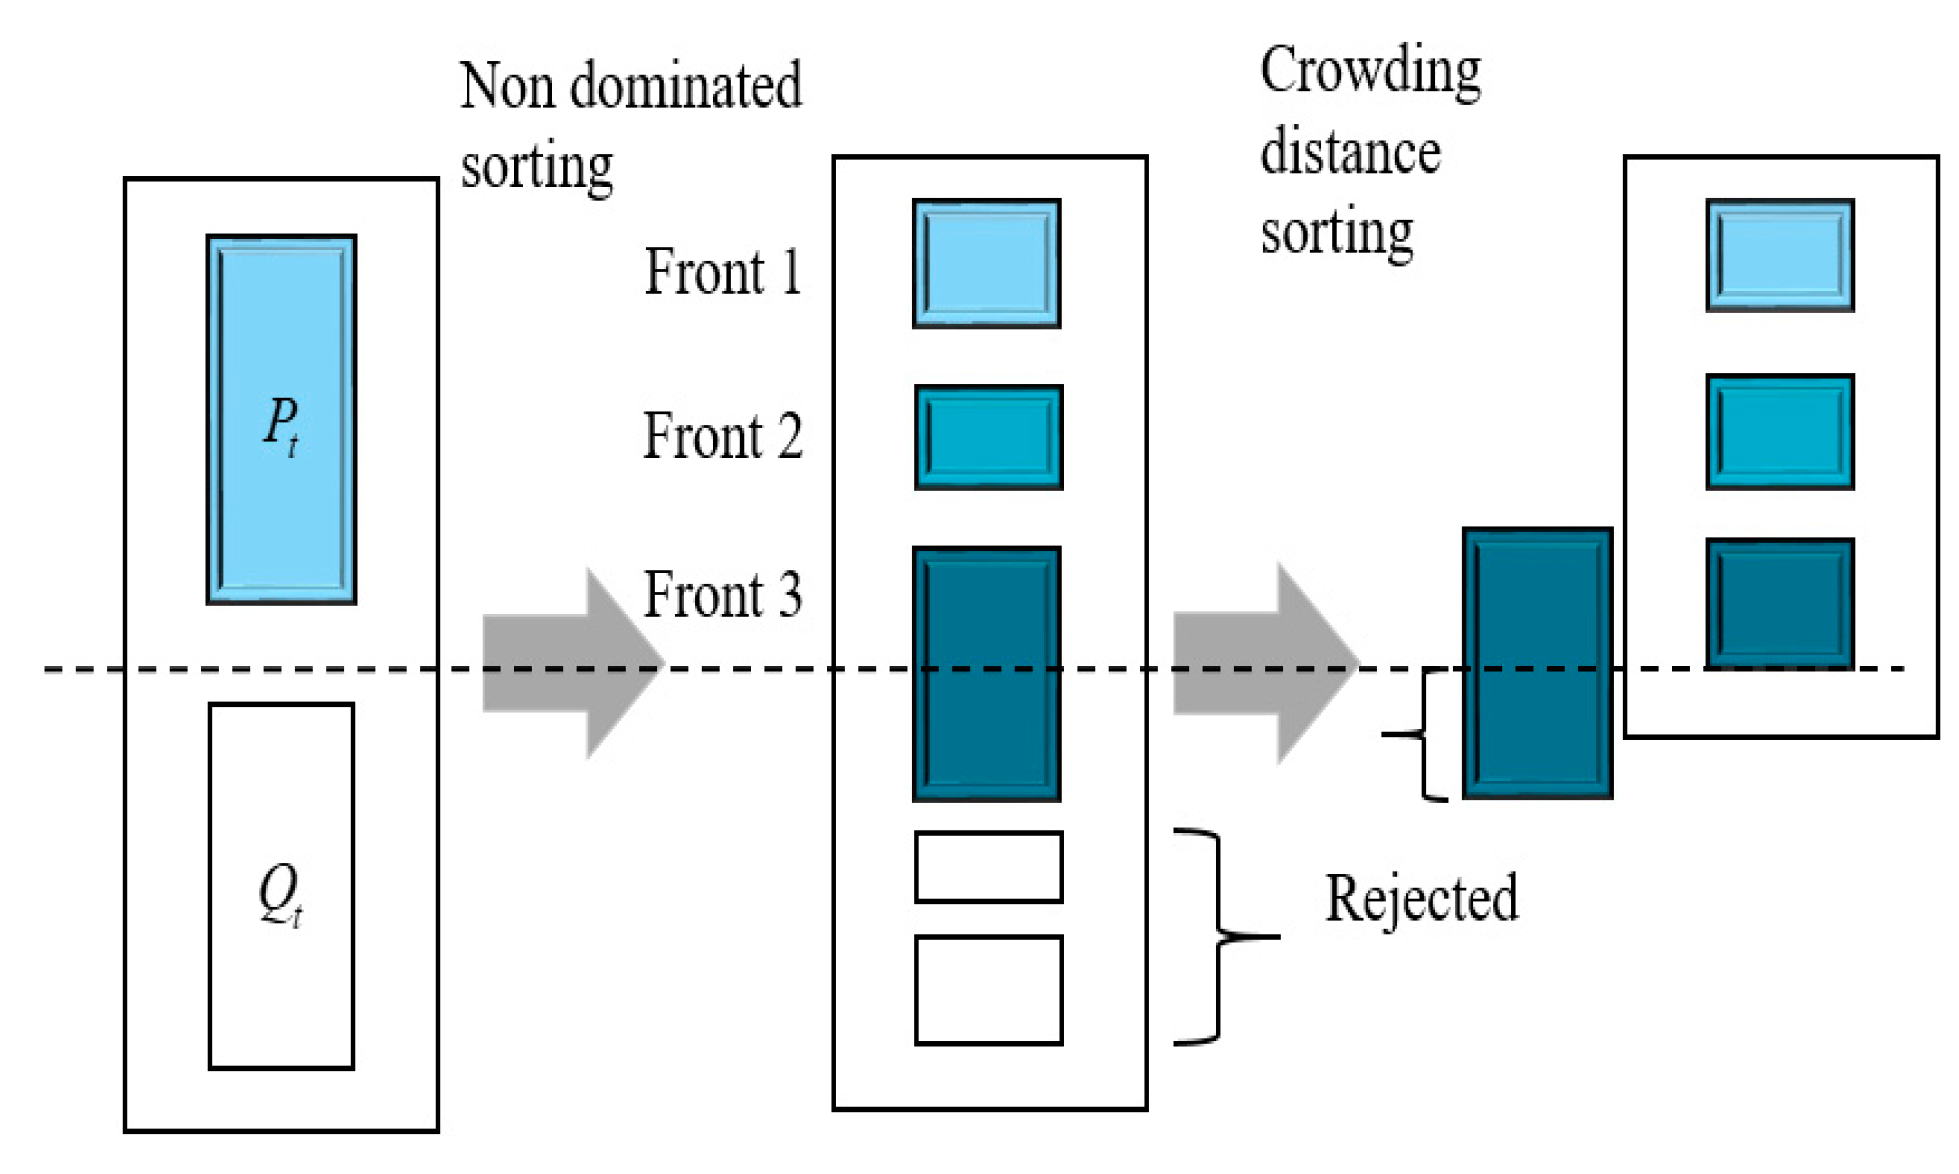
Figure 4.
Chromosome and population.
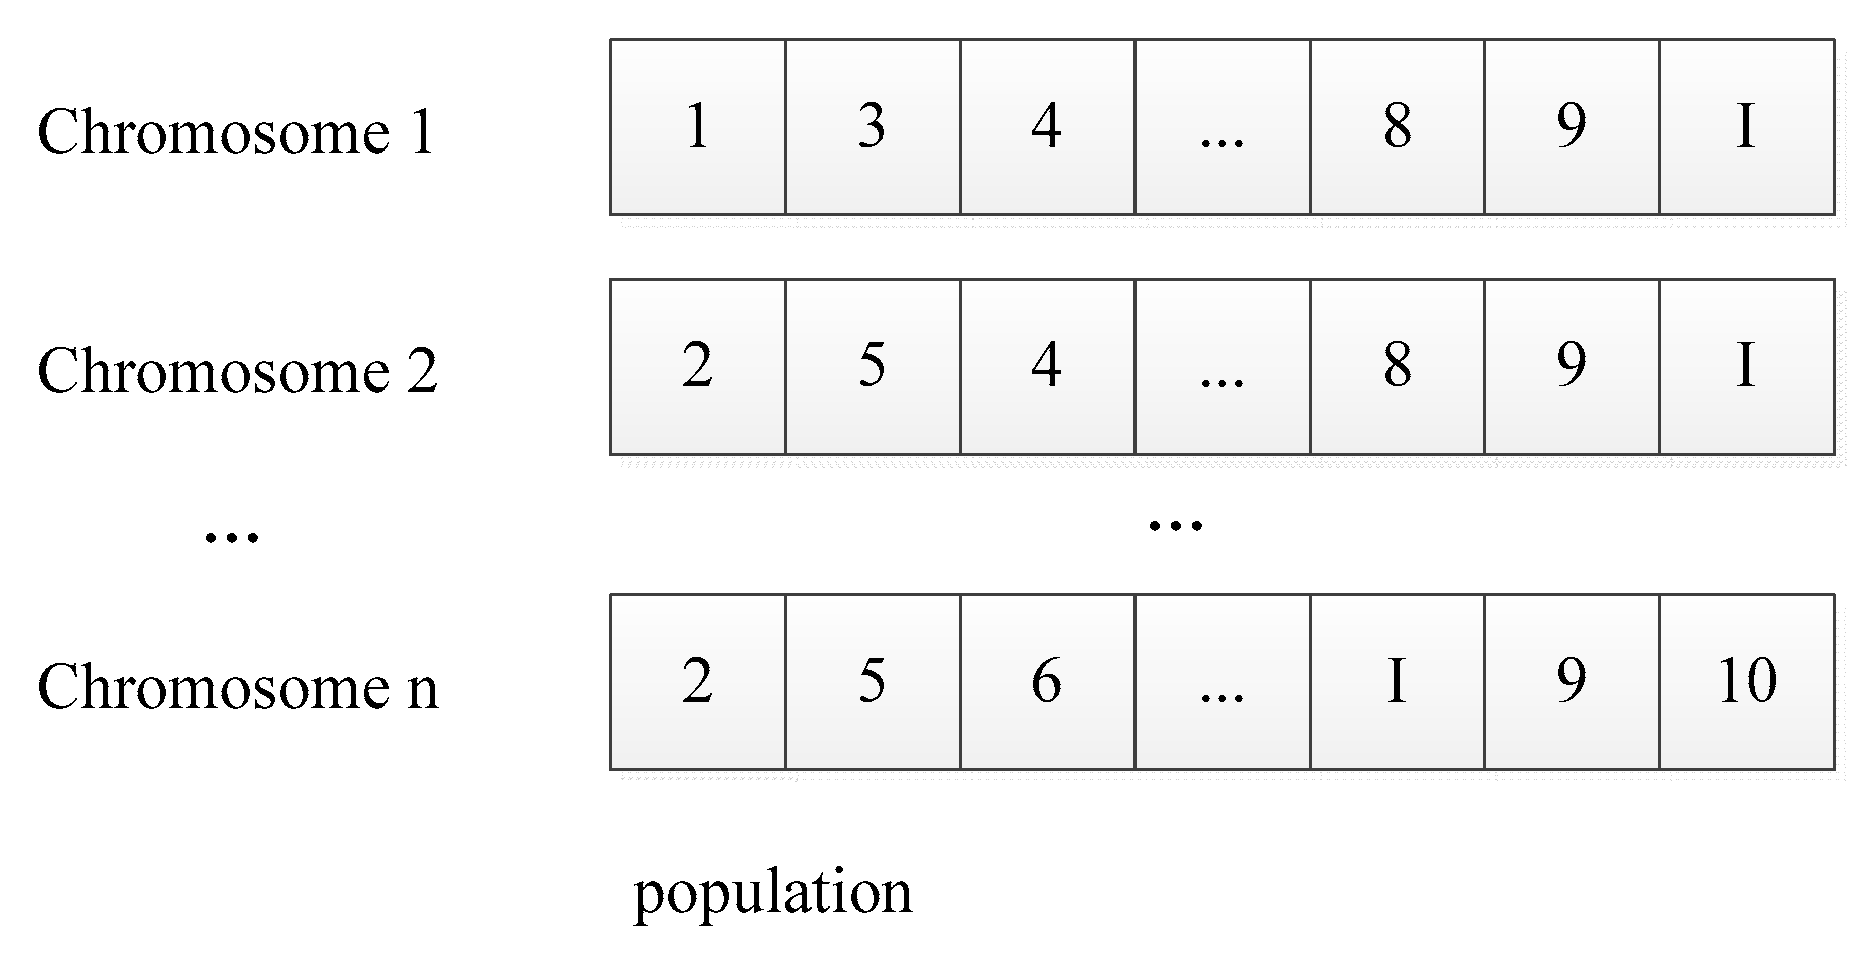
Figure 5.
Convergence diagram.
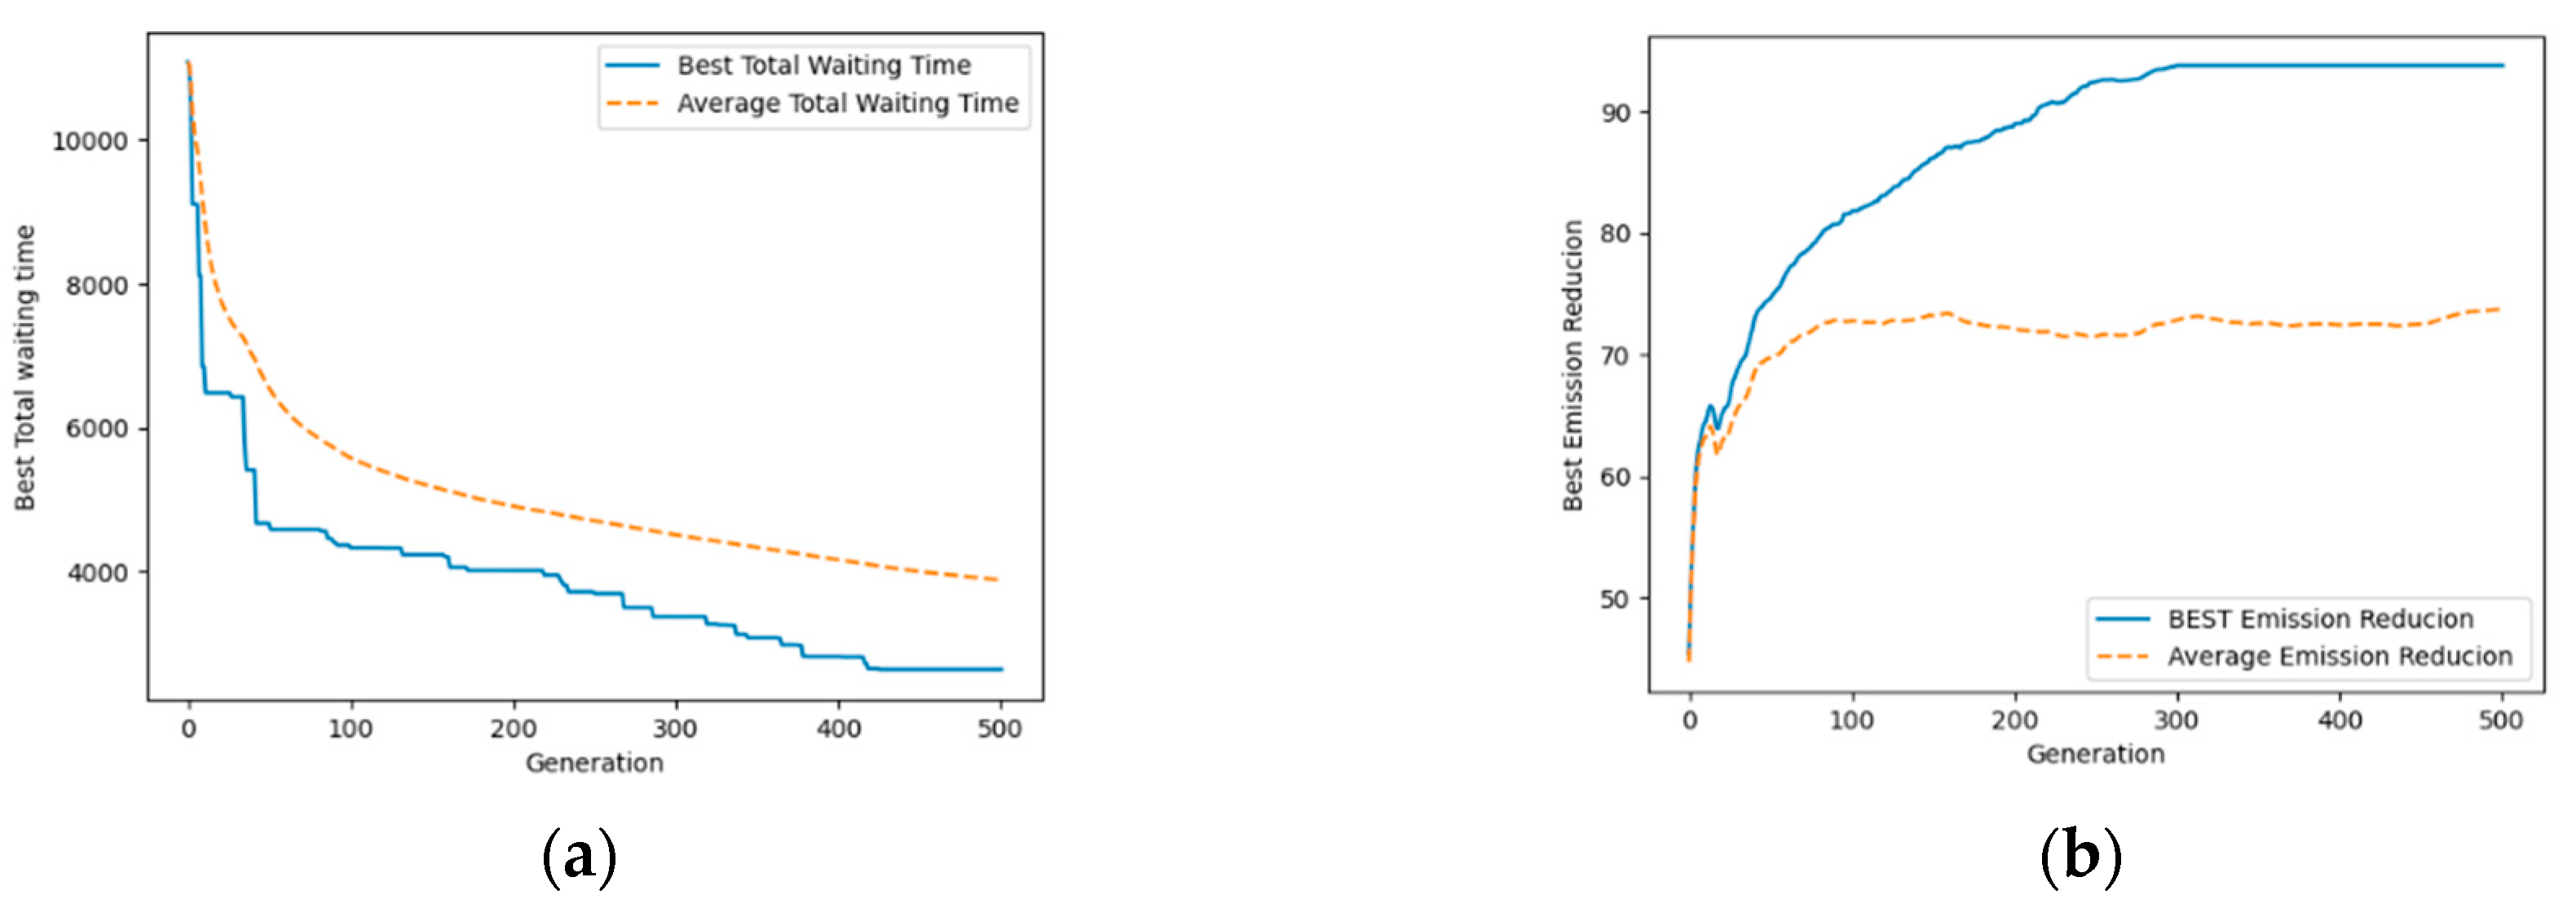
Figure 6.
Optimal speed convergence curve.
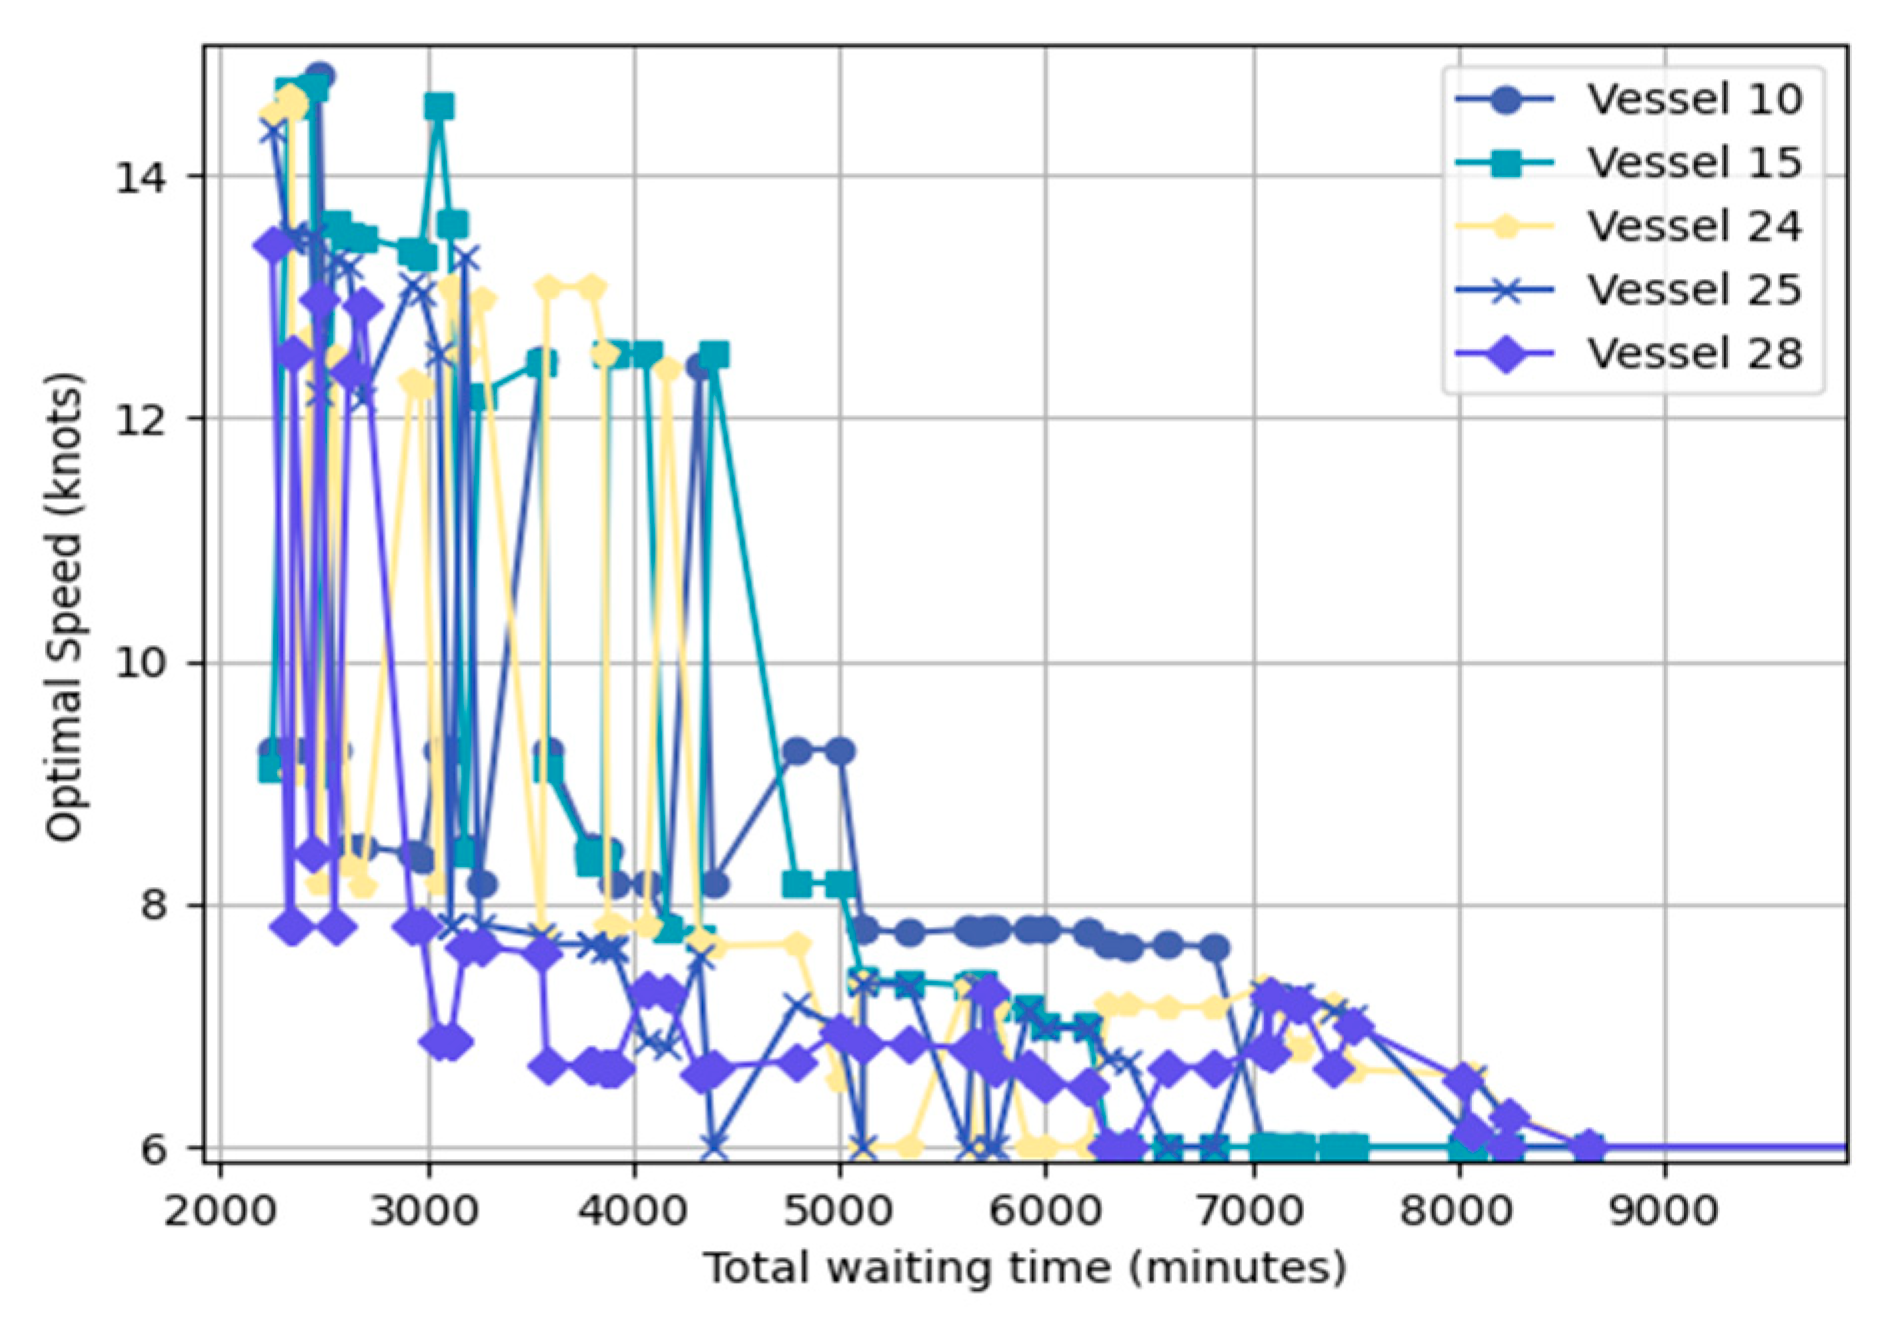
Figure 7.
Pareto front.
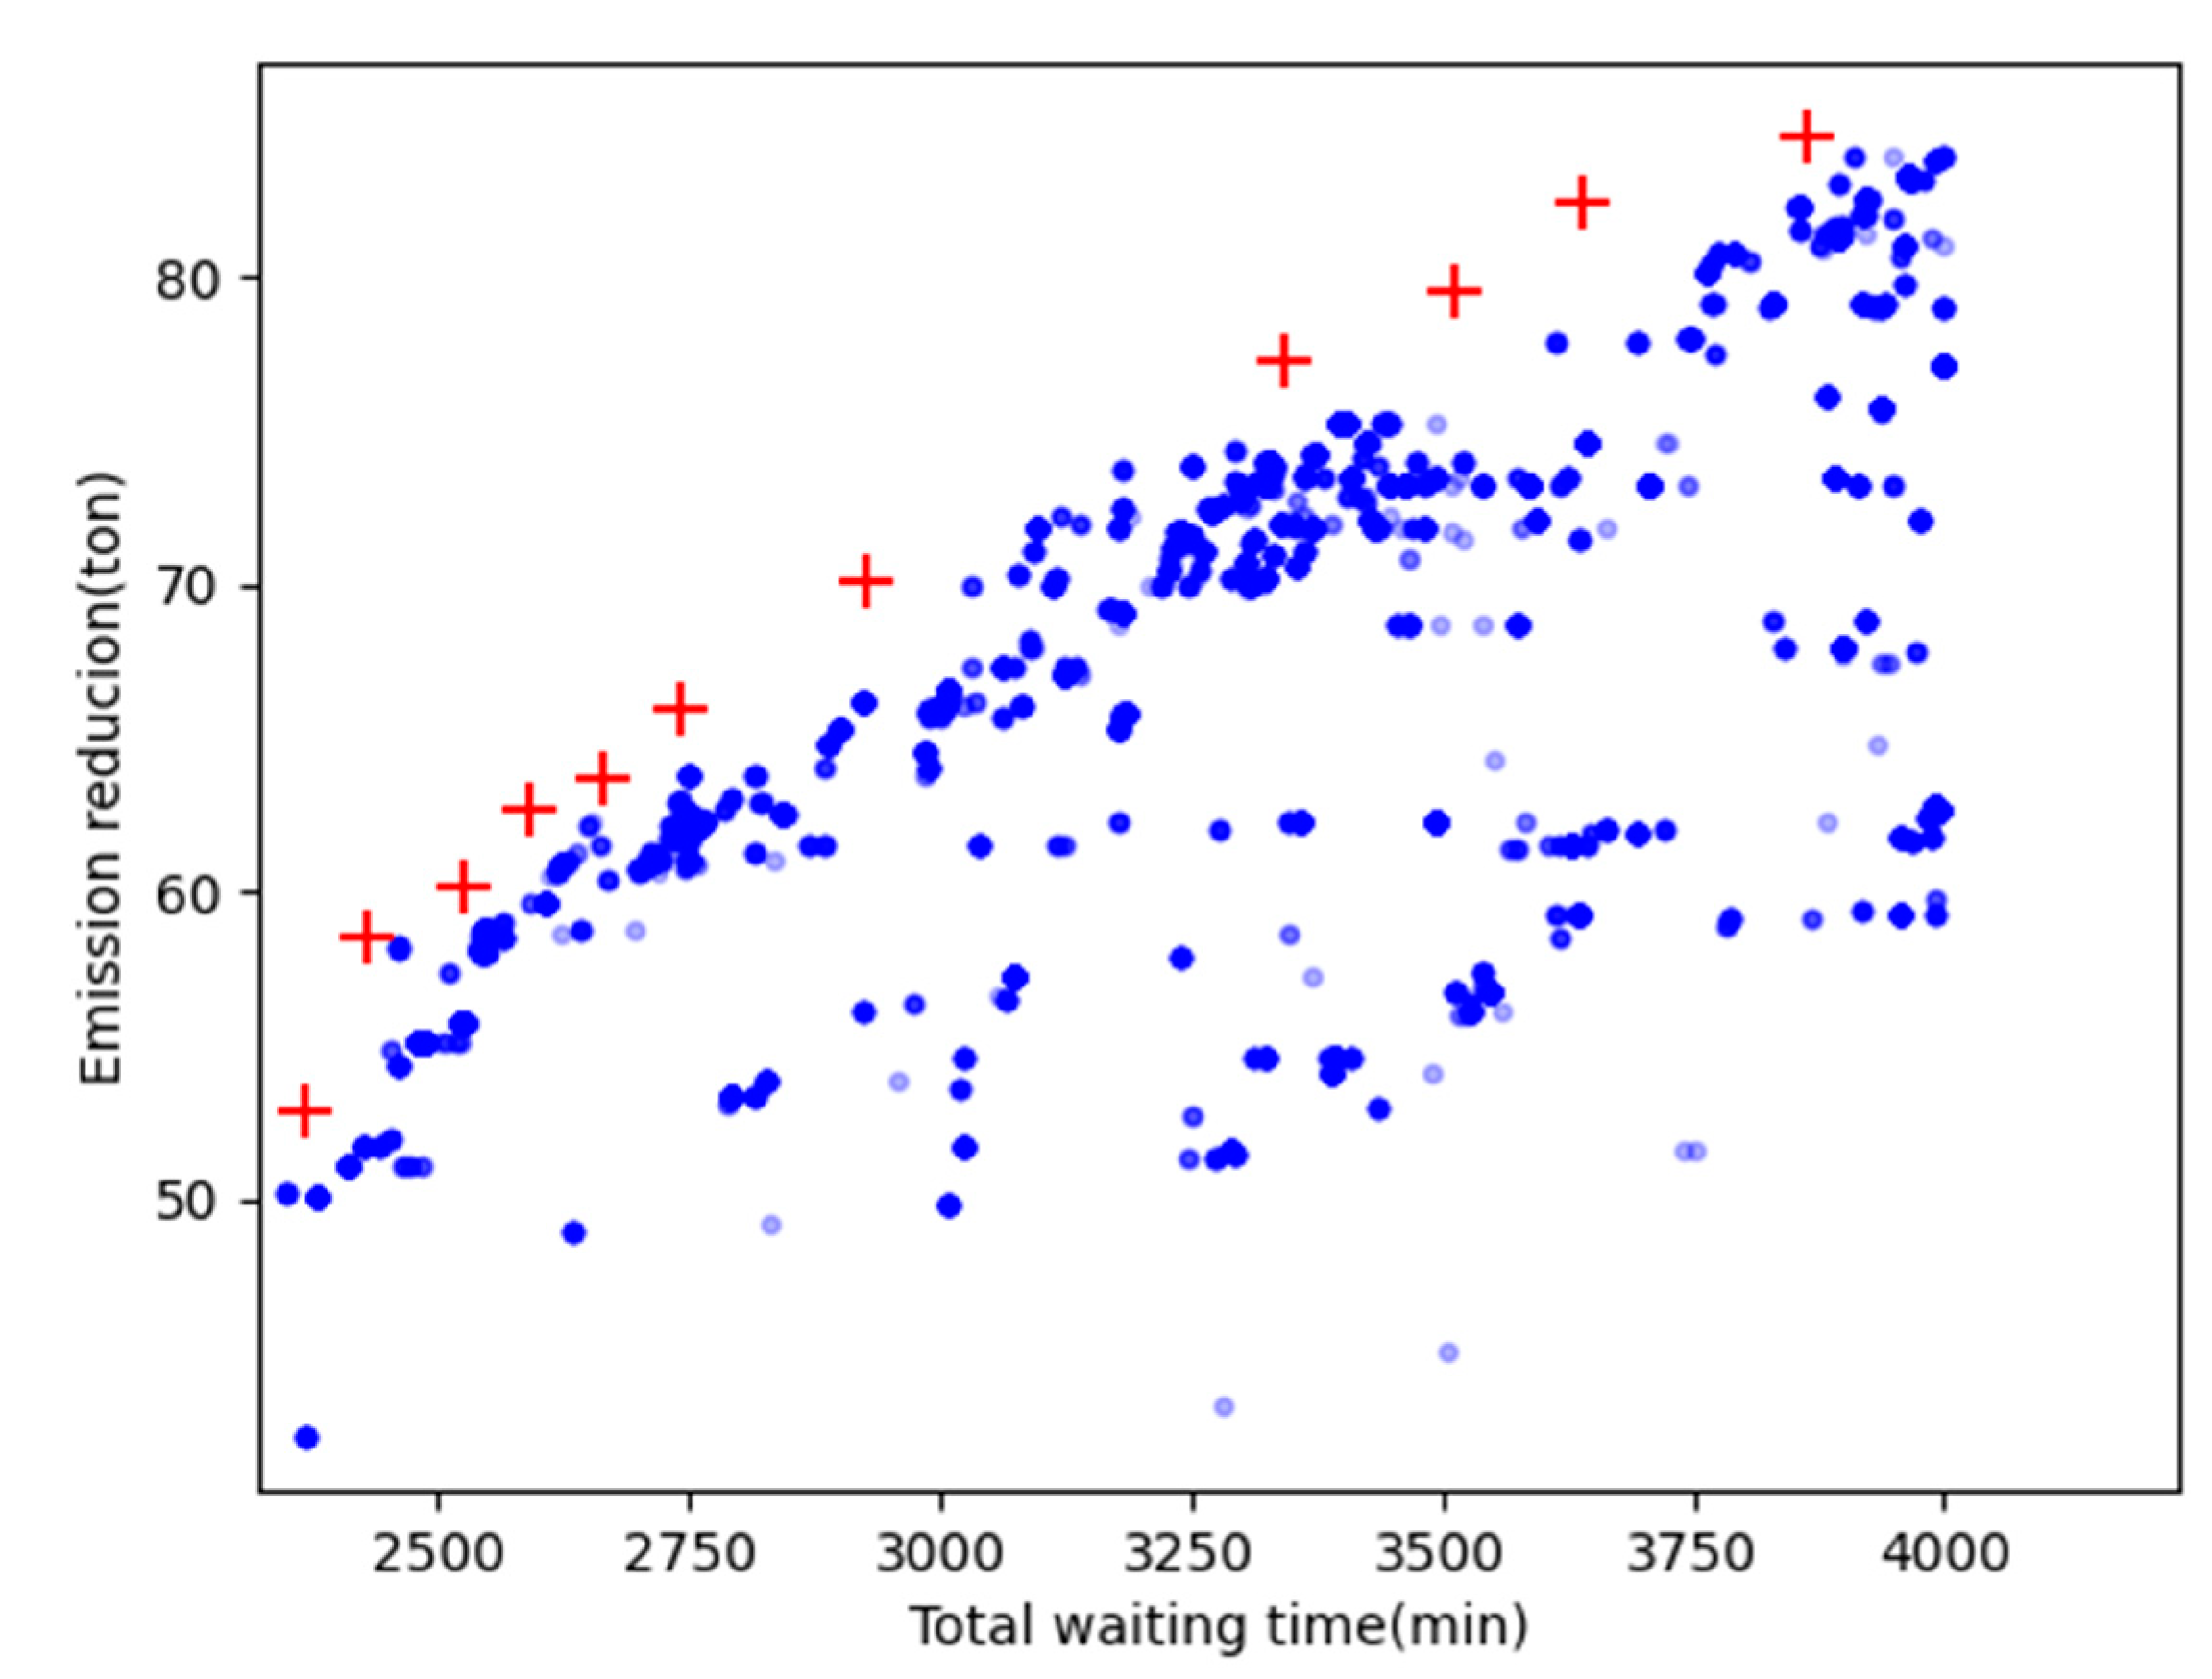
Figure 8.
Two objectives in various strategies.
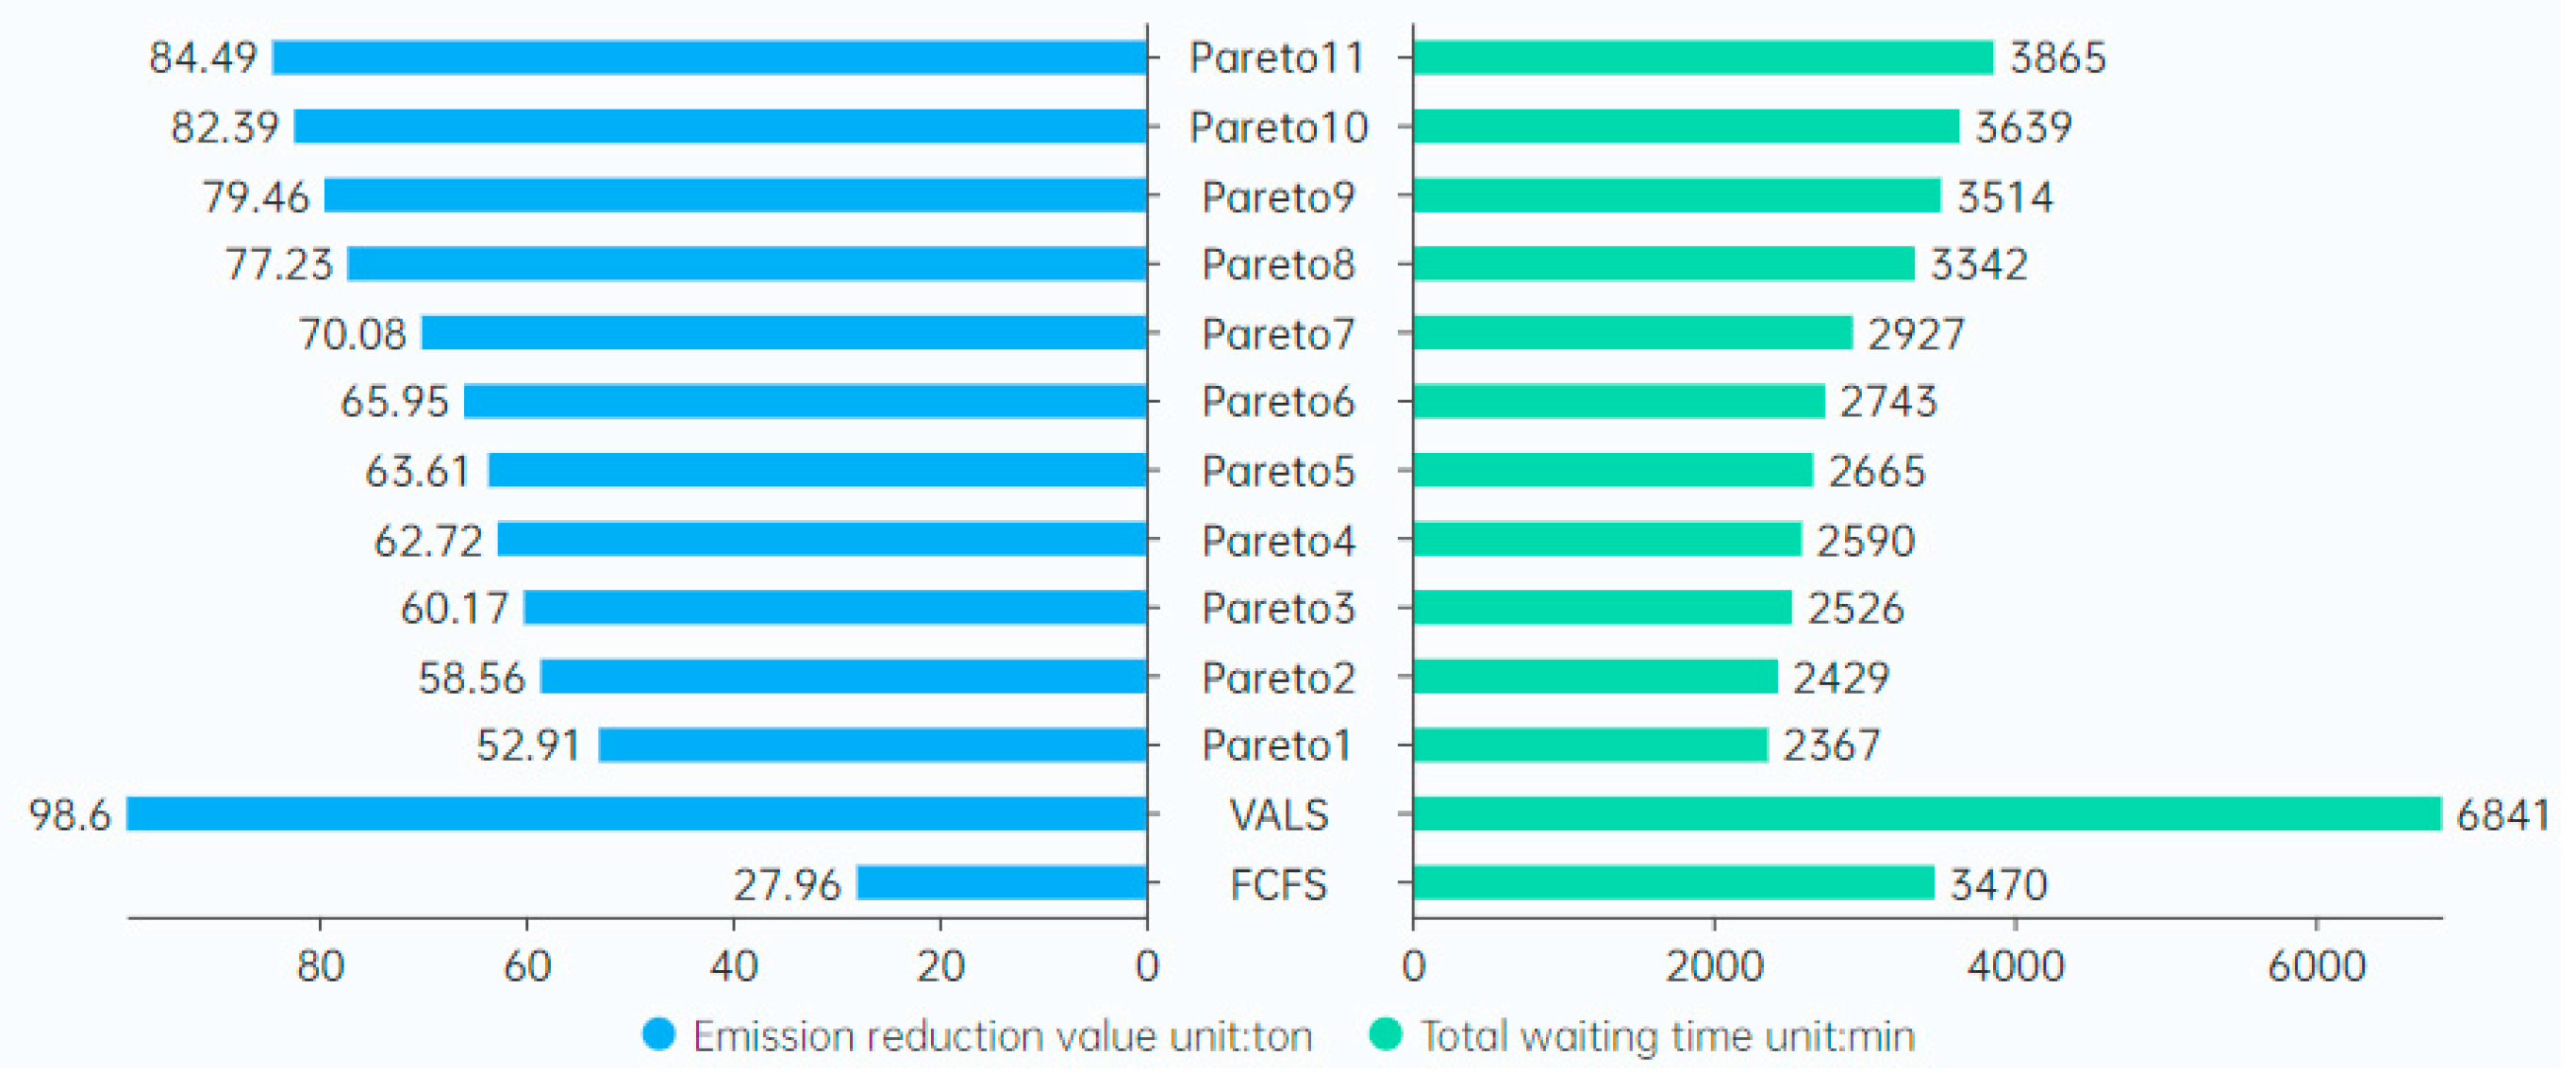

Table 1.
Information of vessels entering the port at the current stage.
| id | length | average_speed | estimated_arrival_time | draft | Virtual vessel |
| 1 | 335 | 9 | 120 | 11 | 0 |
| 2 | 295 | 7.9 | 180 | 11.4 | 0 |
| 3 | 300 | 7.4 | 180 | 13.1 | 0 |
| 4 | 147 | 11 | 250 | 6.7 | 0 |
| 5 | 337 | 12 | 255 | 11.1 | 0 |
| 6 | 304 | 10 | 280 | 10.6 | 0 |
| 7 | 143 | 8 | 300 | 8 | 0 |
| 8 | 172 | 12.8 | 330 | 8.4 | 0 |
| 9 | 289 | 15 | 350 | 13 | 0 |
| 10 | 143 | 8 | 360 | 8 | 1 |
| 11 | 330 | 15 | 365 | 14 | 0 |
| 12 | 399 | 12 | 375 | 14.2 | 1 |
| 13 | 172 | 12.8 | 400 | 8.4 | 0 |
| 14 | 137 | 12.5 | 400 | 10 | 1 |
| 15 | 100 | 7.8 | 425 | 12.6 | 1 |
| 16 | 157 | 8.2 | 436 | 13.8 | 0 |
| 17 | 252 | 6.1 | 438 | 12.5 | 1 |
| 18 | 178 | 6.5 | 442 | 13.7 | 0 |
| 19 | 312 | 13 | 460 | 13.1 | 0 |
| 20 | 173 | 12 | 460 | 10.4 | 1 |
| 21 | 259 | 13.7 | 490 | 10.6 | 0 |
| 22 | 148 | 7.3 | 523 | 12 | 0 |
| 23 | 229 | 7.4 | 550 | 13.1 | 0 |
| 24 | 217 | 16 | 560 | 13.7 | 1 |
| 25 | 223 | 8 | 575 | 12.7 | 1 |
| 26 | 330 | 12 | 600 | 15 | 0 |
| 27 | 200 | 13.3 | 628 | 14 | 0 |
| 28 | 330 | 15 | 630 | 10 | 1 |
| 29 | 180 | 7.1 | 639 | 13.7 | 0 |
| 30 | 217 | 7 | 700 | 12.9 | 0 |
| 31 | 166 | 8 | 730 | 8.8 | 0 |
| 32 | 229 | 7 | 760 | 12 | 0 |
Table 2.
Pareto optimal set.
| Serial Number | Veseel order | Emission reduction value (ton) | Total waiting time (min) |
| 1 | [1, 4, 5, 7, 6, 2, 10, 8, 13, 21, 14, 20, 15, 3, 16, 18, 11, 17, 22, 25, 29, 26, 12, 19, 28, 9, 30, 27, 23, 24, 31, 32] | 52.91 | 2367 |
| 2 | [1, 4, 5, 7, 6, 2, 10, 8, 13, 21, 14, 20, 17, 15, 11, 18, 16, 3, 22, 12, 29, 26, 19, 30, 28, 9, 25, 27, 23, 24, 31, 32] | 58.56 | 2429. |
| 3 | [1, 4, 5, 7, 6, 2, 10, 8, 20, 21, 14, 16, 15, 13, 3, 18, 17, 11, 22, 12, 29, 25, 26, 30, 23, 9, 28, 19, 27, 24, 31, 32] | 60.17 | 2526 |
| 4 | [1, 4, 5, 7, 6, 2, 10, 8, 13, 21, 14, 16, 15, 3, 20, 18, 17, 11, 22, 9, 12, 25, 26, 19, 28, 29, 30, 27, 32, 24, 31, 23] | 62.72 | 2590 |
| 5 | [1, 4, 5, 7, 6, 2, 10, 8, 13, 21, 14, 16, 15, 3, 11, 22, 17, 20, 18, 12, 9, 25, 26, 19, 28, 29, 30, 27, 32, 24, 31, 23] | 63.61 | 2665 |
| 6 | [1, 4, 5, 7, 6, 2, 10, 8, 13, 21, 14, 16, 15, 3, 20, 18, 17, 11, 22, 25, 19, 26, 12, 28, 9, 29, 30, 27, 32, 24, 31, 23] | 65.95 | 2743 |
| 7 | [1, 4, 5, 7, 6, 2, 10, 8, 20, 21, 14, 16, 13, 15, 17, 18, 11, 3, 22, 25, 12, 26, 29, 9, 28, 30, 19, 27, 32, 24, 31, 23] | 70.08 | 2927 |
| 8 | [1, 4, 5, 7, 6, 2, 10, 8, 14, 13, 21, 20, 16, 3, 19, 17, 11, 10, 26, 22, 12, 25, 9, 18, 27, 28, 29, 31, 32, 24, 27, 23] | 77.23 | 3342 |
| 9 | [1, 4, 5, 7, 6, 2, 10, 8, 17, 20, 14, 21, 16, 15, 3, 18, 13, 11, 22, 12, 29, 26, 28, 25, 9, 19, 30, 31, 32, 24, 27, 23] | 79.46 | 3514 |
| 10 | [1, 4, 5, 7, 6, 2, 10, 8, 17, 13, 14, 21, 15, 3, 19, 17, 16, 11, 22, 12, 29, 26, 28, 30, 25, 31, 9, 24, 32, 18, 27, 23] | 82.39 | 3639 |
| 11 | [1, 4, 5, 7, 6, 2, 10, 8, 13, 20, 14, 21, 15, 3, 19, 17, 16, 11, 22, 25, 29, 26, 28, 30, 12, 31, 32, 18, 9, 24, 27, 23] | 84.49 | 3865 |
Table 3.
Scheduling scheme of various strategies.
| ID | Estimated_arrival_time(min) | NSGA-II(Pareto1) | FCFS actual_start_time |
VALS |
| 1 | 120 | 120 | 120 | 120 |
| 2 | 180 | 308 | 331 | 333 |
| 3 | 180 | 499 | 500 | 500 |
| 4 | 250 | 250 | 507 | 766 |
| 5 | 255 | 262 | 509 | 509 |
| 6 | 280 | 353 | 514 | 514 |
| 7 | 300 | 300 | 519 | 425 |
| 8 | 330 | 363 | 522 | 643 |
| 9 | 350 | 664 | 524 | 524 |
| 10 | 360 | 360 | 529 | 768 |
| 11 | 365 | 514 | 532 | 528 |
| 12 | 375 | 648 | 536 | 532 |
| 13 | 400 | 400 | 542 | 538 |
| 14 | 400 | 493 | 544 | 540 |
| 15 | 425 | 497 | 546 | 1230 |
| 16 | 436 | 506 | 548 | 542 |
| 17 | 438 | 518 | 551 | 438 |
| 18 | 442 | 509 | 559 | 442 |
| 19 | 460 | 654 | 564 | 558 |
| 20 | 460 | 495 | 570 | 570 |
| 21 | 490 | 490 | 572 | 563 |
| 22 | 523 | 526 | 575 | 566 |
| 23 | 550 | 708 | 578 | 659 |
| 24 | 560 | 710 | 581 | 1304 |
| 25 | 575 | 575 | 584 | 1306 |
| 26 | 600 | 643 | 600 | 600 |
| 27 | 628 | 706 | 628 | 628 |
| 28 | 630 | 660 | 631 | 1311 |
| 29 | 639 | 639 | 639 | 639 |
| 30 | 700 | 700 | 700 | 700 |
| 31 | 730 | 730 | 730 | 730 |
| 32 | 760 | 760 | 760 | 760 |
| Total waiting time(min) | 2367 | 3454 | 6841 | |
Table 4.
Virtual Arrival vessel speed optimization of Pareto1.
| ID | Initial speed(knots) | Optimal speed(knots) |
| 9 | 17.14 | 9.03 |
| 19 | 13.04 | 9.17 |
| 23 | 16.45 | 13.54 |
| 24 | 15.89 | 13.48 |
| 27 | 14.33 | 12.74 |
Disclaimer/Publisher’s Note: The statements, opinions and data contained in all publications are solely those of the individual author(s) and contributor(s) and not of MDPI and/or the editor(s). MDPI and/or the editor(s) disclaim responsibility for any injury to people or property resulting from any ideas, methods, instructions or products referred to in the content. |
© 2023 by the authors. Licensee MDPI, Basel, Switzerland. This article is an open access article distributed under the terms and conditions of the Creative Commons Attribution (CC BY) license (http://creativecommons.org/licenses/by/4.0/).
Copyright: This open access article is published under a Creative Commons CC BY 4.0 license, which permit the free download, distribution, and reuse, provided that the author and preprint are cited in any reuse.


