
Submitted:
28 December 2023
Posted:
29 December 2023
You are already at the latest version
Abstract
In response to growing industrial demands, necessitated by larger ships and increased cargo volumes, many port authorities worldwide are undertaking a significant expansion of their infrastructure to increase their capacity. Significant expansion raises challenges such as potential congestion and environmental concerns, especially for port located in urban area as the case study explored in this paper. To address these issues, the study employs a combination of scenario analysis developed in collaboration with the port authority and logistic system simulation. This approach assesses the capacity of existing access gates to handle the increased trucking traffic and optimizes the unloading process of construction trucks at a new terminal. Key findings suggest that while the current gate capacities are adequate, optimizing unloading times at the new terminal is critical to prevent road congestion in urban area before the gate and reduce negative impacts such as sound and atmospheric pollution. The study advocates for an appointment system during peak hours to manage traffic flow effectively and underscores the importance of collaboration between the city and port authorities in managing truck traffic to mitigate congestion on the city side. Nonetheless, the study recognizes certain constraints, including the incomplete evaluation of the influence of intermodal transport on truck traffic. Furthermore, the study emphasizes the need for future research to consider the correlation between vehicle numbers and service levels, aiming to effectively adjust the time in the system.
Keywords:
sustainable port logistics
; road transportation
; access fluidity traffic congestion
; simulation modeling
; scenario analysis approach
1. Introduction
1.1. Introduction to Port Challenges in Trois-Rivières: A Response to Industrial Growth
In the realm of global trade and industry, port expansion is a critical response to the escalating demands of a growing economy. This expansion typically entails challenges like accommodating larger vessels, increased cargo volumes, and intensified vehicle traffic, all of which can put considerable pressure on existing port infrastructure. These general issues are prominently observed in the case of the port in Trois-Rivières, Québec, Canada. Here, the burgeoning industrial sector has significantly heightened the need for more robust freight services. Addressing these concerns, port authorities are planning a new maritime terminal, projected to boost operational capacity by 50%. This development, while crucial for expansion, raises issues of congestion and pollution during construction, necessitating thorough assessment of port’s access infrastructure (i.e., gates). Advanced simulation models become pivotal in this scenario for identifying bottlenecks and devising strategic mitigation plans, particularly for access gate management during construction.
1.2. A Comprehensive Literature Perspective on Ports as Complex Operational Hubs
Crucial in global trade and logistics, ports, manage diverse cargo in a challenging operational environment. Fleming et al. [1] underscore the importance of seaport terminals in the supply chain, noting their efficiency's impact on logistics networks. Access gate congestion is a critical factor in these environments, often caused by the access portal capacity to accommodate a growing number of trucks or the access service's inability to handle the flow of road traffic. Guan and Liu [2] observed that increasing freight volume has strained terminal gate capacity, leading to traffic congestion and bottleneck situations due to limited access portal capacity.
Kulkarni et al. [3] emphasize that port capacity hinges on berths, yards, and gates, often limited by the lowest capacity among these resources. The recent shift in literature towards landside congestion underscores the necessity for expansive research, encompassing varied geographic contexts and the impacts on different stakeholders [2,4]. A lack of study on truck congestion at bulk cargo terminals, an emerging concern due to its effects on urban areas, has been identified [5,6].
To evaluate the port of Seville's ability to handle an increase in the demand for products, [7] utilized simulation modeling by increasing the number of products being processed through the port. The simulation model enabled them to determine that the port could manage the rise in demand in most cases.
1.3. In-Depth Analysis of Strategies and Simulation Insights for Mitigating Landside Congestion
Enhancing port capacity and implementing regulatory truck arrival policies are central in the academic dialogue on mitigating landside congestion at ports. The unsystematic arrival of trucks at seaports significantly contributes to access gate congestion [10]. In an extensive literature review, exploring truck congestion at ports [11] identified key strategies for reducing congestion ranging from infrastructure optimization to managing truck arrivals. Dragovic et al. [5] identified 226 articles on simulation in the port industry, highlighting the extensive use of discrete event simulation, particularly in containerized ports, aligning with [11] findings on the need for varied congestion mitigation methods. Vadlamudi [12] and others advocate for a broadened scope of research, considering environmental impacts and different terminal types, echoing with a holistic approach to sustainable mobility and congestion challenges. This enriched perspective underscores the complexity of managing landside congestion and the importance of considering various stakeholders, such as trucking companies and port’s terminal operators, in developing comprehensive congestion management strategies. The need for comparative studies across different terminal types and a deeper analysis of environmental impacts is suggested [6,8], while a simulation-optimization study mainly focusing on outbound gate systems and specific vehicle types underscores a more comprehensive approach [3]. The academic dialogue on mitigating landside congestion at ports primarily revolves around enhancing port capacity and implementing regulatory truck arrival policies. Kourounioti and Polydoropoulou [10] highlight that the unsystematic arrival of trucks at seaports substantially contributes to access gate congestion. Vadlamudi [12] proposed a scenario analysis approach using simulations to alleviate congestion at port terminals. However, there is a recognized need for broader studies that encompass various terminal types and consider environmental impacts. The necessity for more inclusive studies, covering different terminal types and environmental considerations, is acknowledged. Suggestions for comparative studies across various terminals and in-depth environmental impact assessments are made [6,8], and a study focusing on simulation-optimization for outbound gates and specific vehicle types highlights a broader approach [3].
1.4. Truck-Based Appointment Systems in Congestion Management: A Closer Look
Huynh & Walton, [9] suggested that the terminal appointment system could be improved by assigning each truck an appointment time. A small change in the truck arrival pattern can significantly reduce the queue in the access gate port by implementing two static and real-time appointment systems [8]. The adoption of truck-based appointment systems [2,13], has shown promise in reducing congestion at access gates. These systems' effectiveness were confirmed in various global ports [14,15]. However, current research highlights gaps, especially in data collection and analysis, affecting truck movements and access capacity utilization understanding. Potgieter [16] notes that congestion risks at ports can emerge from diverse factors such as inadequate capacity, low operator productivity, adverse weather conditions, and operational system-related problems. Other studies have developed container pick-up time models to predict truck arrival and proposed multi-objective optimization approaches to address intermodal transport and its impact on port efficiency [17].
1.5. Assessment of Port Performance Metrics in Addressing Landside Congestion
In addressing the complexities of landside congestion at ports, a critical aspect is the assessment of port performance using various metrics. These include average and standard deviation of truck queuing times, server utilization, maximum queue length, gate service time, gate utilization rates, and truck turnaround time [1,8,18]. Kim et al. [19] highlight the waiting time of heavy vehicles as a key customer service indicator, however, truck turnaround time is considered as the most telling land-side performance metric [14,20]. Brooks and Schellinck [21,22] emphasize the need for reliability measures in port services, particularly regarding truck turnaround times, a gap that still exists in current research. These metrics are essential for a comprehensive approach to congestion management, providing a robust framework for evaluating the effectiveness of various strategies and solutions in improving port operations and mitigating congestion. Integrating these insights into our methodology ensures a nuanced and effective assessment of port performance during terminal construction.
1.6. Our Comprehensive and Informed Approach to Addressing Landside Access Congestion
Recognizing the gaps in existing literature, particularly regarding non-containerized general cargo urban ports, our multifaceted approach is informed by an array of studies, including those that address the previously noted scarcity of genuine case studies. Our methodology integrates spatial-temporal analysis with detailed port access data, considering the chronological nature of operations. Key advancements include:
- The adoption of a nuanced simulation parameter configuration that considers spatial and temporal factors. The port is segmented into areas with distinct traffic and service level characteristics, allowing for a more dynamic representation of inter-arrival times based on access time. This methodology enables the detection of peak times and access-waiting times, addressing the shortcomings in previous studies where the temporal aspect of truck arrival and departure failed to reflect real-world variability.
- A scenario design approach is utilized, encompassing both partner engagement and a logical process to derive advised recommendations. This involves developing and analyzing various scenarios, from reference and exploration to improvement and robustness, each informed by the previous level's insights. This hierarchical approach ensures that each scenario is rooted in realistic port constraints, making our recommendations more practical and feasible for implementation.
- A key novelty of this paper lies in our approach to detailing port access data, which has enabled a comprehensive exploratory analysis, particularly focusing on the chronological aspects of access operations. This study stands out by differentiating between four types of vehicles, considering factors like inter-arrival times, access times at entry and exit, and turnaround times at the port. By incorporating realistic time variability, our approach marks a significant advancement over existing literature, offering enhanced relevance and accuracy. This distinct methodology is not only a contribution of this paper but also finds its practical demonstration in a real case study. The detailed exploration of these aspects, especially in the latter part of the analysis, sets the stage for a more informed and effective approach to port access management. Additionally, the approach, incorporating varied analytical techniques, offers a comprehensive understanding of managing port access during terminal construction. This research thereby fills critical gaps in the existing literature and contributes significantly to the field of port access management.
2. Materials and Methods
A comprehensive Framework has been devised to analyze the fluidity of access to Trois-Rivières Port during the construction of a new terminal that is expected to enhance the port's capacity. Fluidity access, referring to the ease and efficiency with which vehicles, particularly trucks, can enter and exit a port, is a critical aspect of this study as it directly impacts the overall performance and operational efficiency and sustainability of the port. The Framework combines simulation and a scenario-based analysis approach, which facilitates experimentation in various exploration, prediction, or optimization contexts. Its components encompass data collection and processing, simulation model design, and scenario design approach. Factors influencing fluidity access include the number of access gates, traffic management, and infrastructure design, and by addressing and optimizing these factors, the study aims to improve the flow of vehicles and enhance port operations.
To better understand the Framework, it is important to first provide a brief overview of the Port of Trois-Rivières depicted in Figure 1. This port is composed of a set of terminals that are categorized into different areas based on the types of goods they handle. These include the general cargo terminal (Area A), grain terminal (Area B), and liquid and solid bulk terminal (Area C). Currently, there are two access gates to the port: the main gate (MG), which has three entries and one exit, and the secondary gate (SG), which has one entry and one exit. Most cars and trucks pass through the MG and use the automatic entry mode with access cards either at MG or SG. For the ones without access cards, a manual registration process is mandatory at MG.
To increase the port's capacity, the port authority is planning a major expansion project through the construction over two years of a new terminal which will result in a significant increase in traffic. To avoid construction trucks waiting outside the port, a Kanban system has been implemented, capable of accommodating up to 15 trucks waiting for unloading at the construction area. With this understanding of the port, we can now explore the various components of the Framework.
2.1. Data Collection and Processing
Throughout this work, the port authority is referred as the industrial partner who will actively participate in data communication and the design of scenarios for evaluation.
2.1.1. Data Collection
Our industrial partner played a pivotal role in providing us with the necessary data to simulate the logistics activities related to freight and construction within the port. The data provided includes access raw data for entry and exit through the two active gates, such as the entry and exit time of trucks (time-stamped in 1 millisecond), truck and car IDs, maritime subcontractors, the destination terminal, and the type of goods handled by truck without automatic access cards, covering the period from 2015 to 2020. Furthermore, we requested additional data on the volume of freight and the total number of trucks per area during this period. To forecast data on construction trucks, we relied on estimates provided by the industrial partner based on the civil engineering planning of such major works and experiences from previous construction projects held at the port. Surveillance videos from security cameras located at the main and secondary gates were utilized to perform time studies and measure service time for registering trucks and cars at the entry and exit of the access gates. Table 1 outlines the structure of the collected data.
2.1.2. Data Processing
The data collected, as illustrated in Table 1, was used to segment the port into three distinct areas. This enabled the access data to be distributed based on the designated areas, and simulation parameters were generated according to the destination areas. This geographical approach aims to uncover inherent fluidity properties associated with area activities. Data exploration was conducted to detect correlations between predictor parameters and target or decision variables, including performance indicators.
- Segmentation of the Port Into Four Areas
Historical data analytics revealed that only about a quarter of the accessed trucks had known destination areas since this information is not registered for automatically accessed trucks. To overcome this limitation, a two-step approach was adopted. Firstly, the automatic trucks were manually assigned based on the maritime subcontractor's intervention area indicated in the historical access data. For trucks consigned by subcontractors operating in multiple areas (55%), Python programs were developed to randomly allocate them to areas A, B, and C based on the global annual truck allocation flow provided by the industrial partner. This process was repeated 50 times to generate 50 random allocation vectors. The percentage distribution of trucks according to the data provided by the industrial partner is 32%, 36%, and 32% respectively for areas A, B, and C. Area D corresponds to the new terminal scheduled for construction.
To simulate logistics systems using queue theory, three fundamental parameters are necessary. These parameters control the arrival and departure of entities (vehicles) to and from the system (port). The first parameter is the inter arrival time (IAT), which determines the pace of vehicle arrivals. The second parameter is the time in the system (TS), which is the sum of the registration time at the entry, the stay time within the system, and the registration time at the exit. The system is considered as a black box in this approach, and fluidity is achieved by controlling the pace of vehicle arrivals and TS, which encompasses the access registration time. The allocation frequency of different vehicle types to the access gates is determined using historical data. Specifically, over 70% of trucks and 90% of cars go through the MG, while the remaining vehicles go through the SG. To obtain accurate statistics on the number of vehicles frequenting the port, data cleaning was performed to remove outliers, specifically trucks that stayed for more than 24 hours. Based on this cleaned data, historical records show an average of 43,189 trucks and 108,000 cars per year. Table 2 illustrates a summary of the collected data and its characteristics.
Time in the System
The port's TS varies due to time and location-specific factors for each area. Including these factors allows the TS parameter to better represent the vehicle behavior based on type, area, and entry time. Figure 2 displays the hourly TS fluctuation across various areas, suggesting a potential drop in service quality during busy periods. Figure 3 illustrates the relationship between TIA and TS, showing a decrease in service levels (high TS) when arrival rates are high (low TIA). These insights are essential for understanding vehicles fluidity.
It is worth noting that the shape of the distribution of TS varies in terms of amplitude and variability by hour and by area. To control this effect, a distribution of TS by hour and by area was chosen and statistical transformations were applied to the data to fit the normal distribution when the initial distributions were beta, gamma, lognormal, or Weibull.
- Inter-arrival time
Upon analyzing historical data, it has been concluded that there is a notable risk of traffic congestion between 6:00 and 17:00. Consequently, this study focuses on this specific time period to investigate traffic flow. It is important to note that congestion is particularly prevalent during this time frame as illustrated in Figure 4. This figure demonstrates three distinct patterns of IAT throughout the day. Figure 4.a depicts the period from 0:00 to 6:00, indicating smooth traffic flow. The period from 17:00 to 00:00, shown in Figure 4.b, experiences moderate fluidity, particularly between 17:00 and 22:00. However, the highest traffic activity occurs between 6:00 and 17:00, as demonstrated in Figure 4.c. To simulate accurately, this study specifically focuses on the daily period from 6:00 to 17:00, Monday to Friday, as this is when congestion is most likely to happen. Moreover, IAT variability is significant from hour to hour. Therefore, to account for this phenomenon, the IAT is assessed every fifteen minutes to capture congestion accurately. Thus, the probability of vehicle arrival changes every fifteen minutes according to the flow registered in historical data.
On the basis of these trends, a model with relevant parameters was developed to evaluate fluidity. This model processes each vehicle entering the system according to its characteristics such as its type, entry and exit registration time, destination area, entry time for TS and entry quarter-hour for IAT. The simulated period selected, as mentioned earlier, is from Monday to Friday from 6:00 am to 5:00 pm, where the risk of congestion is high.
- Access Registration Time
As mentioned earlier, access registration time at entry and exit is extracted from surveillance videos for different types of vehicles. The results are summarized in Table 3.
- Parameters related to area D (new terminal)
Drawing from data on major project planning and past terminal construction, the industrial partner provided key forecast parameters. These were based on civil engineering plans and previous experiences at the port, crucial for determining the service level for the construction area. The parameters involved include the number of trucks that will visit the port per day, the number of trucks that can unload simultaneously (4 trucks), the estimated unloading time per truck (15-20 minutes) as well as the capacity in number of trucks that can be accommodated by the port while waiting for unloading (up to 15 trucks).
2.1.3. Simulation Model Design and Validation.
The simulation models were developed using version 14 of the Simio software. Various objects and processes from the Simio library were utilized to configure flows, entry/exit gates, areas (A, B, C, and D), and the Kanban zone. Specific statistics were implemented to align with fluidity performance criteria. The simulation models took into account the following object implementations and parameters:
- Four flow sources for various vehicles (entities) types (manual access trucks, automatic access trucks, construction trucks, and cars) connected to current and potential access gates;
- A rate table is utilized to generate a flow of entities every 15 minutes, based on historical flow data. This table allows for the simulation model to capture the variability of IAT accurately, ensuring that the flow of entities aligns with historical trends;
- Stochastic entry and exit registration service times specific to each vehicle type;
- Allocation of each vehicle to a destination area based on a stochastic flow and a specific stochastic TS;
- A Kanban zone capable of accommodating up to 15 trucks waiting for unloading;
- Upon completion of their stay, vehicles depart from the port through a specifically designated exit gate;
- The simulated period is from 6:00 am to 5:00 pm daily, with a replication of 44 days to achieve a state of convergence for stochastic parameters;
- Construction trucks that exceed operational capacity are purged from the system and recorded for analysis.
"Two simulation models were developed to evaluate scenarios involving the current MG and SG, as well as an additional third gate. In Figure 5, we present the design and implementation of the two-gate simulation model, showcasing the number of entries (E) and exits (S). The two-gate model, representing the existing MG and SG, served as a critical tool for validating the simulation against real-world conditions. The three-gate scenario, on the other hand, incorporates the existing MG and SG, plus a new gate as proposed in the ‘scenario design approach’ mentioned in the introduction. This model was validated with low uncertainty and applied to our case study, leading to substantial recommendations for decision support aimed at enhancing access fluidity during the construction period."
2.2. Performance Indicators
The performance indicators adopted in this study are the most commonly used in queueing theory to measure access fluidity to stations within a system. The focus is on the gates under investigation and the parameters that accommodates construction trucks within the port. The assessment involves evaluating the number of trucks waiting for access or encountering difficulties accessing the port due to inadequate service levels, as well as the waiting time and the capacity utilization of the gates.
2.3. Scenario-Based Analysis Approach
By designing parameters and simulation models that take into account time and space, potential congestion can be detected for specific contexts. The model's ability to predict such congestion, combined with the scenario-based approach, highlights the effectiveness of the methodology presented in this framework.
To conduct scenario-based analysis, a four-step approach is employed. The first step involves generating reference scenarios based on selected historical data. The second step focuses on designing exploration scenarios to evaluate the impact of increased traffic and the addition of a new access gate on the existing infrastructure. In the third step, improvement scenarios are developed to address identified issues and optimize the utilization of the access infrastructure. Finally, scenarios are created to test the access gate's fluidity in varying contexts by altering the access service level. Both reference and exploration scenarios were developed with the industrial partner's participation. Figure 6 provide an overview of the scenario design approach detailed in next subsections.
2.3.1. Reference Scenarios
As a precautionary principle, this study adopts two baseline scenarios that are not based on the average historical traffic but rather on the peak seasons for freight activity at the port. The rational behind the selection of such specific scenarios is to focus on extreme and moderately congested cases. The first scenario is based on the data from the busiest day on average during the reference period (2017-2019), while the second scenario is based on the 14 busiest weeks of the year. The choice of this period is based on an exploratory data analysis of the traffic flow during the reference period. The reference scenario period is divided into two known seasons of the year and were validated through discussions with the industrial partner. The first season (7 weeks) is the spring season, which involves the resumption of agricultural and construction activity after the winter season (grain, fertilizers, building materials, steels, etc.), while the second season (7 weeks) is the winter period during the winter maintenance season (abrasives, de-icing salt, sand, etc.). Therefore, the first reference scenario was established by using the busiest day on average during the year, and the second scenario was based on the 14 busiest weeks of the year, as illustrated in Figure 7. In both cases, the parameters were determined by considering the relevant reference period.
- Exploration and Improvement Scenarios
The goal of the exploratory scenarios is to examine the capacity of the current infrastructure (access gates) to manage access during the construction of the new terminal, as well as to evaluate the impact on traffic flow if an additional access gate is constructed. On the other hand, the improvement scenarios aim to tackle two main capacity issues that were identified during the analysis of the exploratory scenarios. These scenarios include efforts to establish a balance in the utilization of access capacity between the two existing gates for trucks, as well as attempts to address other problems related to the design of the expected level of service for construction activity.
- Robustness Analysis of the Main Gate Access Fluidity
This section of the framework was added in response to the results indicating that the capacity seems sufficient to handle the growing number of trucks. However, it is essential to conduct additional analysis to assess the potential effects of a reduction in service level or entry capacity on access fluidity. To achieve this, several scenarios were proposed to evaluate the impact of different factors, including the duration and frequency of slowdowns, as well as the number of entrances and trucks visiting the port.
3. Results and Interpretations
Before analysis, all simulation results across various scenarios were validated for parameter convergence. This section presents an analysis of the baseline, exploratory, improvement, and fluidity robustness scenarios, evaluated against different criteria. The following are the configurations and results of various scenario types, as per the previously presented framework.
3.1. Reference Scenario Analysis Results
As delineated in the methodology section, the baseline scenarios are predicated upon two distinct periods of the year characterized by varying levels of traffic flow. Specifically, baseline scenario 1 (BLSc1_bd) corresponds to the average day (2017-2019) with the highest congestion of the year (bd: busiest day), which occurs on Day 5 of Week 47. Meanwhile, baseline scenario 2 (BLSc1_14bw) pertains to the most congested period of the year, encompassing Weeks 19-25 and 43-49. The parameters for both scenarios are itemized in Table 4.
According to historical data, the used capacities of the access gates are shown in Figure 8. The main interpretations of the baseline scenarios are presented as follows:
- The access capacity is largely underutilized, especially in the case of SG where the entry/exit used capacity does not exceed 4% to 6%. The crowding observed in practice is primarily attributable to inadequate planning of truck arrivals;
- Imbalance of used capacity between MG and SG gates. The Figure 8 a depicts the utilization capacity of the two access gates;
- The historical capacity shows that the port can accommodate more than 300 cars and 76 trucks at the same time;
- The time system is 1.23 h on average and 2.87 h as a maximum for freight trucks while the TS is 3.38 h on average for cars;
- Regarding MG, queues at the entrance can reach up to 6 to 7 vehicles, while the maximum number of vehicles at the exit is 8 to 12 for scenarios 1 and 2, respectively. As for SG, the maximum number of vehicles waiting to access cannot exceed three, as illustrated in Figure 8b.
The exploratory scenarios will be analyzed in relation to these two baseline scenarios.
1.1. Results of Exploratory Scenario Analysis for Two Access Gates
Table 5 presents the parameters of this exploratory scenario batch, which aim to investigate the impact of an increase in the number of freight trucks. ExpSc1 and ExpSc2 reference historical data for flows BLSc1_bd and BLSc1_14bw for two access gates. In addition, the impact of construction trucks (CT) flows is explored, taking into account the increase in the number of freight trucks (FT). These exploratory scenarios (ExpSc3-6) are intended to assess the effect of increased FT and CT traffic on the flow of existing access infrastructure. These scenarios utilize forecasted data for the construction period and take into account the unloading of four trucks simultaneously, with an unloading time of 15 and 20 minutes, respectively.
Figure 9 depicts the impact of an increase in freight and construction trucks on the utilized access capacity, as compared to the baseline scenarios. Based on the forecast period data, an increase in 20% freight trucks along with construction trucks has a moderate impact on the utilized capacity of access gates. However, the average number of waiting trucks at the end of the shift day is around 25% of the total number of construction trucks, potentially reaching a maximum of 50%. When the unloading service time is 20 minutes, the issue does not arise at the access level but rather at the operational capacity level in the new terminal, which negatively affects traffic flow on the city-side. The utilized capacity increases significantly at 15 minutes of unloading time without significantly compromising the access fluidity. In this case, the number of waiting trucks is on average 10%, and at most, 30% of the number of construction trucks, as illustrated in Figure 10. This situation still remains unfavorable for traffic flow on the city-side, where an average of 25 trucks waits for access to the port. Further experiments with lower unloading times showed that 2.5% additional utilized capacity was observed at the two gates when all the construction trucks are purged in the case of two-gate scenarios.
1.2. Three Gates Exploratory Scenario Analysis Results
Within this set of scenarios, we are exploring the impact of increasing an access gate, designated as New Gate (NG), with one entrance and one exit, which serves a specific destination as illustrated in Table 6.
In comparison to the two-gate scenarios, an increase in freight and construction trucks in the three-gate scenarios reveals that the addition of a new gate dedicated to automatic trucks destined for area B eases the load of the two existing gates, as shown in Figure 11. This observation is particularly noticeable when the new gate is dedicated to automatic trucks destined for area B and 20% of the traffic to the area A. The utilized capacity for the new access gate ranges from 6.1% to 6.8% at entry and 3.2% to 3.6% at the exit.
In the case of scenarios with two and three gates, the average and maximal number of construction trucks waiting for access due to insufficient operational unloading capacity is quite noticeable. This context is illustrated in Figure 12.
Figure 13 shows that 41 trucks (23 in average) remain on the city-side after 11 hours of running simulation time for the scenario ExpSc9.
After conducting the first set of exploratory scenarios, it was observed that access gate capacity was not a significant problem. However, the number of construction trucks waiting caused significant traffic issues on the city-side. Additionally, it was found that the flow of trucks, based on historical data, did not allow for an equitable distribution between the different gates. To address these issues, improvement scenarios were designed to optimize, on the one hand, unloading service time at the new terminal and, on the other hand, access flow between the existing gates.
1.3. Improvement Scenarios Analysis Results
The improvement scenarios aim to address the anomalies observed during the exploration of the operational access capacity to the port, in the context of an increase in trucks, and in response to the insufficient unloading service level for construction activity at the new terminal.
For the set of scenarios aimed at finding the flow balance between the access gates, flows ranging from 10% to 90% for MG and their complement for SG were explored to determine the balance flows between the two existing gates. These flows concern automatic access freight trucks and construction trucks. However, manual freight trucks all pass through MG, and cars maintain historical flows. Regarding the set of scenarios aimed at optimizing unloading service time at the new terminal, the scenarios explore the unloading capacity in terms of the number of trucks unloading simultaneously, depending on the unloading time, which varies from 15 to 25 minutes. The objective is to minimize the waiting time for trucks outside the port to the greatest extent possible. Table 7 summarizes the parameters of the improvement scenarios.
For effective traffic management and reduced waiting times, it is crucial to balance the traffic load between the two access gates. Taking into account that all manual access trucks and over 90% of cars use MG based on historical data, the findings suggest that the traffic flow to MG should not exceed 30%, with the remaining 70% being directed to the SG in the absence of construction trucks. However, with the presence of construction trucks, the flow to MG may increase to 50% in a two-gate scenarios, as shown in Figure 14, and between 40% and 50% in three-gate scenarios. The SG manages the remaining traffic flow. As a reminder, it's important to note that from scenario 1 to scenario 9, the flow of trucks passing through the MG ranges from 10% to 90%, with the remaining traffic passing through the SG.
However, the findings from the optimization scenarios for unloading services at the construction area are depicted in Figure 15. The number of trucks that should simultaneously unload is dependent on the actual unloading time to minimize wait times outside the port. Acceptably, a minimum of 5 trucks unloading simultaneously may result in an average of 5 trucks waiting. By increasing the number of trucks to 6, only one truck may be expected to wait on average. For a service time of 20 minutes, the optimal number is 8 trucks, with 7 trucks also being an acceptable alternative. However, for a service time of 25 minutes, 9 trucks unloading in parallel is the optimal number.
1.4. Robustness Tests for the Fluidity of the Main Gate Access
Based on the prediction of traffic flow with an increase in trucks during the construction period, the current access context (which consists of two gates with 4 entrances and 2 exits) can handle the additional truck flows, even in the busiest historical periods of the year. Since the secondary gate is the least influenced because of the low flow handled at the entry/exit, we proceed with another step of experiments for testing the impact of the access service slowdown at the main gate. In addition to the parameter related to the number of entrances (historically 3 entrances), some parameters have been devised to constrain the service level at the main gate, such as the slowdown factor of the registration service (number, duration and frequency) and the trucks increasing. Table 8 summarizes the parameters of the experimented scenarios.
The number of vehicles per day is around 873, divided into 395 cars, 201 trucks with automatic access mode, 55 trucks with manual access mode, and 222 construction trucks. With a construction truck unloading service level of 15 minutes and four trucks unloading simultaneously, an average of 28 trucks per day remain in backlog due to inadequate unloading service. The number of waiting trucks takes into account only those trucks queuing to access the port and are held up exclusively due to insufficient access service.
- The objective of the first set of scenarios (24 scenarios) was to examine the effects of access service degradation, which can result from factors such as adverse weather conditions, delays, registrar training, or computer and electrical failures, on access fluidity. By exploring the impact of slowdowns ranging from low to high across varying entrance configurations (from 1 to 3 entrances), the study aimed to provide insights into how different degrees of slowdown, frequencies, and simultaneous entrance availability affect the overall access experience.
- The second batch (8 scenarios) assumed an extreme access conditions. Only one entrance available and a slowdown factor of 40% and 50% for frequency of slowdowns ranging from 1, 2, 4 and 6 per hour. The objective of this batch is to experiment the impact of the extreme conditions of the number of entrances (just one entrance) under different slowdown rates and slowdown frequency degrees.
- In the final set of scenarios, the goal is to assess the impact of a plausible increase in the number of trucks, ranging from 20% to 50%, while operating with three entrances under continuous significant service degradation (40%) over time. This consideration of truck number increase is driven by the unpredictable nature of the construction context, where the volume of trucks can fluctuate based on the subcontractor responsible for the new terminal's construction. Although the exploratory scenarios use an average truck number, it is crucial to account for the potential variability in construction and freight truck numbers and its effect on port fluidity. As such, these scenarios aim to accommodate possible changes in truck volumes and their implications for port operations and efficiency.
The Simio experiments took place over a 44-hour duration, divided into four 11-hour days, and included 10 replications as well as a 10-hour warm-up period. A 95% confidence interval was utilized for the study. The outcomes of the various scenarios can be found summarized in Table 9.
The interpretation of the findings for each batch of scenarios is as follows:
Batch 1 (Scenarios 1-24): This batch focuses on the context of using the main gate with access capacities of 1 to 3 entrances and slowdown factors of 20% and 30%, with frequencies of 1, 2, 4, and 6 per hour.
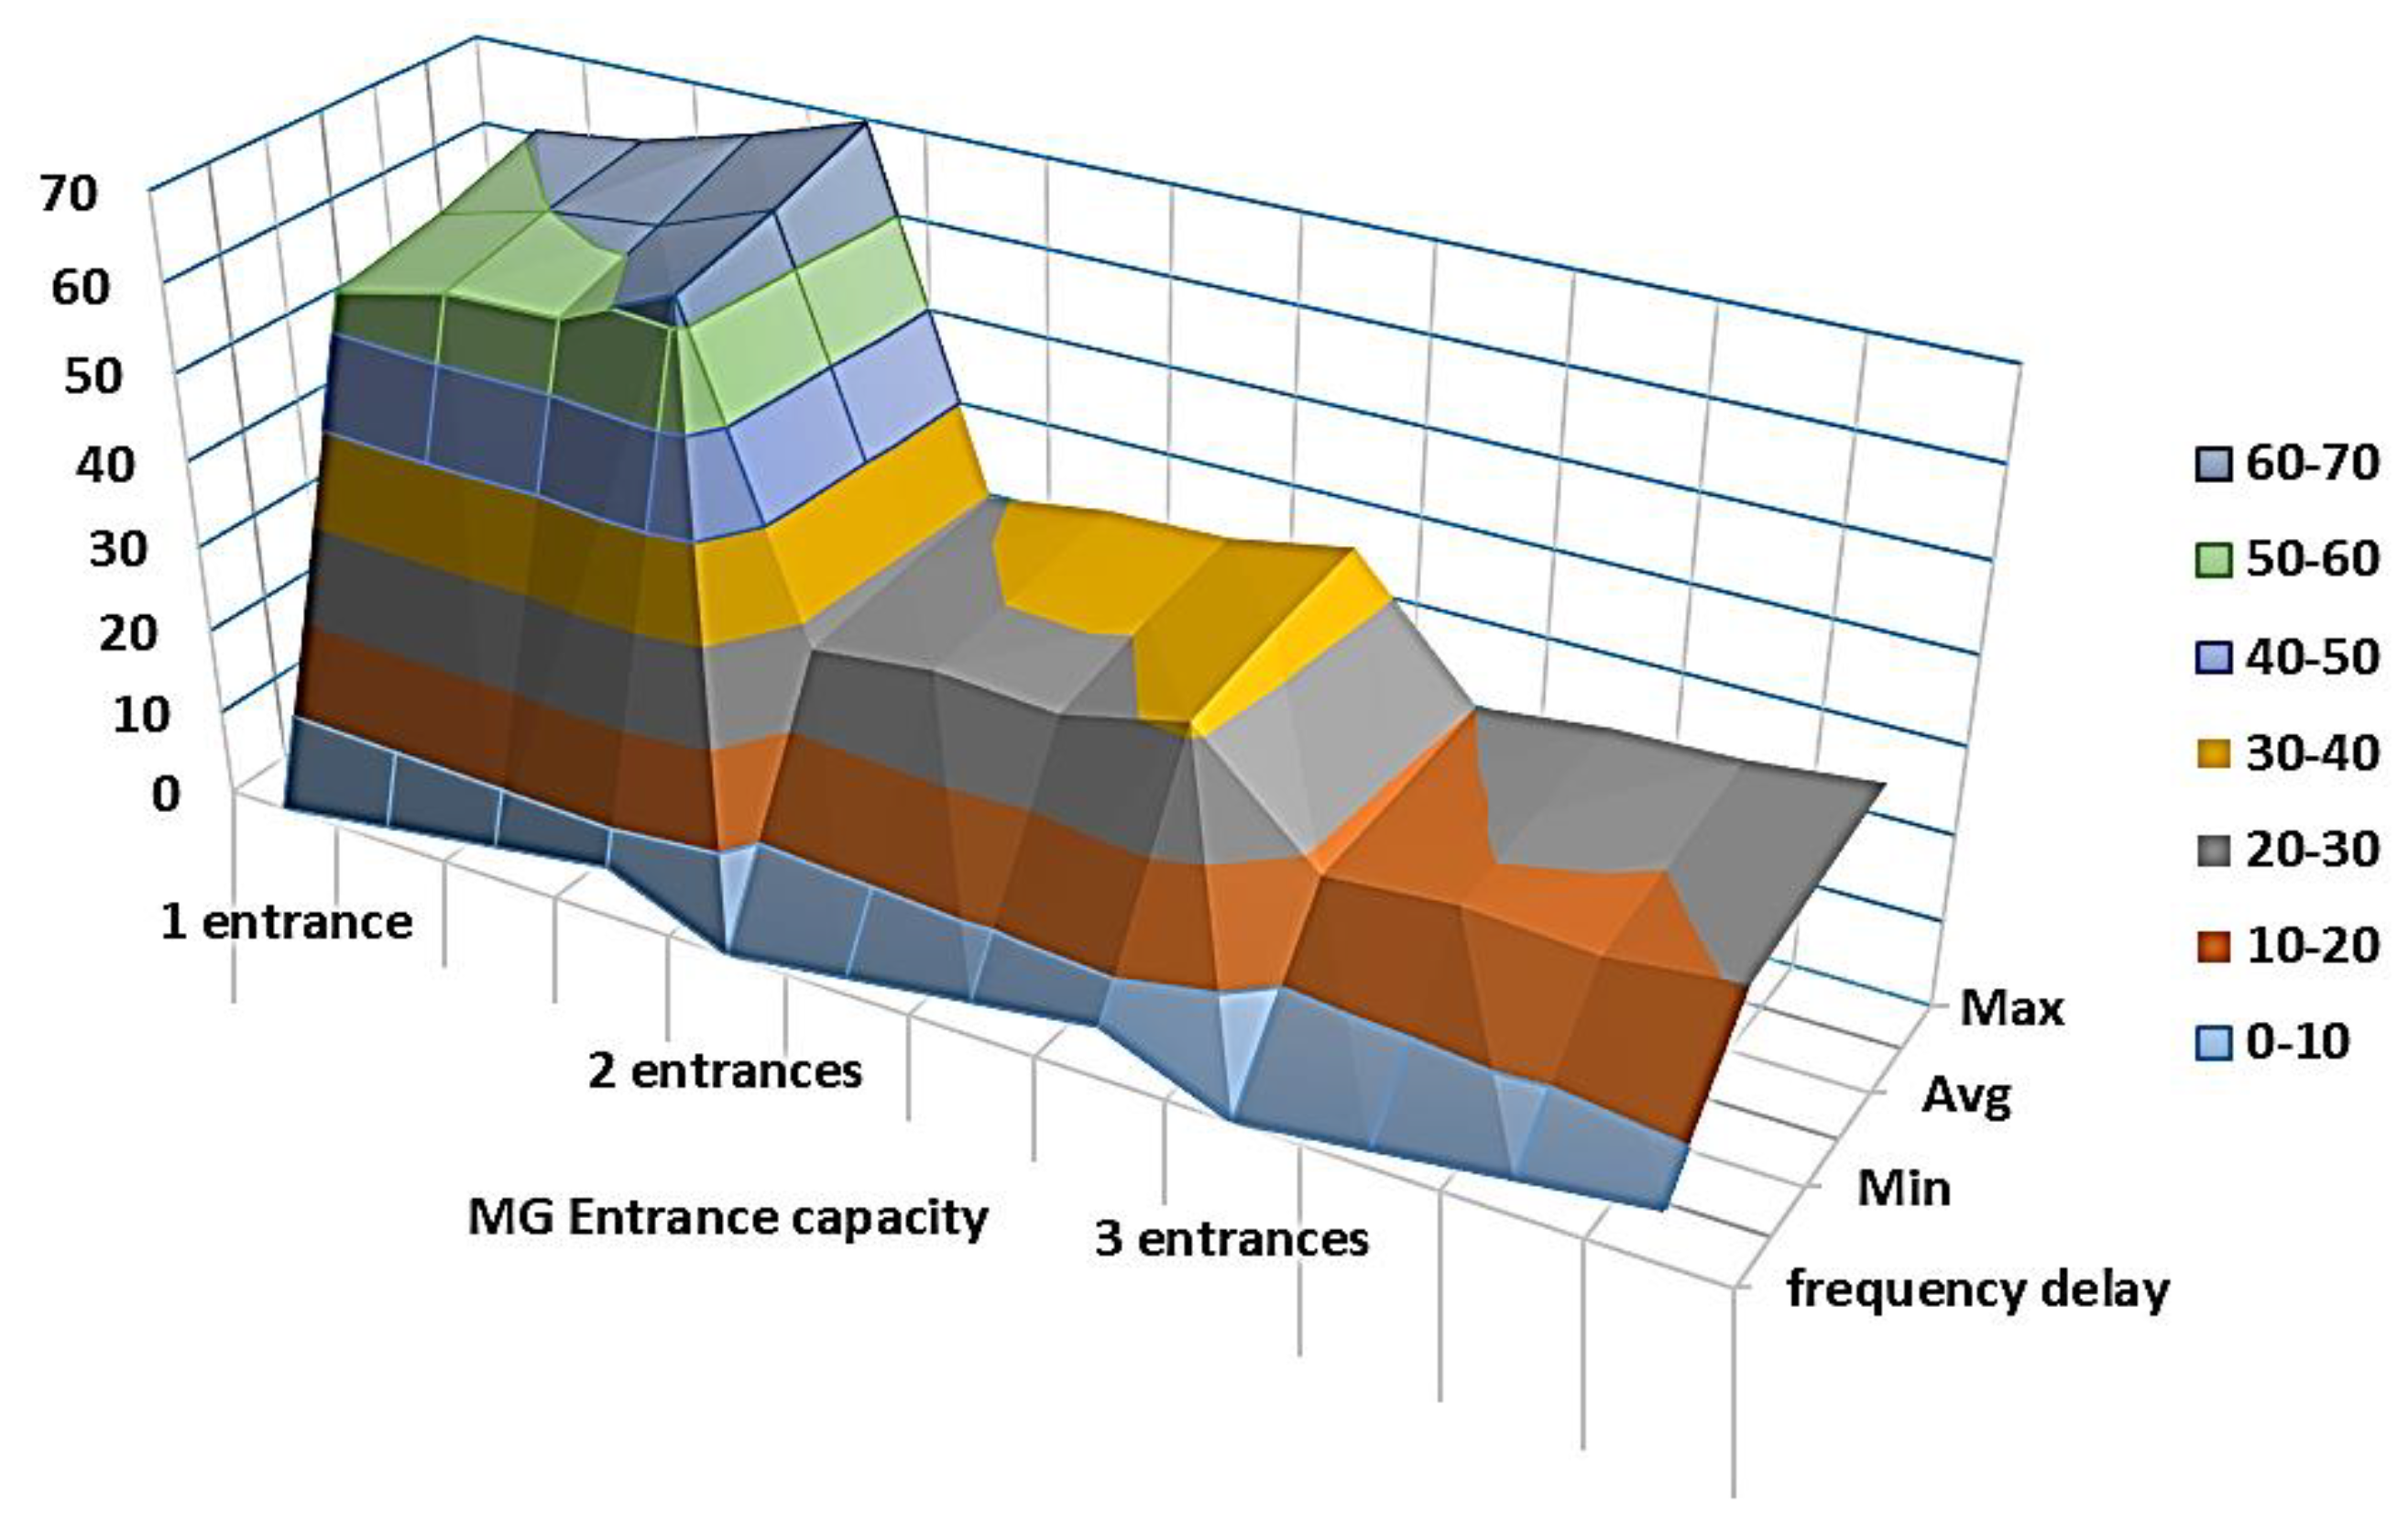
- Decreasing the number of entrances from 3 to 2 leads to a 50% increase in capacity utilization, and further reducing it to one entrance triples the used capacity. This significantly affects system fluidity during peak hours. Both the slowdown factor and the frequency of slowdowns contribute to increased capacity utilization. A 5% increase in capacity utilization is observed when the slowdown factor rises from 20% to 30% over time. Figure 16 illustrates these results for a 20% delay factor;
- Changing the number of entrances from 2 to 1 has a critical impact and can adversely affect access fluidity. As shown in Figure 17, the maximum number of waiting vehicles is five times greater when comparing one entrance to two entrances. In contrast, the number of waiting vehicles doubles when reducing the number of entrances from 3 to 2. The service slowdown also significantly affects the system.
Figure 16.
Max number of vehicles waiting for access.
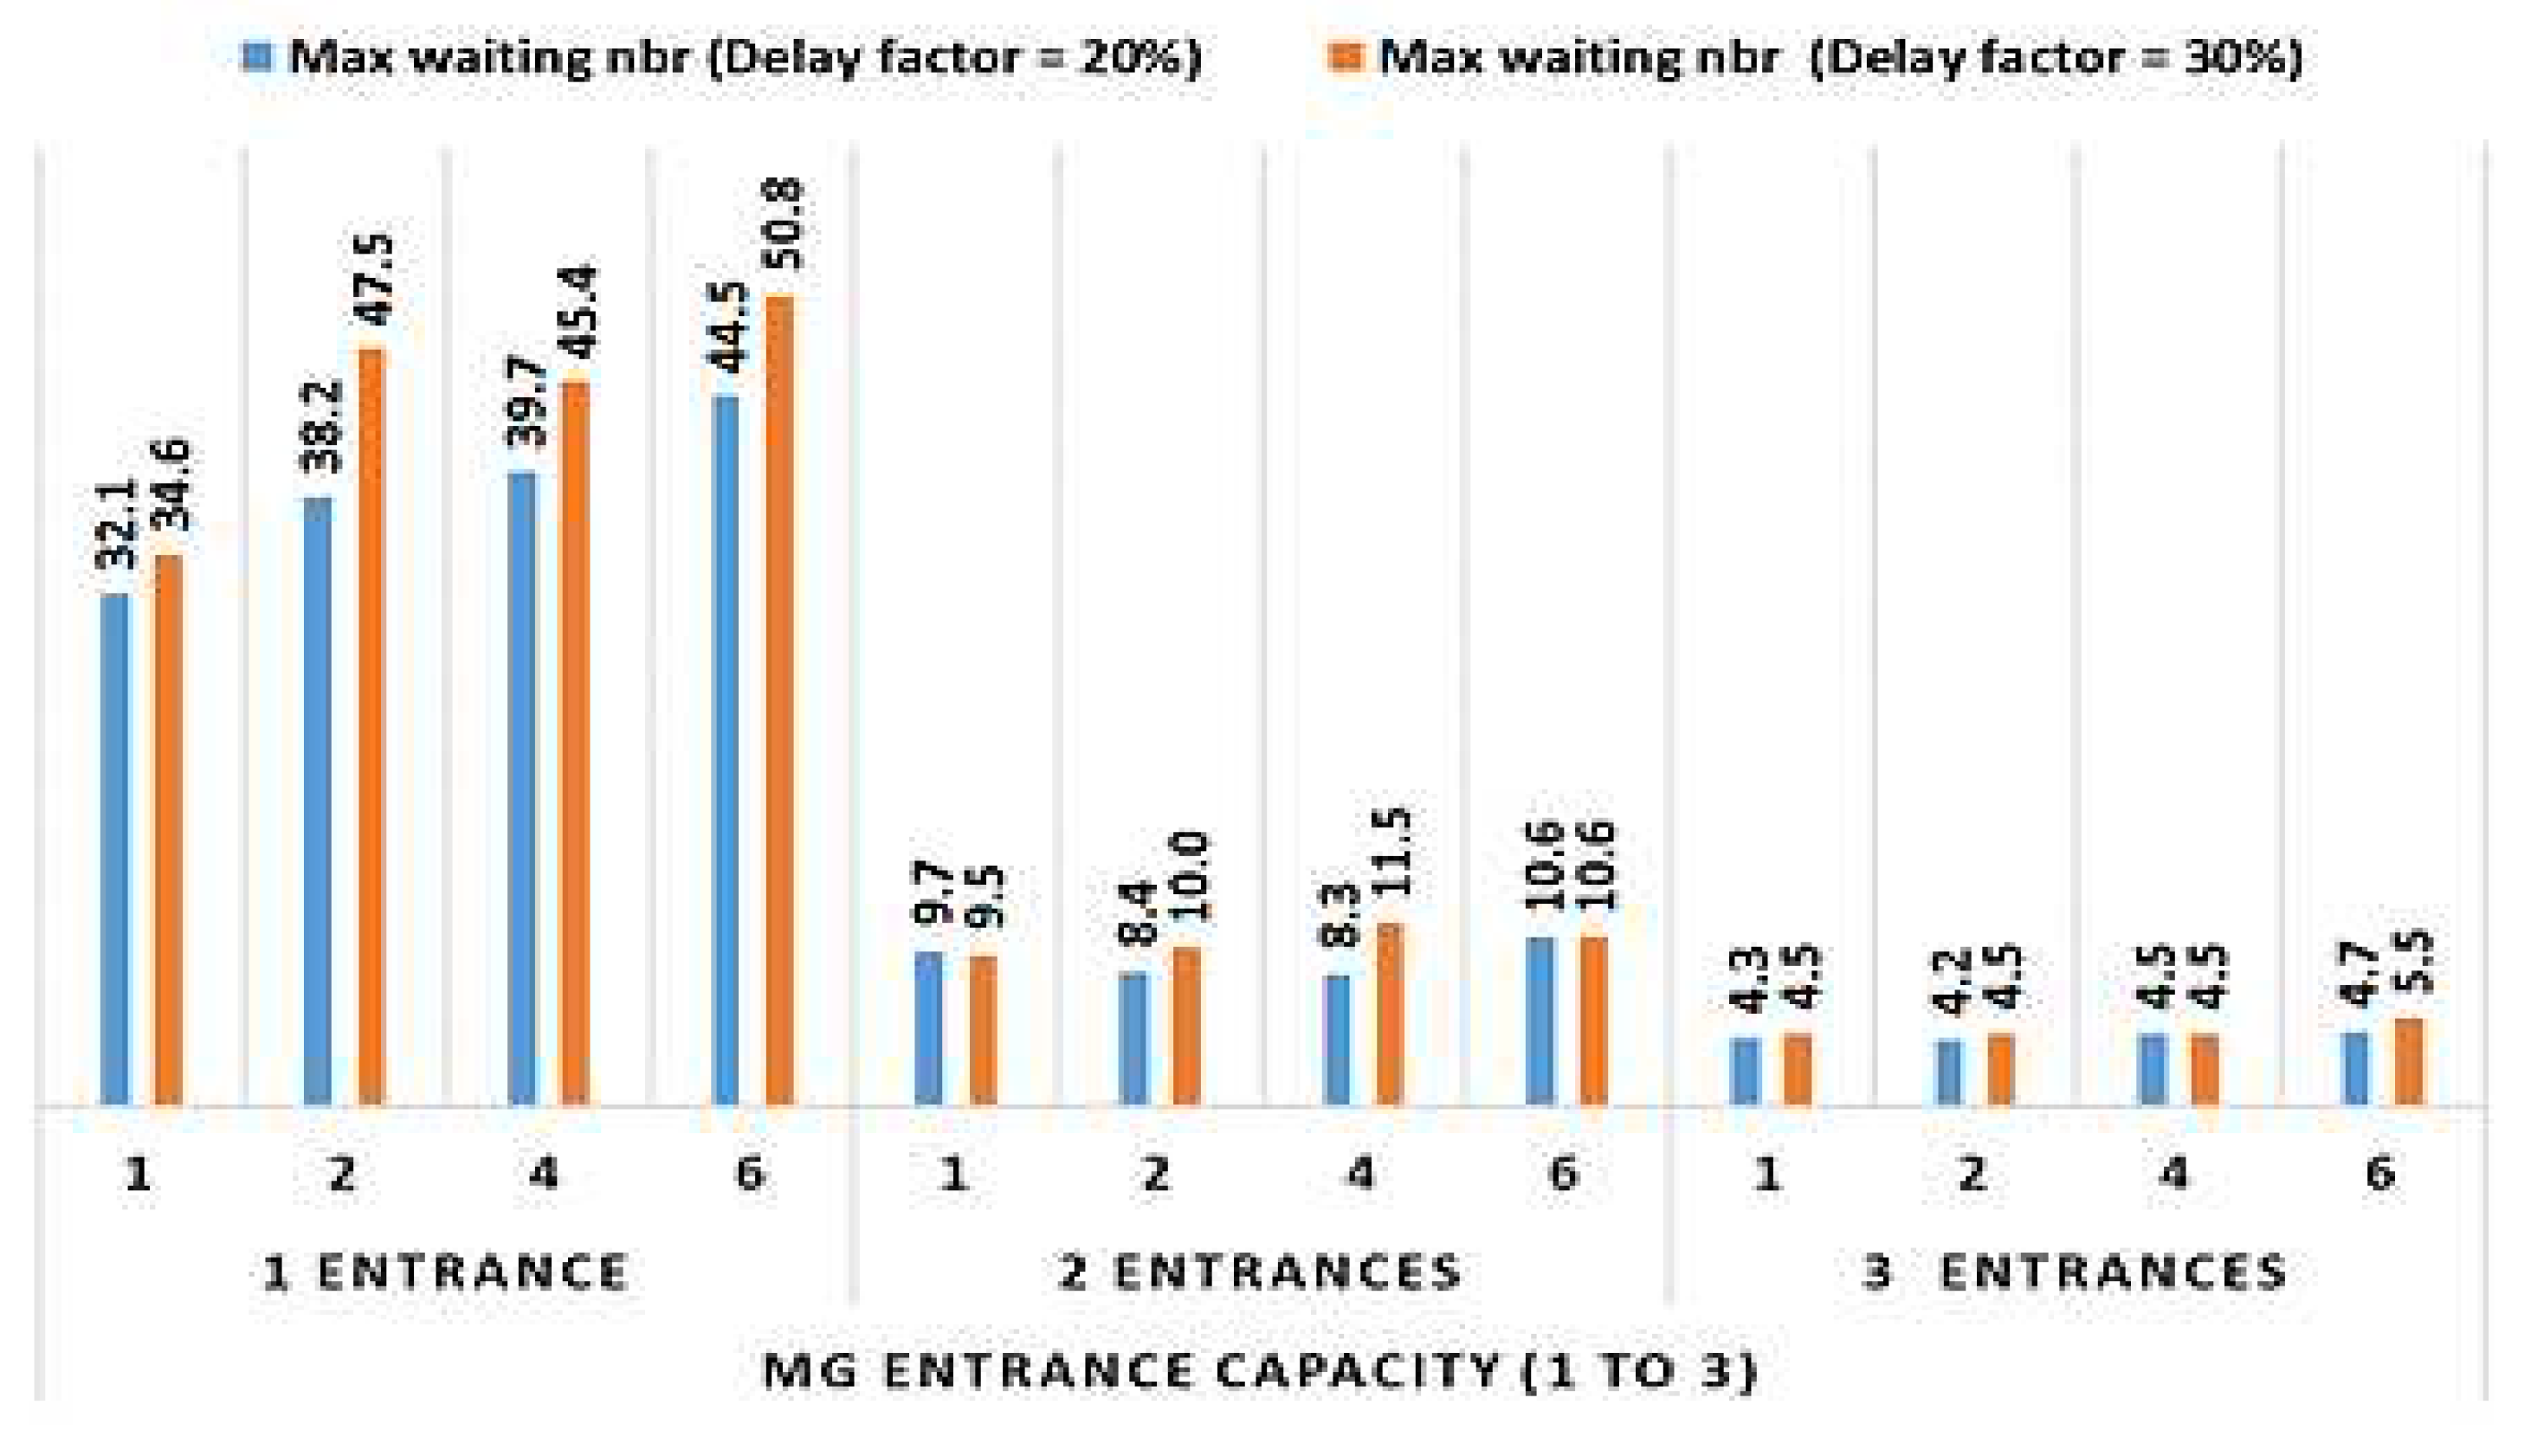
Figure 17.
Main gate capacity utilization percentage (with a 20% delay factor and frequencies of 1, 2, 4, and 6).
Figure 17.
Main gate capacity utilization percentage (with a 20% delay factor and frequencies of 1, 2, 4, and 6).
Batch 2: (Scenarios 25-28 and 33-36) - This batch focuses on the context of using the main gate with a single entrance and slowdown factors of 40% and 50%, accompanied by slowdown frequencies of 1, 2, 4, and 6:
- As illustrated in Figure 18, in the case of a single entrance with significant slowdown factors of 40% and 50%, the maximum number of waiting vehicles is considerably high. When the slowdown factor increases from 40% to 50%, there is a substantial effect on the maximum number of waiting vehicles, with an additional 13 vehicles if the slowdown occurs frequently;
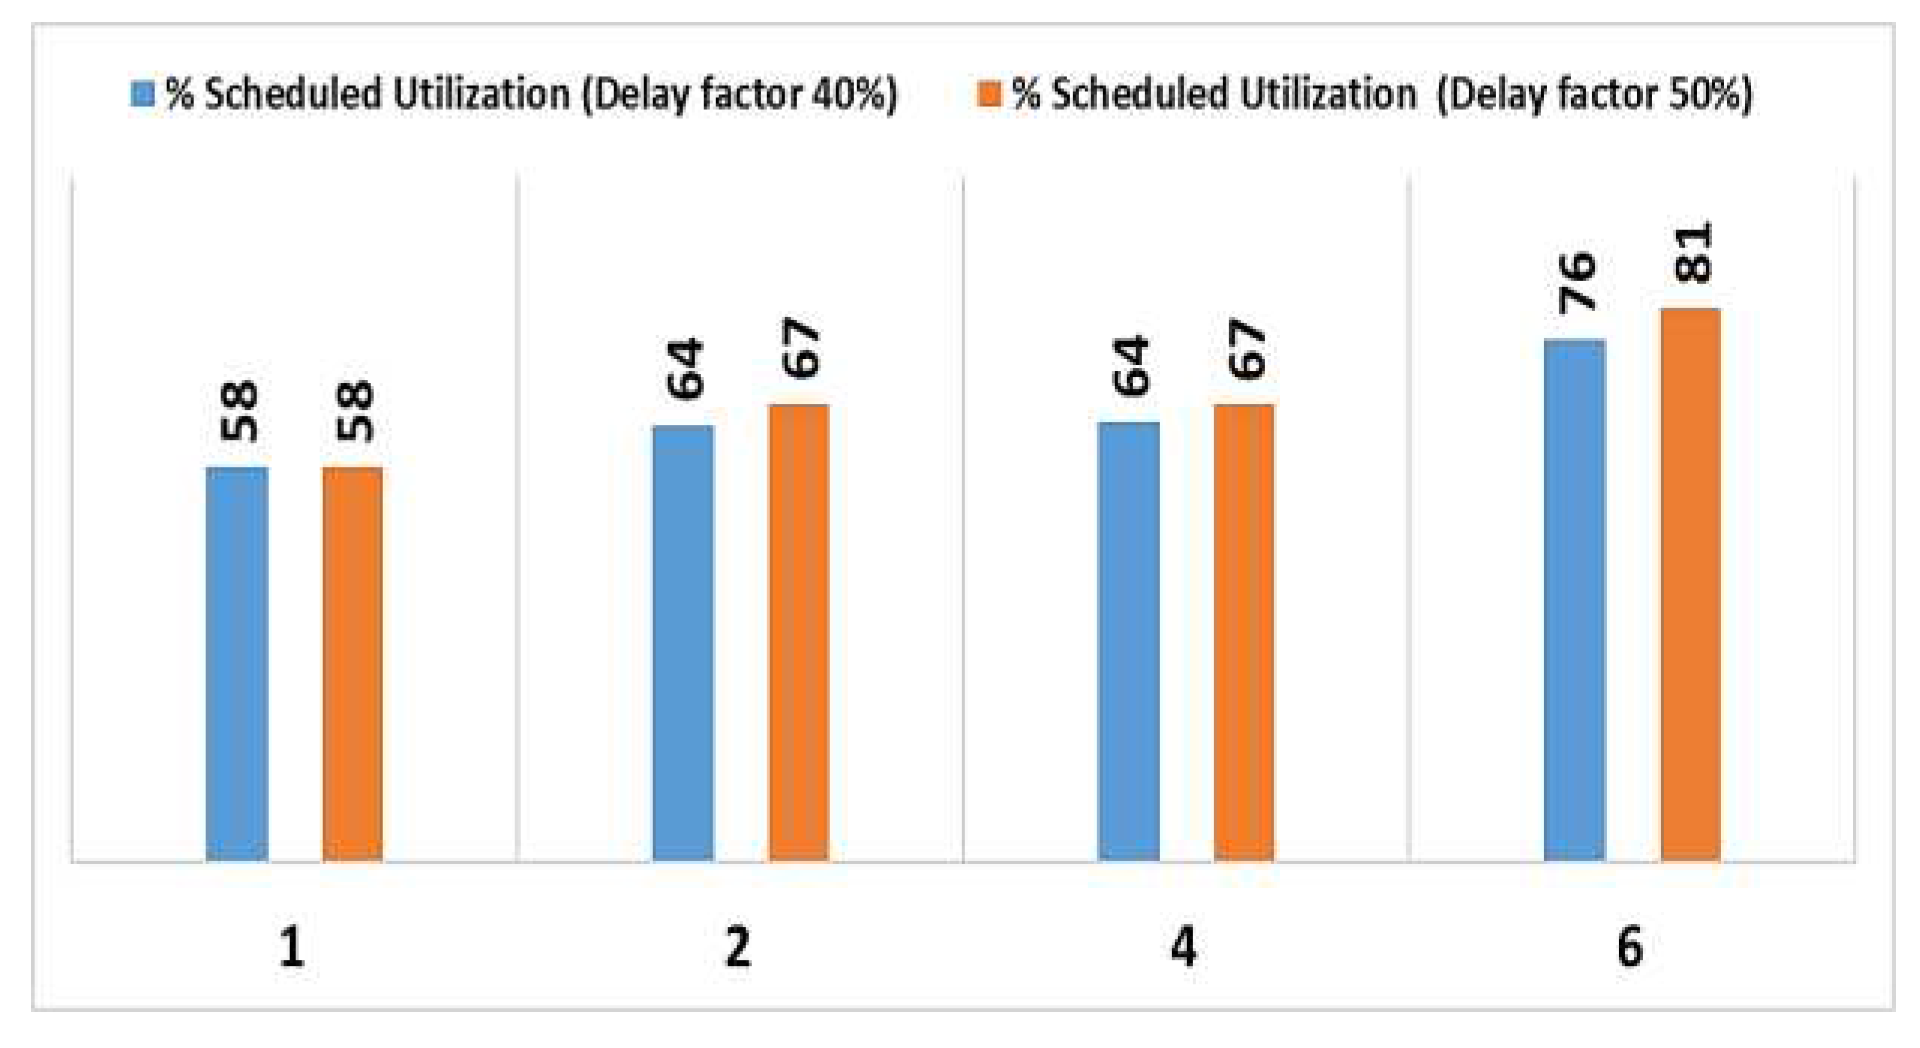
- None of the utilization capacities are sufficient for these scenarios. With a 58% utilization rate, the gate is prone to congestion for the majority of the operating period. It's important to note that the maximum number of waiting vehicles is 25 when there is a 40% slowdown occurring once an hour for a duration of 10 minutes. Figure 19 provides a summary of the main gate utilization percentage.
Figure 18.
Maximum number of vehicles waiting for access under delay frequencies of 1, 2, 4, and 6.
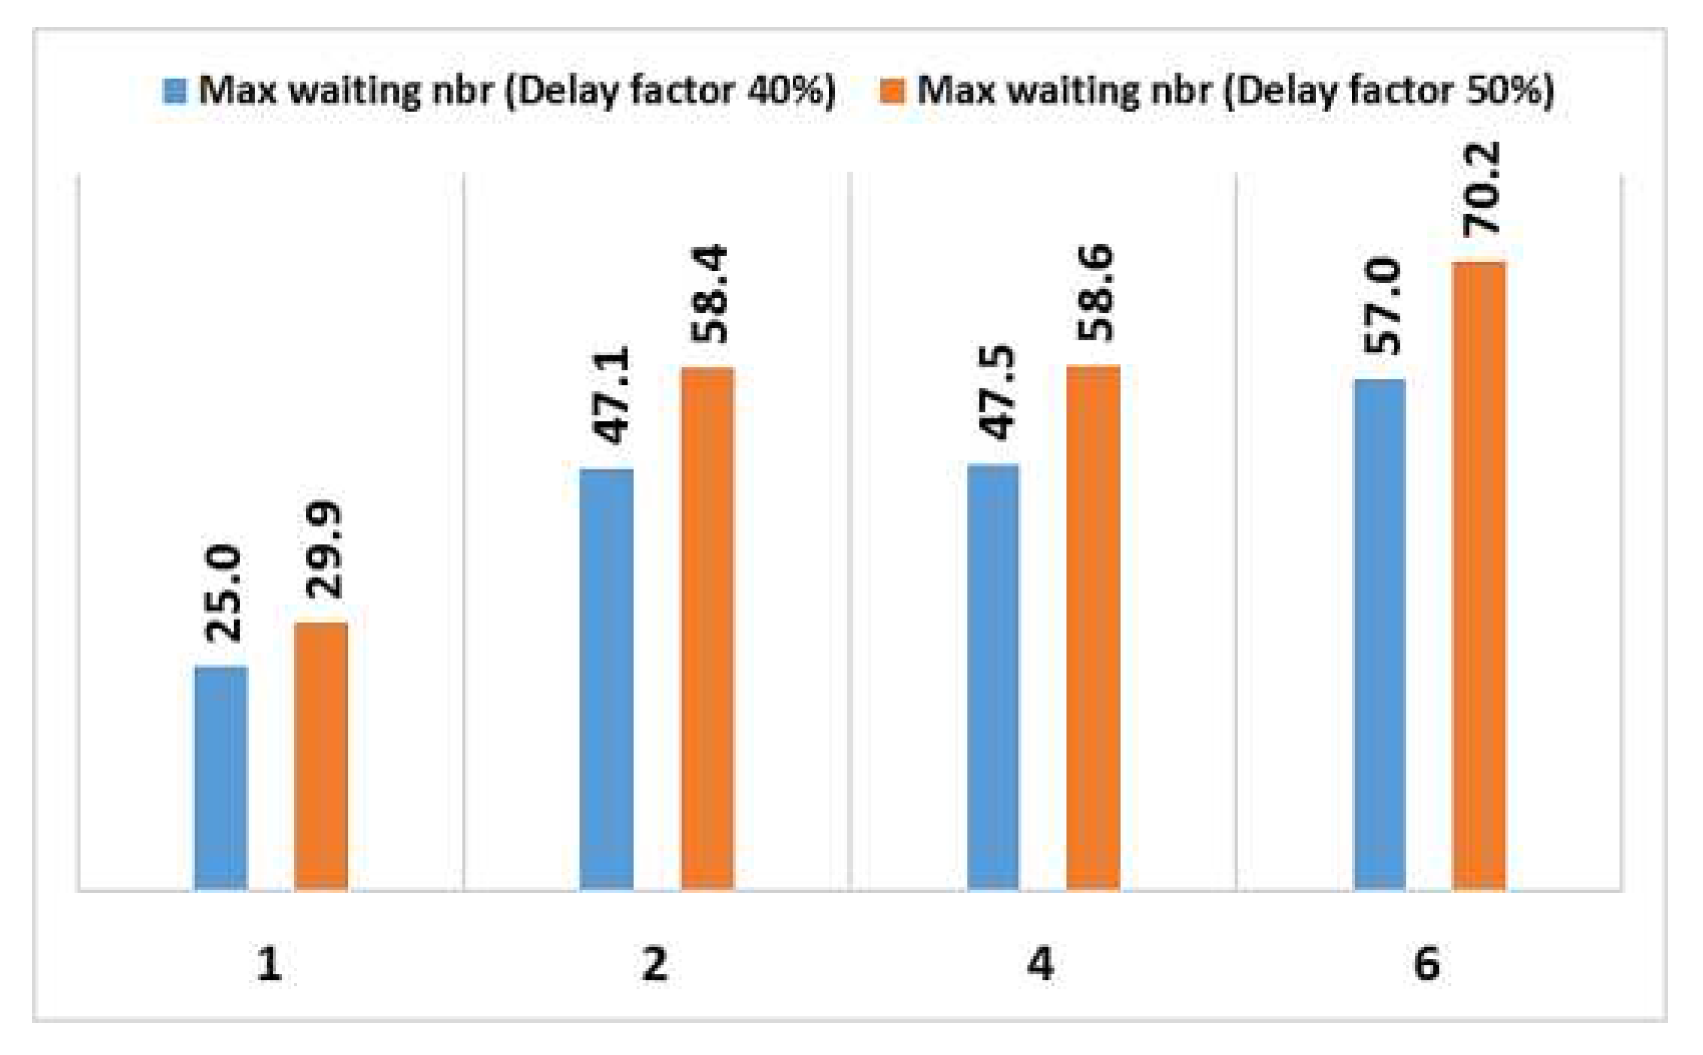
Figure 19.
Main gate utilization percentage under delay frequencies of 1, 2, 4, and 6.
Batch 3: (Scenarios 29-32) - This batch explores the context of using the main gate with three entrances, a 40% slowdown factor and truck increases of 20%, 30%, 40%, and 50%:
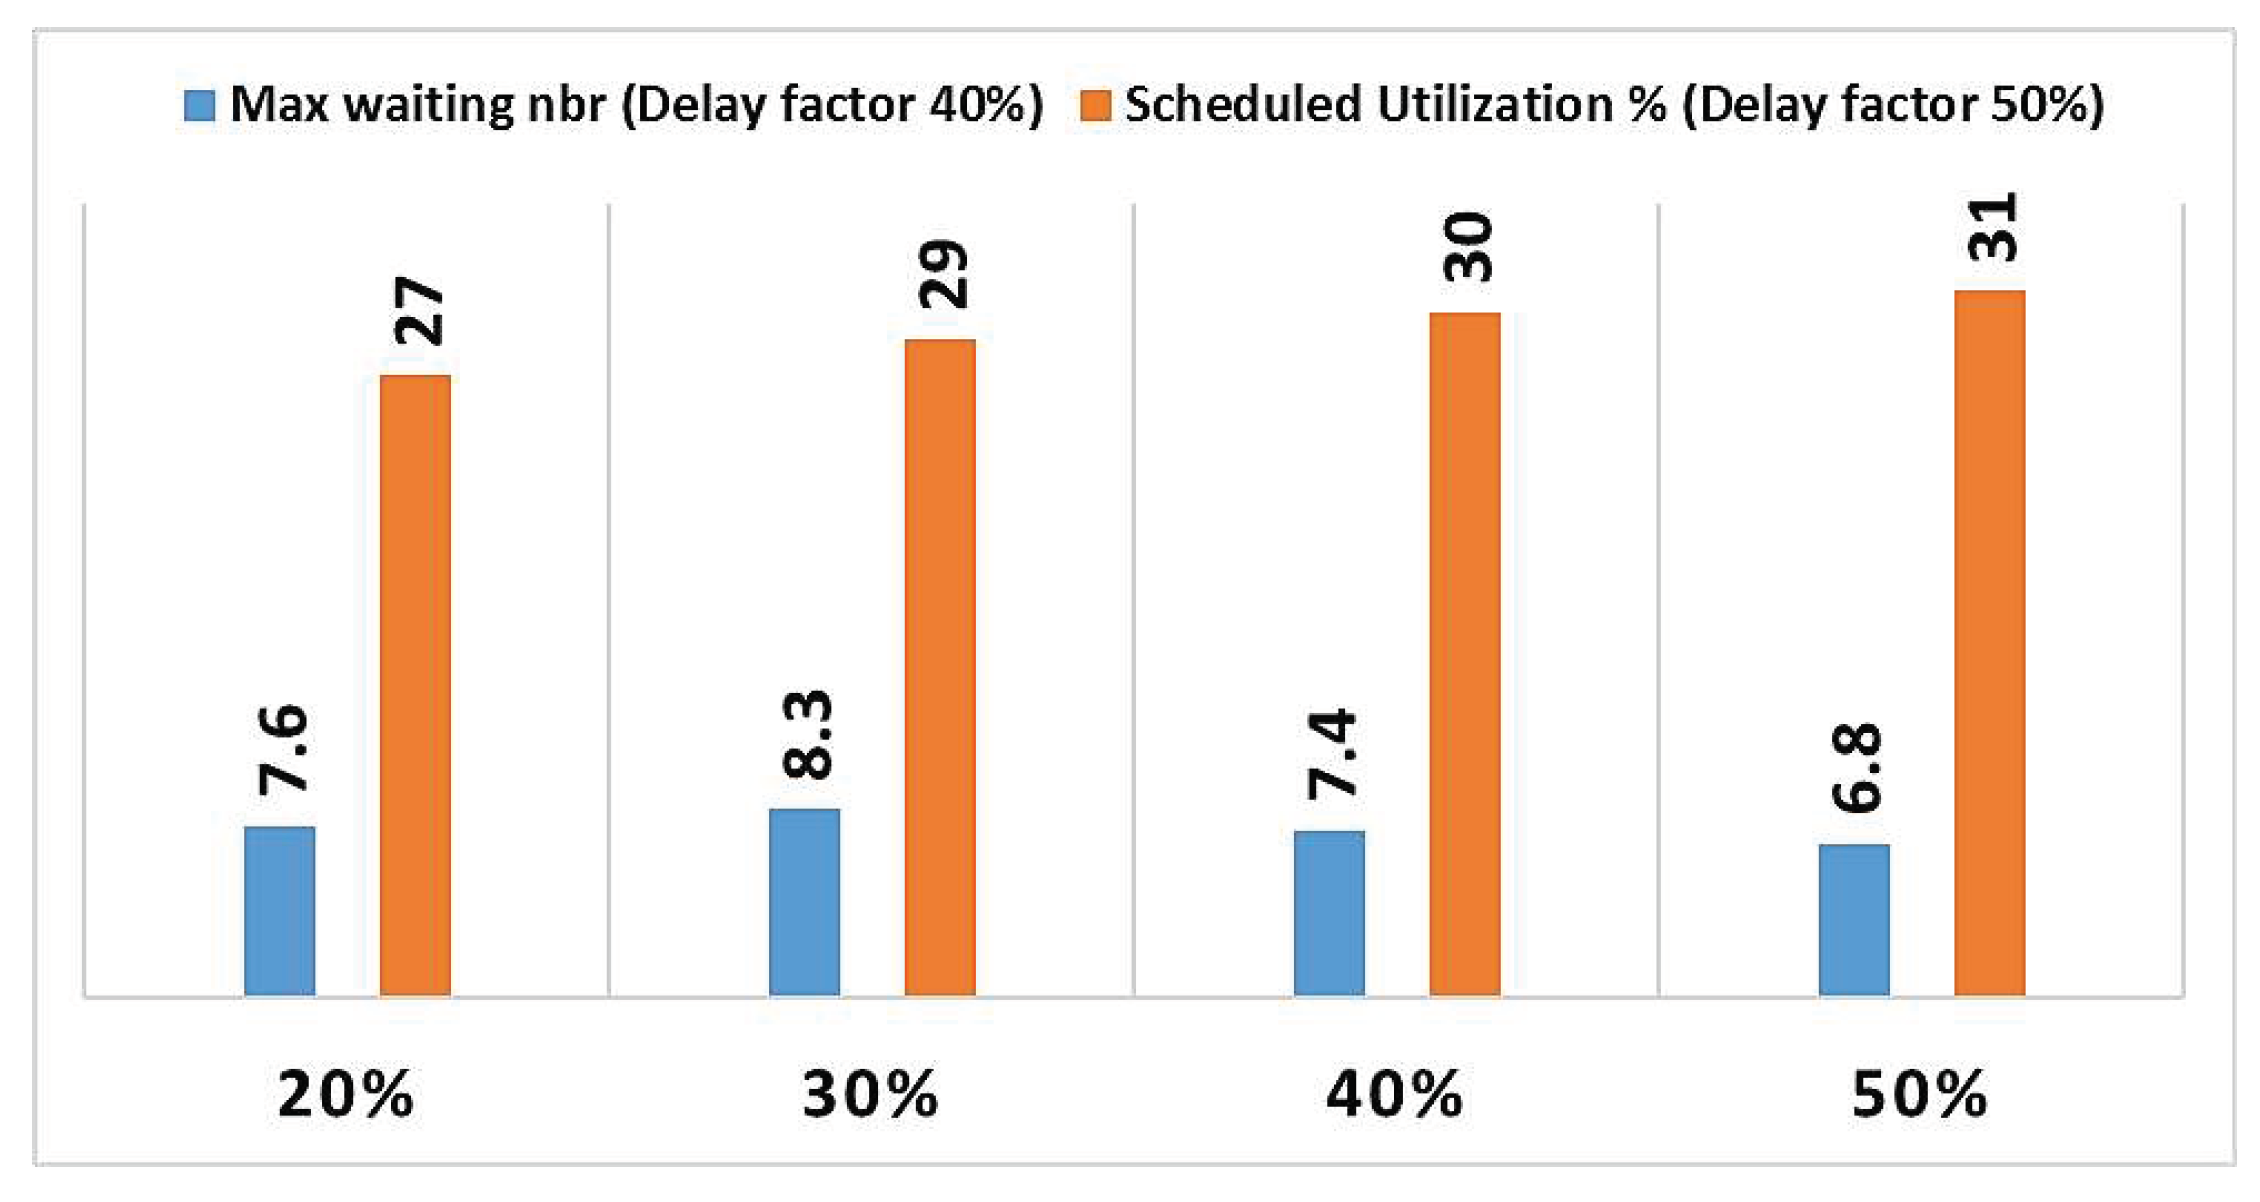
With three entrances and a 40% slowdown factor consistently applied, the system's sensitivity to the increase in the number of trucks from 20% to 50% is relatively low in terms of both maximum waiting vehicles and capacity utilization. On average, capacity utilization rises by 1.24% for every 10% increase in the number of trucks. The maximum number of waiting vehicles experiences only a slight change, as depicted in Figure 20. The fluidity in the context of three entrances remains robust even when facing an increase in the number of trucks up to 50%.
Figure 20.
Effects of increasing truck flow from 20% to 50% on the maximum number of waiting vehicles and main gate utilization percentage.
Figure 20.
Effects of increasing truck flow from 20% to 50% on the maximum number of waiting vehicles and main gate utilization percentage.
1.5. Concluding Remarks
The various evaluations of port access fluidity reveal that having a single entrance for the main gatehouse is not optimal for maintaining fluidity in all situations. This gate processes more than 70% of the trucks and over 90% of the light vehicles (cars). Indeed, reducing the number of entrances significantly impacts fluidity in terms of both waiting truck numbers and main gate capacity utilization. The introduction of a slowdown factor to the access service adversely affects fluidity, depending on the frequency and duration of slowdowns. However, these factors are more tolerable with three entrances. The experiments also demonstrate the capability of the existing two gates to accommodate construction trucks alongside freight trucks. Nonetheless, scheduling truck arrivals during specific daily hours and peak traffic seasons is necessary in such cases.
One specificity of this study is that it aims to assess the fluidity in a particular context, such as during the construction of a new terminal. However, the methodological approach can be applied to any other similar case, as it follows a structured process of baseline, exploration, improvement, and robustness assessment. This adaptability makes the methodology valuable for addressing various fluidity challenges in different contexts.
In contrast, other studies like Mohammad [4] and Guan and Liu [2] mainly concentrated on the high cost of drayage and environmental concerns. Truck appointment systems have been widely examined and implemented in several ports worldwide to reduce congestion at access gates, as demonstrated by Torkjazi [13], Goudreau [15], and others. These studies have shown the effectiveness of appointment systems in reducing truck waiting times and improving overall port efficiency. In synergy with these results, it is suggested to adopt a lightweight truck arrival planning system as a preventive measure to avoid congestion due to the unpredictability of truck arrivals. This approach aims to better manage the flow of vehicles and maintain fluidity at the access gates during periods of high demand.
Comparing the scenario analysis with logistic system simulations to other methodologies, it appears that the study provides a more comprehensive view of port access fluidity during a specific situation (i.e., construction of a new terminal). It considers a broader range of factors, including gate capacity, service levels, and robustness against impairments. On the other hand, alternative methodologies are more focused on addressing gate congestion issues through the implementation of appointment systems and optimizing gate operations. The scenario analysis with logistic system simulation is tailored to the unique needs of a port during a construction period, whereas alternative methodologies generally aim to improve port efficiency in regular operation scenarios.
4. Conclusion
The study of port access fluidity during the construction of a new terminal was conducted by utilizing a combination of a scenario analysis approach and simulation. This approach is based on the co-construction with the industrial partner of an initial set of reference scenarios, focusing on the most congested periods of the year. A second set of co-constructed scenarios was designed to explore the capability of the existing access infrastructure to handle additional vehicle flows and the impact of creating a new access gate on fluidity. The exploration scenarios' results show that the two existing gates are sufficient to satisfy access during the new terminal's construction period. However, the planned service level for unloading construction trucks is not convenient for accommodating the construction truck flow, and an imbalance of access flows between the existing gates has been observed. In response to these findings, two sets of scenarios were devised: the first to optimize flows between gates and the service level for unloading at the new terminal, and the second to study the main gate's robustness against various impairments that slow down the access registration service. The results of the latter set highlight the importance of the main gate operating at full capacity (with three entrances) and recommend planning truck arrivals, particularly delaying construction trucks until after 9:00 to avoid peak freight truck and morning vehicle traffic periods.
Despite its valuable contributions, the study acknowledges certain limitations. One key area not explored is the impact of intermodal transport, particularly the operations of ships and trains, on the truck flow. Moreover, while the experimentation assumes the same stochastic time distribution within the system, the reality in practice is quite different. Terminal operators have the ability to adjust their handling capacity for loading or unloading Freight Trucks (FT). However, this level of adaptability does not extend to Container Trucks (CT), leading to a situation where service levels for CT remain inflexible, even with an increasing flow of vehicles. To better understand this dynamic, a correlation model that links the number of vehicles to service levels could be valuable for analyzing freight traffic. Future research should aim to address these gaps and explore these relationships.
Acknowledgments
Authors acknowledge the collaboration and funding support by the Trois-Rivières Port Authority, Réseau Québec maritime and Mitacs through the PLAINE, Business Strategy Internship and Accelerate programs.
References
- Fleming, M.; Huynh, N.; Xie, Y. Agent-Based Simulation Tool for Evaluating Pooled Queue Performance at Marine Container Terminals. Transp. Res. Rec. J. Transp. Res. Board 2013, 2330, 103–112. [Google Scholar] [CrossRef]
- Guan, C.Q.; Liu, R. (. Modeling Gate Congestion of Marine Container Terminals, Truck Waiting Cost, and Optimization. Transp. Res. Rec. J. Transp. Res. Board 2009, 2100, 58–67. [Google Scholar] [CrossRef]
- Kulkarni, K. Kulkarni, K., Tran, K.T., Wang, H., Lau, H.C., 2017. Efficient gate system operations for a multipurpose port using simulation-optimization, in: 2017 Winter Simulation Conference (WSC). Presented at the 2017 Winter Simulation Conference (WSC), pp. 3090–3101. [CrossRef]
- Mohammad, O.S. Application of Agent-Based Approaches to Enhance Container Terminal Operations. Theses and Dissertations, 2013. [Google Scholar]
- Dragović, B.; Tzannatos, E.; Park, N.K. Simulation modelling in ports and container terminals: literature overview and analysis by research field, application area and tool. Flex. Serv. Manuf. J. 2016, 29, 4–34. [Google Scholar] [CrossRef]
- Neagoe, M.; Hvolby, H.-H.; Taskhiri, M.S.; Turner, P. Using discrete-event simulation to compare congestion management initiatives at a port terminal. Simul. Model. Pr. Theory 2021, 112, 102362. [Google Scholar] [CrossRef]
- Cortés, P.; Muñuzuri, J.; Ibáñez, J.N.; Guadix, J. Simulation of freight traffic in the Seville inland port. Simul. Model. Pr. Theory 2007, 15, 256–271. [Google Scholar] [CrossRef]
- Chen, G.; Govindan, K.; Yang, Z.-Z.; Choi, T.-M.; Jiang, L. Terminal appointment system design by non-stationary M(t)/Ek/c(t) queueing model and genetic algorithm. Int. J. Prod. Econ. 2013, 146, 694–703. [Google Scholar] [CrossRef]
- Huynh, N., Walton, C.M., 2011. Improving Efficiency of Drayage Operations at Seaport Container Terminals Through the Use of an Appointment System, in: Böse, J.W. (Ed.), Handbook of Terminal Planning, Operations Research/Computer Science Interfaces Series. Springer, New York, NY, pp. 323–344. [CrossRef]
- Kourounioti, I.; Polydoropoulou, A. Application of aggregate container terminal data for the development of time-of-day models predicting truck arrivals. Eur. J. Transp. Infrastruct. Res. 2018, 18. [Google Scholar] [CrossRef]
- Lange, A.-K., Schwientek, A.K., Jahn, C., 2017. Reducing truck congestion at ports - classification and trends, in: Digitalization in Maritime and Sustainable Logistics: City Logistics, Port Logistics and Sustainable Supply Chain Management in the Digital Age. Proceedings of the Hamburg International Conference of Logistics (HICL), Vol. 24. Berlin: epubli GmbH, pp. 37–58. [CrossRef]
- Vadlamudi, J.C. How a Discrete event simulation model can relieve congestion at a RORO terminal gate system : Case study: RORO port terminal in the Port of Karlshamn. 2016. [Google Scholar]
- Torkjazi, M. New Models for Truck Appointment Problem and Extensions. Theses and Dissertations, 2020. [Google Scholar]
- Ramírez-Nafarrate, A.; González-Ramírez, R.G.; Smith, N.R.; Guerra-Olivares, R.; Voß, S. Impact on yard efficiency of a truck appointment system for a port terminal. Ann. Oper. Res. 2016, 258, 195–216. [Google Scholar] [CrossRef]
- Goudreau, É. Analyses des impacts de l’implantation d’un système de rendez-vous sur le trafic routier dans un port manutentionnant des produits non conteneurisés. masters thesis, Université du Québec à Trois-Rivières, Trois-Rivières, 2018. [Google Scholar]
- Potgieter, L. Risk profile of port congestion : Cape Town container terminal case study. Doctoral dissertation, Stellenbosch University, Stellenbosch, 2016. [Google Scholar]
- Abu Aisha, T.; Ouhimmou, M.; Paquet, M. Optimization of Container Terminal Layouts in the Seaport—Case of Port of Montreal. Sustainability 2020, 12, 1165. [Google Scholar] [CrossRef]
- Guo, X.; Huang, S.Y.; Hsu, W.J.; Low, M.Y.H. Dynamic yard crane dispatching in container terminals with predicted vehicle arrival information. Adv. Eng. Informatics 2011, 25, 472–484. [Google Scholar] [CrossRef]
- Kim, K.H.; Lee, K.M.; Hwang, H. Sequencing delivery and receiving operations for yard cranes in port container terminals. Int. J. Prod. Econ. 2003, 84, 283–292. [Google Scholar] [CrossRef]
- Yi, S.; Scholz-Reiter, B.; Kim, T.; Kim, K.H. Scheduling appointments for container truck arrivals considering their effects on congestion. Flex. Serv. Manuf. J. 2019, 31, 730–762. [Google Scholar] [CrossRef]
- Brooks, M.R.; Schellinck, T. Measuring Port Effectiveness. Transp. Res. Rec. J. Transp. Res. Board 2015, 2479, 42–48. [Google Scholar] [CrossRef]
- Brooks, M.R.; Schellinck, T. Measuring port effectiveness in user service delivery: What really determines users' evaluations of port service delivery? Res. Transp. Bus. Manag. 2013, 8, 87–96. [Google Scholar] [CrossRef]
Figure 1.
Overview of the Trois-Rivières port and its different areas.
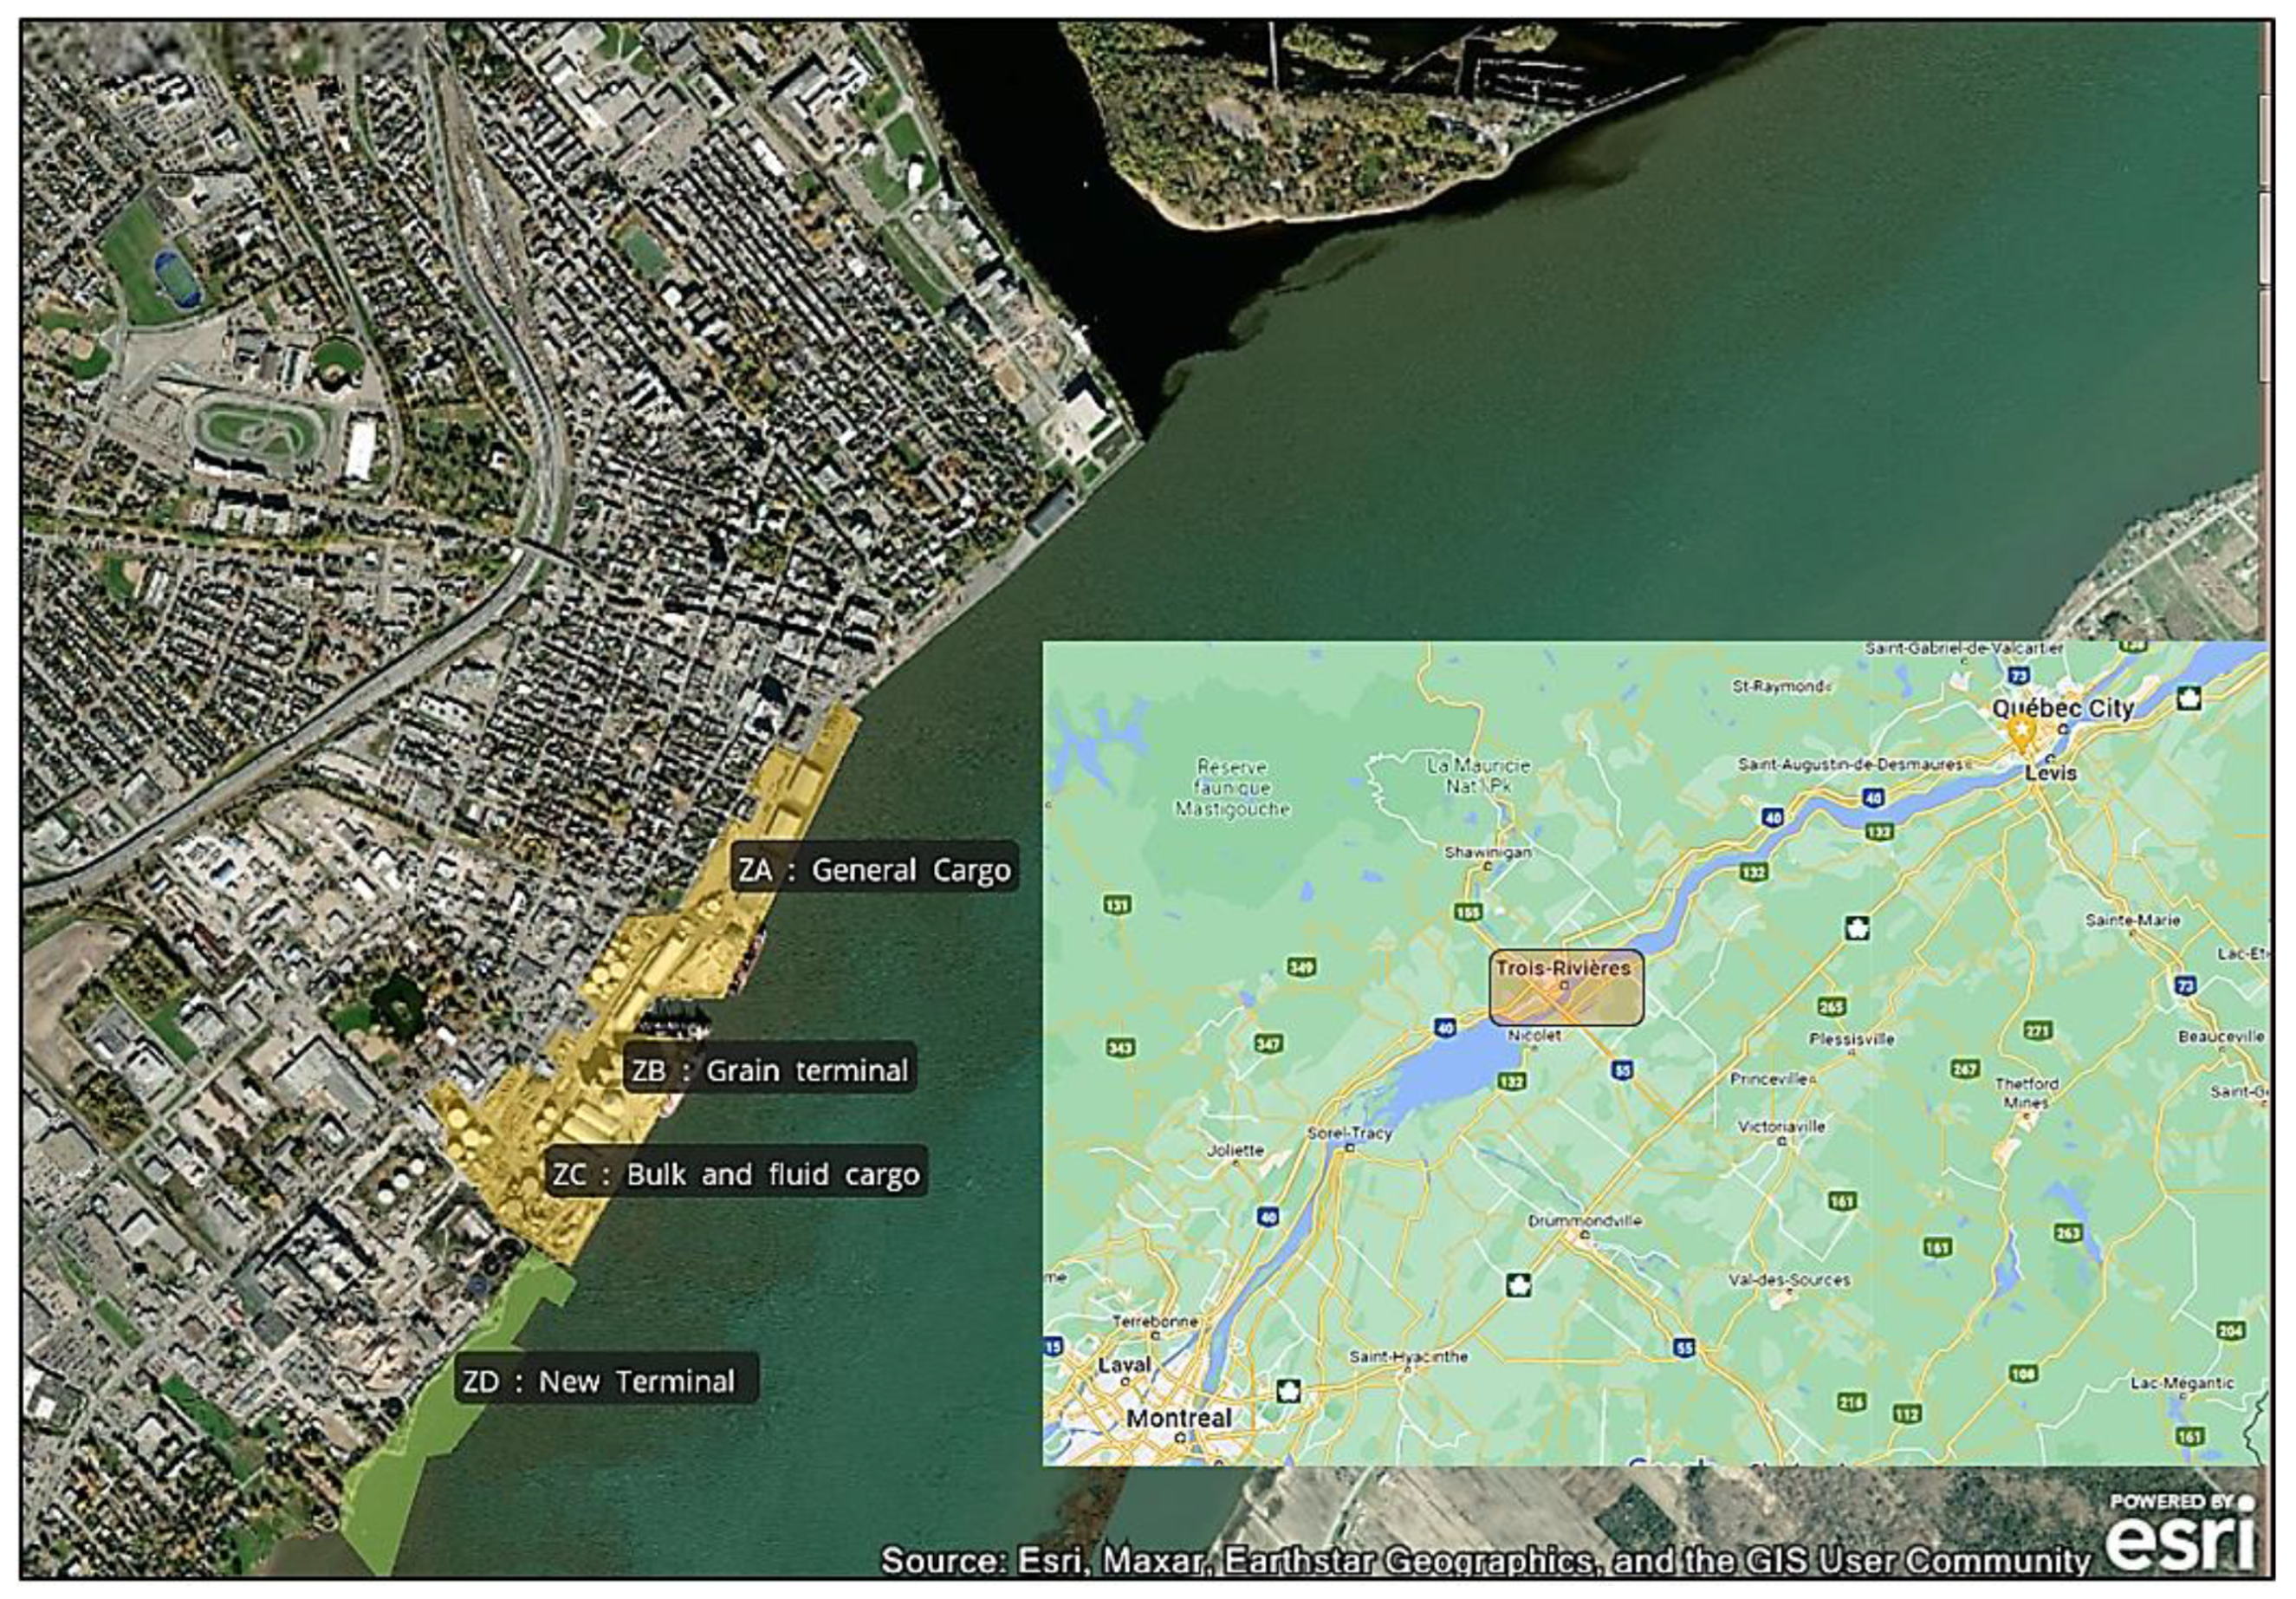
Figure 2.
Hourly variability of TS across different areas from 6:00 to 16:00 (X h means the elapsed time between X and X+1 h, TSZ1,2,3 means TS in area A,B,C).
Figure 2.
Hourly variability of TS across different areas from 6:00 to 16:00 (X h means the elapsed time between X and X+1 h, TSZ1,2,3 means TS in area A,B,C).
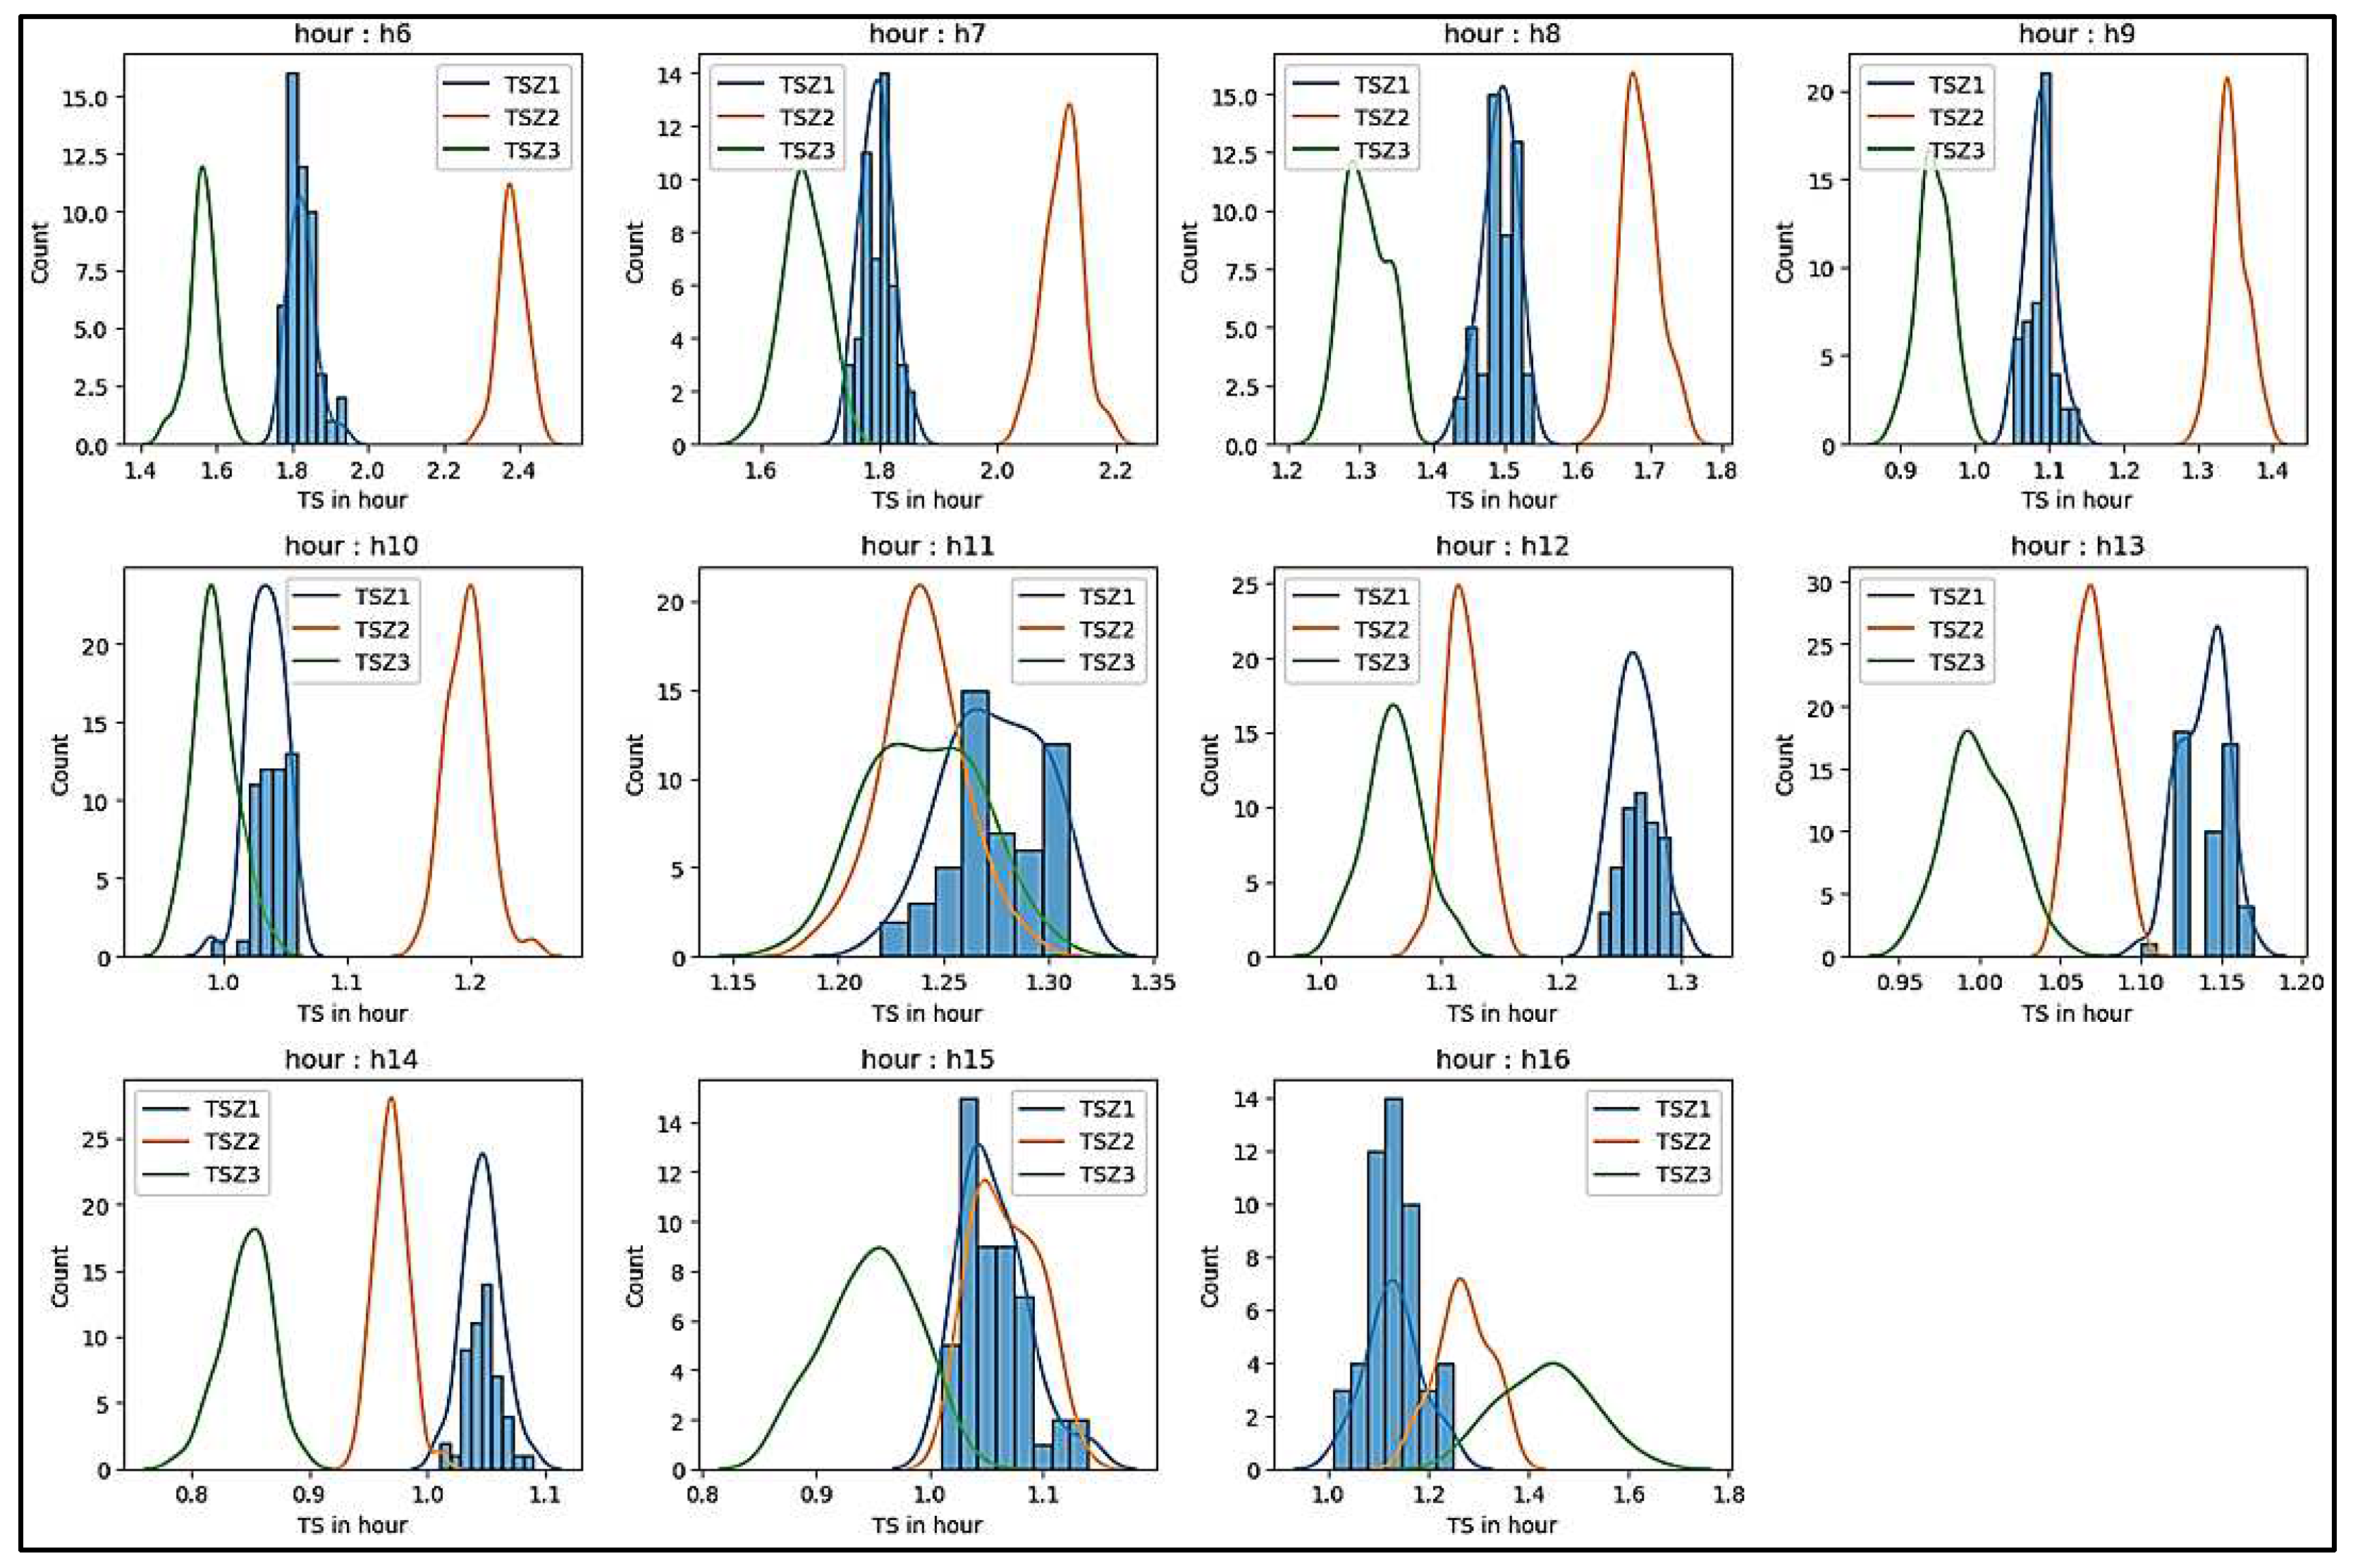
Figure 3.
Correlation between TIA and TS for the period 2015-2019.
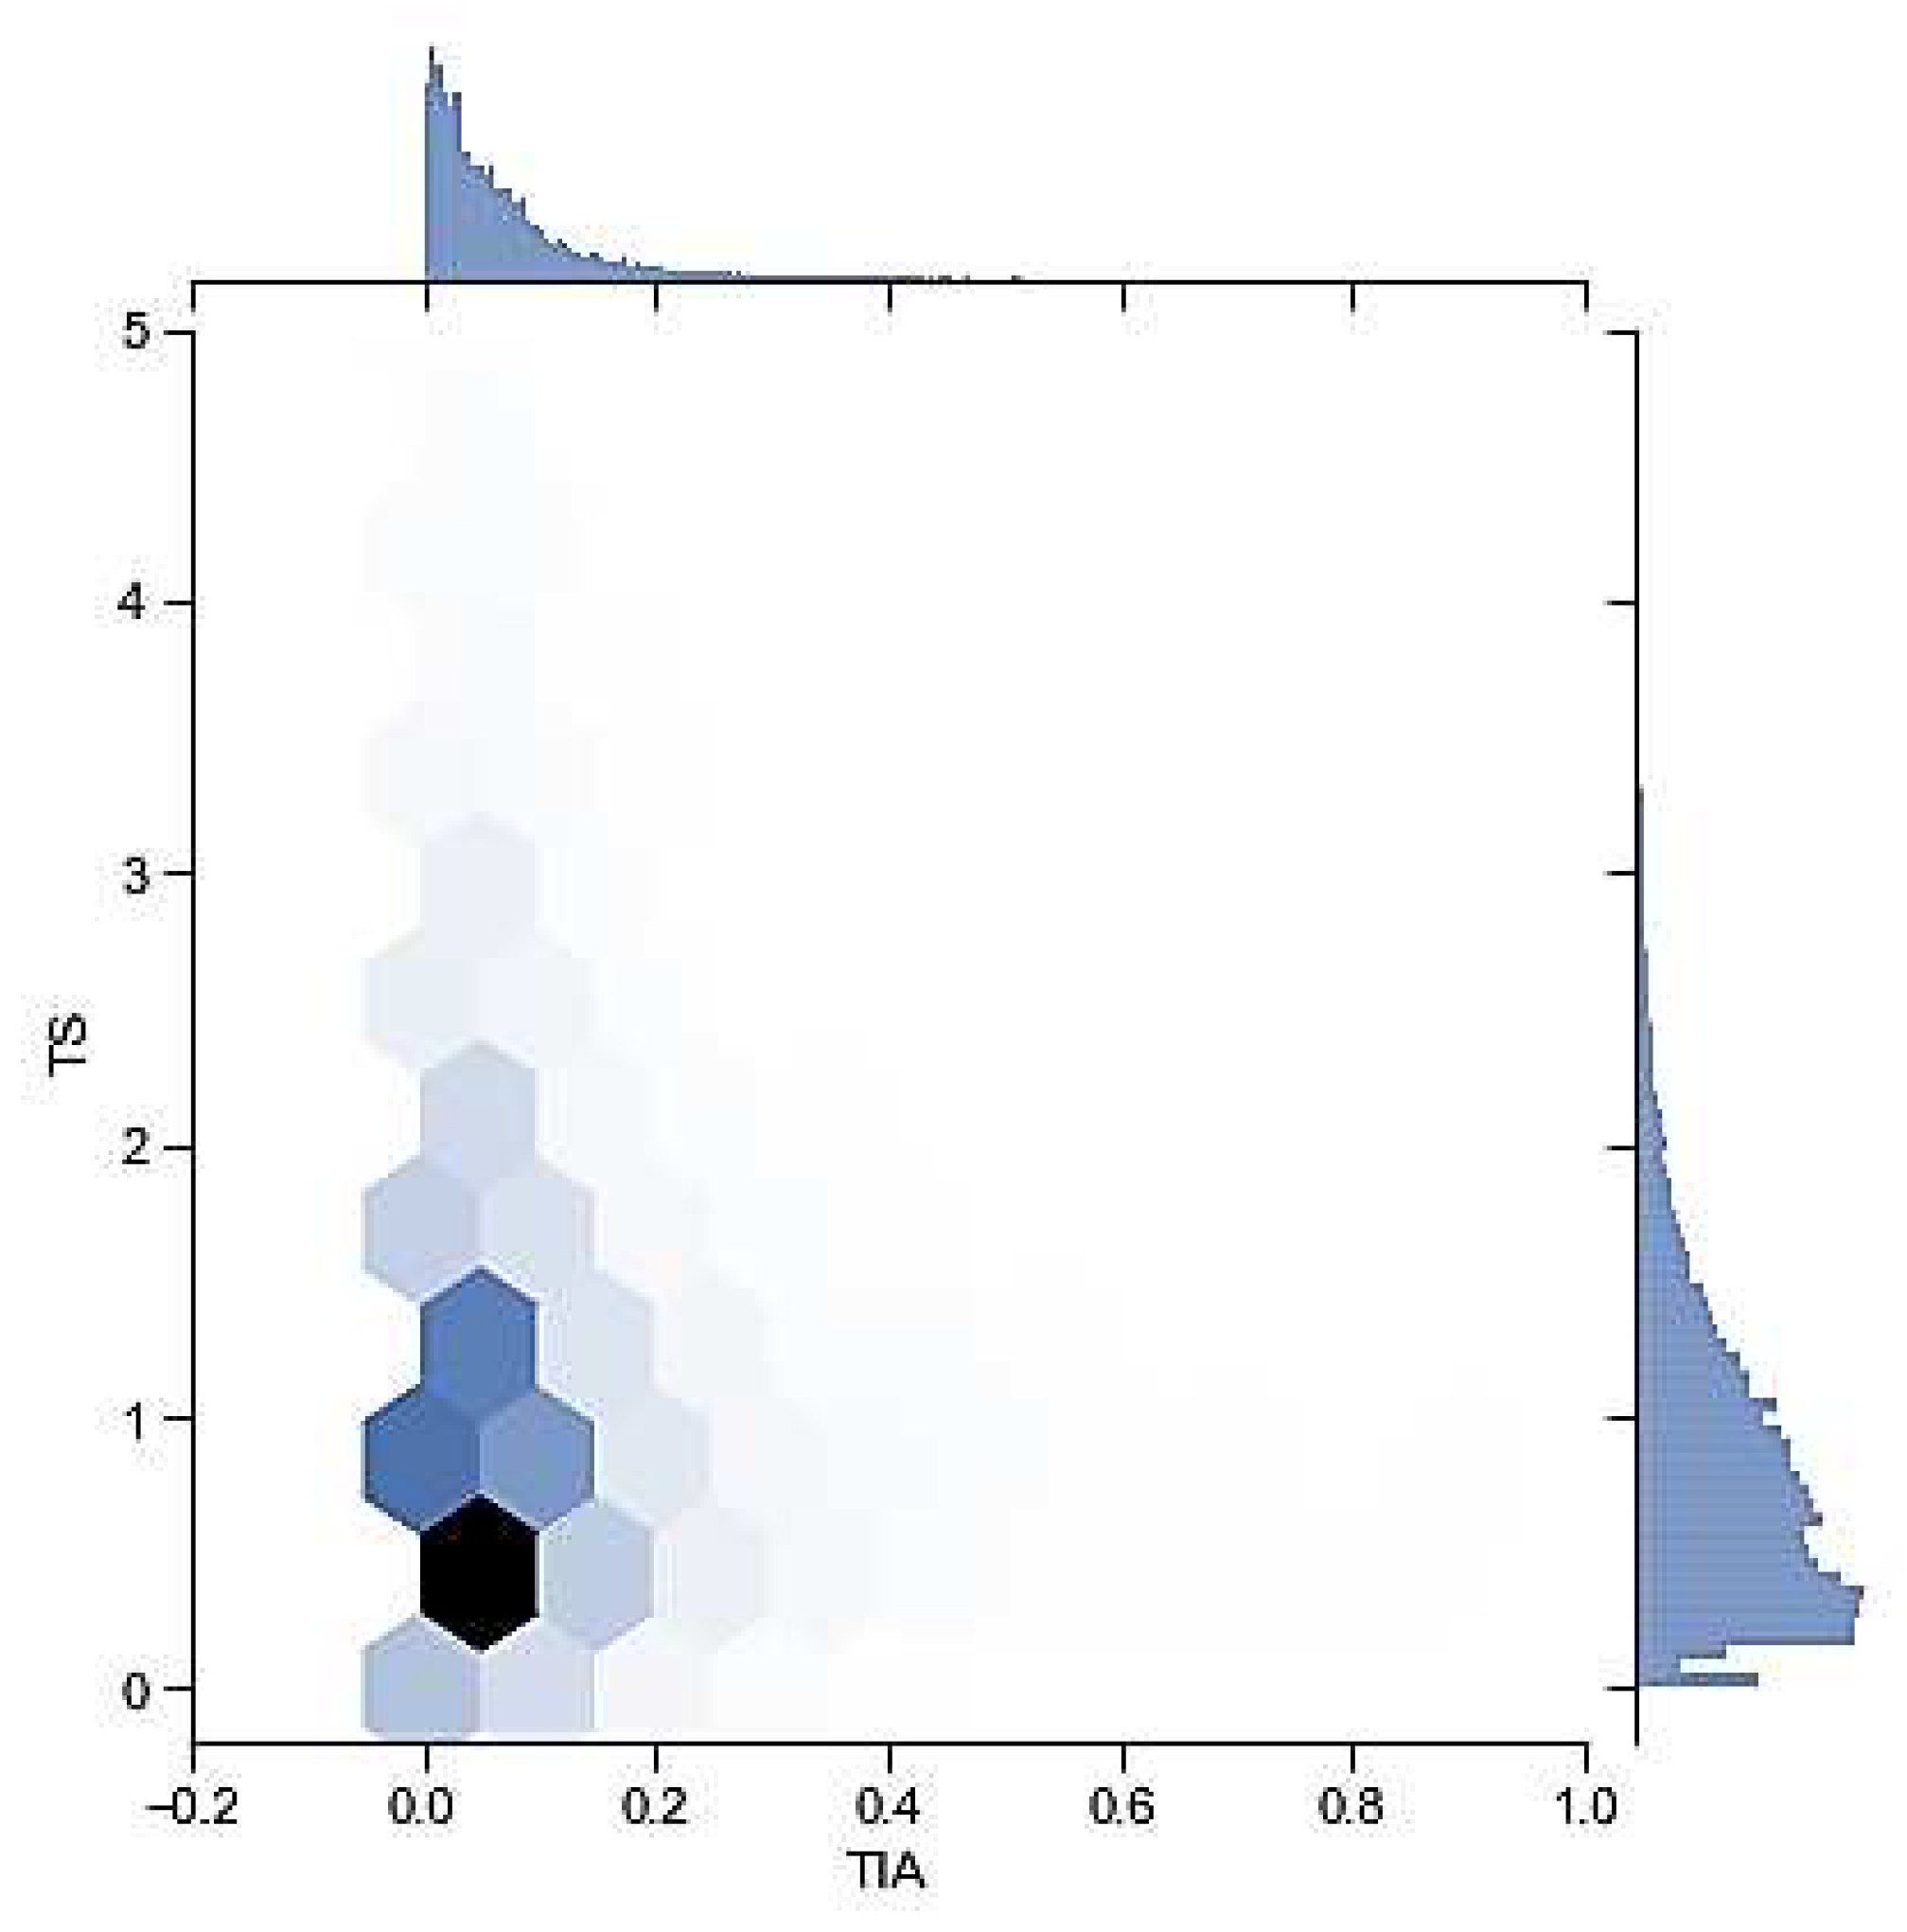
Figure 4.
Simulation period selection from 6:00 to 17:00, Monday through Friday.
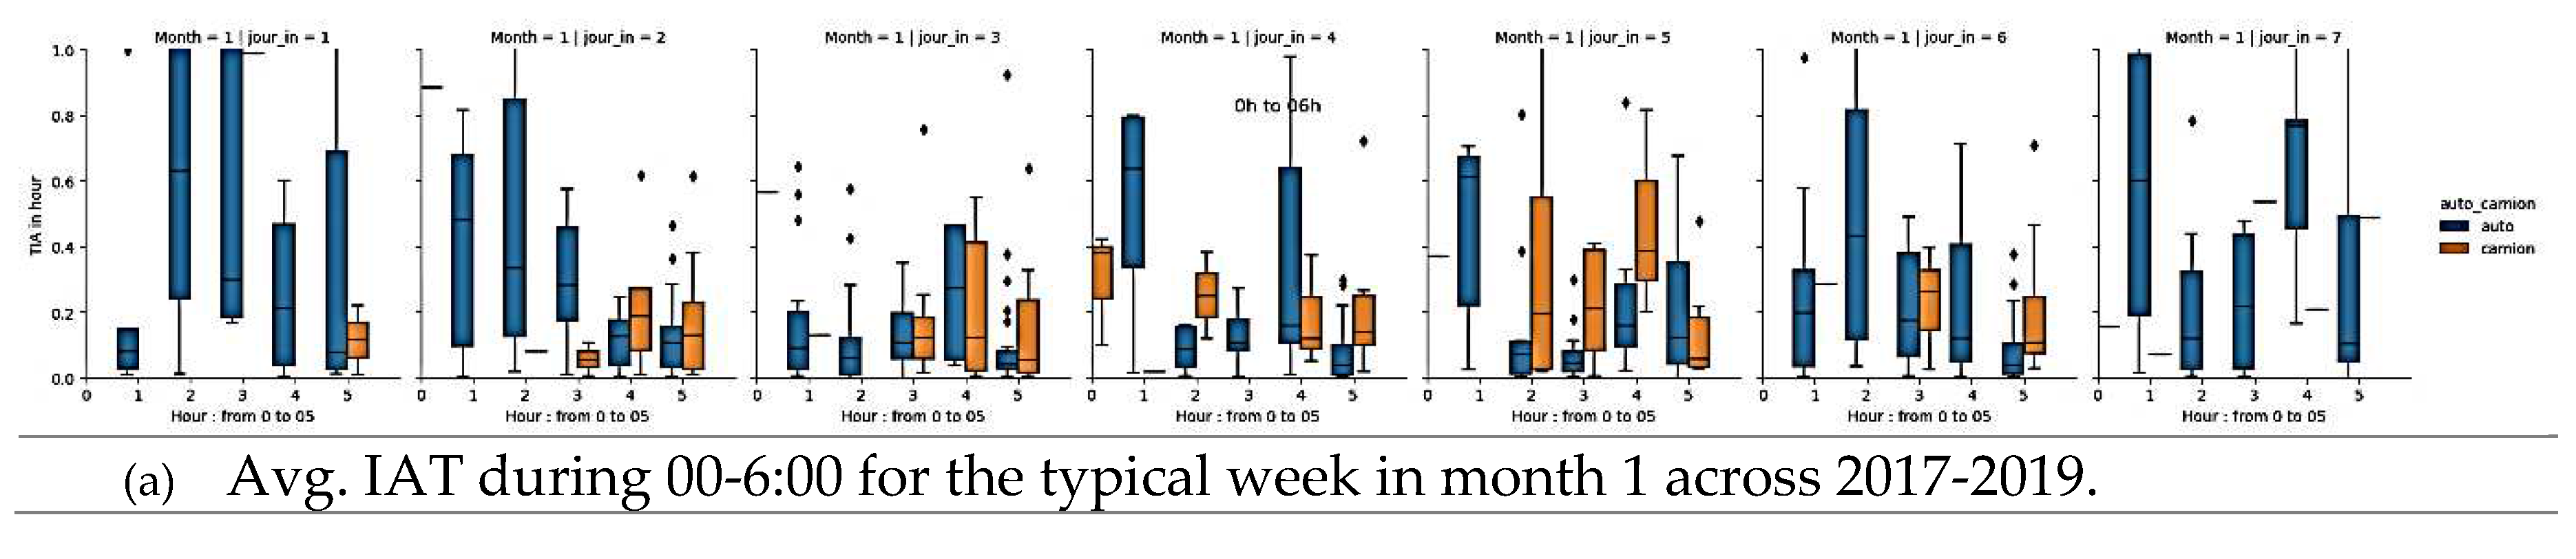
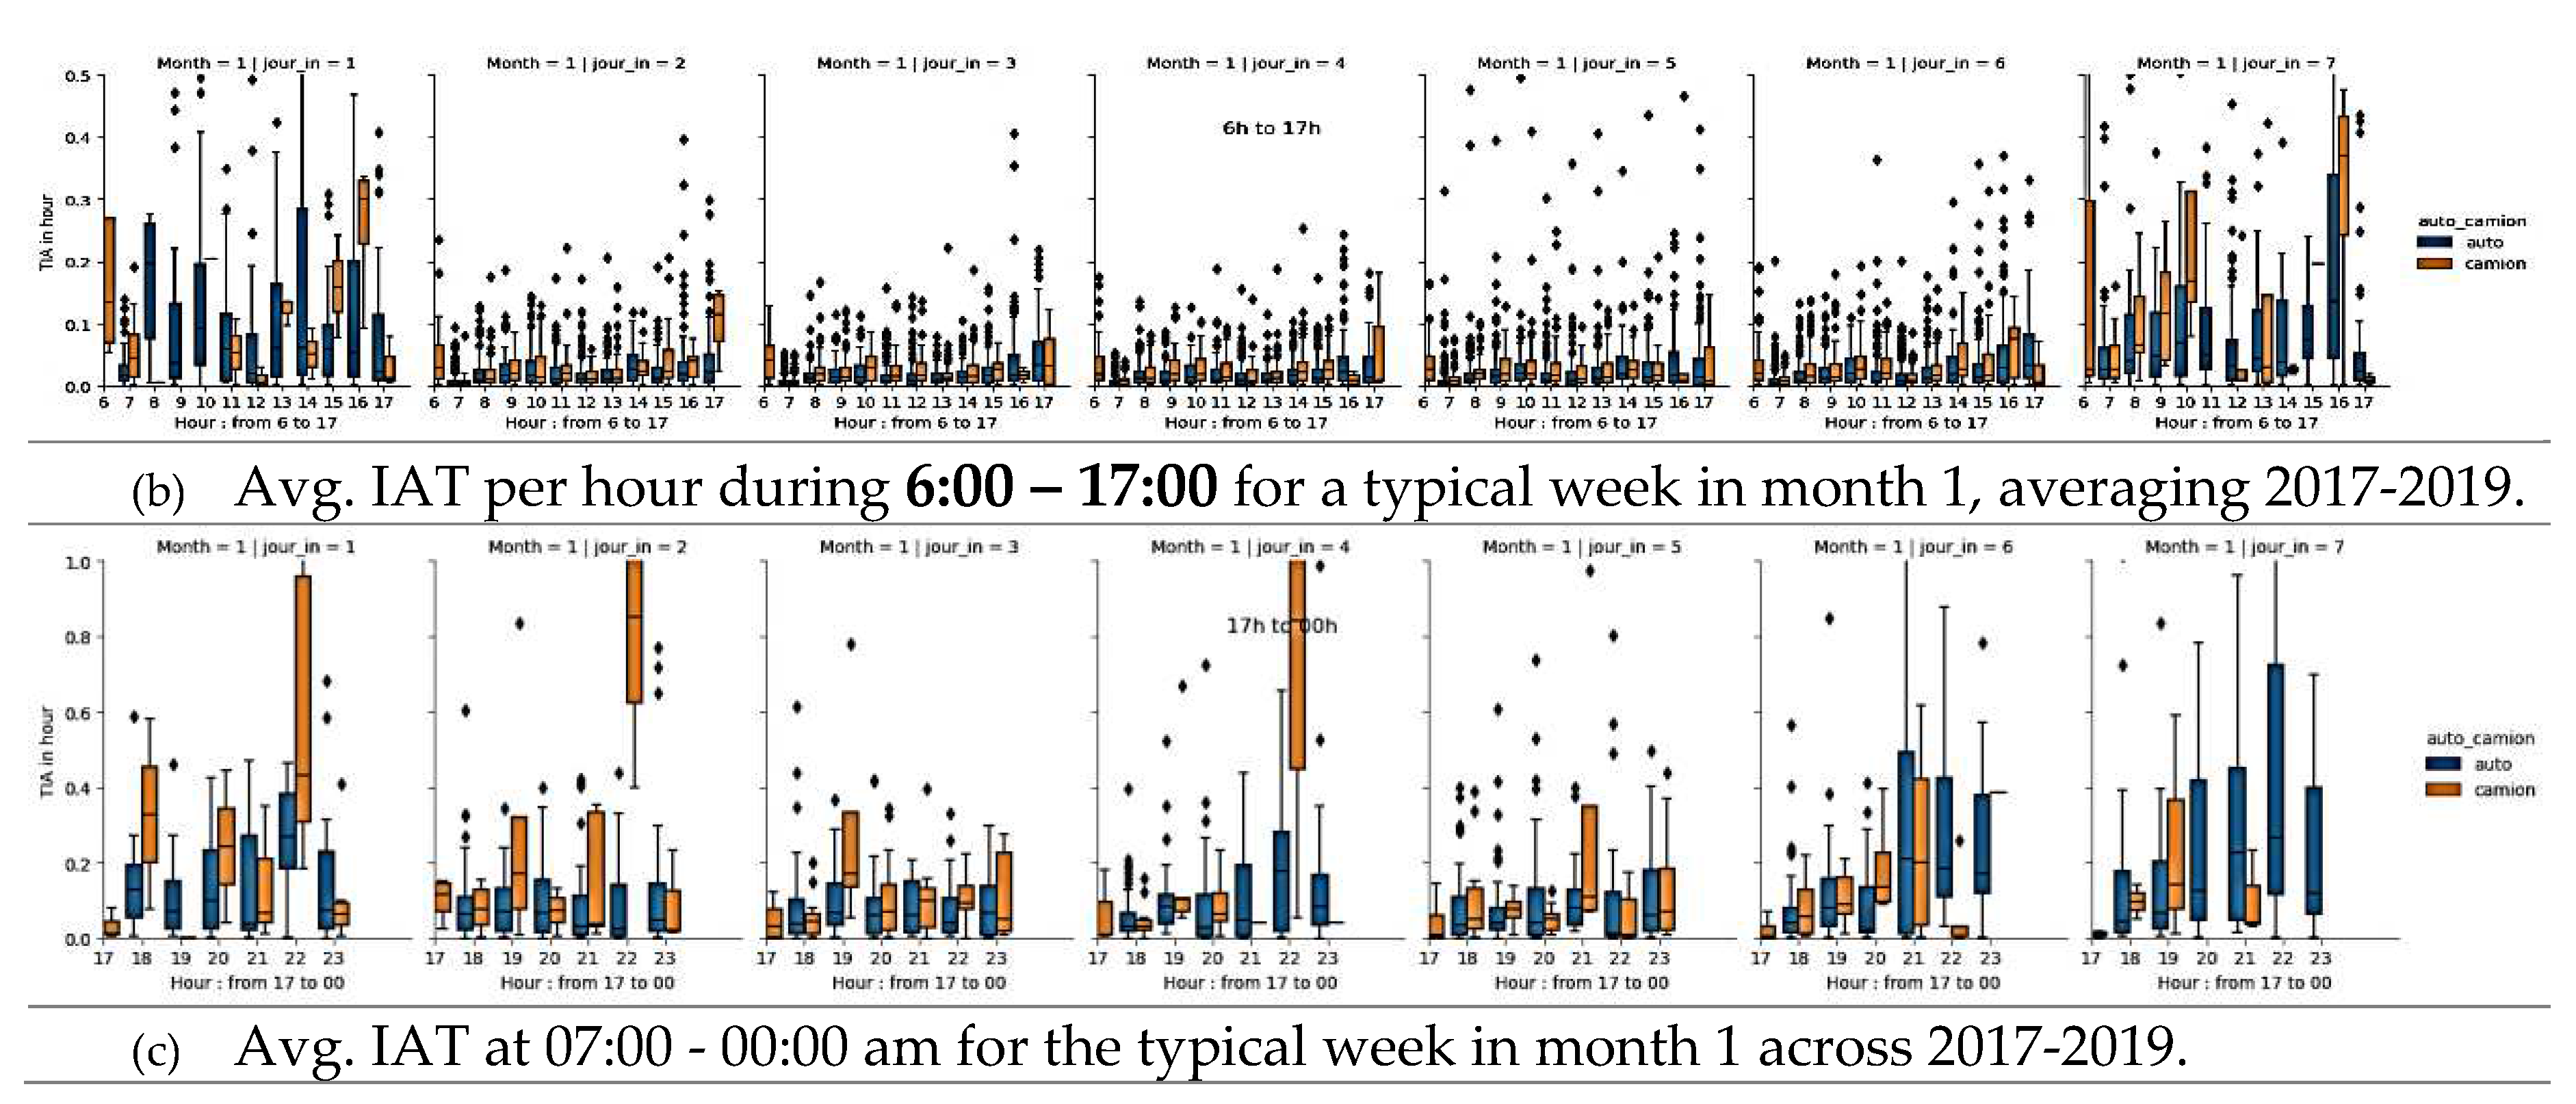
Figure 5.
Design and implementation of the two-gate simulation models.
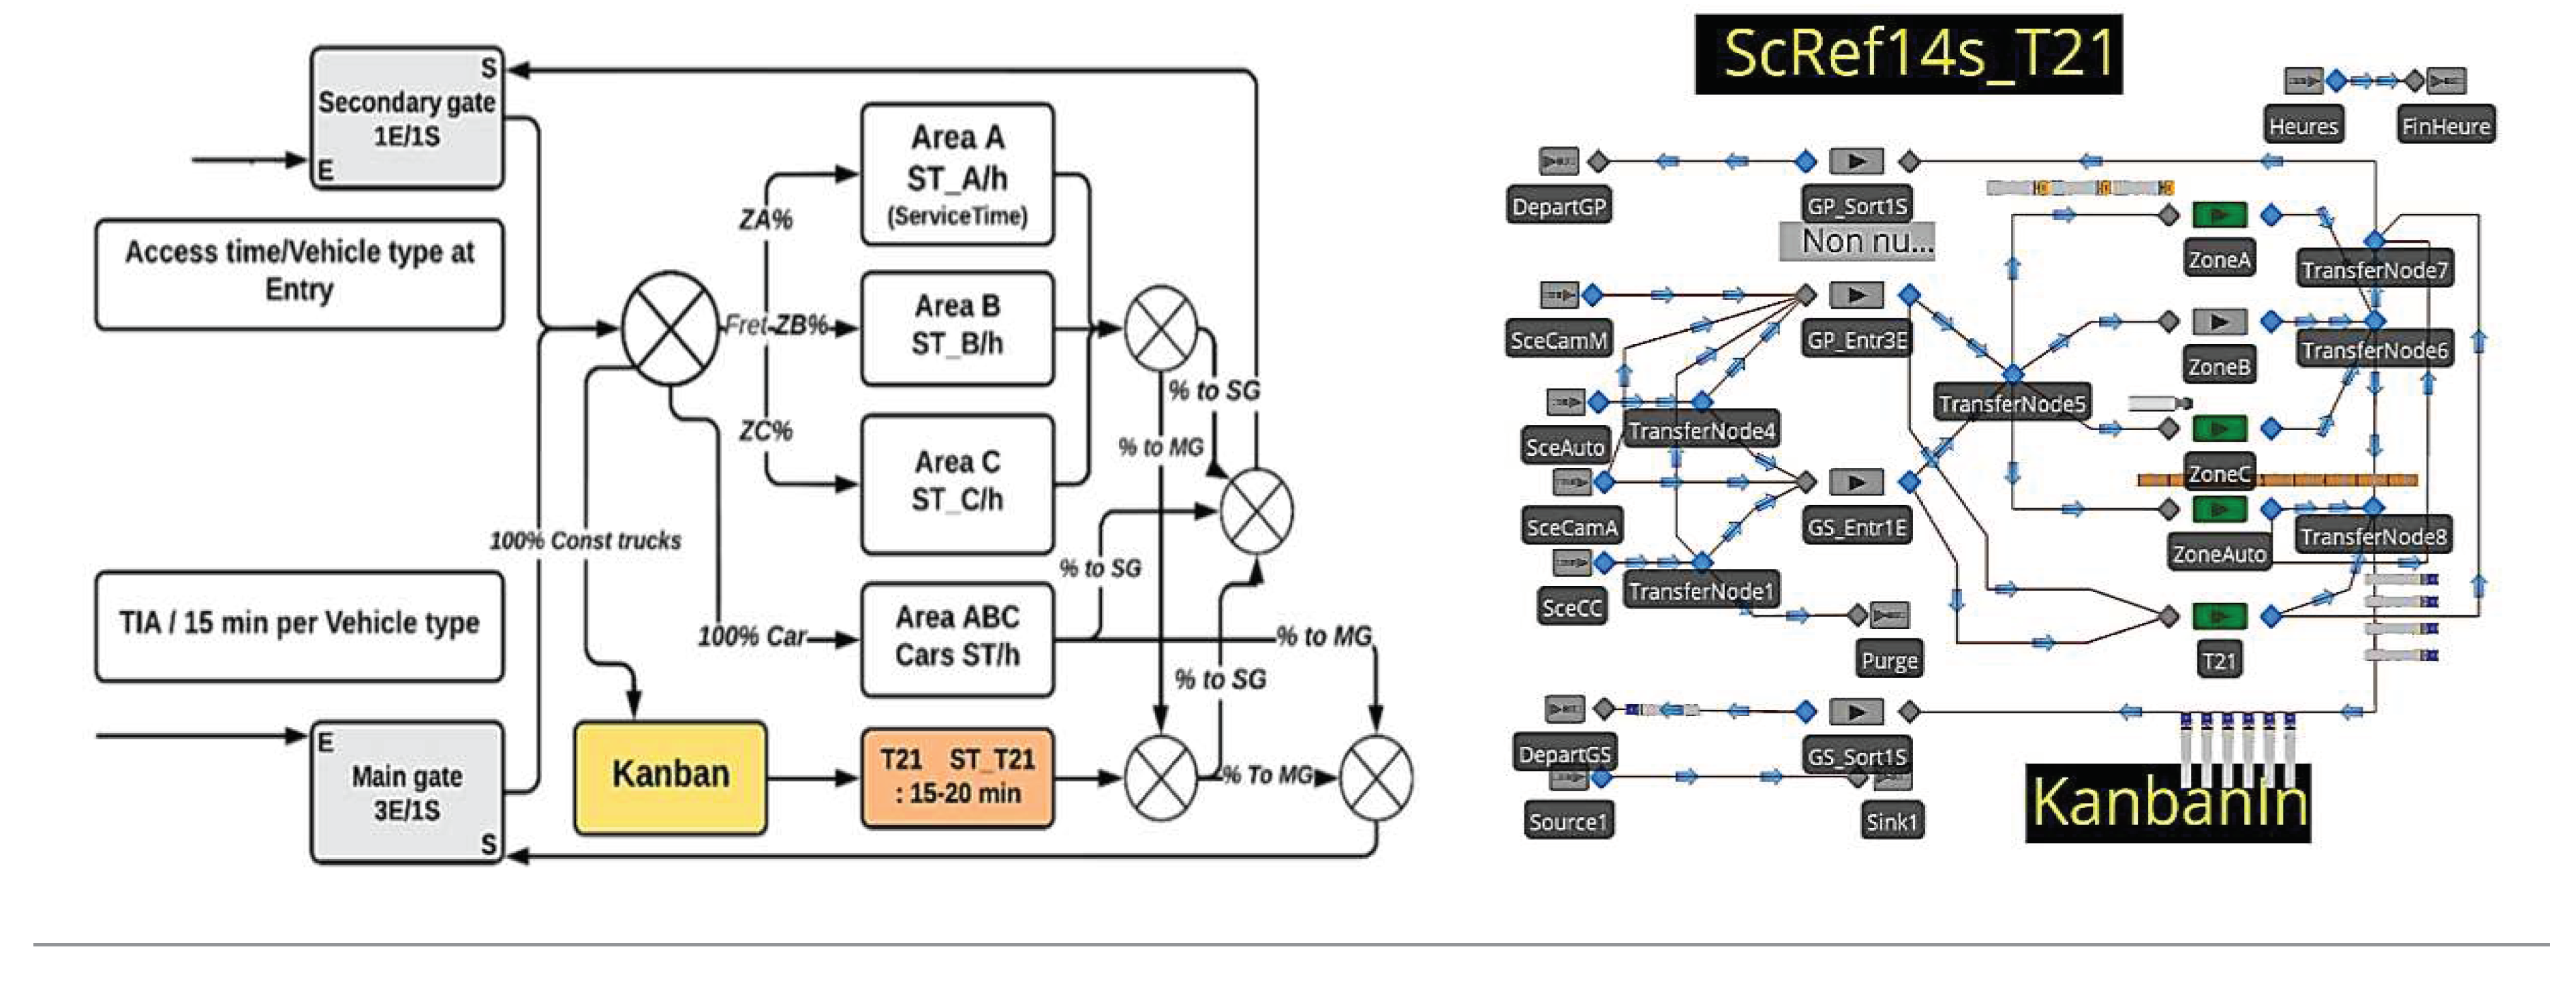
Figure 6.
Scenarios design approach.
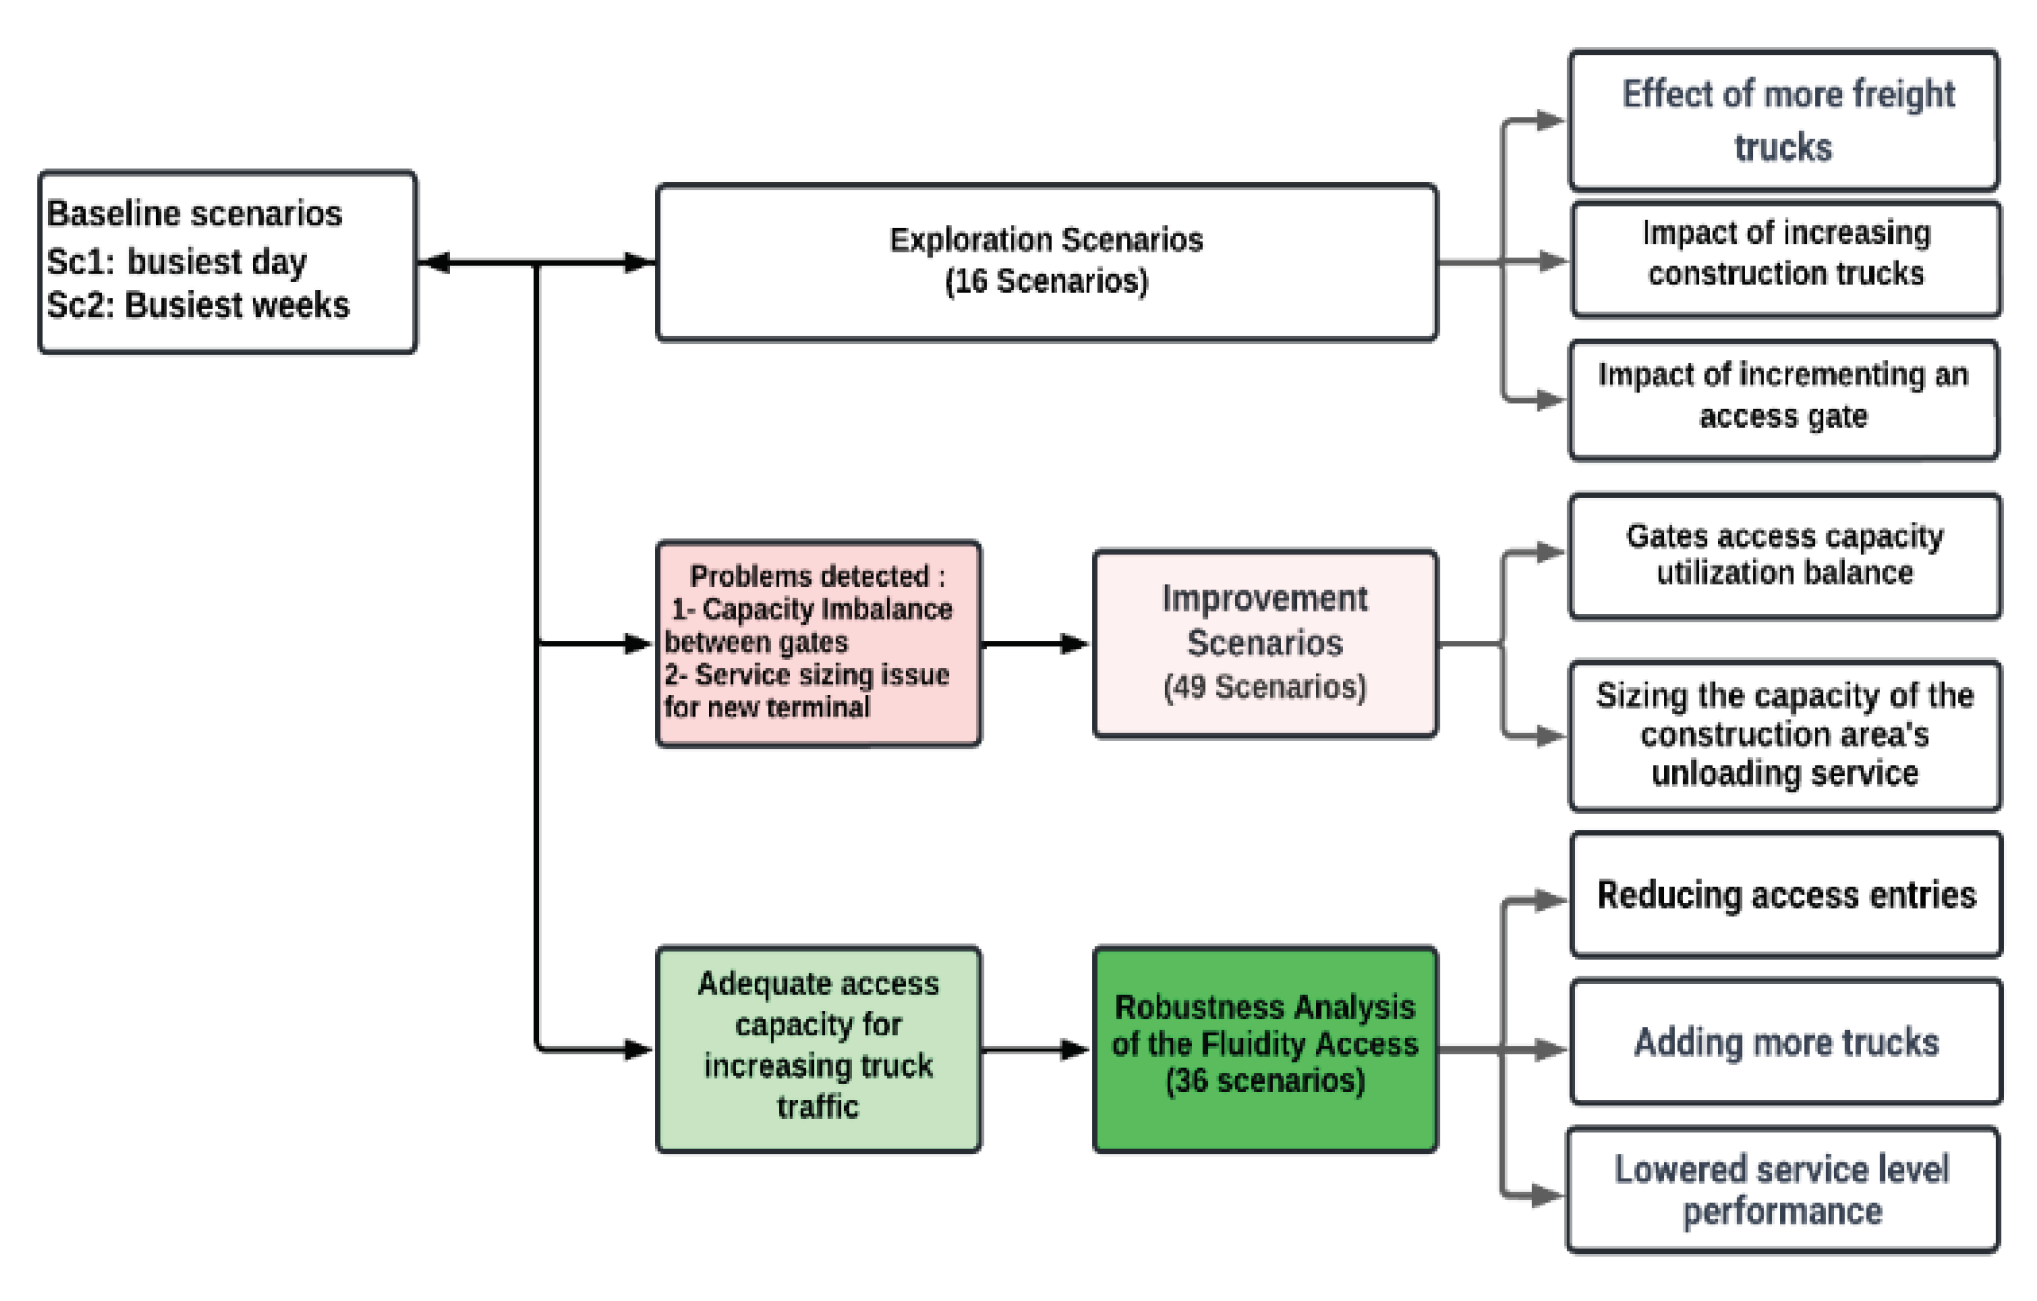
Figure 7.
Reference period selection for baseline scenarios.
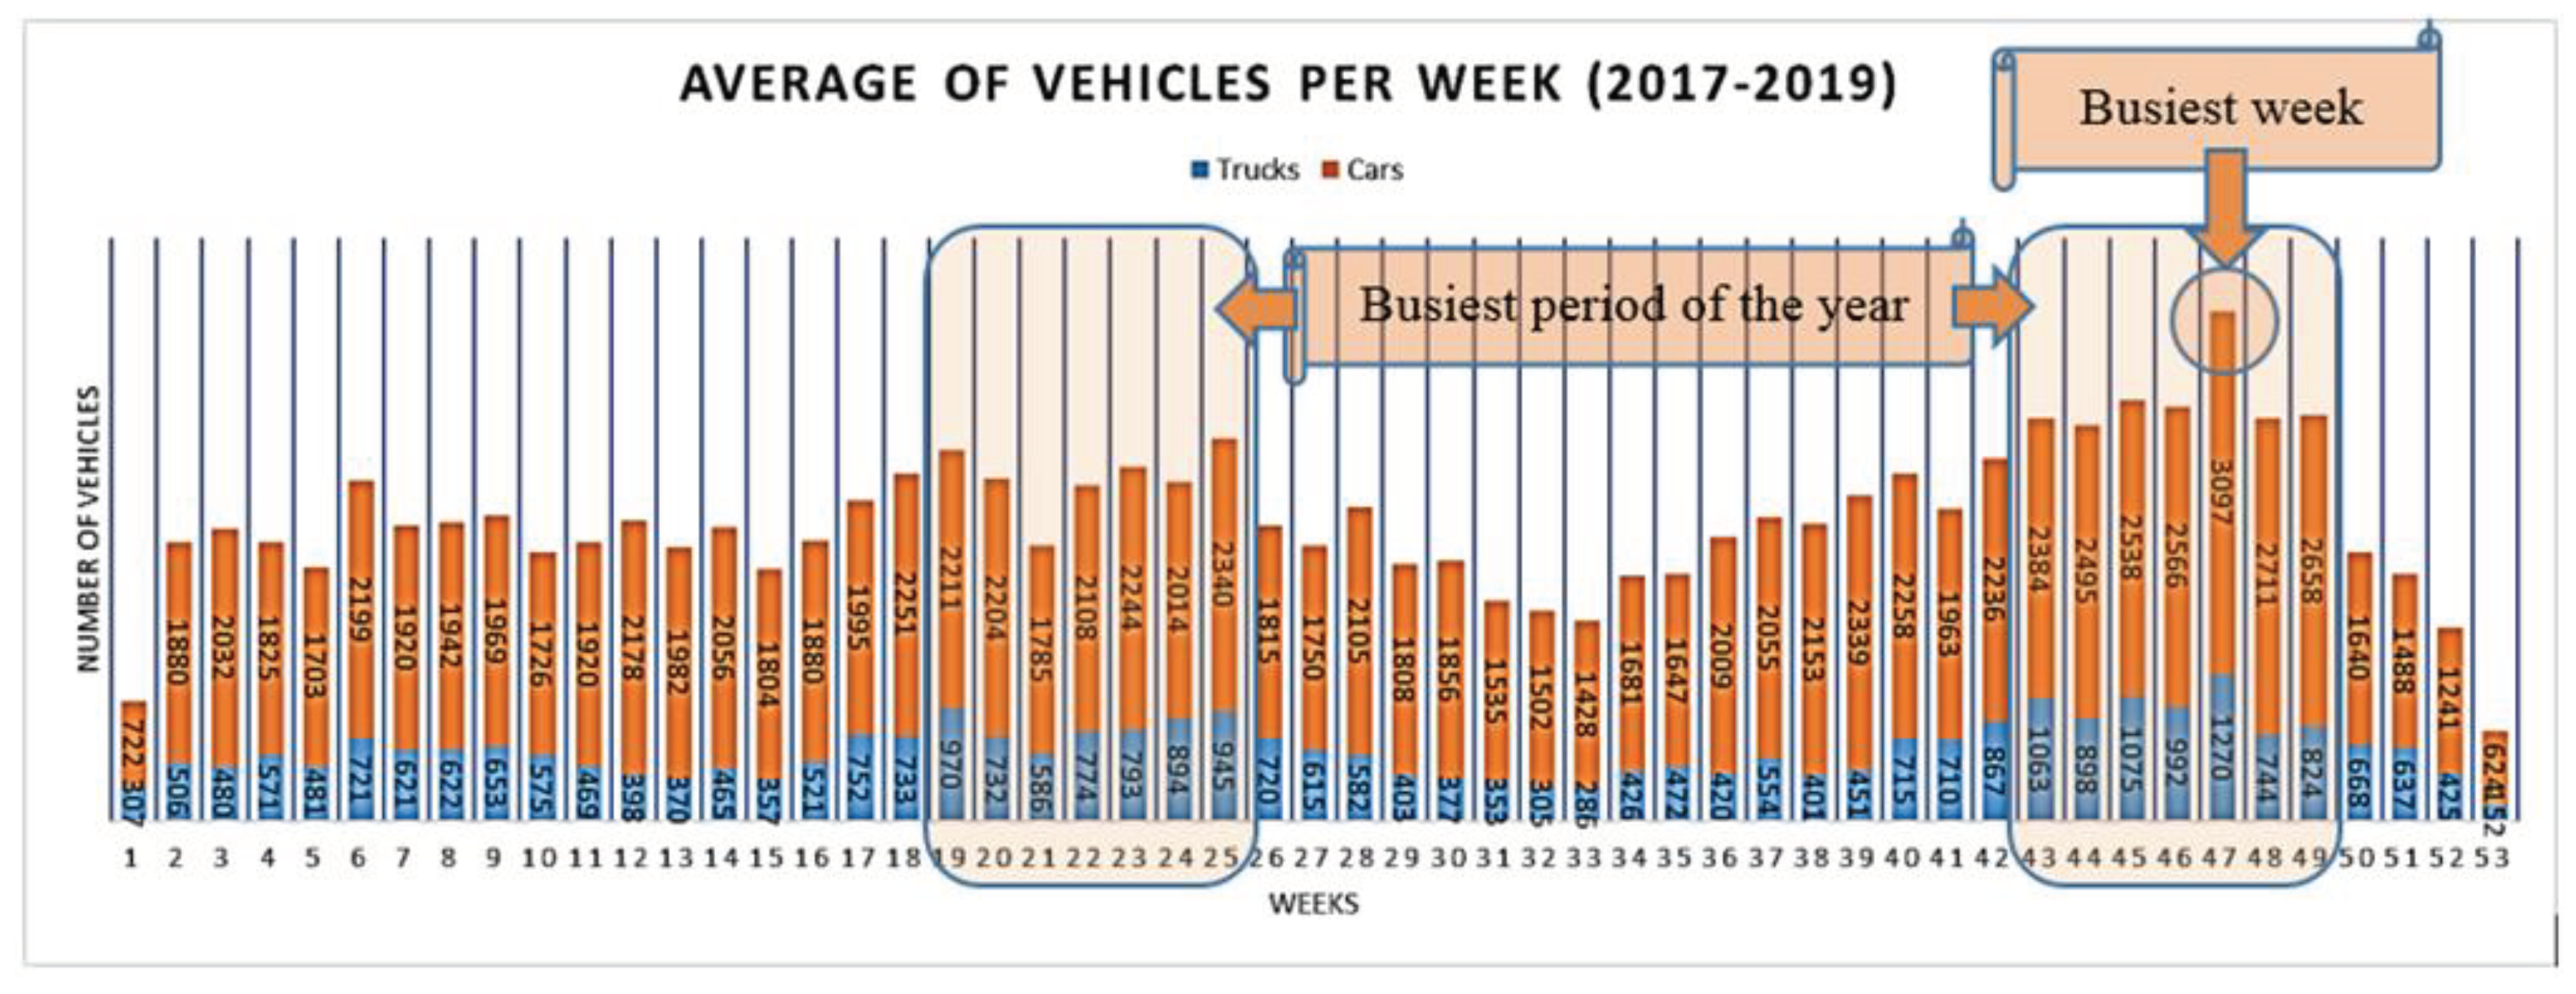
Figure 8.
Utilized capacities (%) of access gates (Main Gate and Secondary Gate) for Entry/Exit in baseline scenarios.
Figure 8.
Utilized capacities (%) of access gates (Main Gate and Secondary Gate) for Entry/Exit in baseline scenarios.
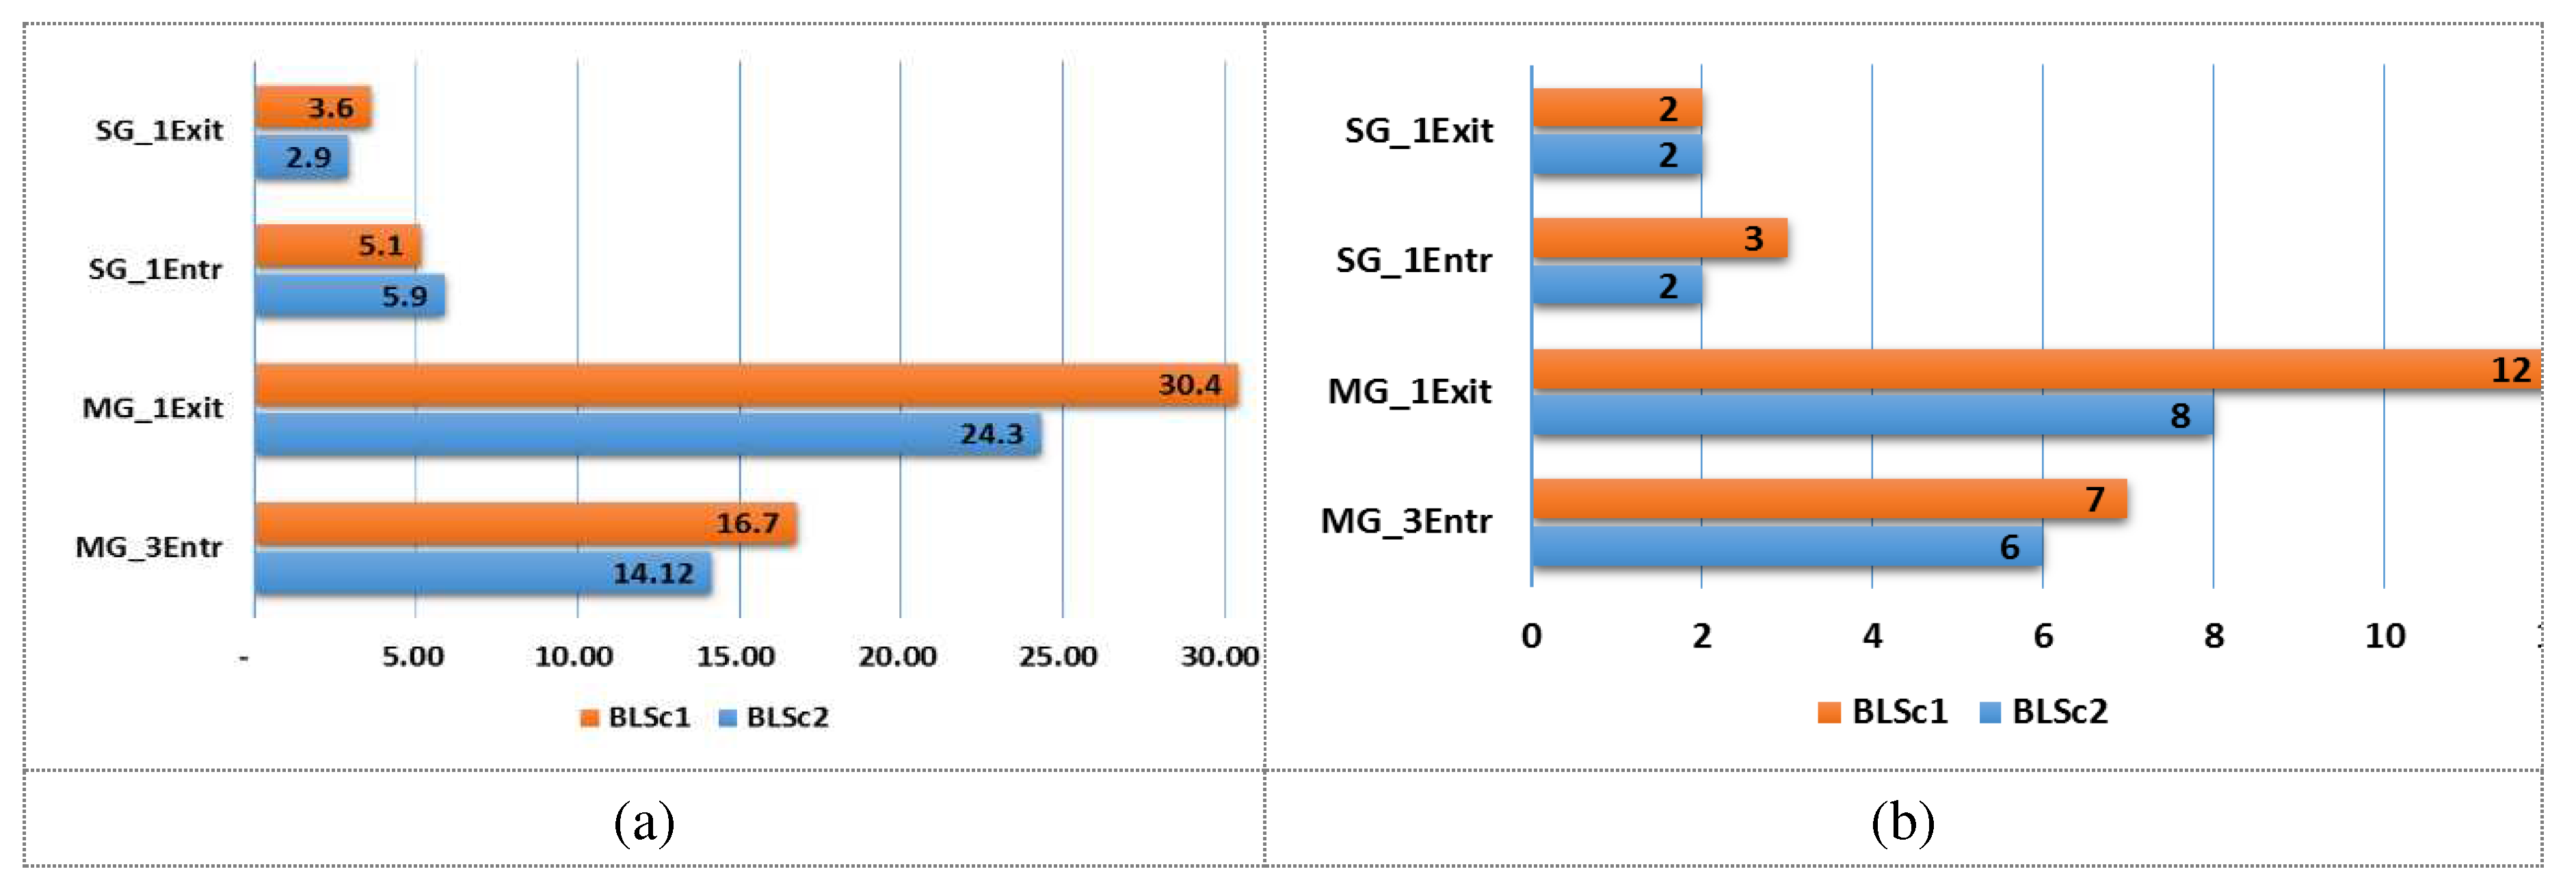
Figure 9.
Impact of increased truck volume on Access Capacity at Two Gates Scenario.
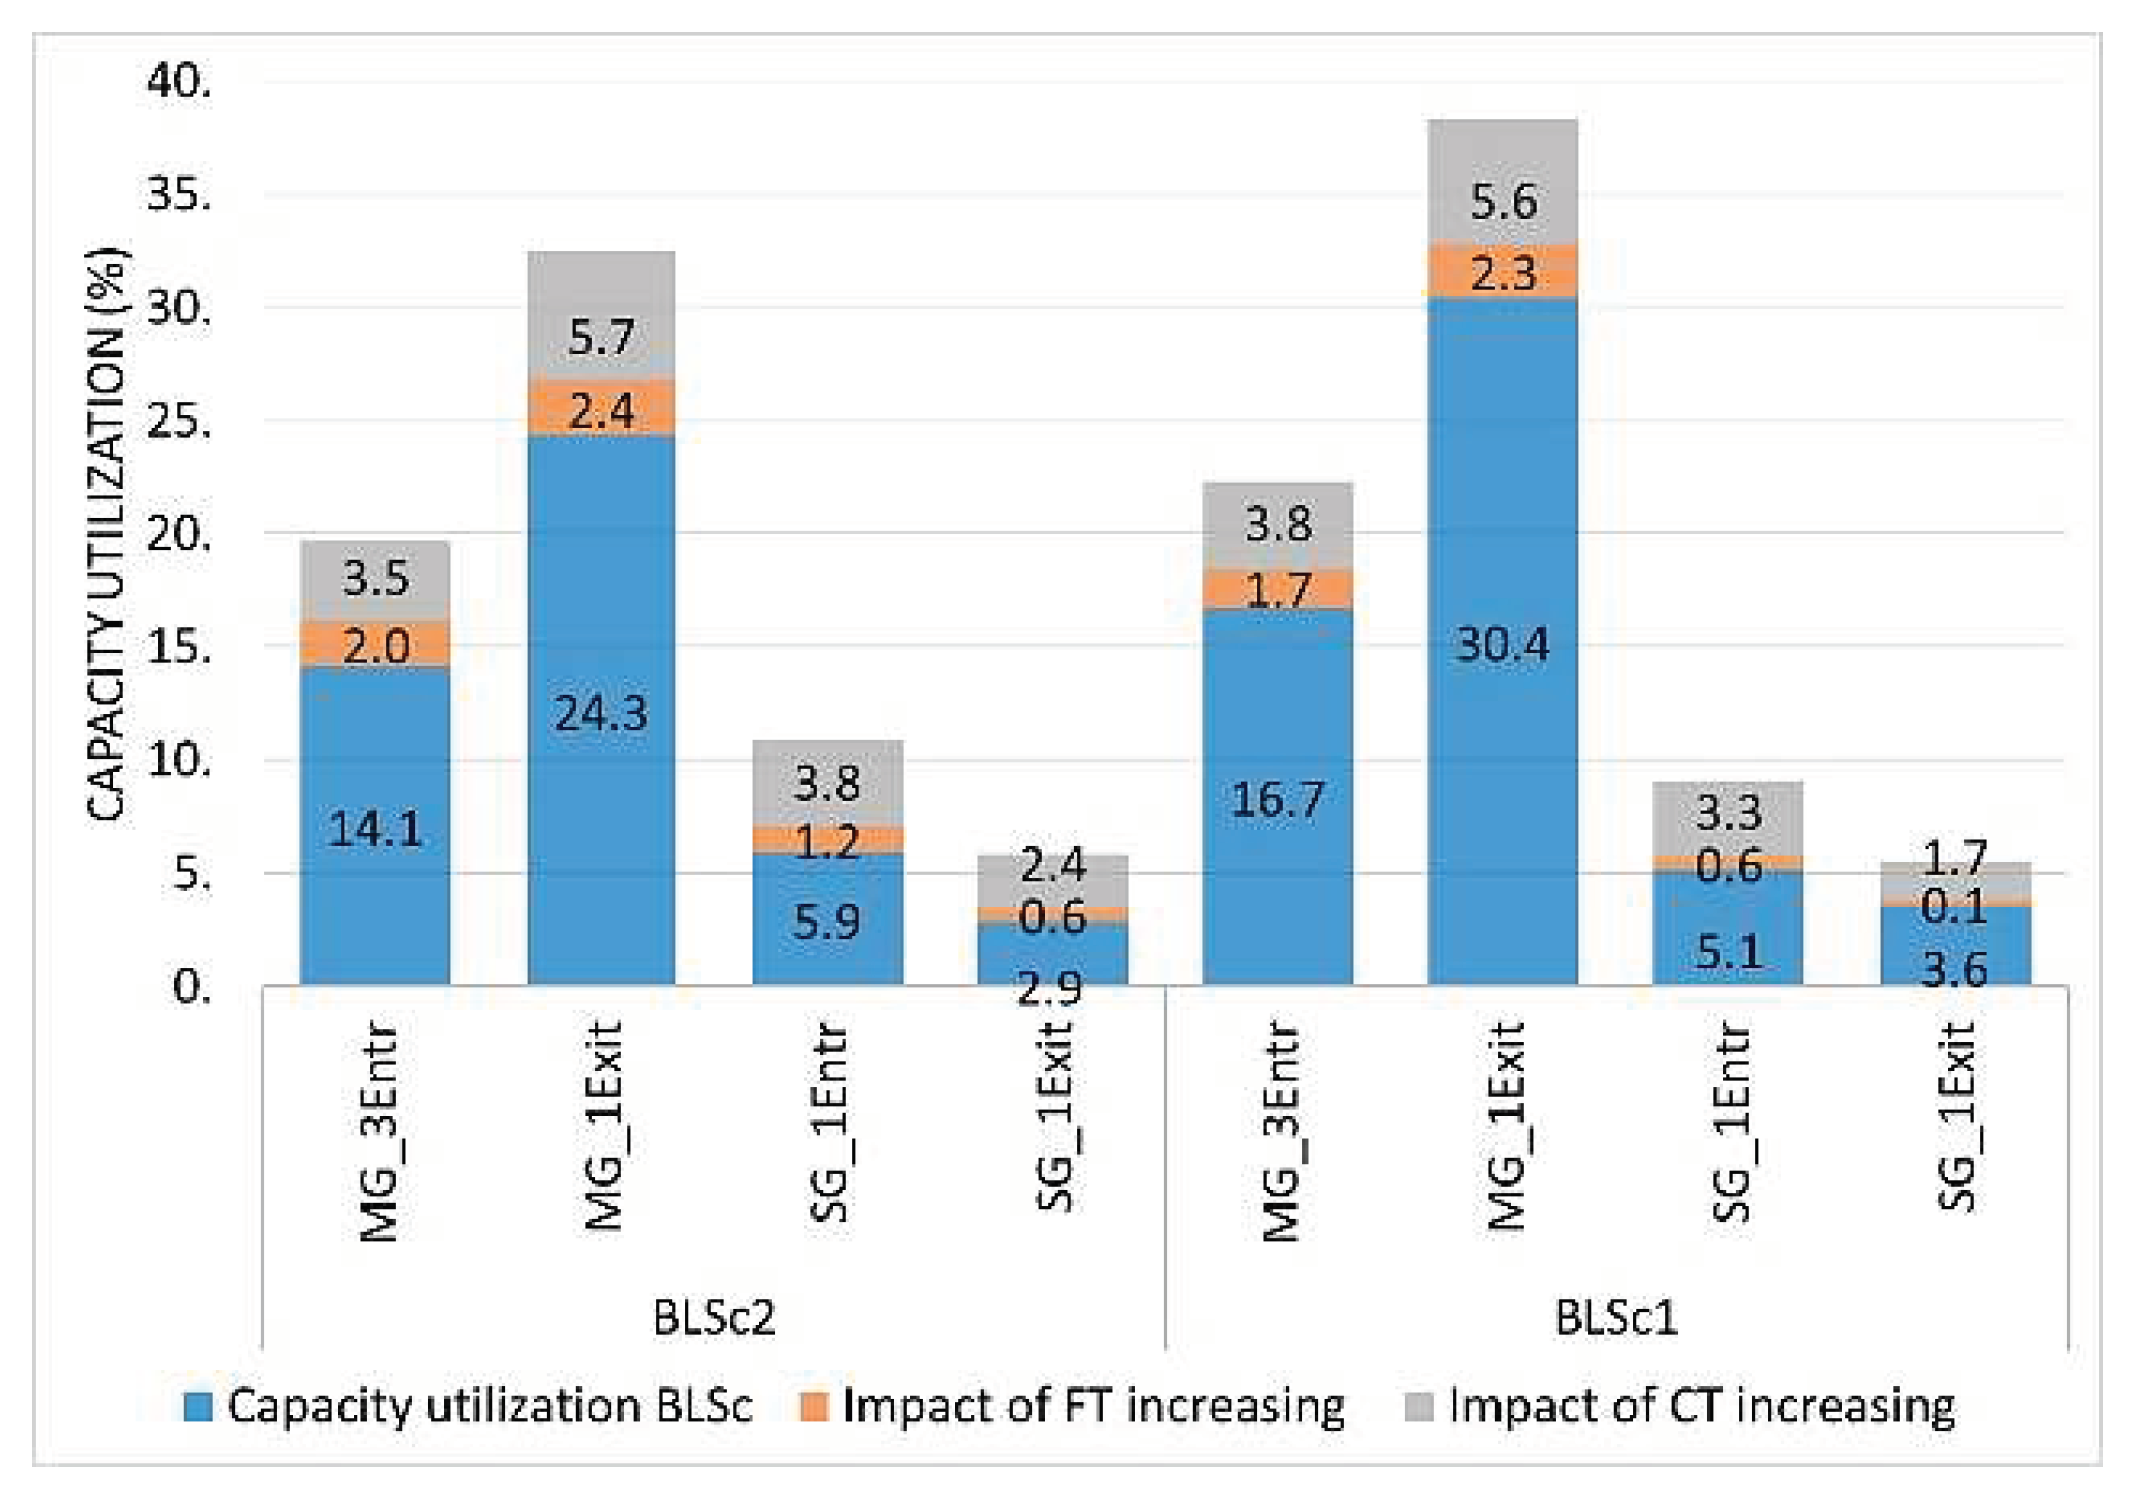
Figure 10.
total number of trucks in the system, including those waiting for access, with an unloading time of 15 minutes.
Figure 10.
total number of trucks in the system, including those waiting for access, with an unloading time of 15 minutes.
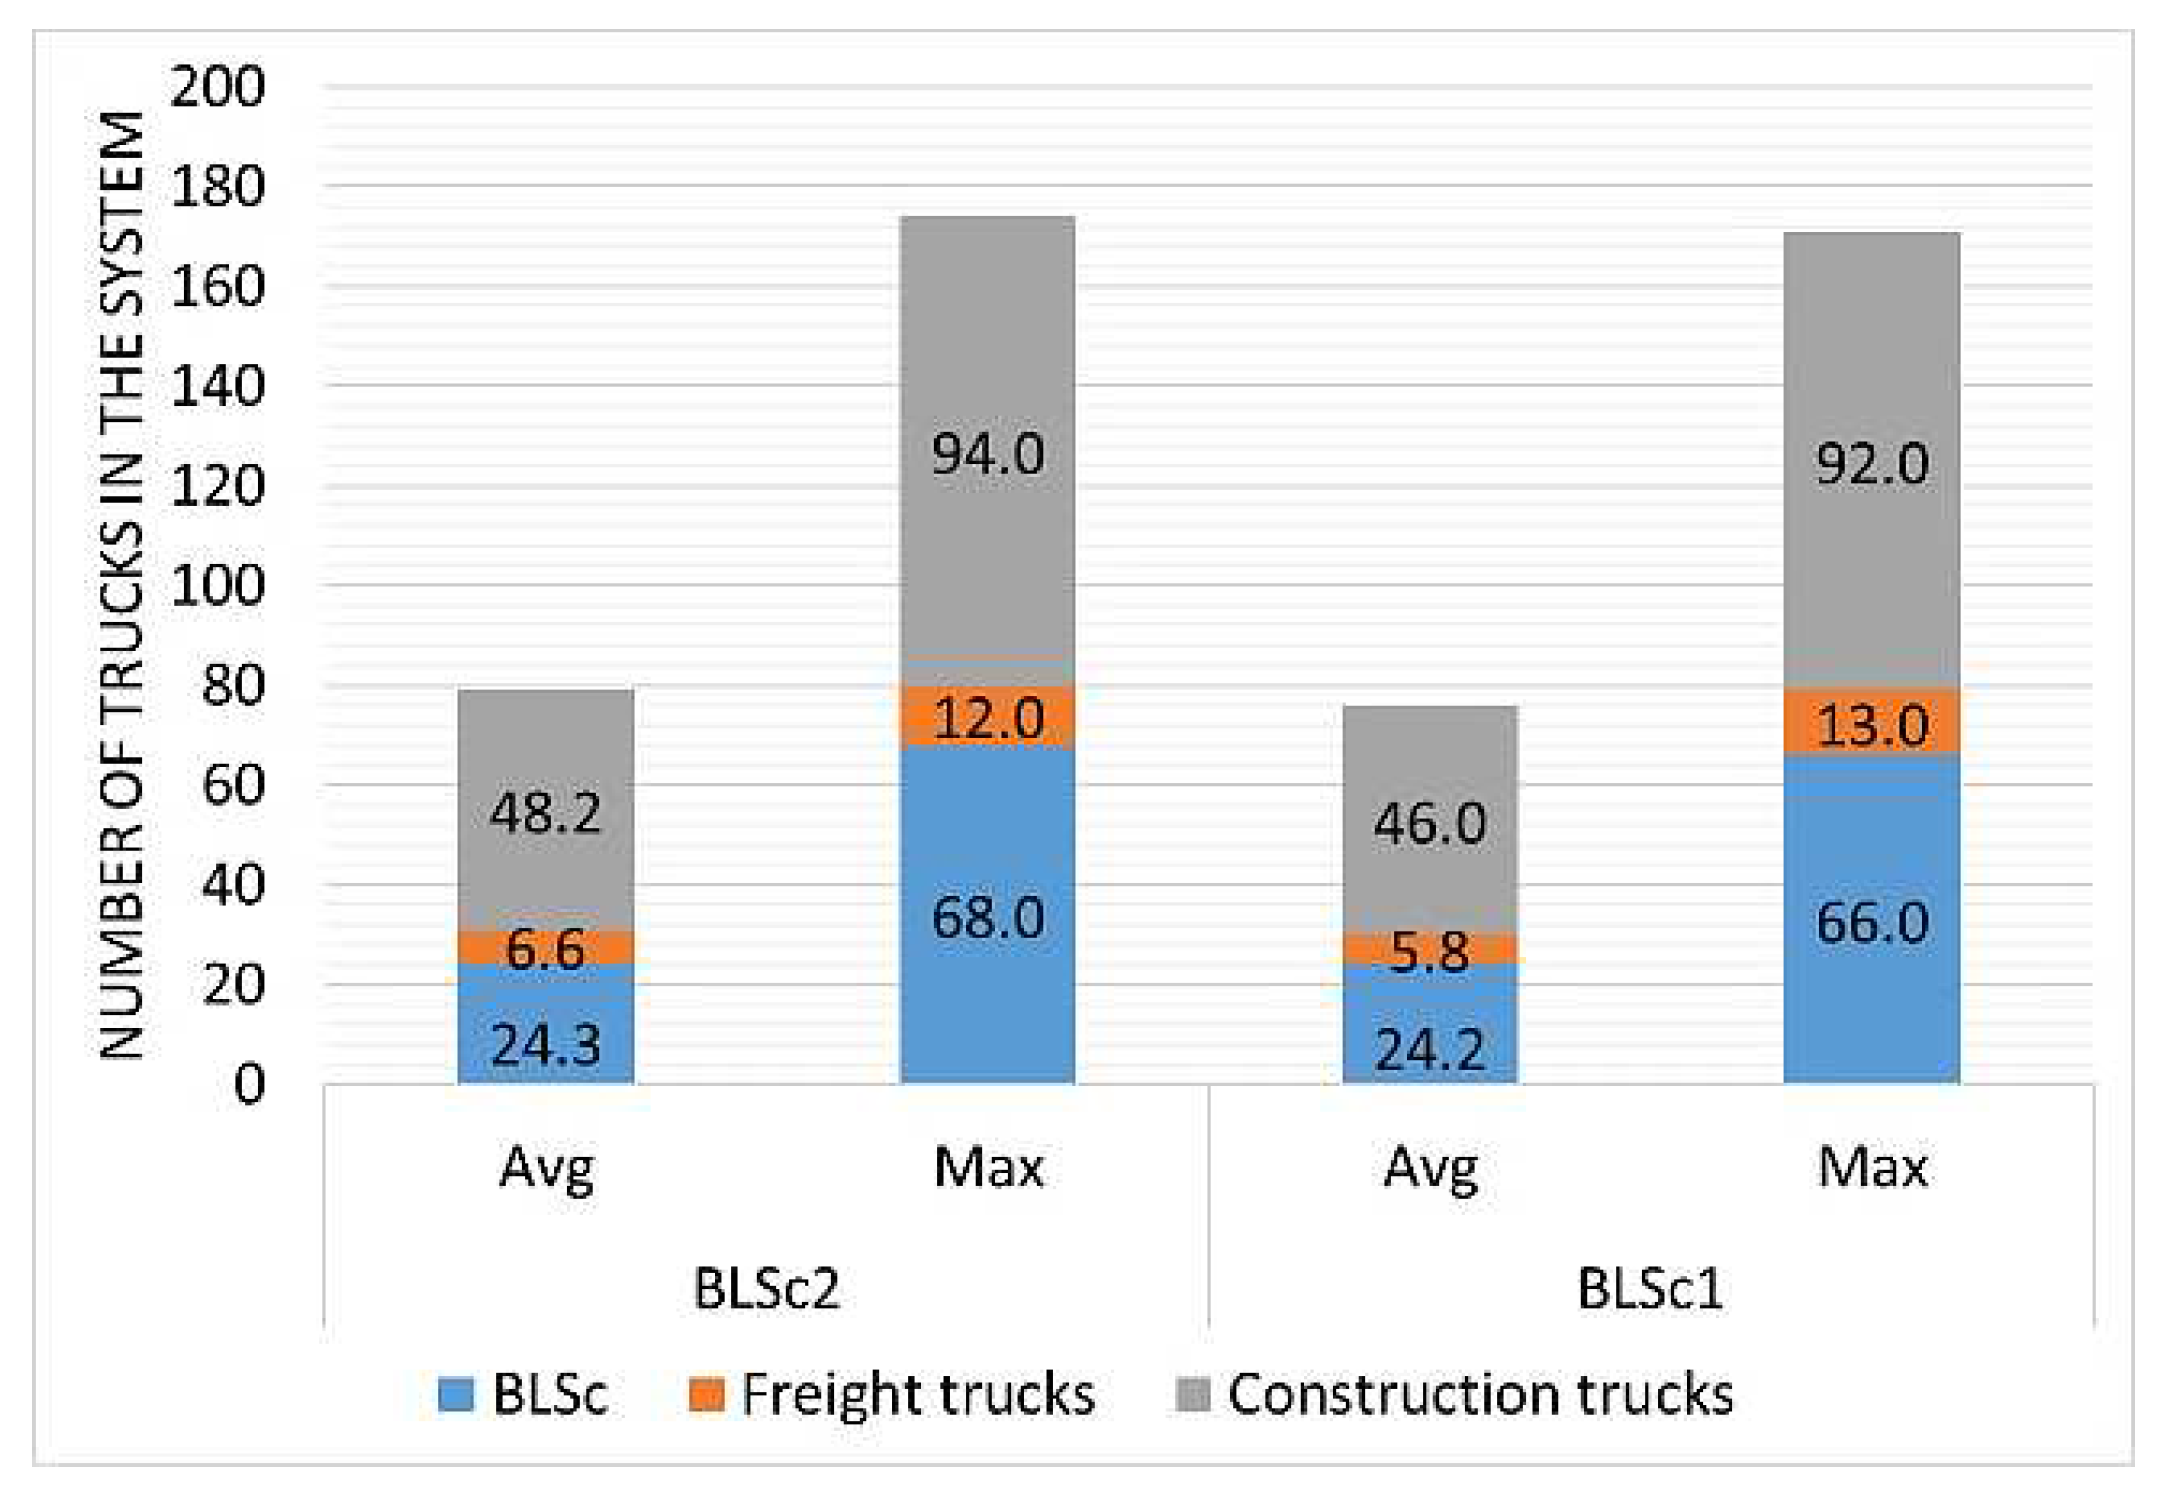
Figure 11.
Impact of adding a new access gate to the capacity utilization with an unloading time of 15 min.
Figure 11.
Impact of adding a new access gate to the capacity utilization with an unloading time of 15 min.
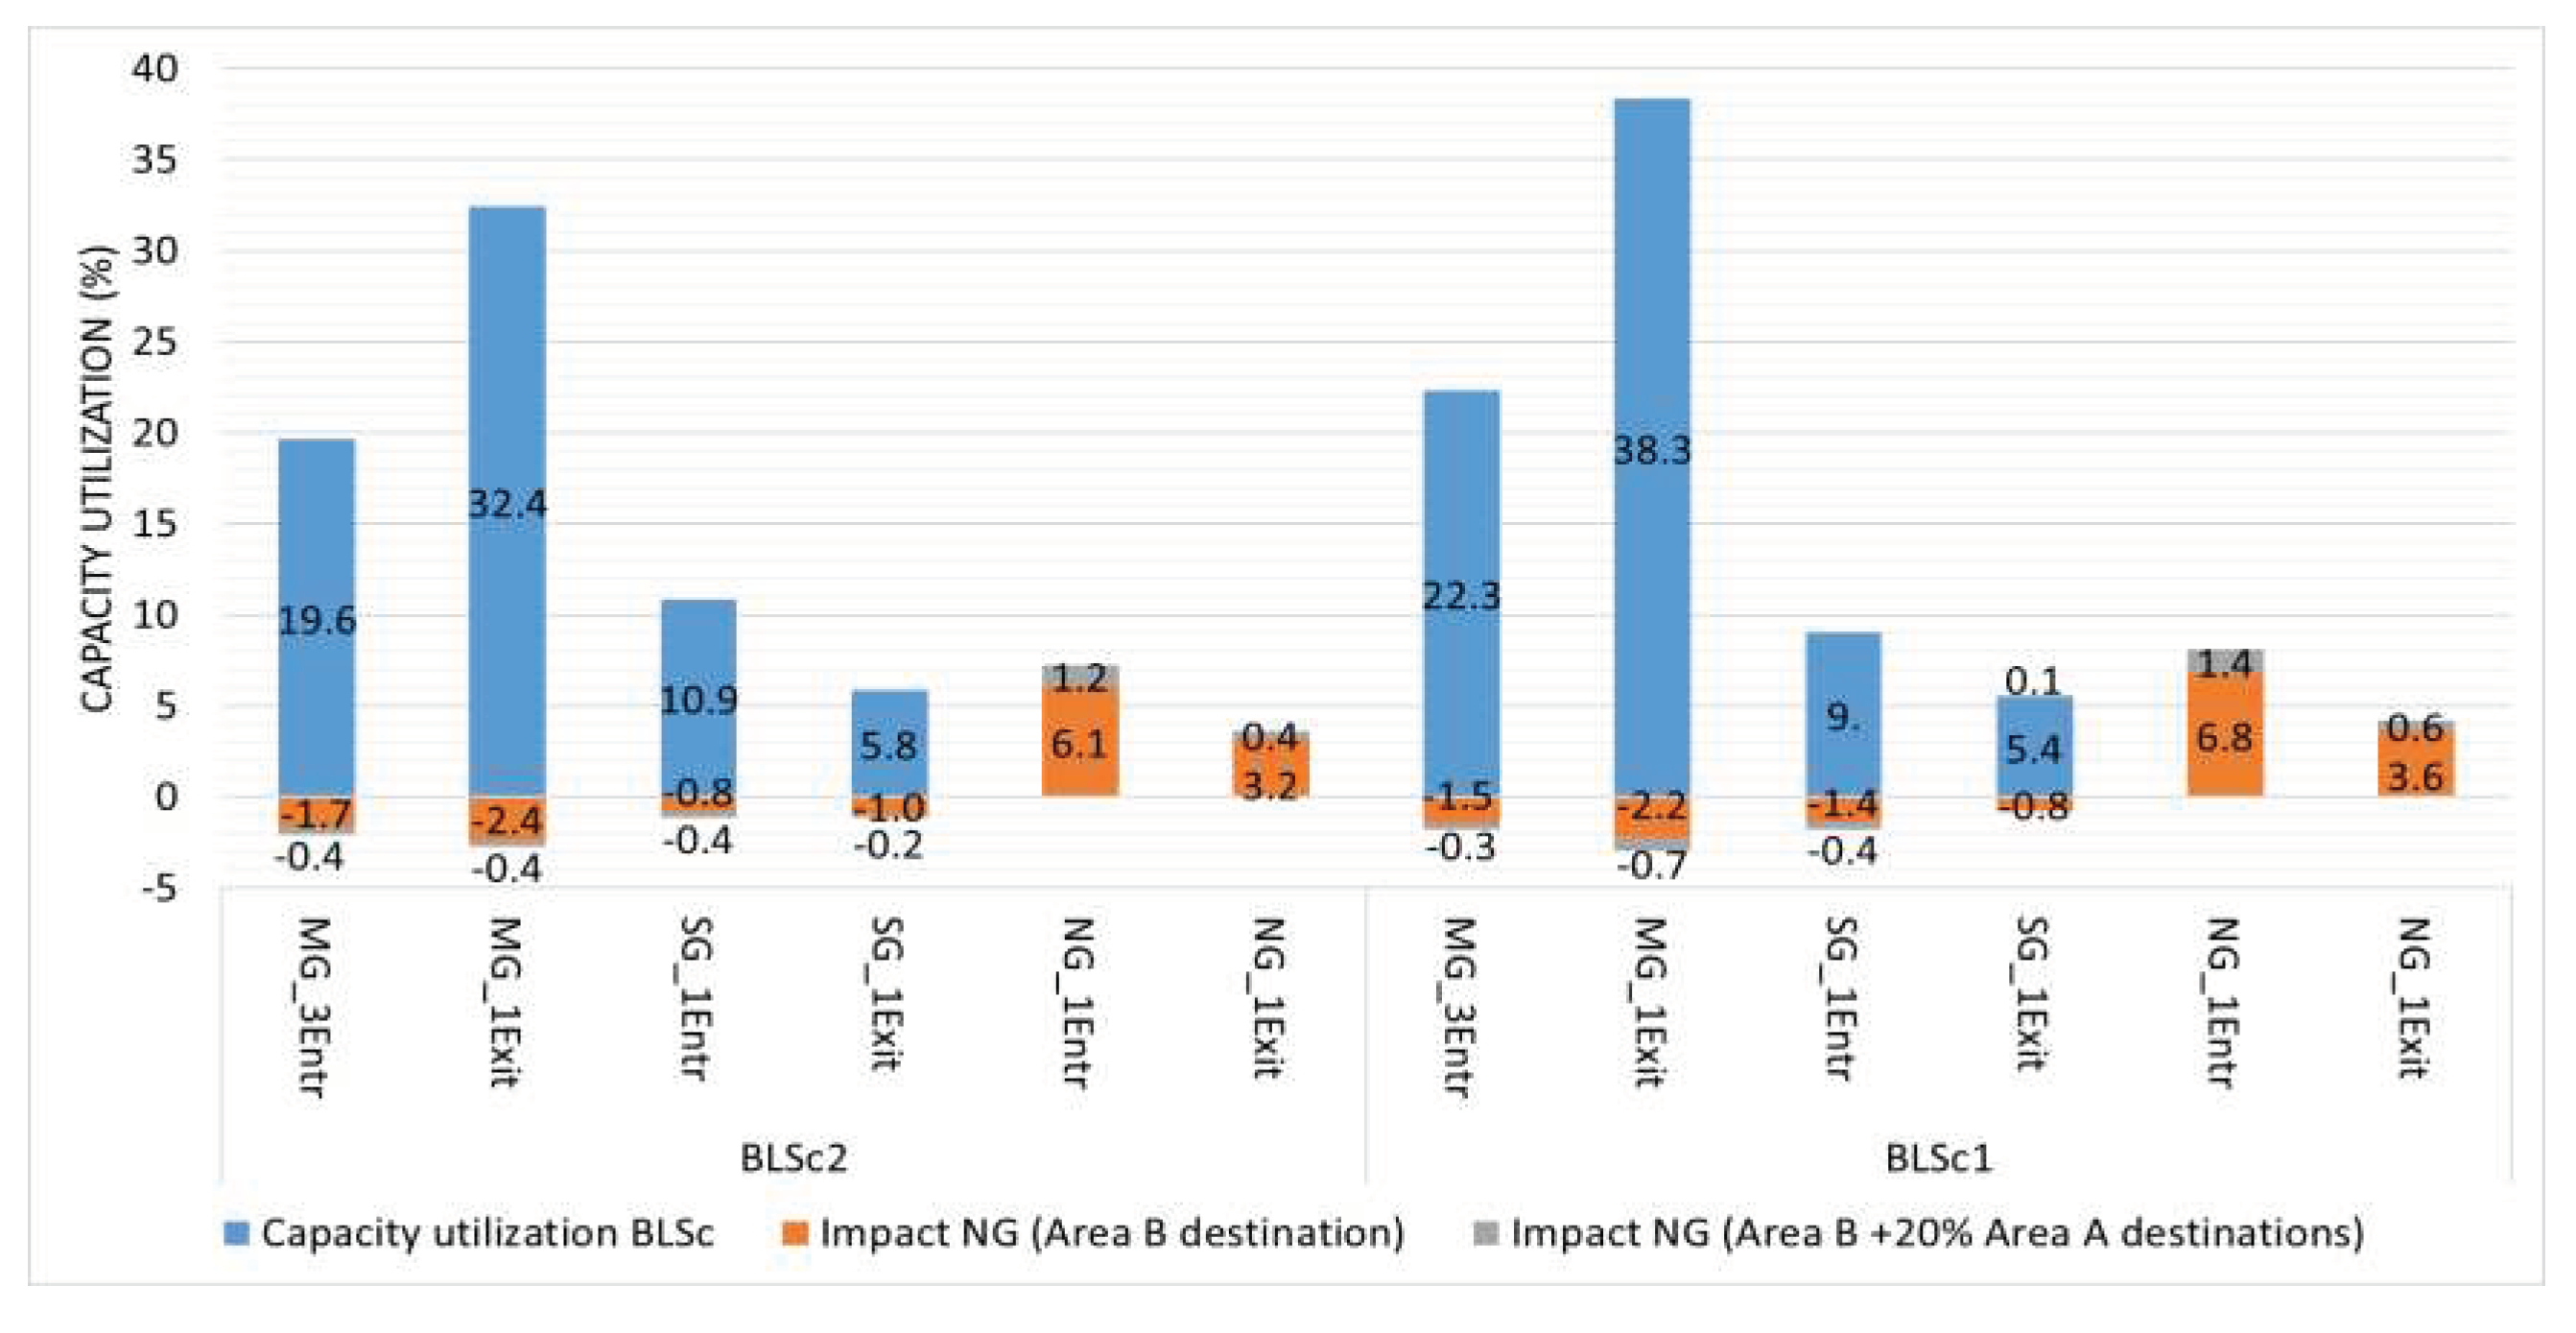
Figure 12.
Average and maximum number of construction trucks waiting for access.
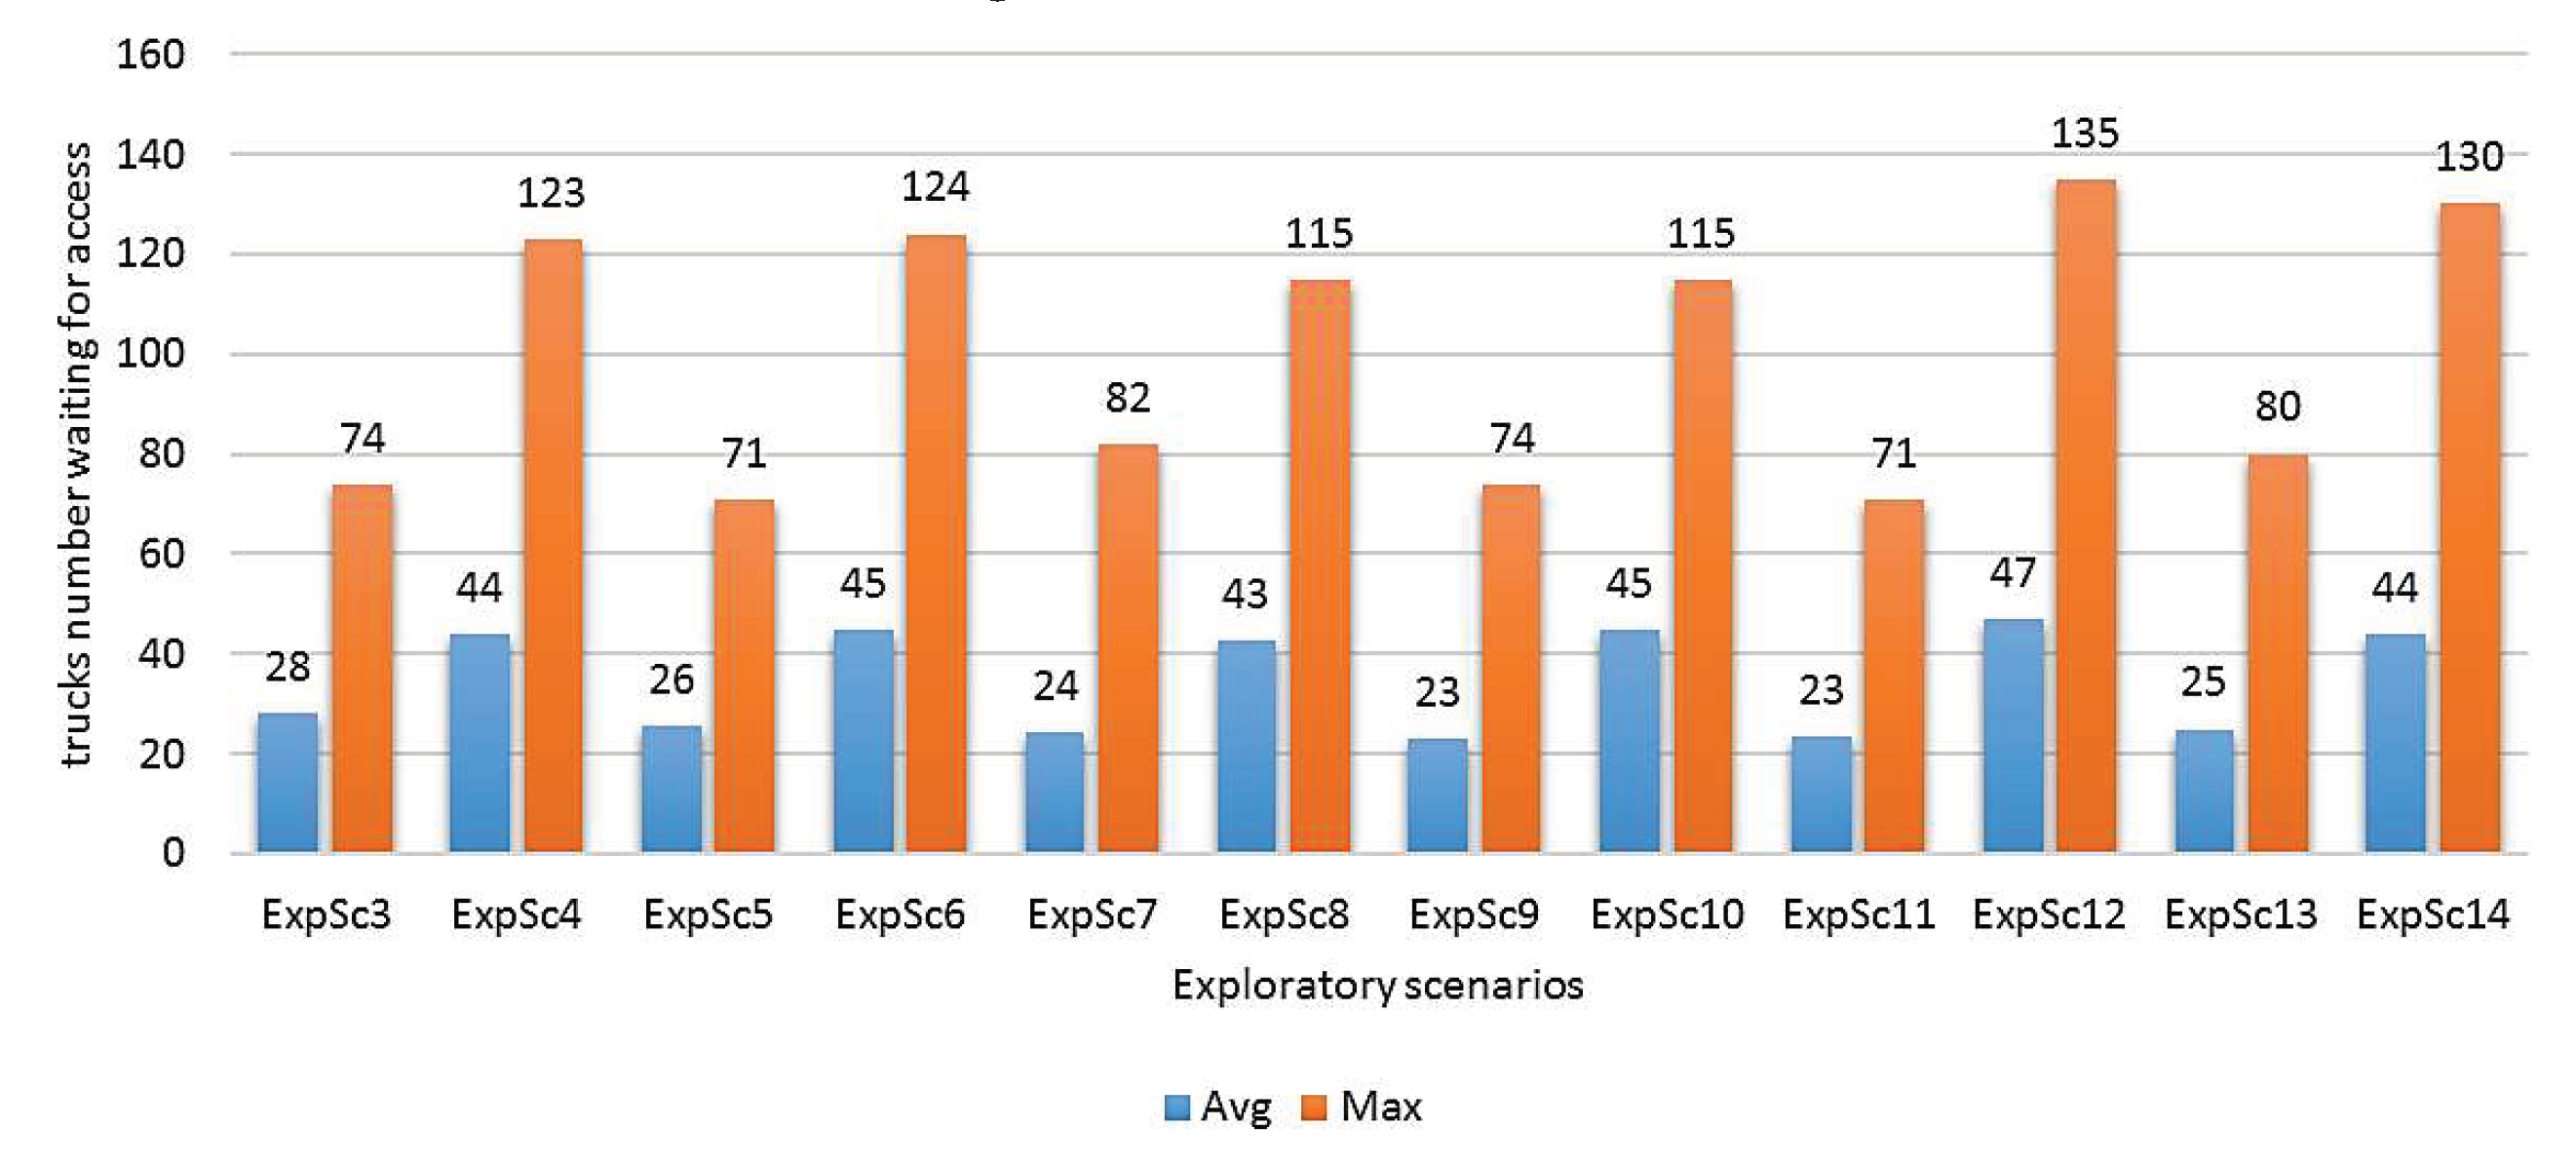
Figure 13.
Scenario with three gates after 11 hours of simulation time.
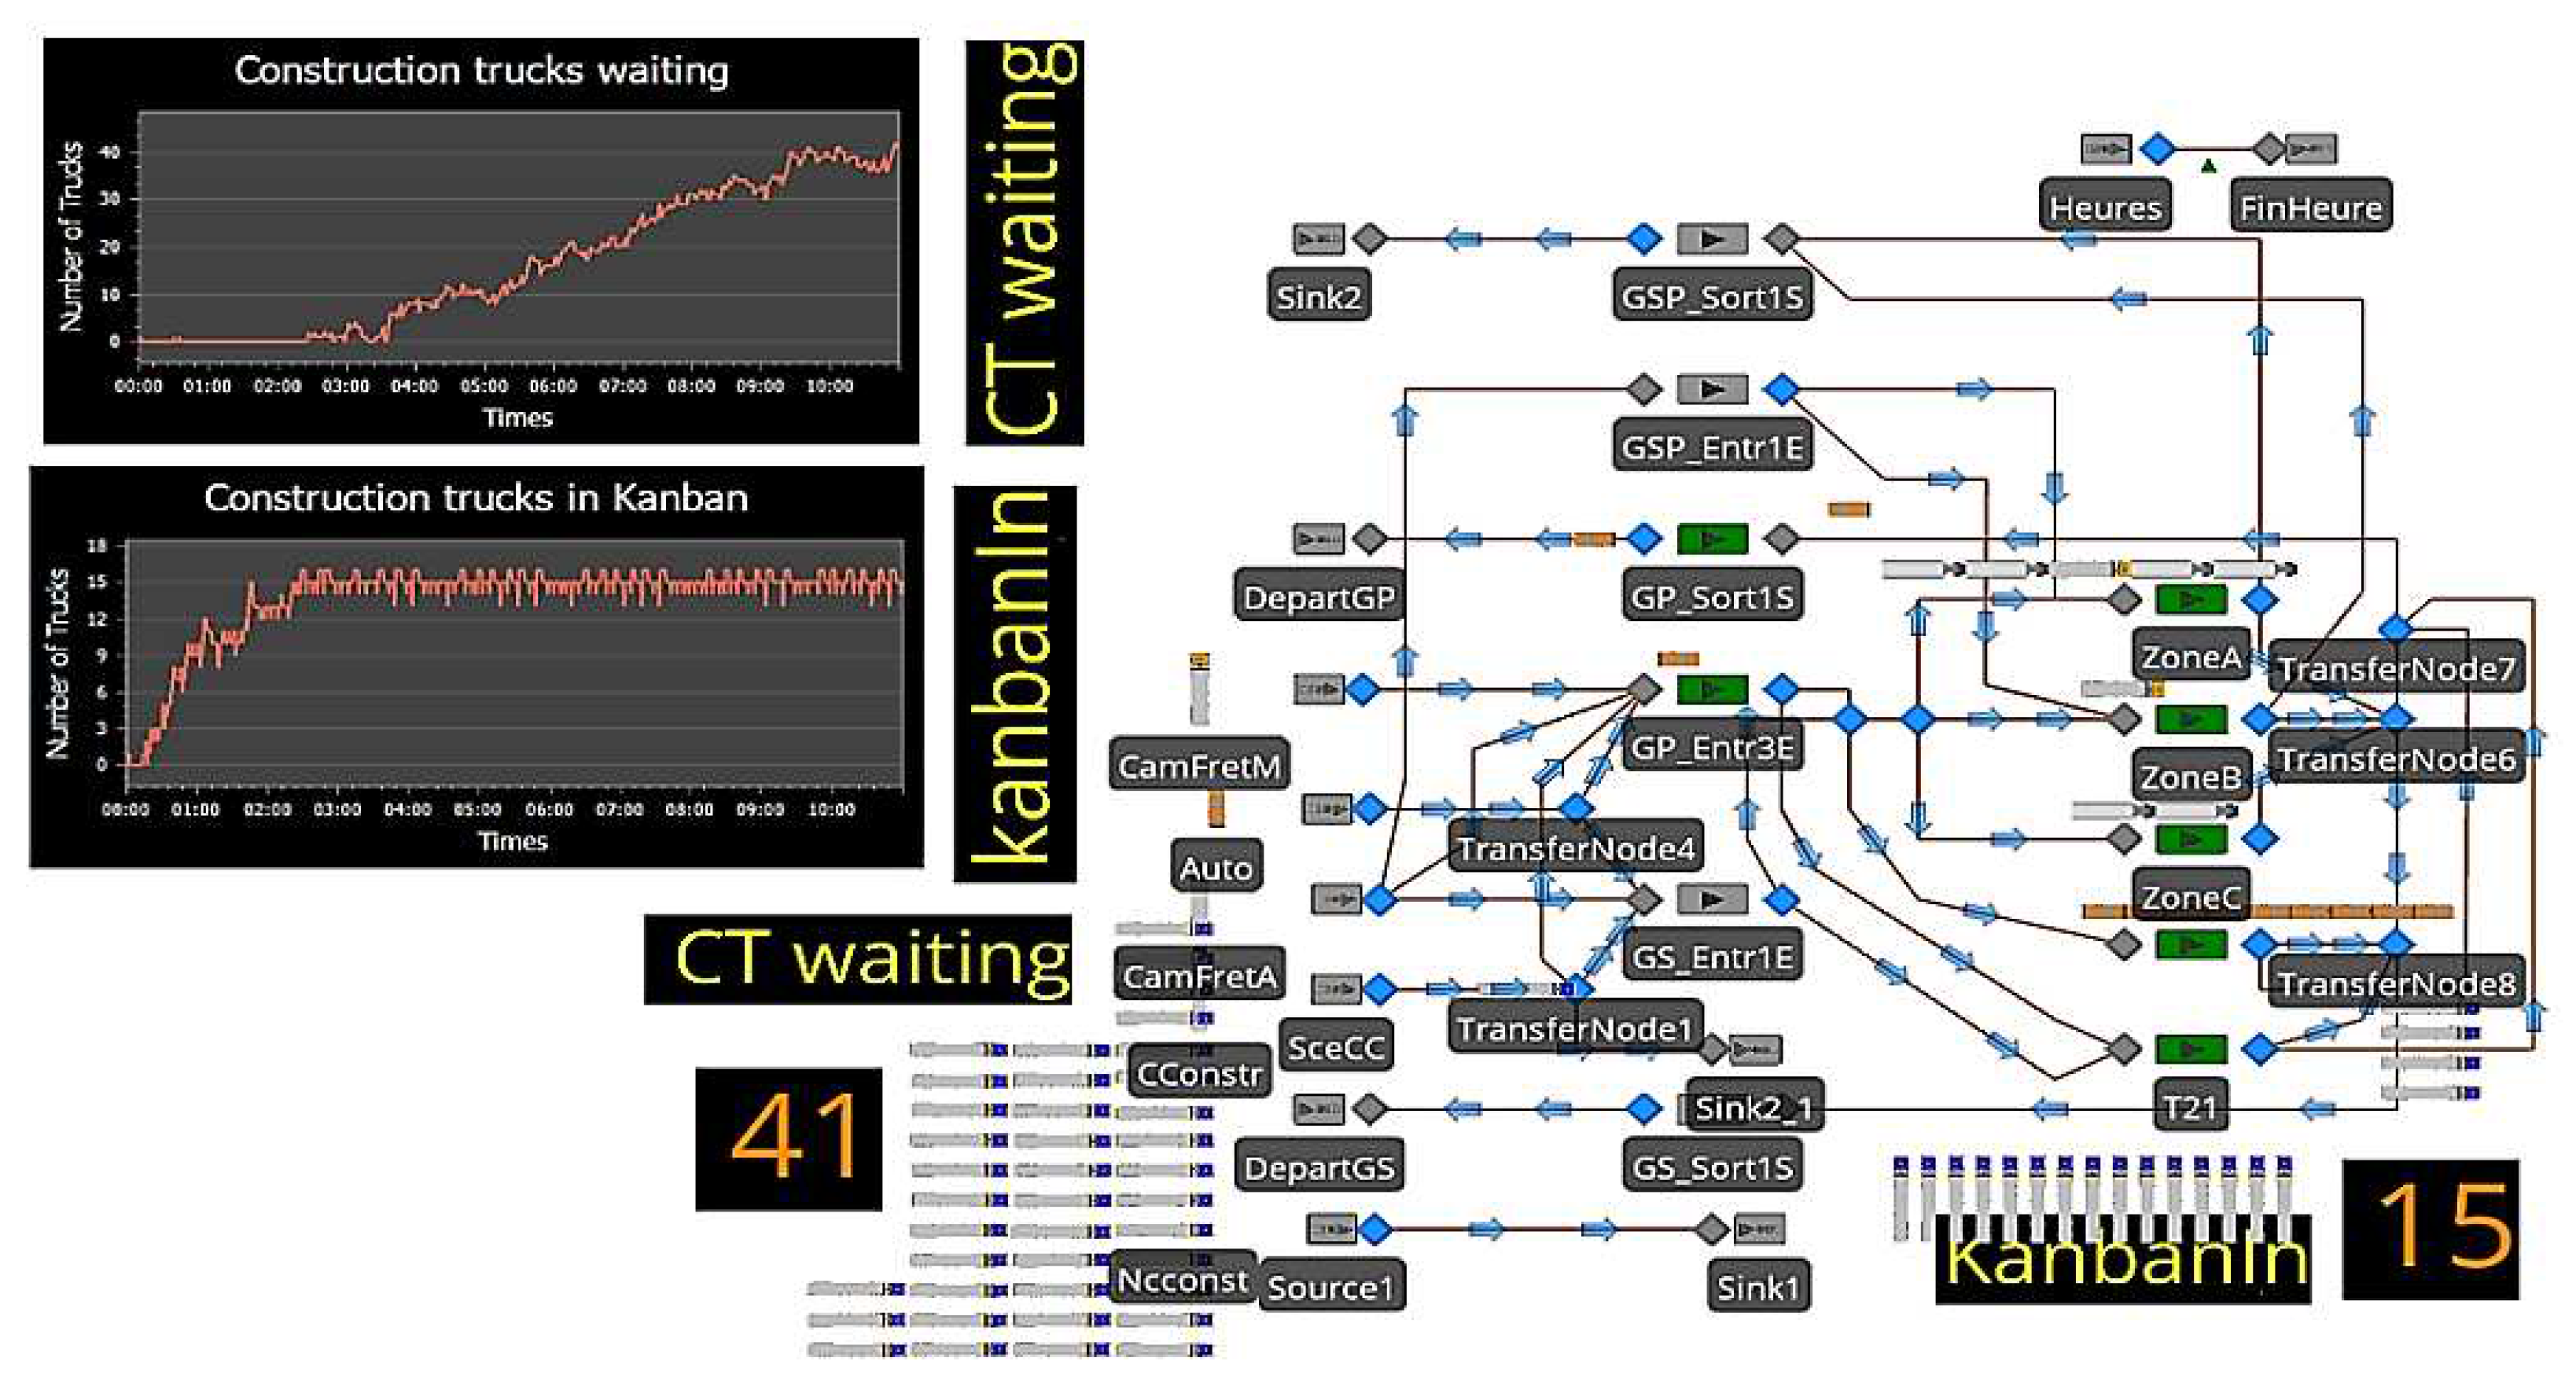
Figure 14.
Balancing the flow between the MG and SG in the two-gate scenarios case and construction trucks in scenario ImpSc2.
Figure 14.
Balancing the flow between the MG and SG in the two-gate scenarios case and construction trucks in scenario ImpSc2.
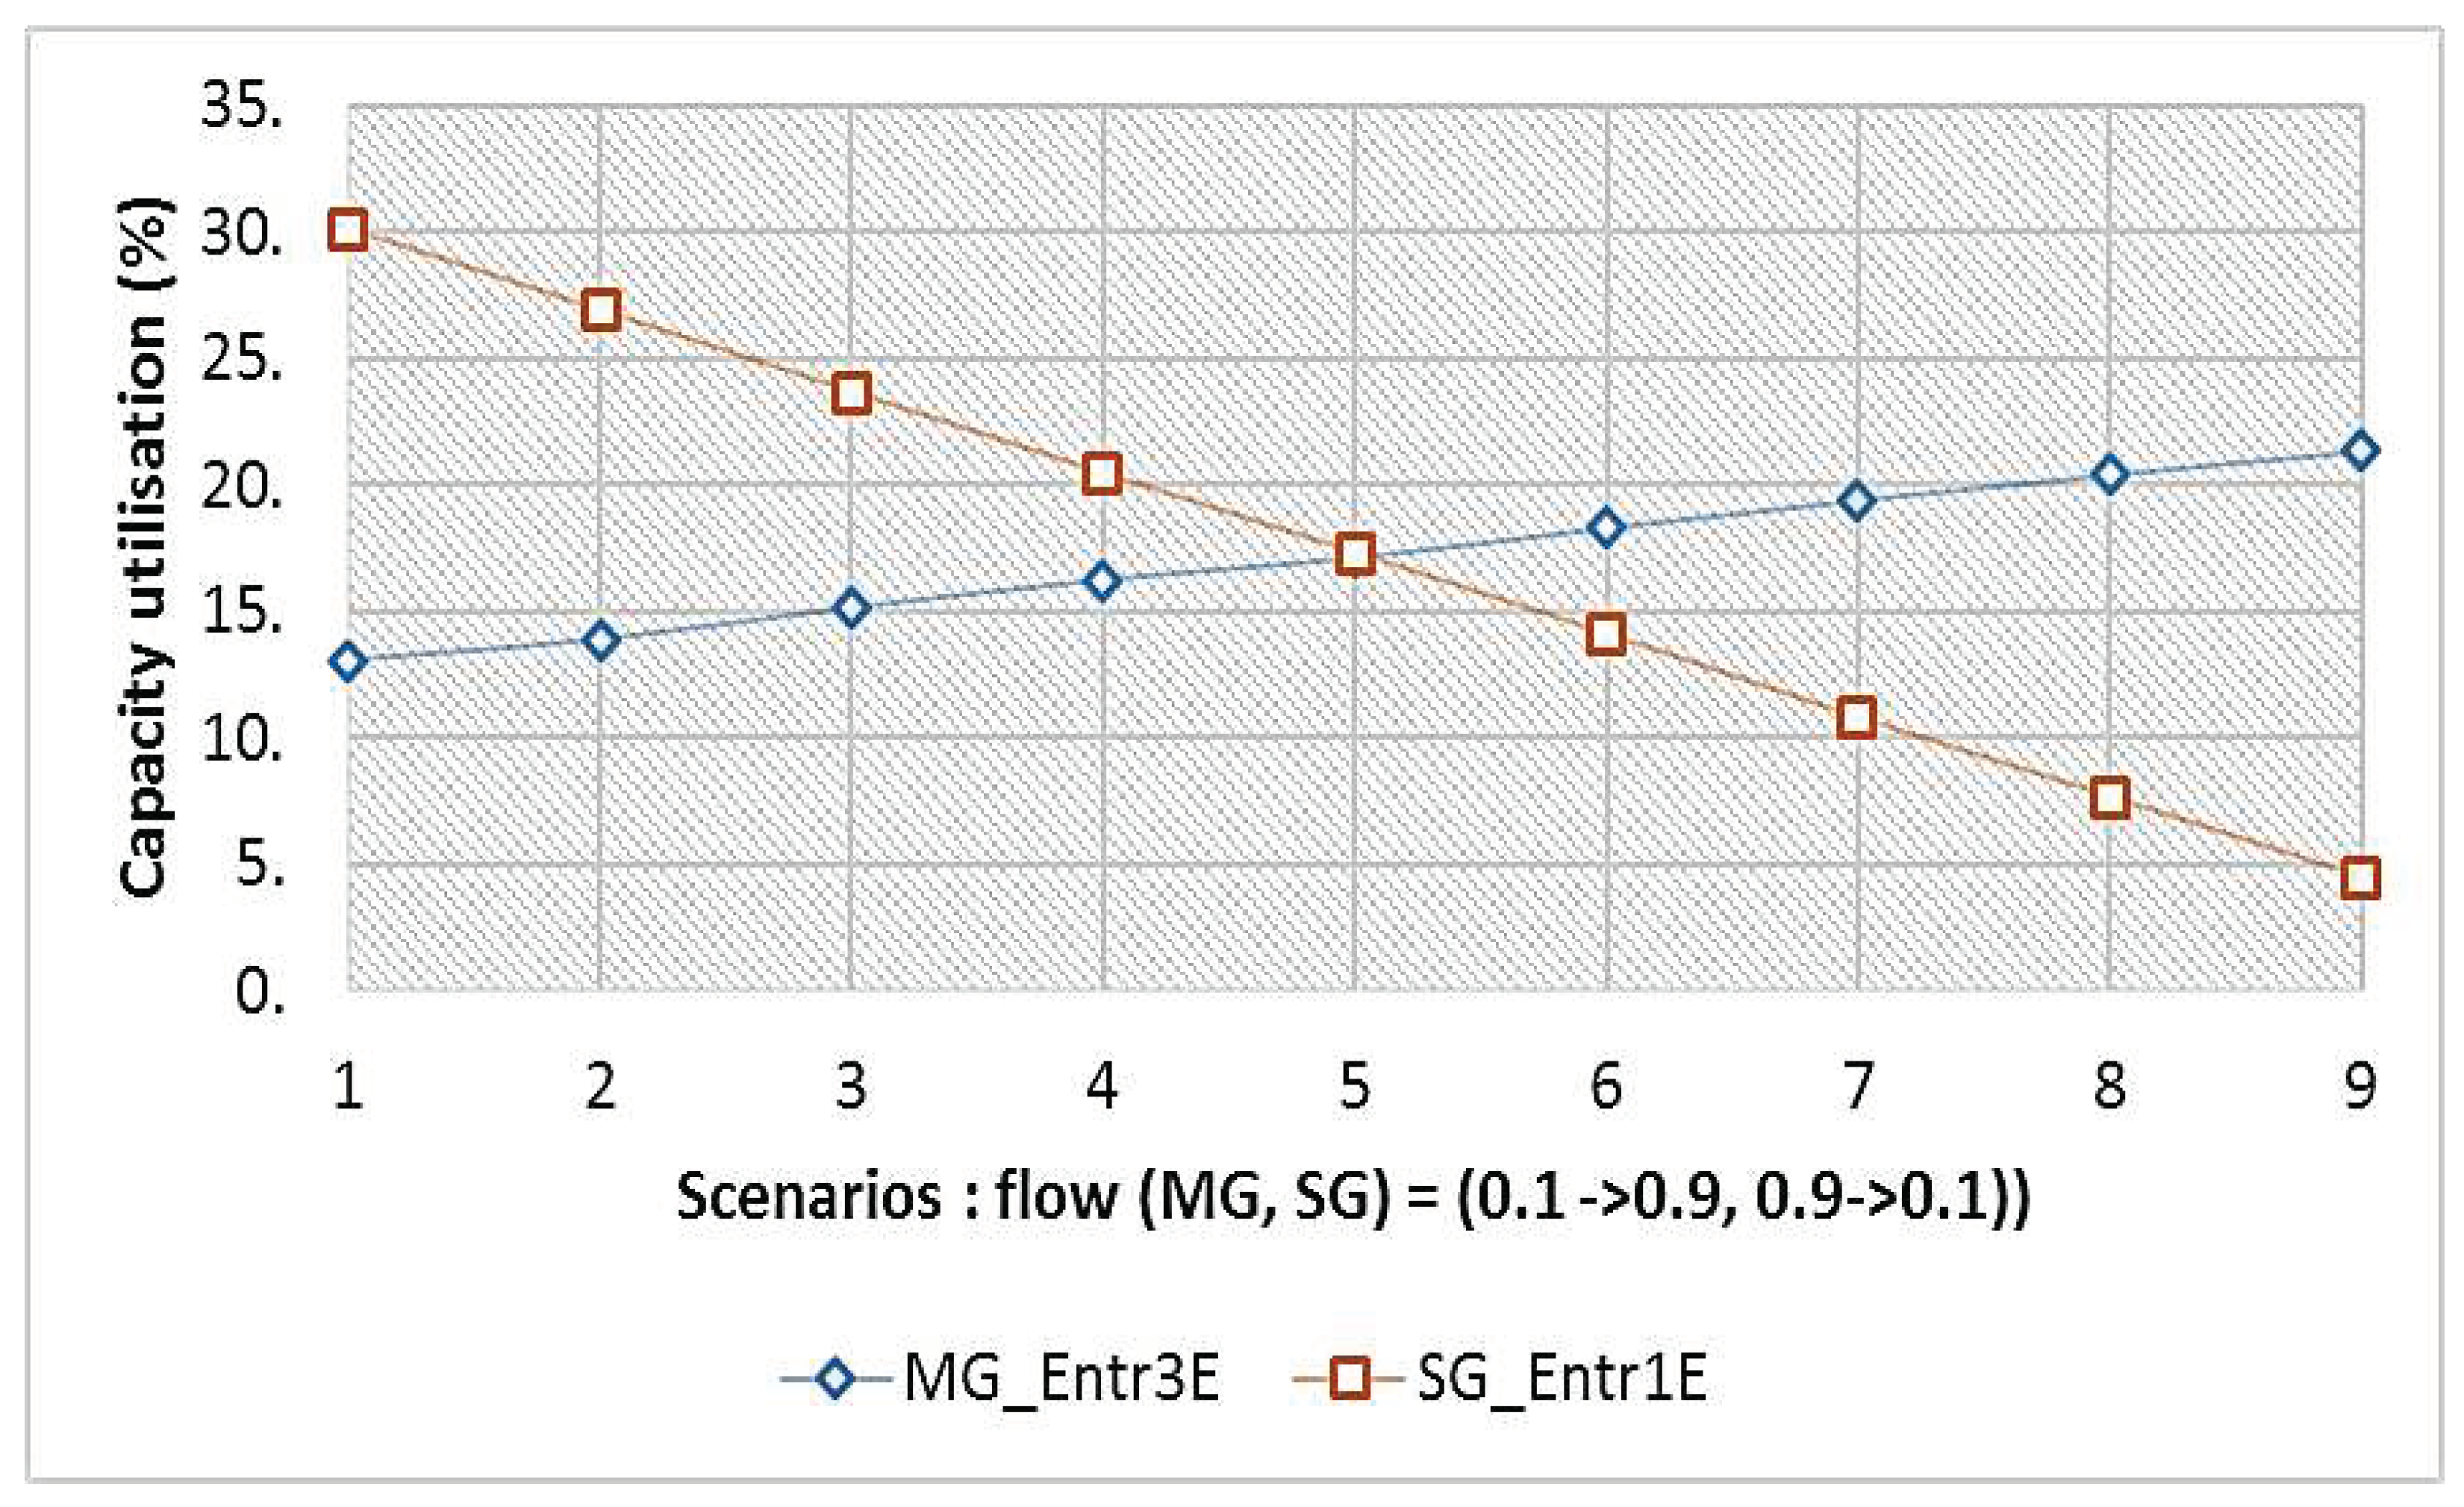
Figure 15.
Comparative analysis of average and maximum construction truck presence on the landside, influenced by varied unloading service duration and concurrent truck unloading numbers.
Figure 15.
Comparative analysis of average and maximum construction truck presence on the landside, influenced by varied unloading service duration and concurrent truck unloading numbers.

Table 1.
Summary of the collected data and its characteristics provided by the industrial partner.
| Data Type | Observations and Attributes | Period |
|---|---|---|
| Vehicles access data | 796,000-records with entry/exit time, vehicle type, destination, freight, subcontractors. | 2015-2020 (Selected period for analysis: 2017-2019) |
| Summarized activity data by area | Tables with areas, load/unload quantities, truck count, and types of freight | |
| Access gates surveillance videos | 96 hours of streaming video from which obtain vehicle service time at a gate | Four days of July 2019 |
| Projected construction parameters | Civil engineering pre-feasibility study with forecast demand in number of construction trucks, unloading duration and number of unloading stations | Construction period |
Table 2.
Summary of the collected data and its characteristics.
| Area | 2017 | 2018 | 2019 | Total | % |
|---|---|---|---|---|---|
| A | 13 511 | 13 493 | 14 918 | 41 922 | 32% |
| B | 13 600 | 17 506 | 15 126 | 46 232 | 36% |
| C | 14 845 | 15 366 | 11 202 | 41 413 | 32% |
| Total trucks | 41 956 | 46 365 | 41 246 | 129 567 | 100% |
| Total cars | 100 219 | 117 963 | 105 488 | Avg : 107 890 | - |
Table 3.
Vehicle entry and exit registration times.
| Vehicle and entry modes | Access registration times distributions | Avg times (seconds) |
|---|---|---|
| Automated truck entry | JohnsonSB(0.16, 0.70, 12.00, 59.27) | 33.65 |
| Manual truck entry | JohnsonSB(1.19, 0.59, 69.20, 390.37) | 133.29 |
| Automated truck exit | Norm(17.444, 5.0472) | 17.42 |
| Manual truck exit | JohnsonSB(1.79, 0.57, 27.76, 243.13) | 50.26 |
| Car entry | JohnsonSB(7.70, 0.94, 4.90, 28610.99) | 18.59 |
| Car exit | JohnsonSB(7.96, 1.21, 4.52, 4975.24) | 14.3 |
Table 4.
Baseline scenario parameters.
| Baseline Scenarios | Nber of Gates | Data | Truck flow MG | Truck flow SG | Reference |
|---|---|---|---|---|---|
| BLSc1_bd | 2 | 2017-2019 | 78% | 22% | Busiest day |
| BLSc2_14bw | 2 | 2017-2019 | 67% | 33% | 14 busiest weeks |
Table 5.
Exploratory Scenarios with Forecast Data and Simultaneous Unloading of Four Trucks.
| Exploratory scenarios | Nber of gates | Unloading time for CT | Reference flow | Impact to be evaluated |
|---|---|---|---|---|
| ExpSc1 | 2 | - | BSc2 | Increase in FT |
| ExpSc2 | - | BSc1 | ||
| ExpSc3 | 15 | BSc2 | Increase in FT and CT | |
| ExpSc4 | 20 | |||
| ExpSc5 | 15 | BSc1 | ||
| ExpSc6 | 20 |
Table 6.
Impact of Adding an Access Gate with One Entrance and One Exit.
| Exploratory scenarios | Nber of gates | Unloading time for construction truck | New gate (truck destination) | Reference flow |
|---|---|---|---|---|
| ExpSc7 | 3 | 15 | Area B | BLSc1_14bw |
| ExpSc8 | 3 | 20 | ||
| ExpSc9 | 3 | 15 | BLSc1_bd | |
| ExpSc10 | 3 | 20 | ||
| ExpSc11 | 3 | 15 | Area B & 20% Area A | BLSc1_14bw |
| ExpSc12 | 3 | 20 | ||
| ExpSc13 | 3 | 15 | BLSc1_bd | |
| ExpSc14 | 3 | 20 |
Table 7.
Scenario improvements using forecasted data for 2024-2025.
| Scenarios | Nbr. gates | Nbr CT unload. simultaneously | Unloading time | New Gate flow |
MG flow |
SG flow |
Nber. Sc |
|---|---|---|---|---|---|---|---|
| ImpSc1 | 2 | 4 | - | - | 0.1-0.9 | 0.9-0.1 | 9 |
| ImpSc2 | 15 | - | |||||
| ImpSc3 | 3 | ZB | |||||
| ImpSc4 | ZB + 20%ZA | ||||||
| ImpSc5 | 2 | 4/5/6 | - | 0.67 | 0.33 | 3 | |
| ImpSc6 | 4/5/6/7/8 | 20 | - | 5 | |||
| ImpSc7 | 5/6/7/8/9 | 25 | - | 5 |
Table 8.
Parameters of the experimented scenarios.
| Batch Sc | Slowdown duration | Slowdown factor | Slowdown freq | Entrance Nber | Outlook Nber of trucks | Nber of scenarios |
| 1 | 10 min | 20% and 30% | 1, 2, 4, 6 | 1 – 2 - 3 | construction period | 24 |
| 2 | 10 min | 40% and 50% | 1, 2, 4, 6 | 1 | construction period | 24 |
| 3 | 10 min | 40% | 6 | 3 | construction period + 20 to 50% | 24 |
Table 9.
Scenarios results.
| Sc | MG capacity |
Delay factor | Delay frequency (h) |
Avg vehicles waiting | Max vehicles waiting | Avg waiting time (min) | Max waiting time (min) | Scheduled utilization (%) | Processing time (%) |
|---|---|---|---|---|---|---|---|---|---|
| Sc1 | 1 | 0.2 | 1 | 1.82 | 32.1 | 1.80 | 15.8 | 57 | 57 |
| Sc2 | 2 | 2.56 | 38.2 | 2.56 | 19.4 | 60 | 60 | ||
| Sc3 | 4 | 2.82 | 39.7 | 2.76 | 23.7 | 61 | 61 | ||
| Sc4 | 6 | 3.40 | 44.5 | 3.35 | 26.8 | 66 | 66 | ||
| Sc5 | 2 | 1 | 0.10 | 9.7 | 0.09 | 3.3 | 29 | 43 | |
| Sc6 | 2 | 0.12 | 8.4 | 0.11 | 3.6 | 30 | 45 | ||
| Sc7 | 4 | 0.11 | 8.3 | 0.11 | 4.3 | 30 | 45 | ||
| Sc8 | 6 | 0.16 | 10.6 | 0.16 | 4.5 | 33 | 48 | ||
| Sc9 | 3 | 1 | 0.01 | 4.3 | 0.01 | 1.1 | 19 | 42 | |
| Sc10 | 2 | 0.01 | 4.2 | 0.01 | 1.2 | 21 | 45 | ||
| Sc11 | 4 | 0.01 | 4.5 | 0.01 | 1.3 | 20 | 44 | ||
| Sc12 | 6 | 0.02 | 4.7 | 0.02 | 1.5 | 22 | 47 | ||
| Sc13 | 1 | 0.3 | 1 | 1.96 | 34.6 | 1.93 | 17.4 | 57 | 57 |
| Sc14 | 2 | 3.44 | 47.5 | 3.39 | 27.9 | 62 | 62 | ||
| Sc15 | 4 | 3.46 | 45.4 | 3.41 | 27.2 | 63 | 63 | ||
| Sc16 | 6 | 4.88 | 50.8 | 4.80 | 30.1 | 71 | 71 | ||
| Sc17 | 2 | 1 | 0.10 | 9.5 | 0.10 | 3.1 | 29 | 43 | |
| Sc18 | 2 | 0.15 | 10.0 | 0.15 | 4.1 | 31 | 45 | ||
| Sc19 | 4 | 0.17 | 11.5 | 0.16 | 5.3 | 32 | 46 | ||
| Sc20 | 6 | 0.18 | 10.6 | 0.18 | 4.9 | 36 | 51 | ||
| Sc21 | 3 | 1 | 0.01 | 4.5 | 0.01 | 1.3 | 19 | 42 | |
| Sc22 | 2 | 0.01 | 4.5 | 0.01 | 1.3 | 21 | 45 | ||
| Sc23 | 4 | 0.02 | 4.5 | 0.02 | 1.4 | 21 | 44 | ||
| Sc24 | 6 | 0.03 | 5.5 | 0.03 | 2.0 | 24 | 49 | ||
| Sc25 | 1 | 0.4 | 1 | 1.61 | 25.0 | 1.59 | 13.4 | 58 | 58 |
| Sc26 | 2 | 4.15 | 47.1 | 4.10 | 32.6 | 64 | 64 | ||
| Sc27 | 4 | 4.38 | 47.5 | 4.36 | 32.7 | 64 | 64 | ||
| Sc28 | 6 | 7.99 | 57.0 | 7.83 | 41.7 | 76 | 76 | ||
| Sc29 | 3 (*) | 0.4 | 6 | 0.05 | 7.6 | 0.04 | 2.3 | 27 | 54 |
| Sc30 | 6 | 0.07 | 8.3 | 0.06 | 3.0 | 29 | 56 | ||
| Sc31 | 6 | 0.06 | 7.4 | 0.05 | 2.8 | 30 | 58 | ||
| Sc32 | 6 | 0.06 | 6.8 | 0.05 | 2.7 | 31 | 59 | ||
| Sc33 | 1 | 0.5 | 1 | 1.82 | 29.9 | 1.80 | 16.6 | 58 | 58 |
| Sc34 | 2 | 6.26 | 58.4 | 6.08 | 45.2 | 67 | 67 | ||
| Sc35 | 4 | 6.34 | 58.6 | 6.26 | 47.0 | 67 | 67 | ||
| Sc36 | 6 | 11.53 | 70.2 | 11.42 | 51.1 | 81 | 81 | ||
| (*) | Increase in the number of trucks by 20%, 30%, 40% and 50% successively for scenarios 29 to 32 | ||||||||
Disclaimer/Publisher’s Note: The statements, opinions and data contained in all publications are solely those of the individual author(s) and contributor(s) and not of MDPI and/or the editor(s). MDPI and/or the editor(s) disclaim responsibility for any injury to people or property resulting from any ideas, methods, instructions or products referred to in the content. |
© 2023 by the authors. Licensee MDPI, Basel, Switzerland. This article is an open access article distributed under the terms and conditions of the Creative Commons Attribution (CC BY) license (http://creativecommons.org/licenses/by/4.0/).
Copyright: This open access article is published under a Creative Commons CC BY 4.0 license, which permit the free download, distribution, and reuse, provided that the author and preprint are cited in any reuse.


