
Submitted:
19 May 2023
Posted:
19 May 2023
You are already at the latest version
Abstract
The aim of innovations in road safety is to contribute to better protection of road users and to minimize damage to their property. The main objective of the article is to identify disparities in the perception of an innovation element in road safety by road users based on their type of employment and the number of kilometers driven per year. The research will evaluate the attitudes of selected groups of road users based on the number of kilometers driven in a calendar year and whether driving a motor vehicle is their main job duty. The analysis involved 239 respondents using a paper questionnaire. Disparities in the perception of innovations in road safety were evaluated using contingency tables, chi-square tests, non-parametric tests, and Cramer's V. Road users feel much safer with a front braking light when crossing traffic of vehicles and pedestrians (71%); at pedestrian crossings (74%); when turning left (63.4%); as well as when crossing traffic of multiple vehicles (62.5%). Disparities among respondents based on the type of employment of the road user were not confirmed. Conversely, road users with a higher number of kilometers driven per year have a more positive perception of the innovation element at pedestrian crossings.
Keywords:
innovations
; safety
; front braking light
; disparities
; road transport
MSC: 05B10
1. Introduction
The road transport includes the movement of people, goods, and vehicles on roads. This type of transport involves various means of transport, such as cars, trucks, buses, motorcycles, and bicycles, which travel on public roads, highways, and streets [1]. Road transport is an important part of modern transport infrastructure, which enables the movement of people and goods to different places [2]. This type of transport is often used for short and medium distances and is usually more flexible, cheaper, and more accessible than other modes of transport, such as air or sea transport [3,4]. The problem with road transport is its lower safety compared to other modes of transport [5,6]. Traffic accidents related to road transport are a serious social problem for every country [7]. Traffic accidents are associated with uncertainty and unpredictability [8]. These accidents are based on many causes that depend on various variables, such as a lack of information on the part of pedestrians, a lack of information on the part of drivers, speed not adapted to road conditions, and so on [9,10].
Reducing the number of traffic accidents and increasing road safety is the goal not only of the European Union but of all other states. According to statistical data from the World Health Organization, approximately 1.35 million people die on the roads each year, which means more than 3,700 deaths per day [11]. Road safety has been internationally recognized as a primary strategic goal in many countries [12,13]. Increasing road safety is an important political and social goal. For this reason, significant attention has been paid to innovations in road safety in recent times, which are key to improving road safety. Research is being conducted in the area of innovations in the form of autonomous vehicles [14], the implementation of intelligent transport systems [15], or electric safety systems [16].
Reducing uncertainty for road users is only possible through collaboration between various organizations and institutions, such as law enforcement agencies, transportation companies, and companies involved in technological innovations.
The novelty of our research is focused on increasing road safety by reducing uncertainty for all road users through the installation of a front brake light. Pedestrians, cyclists, and other drivers will gain information about the braking of the vehicle even when looking at the front of the vehicle.
The subject of evaluation will be the following scientific questions (RQs):
RQ1: Do participants in road traffic who have a primary job role involving driving motor vehicles perceive the safety innovation (front brake light) more positively compared to participants who do not have a primary job role involving driving motor vehicles?
RQ2: Do participants in road traffic who have driven more than 60,000 km in a motor vehicle perceive the safety innovation (front brake light) more positively compared to participants who drive less than 60,000 km per calendar year?
The structure of the article is as follows. The introduction highlights the originality and uniqueness of the conducted quantitative research and formulates the research questions. The theoretical part of the article reflects the most important aspects and factors of the innovative element in road traffic; road safety; positive economic consequences and impacts of using the innovative element; and socio-social interaction on population safety. The next part of the article defines the goal; research methodology; variable definition; formulation of statistical hypotheses; presentation and justification of selected statistical methods; and structure of the selected sample of respondents. The following section presents empirical results, evaluates and verifies statistical hypotheses. The discussion summarizes the most significant findings of the research. Subsequently, practical consequences of the proposed innovative element in transportation were formulated. In conclusion, further phases of the conducted research were outlined, and the limits of the conducted case study were established.
2. Theoretical background
Increasing road safety is a significant goal not only for the European Union but also from a global perspective [17,18]. Several studies have pointed out various factors that cause traffic accidents and fatalities e.g., [19]. Research has identified the following factors, apart from driver uncertainty, that contribute to accidents: environmental conditions, the state of infrastructure, and technical vehicle causes [20]. Also, fatigue [21], alcohol [22], emotional state, drowsiness, headaches [23], respiratory illnesses and fever [24,25] are causes that increase the likelihood of a traffic accident. Driving under the influence of alcohol is one of the most common causes that eventually leads to risky driver behavior [26,27,28]. According to Alonso et al. [29], significant personality factors, such as age, experience, fatigue, and health, also significantly affect road safety. Walton et al. [30] addressed research on policies concerning age restrictions and minimum age requirements for driver’s licenses.
Research results have shown that the accident rate of young drivers is a significant problem in road traffic. Young drivers (aged 18-24) are much more prone to involvement in traffic accidents than other drivers [31]. The main causes of young driver accidents are incorrect risk behavior, lack of experience, and inattention [32,33,34]. Risky behavior includes, for example, speeding, driving under the influence of alcohol, failure to follow safety rules, and a significant increase in the risk of accidents. Because young drivers are in the early stages of their driving licenses, they typically have less experience in driving vehicles in various situations on the roads [35].
Additional studies also show that fatigue increases the risk of traffic accidents and reduces the ability to control a vehicle, which can lead to serious consequences [36]. Drivers affected by fatigue are more likely to make mistakes while driving, such as driving at inappropriate speeds, crossing lines, frequent braking, or poor reaction to traffic [37].
The impact of fatigue on drivers also increases the risk of health problems, such as obstructive sleep apnea, which can lead to daytime sleepiness and poor quality of sleep at night [38]. Obstructive sleep apnea occurs in 15 to 30% of the population, with 80% of cases remaining undetected and untreated [39]. Many drivers with obstructive sleep apnea are unaware that they have this disorder and assume that their sleepiness is due to a lack of sleep [40].
According to statistical data from the World Health Organization, approximately 1.35 million people die in road traffic accidents every year, which means more than 3,700 deaths per day [11]. Over the past 15 years, there has been a significant increase in the number of fatalities, as around 3,000 people died on the world’s roads each day in 2007 [41]. These traffic accidents result in global economic losses estimated at the cost of damage to road traffic amounting to $518 billion annually [11].
A very common cause of traffic accidents is a lack of information for traffic participants. Studies show that inadequate information can lead to incorrect decision-making and worsen drivers’ ability to predict and respond to risky situations on the road [42,43]. The proposed innovation in this research aims to reduce the lack of information for traffic participants. Innovations currently being implemented in road transport to reduce accidents can be divided into several groups. In the long-term horizon, autonomous vehicles can be mentioned as an innovation. These vehicles are designed to be capable of driving without human intervention [44]. As a result, they can eliminate some human factors that cause accidents, such as fatigue, alcohol, or insufficient attention [45]. Another possibility for innovation that can be introduced into practice in the shorter term is intelligent transport systems. These systems use information technology to monitor and manage road traffic [15]. They can, for example, monitor traffic, traffic signs, and traffic lights, thus improving traffic flow and safety on the roads [46].
Another option is electronic vehicle safety systems, which include various technologies such as camera systems, radar sensors, and vehicle tracking. Systems such as automatic brakes or lane departure warning systems help improve safety and prevent accidents [16]. Increasing road safety can also be achieved through safer infrastructure by integrating new technologies into traffic signs or traffic lights at intersections [47]. Innovation in education also has a significant impact on road safety [48]. New technologies also allow for better education on road safety. Interactive applications, virtual environments, or driving simulators can help with driver training and improve their reaction skills and safety on the roads. Innovations that reduce the uncertainty of road users are also very important, as several authors have noted.
Wu and Lu [49] deal with uncertainty in road traffic and its impact on risk perception and safety of road users. The authors state that there are various factors that can cause uncertainty, such as bad weather, unpredictable behavior of other road users, technical problems with vehicles, and so on. Cordellieri et al. [50] examine differences in risk perception and behavior of drivers and road users depending on gender. The authors state that women tend to perceive risks in road traffic more intensely than men and also have a lower risk tolerance. Mühl et al. [51] propose an integrated approach to reducing uncertainty in road traffic.
The innovation of the front brake light provides other road users with information about the braking of the vehicle. The front brake light is technically a green light [52] located at the front of the vehicle (Figure 1).
The innovation of the front brake light provides other road users with information about the braking of the vehicle. The front brake light is technically a green light [52] located at the front of the vehicle (Figure 1). The choice of green color is due to the fact that there are certain colors of light that cannot be used, such as red light for the rear brake light, blue light for indicating priority of passage, and orange light for indicating the direction of travel of the vehicle. The green color of the front brake light also has significance in terms of the information it conveys. It indicates that the vehicle is braking, which reduces the stress of other road users who may not have information about whether a vehicle that does not have the right of way is braking.
3. Aim, methodology and data
The main goal of the article is to identify disparities in the perception of an innovative safety feature among road users, based on their type of employment and the number of kilometers driven per year.
3.1. Data collection
The questionnaire was created in collaboration between the University of Žilina and the Institute for Legal and Traffic Psychology in Bonn, which conducted a pre-study on the front brake light in a non-public space at Berlin Tegel Airport. Further information on the results of this study can be found in Monzel et al. [52]. In 2023, the University of Žilina continues the research in real traffic in the Žilina and Trenčín regions of Slovakia. In addition to the scientific researchers from the University of Žilina and the Institute for Legal and Traffic Psychology, practitioners also contributed to the questionnaire development, including transport companies operating bus services in both regions, as well as experts from a company operating freight transport in the Trenčín region. The preparatory phase for the questionnaire processing lasted from September 2022 to November 2022.
The aim of the survey was to determine drivers’ opinions on front brake lights before their installation on vehicles. The goal was to obtain data on which sources of information were best conveyed to drivers about the front brake light. Another goal of the survey was to obtain drivers’ opinions on the impact of the front brake light on road safety before its installation on vehicles. The survey was processed in paper form and each driver was personally approached and filled out the questionnaire themselves. All completed questionnaires are archived at the University of Žilina. The research on the front brake light was conducted on a voluntary basis for carriers who applied based on a media call made during September and October 2022. Based on the total number of 3000 registered vehicles, drivers who applied earlier were selected in order to evenly address drivers of heavy vehicles, buses, and personal vehicles. Despite the fact that drivers filled out the questionnaire in paper form under the supervision of an interviewer, out of the total number of 312 submitted questionnaires, only 239 were fully completed.
3.2. Questionnaire and variables
In the survey, we did not investigate the reasons why the questionnaire was not fully completed. However, the most common reason was skipping some questions, which can be attributed to inattention during the completion of the questionnaire. The comprehensibility of the questionnaire questions was tested on doctoral students at the University of Žilina and professional drivers from the University of Žilina. Based on feedback, the questions were reformulated to be more understandable. Since all the drivers who participated in the survey were drivers of Slovak transport companies, the questionnaire was distributed only in the Slovak language. However, there is also an English version of the questionnaire that was reviewed by the Bonn Institute of Psychology. The questionnaire contained closed questions except for filtering questions in which drivers answered how long they have held a driver’s license and how long they have been working as drivers. To prevent automatic computer filling of the questionnaire, it was used only in paper form. For checking the consistency of respondent attitudes, the questionnaire also included control questions.
The respondent had time to fill in the questionnaire according to their own needs. In larger companies, several drivers were instructed together on how to fill in the questionnaire, and then the drivers filled it out themselves. In companies with a small number of drivers, interviewers visited drivers individually, instructed them on how to fill in the questionnaire, and then the drivers filled it out without assistance. The time to complete the questionnaire was not recorded, and each respondent handed it in when the driver determined that they had answered all the questions.
The questionnaire contained the following statements aimed at assessing the respondents’ attitudes towards the front brake light: V0: Have you ever heard of the front brake light?
V1: When the brake pedal is pressed, the front brake light illuminates so that other road users can see from the front if the vehicle is braking. Please state your opinion on what impact the front brake light will have on the following traffic situations: V1_1: When crossing traffic of vehicles and pedestrians; V1_2: When crossing traffic of multiple vehicles; V1_3: When overtaking; V1_4: At pedestrian crossings; V1_5: When turning left; V1_6: When changing lanes on the highway; V1_7: When braking in queues.
Respondents had to answer the above statements (V1_1; ..., V1_7) by selecting one of 5 options (Likert scale): 1—much more dangerous; ...; 5—much safer.
3.3. Statistical methods
The following hypotheses were formulated to evaluate the main goal of the article:
H1: There are statistically significant differences in attitudes between selected groups of respondents based on the type of employment contract of the respondent towards selected traffic situations (V1_1, ..., V1_7) with the implementation of an innovative element (front brake light) in road traffic.
H2: There are statistically significant differences in attitudes among selected groups of respondents according to the number of kilometers driven on selected traffic situations (V1_1, ..., V1_7) with the implementation of an innovative element (front brake light) in road traffic.
The following statistical methods are applied to evaluate the formulated statistical hypotheses: Pearson’s chi-square test, Z-score, Cramer’s V, and non-parametric Mann-Whitney test.
The Pearson chi-square test is used to determine statistically significant differences between two or more selection groups. Prior to this, it is necessary to calculate the characteristics of descriptive statistics (descriptive characteristics—absolute and relative frequency). Their contribution lies in a) presenting the basic structure of respondents’ answers to selected statements; b) their subsequent use in applying tests. To determine the descriptive statistics of selected statements according to the selected criteria (number of kilometers driven and type of employment contract of the respondent), the method of simple sorting was used—sorting according to two statistical characters. The results are summarized in clear contingency tables (e.g., see Table 2).
The formula for calculating the test statistic (TS) for Chi-square test is found in several scientific, professional, and educational publications [53,54]. Before calculating the TS for Chi-square, it is necessary to compute the expected (theoretical) frequencies. A prerequisite for applying Chi-square is that all respondent groups meet the minimum required expected frequency of 5 [55]. The critical region of testing is determined based on the test’s significance level and degrees of freedom. The significance level (α) is set at 0.05 (5%). The degrees of freedom (v) are determined as the product of (r-1) and (s-1), where (r-1) is the number of levels of the first statistical characteristic minus one, and (s-1) is the number of levels of the second statistical characteristic minus one [56]. When applying Chi-square, the degrees of freedom were determined to be v = 2. If the calculated value of the test statistic is lower than the critical region of testing, then the null hypothesis cannot be rejected [57]. Chi-square was used to determine whether there are statistically significant differences in attitudes among respondents to selected statements based on the chosen criterion. The statistical method is suitable for scaling the attitudes of the selected sample of respondents [58]. The power of the test [54,59] depends on the appropriate distribution of actual and expected frequencies.
The size of the relationship between selected statements and the period of data collection (or country of data collection) was calculated using Cramer’s V, given the data. The categories of Cramer’s V and their interpretations are described by several authors [60]. The criteria for applying the selected mathematical and statistical methods are: i) random sampling of the sample; ii) a sufficiently robust number of respondents in the selected groups. These assumptions were accepted. All calculations were performed using IBM SPSS Statistics ver 28 statistical software.
3.4. Structure of respondents
Structure of the selected sample of respondents (n = 239) according to the following characteristics: gender of the respondent—male: 213 (89.1%); female: 26 (10.9%); age of the respondent—less than or equal to 40 years: 64 (26.7%); from 41 to 50 years: 63 (26.4%); from 51 to 60 years: 80 (33.5%) and over 60 years: 32 (13.4%); type of employment contract—professional driver (main employment in transport): 156 (65.3%); occasional driver (without employment in transport)—83 (34.7%); number of kilometers driven per year—less than 10,000 km: 38 (15.9%); from 10,001 to 30,000 km: 78 (32.6%); 30,001–60,000 km: 47 (19.7%); 60,001 km–100,000 km: 29 (12.1%); more than 100,000 km: 47 (19.7%); source of information about the front brake light: company, colleagues, work supervisor—126 (52.7%); media—TV, internet, radio, etc.—113 (47.3%); respondent’s attitude towards complete information about the front brake light—yes: 173 (72.4%); no: 43 (18.0%); I don’t know: 23 (9.6%).
4. Research empirical results
Out of the total number of 239 (100%) respondents, 216 (90.37%) respondents already know (or have experience with) the front brake light, and 23 (9.63%) respondents do not know and have not heard of the innovative novelty—front brake light.
The aim of the statistical analysis is to analyze the attitudes of respondents who already have experience with the front brake light (n = 216). Out of the mentioned number of respondents, 173 (80.1%) stated that they are well informed about the front brake light, and 43 (19.1%) respondents stated that they need further information about the front brake light.
The following tables (see Table 1, Table 2, Table 3, Table 4, Table 5, Table 6 and Table 7) evaluate selected traffic situations (V1_1, ..., V1_7) with the implementation of the innovative element (front brake light) in road traffic according to the following characteristics: type of employment (main employment—138 (63.9%); no employment—78 (36.1%)) and the number of kilometers driven (up to 60,000 km—152 (70.4%); more than 60,000 km—64 (29.6%)).
The structure of respondents’ perception of the innovative element in road transport in the case of crossing vehicle and pedestrian traffic is as follows: (1+2)—27 (12.5%) respondents; (3)—35 (16.2%) respondents; and (4+5)—154 (71.3%) respondents. The comparison of respondents’ attitudes towards V1_1 is the subject of Table 1.
The type of employment is not a statistically significant characteristic of respondents when evaluating the front brake light in the case of crossing the traffic of vehicles and pedestrians (see Table 1; p-val. = 0.820). Hypothesis H1_V_1 was rejected. There are statistically significant differences in the attitudes of respondents when evaluating the front brake light in the case of crossing the traffic of vehicles and pedestrians according to the number of kilometers driven. The influence of this characteristic is weak (Cramer’s V = 0.146). Hypothesis H2_V_1 was accepted at a significance level of 10%.
The structure of respondents on the perception of the innovative element in road traffic in the case of crossing multiple vehicles is: (1+2)—25 (11.6%) respondents, (3)—56 (25.9%) respondents, and (4+5)—135 (62.5%) respondents. The comparison of respondents’ attitudes regarding V1_2 is the subject of Table 2.
The type of employment contract is not a statistically significant characteristic of the respondent when evaluating the front brake light when crossing traffic with multiple vehicles (see Table 2; p-val. = 0.678). Hypothesis H1_V_2 was rejected. The number of kilometers driven by the respondent is a statistically significant characteristic that matters when evaluating the front brake light when crossing traffic with multiple vehicles. The influence of this characteristic is moderately strong (Cramer’s V = 0.150). Hypothesis H2_V_2 was accepted.
The structure of respondents’ perception of the innovative element in road transport when overtaking is: (1+2)—40 (18.5%) resp.; (3)—85 (39.4%) resp. and (4+5)—91 (42.1%) resp. The comparison of respondents’ attitudes towards V1_3 is the subject of Table 3.
The type of employment and the number of kilometers driven are not statistically significant characteristics of the respondent when evaluating the front brake light when overtaking (see Table 3; p-val. = 0.106 and p.val. = 0.782). Hypotheses H1_V_3 and H2_V_3 were rejected.
The structure of respondents regarding the perception of an innovative element in road transport at pedestrian crossings is: (1+2)—31 (14.4%) respondents; (3)—25 (11.6%) respondents, and (4+5)—160 (74.1%) respondents. The comparison of respondents’ attitudes towards V1_4 is the subject of Table 4.
The type of employment contract is not a statistically significant characteristic of the respondent in evaluating the front brake light on pedestrian crossings (see Table 4; p-val. = 0.661). Hypothesis H1_V_4 was rejected. The number of kilometers driven by the respondent is a statistically significant characteristic that is important in evaluating the front brake light on pedestrian crossings. The influence of this characteristic is moderately strong (Cramer’s V = 0.153). Hypothesis H2_V_4 was accepted.
The structure of respondents’ perceptions of the innovative element in road transport when turning left is as follows: (1+2)—24 (11.1%) resp.; (3)—55 (25.5%) resp. and (4+5)—137 (63.4%) resp. The comparison of respondents’ attitudes towards V1_5 is the subject of Table 5.
The type of employment contract and the number of kilometers driven are not statistically significant characteristics of the respondent when evaluating the front brake light when turning left (see Table 5; p-val. = 0.452 and p-val. = 0.842). Hypotheses H1_V_5 and H2_V_5 were rejected.
The structure of respondents’ perceptions of the innovative element in road transport when changing lanes on a highway is as follows: (1+2)—40 (18.5%) respondents; (3)—73 (33.8%) respondents; and (4+5)—103 (47.7%) respondents. The comparison of respondents’ attitudes towards V1_6 is the subject of Table 6.
The type of employment contract or the number of kilometers driven by the respondent are not statistically significant characteristics when evaluating the front brake light during a lane change on a highway (see Table 6; p-val. = 0.887 and p-val. = 0.479). Hypotheses H1_V_6 and H2_V_6 were rejected.
The structure of respondents’ perceptions of the innovative element in road transport during braking in traffic is: (1+2)—21 (9.7%) respectively; (3)—53 (24.5%) respectively; and (4+5)—142 (65.7%) respectively. The comparison of respondents’ attitudes towards V1_7 is the subject of Table 7.
The type of employment contract or the number of kilometers driven are not statistically significant characteristics of the respondent when evaluating the front braking during deceleration in traffic jams (see Table 6; p-val. = 0.887 and p-val. = 0.479). Hypotheses H1_V_6 and H2_V_6 were rejected.
The results obtained in Table 1, Table 2, Table 3, Table 4, Table 5, Table 6 and Table 7 were also verified using the non-parametric Mann-Whitney test (see Table 8).
The results above (see Table 8) confirmed statistically significant differences between respondents based on the number of kilometers driven per year in perceiving V1_1 (M-W test: p-val. = 0.058), V1_2 (M-W test: p-val. = 0.076), and V1_4 (M-W test: p-val. = 0.053) at a significance level of 0.1. These results are identical to those obtained using the chi-square test.
5. Discussion
The empirical results of the research brought interesting findings. More than 70% of respondents stated that the implementation of the innovative feature has a positive impact on the crossing of traffic between vehicles and pedestrians. Respondents who have driven less than 60,000 kilometers per year perceive the innovative feature as more useful (72.4%) compared to respondents who have driven more than 60,000 kilometers per year. The implementation of the innovative feature in road traffic has a positive impact in the case of crossing traffic of multiple vehicles, as reported by 62.5% of respondents. Respondents with a lower number of kilometers driven per year perceive the impact of the innovative feature (63.8%) more positively compared to respondents with a higher number of kilometers driven (59.4%). Approximately 42% of respondents consider the positive impact of the innovative feature on increasing safety in road traffic during overtaking. Disparities among respondents according to type of employment and number of kilometers driven per year were not confirmed. Another interesting finding is that respondents who have driven more than 60,000 kilometers per year consider the impact of the innovative feature on pedestrian crossings (79.8%) to be much safer in road traffic compared to respondents with a number of kilometers driven under 60,000 per year (71.7%).
The innovative element in road traffic has a positive impact on safety when turning left for 63.4% of respondents; when changing lanes on a highway for 47.7% of respondents, and when braking in a queue for 65.7% of respondents. Disparities between respondents according to their employment contract type or the number of kilometers driven per year were not confirmed regarding the perception of the safety impact of the innovative element when turning left, changing lanes on a highway, or braking in a queue.
The results of the questionnaire show that only 22% of road users consider the innovative feature of the front brake light to be unnecessary. On the other hand, as many as 54% of road users consider the implementation of the innovative feature to be necessary or very necessary in road traffic.
In Slovakia, it is a unique study as it is the first study conducted in real traffic. The study of the front brake light was conducted by Monzel et al. [52] at the Berlin airport. The difference between our study and Monzel et al.’s [52] study is that our German colleagues conducted the study in a non-public area. The study provided empirical evidence of the increased safety of road traffic due to the installation of the front brake light [52]. However, the authors point out the need for research in real-world conditions, as field research at the airport can exhibit false positive and negative signals of the impact of the front brake light on safety. 77% of professional drivers in Slovakia believe that the front brake light will increase road safety and would be satisfied if the front brake light were installed on all vehicles. Differences in respondents’ perceptions of the impact of the innovative element on pedestrian crossings were not confirmed.
6. Practical implications
Innovation in the form of a front brake light has the potential to reduce traffic accidents in the following cases:
- Left turn—when two vehicles meet in traffic, and one is turning left while giving way to the vehicle continuing straight ahead, there is a certain degree of uncertainty for the driver continuing straight ahead as to whether the turning vehicle is giving way [61]. If the turning vehicle begins to brake, the front brake light will light up, and the oncoming vehicle will be informed that the turning vehicle is braking.
- Lane change—when changing lanes, the driver often works with a high degree of uncertainty as to whether the driver in the lane they intend to move into has noticed the turn signals of the vehicle and whether the driver can safely change lanes [62]. If the vehicle in the lane slows down to allow the other vehicle to merge, the front brake light will light up. The driver changing lanes will see the illuminated front brake light, reducing their uncertainty as they have information that the vehicle is allowing them to merge into the next lane.
- Narrow road—a similar situation arises when the road narrows, and only one vehicle can travel on a particular stretch. If a vehicle has information that the oncoming vehicle is braking or stopped and has a lit front brake light, it means that the particular driver can continue driving on the narrow section of the road.
- Pedestrian crossing—pedestrians often work with a high degree of uncertainty because they do not know if drivers see them and give them the right of way. A pedestrian often waits for eye contact with the driver [63], which is often not possible, for example, at night or in reduced visibility. Illumination of the front brake light means that the driver perceives the pedestrian and has started to brake.
7. Conclusions
The main goal of the article is to identify disparities in the perception of an innovative safety element among road users based on their employment status and the number of kilometers driven per year.
The type of employment contract is not statistically significant in evaluating selected situations regarding the front brake light among road traffic participants. Scientific hypothesis 1 (RQ1) was rejected. Almost 75% of respondents consider the innovative feature (front brake light) to be much safer when crossing for pedestrians. Respondents with more than 60,000 kilometers driven per year consider the positive impact of the innovative feature in the given traffic situation to be significantly more important than respondents with less than 60,000 kilometers driven per year. On the other hand, it is interesting to note that respondents with fewer kilometers driven (60,000 km) perceive the front brake light significantly more positively when crossing traffic between vehicles and pedestrians as well as in multi-vehicle traffic situations. Disparities among respondents based on the number of kilometers driven were not confirmed in the perception of the front brake light in traffic situations such as overtaking, turning left, changing lanes on the highway, and braking in columns. Scientific hypothesis 2 (RQ2) was partially confirmed.
The main user of the research results is the state or public administration, which approves technical requirements for motor vehicles. The maximum effect of improving road safety through the installation of front brake lights can be achieved by making it mandatory for all motor vehicles. However, it is also possible to consider the alternative of mandatory installation on new vehicles and voluntary installation on vehicles already in use. By taking this approach, we would achieve the maximum effect of installing front brake lights over a longer period of time.
The conducted case study has certain limitations. One of them is that data collection was carried out only in one Central European country (Slovak Republic). The initial phase of the research, which involved pilot analysis, was participated by 239 respondents. Respondents subjectively evaluated selected statements in the questionnaire, which can also lead to certain bias. The authors applied several statistical tools to verify the outputs. The main phase of the research will involve a more robust sample of respondents.
Further research should focus on the effect of installing front brake lights on motorcycles, as within our research, front brake lights were only installed on cars, trucks, and buses. Additional studies should also focus on the optimal configuration of the front brake light with regard to light intensity and height placement on the vehicle. During our research, the lights were placed on the front of the vehicle according to technical possibilities, but further research should determine the maximum height for brake light placement.
Author Contributions
Conceptualization, M.P.; methodology, M.P.; validation, J.D.; formal analysis, J.D.; investigation, M.P.; resources, M.P., E.N. and J.D.; data curation, M.P.; writing—original draft preparation, M.P. and J.D.; writing—review and editing, M.P. and J.Z.; visualization, M.P.; supervision, M.P. and E.N. All authors have read and agreed to the published version of the manuscript.
Funding
This paper is an output of the project NFP313011BWN6 “The implementation framework and business model of the Internet of Things, Industry 4.0 and smart transport”.
Data Availability Statement
The data presented in this study are available on request from the corresponding author.
Conflicts of Interest
The authors declare no conflict of interest.
References
- Shen, X.; Wei, S. Application of XGBoost for hazardous material road transport accident severity analysis. IEEE Access 2020, 8, 206806–206819. [Google Scholar] [CrossRef]
- Kliestik, T.; Hrosova, L.; Valaskova, K.; Svabova, L. Do Firm in the Tourism Sector Manage Earnings? The Case of the V4 Countries. J. of Tour. and Ser. 2022, 13, 120–136. [Google Scholar] [CrossRef]
- Inanloo, B.; Tansel, B. A transportation network assessment tool for hazardous material cargo routing: Weighing exposure health risks, proximity to vulnerable areas, delay costs and trucking expenses. J. Loss. Prev. Process Ind. 2016, 40, 266–276. [Google Scholar] [CrossRef]
- Vatankhah, S.; Zarra-Nezhad, M.; Amirnejad, G. An empirical assessment of willingness to accept “low-cost” air transport services: Evidence from the Middle East. J. of Tour. and Ser. 2019, 10, 79–103. [Google Scholar] [CrossRef]
- Kliestik, T.; Novak Sedlackova, A.; Bugaj, M.; Novak, A. Stability of profits and earnings management in the transport sector of Visegrad countries. Oec. Cop. 2022, 13, 475–509. [Google Scholar] [CrossRef]
- Shen, X.; Wei, S. Severity analysis of road transport accidents of hazardous materials with machine learning. Traffic Inj Prev 2021, 22, 324–329. [Google Scholar] [CrossRef]
- Cioca, L.; Ivascu, L. Risk indicators and road accident analysis for the period 2012-2016. Sustainability (Switzerland) 2017, 9. [Google Scholar] [CrossRef]
- Savolainen, P.; Mannering, F.; Lord, D.; Quddus, M. The statistical analysis of highway crash-injury severities: A review and assessment of methodological alternatives. Accid. Anal. Prev. 2011, 43, 1666–1676. [Google Scholar] [CrossRef]
- Kumar, S.; Toshniwal, D. A data mining framework to analyze road accident data. J. of Big. Dat. 2015, 2. [Google Scholar] [CrossRef]
- Janovská, K.; Vozňáková, I.; Besta, P.; Šafránek, M. Ecological and economic multicriteria optimization of operating alternative propulsion vehicles within the city of Ostrava in the Czech Republic. Equilibrium. Quar. J. Econ. Econom. Policy 2021, 2021 16, 907–943. [Google Scholar] [CrossRef]
- WHO. Global status report on road safety 2018. World Health Organization, 403, ISBN 9789241565684.
- Najaf, P.; Thill, J.C.; Zhang, W.; Fields, M.G. City-level urban form and traffic safety: a structural equation modeling analysis of direct and indirect effects. J. Trans. Geography 2018, 69, 257–270. [Google Scholar] [CrossRef]
- Pauer, G. Development potentials and strategic objectives of intelligent transport systems improving road safety. Trans. Telecommun. J. 2017, 18, 15–24. [Google Scholar] [CrossRef]
- Elliott, E.M.; Bell, R.; Gorin, S.; Robinson, N.; Marsh, J.E. Auditory distraction can be studied online! A direct comparison between in-person and online experimentation. J. Cogn. Psychol. 2022, 34, 307–324. [Google Scholar] [CrossRef]
- Radu, V.; Dumitrescu, C.; Vasile, E.; Tăbîrcă, A.I.; Stefan, M.C.; Manea, L.; Radu, F. Modeling and Prediction of Sustainable Urban Mobility Using Game Theory Multiagent and the Golden Template Algorithm. Electronics 2023, 12, 1288. [Google Scholar] [CrossRef]
- Barletta, V.S.; Caivano, D.; Vincentiis, M.D.; Ragone, A.; Scalera, M.; Martín, M.A.S. V-SOC4AS: A Vehicle-SOC for Improving Automotive Security. Algorithms 2023, 16, 112. [Google Scholar] [CrossRef]
- Mayo, L.F.; Maglasang, R.N.; Moridpour, S.; Taboada, E.B. Impact of transport policies to commuter safety in urban cities of a developing country: A sustainability and system perspective, Case Stud. on Transp. Policy 2022, 10, 2138–2152. [Google Scholar] [CrossRef]
- Dvorský, J.; Petráková, Z. Effect of business risks on the business future by czech and slovak SMEs in the segment transport and services. Transportation Research Procedia, 2021, 55, 1444–1451. [Google Scholar] [CrossRef]
- Hordofa, G.G.; Assegid, S.; Girma, A.; Weldemarium, T.D. Prevalence of fatality and associated factors of road traffic accidents among victims reported to burayu town police stations, between 2010 and 2015, ethiopia. J. of Transp. and Health 2018 10, 186–193. [CrossRef]
- Wang, Y.; Xu, J.; Liu, X.; Zheng, Z.; Zhang, H.; Wang, C. Analysis on Risk Characteristics of Traffic Accidents in Small-Spacing Expressway Interchange. Int. J. Environ. Res. Public Health 2022, 19, 9938. [Google Scholar] [CrossRef]
- Canonica, A.C.; Alonso, A.C.; da Silva, V.C.; Bombana, H.S.; Muzaurieta, A.A.; Leyton, V.; Greve, J.M.D. Factors Contributing to Traffic Accidents in Hospitalized Patients in Terms of Severity and Functionality. Int. J. Environ. Res. Public Health 2023, 20, 853. [Google Scholar] [CrossRef]
- Garrisson, H.; Scholey, A.; Ogden, E.; Benson, S. The effects of alcohol intoxication on cognitive functions critical for driving: A systematic review. Accid. Anal. Prev., 2021, 154. [Google Scholar] [CrossRef] [PubMed]
- Zhao, C.; Chang, X.; Xie, T. Unsupervised anomaly detection based method of risk evaluation for road traffic accident. Appl Intell 2023, 53, 369–384. [Google Scholar] [CrossRef]
- Useche, S.; Gómez, V.; Cendales, B. Stress-related Psychosocial Factors at Work, Fatigue, and Risky Driving Behavior in Bus Rapid Transport (BRT) Drivers. Accid. Anal. Prev. 2017, 104, 106–114. [Google Scholar] [CrossRef] [PubMed]
- Jiang, Y.; Zhao, N.; Peng, L.L.; Xin, J.Z.; Liu, S.Y. Fast simulation of fully non-stationary wind fields using a new matrix factorization assisted interpolation method. Mech. Syst. Signal Process 2022, 172, 108973. [Google Scholar] [CrossRef]
- Olojede, O.; Daramola, O.; Olufemi, B. Metropolitan transport safety and security: An african experience. J. Transp. Saf. Secur. 2017, 9, 383–402. [Google Scholar] [CrossRef]
- Lei, T.; Peng, J.; Liu, X.L.; Luo, Q. A Bayesian network based framework for real-time crash prediction on the basic freeway segments of urban expressways. J. Adv. Transp. 2021, 45, 373–381. [Google Scholar] [CrossRef]
- Porpiglia, N.M.; Tagliaro, F.; Micciolo, R.; Canal, L.; Musile, G.; Bortolotti, F. New evidence of high association between carbohydrate deficient transferrin (CDT) and alcohol-related road traffic accidents. A retrospective study on 929 injured drivers. Foren. Scien. Intern. 2022, 340. [Google Scholar] [CrossRef] [PubMed]
- Alonso, F.; Esteban, C.; Sanmartín, J.; Useche, S. Reported prevalence of health conditions that affect drivers. Cogent Med. 2017, 4, 1303920. [Google Scholar] [CrossRef]
- Walton, D.; Jenkins, D.; Thoreau, R.; Kingham, S.; Keall, M. Why is the rate of annual road fatalities increasing? A unit record analysis of New Zealand data (2010–2017) J. Saf. Res. 2020, 72, 67–74. [Google Scholar] [CrossRef]
- Albert, D.A.; Claude Ouimet, M.; Brown, T.G. Negative mood mind wandering and unsafe driving in young male drivers. Accid. Anal. Prev. 2022, 178. [Google Scholar] [CrossRef]
- Hyun, K.K.; Jeong, K.; Tok, A.; Ritchie, S.G. Assessing crash risk considering vehicle interactions with trucks using point detector data. Accid. Anal. Prev. 2019, 130, 75–83. [Google Scholar] [CrossRef] [PubMed]
- Horswill, M.S.; Hill, A.; Silapurem, L. The development and validation of video-based measures of drivers’ following distance and gap acceptance behaviours. Accid. Anal. Prev. 2020, 146. [Google Scholar] [CrossRef] [PubMed]
- Hjorthol, R. Decreasing popularity of the car? changes in driving licence and access to a car among young adults over a 25-year period in norway. J. Transp. Geogr., 2016, 51, 140–146. [Google Scholar] [CrossRef]
- Zangi, N.; Srour-Zreik, R.; Ridel, D.; Chasidim, H.; Borowsky, A. Driver distraction and its effects on partially automated driving performance: A driving simulator study among young-experienced drivers. Accid. Anal. Prev. 2022, 166. [Google Scholar] [CrossRef] [PubMed]
- Zaranka, J.; Pečeliūnas, R.; Žuraulis, V. A road safety-based selection methodology for professional drivers: Behaviour and accident rate analysis. Intern. J. of Envir. Res. Pub. Health 2021, 18. [Google Scholar] [CrossRef] [PubMed]
- Shi, L.; Zheng, L.; Jin, D.; Lin, Z.; Zhang, Q.; Zhang, M. Assessment of combination of automated pupillometry and heart rate variability to detect driving fatigue. Front. Public Health 2022, 10. [Google Scholar] [CrossRef] [PubMed]
- Yu, P.K.; Radcliffe, J.; Gerry Taylor, H.; Amin, R.S.; Baldassari, C.M.; Boswick, T.; … Redline, S. Neurobehavioral morbidity of pediatric mild sleep-disordered breathing and obstructive sleep apnea. Sleep 2022, 45. [Google Scholar] [CrossRef]
- Huhta, R.; Hirvonen, K.; Partinen, M. Prevalence of sleep apnea and daytime sleepiness in professional truck drivers. Sleep Med. 2021, 81, 136–143. [Google Scholar] [CrossRef]
- Felix, M.; Intriago Alvarez, M.B.; Vanegas, E.; Farfán Bajaña, M.J.; Sarfraz, Z.; Sarfraz, A.; … Cherrez-Ojeda, I. Risk of obstructive sleep apnea and traffic accidents among male bus drivers in ecuador: Is there a significant relationship? Ann. Med. Surg. 2022, 74. [Google Scholar] [CrossRef]
- Islam Bin, M.; Kanitpong, K. Identification of factors in road accidents through in-depth accident analysis. IATSS Research, 2008, 32, 58–67. [Google Scholar] [CrossRef]
- Liang, C.; Ghazel, M.; Cazier, O.; El-Koursi, E. Developing accident prediction model for railway level crossings. Saf. Scien. 2018, 101, 48–59. [Google Scholar] [CrossRef]
- Zhang, Z.; Akinci, B.; Qian, S. Inferring the causal effect of work zones on crashes: Methodology and a case study. Anal. Meth. Accid. Res. 2022, 33. [Google Scholar] [CrossRef]
- Elliott, E.M.; Bell, R.; Gorin, S.; Robinson, N.; Marsh, J.E. Auditory distraction can be studied online! A direct comparison between in-person and online experimentation. J. Cogn. Psychol. 2022, 34, 307–324. [Google Scholar] [CrossRef]
- Bonin, P.; Thiebaut, G.; Bugaiska, A.; Méot, A. Mixed evidence for a richness-of-encoding account of animacy effects in memory from the generation-of-ideas paradigm. Curr. Psychol. 2022, 41, 1653–1662. [Google Scholar] [CrossRef]
- Mumtaz, S.; Ashraf, M.I.; Menon, V.G.; Abbas, T.; Al-Dulaimi, A. Guest editorial intelligent autonomous transportation system with 6G - series - part III. IEEE Trans. Intel. Transp. Sys. 2023, 24, 2035–2037. [Google Scholar] [CrossRef]
- Tengilimoglu, O.; Carsten, O.; Wadud, Z. Infrastructure requirements for the safe operation of automated vehicles: Opinions from experts and stakeholders. Transp. Policy 2023, 133, 209–222. [Google Scholar] [CrossRef]
- Bailey, T.; Wundersitz, L.; O’Donnell, K.; Rasch, A. Identifying best practices in a process evaluation of a novice driver education program. Eval. Progr. Plan. 2023, 93. [Google Scholar] [CrossRef]
- Wu, L.; Lu, B. A route choice model for road network users in mountainous cities considering vulnerability. J. Advan. Transp. 2022. [Google Scholar] [CrossRef]
- Cordellieri, P.; Baralla, F.; Ferlazzo, F.; Sgalla, R.; Piccardi, L.; Giannini, A.M. Gender Effects in Young Road Users on Road Safety Attitudes, Behaviors and Risk Perception. Front. Psychol. 2016, 7, 1412. [Google Scholar] [CrossRef]
- Mühl, K.; Vogt, A.; Baumann, M. Reducing uncertainty by anticipation in traffic – the effect of situational characteristics and criticality on behavioral, subjective, and psychophysiological parameters. Transp. Res. Part F: Traf. Psych. Behav. 2020, 75, 173–186. [Google Scholar] [CrossRef]
- Monzel, M.; Keidel, K.; Schubert, W.; Banse, R. A field study investigating road safety effects of a front brake light. IET Intel. Transp. Sys 2021, 15, 1043–1052. [Google Scholar] [CrossRef]
- Oluyede, B.O. A modified chi-square test of independence against a class of ordered alternatives in an r x c contingency table. Can. J. Stat. 1994, 22, 75–87. [Google Scholar] [CrossRef]
- Agresti, A. A survey of exact inference for contingency tables. Statis. Scien. 1992, 7, 131–153. [Google Scholar] [CrossRef]
- Babin, B.J.; Hair, J.F.; Boles, J.S. Publishing research in marketing journals using structural equation modeling. J. Mark. Theo. Pract. 2008, 16, 279–286. [Google Scholar] [CrossRef]
- Hosmane, B.S. Improved likelihood ratio tests and pearson chi-square tests for independence in two dimensional contingency tables. Com. Stat. – Theo. Meth. 1986, 15, 1875–1888. [Google Scholar] [CrossRef]
- Baglivo, J.; Olivier, D.; Pagano, M. Methods for the analysis of contingency tables with large and small cell counts. Journal of the American Statistical Association 1988, 83, 1006–1013. [Google Scholar] [CrossRef]
- Goodman, L.A. The multivariate analysis of qualitative data: Interactions among multiple classifications. Journal of the Am. Stat. Assoc. 1970, 65, 226–256. [Google Scholar] [CrossRef]
- Rao, J.N.K.; Scott, A.J. The analysis of categorical data from complex sample surveys: Chi-squared tests for goodness of fit and independence in two-way tables. J. Amer. Stat. Assoc. 1981, 76, 221–230. [Google Scholar] [CrossRef]
- Akoglu, H. User’s guide to correlation coefficients. Tur J. Emerg. Med. 2018, 18, 91–93. [Google Scholar] [CrossRef]
- Manirul Islam, S.; Washington, S.; Kim, J.; Haque, M. A comprehensive analysis on the effects of signal strategies, intersection geometry, and traffic operation factors on right-turn crashes at signalised intersections: An application of hierarchical crash frequency model. Accid Anal. Prev. 2022, 171. [Google Scholar] [CrossRef]
- Xiang, W.; Wang, C.; Li, X.; Xue, Q.; Liu, X. Optimizing guidance signage system to improve drivers’ lane-changing behavior at the expressway toll plaza. Transp. Res. Part F: Traf. Psych. Beh. 2022, 90, 382–396. [Google Scholar] [CrossRef]
- Onkhar, V.; Bazilinskyy, P.; Dodou, D.; de Winter, J.C.F. The effect of drivers’ eye contact on pedestrians’ perceived safety. Transp. Res. Part F: Traf. Psych. Beh. 2022, 84, 194–210. [Google Scholar] [CrossRef]
Figure 1.
Front brake light (source: own processing).
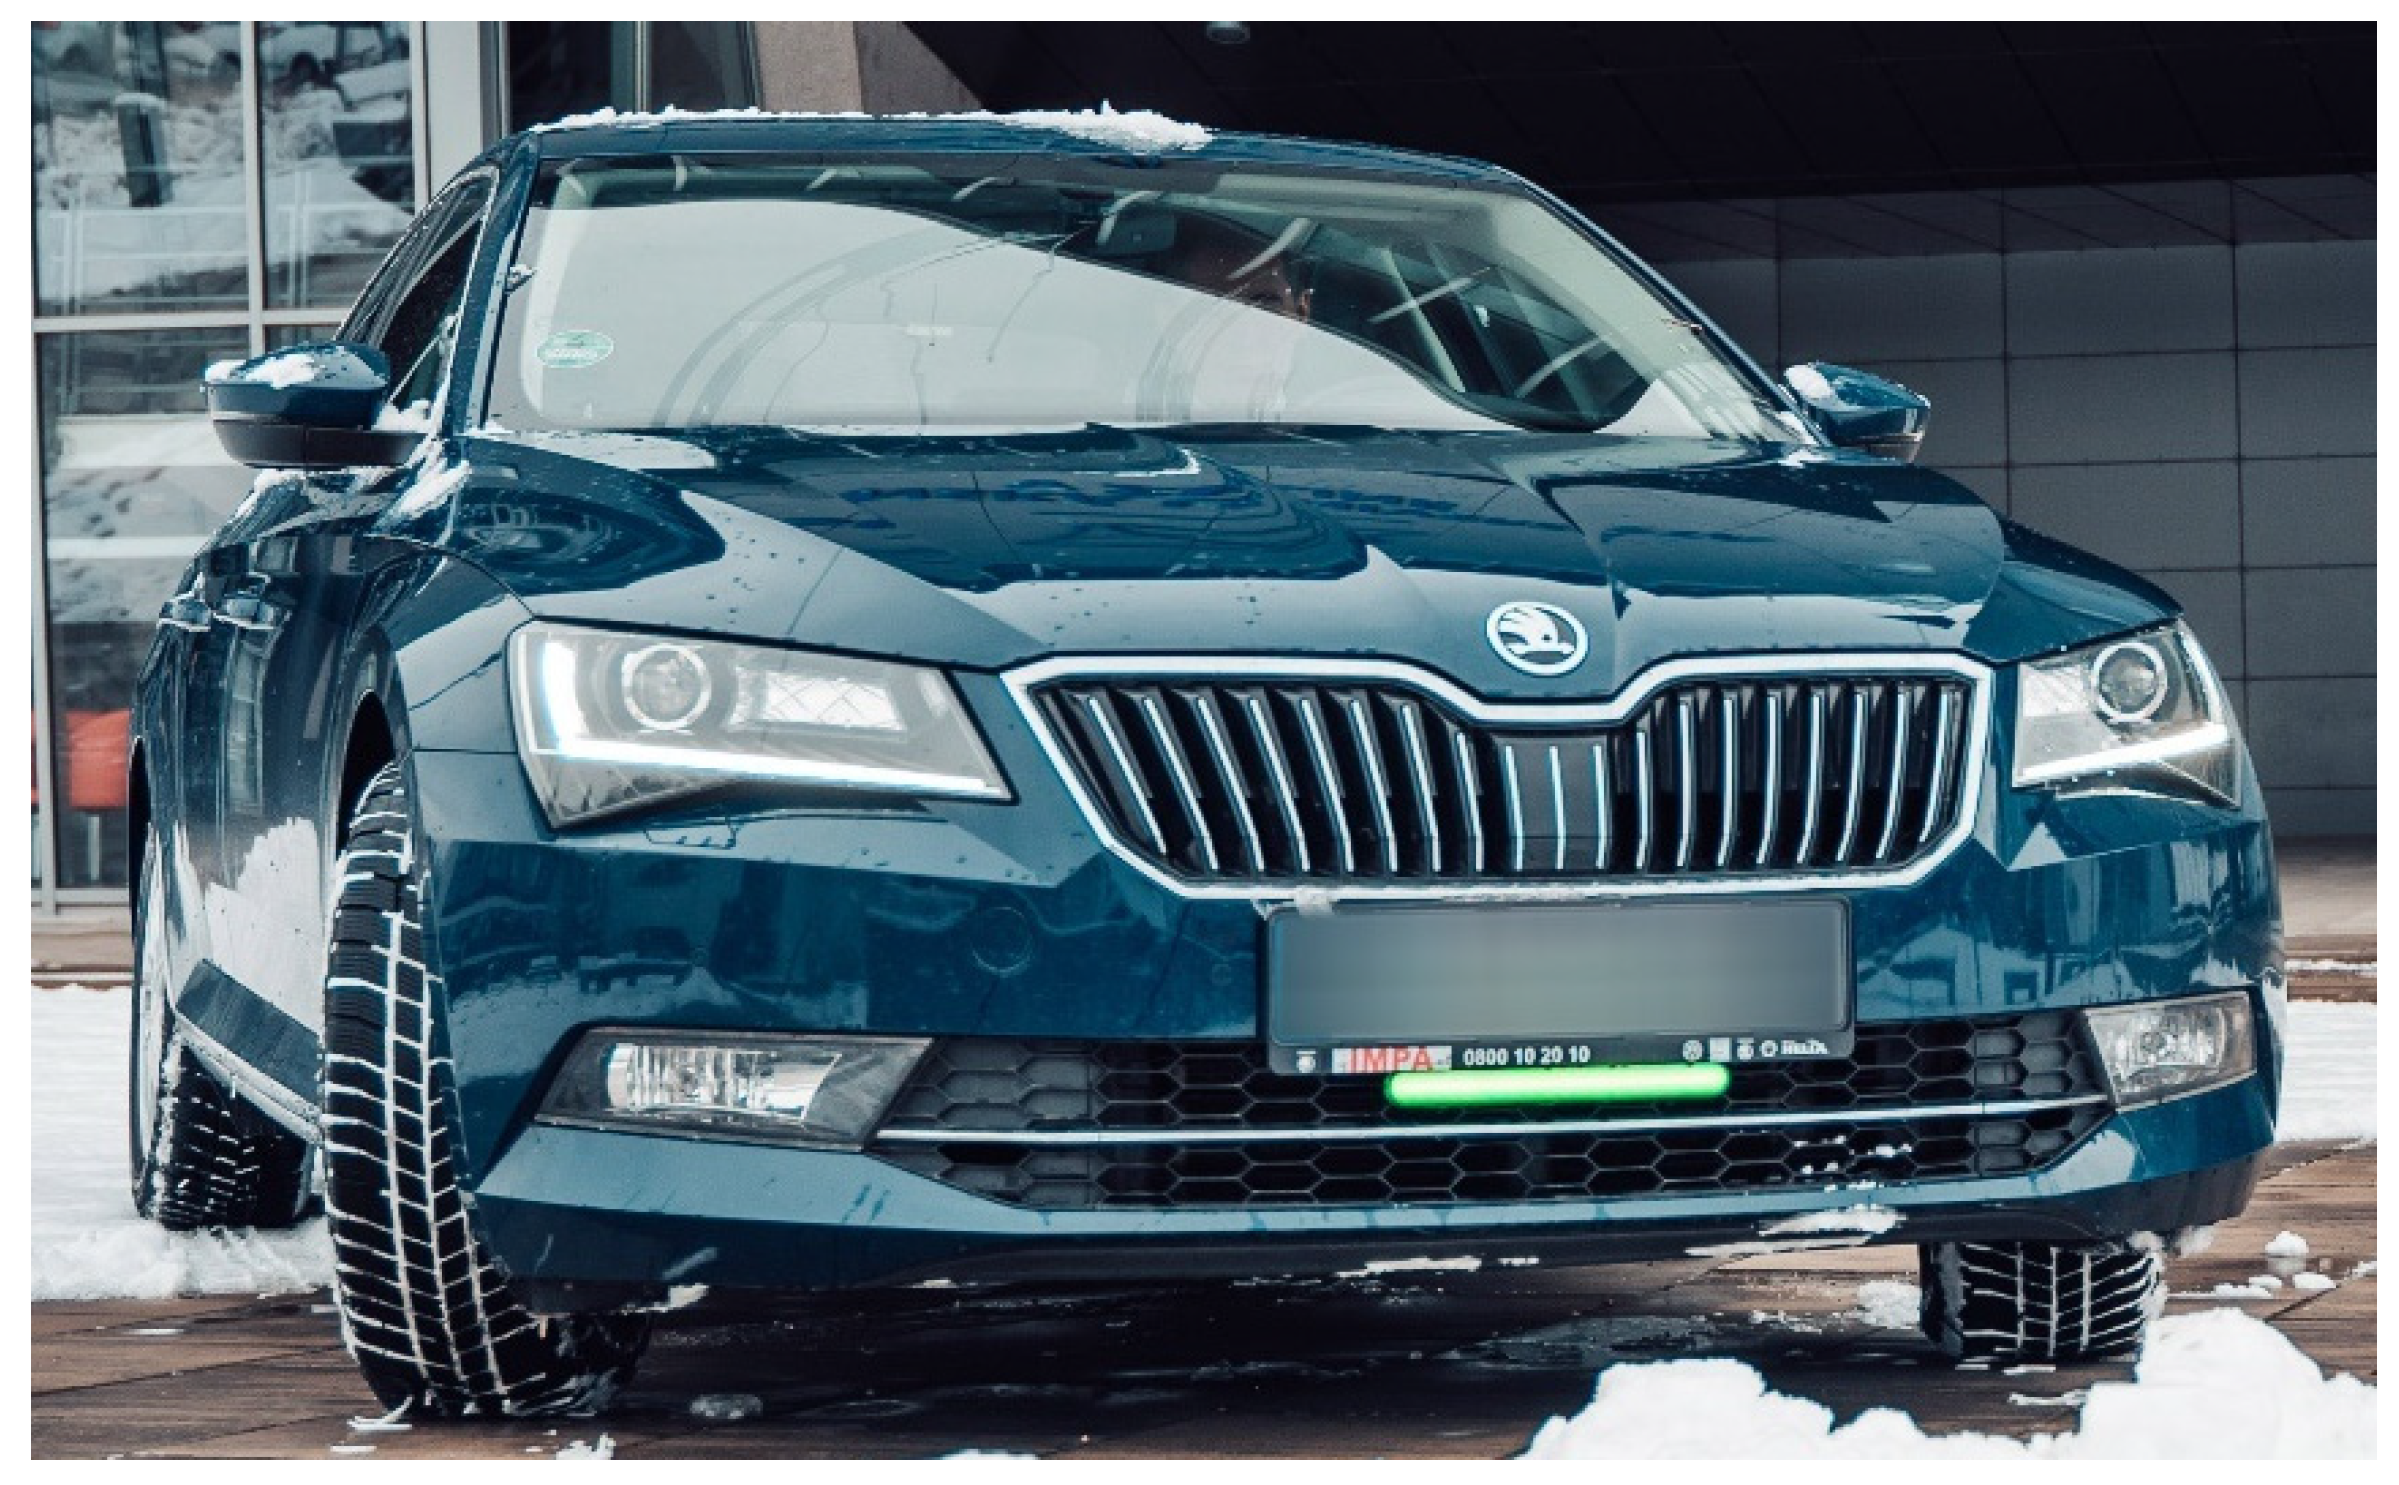

Table 1.
The attitudes of respondents in the case of crossing traffic of vehicles and pedestrians.
| V1_1 | Type of employment | V1_1 | Number of driven kilometers | ||
|---|---|---|---|---|---|
| Main | None | Within 60,000 km | More than 60,000 km | ||
| 1+2 | 17 | 10 | 1+2 | 22 | 5 |
| % | 12.3% | 12.8% | % | 14.5% | 7.8% |
| 3 | 24 | 11 | 3 | 20 | 15 |
| % | 17.4% | 14.1% | % | 13.2% | 23.4% |
| 4+5 | 97 | 57 | 4+5 | 110 | 44 |
| % | 70.3% | 73.1% | % | 72.4% | 68.8% |
| Together | 138 (100%) | 78 (100%) | Together | 152 (100%) | 64 (100%) |
| CHS (p-val.) | 0.397 (0.820) | CHS (p-val.) | 4.618 (0.095*) | ||
Note: CHS—Chi-square; * α = 0.1; ** α = 0.05; *** α = 0.01. Source: own research results.
Table 2.
Attitudes of respondents in the case of crossing traffic of multiple vehicles.
| V1_2 | Type of employment | V1_2 | Number of driven kilometers | ||
|---|---|---|---|---|---|
| Main | None | Within 60,000 km | More than 60,000 km | ||
| 1+2 | 14 | 11 | 1+2 | 21 | 5 |
| % | 10.1% | 14.1% | % | 13.8% | 6.2% |
| 3 | 36 | 20 | 3 | 34 | 21 |
| % | 26.1% | 25.6% | % | 22.4% | 34.4% |
| 4+5 | 88 | 47 | 4+5 | 97 | 38 |
| % | 63.8% | 60.3% | % | 63.8% | 59.4% |
| Together | 138 (100%) | 78 (100%) | Together | 152 (100%) | 64(100%) |
| CHS (p-val.) | 0.777 (0.678) | CHS (p-val.) | 4.874 (0.087*) | ||
Note: CHS—Chi-square; * α = 0.1; ** α = 0.05; *** α = 0.01. Source: own research results.
Table 3.
Attitudes of respondents regarding overtaking.
| V1_3 | Type of employment | V1_3 | Number of driven kilometers | ||
|---|---|---|---|---|---|
| Main | None | Within 60,000 km | More than 60,000 km | ||
| 1+2 | 28 | 12 | 1+2 | 28 | 12 |
| % | 20.3% | 15.4% | % | 18.4% | 18.8% |
| 3 | 47 | 38 | 3 | 62 | 23 |
| % | 34.1% | 48.7% | % | 40.8% | 35.9% |
| 4+5 | 63 | 28 | 4+5 | 62 | 29 |
| % | 45.7% | 35.9% | % | 40.8% | 45.3% |
| Together | 138 (100%) | 78 (100%) | Together | 152 (100%) | 64 (100%) |
| CHS (p-val.) | 4.495 (0.106) | CHS (p-val.) | 0.491 (0.782) | ||
Note: CHS—Chi-square; * α = 0.1; ** α = 0.05; *** α = 0.01. Source: own research results.
Table 4.
Attitudes of respondents regarding the pedestrian crossing innovation.
| V1_4 | Type of employment | V1_4 | Number of driven kilometers | ||
|---|---|---|---|---|---|
| Main | None | Within 60,000 km | More than 60,000 km | ||
| 1+2 | 18 | 13 | 1+2 | 27 | 4 |
| % | 13.0% | 16.7% | % | 17.8% | 6.3% |
| 3 | 15 | 10 | 3 | 16 | 9 |
| % | 10.9% | 12.8% | % | 10.5% | 14.0% |
| 4+5 | 105 | 55 | 4+5 | 109 | 51 |
| % | 76.1% | 70.5% | % | 71.7% | 79.7% |
| Together | 138 (100%) | 78 (100%) | Together | 152 (100%) | 64 (100%) |
| CHS (p-val.) | 0.829 (0.661) | CHS (p-val.) | 5.033 (0.081*) | ||
Note: CHS—Chi-square; * α = 0.1; ** α = 0.05; *** α = 0.01. Source: own research results.
Table 5.
Attitudes of respondents towards left turns.
| V1_5 | Type of employment | V1_5 | Number of driven kilometers | ||
|---|---|---|---|---|---|
| Main | None | Within 60,000 km | More than 60,000 km | ||
| 1+2 | 15 | 9 | 1+2 | 17 | 7 |
| % | 10.9% | 11.5% | % | 11.2% | 10.9% |
| 3 | 39 | 16 | 3 | 37 | 18 |
| % | 28.2% | 20.5% | % | 24.3% | 28.1% |
| 4+5 | 84 | 53 | 4+5 | 98 | 39 |
| % | 60.9% | 68.0% | % | 64.5% | 61.0% |
| Together | 138 (100%) | 78 (100%) | Together | 152 (100%) | 64 (100%) |
| CHS (p-val.) | 1.589 (0.452) | CHS (p-val.) | 0.344 (0.842) | ||
Note: CHS—Chi-square; * α = 0.1; ** α = 0.05; *** α = 0.01. Source: own research results.
Table 6.
Attitudes of respondents towards the innovation in road transport during changing lanes on a highway.
Table 6.
Attitudes of respondents towards the innovation in road transport during changing lanes on a highway.
| V1_6 | Type of employment | V1_6 | Number of driven kilometers | ||
|---|---|---|---|---|---|
| Main | None | Within 60,000 km | More than 60,000 km | ||
| 1+2 | 26 | 14 | 1+2 | 25 | 15 |
| % | 18.8% | 17.9% | % | 16.4% | 23.4% |
| 3 | 45 | 28 | 3 | 53 | 20 |
| % | 32.6% | 35.9% | % | 34.9% | 31.3% |
| 4+5 | 67 | 36 | 4+5 | 74 | 29 |
| % | 48.6% | 46.2% | % | 48.7% | 45.3% |
| Together | 138 (100%) | 78 (100%) | Together | 152 (100%) | 64 (100%) |
| CHS (p-val.) | 0.241 (0.887) | CHS (p-val.) | 1.470 (0.479) | ||
Note: CHS—Chi-square; * α = 0.1; ** α = 0.05; *** α = 0.01. Source: own research results.
Table 7.
Attitudes of respondents towards braking in traffic jams.
| V1_7 | Type of employment | V1_7 | Number of driven kilometers | ||
|---|---|---|---|---|---|
| Main | None | Within 60,000 km | More than 60,000 km | ||
| 1+2 | 13 | 8 | 1+2 | 15 | 6 |
| % | 9.4% | 10.3% | % | 9.9% | 9.4% |
| 3 | 34 | 19 | 3 | 39 | 14 |
| % | 24.6% | 24.4% | % | 25.7% | 21.9% |
| 4+5 | 91 | 51 | 4+5 | 98 | 44 |
| % | 66.0% | 65.3% | % | 64.4% | 68.7% |
| Together | 138 (100%) | 78 (100%) | Together | 152 (100%) | 64 (100%) |
| CHS (p-val.) | 0.040 (0.980) | CHS (p-val.) | 0.399 (0.819) | ||
Note: CHS—Chi-square; * α = 0.1; ** α = 0.05; *** α = 0.01. Source: own research results.
Table 8.
Attitudes of respondents towards turning left.
| TE | The evaluation of the innovative element in selected traffic situations. | |||||||
|---|---|---|---|---|---|---|---|---|
| V1_1 | V1_2 | V1_3 | V1_4 | V1_5 | V1_6 | V1_7 | ||
| MR | 1 | 120.24 | 121.35 | 123.13 | 121.21 | 117.19 | 119.97 | 122.13 |
| 2 | 119.55 | 117.46 | 114.13 | 117.72 | 125.29 | 120.06 | 116.00 | |
| M-W test (p-val.) | 0.939 | 0.668 | 0.320 | 0.677 | 0.369 | 0.992 | 0.492 | |
| NDK | V1_1 | V1_2 | V1_3 | V1_4 | V1_5 | V1_6 | V1_7 | |
| MR | 3 | 121.83 | 129.68 | 118.63 | 116.61 | 120.24 | 120.67 | 118.29 |
| 4 | 106.09 | 108.53 | 122.93 | 137.28 | 119.49 | 118.57 | 123.68 | |
| M-W test (p-val.) | 0.058* | 0.076* | 0.668 | 0.053* | 0.936 | 0.822 | 0.554 | |
Note: MR—Mean rank; M-W test—Mann-Whitney test; TE—Type of employment ; NDK—number of kilometers driven ; 1—Primary employment status ; 2—No employment status ; 3—Within 60,000 km ; 4—More than 60,000 km; * α = 0.1; ** α = 0.05; *** α = 0.01. Source: own research results.
Disclaimer/Publisher’s Note: The statements, opinions and data contained in all publications are solely those of the individual author(s) and contributor(s) and not of MDPI and/or the editor(s). MDPI and/or the editor(s) disclaim responsibility for any injury to people or property resulting from any ideas, methods, instructions or products referred to in the content. |
© 2023 by the authors. Licensee MDPI, Basel, Switzerland. This article is an open access article distributed under the terms and conditions of the Creative Commons Attribution (CC BY) license (http://creativecommons.org/licenses/by/4.0/).
Copyright: This open access article is published under a Creative Commons CC BY 4.0 license, which permit the free download, distribution, and reuse, provided that the author and preprint are cited in any reuse.


