
Submitted:
16 October 2025
Posted:
17 October 2025
You are already at the latest version
Abstract
The rapid advancement of Advanced Driver Assistance Systems (ADAS) is reshaping the future of mobility by offering potential improvements in safety, efficiency, and driving experience, yet consumer acceptance remains uneven across regions. This study ad-dresses the gap in knowledge and trust by examining how Hungarian drivers, as part of the Central and Eastern European context, perceive and adopt ADAS technologies. To achieve this, we conducted two expert in-depth interviews to refine the research in-strument, followed by an online survey of 179 drivers. Using k-means cluster analysis, we identified three distinct consumer segments: Conservative Controllers, who demonstrate low levels of trust and willingness to adopt ADAS; Cautious Adopters, who weigh costs and benefits carefully; and Pragmatic Innovators, who are open to experimentation and display the highest acceptance and willingness to pay. The results reveal that awareness and familiarity strongly influence acceptance, highlighting the role of consumer educa-tion and transparent communication in shaping adoption. The findings suggest that manufacturers, driving schools, and policymakers can accelerate the diffusion of ADAS by developing targeted strategies tailored to different consumer groups. Strengthening knowledge and trust in these systems will not only support their market success but also contribute to safer, more sustainable transportation.
Keywords:
advanced driver assistance systems
; ADAS
; cluster analysis
; consumer behavior
; driving behavior
; Central and Eastern Europe
; mobility innovation
1. Introduction
Advanced Driver Assistance Systems (ADAS) have the potential to significantly transform driving by incorporating various automation functions designed to improve safety and reduce the number of collisions. While ADAS can relieve some of the driver’s workload, the current maximum level of automation still requires full driver attention [1]. According to a survey conducted in 2021, 57% of people in Hungary have a driving license, and an additional 25% plan to obtain one soon. Only 18% of respondents do not have a driving license and do not intend to get one [2]. Additionally, the number of driving schools in Hungary increased from 626 in 2020 to 692 in 2021 [3]. Road traffic accidents involving personal injury fluctuated between 2010 and 2022. Notably, in 2020, there was a significant decrease in accidents, dropping from 16,600 in 2019 to 13,800. However, by 2022, the number of accidents had risen again to 14,700 [4]. ADAS may help address the expanding need for road safety in a nation where driving is bound to become increasingly common. For instance, forward collision warning systems have been shown to reduce the frequency of accidents [5]. Another highly useful feature is the Automatic Emergency Braking (AEB) system, which has led to great improvements in safety, reducing rear-end crashes by 50% [6,7]. Consumers must understand these features and their strengths and weaknesses to benefit from ADAS. To reduce the number of breakdowns and accidents, consumers need to purchase vehicles with automation, use and adopt these features, and monitor them [1]. Driver performance improves when individuals have a better conceptual understanding of automated systems and comprehend the systems’ reasoning [8]. Over the last ten years, EU institutions have actively promoted ADAS policy and research. On July 7, 2010, Directive 2010/40/EU was adopted to accelerate the deployment of innovative transport technologies in Europe. The EU is encouraged to introduce proven safe systems as soon as possible and to develop systems that promise significant safety improvements in the long term. Vehicle safety is a key objective for the European Union, and achieving this requires meeting many technical and performance goals. The European Commission’s Cars 21 strategy envisions a technologically leading automotive industry where vehicle safety can be improved. EuroNCAP is taking on a new role in assessing the quality of e-safety systems and exploring new ways to incorporate accident avoidance technologies. As intelligent safety systems, ADAS promise improvements from accident avoidance to severity reduction and post-accident phases. An effective methodology for ADAS is essential for improving road safety. Unfortunately, such a methodology has yet to be perfectly developed. Research in the EU has shown that certain interventions, such as intelligent speed adaptation or electronic stability control, can significantly contribute to safety objectives [9]. Determining the efficacy of other ADAS in improving the driving experience will require additional investigation. The European Union actively promotes ADAS adoption as part of its Vision Zero strategy, which aims to eliminate road fatalities by 2050 [9]. The Intelligent Transport Systems (ITS) Directive (Directive 2010/40/EU) supports the deployment of advanced vehicle technologies, mandating that new cars include specific ADAS features by 2024 [10]. These regulations are expected to accelerate consumer exposure and acceptance of ADAS, making it essential to understand current market segmentation patterns, as presented in this study. However, previous research indicates that ADAS awareness and acceptance levels vary significantly across Europe. For instance, Boelhouwer et al. (2020) [11] found that in the Netherlands, ADAS adoption is strongly influenced by structured information campaigns and incentives, whereas in Central and Eastern European countries, including Hungary, there is still a notable gap in consumer knowledge and trust in these technologies.
As ADAS become increasingly widespread, it is important to assess consumer acceptance and attitudes toward these technologies. The acceptance of new technological innovations can depend on several factors, one of which is the ability of these technologies to address significant issues, such as human error in driving. Human error is the leading cause of road accidents. For example, Singh (2015) [12] found that 94% of accidents between 2005 and 2007 were caused by human error, based on an examination of 5,471 crashes. Properly used, semi-automated and automated collision avoidance systems can help make such occurrences less likely. Systems that warn drivers and physically intervene, such as automatic braking, are particularly effective in improving road safety [7]. However, over-reliance on automation systems can be problematic. Drivers must understand these technologies’ benefits and limitations to avoid potential negative effects [13].
Building on these considerations, there remains a need to better understand how consumers in Central and Eastern Europe perceive and adopt ADAS technologies, where knowledge gaps and mistrust are still prevalent compared to Western Europe. Despite regulatory efforts and the proven safety benefits of these systems, limited awareness and varying attitudes may hinder widespread adoption. Addressing this gap, the present study investigates Hungarian drivers’ acceptance of ADAS, with a particular focus on identifying consumer segments that differ in their levels of trust, familiarity, and willingness to adopt. By applying a cluster analysis approach, this research not only contributes to the literature on technology acceptance in the mobility domain but also offers practical insights for policymakers, driving schools, and manufacturers seeking to accelerate the safe and sustainable diffusion of ADAS.
2. Theoretical Background
2.1. Acceptance of Advanced Driver Assistance Systems
The acceptance of Advanced Driver Assistance Systems (ADAS) has been widely examined through established theoretical models of technology adoption. Among the most commonly applied are the Technology Acceptance Model (TAM) [14], the Theory of Planned Behavior (TPB) [15], and the Unified Theory of Acceptance and Use of Technology (UTAUT) [16]. These models provide structured frameworks for explaining how perceived usefulness, ease of use, attitudes, social influence, and behavioral control shape users’ willingness to adopt technological innovations.
Several empirical studies have adapted these models to the context of ADAS. Rahman et al. (2017) [17] investigated whether models related to technology acceptance are appropriate tools for assessing the acceptance of ADAS. The results showed that TAM, Theory of Planned Behavior (TPB), and UTAUT models were able to predict behavioral intention to use ADAS. Among the models, TAM model performed best, explaining 82% of the variability in behavioral intention. The research included an experiment using a driving simulator and an online survey. Participants in the driving simulator experiment showed significantly higher intention to use ADAS than those who participated in the online survey. It can be inferred that the practical (simulator) trial, where participants were able to interact with these systems, led to a better understanding and greater acceptance [17].
Demographic characteristics have also been identified as relevant factors in ADAS acceptance. Greenwood et al. (2022) [1] conducted a study with 634 licensed drivers and reported that younger males exhibited the highest levels of confidence and acceptance toward ADAS. Such findings indicate that adoption patterns may differ systematically across age and gender groups, underscoring the importance of consumer segmentation when examining technology diffusion.
Beyond demographic variables, awareness and knowledge play a crucial role in shaping trust and acceptance. Awareness and trust are often interlinked, with the direction of influence depending on users’ level of experience. DeGuzman and Donmez (2021a) [18] found that while familiarity with adaptive cruise control (ACC) has improved over the past decade, many drivers remain misinformed about system capabilities and limitations. Their studies revealed an interesting asymmetry: non-owners of ACC and lane-keeping assist (LKA) systems tended to become more skeptical as their knowledge increased, reflecting heightened awareness of potential risks and failures. By contrast, owners of such systems demonstrated higher confidence as familiarity increased, suggesting that direct usage can counterbalance concerns and foster greater trust [19]. Reagan et al. (2023) [13] conducted a questionnaire on the awareness and understanding of ADAS based on a sample of 852 people. The study aimed to compare confidence, knowledge, and awareness between owners of new and used vehicles. The results showed that new car buyers were more aware of ADAS than those who bought used cars. Based on their findings, the researchers recommend that system designers simplify and facilitate these systems to increase acceptance and widespread adoption. Despite often being uninformed or misinformed about automation systems, drivers recognize the importance of learning about them. They prefer to obtain information through personal experience and various online portals not official sources [20].
Taken together, these findings suggest that ADAS acceptance cannot be explained by technological factors alone. Instead, it is the interplay of theoretical acceptance determinants (e.g., usefulness, ease of use), demographic profiles, and experiential knowledge that shapes consumers’ trust and willingness to adopt. Understanding these dynamics is essential for tailoring effective communication and education strategies aimed at accelerating ADAS adoption across diverse consumer groups.
2.2. ADAS in the Context of Future Mobility and Sustainability
ADAS are embedded in the broader paradigm shift driven by future mobility and sustainability goals. ADAS are not merely technical features but strategic components in a transport ecosystem where digitalization, connectivity, and automation converge to enhance safety, efficiency, and environmental performance. Within European policy, the integration of ADAS into Intelligent Transport Systems (ITS) is already central. The most recent amendment of the ITS Directive (Directive (EU) 2023/2661) aims to adapt the framework to new mobility services, particularly connected and automated mobility, while ensuring that critical traffic-related data, such as speed limits and dynamic road conditions, are made digitally available to vehicles and infrastructure systems [21]. This integration allows ADAS to interact with infrastructure, process real-time traffic information, and dynamically adapt to changing environments, thus linking individual vehicles to system-level mobility innovation.
From a sustainability perspective, ADAS contribute in three main domains: safety, environmental performance, and traffic efficiency. Regarding safety, projections by Aleksa et al. (2024) [22] suggest that in Austria, the large-scale implementation of selected ADAS features could prevent up to 8,700 crashes and 70 fatalities by 2040, corresponding to an overall crash reduction of 8%. In terms of environmental performance, Samad (2024) [23] assessed ADAS in the context of electric vehicles and emphasized that while sensor systems and onboard data processing generate additional energy demand, the net benefits in crash avoidance, smoother driving cycles, and reduced energy consumption outweigh these costs. Finally, in terms of traffic efficiency, ADAS can support smoother acceleration and braking patterns, reducing stop-and-go traffic, mitigating congestion, and enabling more efficient use of existing infrastructure.
However, these benefits are not uniformly realized across Europe. In Western European countries, structured campaigns and regulatory incentives have fostered greater public trust and willingness to adopt ADAS. In contrast, in Central and Eastern European contexts, including Hungary, levels of awareness and willingness to pay remain significantly lower [24]. This disparity underlines the need for targeted educational and policy interventions to ensure that the safety and sustainability benefits of ADAS are more evenly distributed across regions.
Finally, ADAS serve as critical stepping stones toward higher levels of vehicle automation. While current systems correspond mainly to SAE Levels 1–2, their diffusion prepares consumers, industries, and regulators for the transition toward Levels 3–4. As Digitaleurope (2025) [25] highlights, the gradual pathway from assisted driving to autonomous mobility depends on fostering consumer familiarity and trust with ADAS as intermediate technologies. Therefore, understanding consumer acceptance of ADAS is not only relevant for immediate safety and sustainability objectives but also strategically significant for ensuring societal readiness for fully autonomous and sustainable mobility ecosystems.
3. Materials and Methods
3.1. Research Design and Objectives
The present study was designed to address a central research problem: although ADAS offer substantial potential to improve traffic safety and driving efficiency, consumer acceptance remains uneven, particularly in Central and Eastern European countries. Limited awareness and trust may hinder the effective diffusion of these technologies. To contribute to closing this gap, the study focused on Hungarian drivers as a case within the regional context. Accordingly, the study was guided by the following research question (RQ):
- How accepting and knowledgeable are Hungarian drivers about ADAS, and how can they be segmented based on their attitudes, trust, and willingness to adopt these technologies?
To answer this question, the research pursued three main objectives:
- To explore drivers’ awareness, trust, and attitudes toward ADAS.
- To identify distinct consumer segments through cluster analysis based on their acceptance patterns.
- To derive practical implications for policymakers, driving schools, and manufacturers to accelerate the safe and sustainable adoption of ADAS.
The overall research design followed a mixed-method approach, combining qualitative and quantitative methods in consecutive phases. Figure 1 illustrates the methodological structure of the study. The process began with a literature review to establish the theoretical background, followed by in-depth interviews with domain experts to refine the research instrument. Subsequently, a questionnaire survey was conducted with a representative sample of drivers, and the data were analyzed using k-means cluster analysis.
3.2. Data Collection and Questionnaire Design
The empirical data collection was conducted in two stages. First, two semi-structured expert interviews were carried out to refine the content and clarity of the questionnaire. One interview involved a driving school instructor, who provided insights into training practices, challenges faced by novice drivers, and the potential role of ADAS in the learning process. The other interview was conducted with an automotive engineer working in ADAS development, who contributed technical expertise and highlighted common misconceptions among users. Both interviews lasted approximately 90 minutes and were instrumental in validating the relevance and comprehensibility of the survey items.
Building on the insights from the expert phase, an online questionnaire was developed and distributed between February 25 and March 14, 2024. The survey targeted Hungarian drivers and resulted in 179 valid responses. Participation was voluntary and anonymous, and respondents were informed about the purpose of the study before completing the questionnaire.
The questionnaire was designed to capture demographic characteristics, travel and driving habits, familiarity with ADAS, and attitudes toward ADAS adoption. It consisted of three demographic questions, two questions related to travel behavior, one question on familiarity with ADAS, and thirty-three attitudinal statements regarding ADAS acceptance derived from the core constructs in TAM, TPB, and UTAUT models. These were measured on a 5-point Likert scale (from “strongly disagree” to “strongly agree”). The estimated completion time was approximately 15–20 minutes.
Table 1 summarizes the structure of the questionnaire, including the main topics, number of questions, measurement scales, and key references used in their development.
Table 2 maps each attitudinal statement to its underlying construct and lists the corresponding item identifiers used in the survey. The six constructs capture core dimensions of ADAS acceptance—Perceived Usefulness/Expectancy, Perceived Ease of Use/Effort Expectancy, Trust and Control, Behavioral Intention and Attitude, Perceived Cost and Value, and Innovativeness and Risk Propensity. This mapping guided both the scale reliability assessment and the subsequent clustering by ensuring that conceptually related items were grouped consistently. All reverse-keyed items within the listed questions were recoded prior to analysis so that higher scores uniformly indicate more favorable evaluations of ADAS.
3.3. Data Analysis
The data collected through the online survey were processed and analyzed using IBM SPSS Statistics 29.0. Prior to analysis, the dataset was screened for missing values and outliers. Cases with incomplete responses were excluded, resulting in 179 valid entries. Descriptive statistics were first computed to summarize the demographic profile of respondents, their driving habits, and their self-reported familiarity with ADAS. To assess the reliability of the questionnaire, internal consistency was evaluated using Cronbach’s alpha for the attitudinal items. Values above the commonly accepted threshold of 0.70 were considered indicative of acceptable reliability. Exploratory checks of item distributions were also performed to ensure suitability for further analysis.
Subsequently, a k-means cluster analysis was applied to the 33 attitudinal items measuring acceptance of ADAS. This unsupervised learning technique was chosen to identify latent consumer segments based on similarities in their responses. The number of clusters was determined by comparing solutions with varying k values and evaluating interpretability, cluster size balance, and variance explained. The final solution provided three distinct consumer groups: (1) Conservative Controllers, (2) Cautious Adopters, and (3) Pragmatic Innovators. For segmentation, we applied k-means clustering (k-means++ initialization) to the 33 standardized items and evaluated solutions for k = 2…6. Model selection followed a multi-criteria strategy using (i) within-cluster sum of squares (SSE; elbow), (ii) Silhouette, (iii) Calinski–Harabasz (CH), and (iv) Davies–Bouldin (DB) indices. As a stability/robustness check, we compared the retained k-means solution against an independent Ward hierarchicalclustering using the Adjusted Rand Index (ARI). The corresponding indices and stability metric are reported in Results (Table 2 and Table 3), where a three-cluster configuration is retained based on the combined evidence.
Between-cluster differences on non-clustering variables (e.g., familiarity, willingness-to-pay, demographics) were examined with standard comparative statistics (parametric or non-parametric as appropriate) and reported alongside effect sizes in the Results section.
4. Results
This section presents the comprehensive findings of our research. It includes detailed insights from the in-depth interviews, which provided qualitative data on expert opinions and current practices related to ADAS. Additionally, it covers the outcomes of the questionnaire, which gathered quantitative data from a broad sample of automobile drivers.
4.1. Expert In-Depth Interview
In-depth interviews with experts provided a detailed understanding of ADAS, identified key issues and concerns, and facilitated the validation of the questionnaire. After consulting the first expert, an initial version of the questionnaire was developed. This version was further refined with the help of the second expert. Based on the feedbacks, the questionnaire underwent several revisions to improve clarity and relevance. The second part of the in-depth interviews focused on current driver training and practical training. According to the driving instructor, combining classroom and online education for driver training would lead to more efficient learning and thorough preparation in Hungary. He believes classroom-based teaching is more effective for explaining the rules and teaching the foundational driving concepts, providing a structured and interactive environment. On the other hand, online training is more effective for practicing and reinforcing this knowledge through simulations and self-paced learning. He noted that a similar hybrid system is used in Austria, where it has shown positive results.
Regarding the practical driving exam, he explained that abolishing the routine exam impacted students’ practical preparation negatively. In Hungary, the routine test used to require learners to demonstrate on a closed course their ability to handle various standardised driving tasks under controlled conditions. After the routine test, they could only take the test in traffic. Its removal means students have less structured practice before facing the final traffic test. He argued that 30 practical hours are insufficient for passing the traffic test. Based on his practical experience, he believes that at least 60-70 hours of driving practice are necessary to acquire the skills and knowledge to pass the test. This extended practice time would allow students to become more proficient and confident in their driving abilities, better preparing them for real-world driving situations. Instructors are divided on the use and teaching of ADAS. Some are conservative, opting to train students on cars with minimal ADAS functionality. In contrast, more open-minded instructors use cars equipped with some ADAS to help learners pass the test. However, these instructors believe ADAS should not be utilized during the examination. One instructor elaborated on the current traffic rules system, describing it as outdated and needing renewal.
4.2. Cluster Validation and Model Selection
K-means solutions for k=2 to k=6 on z-standardized ADAS-acceptance items (sporadic missings median-imputed; reverse-keyed items recoded prior to scoring) were evaluated. Model selection combined complementary diagnostics: within-cluster sum of squares (SSE, “elbow”), Silhouette, Calinski–Harabasz (CH), and Davies–Bouldin (DB) (Table 3).
While k=2 achieved the highest mean Silhouette, the three-cluster configuration provided a superior trade-off between compactness and interpretability, with balanced group sizes and coherent profiles (n = 95, 32, 52). The SSE curve shows diminishing returns beyond k=3, and changes in CH/DB likewise indicate no substantial gains from additional clusters.
Stability/robustness was examined by comparing the k-means (k=3) labels with an independent Ward’s hierarchical solution; the Adjusted Rand Index (ARI) = 0.234 indicates low-to-moderate structural agreement, which is typical for high-dimensional attitudinal data where clusters are fuzzy rather than perfectly separated. As a prerequisite for segmentation, the 33-item acceptance scale demonstrated good internal consistency (Cronbach’s α = 0.862), supporting reliable measurement before clustering. Taken together, the multi-criteria evidence (elbow, Silhouette, CH, DB), the stability check (ARI), and the scale reliability (α) justify retaining three clusters as a parsimonious and defensible segmentation of ADAS acceptance (Table 4).
4.3. Demographic Data of the Online Survey Respondents
The questionnaire asked respondents for demographic information such as gender, age, and education.
Table 5 shows the demographic distribution of participants. The gender distribution was roughly similar, with 45% male and 55% female respondents. Regarding age, a larger proportion of the survey participants were young adults between 18 and 23. The second highest proportion, 21%, was of participants aged between 24 and 29. Thus, the majority of the sample is made up of Generation Z individuals. Furthermore, since most respondents were University students belonging to Generation Z, most only had a high school diploma and were pursuing a university education.
Figure 2 shows the distribution of participants’ travel habits, illustrated by a pie chart. The largest proportion of participants, 47%, travel by car or motorbike daily, followed by 30% who use public transport. Additionally, 19% of respondents use public transport and a car or motorbike equally.
Figure 3 shows the distribution of the respondents to the questionnaire in terms of driving licenses. Despite most of the sample being young, 85% have a category B license—that which is required to operate a personal car in Hungary. Only 7% of the respondents do not have a driving license.
Figure 4 shows the level of participants’ self-reported knowledge of ADAS. Participants were asked to rate their level of familiarity on a 5-point Likert scale. The results show considerable variation. Nearly a quarter (24%) of the respondents consider themselves very ignorant of ADAS, while only 12% believe they have a maximum level of knowledge. The highest proportion of participants, 25%, rated their knowledge as intermediate.
4.4. Cluster Analysis
To evaluate the questionnaire, we conducted k-means clustering, identifying three distinct groups: (1) Conservative Controllers, (2) Cautious Adopters, and (3) Pragmatic Innovators.
4.4.1. Cluster 1—Conservative Controllers
Table 6 shows the average values of the first cluster in increasing order for the 33 attitude statements.
The first cluster includes participants who are the least open to ADAS. This group contains 21 participants, the fewest compared to the other two clusters. This group scored the highest averages on attitude statements where distrust was expressed. The attitude statement (Question 1) scored 4.10. This finding suggests that these individuals are more confident in their own driving abilities than in cars with ADAS. Furthermore, this cluster is unwilling to pay extra for ADAS, as they believe the benefits do not justify the expense. These participants are generally more skeptical of new technologies and are the last to try them. Overall, members of the first cluster show risk-averse attitudes, distrust ADAS, and want full control over their vehicles (Table 6).
4.4.2. Cluster 2—Cautious Adopters
Table 7 shows the average values of the second cluster in increasing order for the 33 attitude statements.
The second cluster has the highest number of participants, with 99 people in total. These individuals are moderately open to the introduction and use of new technologies, including ADAS. Unlike the first cluster, they weigh the costs and benefits of ADAS rather than rejecting the technology outright. Despite their interest in new technology, they are characterized by caution and uncertainty. The highest-rated attitude statement, with a mean score of 3.74 was Question 1. This cluster is more willing to pay for ADAS than the first, but not as much as the third cluster. In terms of accepting new technologies, members of the second cluster, although interested, do not consider themselves pioneers. They prefer to adopt these technologies once others have tried and tested them and can be reliably applied. Furthermore, for this cluster, the simple and user-friendly presentation of these systems is very important (Table 7).
4.4.3. Cluster 3—Pragmatic Innovators
Table 8 shows the average values of the third cluster in increasing order for the 33 attitude statements.
The final cluster group consists of 59 participants and was found to be the most open and accepting of the three groups toward ADAS. They have the lowest mean scores for negative attitude statements about ADAS, such as Question 5, which had a mean score of 2.69. This cluster perceives ADAS as potentially improving safety and efficiency, giving a mean value of 4.32 for Question 29. The overall high mean values of the third cluster reflect that these participants recognize the practical benefits of the technology and believe it could be useful for them. They are open to innovation and willing to experiment with new things. In contrast to the first cluster, the third cluster would be the first to try new technologies and have a more positive view of ADAS. Similar to the second cluster, they also want the system to be easy to use and transparent. On measures of willingness to pay a premium for ADAS, this group scored 3.90—the highest of any cluster (Table 8).
Figure 5 shows the distribution of the three cluster groups. The first cluster, the conservative thinkers, are the smallest with 21 people, they are also visibly further away from cluster groups 2 and 3 in terms of distribution. Most participants are in the second cluster group with 99 participants who are accepting of ADAS technology but have concerns about it. This cluster group is closer to cluster 3, who in turn are considered pioneers in terms of acceptance, with 59 participants.
Table 9 shows the overall average of the total acceptance attitude statements and familiarity for each cluster, along with the number of cluster items (participants). The attitude statements also included inverted questions, whose values were adjusted to calculate the average values. Overall, the three levels of acceptance appear to be distinct. Based on the values of the three cluster groups, the first cluster can be described as more rejecting, the second as moderately accepting, and the third as more accepting of technology.
4. Discussion
The in-depth expert interviews revealed a significant lack of acceptance and knowledge regarding ADAS among consumers and drivers in Hungary. Specifically, the interviews indicated that neither driving schools nor car dealers provide adequate information about these systems. The results of the questionnaire largely confirmed our preliminary assumptions: consumers are reluctant to buy vehicles equipped with ADAS. These findings align with the literature, which indicates that lower trust levels correlate with decreased willingness to use ADAS [29]. Additionally, Moon et al. (2023) [30] found mixed acceptance among consumers, noting that fast and efficient system operation positively influences acceptance.
The cluster analysis identified three distinct groups with varying acceptance of ADAS. The first group, Conservative Controllers, has an average acceptance score of 2.30. These individuals are reluctant to relinquish driving control to an automated system, preferring to maintain control of the vehicle themselves, indicating a generally low level of trust in ADAS. In contrast, the second cluster, Cautious Adopters, shows a moderate level of acceptance with an overall mean attitude score of 2.99. This group is the largest, comprising 99 participants, and reflects a more balanced view, weighing the pros and cons of ADAS before adoption. Finally, the third cluster, Pragmatic Innovators, is the most accepting of ADAS, with a mean score of 3.52. They are more open to innovation and willing to experiment with new technologies, demonstrating a higher confidence level in the benefits of ADAS. These segmentation trends are consistent with earlier research on the deployment of ADAS throughout Europe. Due to more comprehensive public awareness campaigns and organized education programs on vehicle automation, for example, surveys conducted in Germany and the Netherlands show a typically better degree of trust in ADAS [11]. Hungary and other Central and Eastern European nations, on the other hand, show greater mistrust, probably as a result of less manufacturer-led programs meant to raise customer familiarity and less exposure to ADAS in driving education.
The pattern that segments with higher self-reported familiarity also exhibit higher acceptance is consistent with prior evidence that stronger knowledge and trust are linked to greater intention to use assistance functions [29], while sensitivity to perceived performance and responsiveness of the system also shapes attitudes (Moon et al., 2023) [30]. When contrasted with Western European studies, particularly those from Germany and the Netherlands, our results align with reports of higher trust where structured public information, training, and dealership demonstrations are common, whereas Central and Eastern European samples, including Hungary, more often display hesitation that is associated with lower exposure to assistance features in driver education and fewer manufacturer or dealer programs at the point of sale [11]. Evidence from the United States typically describes a divide between groups that gain confidence after hands on trials during test drives and groups that remain unsure without guided experience, which maps onto our intermediate segment that moves with credible proof rather than early enthusiasm, while studies from East Asia frequently find that high technology familiarity and frequent interaction with in vehicle digital systems predict stronger acceptance, a pattern that resembles our most receptive segment.
Different cluster groups require different communication strategies. The first cluster, the rejectionists, will require the most time and effort to reach a level of acceptance where they are willing to use this technology, let alone pay a premium. Their distrust of technology gets in the way, unless the technology has already been widely accepted and adopted by others. They may favour features such as fail-safe or system override to give them a sense of control over the vehicle. The second cluster, more accepting but not fully aware of the technology’s greater positive or negative impacts, is easier to reach and address. They are likely to become more accepting if they know the security benefits. Given that they are price conscious, they seek value in what they buy and will be willing to adopt if the benefits are clearly communicated. The third cluster, the most accepting, would require the least effort. They have the highest willingness to pay and are the most accepting. They tend to adopt early, given that they seek innovative and novel products. Participants were also asked to indicate how well-informed they considered themselves to be about ADAS. The results suggest that the cluster group that considers itself the most informed is the most accepting, while the cluster group that considers itself the least informed is the least accepting. Table 10 synthesizes the three ADAS consumer segments, contrasting their trust in automation, control needs, willingness to pay, purchase intentions, and innovativeness.
5. Conclusions
This study examined the factors influencing ADAS adoption, revealing distinct consumer segments based on awareness and acceptance levels. The results provide insights into the challenges and opportunities of introducing these technologies, particularly in regions where consumer familiarity remains limited. The main contribution of the paper is a validated segmentation of drivers in Central and Eastern European context linked directly to measurable acceptance factors and supported by transparent diagnostics. The study integrates expert insight with survey evidence to produce a methodologically explicit pipeline from instrument refinement to clustering and validation. The novelty lies in offering a region specific and measurement grounded view of acceptance that moves beyond single score summaries, in documenting multi indicator model selection in a way that can be reproduced, and in showing how familiarity relates to acceptance within distinct segments that are actionable for policy and market practice.
The cluster analysis identified three groups with different attitudes towards ADAS. The first cluster demonstrated the lowest willingness to spend more on vehicles equipped with ADAS, with a score of 1.33 on this measure. They also consider themselves uninformed about ADAS, with a mean familiarity score of 2.52. The second cluster, the largest group, is moderately open to ADAS. These participants are cautious, considering practical and financial aspects before investing. On measures of willingness to pay a premium for vehicles equipped with ADAS, this group scored 2.79, demonstrating a moderate interest in the technology. They also had a higher awareness level than the first group. The third cluster is the most accepting of ADAS, willing to experiment with new technologies and confident in their benefits. This group has the highest familiarity score of 3.05 and scored 3.90 on measures of willingness to pay a premium for ADAS—the highest of any group.
In answering this paper’s research question, the results suggest that Hungarian drivers have a medium level of acceptance of ADAS. This relative lowness of this number is primarily due to a lack of awareness and limited practical experience with these systems. To ameliorate this problem, we recommend that driving schools include ADAS in their curricula and that car dealers properly inform their customers when they purchase such vehicles, thereby increasing road safety.
The study’s conclusions draw attention to important obstacles in the adoption of ADAS, especially the disparities in drivers’ understanding and acceptability. These findings probably apply not only to Hungary but also to the larger region of Central and Eastern Europe, where similar information gaps and mistrust of automation still exist. Targeted education and awareness initiatives are crucial to promoting broader acceptance. In order to address usability and reliability issues and guarantee that the advantages of ADAS are adequately conveyed, policymakers and industry stakeholders must collaborate. The shift to safer, tech-assisted driving might be accelerated and regional variations could be mitigated with a concerted effort throughout Europe.
Future research should expand the sample to multiple age groups and multiple countries in the region and should combine surveys with objectiv e knowledge tests to measure familiarity more precisely. Experimental or quasi experimental designs can test whether simulator training, dealership demonstrations, or curriculum changes produce measurable gains in trust, intention, and actual use. Discrete choice or conjoint experiments can estimate willingness to pay for bundles of assistance features, and longitudinal designs can track how attitudes translate into adoption and real world engagement with assistance functions. Linking survey data to telematics or usage logs, subject to ethics and consent, would further clarify the relationship between stated acceptance and behavior.
We recommend that researchers investigate where drivers can obtain the most effective information and identify the best sources to integrate ADAS into their driving practices properly. This research is limited by its sample size, so future studies should involve a larger sample to enhance the generalizability of the results. Another limitation is the demographic skew, as most participants were young adults, leaving other age groups underrepresented. Despite these limitations, this study provides valuable insights into Hungarian drivers’ attitudes and acceptance of ADAS. Researchers should address these gaps to develop comprehensive strategies that promote the widespread adoption and effective use of ADAS, ultimately enhancing road safety and driving experiences.
Managerial implications follow naturally from the segment profiles. For education authorities and driving schools, incorporating assistance literacy into theory classes and structured practice is likely to move the cautious middle segment and to lower uncertainty in the least trusting segment. For manufacturers and dealers, short guided demonstrations that show both benefits and limits and simple how to steps during test drives can convert interest into use, while clear messages about driver override and system boundaries address the concerns of hesitant drivers. Communication approaches may consider highlighting features that appeal to each segment: fail-safe, override, or deactivate features for conservative controllers; product value and benefits for cautious adopters; and premium, novel features for pragmatic innovators. For public agencies, targeted communication that quantifies expected safety benefits and encourages experience in low risk environments can accelerate safe diffusion and support progress toward road safety objectives.
In summary, the study provides evidence that acceptance of assistance systems in Hungary is segmented and that familiarity is a central lever. By aligning education, communication, and product trials with the needs of each segment, stakeholders can support safer and more effective use of assistance technologies and lay the groundwork for future mobility that is both practical and socially beneficial.
Author Contributions
Conceptualization, B.E.B., M.J., J.C.B. and R.K.; methodology, B.E.B. and R.K; software, R.K.; validation, B.E.B., M.J., J.C.B. and R.K.; formal analysis, R.K.; investigation, R.K.; resources, B.E.B; data curation, B.E.B.; writing—original draft preparation, B.E.B. and R.K.; writing—review and editing, B.E.B., J.C.B. and R.K.; visualization, R.K.; supervision, B.E.B., J.C.B. and M.J.; project administration, B.E.B.; funding acquisition, B.E.B. All authors have read and agreed to the published version of the manuscript.
Funding
This research received no external funding.
Institutional Review Board Statement
The study was conducted in accordance with the Declaration of Helsinki, and approved by the Scientific Advisory Board of SZÉCHENYI ISTVÁN UNIVERSITY (Decision Nr. SZE/ETT-28/2024 (XII.17.), 17 December 2024).
Informed Consent Statement
Informed consent was obtained from all subjects involved in the study.
Acknowledgments
During the preparation of this work, the author(s) used GPT-5 (OpenAI, 2025) to assist with wording and translation of selected passages. After using this tool, the author(s) thoroughly reviewed and edited the content as necessary and take full responsibility for the final version of the manuscript.
Conflicts of Interest
The authors declare no conflicts of interest.
References
- Greenwood, P.M.; Lenneman, J.K.; Baldwin, C.L. Advanced driver assistance systems (ADAS): Demographics, preferred sources of information, and accuracy of ADAS knowledge. Transp. Res. Part F Traffic Psychol. Behav. 2022, 86, 131–150. [Google Scholar] [CrossRef]
- Medve, S. Share of Hungarians owning a driver’s license in 2021. Available online: https://www.statista.com/statistics/1268060/hungary-share-of-people-with-a-driver-s-license/ (accessed on 10 July 2024).
- Medve, S. Number of driving schools in Hungary from 2019 to 2021. Available online: https://www.statista.com/statistics/1293462/hungary-number-of-driving-schools/ (accessed on 10 July 2024).
- Medve, S. Number of road traffic accidents causing personal injury in Hungary from 2010 to 2022. Available online: https://www.statista.com/statistics/1140359/hungary-road-traffic-accidents/ (accessed on 10 July 2024).
- Souders, D.J.; Charness, N.; Roque, N.A.; Pham, H. Aging: Older adults’ driving behavior using longitudinal and lateral warning systems. Hum. Factors 2020, 62, 229–248. [Google Scholar] [CrossRef] [PubMed]
- Spicer, R.; Vahabaghaie, A.; Bahouth, G.; Drees, L.; Martinez von Bülow, R.; Baur, P. Field effectiveness evaluation of advanced driver assistance systems. Traffic Inj. Prev. 2018, 19 (Suppl. 2), S91–S95. [Google Scholar] [CrossRef] [PubMed]
- Cicchino, J.B. Effectiveness of forward collision warning and autonomous emergency braking systems in reducing front-to-rear crash rates. Accid. Anal. Prev. 2017, 99, 142–152. [Google Scholar] [CrossRef] [PubMed]
- Nunes, A. The impact of automation use on the mental model: Findings from the air traffic control domain. Proc. Hum. Factors Ergon. Soc. Annu. Meet. 2003, 47, 66–70. [Google Scholar] [CrossRef]
- European Commission. CARS 21: A Competitive Automotive Regulatory System for the 21st Century. Final Report. 2006. Available online: https://tinyurl.com/yc3bp3p (accessed on 20 July 2024).
- SAE International. SAE Levels of Driving Automation™ Refined for Clarity and International Audience. 2021. Available online: https://www.sae.org/blog/sae-j3016-update (accessed on 20 July 2024).
- Boelhouwer, A.; Van den Beukel, A.P.; Van der Voort, M.C.; Hottentot, C.; De Wit, R.Q.; Martens, M.H. How are car buyers and car sellers currently informed about ADAS? An investigation among drivers and car sellers in the Netherlands. Transp. Res. Interdiscip. Perspect. 2020, 4, 100103. [Google Scholar] [CrossRef]
- Singh, S. Critical Reasons for Crashes Investigated in the National Motor Vehicle Crash Causation Survey (Report No. DOT HS 812 115). National Highway Traffic Safety Administration, 2015. Available online: https://crashstats.nhtsa.dot.gov/Api/Public/ViewPublication/812115 (accessed on 20 July 2024).
- Reagan, I.J.; Cicchino, J.B.; Teoh, E.R.; Cox, A.E. New and used vehicle buyers’ awareness, understanding, and trust in advanced driver assistance systems. Transp. Res. Part F Traffic Psychol. Behav. 2023, 92, 44–55. [Google Scholar] [CrossRef]
- Davis, F.D. Perceived usefulness, perceived ease of use, and user acceptance of information technology. MIS Q. 1989, 13, 319–340. [Google Scholar] [CrossRef]
- Al Maskari, A. Theory of Planned Behavior (TPB) Ajzen (1988). In Technology Adoption and Social Issues: Concepts, Methodologies, Tools, and Applications; IGI Global: Hershey, PA, USA, 2018; pp. 46–67. [Google Scholar]
- Venkatesh, V.; Morris, M.G.; Davis, G.B.; Davis, F.D. User acceptance of information technology: Toward a unified view. MIS Q. 2003, 27, 425–478. [Google Scholar] [CrossRef]
- Rahman, M.M.; Lesch, M.F.; Horrey, W.J.; Strawderman, L. Assessing the utility of TAM, TPB, and UTAUT for advanced driver assistance systems. Accid. Anal. Prev. 2017, 108, 361–373. [Google Scholar] [CrossRef] [PubMed]
- DeGuzman, C.A.; Donmez, B. Drivers still have limited knowledge about adaptive cruise control even when they own the system. Transp. Res. Rec. 2021, 2675, 328–339. [Google Scholar] [CrossRef]
- DeGuzman, C.A.; Donmez, B. Knowledge of and trust in advanced driver assistance systems. Accid. Anal. Prev. 2021, 156, 106121. [Google Scholar] [CrossRef] [PubMed]
- Nandavar, S.; Kaye, S.A.; Senserrick, T.; Oviedo-Trespalacios, O. Exploring the factors influencing acquisition and learning experiences of cars fitted with advanced driver assistance systems (ADAS). Transp. Res. Part F Traffic Psychol. Behav. 2023, 94, 341–352. [Google Scholar] [CrossRef]
- European Commission. Directive (EU) 2023/2661 amending Directive 2010/40/EU on the framework for the deployment of Intelligent Transport Systems. Off. J. Eur. Union. 2023. Available online: https://transport.ec.europa.eu/transport-themes/smart-mobility/road/its-directive-and-action-plan_en (accessed on 10 July 2024).
- Aleksa, A.; Fellendorf, M.; Mathew, J.K. Impact analysis of advanced driver assistance systems (ADAS) in Austria. Eur. Transp. Res. Rev. 2024, 16, 1–16. [Google Scholar] [CrossRef]
- Samad, M.A. Assessing the environmental impact of advanced driver assistance systems (ADAS) in electric vehicles. EasyChair Prepr. 2024. Available online: https://easychair.org/publications/preprint/LVSD (accessed on 10 July 2024).
- Zhang, L.; De Winter, J.C.F.; Stanton, N.A. Retrofit acceptance of advanced driver assistance systems: A cross-European survey. Transp. Res. Part F Traffic Psychol. Behav. 2024, 98, 94–110. [Google Scholar] [CrossRef]
- DIGITALEUROPE. Embracing the Future of Mobility. 2025. Available online: https://cdn.digitaleurope.org/uploads/2025/05/Embracing-the-future-of-mobility-DIGITALEUROPE.pdf (accessed on 10 July 2025).
- Chu, K.M. A consumer innovation resistance theory perspective on the advanced driver assistance systems. Econ. Res.-Ekon. Istraž. 2023, 36, (early view). [Google Scholar] [CrossRef]
- Harms, I.M.; Bingen, L.; Steffens, J. Addressing the awareness gap: A combined survey and vehicle registration analysis to assess car owners’ usage of ADAS in fleets. Transp. Res. Part A Policy Pract. 2020, 134, 65–77. [Google Scholar] [CrossRef]
- Kaye, S.A.; Nandavar, S.; Yasmin, S.; Lewis, I.; Oviedo-Trespalacios, O. Consumer knowledge and acceptance of advanced driver assistance systems. Transp. Res. Part F Traffic Psychol. Behav. 2022, 90, 300–311. [Google Scholar] [CrossRef]
- Yu, B.; Bao, S.; Zhang, Y.; Sullivan, J.; Flannagan, M. Measurement and prediction of driver trust in automated vehicle technologies: An application of hand position transition probability matrix. Transp. Res. Part C Emerg. Technol. 2021, 124, 102957. [Google Scholar] [CrossRef]
- Moon, C. An objective evaluation method for driver or passenger acceptance of an autonomous driving system for lane changes. Appl. Sci. 2023, 13, 9601. [Google Scholar] [CrossRef]
Figure 1.
Research design.
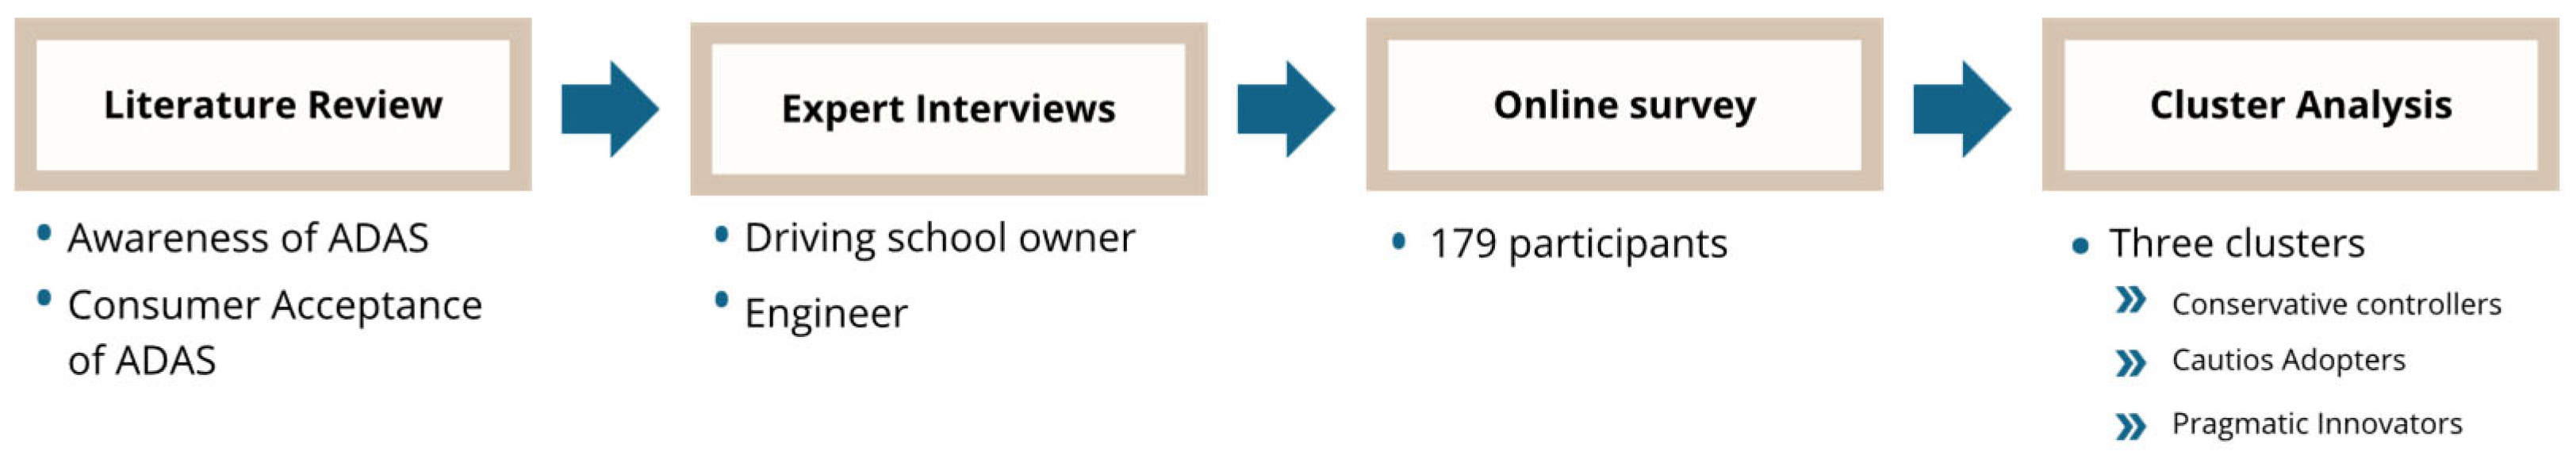
Figure 2.
Travel Habits of the Respondents.
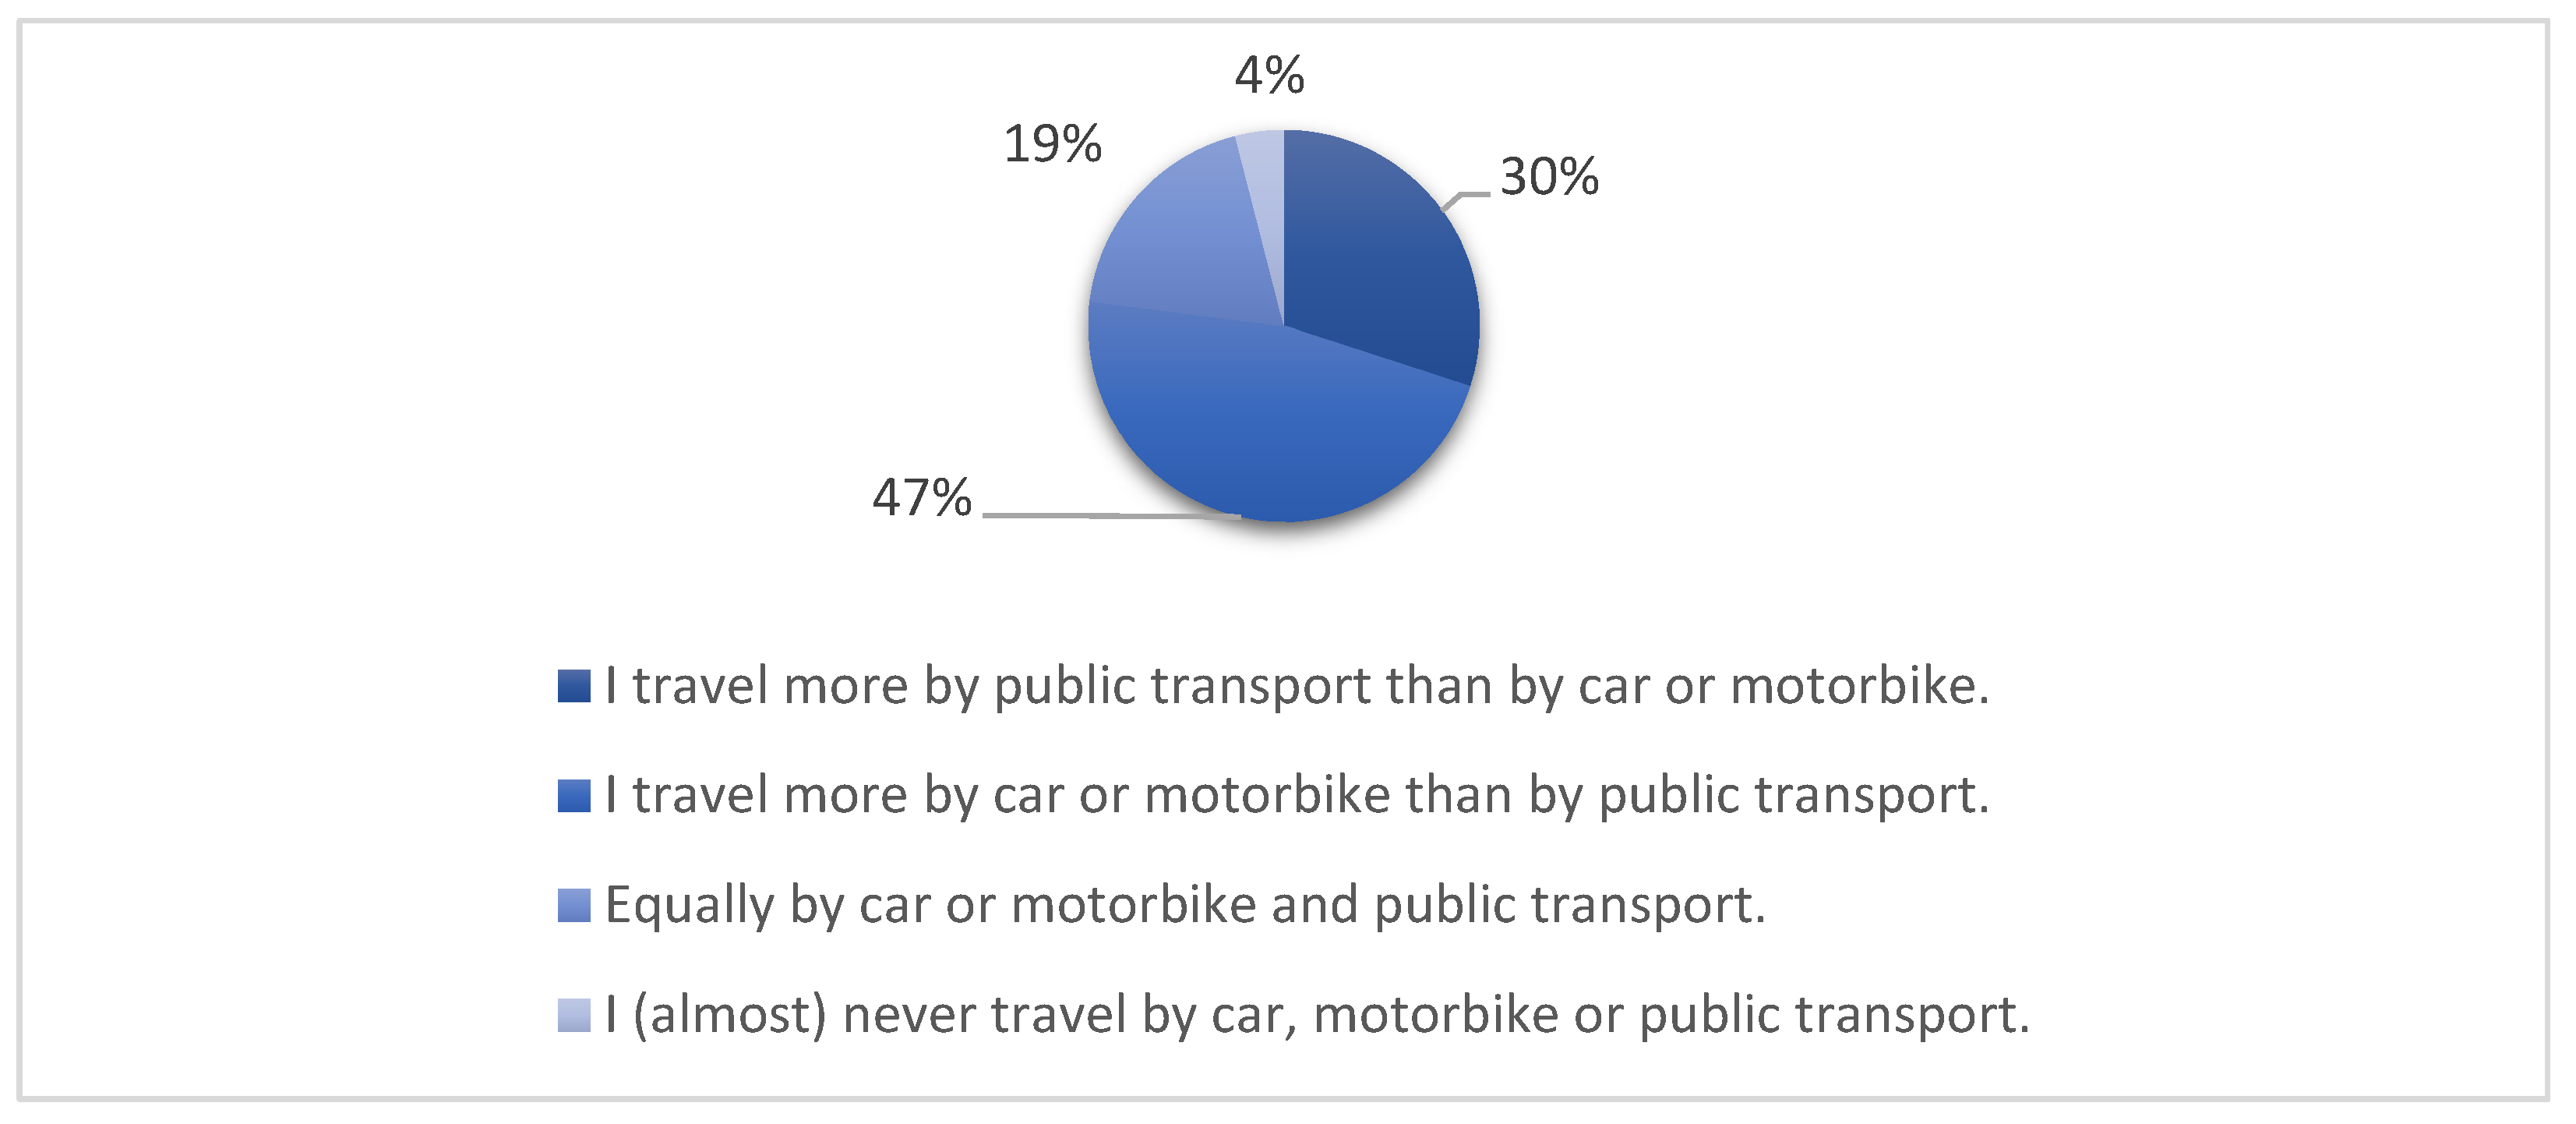
Figure 3.
Percentage of People with a Driving License.
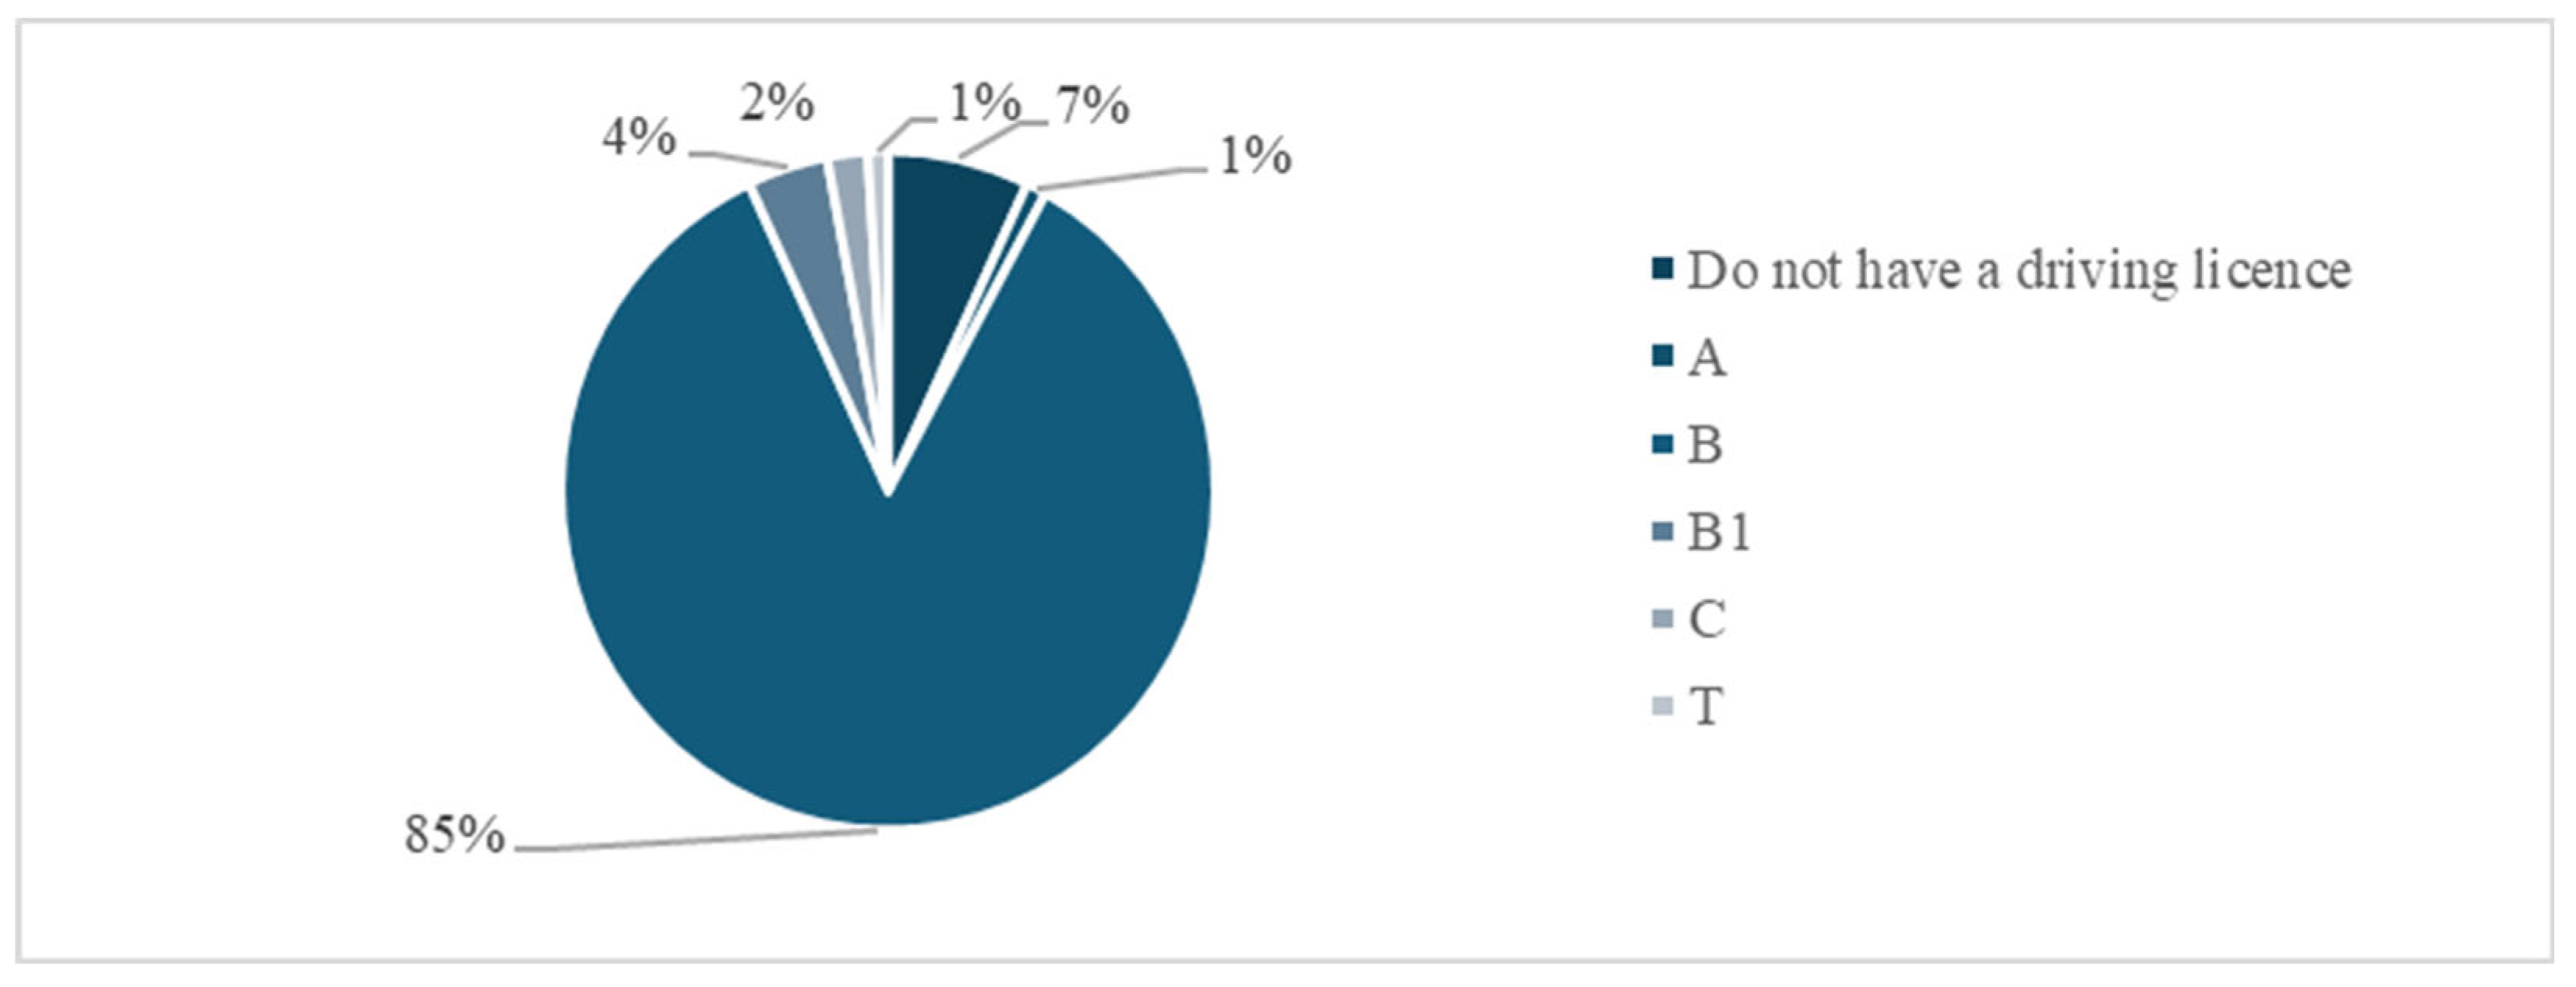
Figure 4.
Familiarity with ADAS.
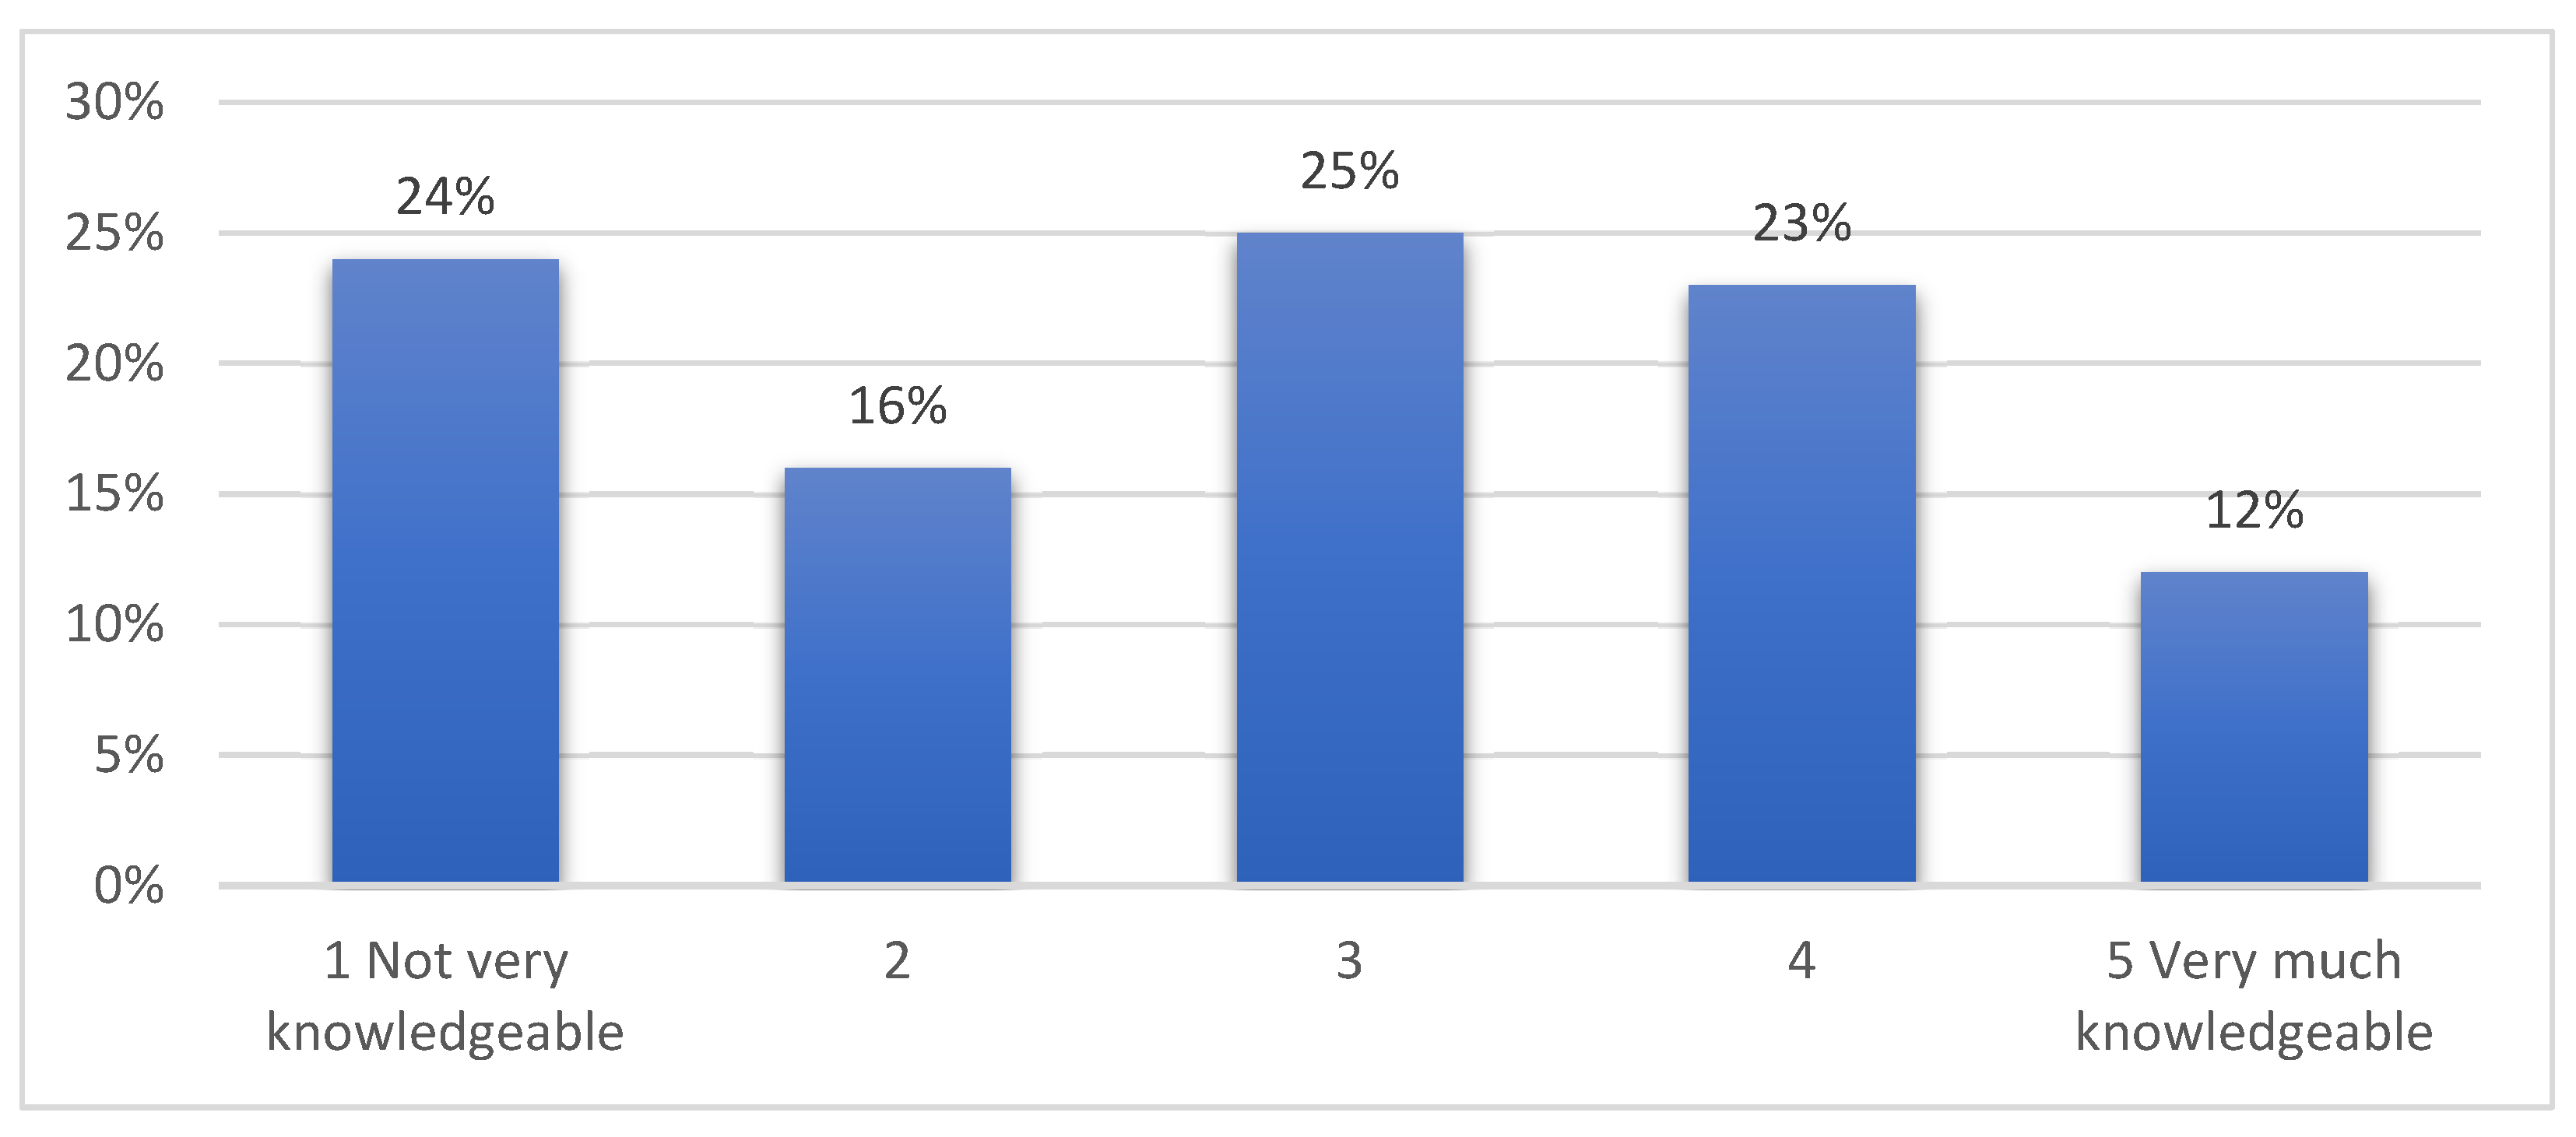
Figure 5.
Distribution of the three cluster groups.
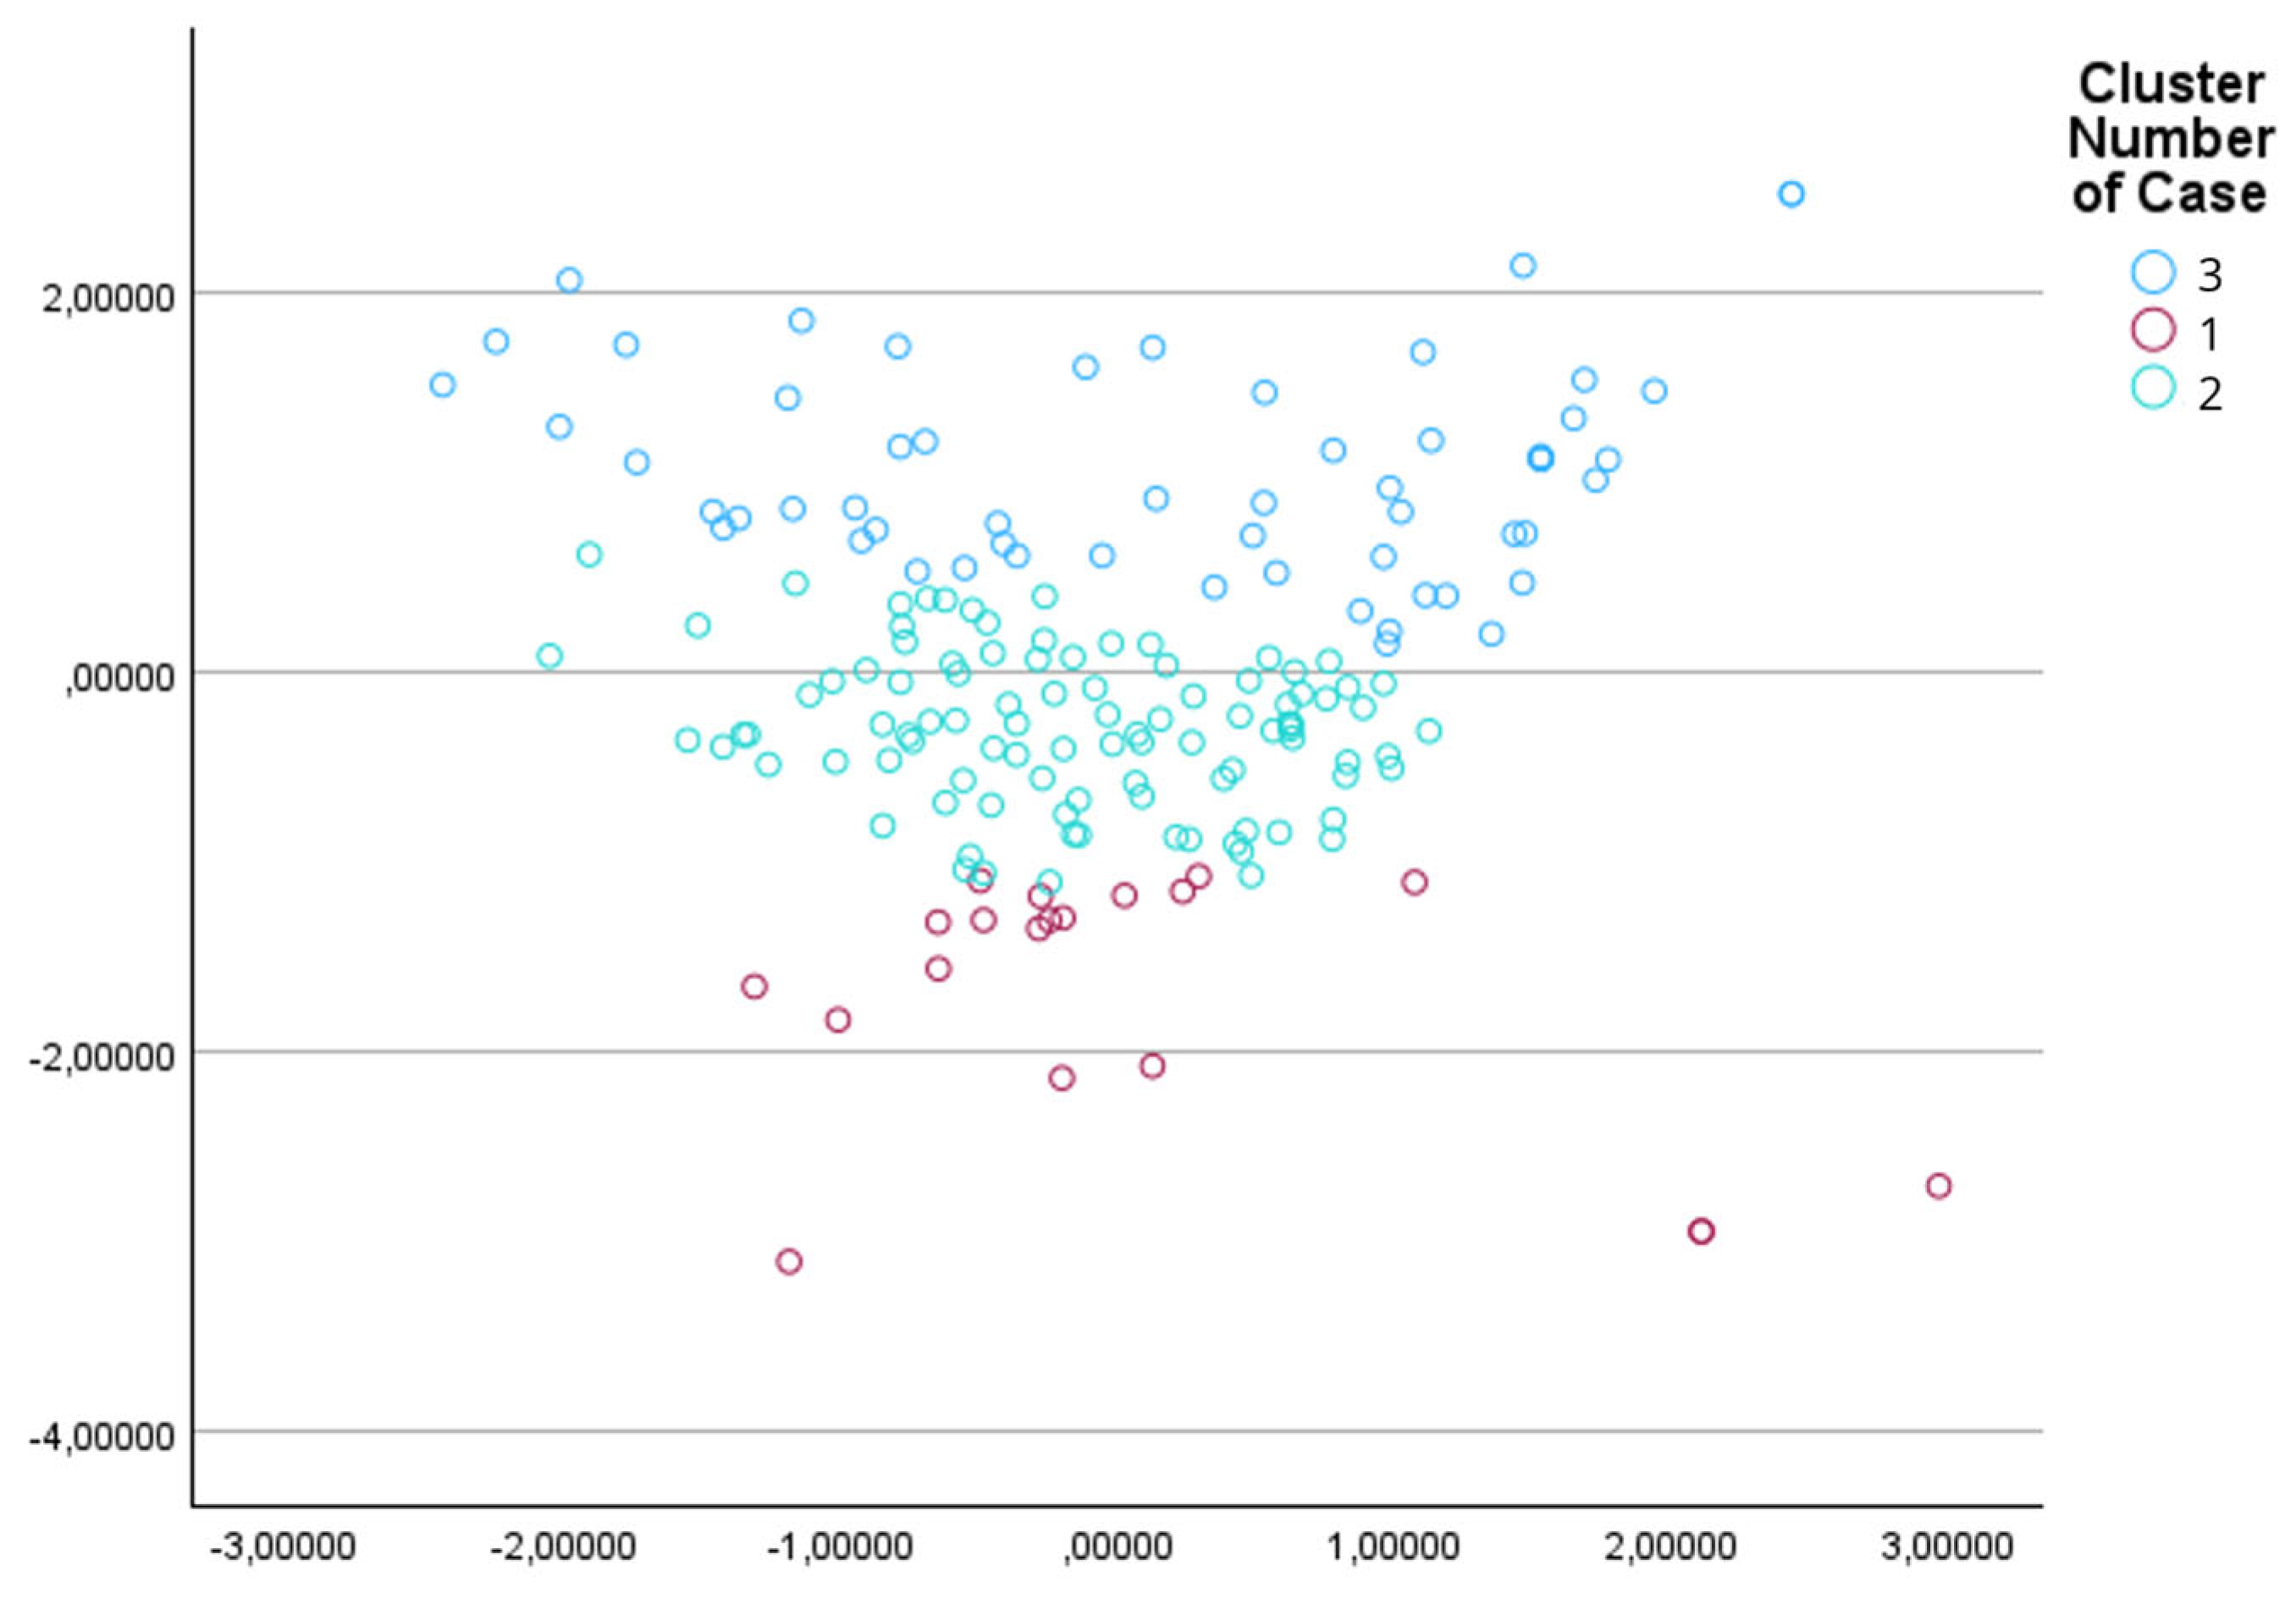

Table 1.
Online Survey Questions.
| Topic of Questions | Number of Questions | Scales | References |
| Demographic Questions | 3 | Multiple-choice | [1,11,26,27,28] |
| Travel and Driving Habits | 2 | Multiple-choice | |
| Familiarity with ADAS | 1 | Five-point Likert scale | |
| Acceptance of ADAS | 33 | Five-point Likert scale |
Table 2.
Attitudinal Statements Construct Mapping.
| Construct | Question | Attitudinal Statement |
| Perceived Usefulness / Perceived Expectancy | 6, 7, 28, 29, 30 | This pertains to the belief that ADAS improves the safety, performance, and efficiency in driving. |
| Perceived Ease of Use / Effort Expectancy | 12, 13, 14, 18, 31, 32, 33 | This measures the belief that ADAS requires minimal effort to use. |
| Trust and Control | 1, 2, 3 | This attributes to the driver’s trust in technology and their ability to maintain or relinquish control over the vehicle. |
| Behavioral Intention and Attitude | 4, 5, 8, 9, 15, 19, 21 | This is attributed to the overall attitude and intention of the driver to adopt ADAS. |
| Perceived Cost and Value | 10, 11, 16, 17 | This measures the driver’s perception of ADAS and its benefits vs. costs, and their willingness to pay for such technology. |
| Innovativeness and Risk Propensity | 20, 22, 23, 24, 25, 26, 27 | These are personality traits that are attributed to how open the driver is to new technology and the risks in buying a novel feature in vehicles. |
Table 3.
Model-selection and validity indices for k-means solutions.
| k | SSE (Inertia) | Silhouette | Calinski–Harabasz | Davies–Bouldin |
| 2 | 4749.059 | 0.1668 | 43.1571 | 1.8969 |
| 3 | 4366.588 | 0.1400 | 31.0440 | 1.9411 |
| 4 | 4026.073 | 0.1244 | 27.2525 | 2.0480 |
| 5 | 3826.867 | 0.1085 | 23.6449 | 2.1293 |
| 6 | 3676.168 | 0.1059 | 20.9965 | 2.1891 |
Notes: Higher is better for Silhouette and CH; lower is better for DB. SSE decreases monotonically by definition; the “elbow” indicates diminishing returns in compactness.
Table 4.
Validation metrics for the retained three-cluster k-means solution (cluster sizes, ARI, Cronbach’s α).
Table 4.
Validation metrics for the retained three-cluster k-means solution (cluster sizes, ARI, Cronbach’s α).
| Metric | Value |
| Cluster sizes (n) | 95, 32, 52 |
| Stability (Ward vs. k-means, ARI) | 0.234 |
| Scale reliability (Cronbach’s α, 33 items) | 0.862 |
Table 5.
Demographic Data of the Respondents.
| Gender | |
| Male | 45% |
| Female | 55% |
| Age | |
| 18-23 Years | 68% |
| 24-29 Years | 21% |
| 30-35 Years | 4% |
| 36-41 Years | 4% |
| 42-47 Years | 1% |
| 48-53 Years | 1% |
| 54-59 Years | 1% |
| Education | |
| High School | 64% |
| College Degree | 9% |
| University Degree | 25% |
| PhD | 2% |
Table 6.
Cluster 1.
| Attitude Statements | Mean |
| (Question 11) I would be willing to pay more for the use of Cars equipped with ADAS. | 1.33 |
| (Question 20) I am usually the first in my circle of friends to use Cars equipped with ADAS when they appear. | 1.38 |
| (Question 22) I really enjoy buying new high-tech things first, before other people realize they exist. | 1.38 |
| (Question 7) Using Cars equipped with ADAS would improve my driving performance. | 1.48 |
| (Question 28) Using ADAS improves my driving performance. | 1.48 |
| (Question 9) I would find the use of Cars equipped with ADAS enjoyable. | 1.52 |
| (Question 23) It is very important for me to be the first to buy the latest technology products. | 1.57 |
| (Question 8) Using Cars equipped with ADAS would be compatible with my flexible behavior. | 1.62 |
| (Question 2) It is not important for me to be able to take back control of a car with ADAS. | 1.67 |
| (Question 10) The cost of Cars equipped with ADAS would be outweighed by their benefits. | 1.71 |
| (Question 30) Using ADAS improves my driving efficiency. | 1.71 |
| (Question 6) Using Cars equipped with ADAS would allow me to perform driving tasks more efficiently. | 1.81 |
| (Question 26) I like to take risks by buying unknown brands just to add variety to my purchases. | 1.81 |
| (Question 21) Next time I want a new car, I’ll buy an ADAS car. | 1.95 |
| (Question 24) If I like a brand, I rarely switch just to try something new (reverse). | 2.19 |
| (Question 4) I would like to experiment with cars that have ADAS. | 2.24 |
| (Question 3) Overall, I would trust the technology of an ADAS car. | 2.29 |
| (Question 32) ADAS are difficult to use (reverse). | 2.29 |
| (Question 19) I think that using Cars equipped with ADAS is a wise decision. | 2.33 |
| (Question 29) Using ADAS improves my safety. | 2.38 |
| (Question 12) ADAS is easy to use because I can use it at any time. | 2.48 |
| (Question 13) ADAS is easy to use because I can use it in any situation. | 2.48 |
| (Question 31) Interacting with ADAS is clear and understandable. | 2.52 |
| (Question 14) ADAS is easy to use because it is not complicated. | 2.62 |
| (Question 15) I will wait to buy an ADAS car until it is proven that it is beneficial for me (reverse). | 2.67 |
| (Question 18) In my opinion, an ADAS car is often too complicated to be useful (reverse). | 2.81 |
| (Question 5) I am generally reluctant to try cars with ADAS (reverse). | 2.90 |
| (Question 17) I worry that I might pay more when using an ADAS car (reverse). | 2.90 |
| (Question 33) Interacting with ADAS does not require much mental effort (reverse). | 2.90 |
| (Question 16) Buying an ADAS car can be a waste of money (reverse). | 3.05 |
| (Question 27) I’m very cautious about trying new products (reverse). | 3.05 |
| (Question 25) When I go to an electronics store, I feel safer ordering products I know (reverse). | 3.10 |
| (Question 1) I prefer to keep control when using a car with ADAS (reverse). | 4.10 |
Table 7.
Cluster 2.
| Attitude Statements | Mean |
| (Question 23) It is very important for me to be the first to buy the latest technology products. | 2.01 |
| (Question 20) I am usually the first in my circle of friends to use Cars equipped with ADAS when they appear. | 2.15 |
| (Question 5) I am generally reluctant to try cars with ADAS (reverse). | 2.33 |
| (Question 18) In my opinion, an ADAS car is often too complicated to be useful (reverse). | 2.43 |
| (Question 22) I really enjoy buying new high-tech things first, before other people realize they exist. | 2.46 |
| (Question 26) I like to take risks by buying unknown brands just to add variety to my purchases. | 2.46 |
| (Question 16) Buying an ADAS car can be a waste of money (reverse). | 2.48 |
| (Question 2) It is not important for me to be able to take back control of a car with ADAS. | 2.55 |
| (Question 32) ADAS are difficult to use (reverse). | 2.67 |
| (Question 7) Using Cars equipped with ADAS would improve my driving performance. | 2.75 |
| (Question 10) The cost of Cars equipped with ADAS would be outweighed by their benefits. | 2.76 |
| (Question 11) I would be willing to pay more for the use of Cars equipped with ADAS. | 2.79 |
| (Question 28) Using ADAS improves my driving performance. | 2.86 |
| (Question 8) Using Cars equipped with ADAS would be compatible with my flexible behavior | 2.89 |
| (Question 21) Next time I want a new car, I’ll buy an ADAS car. | 2.92 |
| (Question 17) I worry that I might pay more when using an ADAS car (reverse). | 2.96 |
| (Question 27) I’m very cautious about trying new products (reverse). | 2.98 |
| (Question 6) Using Cars equipped with ADAS would allow me to perform driving tasks more efficiently. | 3.00 |
| (Question 24) If I like a brand, I rarely switch just to try something new (reverse). | 3.03 |
| (Question 30) Using ADAS improves my driving efficiency. | 3.03 |
| (Question 15) I will wait to buy an ADAS car until it is proven that it is beneficial for me (reverse). | 3.07 |
| (Question 33) Interacting with ADAS does not require much mental effort. | 3.17 |
| (Question 3) Overall, I would trust the technology of an ADAS car. | 3.19 |
| (Question 9) I would find the use of Cars equipped with ADAS enjoyable. | 3.23 |
| (Question 12) ADAS is easy to use because I can use it at any time. | 3.23 |
| (Question 31) Interacting with ADAS is clear and understandable. | 3.24 |
| (Question 13) ADAS is easy to use because I can use it in any situation. | 3.28 |
| (Question 19) I think that using Cars equipped with ADAS is a wise decision. | 3.28 |
| (Question 14) ADAS is easy to use because it is not complicated. | 3.29 |
| (Question 25) When I go to an electronics store, I feel safer ordering products I know (reverse). | 3.39 |
| (Question 29) Using ADAS improves my safety. | 3.46 |
| (Question 4) I would like to experiment with cars that have ADAS. | 3.62 |
| (Question 1) I prefer to keep control when using a car with ADAS (reverse). | 3.74 |
Table 8.
Cluster 3.
| Attitude Statements | Mean |
| (Question 5) I am generally reluctant to try cars with ADAS (reverse). | 2.69 |
| (Question 18) In my opinion, an ADAS car is often too complicated to be useful (reverse). | 2.86 |
| (Question 32) ADAS are difficult to use (reverse). | 2.93 |
| (Question 16) Buying an ADAS car can be a waste of money (reverse). | 3.02 |
| (Question 26) I like to take risks by buying unknown brands just to add variety to my purchases. | 3.17 |
| (Question 2) It is not important for me to be able to take back control of a car with ADAS. | 3.25 |
| (Question 20) I am usually the first in my circle of friends to use Cars equipped with ADAS when they appear. | 3.25 |
| (Question 23) It is very important for me to be the first to buy the latest technology products. | 3.25 |
| (Question 27) I’m very cautious about trying new products (reverse). | 3.25 |
| (Question 17) I worry that I might pay more when using an ADAS car (reverse). | 3.27 |
| (Question 1) I prefer to keep control when using a car with ADAS (reverse). | 3.39 |
| (Question 15) I will wait to buy an ADAS car until it is proven that it is beneficial for me (reverse). | 3.44 |
| (Question 25) When I go to an electronics store, I feel safer ordering products I know (reverse). | 3.53 |
| (Question 22) I really enjoy buying new high-tech things first, before other people realize they exist. | 3.54 |
| (Question 24) If I like a brand, I rarely switch just to try something new (reverse). | 3.71 |
| (Question 10) The cost of Cars equipped with ADAS would be outweighed by their benefits. | 3.90 |
| (Question 11) I would be willing to pay more for the use of Cars equipped with ADAS. | 3.90 |
| (Question 3) Overall, I would trust the technology of an ADAS car. | 3.95 |
| (Question 4) I would like to experiment with cars that have ADAS. | 3.97 |
| (Question 33) Interacting with ADAS does not require much mental effort (reverse). | 3.97 |
| (Question 21) Next time I want a new car, I’ll buy an ADAS car. | 3.98 |
| (Question 19) I think that using Cars equipped with ADAS is a wise decision. | 4.03 |
| (Question 8) Using Cars equipped with ADAS would be compatible with my flexible behavior | 4.07 |
| (Question 12) ADAS is easy to use because I can use it at any time. | 4.08 |
| (Question 14) ADAS is easy to use because it is not complicated. | 4.08 |
| (Question 13) ADAS is easy to use because I can use it in any situation. | 4.15 |
| (Question 7) Using Cars equipped with ADAS would improve my driving performance. | 4.17 |
| (Question 9) I would find the use of Cars equipped with ADAS enjoyable. | 4.22 |
| (Question 28) Using ADAS improves my driving performance. | 4.24 |
| (Question 30) Using ADAS improves my driving efficiency. | 4.24 |
| (Question 31) Interacting with ADAS is clear and understandable. | 4.25 |
| (Question 6) Using Cars equipped with ADAS would allow me to perform driving tasks more efficiently. | 4.27 |
| (Question 29) Using ADAS improves my safety. | 4.32 |
Table 9.
Overall average of the acceptance and familiarity of clusters.
| Clusters | Acceptance of ADAS (Mean) | Familiarity with ADAS (Mean) | Number of Respondents (N) |
| Conservative Controllers | 2.30 | 2.52 | 21 |
| Cautious Adopters | 2.99 | 2.73 | 99 |
| Pragmatic Innovators | 3.52 | 3.05 | 59 |
Table 10.
Summary of ADAS Consumer Segments.
| Characteristic | Conservative Controllers | Cautious Adopters | Pragmatic Innovators |
| Size of segment | 11.7% | 55.3% | 33.0% |
| General description | Low trust, reluctant to automation, high need for control | Balanced view, weighs cost vs. benefits of adoption | Open to innovation, high trust in automation |
| Trust in ADAS | Low – they do not trust the technology | Moderate – they are willing to trust if the benefits have been vouched for | High – they have high trust and believe in the safety and reliability of ADAS |
| Need for Control | High – they strongly prefer to maintain control over the vehicle | Moderate to High – they prefer to control the vehicle but are willing to relinquish for benefits that have been tested and proven | Low – they are willing to relinquish control and adopt the system |
| Willingness to Pay | Low – they see ADAS as a waste of money | Moderate – they are price-sensitive and are willing to pay if the benefits offset the additional cost | High – they are willing to purchase vehicles with ADAS, even if they command premium prices |
| Intention to Purchase | Low – they are reluctant to purchase and will most likely delay buying | Moderate – if they are sure that the benefits outweigh the costs, they intend to purchase | High – they intend to purchase a vehicle with ADAS |
| Innovativeness | Low – they are risk-averse and therefore very cautious to adopt | Moderate – they will not adopt right away but are open to new products | High – they seek novelty and prefer to be pioneers in adopting technology |
| Communication Approach | Highlight override or deactivate features to appeal to the segment’s need for control | Highlight benefits and product value to appeal to the segment’s price-sensitive nature | Highlight latest and novel features to appeal to the segment’s innovative nature |
Disclaimer/Publisher’s Note: The statements, opinions and data contained in all publications are solely those of the individual author(s) and contributor(s) and not of MDPI and/or the editor(s). MDPI and/or the editor(s) disclaim responsibility for any injury to people or property resulting from any ideas, methods, instructions or products referred to in the content. |
© 2025 by the authors. Licensee MDPI, Basel, Switzerland. This article is an open access article distributed under the terms and conditions of the Creative Commons Attribution (CC BY) license (http://creativecommons.org/licenses/by/4.0/).
Copyright: This open access article is published under a Creative Commons CC BY 4.0 license, which permit the free download, distribution, and reuse, provided that the author and preprint are cited in any reuse.


