
Submitted:
09 May 2023
Posted:
10 May 2023
You are already at the latest version
Abstract
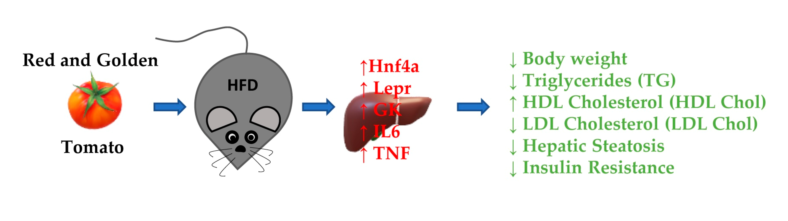
Abstract: Nonalcoholic fatty liver disease, characterized by the lipid accumulation within hepatocytes exceeding 5% of liver weight, is strictly related to metabolic disorders and to obesity and diabetes and represents a health emergency worldwide. Being not available any standard therapy for NAFLD, a key role is ascribed to lifestyle intervention including phytonutrient intake to prevent NAFLD development and progression. We have used a rat model of NAFLD to evaluate the effect of dietary supplementation with red tomato and golden tomato, patented mix of fruit with different degrees of ripeness, particularly rich in naringenin and chlorogenic acid, after steatosis development. We have assessed the ef-fects on body weight, metabolic profile, and hepatic steatosis and a correlation between the amelioration of all the parameters and the liver gene expression was evidenced. We found that the genes mainly up regulated by tomatoes administration were HNF4, Lepr and GK, able to condition metabolic homeostasis. Our results suggest that there is a role for red and golden tomatoes, dietary intake as a nutraceutical approach of NAFLD prevention and therapy.
Keywords:
Nonalcoholic Fatty Liver Disease
; Golden Tomato
; Red Tomato
; Lepr
; NFH4a
; GK
; lipid homeo-stasis
; steatosis
1. Introduction
Nonalcoholic fatty liver disease (NAFLD), being associate with obesity and metabolic syndrome (MetS) features, can be defined as Metabolic Dysfunction-Associated Fatty Liver Disease (MAFLD) [1]. NAFLD is nowadays the most common chronic liver disease with a global prevalence of about 25%. It represents the first stage of metabolic liver disease which can progress to nonalcoholic steatohepatitis (NASH) in dependence of comorbidities (i.e., obesity, insulin resistance, type 2 diabetes mellitus), genetic predisposition (i.e., PNPLA3, TM6SF2), diet and behavior (i.e., alcohol, cholesterol, fructose). NASH is associated with the progression to cirrhosis and hepatocellular carcinoma development and represents the increasing condition for liver transplantation [2]. Due to the complexity of NAFLD pathogenesis, no specific pharmacological therapies are approved, and the intervention on lifestyle represents the only strategy for patients’ management. Together with exercise, the hypocaloric, antioxidant, anti-inflammatory dietary approach is recommended for NAFLD treatment [3].
The tomato (Solanum lycopersicum L.) is a food of the Mediterranean diet with important nutritional role due to its richness in phytonutrients, mainly β- carotene and lycopene, essential amino acids, fiber, minerals, vitamins and monounsaturated fatty acids [3].
Today, the role of the phytonutrient-rich Mediterranean diet in the prevention of inflammation-based diseases such as obesity, diabetes, metabolic syndrome and some neurodegenerative diseases is recognized [4]. Studies in vivo have shown that the consumption of tomatoes and products derived from their processing are protective against certain types of cancer, cardiovascular disorders, cognitive functions and osteoporosis. Tomato phytonutrients are able to reduce reactive oxygen species through radical scavengers, inhibit cell proliferation and damage, modulate enzyme activity, cytokine expression and influence signal transduction pathways [5]. Also, not to be underestimated is its content of soluble and insoluble fiber, cellulose, hemicellulose, pectin which is able to modify the intestinal microbiota and promoting, through its fermentation, the production of short-chain fatty acids that improve the lipid and glycemic profile by improving intestinal dysfunction [6]. These characteristics confer to tomato a protective role against cancer, diabetes, cardiovascular diseases (CVDs) and obesity [7].
Golden tomato (GT) represents a product for industrial invention, named golden peeled tomato, obtained by mixing fruits not yet fully ripe with different degrees of coloring. These are products that, during the ripe tomato harvest, are usually considered field waste and for this reason were discarded. Interestingly, GT and Red Tomato (RT) have a different degree of maturation and differ significantly in terms of phytonutrients, as described in section 4.1, being the GT characterized by higher content of naringenin, a 4,5,7-trihydroxyflavanone, (57%) and of chlorogenic acid (ChA), an ester of caffeic acid and quinic acid, (81%), whereas lower quantity and quality of carotenoids as well as vitamin C (45%) respect to RT. Lycopene, β- carotene, naringenin, and clorogenic acid have been shown hepatoprotective effects and several activities of these phytochemicals were described such as normalizing BMI, improving glucose tolerance, ameliorating IR, decreasing plasma and liver lipid levels reducing NAFLD [8,9,10].
The aim of the present paper was to evaluate the different effects of dietary treatments with golden or red tomatoes to rats with liver steatosis, with a view to individuate possible mechanistic insight on their biological activity. To this purpose, we induced NAFLD applying an experimental high-fat diet (HFD) protocol in vivo to male Wistar rats for 8 weeks and observed the eventual modification of the gene’s expression associated with dysmetabolism after 1 month of nutritional treatment with golden and red tomatoes.
We assessed the influence of GT and RT administration on biochemical modification and metabolic dysfunction, induced by HFD, investigating glucose tolerance, lipid homeostasis and insulin resistance. Interestingly, we focused our research in exploring the specific genes implicated in metabolic pathways, insulin and adipokine signaling, and inflammatory response.
This study could contribute to shed new light on the pathways modulated by these phytonutrients at hepatic level in a condition of NAFLD and provide knowledge for future prevention and therapeutic approaches.
2. Results
2.1. Effects of Red Tomato and Glolden Tomato Diet on Body Weight
The evaluation of body weight gain revealed that treatment with GT and with RT, in rats fed with HFD, reduced the biometric increase versus HFD alone and were not significantly different from NPD (F(3,16): 7.93, p<0.0001, g-power: 0.99, effect size: 2.09) (Figure 1).
2.2. Effects of Red Tomato and Golden Tomato Diet on Metabolic Profile
The oral supplementation with GT and RT in HFD rats was able to modify the metabolic profile in MetS.
As regards lipid homeostasis, statistical analysis was performed by one-way ANOVA followed by Bonferroni post-hoc test and the results are presented in Table 1. Analysis on triglycerides (TG) showed a significant reduction of TG levels in HFD/GT and HFD/RT vs HFD (F(3,16):10.86, p=0.0004, g-power: 0.97, effect size: 1.32), that restore to basal values of NPD. It could appear counterintuitive that total cholesterol (T Chol) levels were much higher in HFD/GT versus HFD and HFD/RT not-different from HFD alone (F(3,16):13.98, p<0.0001, g-power: 0.95, effect size: 1.55). However, one-way ANOVA on High Density Lipoprotein Cholesterol (HDL- Chol) revealed a marked increase in HFD/GT and HFD/RT both versus HFD and NPD groups (F(3,16):52.77, p<0.0001, g-power: 0.99, effect size: 3.49). Also, analysis on Low Density Lipoprotein Cholesterol (LDL- Chol) showed a significant reduction in HFD/GT and HFD/RT vs HFD (F(3,16):8.32, p=0.0015, g-power: 0.98, effect size: 1.16), like NPD basal values. Therefore, the increase in T Chol is justified by a concurrent increase in HDL and reduction of LDL (Table 1).
Furthermore, glucose homeostasis was evaluated considering: i) Area Under the Curve (AUC), following Glucose Tolerance Test (GTT), and the ii) fasting glucose (FG) levels. Statistical analysis on AUC by one-way ANOVA revealed a significant main effect only for HFD/GT vs HFD a vs NPD groups (F (3,16): 23.56, p<0.0001, g-power: 0.99, effect size: 2.01) (Table 2). The plasma levels of FG were markedly reduced in HFD/GT vs HFD (F(3,16):5.74, p=0.0073, g-power: 0.96, effect size: 1.09) (Table 2)
The homeostasis model assessment (Homa) Index calculation (measurement of fasting insulin and glucose) shown that the dietary supplementation with both red and golden tomatoes was able to ameliorate the insulin resistance developed after HFD diet, up to almost normal values (Figure 2). Indeed, HOMA index revealed a marked decrease in HFD/GT and HFD/RT versus HFD (F(3,16)=17.17, p<0.0001, g-power: 0.99, effect size: 1.97), returning to basal levels of NPD groups (Figure 2).
2.3. Effects of Red Tomato and Golden Tomato Diet on Hepatic Steatosis
The histological evaluation, performed on liver samples of the NPD control group, showed no steatosis (average percentage of 3.2±0.8) (Figure 3 A, B) as compared to the HFD group in which steatosis was found to be high (average percentage of 89.3±1.5) (Figure 3 C, D). In HFD liver tissue, macro vesicular steatosis with diffuse and large lipid droplets was predominantly observed. Liver samples of HFD/RT group showed a micro vesicular and macro vesicular steatosis, with small and large lipid droplets accumulation, in an average percentage of 43.33±11.6 (Figure 3 E, F). In the liver samples of HFD/GT group, the steatosis was reduced and of micro vesicular type with a mean percentage of 20.33±6.5 (Figure 3 G,H). The histogram (Figure 3 I) shows the percentage of steatosis in the different groups.
2.5. Effects of Red and Golden Tomatoes Intake on Metabolic, Adipokine, and Inflammatory Signalling
The microarray analysis of 84 target genes (Figure S1) involved in rat fatty liver, were performed in biological triplicate for each group selected as described in section 4.2. The analysis of gene expression in HFD/RT (red bars) and HFD/GT (yellow bars) liver samples was referred to HFD group. Figure 4 shows genes expression with statistic significance (p-value < 0.05) (Table S1).
The alimentary supplementation with RT or GT was able to up regulate, with statistical significance, genes involved in metabolic pathway, adipokine signaling and inflammatory response. We found that, after administration of GT and RT respectively, GK was up-regulated 2,56 and 3,17 times; Hnf4α resulted up-regulated 3,25 and 2,53 times; Lepr was up-regulated 3,21 and 9,99 times; IL6 was up-regulated 3,21 and 9,99 times; TNF was up-regulated 2,5 and 7,78 times.
3. Discussion
NAFLD/MAFLD includes a wide spectrum of clinical features from simple steatosis to nonalcoholic steatohepatitis, characterized by necroinflammation and liver fibrosis development which is associated with high-risk complications, such as liver decompensation and hepatocellular carcinoma [11,12]. It has been estimated that by 2030, NAFLD/NASH is expected to be the most frequent cause for liver transplantation [13]. The NAFLD pathogenesis and progression is complex and involves metabolic and genetics determinants. The “multiple hits” model suggests that several factors such as lipid overload, oxidative stress, mitochondrial and endoplasmic reticulum damage, chronic inflammatory response, hepatocyte cell death, act synergistically to enhance the development and the progression of NAFLD [14]. Even though the recent progress in understanding gene profile and pathways involved in NAFLD have suggested the possible role for targeted therapies (i.e., FXR agonists and PPAR agonists), there is no approved therapy for NAFLD [15]. The current treatment strategy is focused on lifestyle interventions, including increased physical activity and diet-induced weight loss. In this context, several natural compounds have attracted interest in the treatment of NAFLD, and most attention has been given to natural products derived from fruits, vegetable, and medicinal plants [16].
The present paper was aimed at evaluating the impact of dietary supplementation of red tomato (RT) and golden tomato (GT) in a rat model of NAFLD.
The GT represents the harvested version of tomatoes, selected as reported in 4.1 section, and its biological activity is still to be full uncovered. It is characterized by the different composition, in terms of phytochemicals, with higher content of naringenin and chlorogenic acid and lower content of carotenoids and lycopene respect to RT.
In our rat model of steatosis, it was expected the metabolic and hepatoprotective effect of dietary administration of red tomato, rich in healthy constituents with antioxidants properties mainly carotenoids and lycopene [17].
Carotenoids are made up of conjugated double bond in their structure; they have high reducing capability by the transfer of electrons, which give them antioxidant properties, responsible for reducing the risk of atherosclerosis, cancers, and NAFLD [18]. Liver represents a major site of storage of β-carotenes which have a positive impact on the liver pathology. They are famous for ameliorate hepatic steatosis and liver injury, decreasing liver enzymes (alanine/aspartate aminotransferase) and bilirubin levels; in addition, it has been reported their ability to improve insulin sensitivity thus acting as a lipid lowering agent and lipid soluble antioxidant [19,20].
In our experiments, RT dietary supplementation was able to revert the body weight gain observed after HFD administration together with liver steatosis reduction. These effects could be mediated by β- carotene content, being described its role in decreasing fat accumulation associated with lower risk of NAFLD development [21,22]. Moreover, β-carotene is described to be able to alleviate dyslipidemia according to our results about the significative reduction of TG and LDL Chol plasma levels observed after RT administration [23].
Lycopene is the other main pigment present in red tomatoes. It is well-known in decreasing the level of serums TG, LDL Chol and FFAs, and in increasing HDL Chol [24]. The effects of lycopene at hepatic level, consist in reduction of steatosis and in increases of the expression of antioxidant enzymes [9,18]. All those effects have been evidenced in HFD/RT rats respect to HFD group, suggesting that the RT dietary supplementation shows its beneficial effects mediated by both β-carotenes and lycopene contents.
The novelty of our approach was to evaluate the effects of dietary administration of GT, usually discarded after harvesting, as a functional food. It was expected that the intake of GT, rich in naringenin and ChA, could be related to the amelioration of metabolic profile and liver steatosis.
Between flavonoids, naringenin have attracted interest in medicinal biology and chemistry exhibiting a broad range of biological and pharmacological activities such as antioxidant, anti-allergic, antibacterial, anti-inflammatory, antimutagenic and antiproliferative effects in different cancer cell lines [25,26]. It is reported to have both lipid lowering and insulin-like properties. In addition, it has been evidenced its protective effects in metabolic and cardiovascular context showing the ability to ameliorate the metabolic syndrome features in terms of antiadipogenic effects due to the increase of fatty acid oxidation and to the decrease of de novo lipogenesis [27,28]. This evidence is in accord to our results that shown the biometric decreasing and the reduction of steatosis with the loosing of macro vesicular phenotype after GT dietary supplementation. In the same direction, the observed reduction of TG, LDL Chol, and the significant increase of HDL Chol respect to HFD diet support the hypothesis of naringenin- mediated beneficial effect [29].
Chlorogenic acid is one of the most available polyphenol compounds in food and it is considered as a well-known antioxidant agent [30]. It can be found ubiquitously in plants, such as apple, coffee, herbal tea and RT but it is more abundant in GT (81%) [31].
Accumulating evidence have demonstrated that ChA exhibits many biological properties, including antibacterial, antioxidant, anticarcinogenic activities. In addition, metabolic effects have been described; it has a crucial role in glucose and lipid metabolism acting as a hypoglycemic and hypolipidemic agent as reported in models od rat fed a high-cholesterol diet [32]. ChA exerts beneficial effects especially on obesity-related liver steatosis and insulin resistance; it can attenuate both the reduced plasma concentrations of HDL and the increased total cholesterol and plasma concentrations of LDL [33].
Our experiments shown that the effects of supplementation with GT in HFD rats, is effective in ameliorating the lipidic profile (reduction of TG and LDL Chol and increase of HDL Chol) the glucose homeostasis (reduction of AUC and fasting glucose) and the insulin resistance. Moreover, the observed reduction of body weight in HFD/GT group could be ascribable in part to ChA content of GT being reported that this phytonutrient exerts a beneficial influence on obesity- related liver steatosis, blocking diet-induced weight gain [34].
In order to understanding the molecular mechanisms related to the observed modifications of metabolic profile and liver histological characteristics, we have evaluated the tissue expression of genes involved in metabolic pathway, adipokine signaling and inflammatory response. As expected, several genes were differentially expressed in HFD/GT and HFD/RT respect to HFD. However, we have focused our attention on genes markedly up regulated in both treatments with GT and RT.
We found higher levels of IL6 and Tnf transcripts, both involved in inflammatory response in GT and RT group than HFD, but in GT group their levels were lower (respectively of 3,2-times, and 2,5-times) than RT group (respectively 9,9-times, and 7,7-times). These results could be explained as one effect of rapid mobilization of TG from liver during the treatment with GT and RT, observed in terms of lipid liver content, which can be related to the increase of inflammation. However, it is expected that the overall anti-inflammatory effect of RT /GT supplementation is beneficial due to lycopene, β-carotene[35], and mainly by naringenin [36] and ChA [10] content of these matrices.
Interestingly, we found higher levels of HNF4α in HFD/GT (3,25-times) and in HFD/RT (2,53-times) compared to HFD group. HNF4α is a nuclear receptor that plays a crucial role in hepatic lipid homeostasis, regulating the transcription of genes involved in secretion of VLDL, such as Apolipoprotein B [37]. Hepatic HFN4 α expression is markedly reduced in diabetes, obesity and NASH. It has been reported, after HFD feeding, the reduction in mRNA and protein levels of hepatic HNF4α and its cytoplasmatic retention [38]. Treatments that can induce HNF4A expression or activation were investigated leading to the discovery of strong HNF4α agonists able to control fat deposition in the liver. Since hepatic HFN4a is repressed in NASH, the treatment with GT and RT, able to increase its liver expression, could be useful even in the prevention of progression of NAFLD [39].
Furthermore, the gene expression analysis showed increased levels of Leptin receptor (Lepr) in HFD/GT (3,21 times) and in HFD/RT (9,99-times p value 0,005) compared to HFD group. Lepr has been reported as a possible target gene being upregulated by metformin which may enhance leptin sensitivity in liver to alleviate steatosis. Hepatic leptin resistance is a key determinant of lipid accumulation in liver [40]. Much evidence indicate that Lepr serve as a novel biomarker for leptin sensitivity and the augmentation of Lepr is related to the reduction of steatosis [41]. However, increased Lepr levels have been positively correlated with HDL Chol and serum adiponectin levels [40]. In line with literature, several effects observed after GT and RT supplementation could be reconducted to Lepr up-regulation.
Interestingly, enhancing leptin response not only improves liver function (by reducing fat deposits), but could improve glycerol import into hepatocytes to maintain moderate both glucose and lipid metabolism [43]. In fact, our experimental data show that in rats fed with RT and GT the expression of the enzyme glycerol kinase (GK) increases. GK is a crucial enzyme in the interface of fat and carbohydrate metabolism, by converting glycerol to glycerol 3-phosphate (G3P) in a reaction dependent of ATP availability [44]. It has been reported in rat model of hypercholesterolemia that rats receiving chickpea re-established the liver glycogen deposition as compared to the control group; this effect has been correlated to the increase of GK activity [42]. In our paper, we reported the reduction of body weight in rats fed with GT and with RT compared to HFD group. In addition, we found the decrease of TG levels in HFD/GT and in HFD/RT groups compared to rats fed with HFD alone. The microarray analysis has been reported higher levels of GK in HFD/GT (2,56 time) and in HFD/RT (3.17 time) than to group fed with HFD alone. The high expression of GK could correlate to the reduction of TG that were used for gluconeogenesis. In this context, the rats receiving GT or RT solution could re-established the liver glycogen deposition throwgh GK activity.
4. Materials and Methods
4.1. Preparation and Treatment of Golden and Red Tomatoes
The GT sample was prepared by mixing fruits with different degrees of ripeness in appropriate proportions. It is a patented product and registered as “golden peeled tomato” with the following number 102015000058418. The ripening degree of the fruits corresponding to a certain color grade was chosen by means of colorimetric analysis. The analysis was conducted using a colorimeter (CR-400, Minolta corporation, Ltd., Osaka, Japan). The fruits used belong to three different ripening stages with three different colors, green (Figure 5A), pre veraison (Figure 5B) and veraison (Figure 5C). The red tomato sample, on the other hand, was obtained using fully ripened, red-coloured fruit. All fruits come from the same cutivar Brigade, grown on the same farm and therefore subjected to the same soil and climate conditions.
Previous work (data in publication) has shown that GT and RT possess different qualitative and quantitative phytonutrient content and different antioxidant properties. GT was found to be richer in naringenin and chlorogenic acid, while RT was richer in carotenoids and lycopene. The interest in this product arises from the possibility to use fruit that should be thrown away by using it to produce a new functional food with different properties respect to the fully ripe product.
The GT and RT samples, after harvesting, were divided into aliquots (~1kg), freeze-dried and vacuum-preserved at -20°C before being used for animals’ treatments.
4.1.1. Tomatoes Solutions for Oral Administration
The dose of tomato in aqueous solution administered daily to the treated groups was 200 mg/Kg body weight and corresponds to a daily portion of 300 g fresh tomato that a 70 kg man can consume. The dose was established based on valid toxicity tests for red tomatoes available in literature [43,44]. Each animal received daily 1mL of GT or RT (experimental groups HFD/GT and HFD/RT) solution obtained by solubilizing 50 mg of freeze-dried tomato in 50 mL of water orally through a syringe. The groups not receiving the tomato solutions took the same volume (1 mL) of plain water. No animals showed signs of toxicity or intolerance during the treatments.
4.2. Animals and Experimental Groups
The experiments were conducted on 20 male Wistar rats (4week-old), with an average initial weight of 240-260g, purchased from the company Envigo S.r.l . Their housing conditions in the animal facility were in detail described in our previous paper [45]. During the acclimation period, animals were first fed with a standard chow diet providing 3.94 kcal/g and then divided into four homogenous groups with balanced weight. After the adaptation phase, the animals of the normal control group defined as NPD (Normal Pellet Diet, n= 4) were fed a normal diet for the entire duration of the experiment, 3 months. The other three groups were fed with HFD (High-Fat Diet) throughout the experiment and, after 8 weeks, when the induction of the MetS was confirmed according to previous identified criteria, one more month of nutrition with HFD treatment started. In the last month the animals fed with HFD were divided in three groups: one group represented the control (HFD group, n=5) and was orally treated with vehicle, whereas, to evaluate the effect of the golden tomato and red tomato, the others two group were treated with golden tomato (HFD/GT group, n=5) and with red tomato (HFD/RT group, n=5). The experimental phases of the study are depicted in Figure 6.
4.3. Diet Composition
The composition of both types of diet, NPD and HFD, is shown in the Table 3. The animal groups were fed with standard laboratory food (code PF1609, certificate EN 4RF25, Mucedola, Milan, Italy), or with HFD food with of 60% energy coming from fats (code PF4215-PELLET, Mucedola, Milan, Italy). Fatty acid composition plays a crucial role in the regulation of metabolic phenotype. Saturated fatty acids (SFA) are more obesogenic and lead to larger significant metabolic alterations than unsaturated fatty acids. The lipid component of the HFD pellet comes for 9% from palm oil consisting of 50% saturated fat, 39% monounsaturated fat and 11% polyunsaturated fatty acids while the remaining fat comes from lard. The HFD is rich in saturated fatty acids in which the ratio of saturated/monounsaturated to polyunsaturated fatty acids is 4:3:1 Normally the lipid quality consists of SFA/MUFA/PUFA in the ratios 1:1:3. All rats had free access to food. As just reported, HFD induces metabolic syndrome with hepatic profile typical of NAFLD in rats after 8 weeks [46]. Animal care and handling throughout the experimental procedures were in accordance with the European Directive (2010/63/EU). The experimental protocols were approved by the animal welfare committee of the University of Palermo and authorized by the Ministry of Health (Rome, Italy; Authorization Number 14/2022-PR).
4.4. Body Weight Gain
The influence of nutritional treatments on biometric parameters was evaluated considering the increase in weight (Body weight gain) reached by animals at the end of the experiment. Delta Body Weight (ΔBW) was calculated by subtracting the final rat weight after 4 weeks of nutritional treatments to the initial weight recorded at T0.
4.5. Glucose and Lipid Homeostasis Assays
In order to investigate on glucose tolerance, insulin resistance and lipid homeostasis we applied Glucose Tolerance Test (GTT), HOMA index and evaluation of plasma lipid parameters at the end of the experimental protocol [46]. Detailed procedures are described in our previous paper [45]. In the plasma samples, triglycerides (TG), total cholesterol (TC), low-density lipoprotein cholesterol (LDL), high-density lipoprotein cholesterol (HDL) concentrations were quantified by commercial kits using the Free Carpe Diem device (FREE® Carpe Diem; Diacron International, Italy). The data are always expressed in mg/dL.
4.6. Determination of Hepatic Steatosis
Liver tissue sections (5µm) were obtained from cryostat and stained with haematoxiln&eosin. Following staining, the slides were observed with an optical microscope (Microscope Axioscope 5/7 KMAT, Carl Zeiss, Oberkochen, Germany) connected to a digital camera (Microscopy Camera Axiocam 208 color, Carl Zeiss). For the steatosis evaluation a semiquantitative analysis was performed by two independent observers in a high-power field (HPF) (magnification 400×) and repeated for 10 HPFs. Statistical analysis was carried out using the Graph- Pad Prism 4.0 package (GraphPad Inc., San Diego, CA, USA). Comparisons of histological evaluations were made by using ANOVA test. All data are presented as the mean ± SD, and the level of statistical significance was set at p ≤ 0.05.
4.7. RNA Isolation and Real-Time PCR Microarray
Total RNA was purified from 15 Wistar rats Liver tissue by miRNeasy Micro Kit (Qiagen, Hilden, Germany) and quantified using NanoDrop ™ 1000 Spectrophotometer (Thermo Fisher Scientific, Life Technologies Italia). 1 μg of RNA was retro transcribed using the RT2First Strand kit (Qiagen) according to manufacturer’s recommendations. Quantitative Real Time PCR was performed using the pre-designed RT2 Profiler PCR Array Rat Fatty Liver (96- Well Format, Cat. No. 330231 PARN-157ZA, (Qiagen, Hilden, Germany). The plates contained primers for 84 target genes, reported in Supplementary Table 2, and for 5 housekeeping genes: Actin beta (ACTB), beta-2-microglobulin (B2M), Hypoxanthine phosphoribosyl transferase 1 (HPRT1), Lactate dehydrogenase A (LDHA) and Ribosomal protein, large, P1 (RPLP1). In addition, each plate contained 1 Rat Genomic DNA Contamination control (RGDC), 3 Reverse Transcription Control (RTC) and 3 Positive PCR Control (PPC).
Data were expressed as fold regulation using 2 − ΔΔCt method referred to Wistar rats fed HFD as control group. Differences among experimental groups were analyzed by Student t-test. The student’s t-test for independent experiments is performed for testing differences in fold expression of genes between the experimental groups; the Bonferroni correction for multiple hypothesis testing was applied to t-test and P-value, false-positive error probability, was used as primary criterion for selection of genes (P-value cut off of 0.05 for statistical significance) and then the fold-regulation was considered as a measure of biological significance. The cycle threshold (ct) values were submitted to the Web-based PCR Array Data Analysis software (https://geneglobe.qiagen.com/it/analyze(Qiagen).
4.8. Statistical Analisys
Statistical analysis was performed by GraphPad Prism 9.02 (San Diego, CA, USA). Values of biometric, metabolic parameters and histological evaluations in liver were compared by a one-way ANOVA test followed by Bonferroni post-hoc evaluations for differences between means and represented by scattered bar graphs. Differences were considered significant when p<0.05. The statistical power (g-power) was considered only if >0.75 and the effect size if >0.40. The results are presented as the mean ± standard error of the mean (S.E.M.).
The PCR microarray experiments and determinations were performed including in each group three Wistar rats as biological triplicate. The data were represented as mean ± S.D. The statistical significance of the differences between single group and relative control was evaluated by a two-tailed Student’s t-test and adjusted p-values by Hommel’s method. All the statistical analysis has been performed using R Statistical Software version 4.0.4 (Core Team, 2021).
5. Conclusions
Our results shown that the dietetic administration of red and golden tomatoes in NAFLD rat model is beneficial in terms of body weight loss, reversion of lipid liver accumulation, lipidic and glycemic profiles. However, the beneficial effects were more evident in the group which received GT, suggesting the possibility to introduce GT, together with RT, in the diet. The main observed effects seem to be related to the different liver expression of genes such as HNF4α and Lepr (Leptin receptor) and GK, key modulators of liver lipid metabolism, in dependence of dietetic apport of red or golden tomato. It was reported that naringenin exerts antifibrotic effects, inhibiting the trans-differentiation of hepatic stellate cells and reducing collagen synthesis [47]. In line with this evidence, GT diet could play a role in prevention not only in NAFLD development, but also antagonizing the progression to NASH, prodromic to liver fibrosis.
Further studies are necessary to evaluate the effects of co-administration of red and golden tomatoes, but our results suggest this type of co-supplementation could represents a dietary strategy to prevent NAFLD development and progression.
Author Contributions
Conceptualization, Rosaria Maria Pipitone, Daniela Carlisi, Danila Di Majo and Stefania Grimaudo; Data curation, Rosaria Maria Pipitone, Rossella Zito, Giuditta Gambino, Gabriele Di Maria, Ayesha Javed, Giulia Lupo, Giuseppe Giglia, Pierangelo Sardo, Francesca Rappa and Stefania Grimaudo; Formal analysis, Giuditta Gambino and Stefania Grimaudo; software, Gabriele Di Maria; Funding acquisition, Danila Di Majo and Stefania Grimaudo; Investigation, Rosaria Maria Pipitone, Rossella Zito, Giuditta Gambino, Ayesha Javed, Giulia Lupo, Giuseppe Giglia, Giuseppe Ferraro, Francesca Rappa, Daniela Carlisi, Danila Di Majo and Stefania Grimaudo; Methodology, Rosaria Maria Pipitone, Rossella Zito, Giuditta Gambino, Ayesha Javed, Giulia Lupo, Giuseppe Giglia, Pierangelo Sardo, Francesca Rappa, Danila Di Majo and Stefania Grimaudo; Supervision, Giuseppe Ferraro; Validation, Rosaria Maria Pipitone; Writing—original draft, Daniela Carlisi and Danila Di Majo; Writing—review & editing, Rosaria Maria Pipitone and Stefania Grimaudo.
Funding
This research was funded with: project “IN.PO.S.A.”—Grant Number: G66D20000170009, funded by PSR Sicilia (2014–2020)-16.1; Project “Alimenti Nutraceutici e Salute”- TRIAL, Action 1.1.5 of PO FESR Sicilia 2014/2020, project code: 08TP1041100162; FFR2022 University of Palermo Department PROMISE “Stefania Grimaudo” and “Rosaria Maria Pipitone”.
Institutional Review Board Statement
This article does not contain any studies with human participants by any of the authors. Animal experimentation was conducted according to authorization from the Italian Ministry of Health code n. 14/2022-PR.
Informed Consent Statement
Not applicable.
Data Availability Statement
The data presented in this study are available on reasonable request from the corresponding authors.
Conflicts of Interest
The authors declare no conflict of interest.
Abbreviations
ACTB (Actin beta), ApoB (Apolipoprotein B), AUC (Area under the curve), B2M (beta-2-microglobulin), BMI (Body Mass Index), BW (Body weight), ChA (Chlorogenic acid), CVDs (cardiovascular diseases), FFAs (Free Fatty acids), FG (Fasting glucose), FXR (Farnesoid X receptor), , GK (Glicerol Kinase), GT (Golden tomato), GTT (Glucose tolerance test), HCC (Hepatocellular carcinoma), HDL Chol (high-density lipoprotein) cholesterol, HFD (High fat diet), HFD/GT (High fat diet/ golden tomatoes), HFD/RT (High fat diet/ red tomatoes), HNF4α (Hepatocyte nuclear factor 4, alpha), HPF (High-power field), HPRT1 (Hypoxanthine phosphoribosyl transferase 1), IL6 (Interleukin 6), IR (Insulin resistance), LD (Liver decompensation), LDHA (Lactate dehydrogenase A), LDL Chol (low- density lipoprotein) cholestrol, Lepr (Leptin receptor), MAFLD (Metabolic Dysfunction-Associated Fatty Liver Disease), MetS (Metabolic Syndrome), MUFA (Monounsaturated Fatty Acids), NAFLD (Nonalcoholic fatty liver disease), NASH (Nonalcoholic steatohepatitis), NPD (Normal pelleted diet), PNPLA3 (Patatin-like phospholipase domain-containing protein 3), PPARA ((Peroxisome Proliferator Activated Receptor Alpha) PUFA (Polyunsaturated fatty acids), RPLP1 (Ribosomal protein, large, P1), RT (Red tomato), SCFAs (short chain fatty acids), SFA (Saturated fatty acids), T Chol (Total Cholesterol), TG (Triglycerides), TM6SF2 (Transmembrane 6 superfamily 2), TNF-α (Tumor necrosis factor alpha), VLDL (Very low density lipoprotein).
References
- Méndez-Sánchez, N.; Bugianesi, E.; Gish, R.G.; Lammert, F.; Tilg, H.; Nguyen, M.H.; Sarin, S.K.; Fabrellas, N.; Zelber-Sagi, S.; Fan, J.G.; et al. Global Multi-Stakeholder Endorsement of the MAFLD Definition. Lancet Gastroenterol Hepatol 2022, 7, 388–390. [Google Scholar] [CrossRef] [PubMed]
- Cotter, T.G.; Rinella, M. Nonalcoholic Fatty Liver Disease 2020: The State of the Disease. Gastroenterology 2020, 158, 1851–1864. [Google Scholar] [CrossRef] [PubMed]
- WJG-2Antioxidant in NAFLD.
- Di Majo, D.; Cacciabaudo, F.; Accardi, G.; Gambino, G.; Giglia, G.; Ferraro, G.; Candore, G.; Sardo, P. Ketogenic and Modified Mediterranean Diet as a Tool to Counteract Neuroinflammation in Multiple Sclerosis: Nutritional Suggestions. Nutrients 2022, 14. [Google Scholar] [CrossRef] [PubMed]
- Navarro-González, I.; García-Alonso, J.; Periago, M.J. Bioactive Compounds of Tomato: Cancer Chemopreventive Effects and Influence on the Transcriptome in Hepatocytes. J Funct Foods 2018, 42, 271–280. [Google Scholar] [CrossRef]
- Cronin, P.; Joyce, S.A.; O’toole, P.W.; O’connor, E.M. Dietary Fibre Modulates the Gut Microbiota. Nutrients 2021, 13. [Google Scholar] [CrossRef] [PubMed]
- Ali, M.Y.; Sina, A.A.I.; Khandker, S.S.; Neesa, L.; Tanvir, E.M.; Kabir, A.; Khalil, M.I.; Gan, S.H. Nutritional Composition and Bioactive Compounds in Tomatoes and Their Impact on Human Health and Disease: A Review. Foods 2021, 10. [Google Scholar] [CrossRef] [PubMed]
- Fenni, S.; Hammou, H.; Astier, J.; Bonnet, L.; Karkeni, E.; Couturier, C.; Tourniaire, F.; Landrier, J.F. Lycopene and Tomato Powder Supplementation Similarly Inhibit High-Fat Diet Induced Obesity, Inflammatory Response, and Associated Metabolic Disorders. Mol Nutr Food Res 2017, 61. [Google Scholar] [CrossRef] [PubMed]
- Jiang, W.; Guo, M.H.; Hai, X. Hepatoprotective and Antioxidant Effects of Lycopene on Non-Alcoholic Fatty Liver Disease in Rat. World J Gastroenterol 2016, 22, 10180–10188. [Google Scholar] [CrossRef]
- Ma, Y.; Gao, M.; Liu, D. Chlorogenic Acid Improves High Fat Diet-Induced Hepatic Steatosis and Insulin Resistance in Mice. Pharm Res 2015, 32, 1200–1209. [Google Scholar] [CrossRef]
- Farrell, G.C.; Larter, C.Z. Nonalcoholic Fatty Liver Disease: From Steatosis to Cirrhosis. Hepatology 2006, 43. [Google Scholar] [CrossRef]
- Vitale, A.; Svegliati-Baroni, G.; Ortolani, A.; Cucco, M.; Dalla Riva, G. V.; Giannini, E.G.; Piscaglia, F.; Rapaccini, G.; Di Marco, M.; Caturelli, E.; et al. Epidemiological Trends and Trajectories of MAFLD-Associated Hepatocellular Carcinoma 2002-2033: The ITA.LI.CA Database. Gut 2023, 72, 141–152. [Google Scholar] [CrossRef] [PubMed]
- Wong, R.J.; Cheung, R.; Ahmed, A. Nonalcoholic Steatohepatitis Is the Most Rapidly Growing Indication for Liver Transplantation in Patients with Hepatocellular Carcinoma in the U.S. Hepatology 2014, 59, 2188–2195. [Google Scholar] [CrossRef] [PubMed]
- Tilg, H.; Moschen, A.R. Evolution of Inflammation in Nonalcoholic Fatty Liver Disease: The Multiple Parallel Hits Hypothesis. Hepatology 2010, 52, 1836–1846. [Google Scholar] [CrossRef] [PubMed]
- Francque, S.M.; Marchesini, G.; Kautz, A.; Walmsley, M.; Dorner, R.; Lazarus, J. V.; Zelber-Sagi, S.; Hallsworth, K.; Busetto, L.; Frühbeck, G.; et al. Non-Alcoholic Fatty Liver Disease: A Patient Guideline. JHEP Reports 2021, 3. [Google Scholar] [CrossRef]
- Ali, R.; Cusi, K. New Diagnostic and Treatment Approaches in Non-Alcoholic Fatty Liver Disease (NAFLD). Ann Med 2009, 41, 265–278. [Google Scholar] [CrossRef]
- Demiray, E.; Tulek, Y.; Yilmaz, Y. Degradation Kinetics of Lycopene, β-Carotene and Ascorbic Acid in Tomatoes during Hot Air Drying. LWT 2013, 50, 172–176. [Google Scholar] [CrossRef]
- Lee, Y.; Hu, S.; Park, Y.K.; Lee, J.Y. Health Benefits of Carotenoids: A Role of Carotenoids in the Prevention of Non-Alcoholic Fatty Liver Disease. Prev Nutr Food Sci 2019, 24, 103–113. [Google Scholar] [CrossRef]
- Okechukwu, G.N.; Nweke, O.B.; Nwafor, A.J.; Godson, A.G.; Kenneth, E.U.; Ibegbu, A.O. Beta (β)-Carotene-Induced Effects on the Hepato-Biochemical Parameters in Wistar Rats Fed Dietary Fats; 2019; Vol. 12;
- Marcelino, G.; Machate, D.J.; Freitas, K. de C.; Hiane, P.A.; Maldonade, I.R.; Pott, A.; Asato, M.A.; Candido, C.J.; Guimarães, R. de C.A. β-Carotene: Preventive Role for Type 2 Diabetes Mellitus and Obesity: A Review. Molecules 2020, 25. [Google Scholar] [CrossRef]
- Christensen, K.; Lawler, T.; Mares, J. Dietary Carotenoids and Non-Alcoholic Fatty Liver Disease among US Adults, NHANES 2003–2014. Nutrients 2019, 11. [Google Scholar] [CrossRef]
- Baybutt, R.C.; Molteni, A. Dietary B-Carotene Protects Lung and Liver Parenchyma of Rats Treated with Monocrotaline; 1999; Vol. 137;
- Elvira-Torales, L.I.; García-Alonso, J.; Periago-Castón, M.J. Nutritional Importance of Carotenoids and Their Effect on Liver Health: A Review. Antioxidants 2019, 8. [Google Scholar] [CrossRef]
- Palozza, P.; Catalano, A.; Simone, R.E.; Mele, M.C.; Cittadini, A. Effect of Lycopene and Tomato Products on Cholesterol Metabolism. Ann Nutr Metab 2012, 61, 126–134. [Google Scholar] [CrossRef] [PubMed]
- Lee, S.; Lee, C.H.; Moon, S.S.; Kim, E.; Kim, C.T.; Kim, B.H.; Bok, S.H.; Jeong, T.S. Naringenin Derivatives as Anti-Atherogenic Agents. Bioorg Med Chem Lett 2003, 13, 3901–3903. [Google Scholar] [CrossRef]
- Galluzzo, P.; Ascenzi, P.; Bulzomi, P.; Marino, M. The Nutritional Flavanone Naringenin Triggers Antiestrogenic Effects by Regulating Estrogen Receptor α-Palmitoylation. Endocrinology 2008, 149, 2567–2575. [Google Scholar] [CrossRef] [PubMed]
- Mulvihill, E.E.; Allister, E.M.; Sutherland, B.G.; Telford, D.E.; Sawyez, C.G.; Edwards, J.Y.; Markle, J.M.; Hegele, R.A.; Huff, M.W. Naringenin Prevents Dyslipidemia, Apolipoprotein B Overproduction, and Hyperinsulinemia in LDL Receptor-Null Mice with Diet-Induced Insulin Resistance. Diabetes 2009, 58, 2198–2210. [Google Scholar] [CrossRef] [PubMed]
- Da Pozzo, E.; Costa, B.; Cavallini, C.; Testai, L.; Martelli, A.; Calderone, V.; Martini, C. The Citrus Flavanone Naringenin Protects Myocardial Cells against Age-Associated Damage. Oxid Med Cell Longev 2017, 2017. [Google Scholar] [CrossRef] [PubMed]
- Naeini, F.; Namkhah, Z.; Ostadrahimi, A.; Tutunchi, H.; Hosseinzadeh-Attar, M.J. A Comprehensive Systematic Review of the Effects of Naringenin, a Citrus-Derived Flavonoid, on Risk Factors for Nonalcoholic Fatty Liver Disease. Advances in Nutrition 2021, 12, 413–428. [Google Scholar] [CrossRef] [PubMed]
- Olthof, M.R. ; Peter, ^; Hollman, C.H.; Katan, M.B. Human Nutrition and Metabolism Chlorogenic Acid and Caffeic Acid Are Absorbed in Humans^; 2001; Vol. 131.
- Strack, D.; Gross, W. Properties and Activity Changes of Chlorogenic Acid:Glucaric Acid Caffeoyltransferase From Tomato (Lycopersicon Esculentum); 1990; Vol. 92;
- Wan, C.W.; Wong, C.N.Y.; Pin, W.K.; Wong, M.H.Y.; Kwok, C.Y.; Chan, R.Y.K.; Yu, P.H.F.; Chan, S.W. Chlorogenic Acid Exhibits Cholesterol Lowering and Fatty Liver Attenuating Properties by Up-Regulating the Gene Expression of PPAR-α in Hypercholesterolemic Rats Induced with a High-Cholesterol Diet. Phytotherapy Research 2013, 27, 545–551. [Google Scholar] [CrossRef] [PubMed]
- Naveed, M.; Hejazi, V.; Abbas, M.; Kamboh, A.A.; Khan, G.J.; Shumzaid, M.; Ahmad, F.; Babazadeh, D.; FangFang, X.; Modarresi-Ghazani, F.; et al. Chlorogenic Acid (CGA): A Pharmacological Review and Call for Further Research. Biomedicine and Pharmacotherapy 2018, 97, 67–74. [Google Scholar] [CrossRef]
- Cho, A.S.; Jeon, S.M.; Kim, M.J.; Yeo, J.; Seo, K. Il; Choi, M.S.; Lee, M.K. Chlorogenic Acid Exhibits Anti-Obesity Property and Improves Lipid Metabolism in High-Fat Diet-Induced-Obese Mice. Food and Chemical Toxicology 2010, 48, 937–943. [Google Scholar] [CrossRef]
- Yilmaz, B.; Sahin, K.; Bilen, H.; Bahcecioglu, I.H.; Bilir, B.; Ashraf, S.; Halazun, K.J.; Kucuk, O. Carotenoids and Non-Alcoholic Fatty Liver Disease. Hepatobiliary Surg Nutr 2015, 4, 161–171. [Google Scholar] [CrossRef]
- Alam, M.A.; Subhan, N.; Rahman, M.M.; Uddin, S.J.; Reza, H.M.; Sarker, S.D. Effect of Citrus Flavonoids, Naringin and Naringenin, on Metabolic Syndrome and Their Mechanisms of Action. Advances in Nutrition 2014, 5, 404–417. [Google Scholar] [CrossRef] [PubMed]
- Yu, D.; Chen, G.; Pan, M.; Zhang, J.; He, W.; Liu, Y.; Nian, X.; Sheng, L.; Xu, B. High Fat Diet-Induced Oxidative Stress Blocks Hepatocyte Nuclear Factor 4α and Leads to Hepatic Steatosis in Mice. J Cell Physiol 2018, 233, 4770–4782. [Google Scholar] [CrossRef] [PubMed]
- Xu, Y.; Zalzala, M.; Xu, J.; Li, Y.; Yin, L.; Zhang, Y. A Metabolic Stress-Inducible MiR-34a-HNF4α Pathway Regulates Lipid and Lipoprotein Metabolism. Nat Commun 2015, 6. [Google Scholar] [CrossRef] [PubMed]
- Lee, D.H.; Park, S.H.; Ahn, J.; Hong, S.P.; Lee, E.; Jang, Y.J.; Ha, T.Y.; Huh, Y.H.; Ha, S.Y.; Jeon, T. Il; et al. Mir214-3p and Hnf4a/Hnf4α Reciprocally Regulate Ulk1 Expression and Autophagy in Nonalcoholic Hepatic Steatosis. Autophagy 2021, 17, 2415–2431. [Google Scholar] [CrossRef] [PubMed]
- Fishman, S.; Muzumdar, R.H.; Atzmon, G.; Ma, X.; Yang, X.; Einstein, F.H.; Barzilai, N. Resistance to Leptin Action Is the Major Determinant of Hepatic Triglyceride Accumulation in Vivo. The FASEB Journal 2007, 21, 53–60. [Google Scholar] [CrossRef] [PubMed]
- Rodríguez, A.; Moreno, N.R.; Balaguer, I.; Méndez-Giménez, L.; Becerril, S.; Catalán, V.; Gómez-Ambrosi, J.; Portincasa, P.; Calamita, G.; Soveral, G.; et al. Leptin Administration Restores the Altered Adipose and Hepatic Expression of Aquaglyceroporins Improving the Non-Alcoholic Fatty Liver of Ob/Ob Mice. Sci Rep 2015, 5. [Google Scholar] [CrossRef]
- Zulet, M.A.; Macarulla, M.T.; Portillo, M.P.; Noel-Suberville, C.; Higueret, P.; Martínez, J.A. Lipid and Glucose Utilization in Hypercholesterolemic Rats Fed a Diet Containing Heated Chickpea (Cicer Aretinum L.): A Potential Functional Food. International Journal for Vitamin and Nutrition Research 1999, 69, 403–411. [Google Scholar] [CrossRef]
- Phachonpai, W.; Muchimapura, S.; Tong-Un, T.; Wattanathorn, J.; Thukhammee, W.; Thipkaew, C.; Sripanidkulchai, B.; Wannanon, P. ACUTE TOXICITY STUDY OF TOMATO POMACE EXTRACT IN RODENT. Online J Biol Sci 2013, 13, 28–34. [Google Scholar] [CrossRef]
- Aborehab, N.M.; El Bishbishy, M.H.; Waly, N.E. Resistin Mediates Tomato and Broccoli Extract Effects on Glucose Homeostasis in High Fat Diet-Induced Obesity in Rats. BMC Complement Altern Med 2016, 16. [Google Scholar] [CrossRef]
- Di Majo, D.; Sardo, P.; Giglia, G.; Di Liberto, V.; Zummo, F.P.; Zizzo, M.G.; Caldara, G.F.; Rappa, F.; Intili, G.; van Dijk, R.M.; et al. Correlation of Metabolic Syndrome with Redox Homeostasis Biomarkers: Evidence from High-Fat Diet Model in Wistar Rats. Antioxidants 2022, 12, 89. [Google Scholar] [CrossRef]
- Rodríguez-Correa, E.; González-Pérez, I.; Clavel-Pérez, P.I.; Contreras-Vargas, Y.; Carvajal, K. Biochemical and Nutritional Overview of Diet-Induced Metabolic Syndrome Models in Rats: What Is the Best Choice? Nutr Diabetes 2020, 10. [Google Scholar] [CrossRef] [PubMed]
- Liu, X.; Wang, W.; Hu, H.; Tang, N.; Zhang, C.; Liang, W.; Wang, M. Smad3 Specific Inhibitor, Naringenin, Decreases the Expression of Extracellular Matrix Induced by TGF-Β1 in Cultured Rat Hepatic Stellate Cells. Pharm Res 2006, 23, 82–89. [Google Scholar] [CrossRef] [PubMed]
Figure 1.
Delta Body Weight (BW, grams) of the experimental groups. One-way Anova comparisons between groups for **p<0.01, ***p=0.0001 and ****p<0.0001.
Figure 1.
Delta Body Weight (BW, grams) of the experimental groups. One-way Anova comparisons between groups for **p<0.01, ***p=0.0001 and ****p<0.0001.
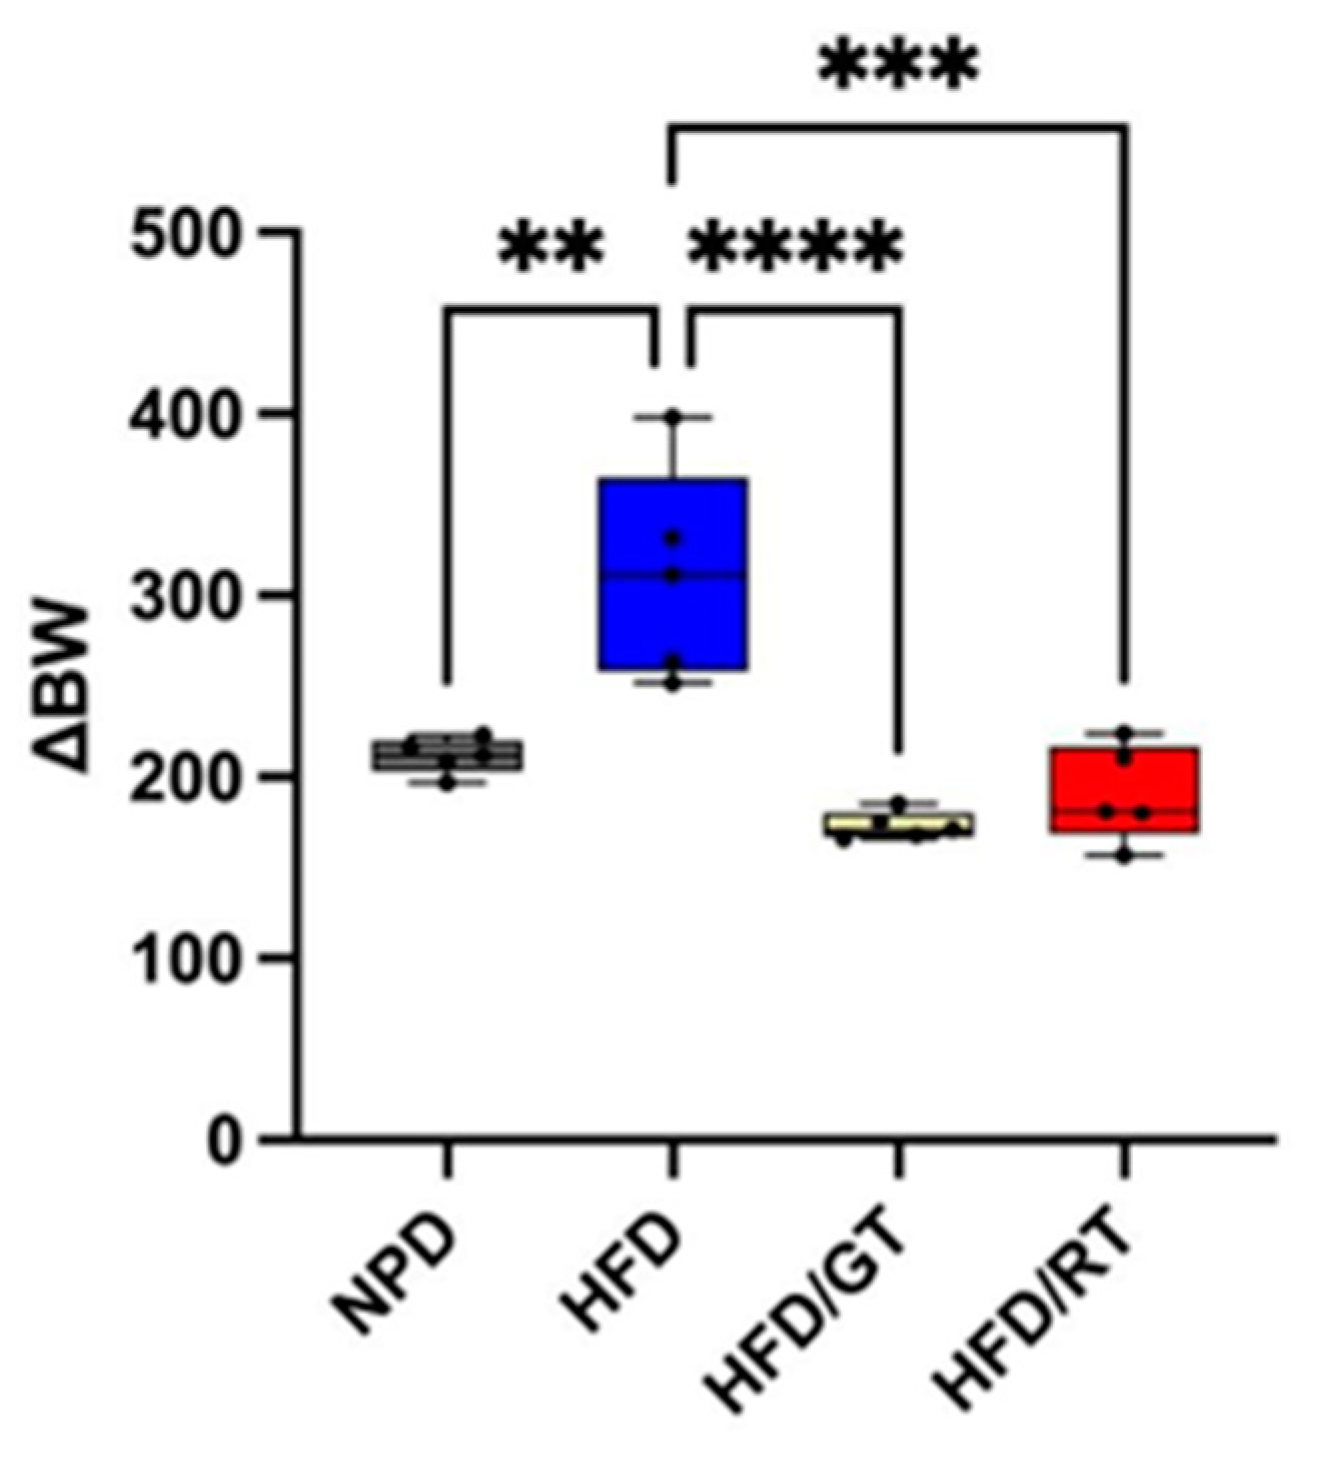
Figure 2.
Homa Index of the experimental groups. One-way Anova comparisons between groups for ***p=0.0001 and ****p<0.0001.
Figure 2.
Homa Index of the experimental groups. One-way Anova comparisons between groups for ***p=0.0001 and ****p<0.0001.
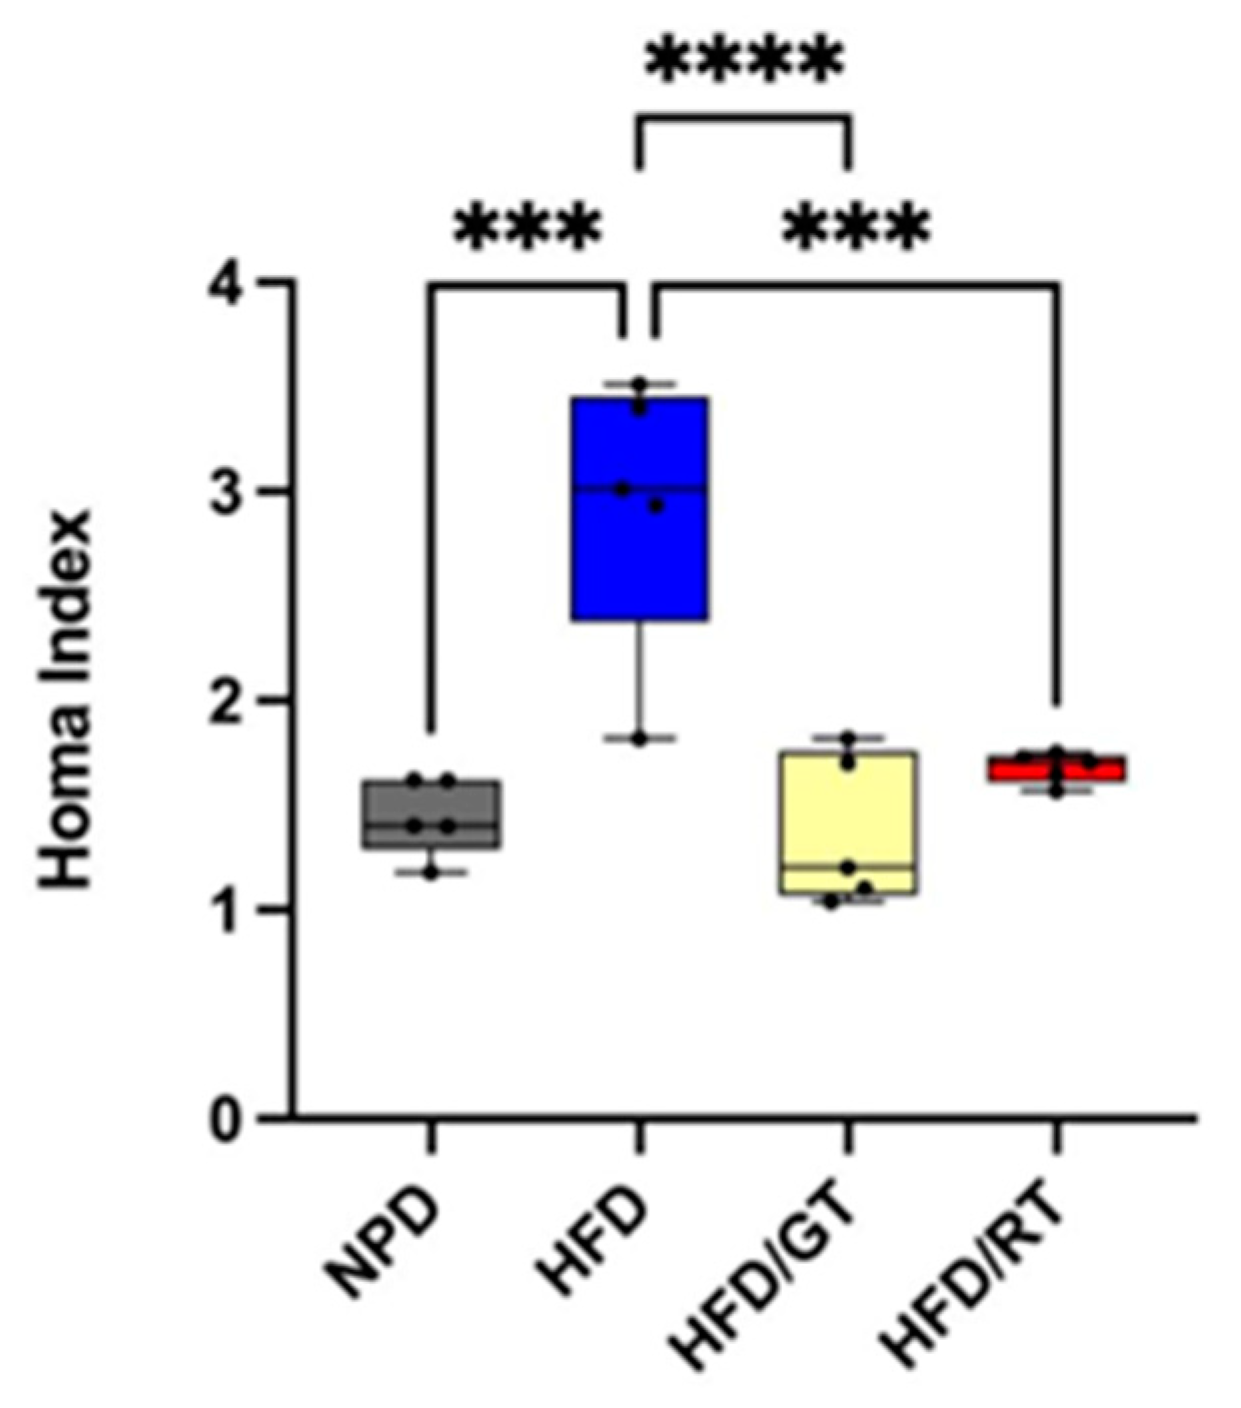
Figure 3.
Representative images of the histological evaluation of the liver parenchyma on hematoxylin and eosin staining. (A,B: Control NPD; C,D: HFD; E,F: HFD/RT; G,H: HFD/GT). A,C,E,G: magnification 200x, scale bar 50µm. B,D,F,H: magnification 400x, scale bar 20µm. I: percentage of steatosis. Data are presented as the mean ± SD. p NPD vs HFD: p <0.001, NPD vs HFD/RT: p <0.001; NPD vs HFD/GT: p <0.001; HFD vs HFD/RT: p <0.001 ; HFD vs HFD/GT: p <0.001; HFD/RT vs HFD/GT: p <0.01.
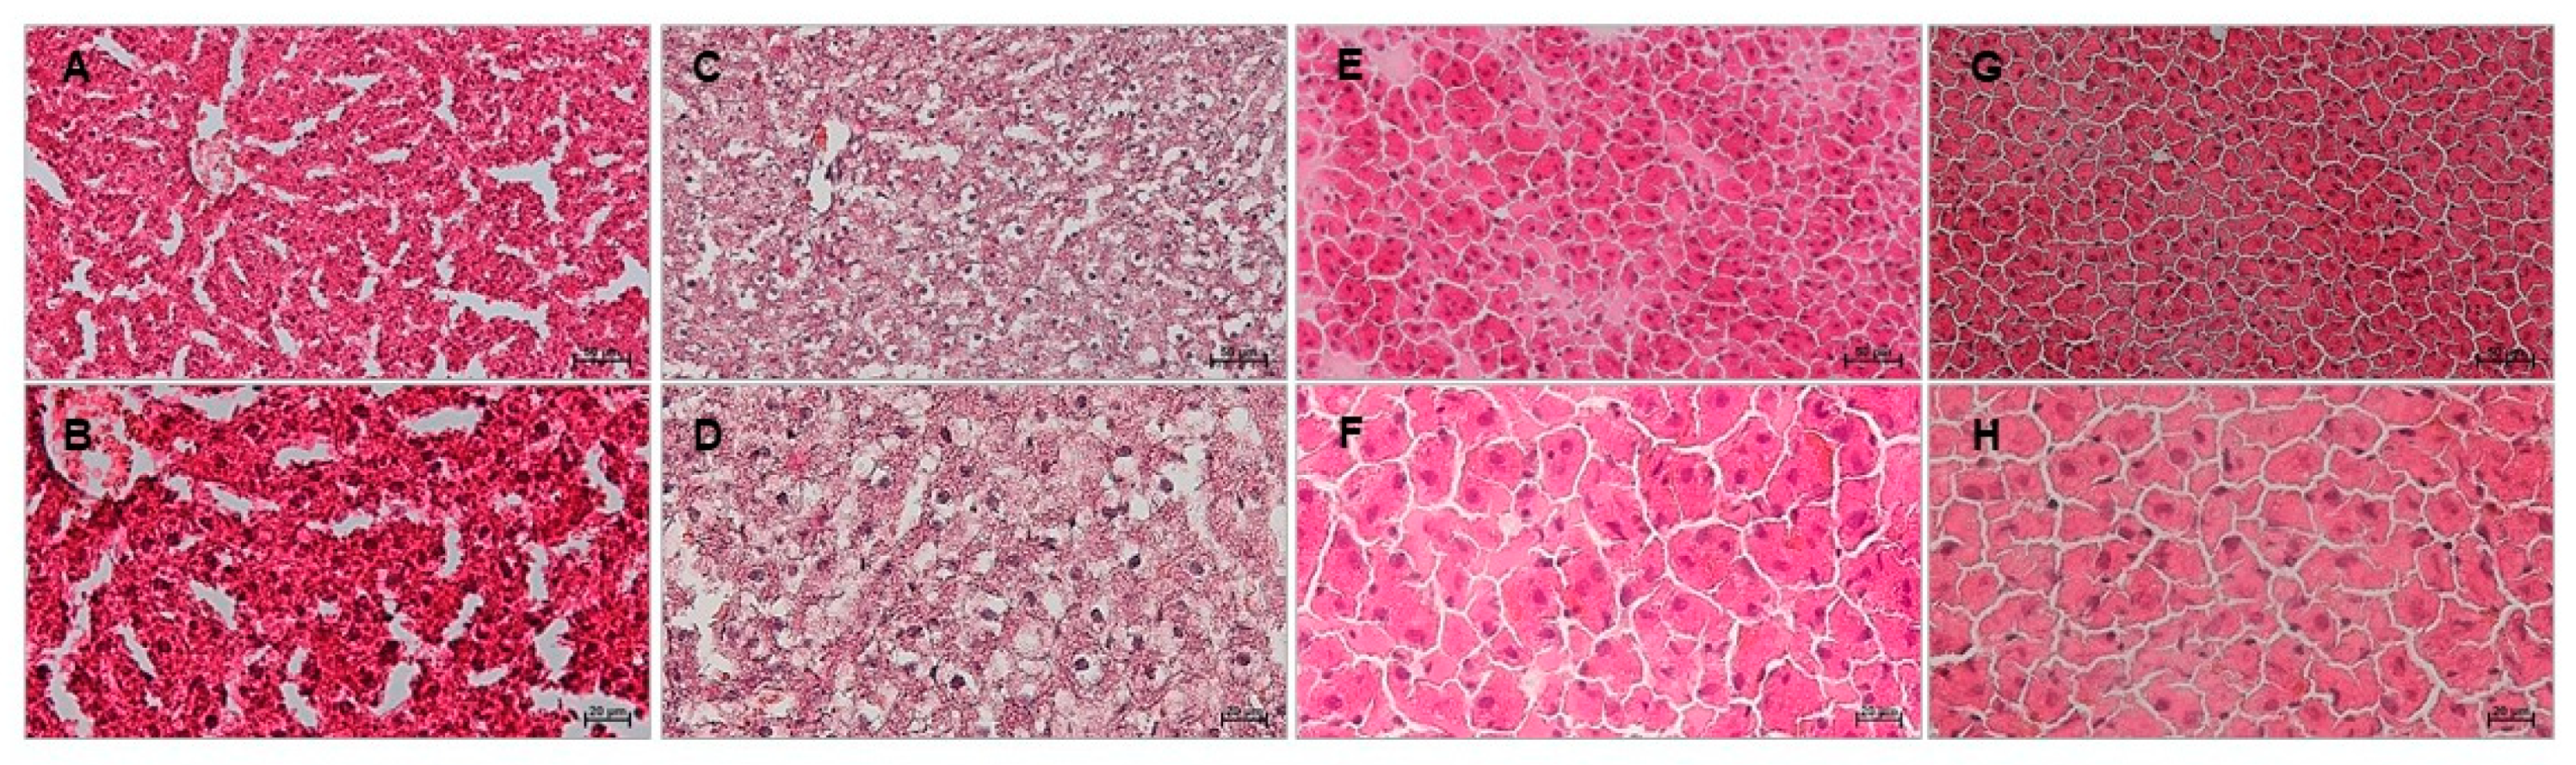
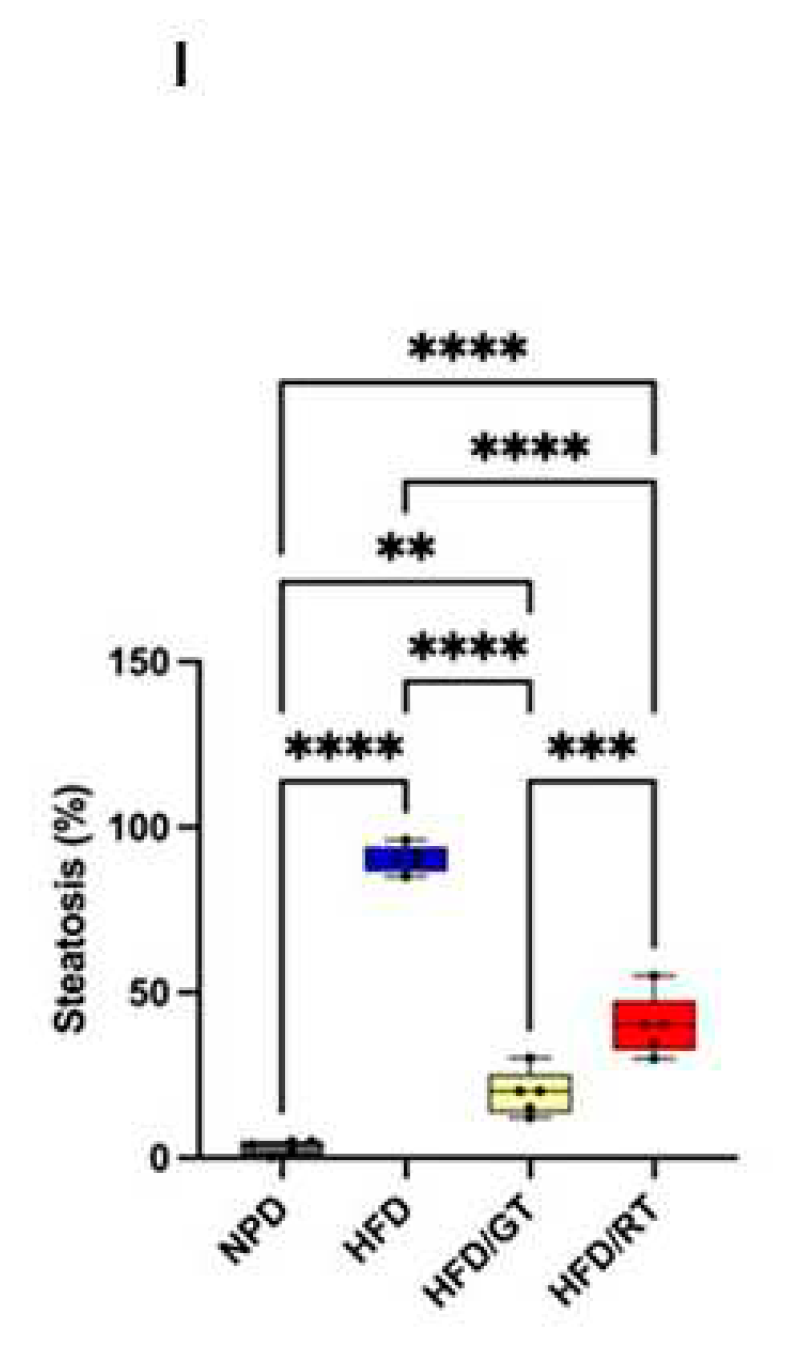
Figure 5.
Relative changes in the fold expression of the genes involved in rat fatty liver pathways with p-value cutoff of 0.05. The analysis was performed in genes differentially expressed with respect to HFD control group in dependence of the nutrition supplementation with red tomatoes (red bars), and golden tomatoes (yellow bars).
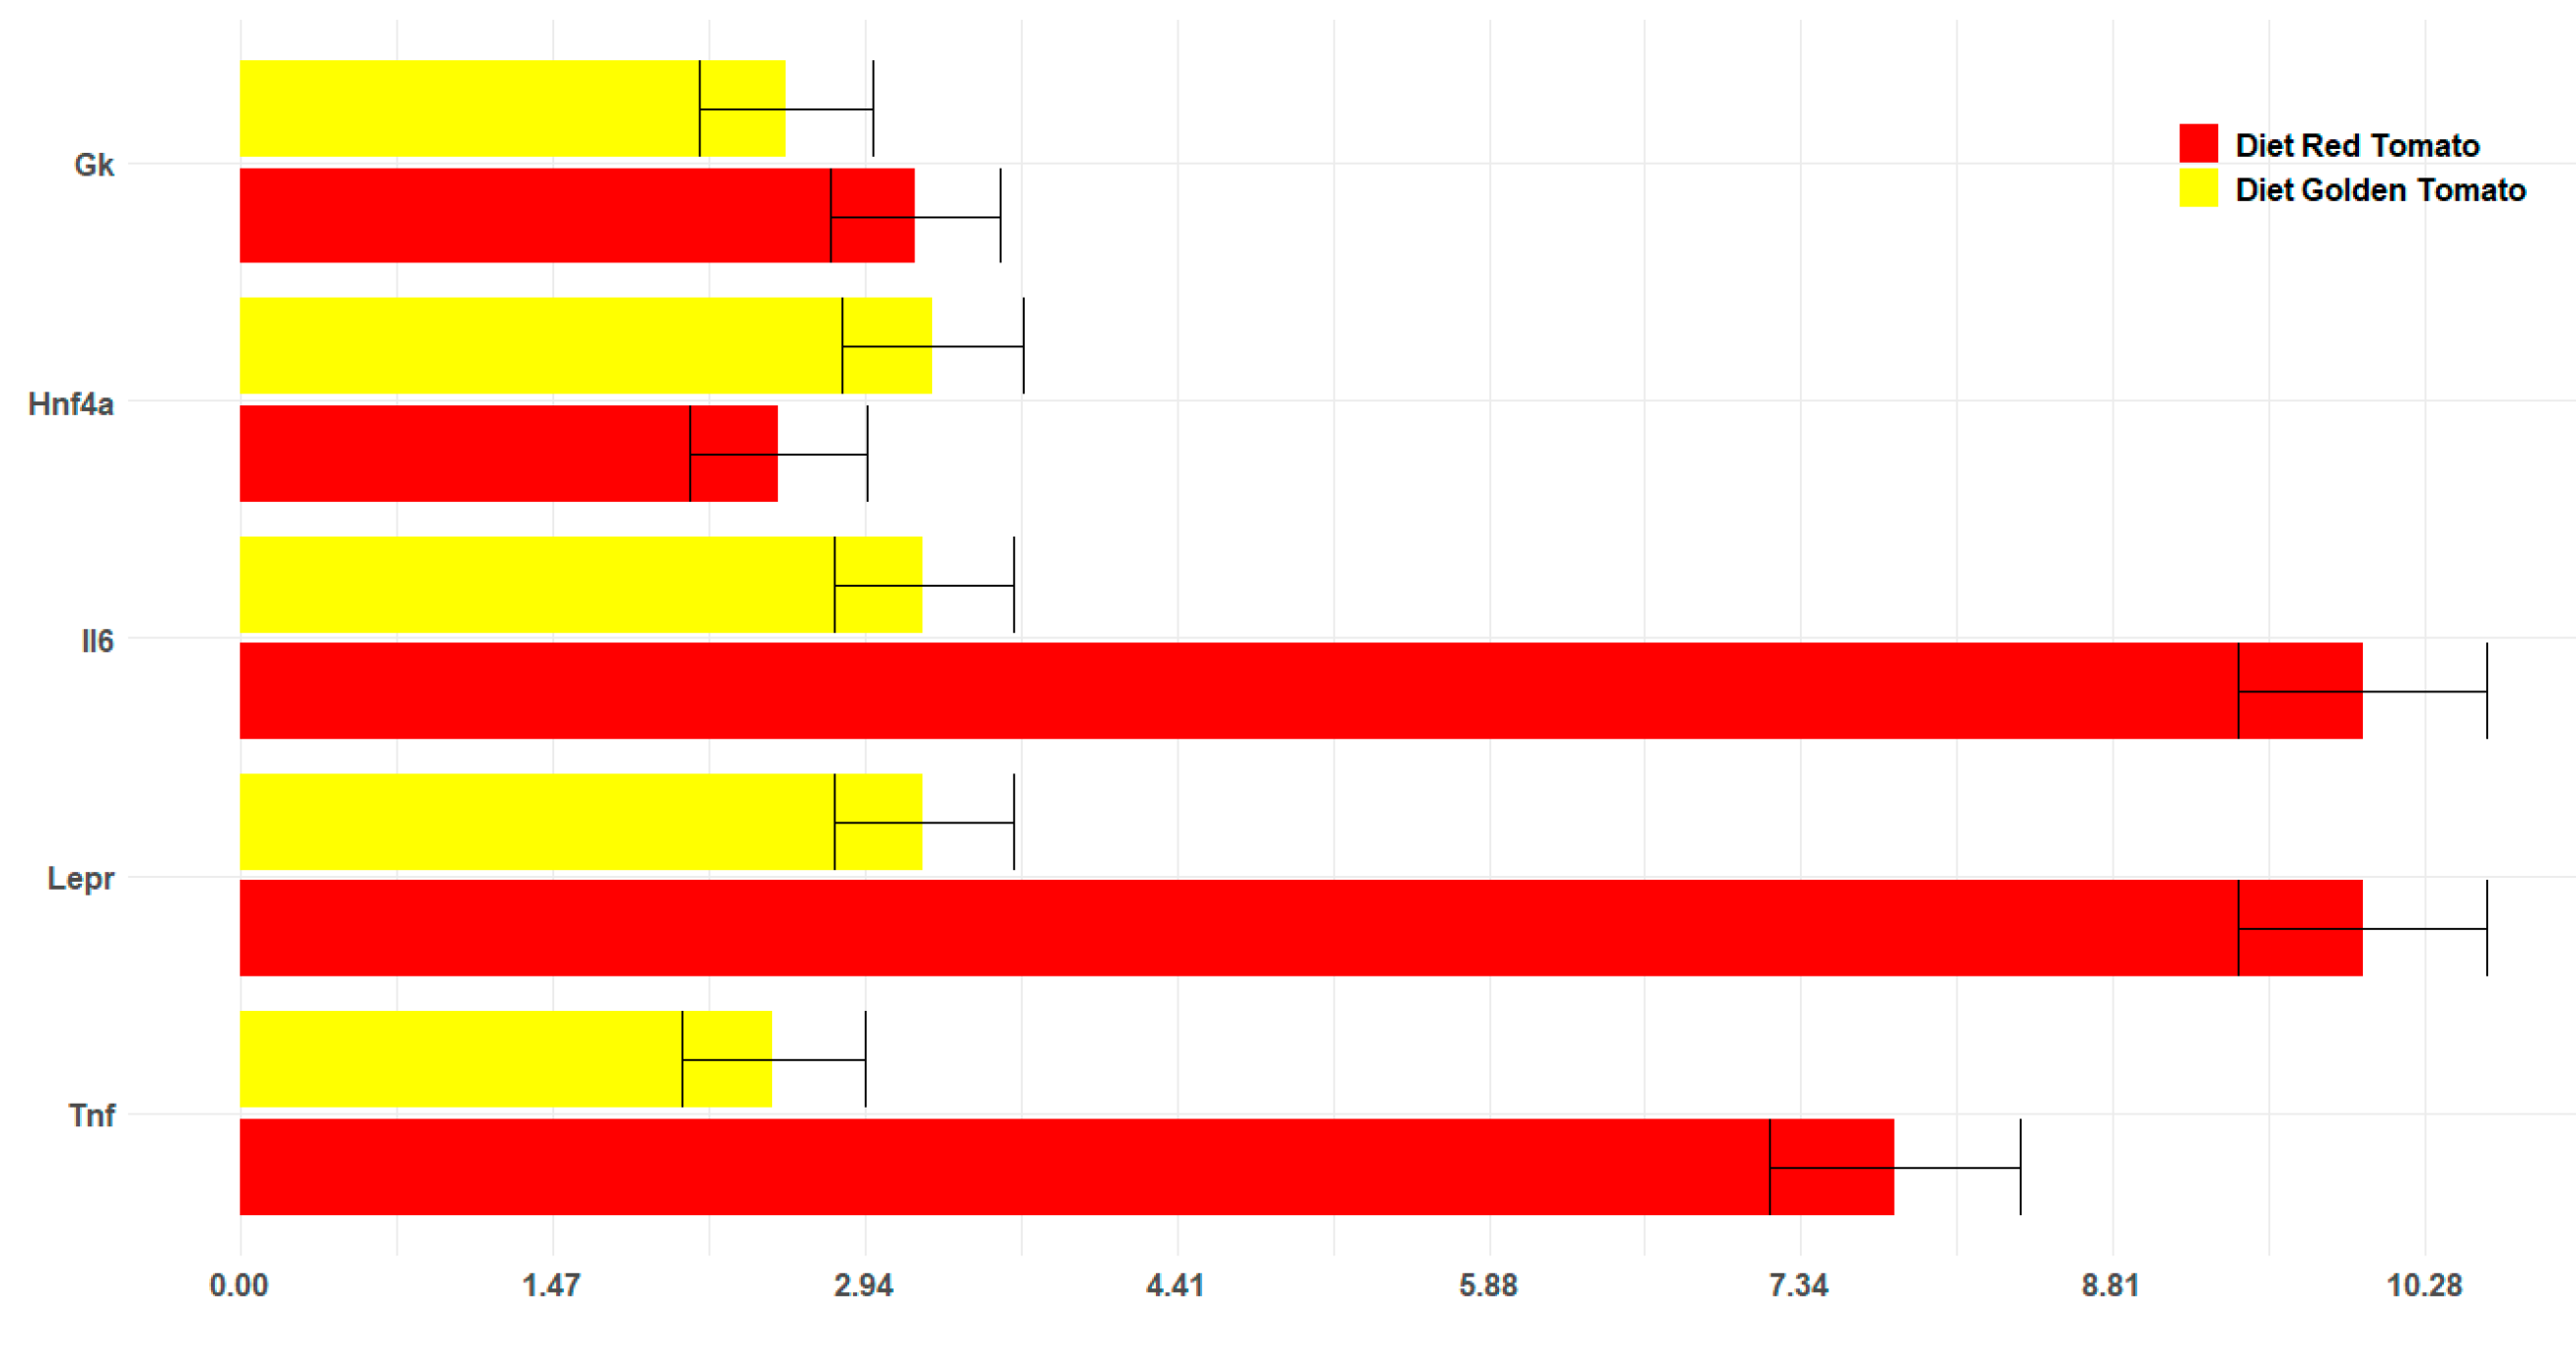
Figure 5.
Schematic representation of different color classes of tomatoes: the green (5A), pre-veraison (5B) and veraison tomatoes (5C).
Figure 5.
Schematic representation of different color classes of tomatoes: the green (5A), pre-veraison (5B) and veraison tomatoes (5C).
Figure 6.
Experimental timing and groups of animals.
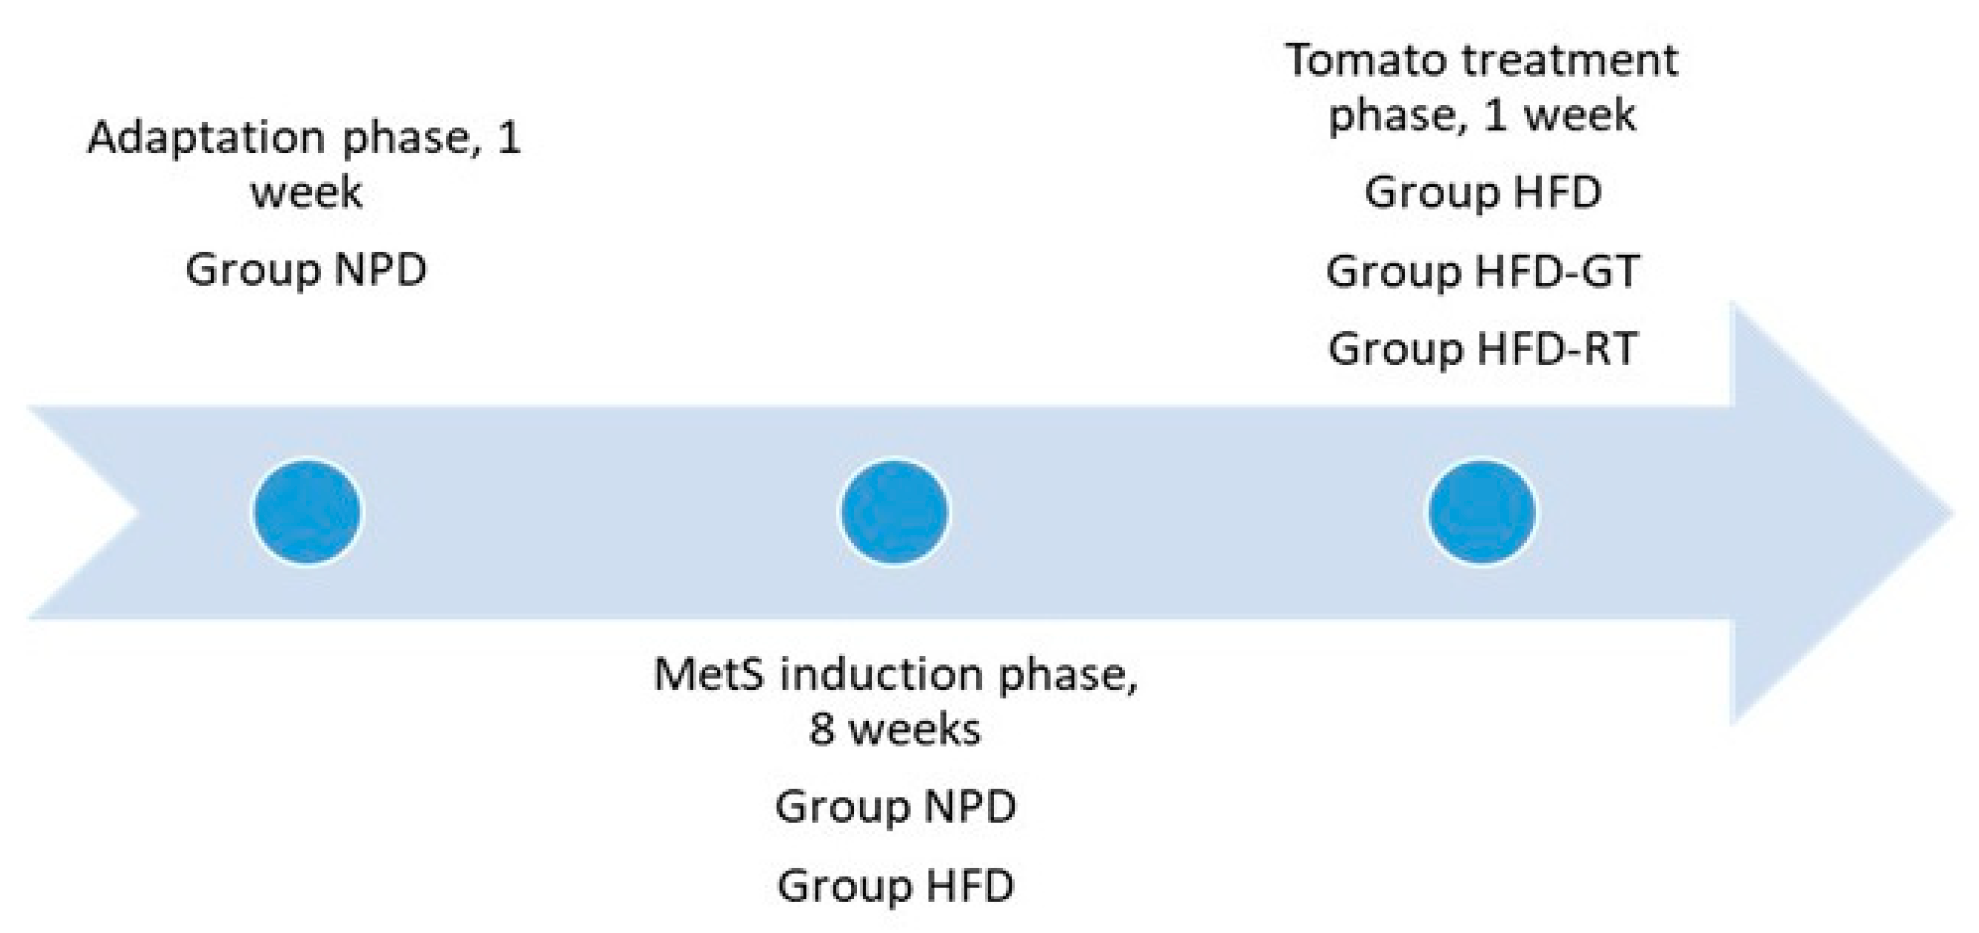

Table 1.
Biochemical parameters of lipid homeostasis: triglycerides (TG), Total Cholesterol (T Chol), LDL Cholesterol (LDL Chol), and HDL Cholesterol (HDL Chol) expressed as mg/dL. Statistical significance for *p<0.05, **p<0.001 and ***p<0.0001 vs HFD and for #p<0.05 and ##p<0.01 vs NPD groups.
Table 1.
Biochemical parameters of lipid homeostasis: triglycerides (TG), Total Cholesterol (T Chol), LDL Cholesterol (LDL Chol), and HDL Cholesterol (HDL Chol) expressed as mg/dL. Statistical significance for *p<0.05, **p<0.001 and ***p<0.0001 vs HFD and for #p<0.05 and ##p<0.01 vs NPD groups.
| Experimental Groups | TG | T Chol | LDL Chol | HDL Chol |
|---|---|---|---|---|
| NPD | 80.42± 16.08 | 75.44±5.96 | 31.74±9.72 | 26.37±0.58 |
| HFD | 125.72± 12.83## | 93.55±4.49# | 52.56±6.00# | 16.12±2.62# |
| HFD/GT | 99.17± 7.31* | 110.49±12.47*# | 34.32±7.72** | 56.56±9.14***## |
| HFD/RT | 85.70±16.67** | 98.58±9.60# | 37.76±4.13* | 39.20±4.95**# |
Table 2.
Biochemical parameters of glucose homeostasis, Area Under the Curve (AUC) and Fasting Glucose. Statistical significance for *p<0.05, **p<0.001 and ***p<0.0001 vs HFD and for #p<0.05 and ##p<0.01 vs NPD groups.
Table 2.
Biochemical parameters of glucose homeostasis, Area Under the Curve (AUC) and Fasting Glucose. Statistical significance for *p<0.05, **p<0.001 and ***p<0.0001 vs HFD and for #p<0.05 and ##p<0.01 vs NPD groups.
| Experimental Groups | AUC | Fasting Glucose (mg/dL) |
|---|---|---|
| NPD | 333.75± 38.65 | 103.34± 11.17 |
| HFD | 492.79±17.30## | 150.85± 35.41# |
| HFD/GT | 412.00± 18.76 **## | 108.53± 11.67* |
| HFD/RT | 448.40 ±41.24 | 126.91±9.60 |
Table 3.
Components of standard laboratory food (code PF1609) and of high fat food (code PF4215).
| Component of diet | Pellet NPD (PF1609) | Pellet HFD (PF4215) |
|---|---|---|
| Energy (Kcal/Kg) | 3947 | 5500–6000 |
| Fat Total (g/100 g) | 3,5 | 60 |
| SFA (g/60 g) | 0,7 | 30 |
| MUFA (g/60 g | 0,8 | 23 |
| PUFA (g/60 g) | 2 | 7 |
| Crude Protein (g/100 g) | 22 | 23 |
| Carbohydrates (Starch g/100 g) | 35,18 | 38 |
| Fiber (g/100 g) | 4,5 | 5 |
| Ash (g/100 g) | 7,5 | 5,5 |
| Vitamin A (IU) | 8,4 | 19,5 |
| Vitamin D3 (IU) | 1260 | 2100 |
Disclaimer/Publisher’s Note: The statements, opinions and data contained in all publications are solely those of the individual author(s) and contributor(s) and not of MDPI and/or the editor(s). MDPI and/or the editor(s) disclaim responsibility for any injury to people or property resulting from any ideas, methods, instructions or products referred to in the content. |
© 2023 by the authors. Licensee MDPI, Basel, Switzerland. This article is an open access article distributed under the terms and conditions of the Creative Commons Attribution (CC BY) license (http://creativecommons.org/licenses/by/4.0/).
Copyright: This open access article is published under a Creative Commons CC BY 4.0 license, which permit the free download, distribution, and reuse, provided that the author and preprint are cited in any reuse.


