
Submitted:
18 October 2024
Posted:
21 October 2024
You are already at the latest version
Abstract
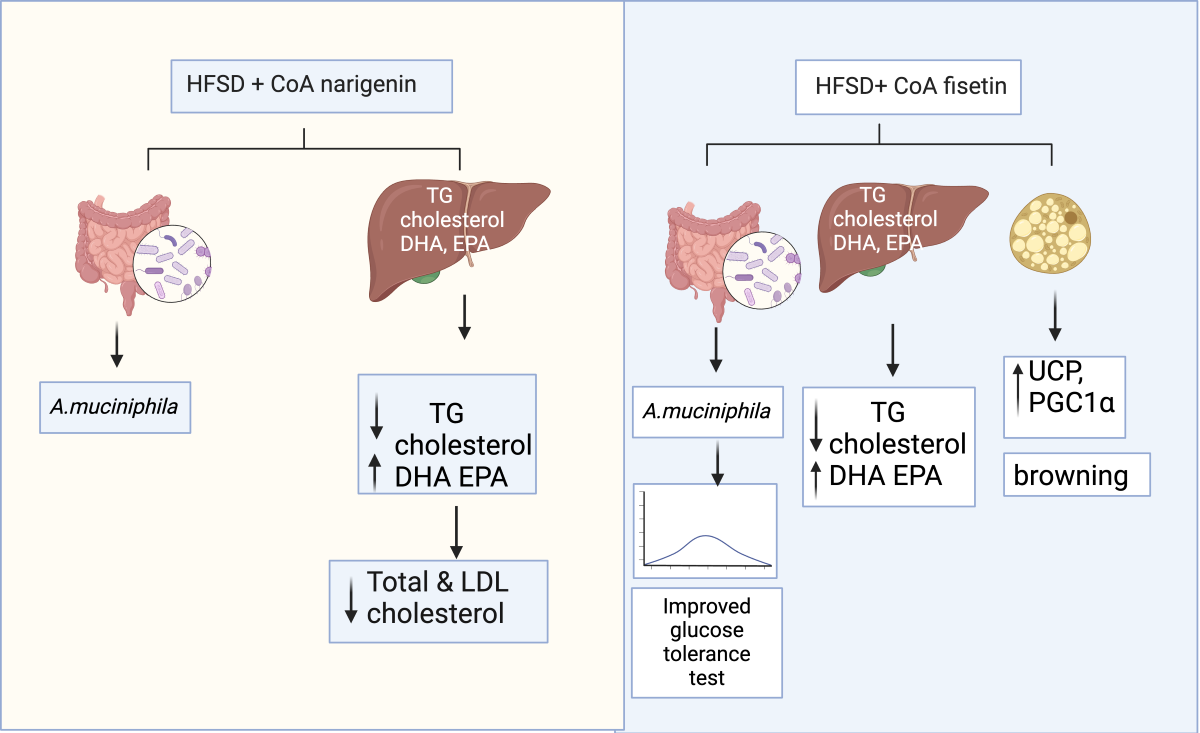
Background/Objective: In recent studies, it has been shown that dietary bioactive compounds can produce health benefits, however, it is not known whether an improvement in solubility can enhance their biological effects. Thus, the aim of this work was to study whether co-amorphous (CoA) of naringenin or fisetin with enhanced solubility modify glucose and lipid metabolism, thermogenic capacity and gut microbiota in mice fed a high-fat, high-sucrose (HFSD) diet. Methods: Mice were fed with a HFSD with or without CoA-naringenin or CoA-fisetin for 3 months. Body weight, food intake, body composition, glucose tolerance test, hepatic lipid composition and gut microbiota were assessed. Results: CoA-naringenin demonstrated significant reductions in fat mass gain, improved cholesterol metabolism, and enhanced glucose tolerance. Mice treated with CoA-naringenin gained 45% less fat mass and exhibited improved hepatic lipid profiles, with significant reductions in liver triglycerides and cholesterol. Additionally, both CoA-flavonoids increased oxygen consumption (VO2), contributing to enhanced energy expenditure and improved metabolic flexibility. Thermogenic activation, indicated by increased UCP1 and PGC-1α levels, was observed with CoA-naringenin, supporting its role in fat oxidation and adipocyte size reduction. Further, both CoA-flavonoids modulated gut microbiota, restoring diversity and promoting beneficial bacteria, such as Akkermansia muciniphila, linked to improved metabolic health. Conclusions: These findings suggest that co-amorphous naringenin or fisetin offer promising applications in improving solubility, metabolic health, and thermogenesis, highlighting their potential as therapeutic agents against obesity and related disorders.
Keywords:
Coamorphous
; naringenin
; fisetin
; energy expenditure
; glucose tolerance
1. Introduction
Metabolic syndrome is a worldwide health problem driven by multifactorial variables that affect various biological systems in the body. One of the factors that promotes the development of this syndrome is the excessive accumulation of adipose tissue [1]. Adipose tissue hypertrophy is generally caused by an increase in energy intake accompanied by a decrease in energy expenditure, resulting in a positive balance that is evidenced by an excess of lipid storage [2]. Abnormal lipid accumulation affects adipose tissue and hepatic metabolism by increasing the flow of circulating free fatty acids from adipose tissue to the liver and increasing hepatic lipogenesis [2]. Several metabolic pathways are involved in the progression of metabolic abnormalities during the development of obesity, leading to changes in adipose tissue inflammation, insulin resistance and adipogenesis [3]. Intracellular lipid accumulation in organs other than adipose tissue promotes an increase in circulating cytokines, leading to a systemic inflammatory state [2,3]. This systemic inflammation, accompanied by cytokine release in peripheral tissues and intracellular lipid accumulation, decreases insulin sensitivity and promotes vascular proliferation of the media artery by macrophages, which further increases cytokine release [3,4,5,6].
One of the major causes of metabolic syndrome is the abnormal accumulation of lipids in various organs [5]. Many strategies to combat this disease focus on increasing energy expenditure and reducing the amount of circulating and stored lipids. In recent years, there has been increased interest in the beneficial metabolic effects of certain bioactive compounds in foods, such as resveratrol, a polyphenol of the stilbene family found in red grapes [7,8]. Studies have shown that resveratrol improves energy expenditure by activating brown adipose tissue [9,10,11,12] and promoting browning of white adipose tissue [10,12], resulting in increased energy expenditure, decreased lipid accumulation, and improved glucose tolerance [10]. However, there are several bioactive compounds in the diet that may also have metabolic benefits that have not been studied.
Naringenin and fisetin, natural flavonoids found in a wide variety of fruits and vegetables, are known for their potent health benefits. Naringenin, found in citrus fruits such as grapefruit and oranges, has potent antioxidant [13] and anti-inflammatory [14,15] properties. It also supports cardiovascular health and may improve insulin sensitivity [16]. Fisetin, found in strawberries, apples and onions, is known for its potent antioxidant [17] and anti-inflammatory properties [18,19]. Both compounds are being studied for their therapeutic applications and promise important benefits for human health. However, further studies are needed to investigate their ability to regulate lipid accumulation in the liver and adipose tissue to understand their protective properties against obesity.
In the last decade, several effects of dietary bioactive compounds such as flavonoids have been shown to be associated with their ability to modulate the taxonomy of the gut microbiota which may in part mediate the health benefits of these compounds [20]. It is likely that the biological effects of flavonoids are influenced by the availability of these compounds due to their chemical nature, which may limit their biological activity since they are poorly soluble in water [21].
To overcome these limitations, we propose new co-amorphous phases based on non-covalent interactions with a co-former that stabilizes the active compounds. Amorphous solids lack long-range order and have a notoriously low packaging efficiency and a high potential energy compared to their crystalline counterparts, generally resulting in improved solubility and permeability [22,23] albeit a reduction in chemical stability. These proposed co-amorphous systems are formed by solid-state molecular interactions (particularly hydrogen bonds) between an active molecule and an innocuous and low-molecular weight compound, such as an amino acid or organic acid, which enhance the stability of the co-amorphous systems by inhibiting the crystallization of individual components [24].
Attempts are being made to modify the solubility of these compounds to potentially increase the effects of these molecules in the body, as well as their interaction with the gut microbiota. However, more research is still needed in this area to understand the potential effects on the host. Therefore, the aim of the present study was to determine the effect of the CoA bioactive compounds naringenin and fisetin on the gut microbiota, energy expenditure, lipid metabolism and expression of genes involved in thermogenesis in mice fed a high-fat high-sucrose diet (HFSD).
2. Materials and Methods
2.1. Materials
Serum glucose, cholesterol, LDL cholesterol, creatinine, urea, aspartate aminotransaminase (AST) and alanine transaminase (ALT) were measured with a COBAS c111 analyzer (Roche, Switzerland). Serum adiponectin and insulin concentrations were measured using Merck Millipore ELISA kits (Darmstadt, Germany). Leptin was measured with an ELISA kit obtained from Sigma Aldrich-Merck, (Darmstad, Germany). The anti-Uncoupled protein 1 (UCP1), anti-Peroxisome proliferator-activated receptor gamma coactivator 1-alpha (PGC1α), and anti-GAPDH were obtained from Abcam (Cambridge, UK). Anti-GAPDH was used as a loading control to normalize protein abundance. Protease and phosphatase inhibition cocktail was purchased from Roche, (Mannheim, Germany). To determine protein content the Immobilon Western chemiluminescent HRP substrate detection system was used and obtained from Millipore (Temecula, CA, USA). The chemidoc photo-documenter system (Bio-Rad Laboratories, Inc, Hercules, CA, USA) was used to record the blots images. Fecal samples were storage in RNA later QIAGEN (Hiden, Germany) at -70ºC and the DNA extraction from feces samples was obtained using QIAamp DNA Accessory Set A kit from QIAGEN (Hiden, Germany). The Illumina kit was used for DNA sequencing.
2.2. CoA Flavonoids Synthesis
CoA-flavonoids were obtained at a flavonoid/arginine molar ratio of 1:3 by flash evaporation using water as solvent for CoA-Fisetin and ethanol/water (9:1) for CoA-Naringenin while the mixtures were rotated at 80°C. The resulting solids were characterized by PXRD, FT-IR, NMR and DSC/TGA [25]. The solubility profiles of the CoA-flavonoids and starting materials (NAR and FST) were assayed in buffer solutions of pH 1.2, 4.5 and 6.8 by UV-V spectroscopy. The thermodynamic solubilities of the CoA-flavonoids were measured by gradually adding CoA-flavonoids to 0.5 mL of distilled water until the solution reached supersaturation. More information on these components can be found in patent application WO2024116042.
2.3. Animal Care and Maintenance
All the protocols and procedures described in this section had been approved by the animal care committee of the National Institute of Medical Sciences and Nutrition, CICUAL-2082 -22-23-1 Mexico City. All the animal procedures described in the experimental section were carried out inside the animal care facility. To perform this study C57BL/6 male mice of 8 weeks old with a weight of 22–25 g were caged (n = 7–9) with a 12-h light-dark cycle, at 22 °C for 100 days. To promote animal wellbeing mice were provided with enrichment toys such as mice tunnels from the begin to the end of experiment. Animals sample size was calculated comparing two means. During the study mice health were monitoring according to end point criteria protocol, previously approved by ethical review committee. Mice were randomly assigned to five different groups of diets, AIN-93 diet (control diet), high fat sucrose diet (HFSD), HFSD with 0.2% of CoA-naringenin, HFSD with 0.2% of -CoA-fisetin, and HFSD with 0.2% of resveratrol as positive control. The HFSD compared to the AIN-93 diet contained twice as much sucrose and lard and were administered in dry form. AIN-93 and HFSD composition is described in Table 1. The CoA percentage was calculated to provide 0.2% of the flavonoid. Food consumption and the body weight of the mice was measured twice a week. At the end of the study, animals were euthanized after 8 h fasted period. Whole blood was collected in a centrifuge tube with heparin and the serum was obtained and frozen at −80°C after centrifugation at 1000 × g for 10 min. Inguinal subcutaneous, and epididymal WAT in addition to BAT and liver samples were obtained and immediately frozen in liquid nitrogen. Tissue samples were stored at −80 °C.
2.4. Determination of Body Composition
To determine fat and lean mass content a quantitative magnetic resonance imaging system (Echo MRI, Houston, TX, USA) was used. Mice were individually placed into a thin-walled plastic tube, with a cylindrical plastic insert added to restrict movement. During the measurement, the animals were briefly subjected to a low intensity (0.05 Tesla) electromagnetic field to measure fat and lean mass. Measurements were performed twice, at baseline and after 90 days after the diet intervention began, (n= 7-9 animals).
2.5. Intraperitoneal Glucose Tolerance Test
On day 90 we performed an intraperitoneal glucose tolerance test. Previously to conduct the test, the mice were fasted for a short period of time (7 h). All blood samples for serum glucose measurement were obtained from a small tail cut. Measurement of the basal glucose concentration was obtained prior to the intraperitoneal injection, the glucose concentration used to perform this study was of 2 g kg−1 body weight. Tail blood samples were obtained at 15, 30, 45, 60, and 120 min after injection. Glucose concentration was measured with the One-Touch Ultra glucometer (Accu-Check Sensor, Roche Diagnostics). (n= 5-7 animals per group).
2.6. Indirect Calorimetry
On day 85, an indirect calorimetry test was carried out using a Comprehensive Lab Animal Monitoring System (Columbus Instruments, OH, USA). Mice were individually housed, and measurements were conducted during 24h. The test was carried out at 22 °C under a 12h/12h light-dark cycle. During the test performance food was only available from 19:00 to 7:00 h, animals always had water ad libitum. The mice were weighted before the test was performed (n= 5-8 animals per group).
2.7. Serum Measurements
Serum glucose, cholesterol, LDL cholesterol, AST, ALT, urea, and creatinine concentration were measured by a COBAS c111 analyzer (Roche Diagnostics, Mannheim, Germany). Serum insulin (Merck Millipore, Darmstadt, Germany), adiponectin (Merck Millipore, Darmstadt, Germany) and leptin (Thermo fisher Scientific, Waltham, MA, USA) levels were measured using a commercial enzyme-linked immunosorbent assay (n= 7-8 animals per group).
2.8. Western Blot Analysis
Subcutaneous and epididymal WAT and BAT extracts were prepared by homogenizing the tissue in RIPA buffer containing PBS buffer, SDS, sodium deoxycholate, sodium azide, NP-40, and protease and phosphatase inhibitors. Total protein was obtained by centrifugation for 20 min. The proteins were separated by SDS-polyacrylamide gel electrophoresis and transferred to polyvinylidene difluoride membranes (Bio Rad Laboratories, Hercules, CA, USA). The membranes were incubated with specific antibodies against UCP1 and PGC1α from abcam (Cambridge, UK), membranes were revealed using an antirabbit secondary antibody from abcam (Cambridge, UK). GAPDH antibody was used as loading control. Bands were detected using Immobilon Western chemiluminescent HRP substrate (Millipore, Temecula, CA, USA). The chemiluminescence was digitized using the ChemiDoc MP imaging system (Bio Rad Laboratories, Hercules, CA). Digital images were analyzed using ImageJ 1.51 (100) 2015 digital imaging processing software (n= 4-6 animals per group).
2.9. Histological Analysis
Subcutaneous, epididymal, and brown adipose tissue samples were collected from the mice to perform histological analysis with the Hematoxylin & Eosin (H&E) staining. The samples were preserved in formalin to stabilize the tissue and prevent it from decay. Afterwards, the samples experienced a dehydration process to get rid of the water content, which were lather included un paraffin for sectioning. The tissues were cut into slices and then stained with specific dyes. The samples were then mounted on glass slides under coverslips to capture them using a microscope. Subsequently, these images were analyzed using ImageJ software to quantify different parameters, for further analyzation.
2.10. Lipid Content Determination in Liver
The Folch Method was used to extract the lipids from biological samples. The sample was first mixed with a solvent mixture of chloroform and methanol to disrupt cell membranes and release lipids into the solvent. The sample was then shaken extensively to ensure extraction. Subsequently, methanol was added to induce separation between the chloroform and the aqueous phase to dissolve the lipids in chloroform. Finally, the samples were dried with nitrogen to concentrate the lipid extracts. The concentration of fatty acids in the liver was determined by Gas Chromatography, and the samples were injected into an Agilent DB-225MS (Santa Clara, CA, USA) 30 m x 0.25 mm x 0.25 µm analytical column, coupled to a flame detector (FID) for analysis. An Agilent 6850 Series II gas chromatograph (Santa Clara, CA, USA) coupled to an auto-sampler (Agilent 6850, Santa Clara, CA, USA) was used. Total hepatic triglycerides and cholesterol concentrations were measured with triglycerides and Total Cholesterol FS Kits (DiaSys, Diagnostic Systems, Hoizheim Germany). Lipids concentrations were calculated from samples absorbance measured with a spectrophotometer (Bio Rad Laboratories, Hercules, CA, USA) (n= 6 animals per group).
2.11. Microbiota Analysis
At the end of the study a fecal sample was collected from all animals treated with the different diets. Fecal samples were frozen at −80 °C. DNA extraction was carried out using a QIAamp Power Fecal Kit, according to the manufacturer’s instructions. Variable regions 3–4 of the 16S rRNA gene were amplified using specific forward (5′ TCGTCGGCAGCGTCAGATGTGTATAAGAGACAGCCTACGGGNGGCWGCAG3) and reverse primers (5′ GTCTCGTGG GCTCGGAGATGTGTATAAGAGACAGGACTACHVGGTATCTAATCC 3) containing the Illumina adapter overhang nucleotide sequences. Ampure XP bits were used to purify the 16S V3-V4 amplicons, and quantified on Qiaxcel (QIAGEN, Germany). The amplicon size was approximately 550 bp. An index PCR was then carried out to attach dual indices using a Nextera XT v2 Kit. The amplicon size was approximately 610 bp, and the concentration of double-stranded DNA was measured using a fluorometer Qubit 3.0 with a high-sensitivity kit. The final amplicon library was pooled in equimolar concentrations. Sequencing was performed on the IlluminaMiSeq platform (MiSeq Reagent Kit V.3, 600 cycles) at a 10 pm with 20% Phyx infection according to the manufacturer’s instructions to generate paired end reads of 300 bases in length in each direction.
For taxonomic composition analysis, Custom C# and python scripts in the Quantitative Insights IntoMicrobial Ecology (QIIME) software pipeline v 2-2022.2 were used to process the sequencing files. The sequence outputs were filtered for low-quality sequences (defined as any sequences that are <200 bp or >620 bp, sequences with any nucleotide mismatches to either the barcode or the primer, sequences with an average quality score of <30, and sequences with ambiguous bases >0. Sequences were checked for chimeras and chimeric sequences were filtered out. The analysis started by clustering sequences within a percent sequence similarity into Amplicon Sequences Variances (ASVs). ASVs were picked against the SILVA database. Thus, the reads were assigned to the different taxonomic levels. Alpha diversity measurements (Shannon) were calculated. Bray-Curtis PCoA analysis was performed to determine similarity between ANOSIM, a permutational multivariate analysis of variance, was used to determine statistically significant clustering of groups based upon microbiota structure distances (n= 6-7 animals per group).
2.12. Statistical Analysis
Results are presented as the means ± SEMs. Analysis of more than two groups was performed by one-way ANOVA followed by Fisher's protected least-square difference test. Differences were considered significant at P< 0.05 (GraphPad Prism San Diego, CA).
3. Results
3.1. Enhanced Solubility and Distinct Properties of Co-Amorphous Naringenin-Fisetin Systems
In the analysis of co-amorphous systems of naringenin and fisetin, various techniques revealed distinct characteristics when compared to their crystalline starting materials—fisetin, naringenin, and arginine. Powder X-ray diffraction (PXRD) showed that the co-amorphous systems displayed broad, featureless peaks characteristic of amorphous halos, in contrast to the sharp, well-defined peaks of the crystalline materials. Fourier-transform infrared spectroscopy (FT-IR) revealed significant shifts in the O-H stretching vibrations of the flavonoids within the co-amorphous systems, suggesting that hydroxyl groups, rather than carbonyl groups, are responsible for forming intermolecular interactions with arginine. Differential scanning calorimetry and thermogravimetric analysis (DSC-TGA) indicated that the narigenin (NAR) system underwent an endothermic event at 91.42°C and a glass transition at 88.3°C, followed by decomposition. Meanwhile, fisetin (FSN) exhibited dehydration at 95.5°C, a glass transition at 111.32°C, and decomposition at 238°C. In solubility tests, both co-amorphous systems dissolved rapidly and completely at pH 6.8, showing significantly improved solubility compared to their individual components, with slight improvements observed at pH 1.2 and 4.5 (Figure 1A,B). The increased viscosity from the co-amorphous material did not result in supersaturation. Overall, these findings underscore the enhanced solubility of the co-amorphous systems relative to their crystalline counterparts, as detailed in patent document WO20241160427.
3.2. Consumption of CoA-Naringenin Decreases Fat Mass Gain in Mice Consuming a HFSD
To assess the effect of CoA flavonoids on physiological parameters related to metabolic syndrome and obesity, weight gain and body composition were measured over the three-month study period (Figure 2A). The results showed as expected, that the HFSD group gained significantly more weight (84%) compared to the control group. Mice that consumed CoA-fisetin exhibited a similar increase in body weight as the HFSD group. However, mice that consumed CoA-naringenin along with HFSD gained 46% less weight than the HFSD group (Figure 2B), though by the end of the study, the difference between the CoA-naringenin group and the HFSD group was not statistically significant (Figure 2C). As anticipated, mice fed resveratrol with HFSD gained less weight compared to both the HFSD group (121%) and the control group (20%) (Figure 2C). Food consumption varied only in the CoA-fisetin group, indicating that changes in body weight in the other groups were not related to food intake (Figure 2D). These results suggest that CoA-naringenin consumption tends to reduce weight gain when combined with an HFSD. Based on this finding, a body composition analysis was conducted. In the fat mass analysis, the HFSD + CoA-naringenin group gained 45% less fat mass compared to the HFSD group and was similar to the fat mass gain of the resveratrol group. Mice in the CoA-fisetin group gained the same percentage of fat mass as the HFSD group (Figure 2E). No significant difference was observed in fat mass gain between the CoA-naringenin and resveratrol groups. Lean mass patterns were similar across all groups (Figure 2F). These findings suggest that CoA-naringenin primarily reduces fat mass gain.
3.3. CoA-Naringenin Improves Cholesterol Metabolism in Obese Mice
To describe the metabolic profile of mice that consumed different CoA flavonoids, various biochemical parameters were measured. Glucose (Figure 3A) and serum insulin (Figure 3B) levels did not show significant differences between the mice fed only a high-fat, high-sugar diet (HFSD) and those supplemented with CoA flavonoids (naringenin and fisetin). However, significant differences were observed with resveratrol (Figs. 3A, 3B). Regarding hepatic metabolism, CoA-naringenin consumption notably reduced total and LDL cholesterol levels compared to the HFSD group, indicating an improvement in cholesterol metabolism when CoA-naringenin was included in the diet (Figure 3C). Mice fed CoA-fisetin showed a reduction in LDL cholesterol compared to the HFSD group. As expected, resveratrol-fed mice exhibited a reduction in both total and LDL cholesterol, similar to the effect of CoA-naringenin (Figure 3D). There were no significant differences between these two groups and the control group. Hepatic inflammation, only showed that CoA-narimgenin decreased significant ALT, however, AST did not show significant difference compared to the control group (Figure 3E,F). Similarly, creatinine levels did not vary significantly between groups (Figure 3G). However, urea levels, which were elevated by HFSD consumption, were reduced with CoA-naringenin, CoA-fisetin, and resveratrol consumption (Figure 3H).
3.4. CoA-Flavonoids Increase VO2, Consumption Improves Metabolic Flexibility and Glucose Tolerance in Mice Fed with HFSD
An essential parameter related to energy expenditure is the volume of oxygen consumption (VO2). To assess the effect of CoA flavonoids on energy consumption, indirect calorimetry was measured (Figure 4A). VO2 increased in mice fed with CoA-naringenin compared to those fed with a high-fat, high-sucrose diet (HFSD) (Figure 4B), indicating a rise in energy expenditure. This could explain the reduced fat mass accumulation observed with CoA-naringenin consumption, even in the presence of an HFSD. In contrast, while Resveratrol also increased VO2, CoA-fisetin did not significantly alter VO2 compared to the HFSD-only group (Figure 4B).
Another parameter measured during indirect calorimetry was the respiratory exchange rate (RER). HFSD consumption resulted in metabolic inflexibility, with energy derived almost exclusively from lipid oxidation (RER: 0.7-0.8) (Figure 4C), indicating an inability to oxidize carbohydrates, even when they are available in the postprandial period. By contrast, normal diet consumption typically results in an RER close to 1.0 during the postprandial phase. In this experiment, CoA-naringenin and fisetin improved RER during the fasting period, enhancing metabolic flexibility impaired by HFSD consumption. In the postprandial phase, mice fed CoA-fisetin showed a significant increase in RER, while CoA-naringenin only showed a rising trend that was not statistically significant (Figure 4D). Notably, resveratrol did not induce this increase, which was only observed with CoA-flavonoid consumption (Figure 4D).
During obesity, glucose tolerance is impaired, leading to reduced insulin sensitivity and a higher risk of diabetes. To evaluate glucose metabolism, we performed an intraperitoneal glucose tolerance test (iGTT) on all experimental groups. Serum glucose levels were measured at 15, 30, 60, 90, and 120 minutes post-glucose injection (Figure 4E). As expected, HFSD increased glucose concentrations compared to the control group. However, mice fed CoA-fisetin showed improved glucose tolerance compared to those consuming only HFSD (Figures 4E and 3F). The area under the curve (AUC) analysis further confirmed that CoA-fisetin consumption maintained glucose levels similar to those of mice on a control diet, despite HFSD consumption (Figure 4F).
3.5. CoA-Flavonoids Decreases Hepatic Lipids in Obesity Induced Diet Model
The pathophysiological effects of obesity on the liver include lipid accumulation in peripheral tissues, leading to abnormal fat deposition, insulin resistance, hepatic inflammation, and steatosis. Given that the liver is a key metabolic organ and bioactive compounds are known to improve lipid metabolism, we investigated hepatic morphology and lipid profiles in mice fed with CoA-flavonoids. To assess hepatic morphology, H&E staining was performed. As shown in Figure 5A, livers of mice fed a high-fat, sugar-rich diet (HFSD) displayed increased fat accumulation, evidenced by prominent lipid droplets, while the control group showed no such droplets, indicating normal lipid distribution. In contrast, mice treated with CoA-naringenin and CoA-fisetin exhibited fewer lipid droplets compared to the HFSD group, resembling the lipid profile of the control diet group.
To confirm these findings, we extracted liver lipids using the Folch method and quantified triglycerides and total cholesterol. Mice on the HFSD alone had elevated liver triglyceride levels, while the CoA-naringenin and CoA-fisetin groups showed a significant reduction of 54% and 32%, respectively, compared to the HFSD group (Figure 5B) suggesting improved lipid metabolism. Additionally, liver cholesterol levels in the CoA-naringenin and CoA-fisetin groups were reduced by 61% and 46%, respectively, compared to the HFSD group (Figure 5C). Resveratrol also lowered liver lipid content (Figure 5C).
Given the reduction in triglyceride levels observed with CoA-flavonoid consumption, we further analyzed liver lipid composition by measuring different fatty acid concentrations. The HFSD group exhibited higher levels of linolenic acid in both absolute and relative terms compared to all other groups (Figure 5D,E). In particular, the CoA flavonoid and resveratrol groups showed higher concentrations of DHA and EPA relative to linolenic acid, more closely resembling the normal diet group. This is significant, as DHA and EPA are known for their anti-inflammatory properties [26,27], consistent with previous reports on fisetin and naringenin (Figure 5E).
Regarding other fatty acids, the HFSD group had elevated levels compared to all other groups (Figure 5F,G). Mice fed only the HFSD had higher palmitic acid concentrations, whereas those treated with CoA-flavonoids showed lower palmitic acid levels and higher palmitoleic acid levels relative to palmitate. Saturated fatty acids were reduced with the consumption of CoA-naringenin and CoA-fisetin, resulting in a lipid profile similar to that of the control group (Figure 5H). These results suggest that CoA flavonoid consumption improves lipid metabolism by reducing hepatic lipid content and increasing the concentration of anti-inflammatory fatty acids.
3.6. CoA- Flavonoids Diminish Adipocyte Size Increasing Thermogenic Markers
Body composition analysis indicates that mice fed with CoA-naringenin gained a lower percentage of fat mass despite consuming a high-fat, high-sucrose diet (HFSD), while maintaining lean mass comparable to mice on a control diet. Previous studies have shown that some bioactive compounds can activate thermogenesis [28,29], particularly in inguinal white adipose tissue, inducing a shift towards "beiging" tissue, which increases energy expenditure [28]. This beiging process improves glucose metabolism and fatty acid oxidation.
To investigate this, we analyzed the morphology and size of adipocytes using H&E staining, as shown in Figure 6A. As expected, adipocytes from mice fed an HFSD were larger compared to those on the control diet. However, in the CoA-naringenin and resveratrol groups, adipocytes were significantly smaller. Notably, CoA-naringenin-treated mice had a higher percentage of small adipocytes compared to the HFSD group, a trend also seen in the CoA-fisetin group (Figure 6B,C). Using images from H&E staining, the mean adipocyte size was calculated for all groups. Mice fed CoA-naringenin had a mean adipocyte size of 113 µM, 30% smaller than those in the HFSD group (162 µM) (Figure 6C). Similarly, CoA-fisetin reduced adipocyte size to 120 µM, even with HFSD consumption. Resveratrol led to the smallest adipocytes, with an average size of 65.7 µM, significantly smaller than all other groups (Figure 6C). Adipose tissue plays a key role in metabolic regulation by releasing adipokines such as adiponectin, which controls glucose and lipid oxidation, and leptin, which regulates appetite. In obesity, dysregulation of these adipokines is common, leading to leptin resistance associated with elevated leptin levels and reduced adiponectin, impairing metabolism and appetite regulation [30,31]. To assess white adipose tissue function, we measured adiponectin and leptin concentrations.
In mice on an HFSD, adiponectin levels were significantly lower compared to the control group. Although CoA-naringenin reduced adiponectin levels, the difference was not statistically significant. However, CoA-fisetin and resveratrol preserved adiponectin levels similar to the control group (Figure 6D). This suggests that CoA-flavonoid supplementation mitigates the impact of HFSD on adiponectin levels. Leptin levels in the CoA-naringenin and resveratrol groups were lower compared to the HFSD group and nearly identical to the control group (Figure 6E). CoA-fisetin also showed a reduction in leptin levels, though this result was not statistically significant (Figure 6E).
Based on the observed improvements in metabolic health, we further evaluated the thermogenic activation potential of these compounds by assessing two beiging markers: uncoupled protein 1 (UCP1) and peroxisome proliferator-activated receptor gamma coactivator 1-alpha (PGC-1α) through western blot analysis. Consumption of CoA-fisetin and resveratrol increased PGC-1α protein abundance compared to the HFSD group (Figure 6F), however only CoA-fisetin rise up UCP1 concentration, since resveratrol tended to increase UCP1 but it was no statistically significant. We did not observe an effect of CoA-naringenin on beiging markers. These results indicate that consuption of CoA-fisetin promotes mitochondrial biogenesis increasing PGC-1α, a key factor in activating thermogenesis and promoting beiging differentiation.
3.7. Changes in the Intestinal Microbiota Are Partially Modulated by the Consumption of CoA-Flavonoids
When evaluating the gut microbiota, a decrease in α-diversity was observed with the consumption of a HFSD compared with the control group (C). However, the addition of compounds such as CoA-naringenin or resveratrol partially restored this diversity (Figure 7A). In terms of β-diversity, there was a marked dissimilarity between group C and those on the HFSD diet, although a slight change was observed with CoA-fisetin supplementation, and an even more pronounced effect with resveratrol (PERMANOVA, p < 0.001) (Figure 7B). At the phylum level, the intake of CoA-naringenin or CoA-physetin increased the abundance of Verrucomicrobiota to levels similar to those of the control group, which is associated with improved glucose tolerance. Resveratrol, on the other hand, restored the balance between Bacteroidetes and Firmicutes, resembling the profile of the control group (Figure 7C). At the genus level, significant increases were observed in Akkermansia, Bifidobacterium, Roseburia, Lactococcus, Parasutterella, Anaerovorax, Marvinbryantia, Paraprevotella and Butyricicoccus across different bioactive compounds. These genera are related to beneficial effects on metabolism, maintenance of the integrity of the intestinal epithelium and anti-inflammatory properties (Figure 7D–L). At the species level, an increase in bacteria associated with metabolic endotoxemia and liver inflammation, such as Streptococcus equi and Mycoplasma microti, was observed in the HFSD group (Figure 7M). In contrast, CoA-fisetin, CoA-naringenin or resveratrol increased the abundance of Akkermansia muciniphila. CoA-fisetin also promoted the growth of butyrate-producing bacteria such as Butyricicoccus pullicaecorum and Bifidobacterium breve. In the case of resveratrol, an increase in Roseburia inulinivorans was observed, which is associated with improved glycemic control (Figure 7O,P).
3.8. CoA-Flavonoids Improve Glucose and Lipid Metabolism Modulating Intestinal Microbiota
The correlogram analysis showed that the consumption of CoA-naringenin and CoA-fisetin increased the abundance of Akkermansia muciniphila which had exclusively a significant association with the decrease of the area under of the ipGTT (Figure 8A,B). Additionally, consumption of CoA-fisetin increased the abundance of Butyricicoccus pullicaecorum and Bifidobacterium breve, which showed a negative correlation with serum and liver total cholesterol concentration (Figure 8B). These correlations were not observed with the consumption of HFSD, however, it was shown that the consumption of this diet increased the abundance of Streptococcus equi, which correlated positively with the serum concentration of glucose, insulin, as well as with an increase in the area under the curve of the ipGTT (Figure 8C).
4. Discussion
In recent years, the rise in obesity across populations has been closely linked to the development of metabolic syndrome, a cluster of conditions that includes elevated blood glucose and cholesterol levels, high blood pressure, and increased adiposity [32,33]. This growing epidemic has driven significant research into identifying effective interventions, with bioactive compounds present in functional foods emerging as a promising approach to mitigate the associated metabolic alterations.
The present study highlights the potential of bioactive compounds, particularly flavonoids such as CoA-naringenin and CoA-fisetin, to reverse or attenuate metabolic dysfunction. One of the main findings is the reduction of fat mass gain and improvement of muscle mass maintenance in an obesity model, specifically through CoA-naringenin. This compound showed remarkable effects on liver metabolism, including the reduction of serum cholesterol and liver transaminases, markers that often signal metabolic stress in obesity. Furthermore, these flavonoids were associated with an improvement of lipid metabolism in the liver, reducing its accumulation, but also modifying its lipid composition, in particular an increase of EPA and DHA which have anti-inflammatory effects [26,27,34], suggesting a possible role of these flavonoids in the treatment of conditions such as Metabolic Dysfunction-Associated Steatotic Liver Disease (MASLD).
In the case of NSF-fisetin, we observed an increase in the respiratory exchange ratio (RER) and an improvement in metabolic inflexibility induced by the consumption of a HFSD. Additionally, there was a significant improvement in glucose tolerance, as previously mentioned. A key factor related to obesity is the expansion of adipose tissue, which is often associated with an increase in adipocyte size. In this study, white adipose tissue (WAT) showed a reduction in size in comparison to the WAT of HFSD-fed mice, following the consumption of both CoA flavonoids. Previous studies have reported that naringenin consumption activates the thermogenic program in WAT, stimulating lipolysis in human adipocytes [35]. This is consistent with our findings of elevated thermogenic markers in the WAT of CoA-naringenin-fed mice [36,37]. Naringenin has also been recognized as a potent antioxidant with anti-inflammatory properties [13,38], shown to reduce fatty liver inflammation by regulating the NLRP3/NF-κB pathway [39]. Although fisetin is best known for its anti-inflammatory effects on the liver and immune system [18,19], there are currently no studies examining its impact on energy expenditure, glucose metabolism or benefits to adipose tissue when consumed in conjunction with an HFSD. In this study, as expected, our results were consistent with previous findings on resveratrol consumption in combination with a high-fat, high-sugar diet (HFSD) [40]. We observed that resveratrol reduced weight gain, decreased fat mass accumulation, improved glucose tolerance and insulin secretion, and reduced adipocyte size, likely due to an increase in thermogenic markers [41,42]. In addition, the known anti-inflammatory effects of resveratrol on the liver [39,43] were also confirmed in our study.
One of the most interesting aspects of the study was the role of the gut microbiota in mediating these effects. The modulation of gut bacteria, particularly through increased populations of Akkermansia and Bifidobacterium, supports improved gut health and metabolic function [44]. Particularly, there was a increase in the abundance of Akkermansia muciniphila, which is known to produce benefits on glucose tolerance and insulin sensitivity [45,46,47]. This microbial change helps to restore metabolic balance, reducing inflammation and promoting better glucose regulation, characteristic of healthier metabolic states [44,48]. Although the direct correlation between flavonoid intake and gut microbiota composition is still under investigation, this emerging field of research opens new directions to explore how bioactive compounds influence not only systemic metabolism, but also the gut microbiota.
Another critical element of the study involves improving the solubility and bioavailability of flavonoids. The development of coamorphous systems significantly improves the absorption of compounds, which is often a limitation in bioactive compounds [49,50]. The transition from the crystalline to the amorphous state increases the solubility, thus improving the potential efficiency of the compounds [49]. This improved solubility is critical for pharmaceutical applications [51], where flavonoids such as naringenin and fisetin may offer new therapeutic approaches to address metabolic syndrome.
The study also highlights the role of flavonoids in improving energy expenditure and metabolic flexibility, which are often impaired in obesity. Increased VO2 and increased thermogenic markers in the CoA-naringenin group suggest increased mitochondrial activity, probably contributing to reduce fat mass. These effects, coupled with improved cholesterol metabolism, present a comprehensive view of how flavonoids can control metabolic syndrome in multiple aspects, such as lipid metabolism, inflammation and energy regulation. However, more studies are needed to determine the potential long-term effects of the consuption of CoA-flavonoids.
5. Conclusions
In conclusion, this study provides strong evidence for the metabolic benefits of bioactive compounds such as CoA-naringenin and CoA-fisetin, especially in the context of obesity and metabolic syndrome. Their effects on reducing fat mass, improving cholesterol and glucose metabolism, increasing energy expenditure and anti-inflammatory effects suggest that they may be valuable components of future therapeutic strategies. The results also highlight the importance of the gut microbiota as a key factor in the metabolic effects of flavonoids, offering interesting possibilities for future research. However, further clinical trials are necessary to validate these effects in humans and fully understand the mechanisms through which these compounds exert their benefits.
Author Contributions
Conceptualization, A.R.T. and S. V.-R.; methodology, S.V.-R., M. B.-G., J. D.C., K. M.V., M. S.-T., G.O., O. G.-P.; validation, S.V.-R., M. B.-G., J. D.C., K. M.V., M. S.-T., G.O., O. G.-P.; formal analysis, S.V.-R., M. B.-G.; investigation, S.V.-R., M. B.-G., J. D.C., K. M.V., M. S.-T., G.O., O. G.-P., P. B.-G.; data curation, A.R.T. and S. V.-R; writing—original draft preparation, A.R.T. and S. V.-R.; writing—review and editing, A.R.T., S. V.-R., N.T.; visualization, A.R.T., and N.T.; supervision, A.R.T. and S. V.-R; project administration, A.R.T..; funding acquisition, A.R.T. All authors have read and agreed to the published version of the manuscript.
Funding
The study was funded by Laboratorios Senosian.
Institutional Review Board Statement
This study was also approved by the Animal Care Committee of the Instituto Nacional de Ciencias Médicas y Nutrición Salvador Zubirán (CICUAL: FNU-2082-22-23-1) in accordance with international guidelines for the use of animals in research.
Informed Consent Statement
Not applicable.
Data Availability Statement
The 16S rRNA gene sequencing raw sequence reads (fastq) are available at the NCBI Sequence Read Archive with BioProject ID PRJNA1173341. The available data are accessible to the reviewers at the following link: https://dataview.ncbi.nlm.nih.gov/object/PRJNA1173341?reviewer=ou6la82706vdte1hr4ounsj2vu.
Acknowledgments
The authors would like thanks to Laboratorios Senosian for financial support.
Conflicts of Interest
The authors declare no conflicts of interest.
References
- Eckel, R.H.; Grundy, S.M.; Zimmet, P.Z. The metabolic syndrome. Lancet 2005, 365, 1415–1428. [Google Scholar] [CrossRef]
- Bluher, M. Obesity: global epidemiology and pathogenesis. Nat Rev Endocrinol 2019, 15, 288–298. [Google Scholar] [CrossRef]
- Kawai, T.; Autieri, M.V.; Scalia, R. Adipose tissue inflammation and metabolic dysfunction in obesity. Am J Physiol Cell Physiol 2021, 320, C375–C391. [Google Scholar] [CrossRef]
- Bai, Y.; Sun, Q. Macrophage recruitment in obese adipose tissue. Obes Rev 2015, 16, 127–136. [Google Scholar] [CrossRef]
- Gallagher, E.J.; Leroith, D.; Karnieli, E. The metabolic syndrome--from insulin resistance to obesity and diabetes. Med Clin North Am 2011, 95, 855–873. [Google Scholar] [CrossRef]
- Li, H.; Meng, Y.; He, S.; Tan, X.; Zhang, Y.; Zhang, X.; Wang, L.; Zheng, W. Macrophages, Chronic Inflammation, and Insulin Resistance. Cells 2022, 11. [Google Scholar] [CrossRef]
- Hou, C.Y.; Tain, Y.L.; Yu, H.R.; Huang, L.T. The Effects of Resveratrol in the Treatment of Metabolic Syndrome. Int J Mol Sci 2019, 20. [Google Scholar] [CrossRef]
- Springer, M.; Moco, S. Resveratrol and Its Human Metabolites-Effects on Metabolic Health and Obesity. Nutrients 2019, 11. [Google Scholar] [CrossRef]
- Alberdi, G.; Rodriguez, V.M.; Miranda, J.; Macarulla, M.T.; Churruca, I.; Portillo, M.P. Thermogenesis is involved in the body-fat lowering effects of resveratrol in rats. Food Chem 2013, 141, 1530–1535. [Google Scholar] [CrossRef]
- Andrade, J.M.; Frade, A.C.; Guimaraes, J.B.; Freitas, K.M.; Lopes, M.T.; Guimaraes, A.L.; de Paula, A.M.; Coimbra, C.C.; Santos, S.H. Resveratrol increases brown adipose tissue thermogenesis markers by increasing SIRT1 and energy expenditure and decreasing fat accumulation in adipose tissue of mice fed a standard diet. Eur J Nutr 2014, 53, 1503–1510. [Google Scholar] [CrossRef]
- Gomez-Garcia, I.; Fernandez-Quintela, A.; Portillo, M.P.; Trepiana, J. Changes in brown adipose tissue induced by resveratrol and its analogue pterostilbene in rats fed with a high-fat high-fructose diet. J Physiol Biochem 2023. [Google Scholar] [CrossRef]
- Milton-Laskibar, I.; Gomez-Zorita, S.; Arias, N.; Romo-Miguel, N.; Gonzalez, M.; Fernandez-Quintela, A.; Portillo, M.P. Effects of resveratrol and its derivative pterostilbene on brown adipose tissue thermogenic activation and on white adipose tissue browning process. J Physiol Biochem 2020, 76, 269–278. [Google Scholar] [CrossRef]
- Cavia-Saiz, M.; Busto, M.D.; Pilar-Izquierdo, M.C.; Ortega, N.; Perez-Mateos, M.; Muniz, P. Antioxidant properties, radical scavenging activity and biomolecule protection capacity of flavonoid naringenin and its glycoside naringin: a comparative study. J Sci Food Agric 2010, 90, 1238–1244. [Google Scholar] [CrossRef]
- Kawaguchi, K.; Kikuchi, S.; Hasegawa, H.; Maruyama, H.; Morita, H.; Kumazawa, Y. Suppression of lipopolysaccharide-induced tumor necrosis factor-release and liver injury in mice by naringin. Eur J Pharmacol 1999, 368, 245–250. [Google Scholar] [CrossRef]
- Lee, E.J.; Kim, D.I.; Kim, W.J.; Moon, S.K. Naringin inhibits matrix metalloproteinase-9 expression and AKT phosphorylation in tumor necrosis factor-alpha-induced vascular smooth muscle cells. Mol Nutr Food Res 2009, 53, 1582–1591. [Google Scholar] [CrossRef]
- Alam, M.A.; Subhan, N.; Rahman, M.M.; Uddin, S.J.; Reza, H.M.; Sarker, S.D. Effect of citrus flavonoids, naringin and naringenin, on metabolic syndrome and their mechanisms of action. Adv Nutr 2014, 5, 404–417. [Google Scholar] [CrossRef]
- Khan, N.; Syed, D.N.; Ahmad, N.; Mukhtar, H. Fisetin: a dietary antioxidant for health promotion. Antioxid Redox Signal 2013, 19, 151–162. [Google Scholar] [CrossRef]
- Maurya, B.K.; Trigun, S.K. Fisetin Modulates Antioxidant Enzymes and Inflammatory Factors to Inhibit Aflatoxin-B1 Induced Hepatocellular Carcinoma in Rats. Oxid Med Cell Longev 2016, 2016, 1972793. [Google Scholar] [CrossRef]
- Pal, H.C.; Athar, M.; Elmets, C.A.; Afaq, F. Fisetin inhibits UVB-induced cutaneous inflammation and activation of PI3K/AKT/NFkappaB signaling pathways in SKH-1 hairless mice. Photochem Photobiol 2015, 91, 225–234. [Google Scholar] [CrossRef]
- Fan, X.; Fan, Z.; Yang, Z.; Huang, T.; Tong, Y.; Yang, D.; Mao, X.; Yang, M. Flavonoids-Natural Gifts to Promote Health and Longevity. Int J Mol Sci 2022, 23. [Google Scholar] [CrossRef]
- Zhao, J.; Yang, J.; Xie, Y. Improvement strategies for the oral bioavailability of poorly water-soluble flavonoids: An overview. Int J Pharm 2019, 570, 118642. [Google Scholar] [CrossRef]
- Jagadeesh, B.N.; Nangia, A. Solubility Advantage of Amorphous Drugs and Pharmaceutical Cocrystals. Cryst. Growth Des. 2011, 11, 2662–2679. [Google Scholar]
- Laitinen, R.; Lobmann, K.; Strachan, C.J.; Grohganz, H.; Rades, T. Emerging trends in the stabilization of amorphous drugs. Int J Pharm 2013, 453, 65–79. [Google Scholar] [CrossRef]
- Saberi, A.; Kouhjani, M.; Yari, D.; Jahani, A.; Asare-Addo, K.; Kamali, H.; Nokhodchi, A. Development, recent advances, and updates in binary, ternary co-amorphous systems, and ternary solid dispersions. J. Drug Deliv. Technol. 2023, 86. [Google Scholar] [CrossRef]
- Dominguez Chavez, J.G.; Mondragon Vasquez, K.; Senosiain Pelaez, J.P. Co-amorphous solid forms of flavonoids. 2024.
- Calder, P.C. Omega-3 fatty acids and inflammatory processes. Nutrients 2010, 2, 355–374. [Google Scholar] [CrossRef]
- Calder, P.C. Omega-3 fatty acids and inflammatory processes: from molecules to man. Biochem Soc Trans 2017, 45, 1105–1115. [Google Scholar] [CrossRef]
- Choi, Y.; Yu, L. Natural Bioactive Compounds as Potential Browning Agents in White Adipose Tissue. Pharm Res 2021, 38, 549–567. [Google Scholar] [CrossRef]
- Kang, H.W.; Lee, S.G.; Otieno, D.; Ha, K. Flavonoids, Potential Bioactive Compounds, and Non-Shivering Thermogenesis. Nutrients 2018, 10. [Google Scholar] [CrossRef]
- Pestel, J.; Blangero, F.; Watson, J.; Pirola, L.; Eljaafari, A. Adipokines in obesity and metabolic-related-diseases. Biochimie 2023, 212, 48–59. [Google Scholar] [CrossRef]
- Taylor, E.B. The complex role of adipokines in obesity, inflammation, and autoimmunity. Clin Sci (Lond) 2021, 135, 731–752. [Google Scholar] [CrossRef]
- Saklayen, M.G. The Global Epidemic of the Metabolic Syndrome. Curr Hypertens Rep 2018, 20, 12. [Google Scholar] [CrossRef]
- Samson, S.L.; Garber, A.J. Metabolic syndrome. Endocrinol Metab Clin North Am 2014, 43, 1–23. [Google Scholar] [CrossRef]
- Calder, P.C. Marine omega-3 fatty acids and inflammatory processes: Effects, mechanisms and clinical relevance. Biochim Biophys Acta 2015, 1851, 469–484. [Google Scholar] [CrossRef]
- Rebello, C.J.; Greenway, F.L.; Lau, F.H.; Lin, Y.; Stephens, J.M.; Johnson, W.D.; Coulter, A.A. Naringenin Promotes Thermogenic Gene Expression in Human White Adipose Tissue. Obesity (Silver Spring) 2019, 27, 103–111. [Google Scholar] [CrossRef]
- Li, X.; Yao, Z.; Qi, X.; Cui, J.; Zhou, Y.; Tan, Y.; Huang, X.; Ye, H. Naringin ameliorates obesity via stimulating adipose thermogenesis and browning, and modulating gut microbiota in diet-induced obese mice. Curr Res Food Sci 2024, 8, 100683. [Google Scholar] [CrossRef]
- Zhang, S.; Li, J.; Shi, X.; Tan, X.; Si, Q. Naringenin activates beige adipocyte browning in high fat diet-fed C57BL/6 mice by shaping the gut microbiota. Food Funct 2022, 13, 9918–9930. [Google Scholar] [CrossRef]
- Ucar, K.; Goktas, Z. Biological activities of naringenin: A narrative review based on in vitro and in vivo studies. Nutr Res 2023, 119, 43–55. [Google Scholar] [CrossRef]
- Wang, Q.; Ou, Y.; Hu, G.; Wen, C.; Yue, S.; Chen, C.; Xu, L.; Xie, J.; Dai, H.; Xiao, H. , et al. Naringenin attenuates non-alcoholic fatty liver disease by down-regulating the NLRP3/NF-kappaB pathway in mice. Br J Pharmacol 2020, 177, 1806–1821. [Google Scholar] [CrossRef]
- Baur, J.A.; Sinclair, D.A. Therapeutic potential of resveratrol: the in vivo evidence. Nat Rev Drug Discov 2006, 5, 493–506. [Google Scholar] [CrossRef]
- Andrade, J.M.O.; Barcala-Jorge, A.S.; Batista-Jorge, G.C.; Paraiso, A.F.; Freitas, K.M.; Lelis, D.F.; Guimaraes, A.L.S.; de Paula, A.M.B.; Santos, S.H.S. Effect of resveratrol on expression of genes involved thermogenesis in mice and humans. Biomed Pharmacother 2019, 112, 108634. [Google Scholar] [CrossRef]
- Lagouge, M.; Argmann, C.; Gerhart-Hines, Z.; Meziane, H.; Lerin, C.; Daussin, F.; Messadeq, N.; Milne, J.; Lambert, P.; Elliott, P. , et al. Resveratrol improves mitochondrial function and protects against metabolic disease by activating SIRT1 and PGC-1alpha. Cell 2006, 127, 1109–1122. [Google Scholar] [CrossRef]
- Meng, T.; Xiao, D.; Muhammed, A.; Deng, J.; Chen, L.; He, J. Anti-Inflammatory Action and Mechanisms of Resveratrol. Molecules 2021, 26. [Google Scholar] [CrossRef]
- Yoon, H.S.; Cho, C.H.; Yun, M.S.; Jang, S.J.; You, H.J.; Kim, J.H.; Han, D.; Cha, K.H.; Moon, S.H.; Lee, K. , et al. Akkermansia muciniphila secretes a glucagon-like peptide-1-inducing protein that improves glucose homeostasis and ameliorates metabolic disease in mice. Nat Microbiol 2021, 6, 563–573. [Google Scholar] [CrossRef]
- Dao, M.C.; Everard, A.; Aron-Wisnewsky, J.; Sokolovska, N.; Prifti, E.; Verger, E.O.; Kayser, B.D.; Levenez, F.; Chilloux, J.; Hoyles, L. , et al. Akkermansia muciniphila and improved metabolic health during a dietary intervention in obesity: relationship with gut microbiome richness and ecology. Gut 2016, 65, 426–436. [Google Scholar] [CrossRef]
- Depommier, C.; Everard, A.; Druart, C.; Plovier, H.; Van Hul, M.; Vieira-Silva, S.; Falony, G.; Raes, J.; Maiter, D.; Delzenne, N.M. , et al. Supplementation with Akkermansia muciniphila in overweight and obese human volunteers: a proof-of-concept exploratory study. Nat Med 2019, 25, 1096–1103. [Google Scholar] [CrossRef]
- Hasani, A.; Ebrahimzadeh, S.; Hemmati, F.; Khabbaz, A.; Hasani, A.; Gholizadeh, P. The role of Akkermansia muciniphila in obesity, diabetes and atherosclerosis. J Med Microbiol 2021, 70. [Google Scholar] [CrossRef]
- Wade, H.; Pan, K.; Duan, Q.; Kaluzny, S.; Pandey, E.; Fatumoju, L.; Saraswathi, V.; Wu, R.; Harris, E.N.; Su, Q. Akkermansia muciniphila and its membrane protein ameliorates intestinal inflammatory stress and promotes epithelial wound healing via CREBH and miR-143/145. J Biomed Sci 2023, 30, 38. [Google Scholar] [CrossRef]
- Han, J.; Wei, Y.; Lu, Y.; Wang, R.; Zhang, J.; Gao, Y.; Qian, S. Co-amorphous systems for the delivery of poorly water-soluble drugs: recent advances and an update. Expert Opin Drug Deliv 2020, 17, 1411–1435. [Google Scholar] [CrossRef]
- Hancock, B.C.; Zografi, G. Characteristics and significance of the amorphous state in pharmaceutical systems. J Pharm Sci 1997, 86, 1–12. [Google Scholar] [CrossRef]
- Liu, J.; Grohganz, H.; Lobmann, K.; Rades, T.; Hempel, N.J. Co-Amorphous Drug Formulations in Numbers: Recent Advances in Co-Amorphous Drug Formulations with Focus on Co-Formability, Molar Ratio, Preparation Methods, Physical Stability, In Vitro and In Vivo Performance, and New Formulation Strategies. Pharmaceutics 2021, 13. [Google Scholar] [CrossRef]
Figure 1.
Solubility of CoA flavonoids. Solubility graphs of naringenin (NAR) and CoA-naringenin (CoA-NAR) (A) and fisetin (FIS) and CoA-fisetin (CoA -FIS) (B) at different pH values. The image in each graph shows the solubility of CoA-NAR and CoA-FST in water before plasticization. Results are shown as mean ± S.E.M.
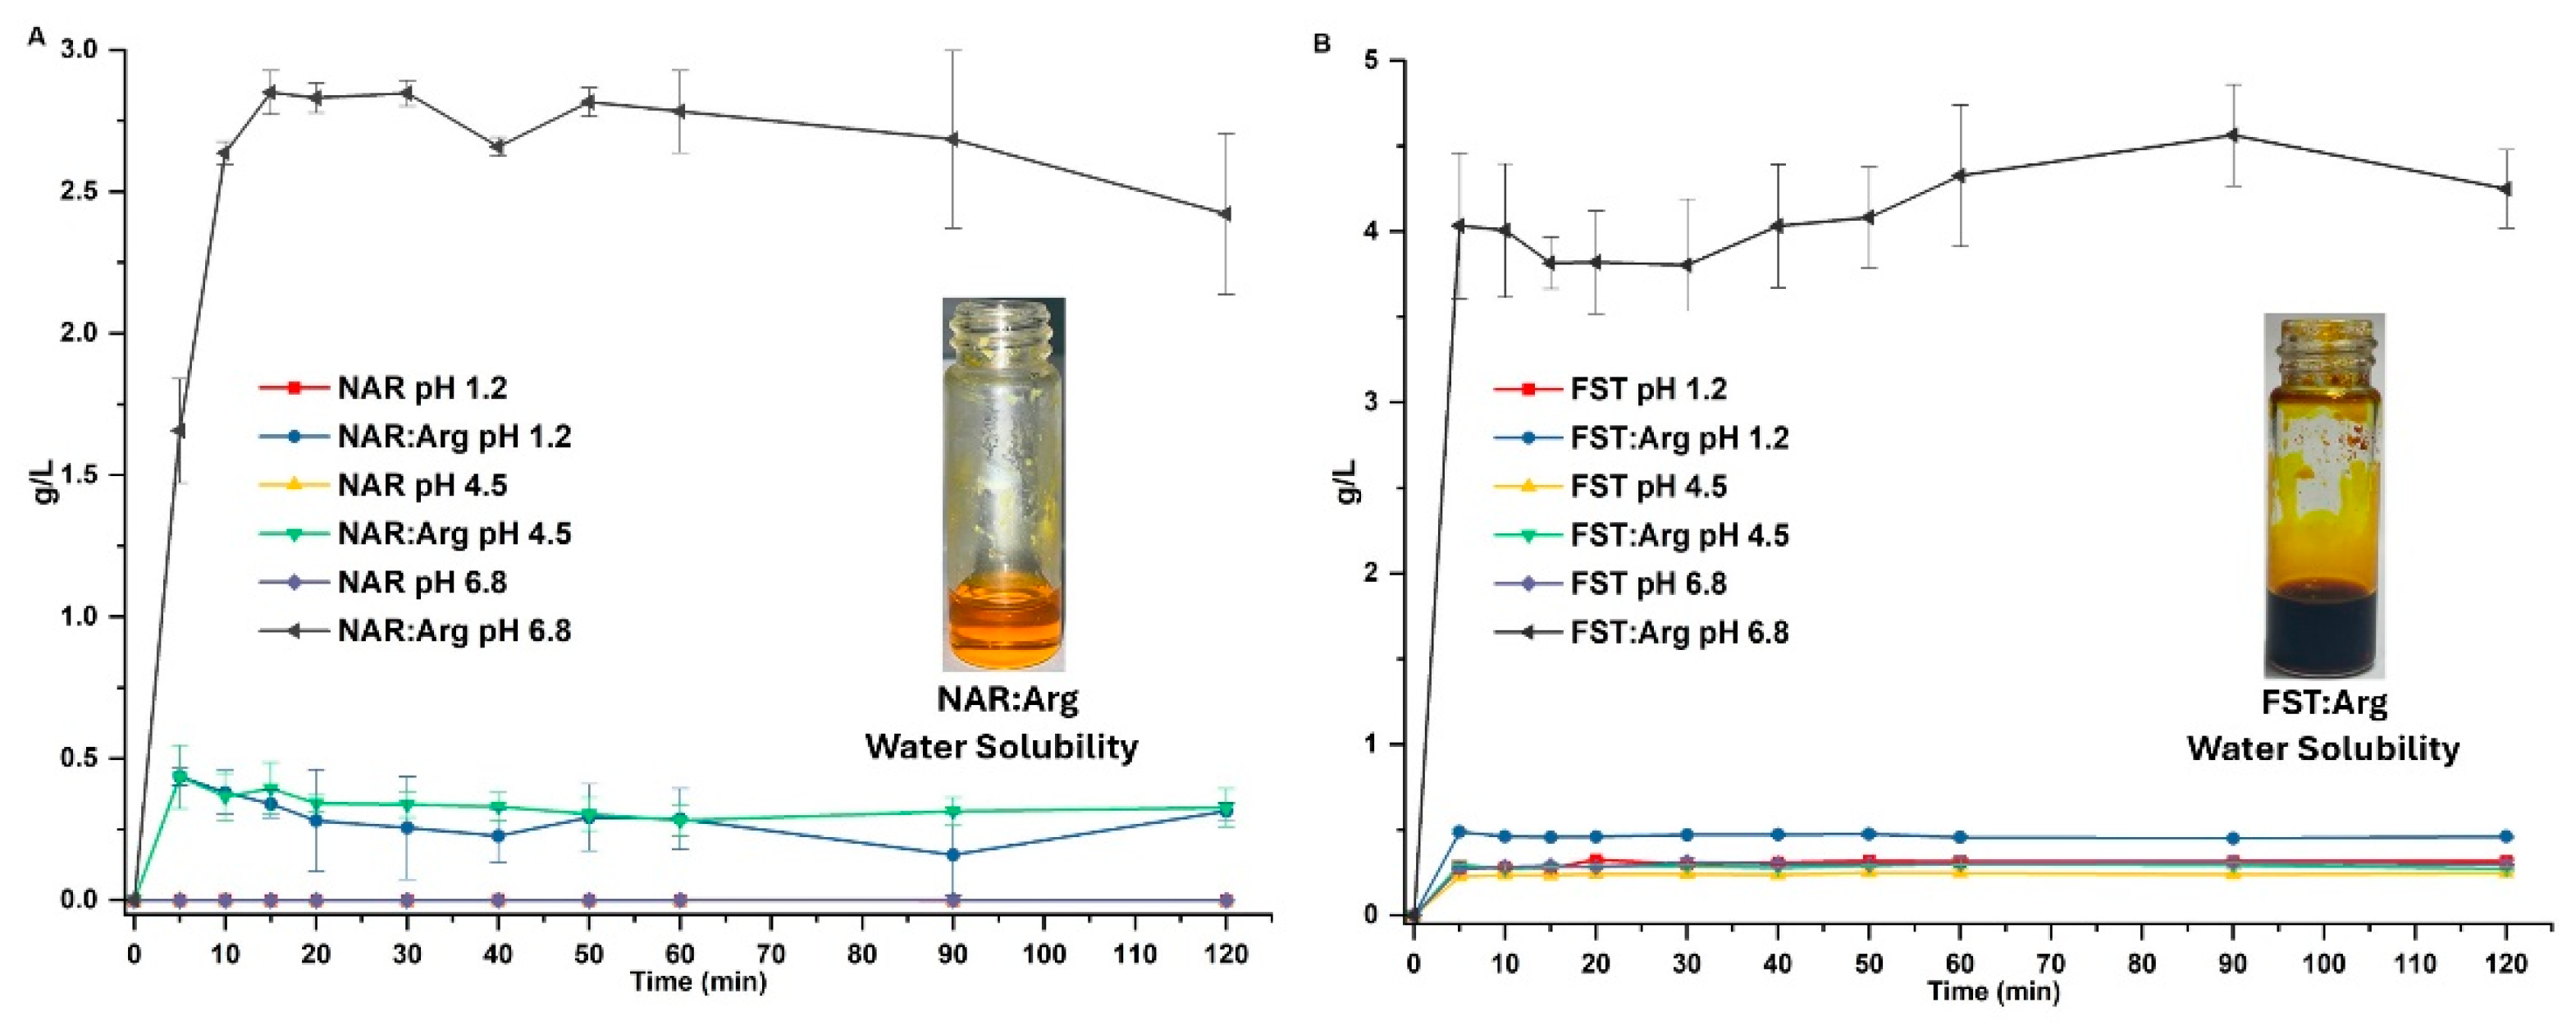
Figure 2.
Effects of CoA-flavonoids in body weight, food intake, percentage of fat mass, percentage of lean mass, in mice with AIN-93 diet and HFSD. (A) Experimental Design, (B) Body weight gain during the study and (C) Body weight at the end of the study, (D) energy intake at the end of the study, (E) percentage of fat mass and (F) lean mass at the end of the study. Results are shown as means ± S.E.M. (n=6/9 by group). One-way ANOVA was performed, letters indicate differences between groups (p=0.05).
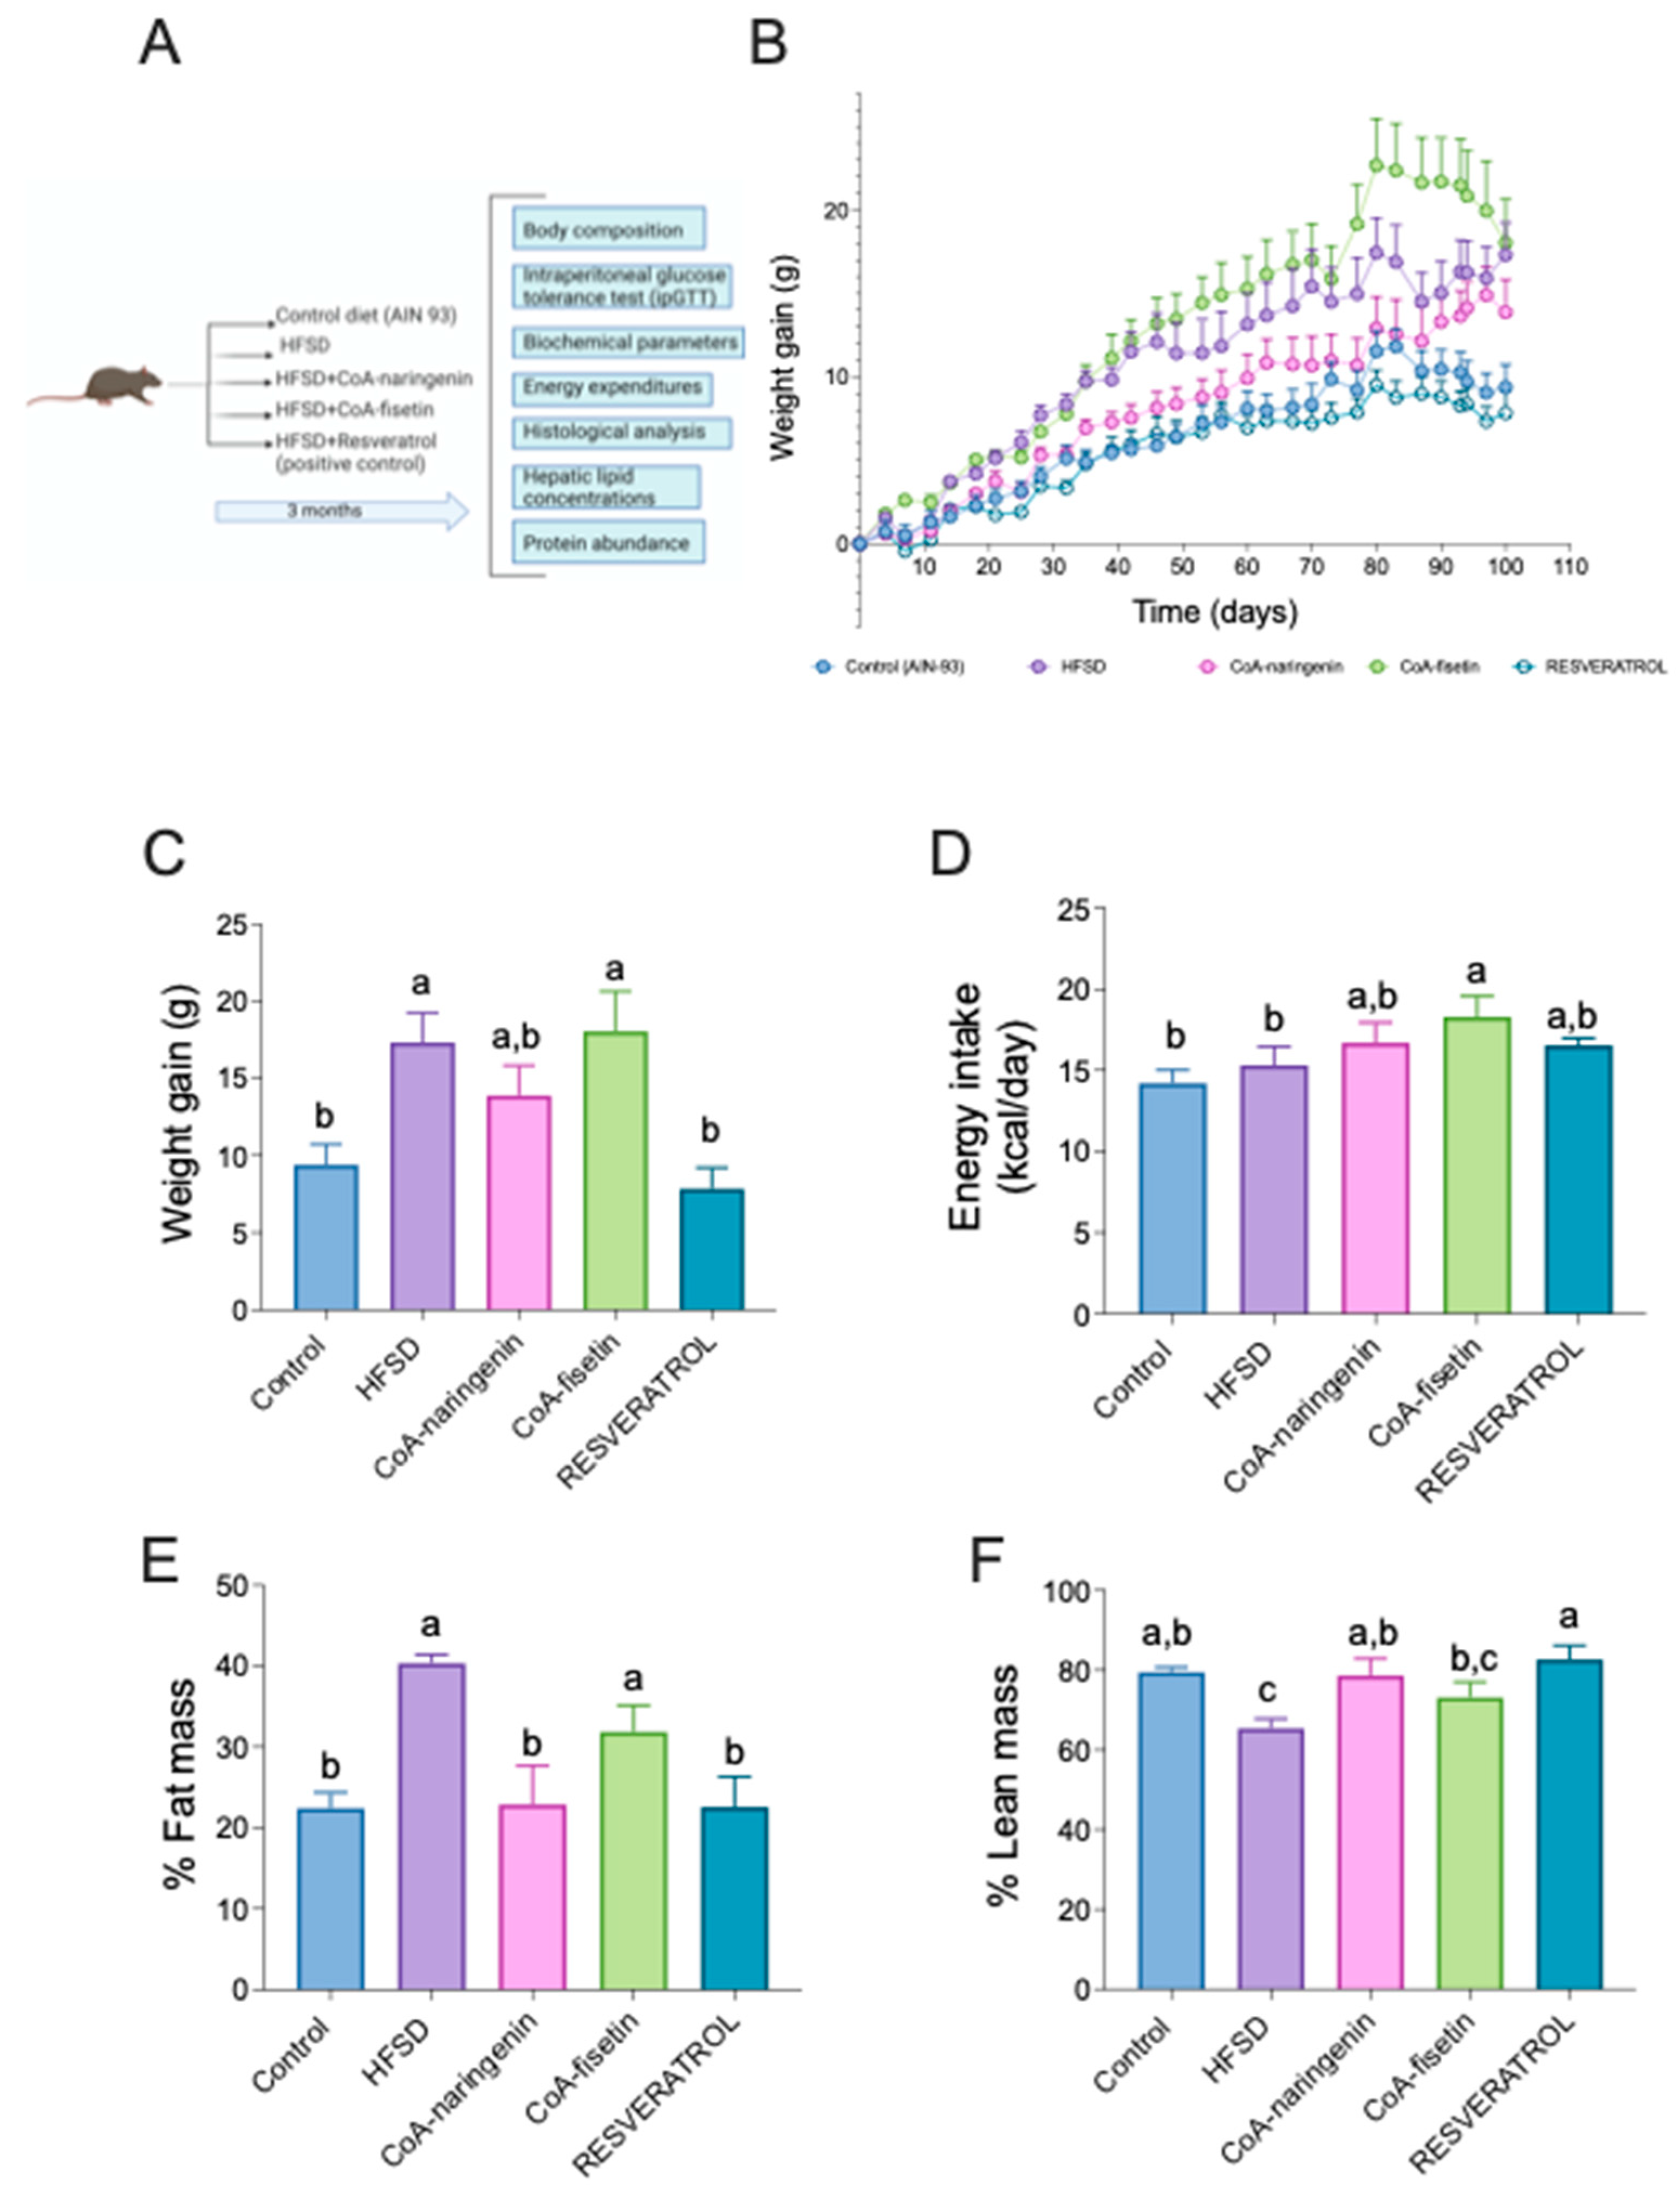
Figure 3.
Effects of CoA-flavonoids in serum concentration of insulin, glucose, cholesterol, hepatic transaminases, urea and creatine in mice with AIN-93 diet and HFSD. A) Glucose, B) Insulin, (C) Total Cholesterol, (D) LDL cholesterol, (E-F) Hepatic Transaminases, G) Creatinin and H) Urea. All parameters were measured at the end of the study by COBAS c111 Analyze, Insulin was measured by and EKISA Kit. Results are showed as the means ± S.E.Ms. (n=5/8 by group). One-way ANOVA was performed, letters indicate differences between groups (p=0.05). Results are shown as means ± S.E.M.
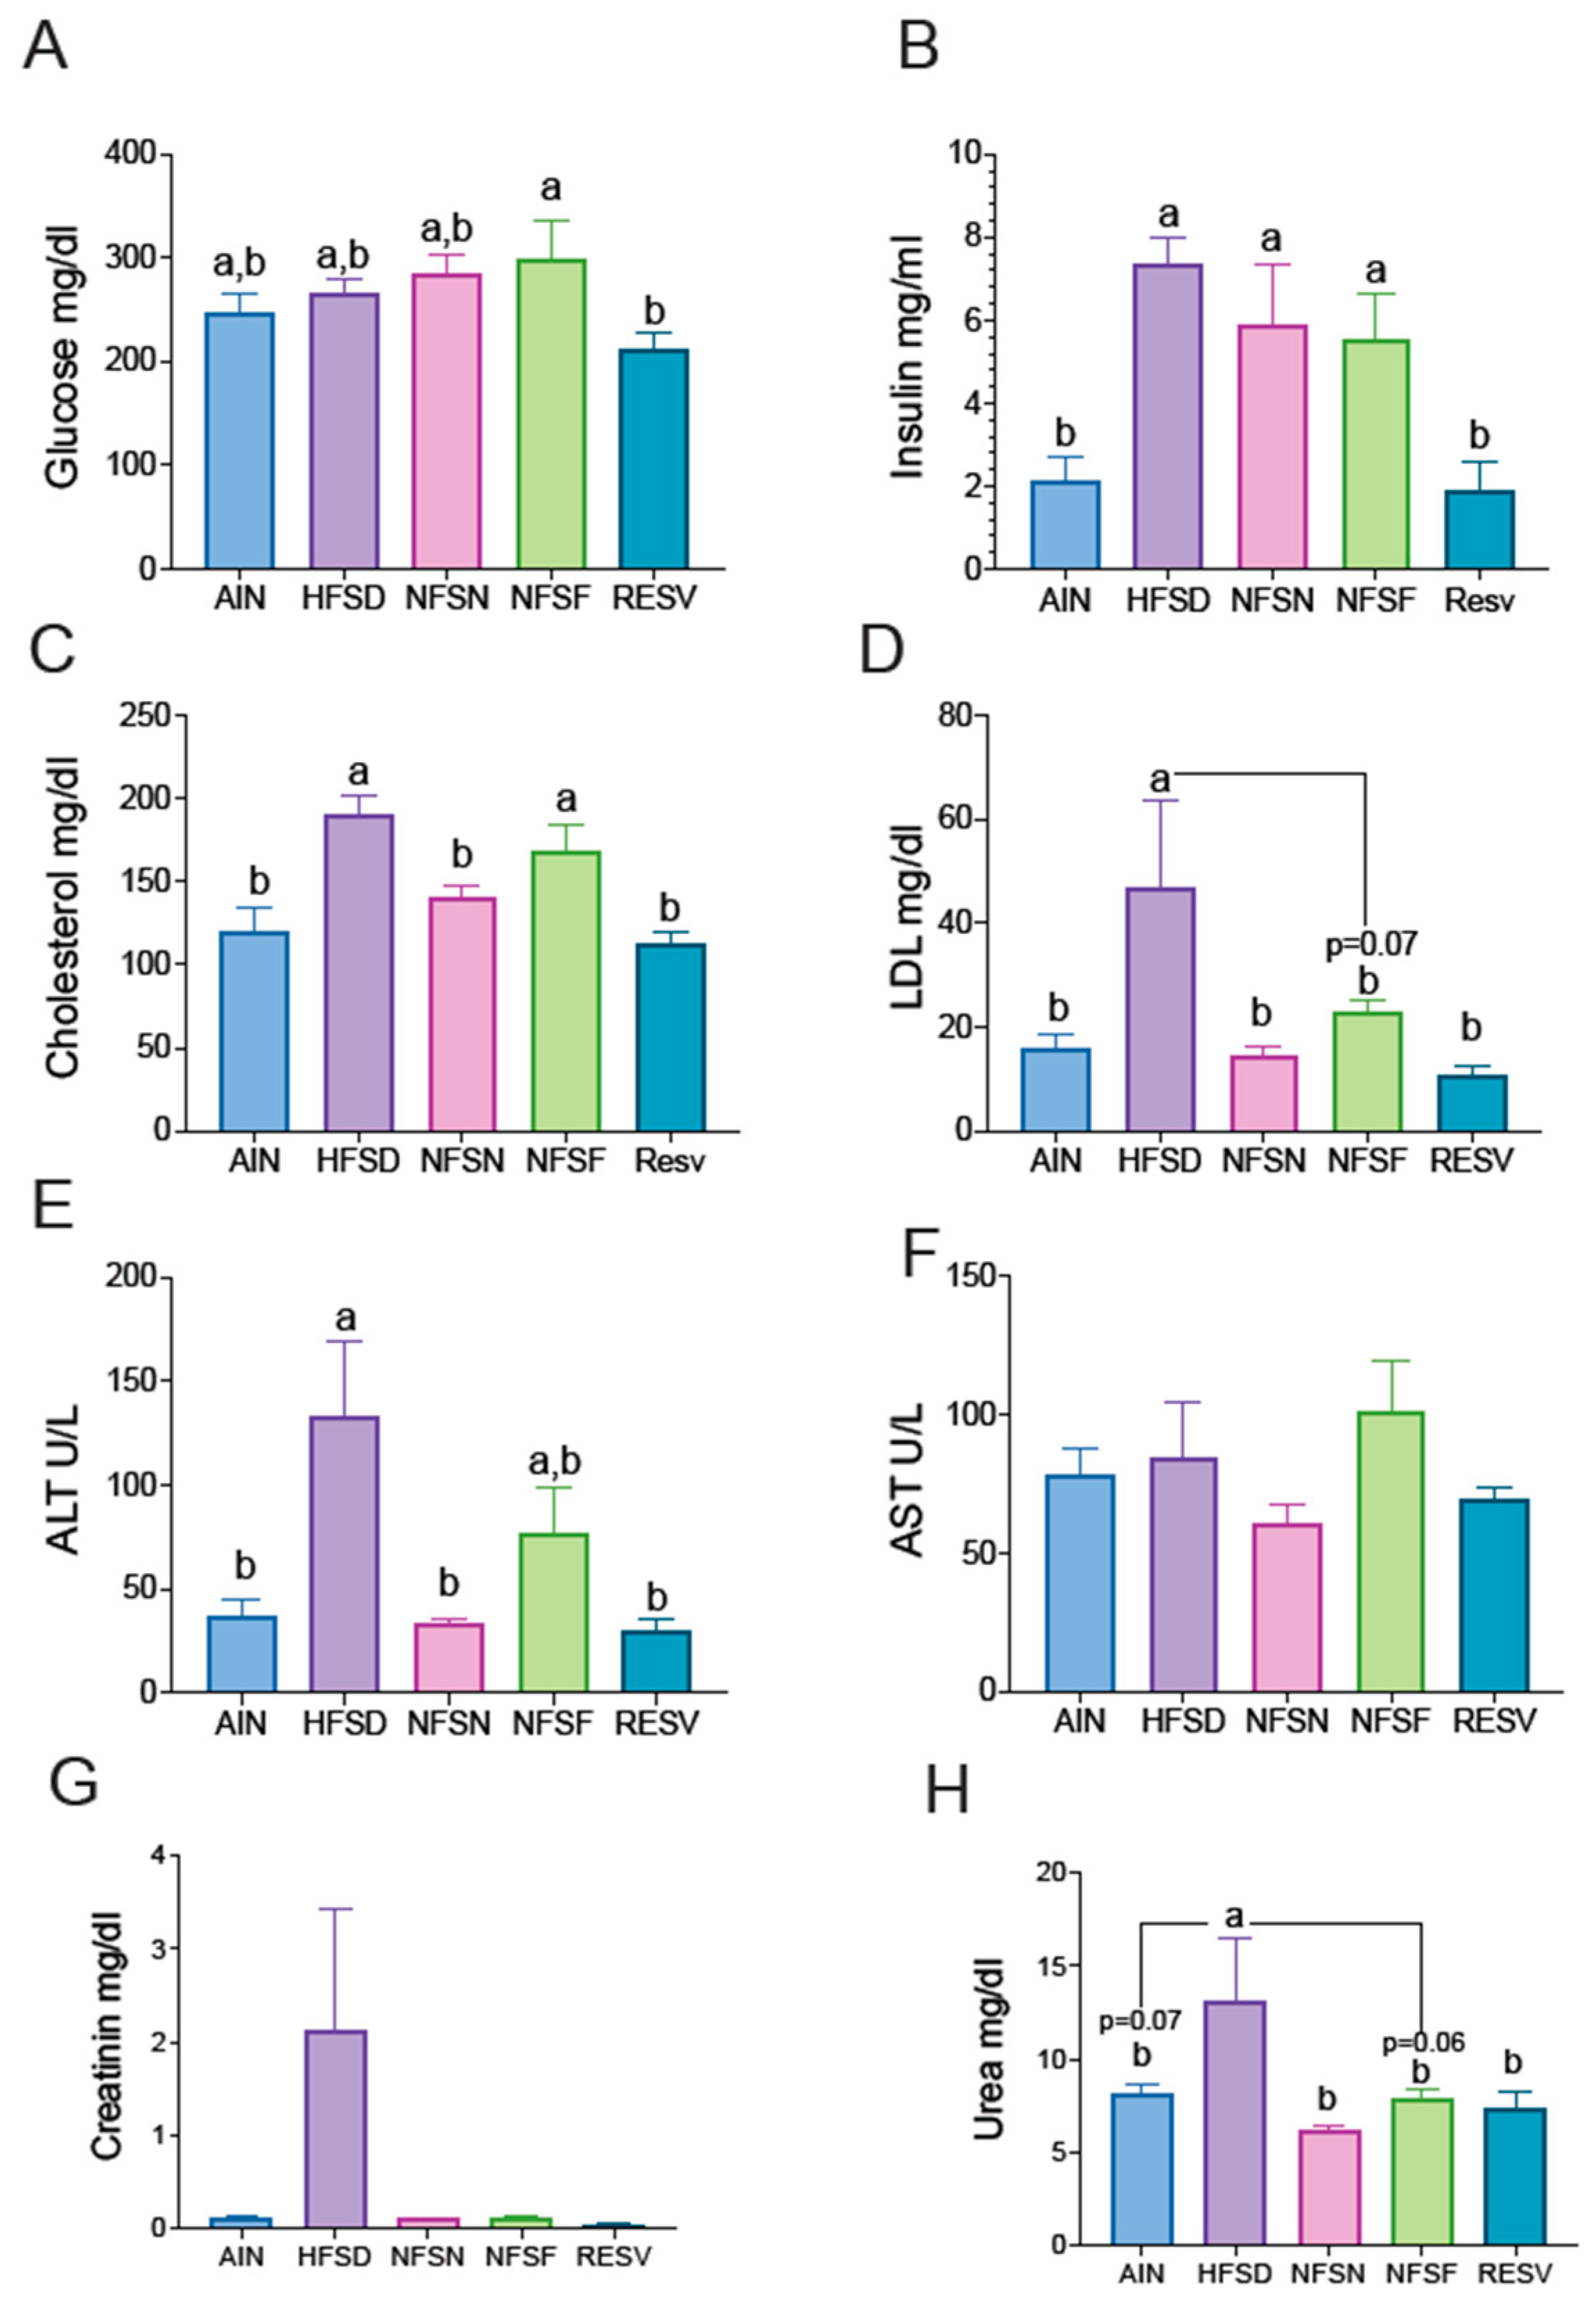
Figure 4.
Measurement of energy expenditure and glucose tolerance in mice with AIN-93 diet and HFSD with or without CoA-flavonoids. determined by indirect calorimetry. (A) Oxygen consumption (VO2 ml/hr) and (B) total oxygen consumption (VO2 ml/hr), (C) RER time course (VCO2/VO2) and (D) RER in fasting and feeding period, (D) Glucose tolerance test (GTT) and (E) Area under the curve of GTT fed with a control OR HFSD with or without CoA-flavonoids. The slope and intercept in ml/hr or Kcal/h are indicated for each condition, (n= 6–9 by group). Results are shown as means ± S.E.M.
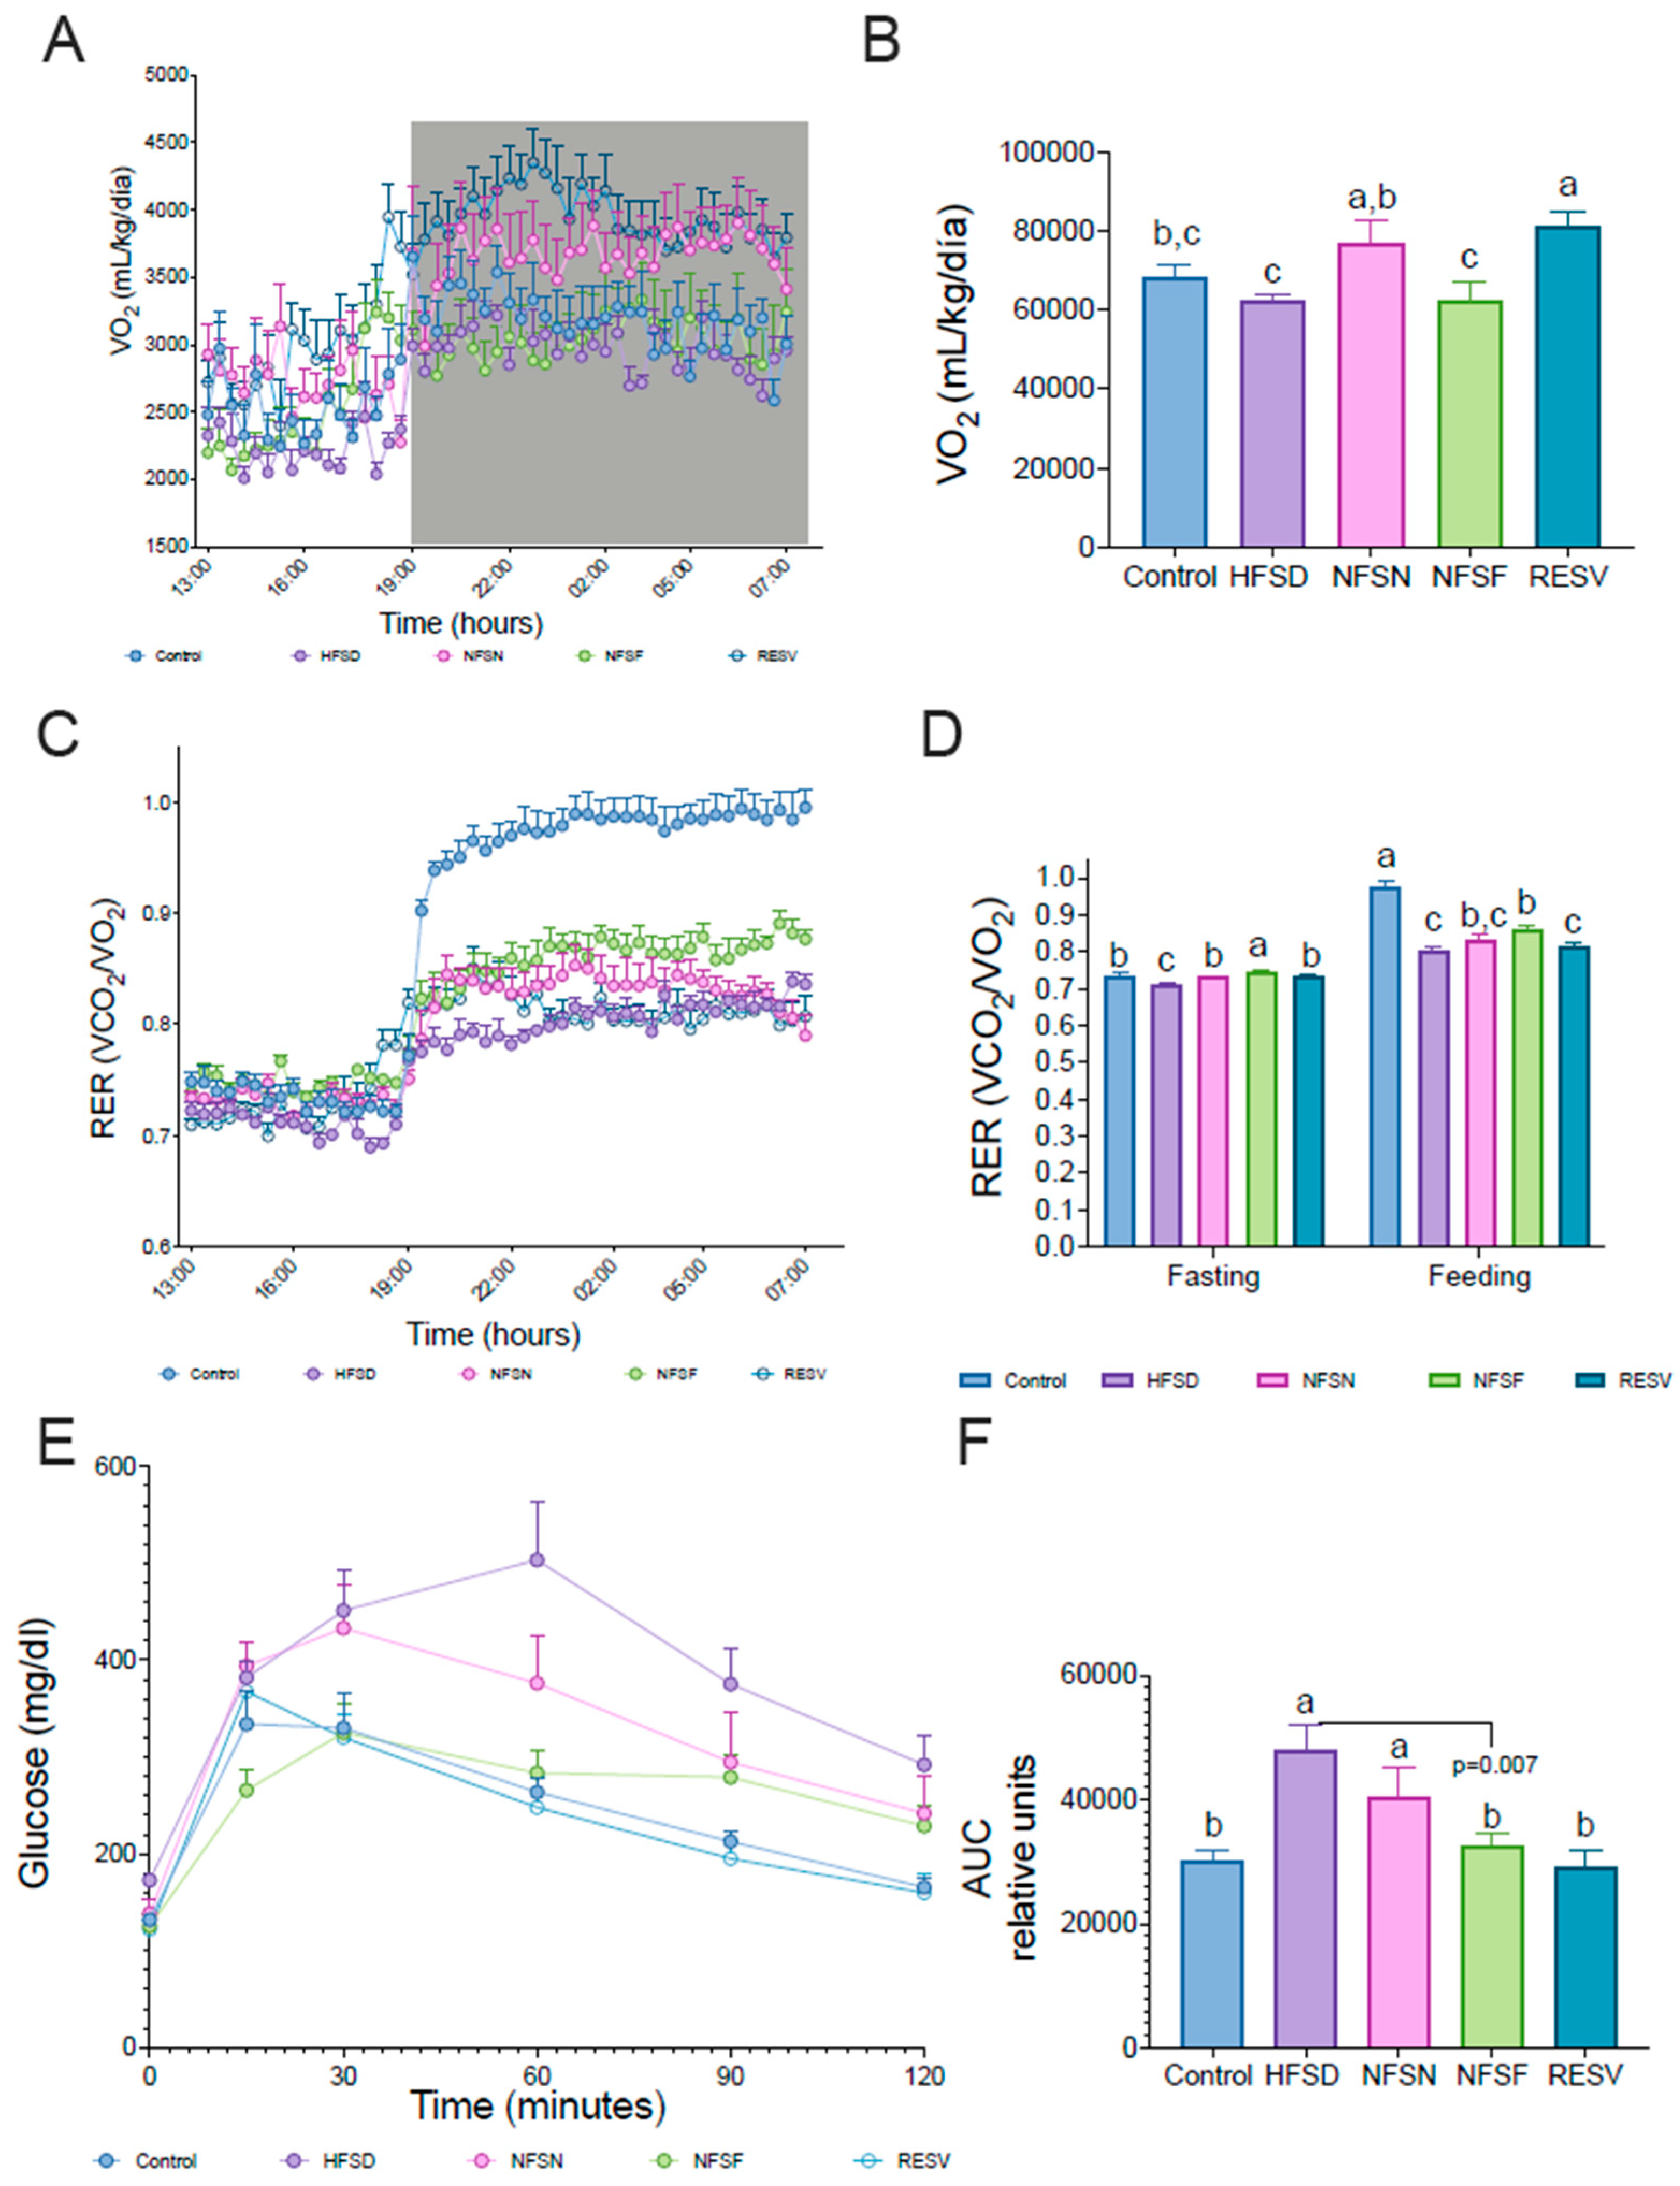
Figure 5.
Effect of CoA-flavonoids on hepatic lipids. A) H&E staining of liver, B) quantification of total hepatic triglycerides and (C) total cholesterol, D) hepatic determination of linolenic acid, DHA, and EPA and (E) linolenic acid and DHA+EPA ratio, F) quantification of palmitic and palmitoleic acid, G) stearic and oleic acid and (H) satured fatty acids determined by Gas Chromatography. All the quantification were realized in all mice fed with a control and HFSD with or without CoA-flavonoids. Lipids samples were obtained through Folch metod. Results are showed as the means ± S.E.Ms. (n=4-5 by group). One-way ANOVA was performed, letters indicate differences between groups (p=0.05). Results are shown as means ± S.E.M.
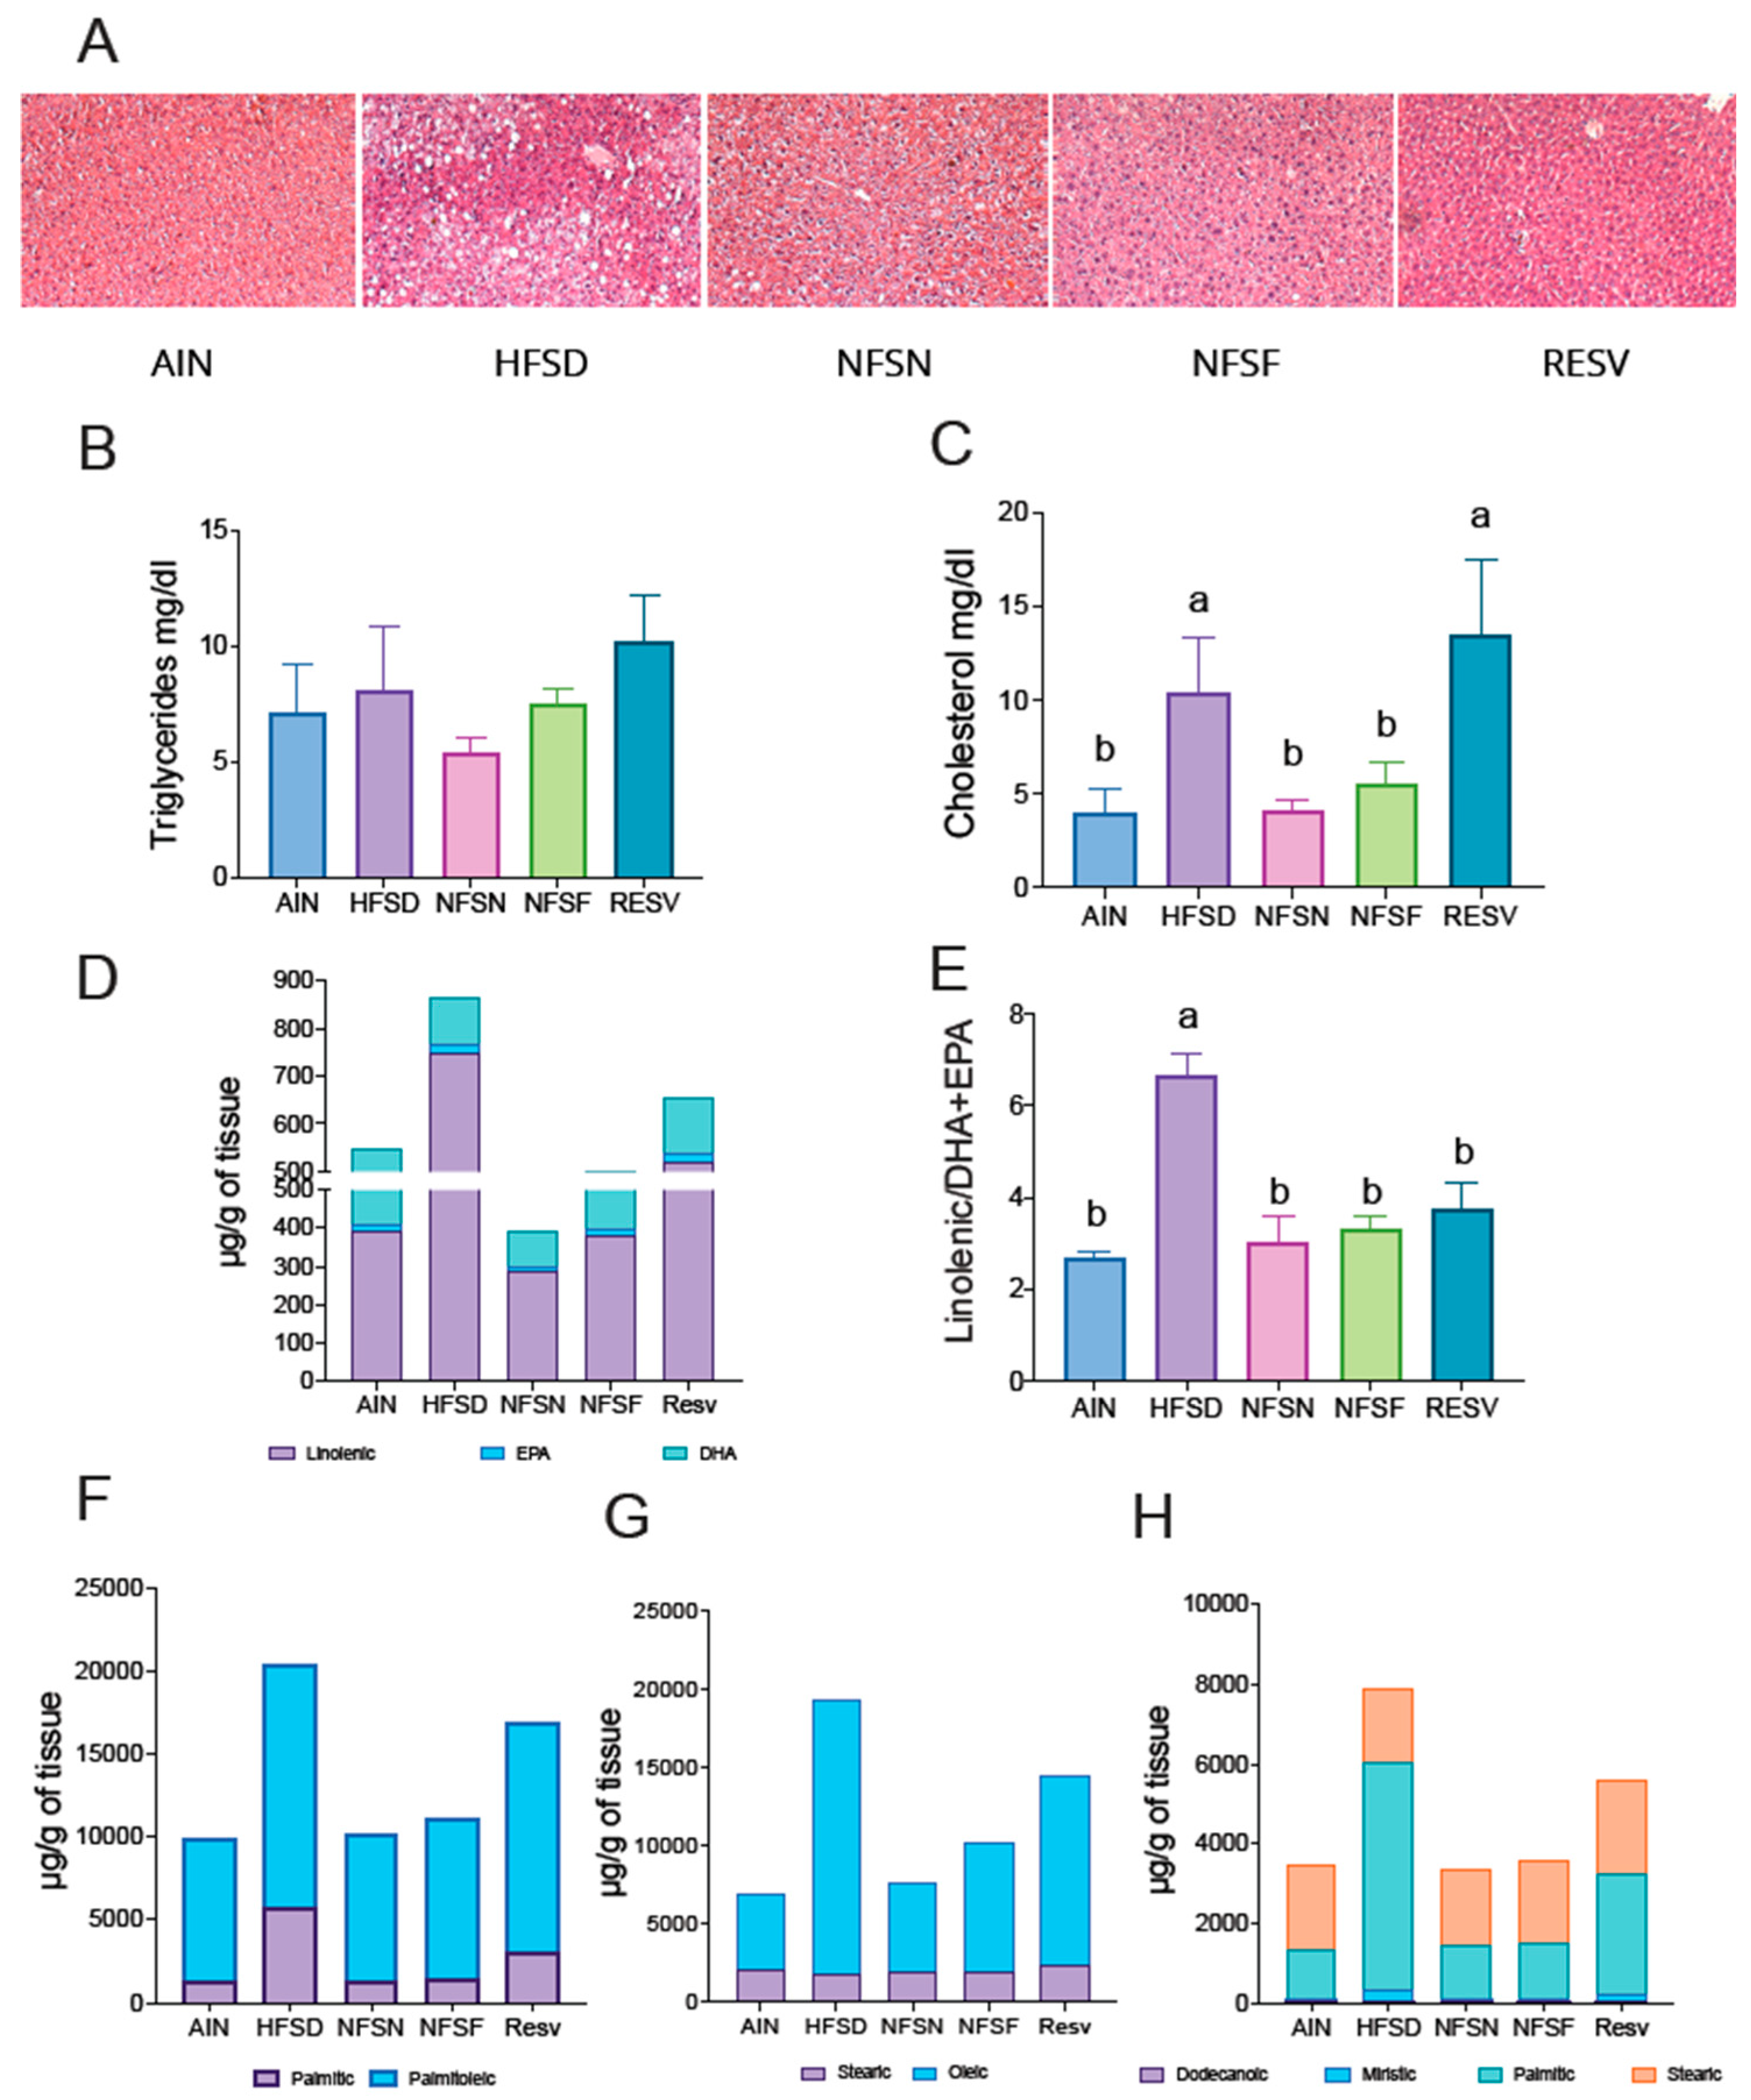
Figure 6.
Effect of CoA-flavonoids in White and Brown adipose tissue metabolism. A) H&E staining of WAT, B) size quantification of adipocytes and (C)mean size of WAT, quantification performed by adiposoft, D) serum concentration of adiponectin and E) leptin measured by and ELISA Kit, F) Immunoblotting and densitometric analysis of UCP-1 and PGC1-α from iWAT, fed with a control and HFSD with or without CoA-flavonoids. Results are showed as the means ± S.E.Ms. (n=4-7 by group). One-way ANOVA was performed, letters indicate differences between groups (p=0.05). Results are shown as means ± S.E.M.
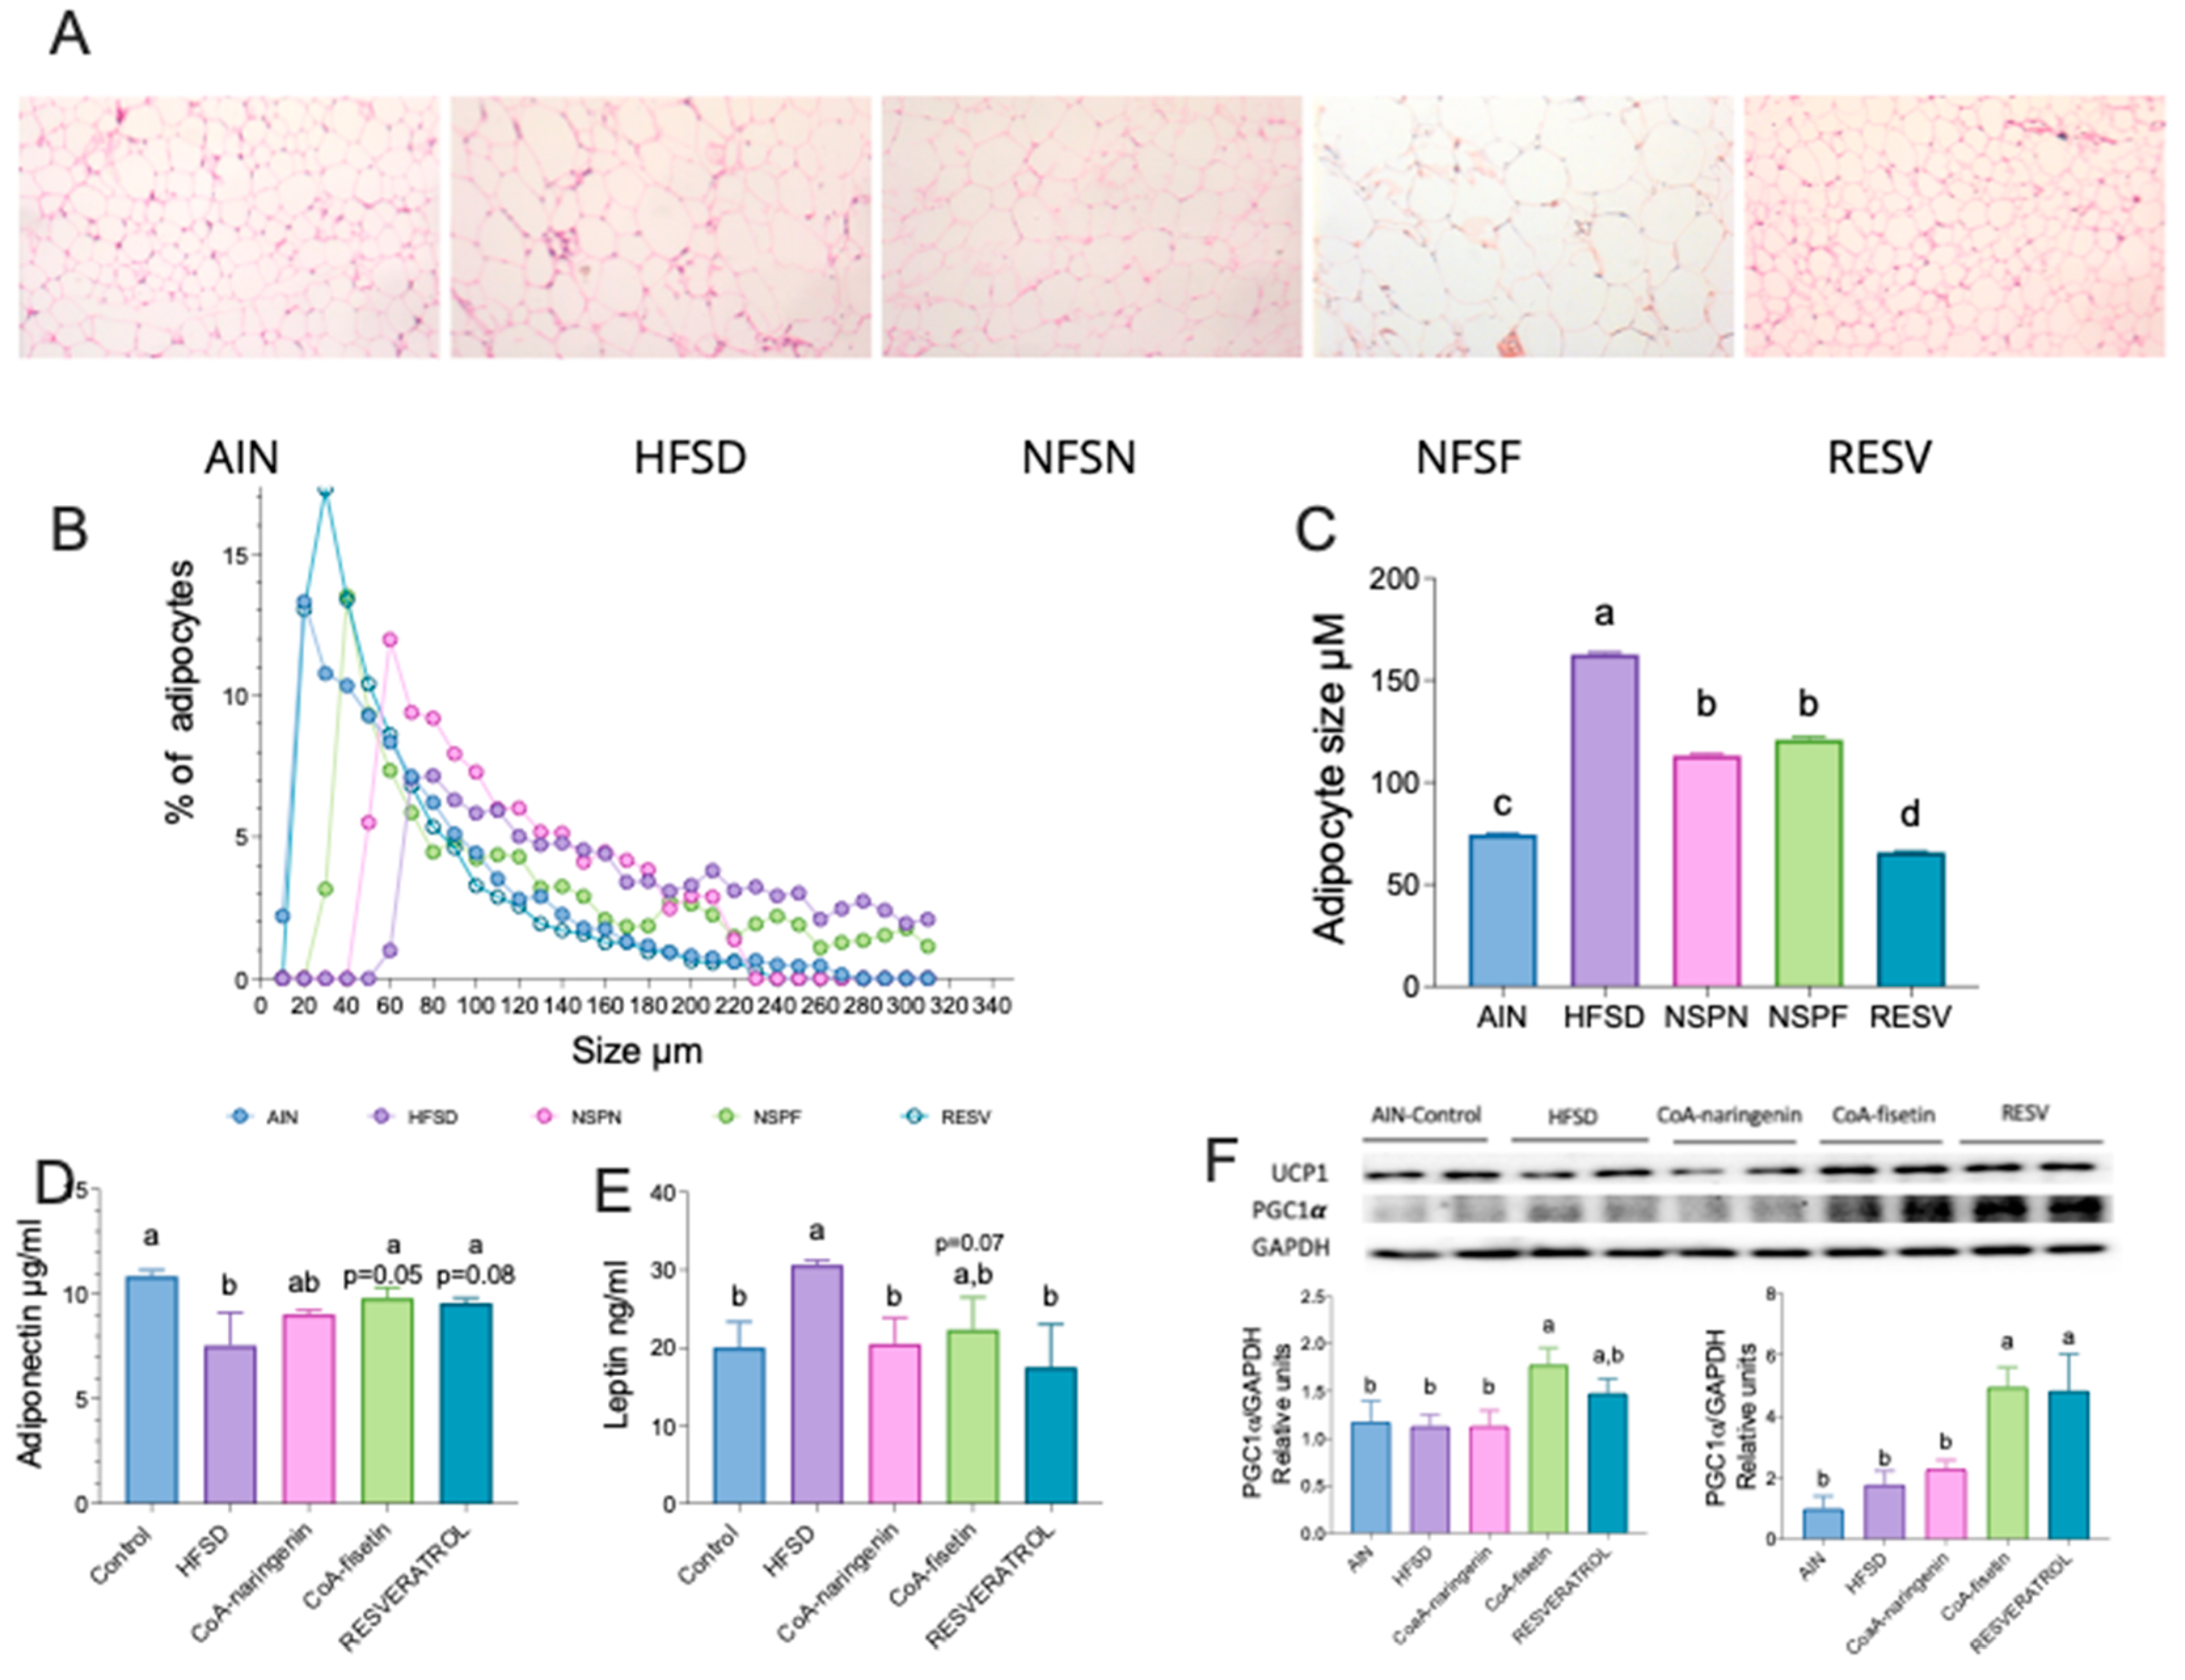
Figure 7.
Effect of CoA-flavonoids on intestinal microbiota. A) Alpha diversity by Shannon index, B) Beta diversity by Jaccard. C) Relative abundance at Phylum level, Relative abundance at genus level by D)Akkermansia, E)Bifidobacterium, F) Roseburia, G) Lactococcus, H) Parasutterella, I)Anerovorax, J)Marvibryantia, K) Paraprevotella, L) Butyricicoccus, Linear Discriminant Analysis between M) C an HFSD groups, N) Fisetin and HFSD groups, O) Naringenin and HFSD groups and P) Resveratrol and HFSD groups.
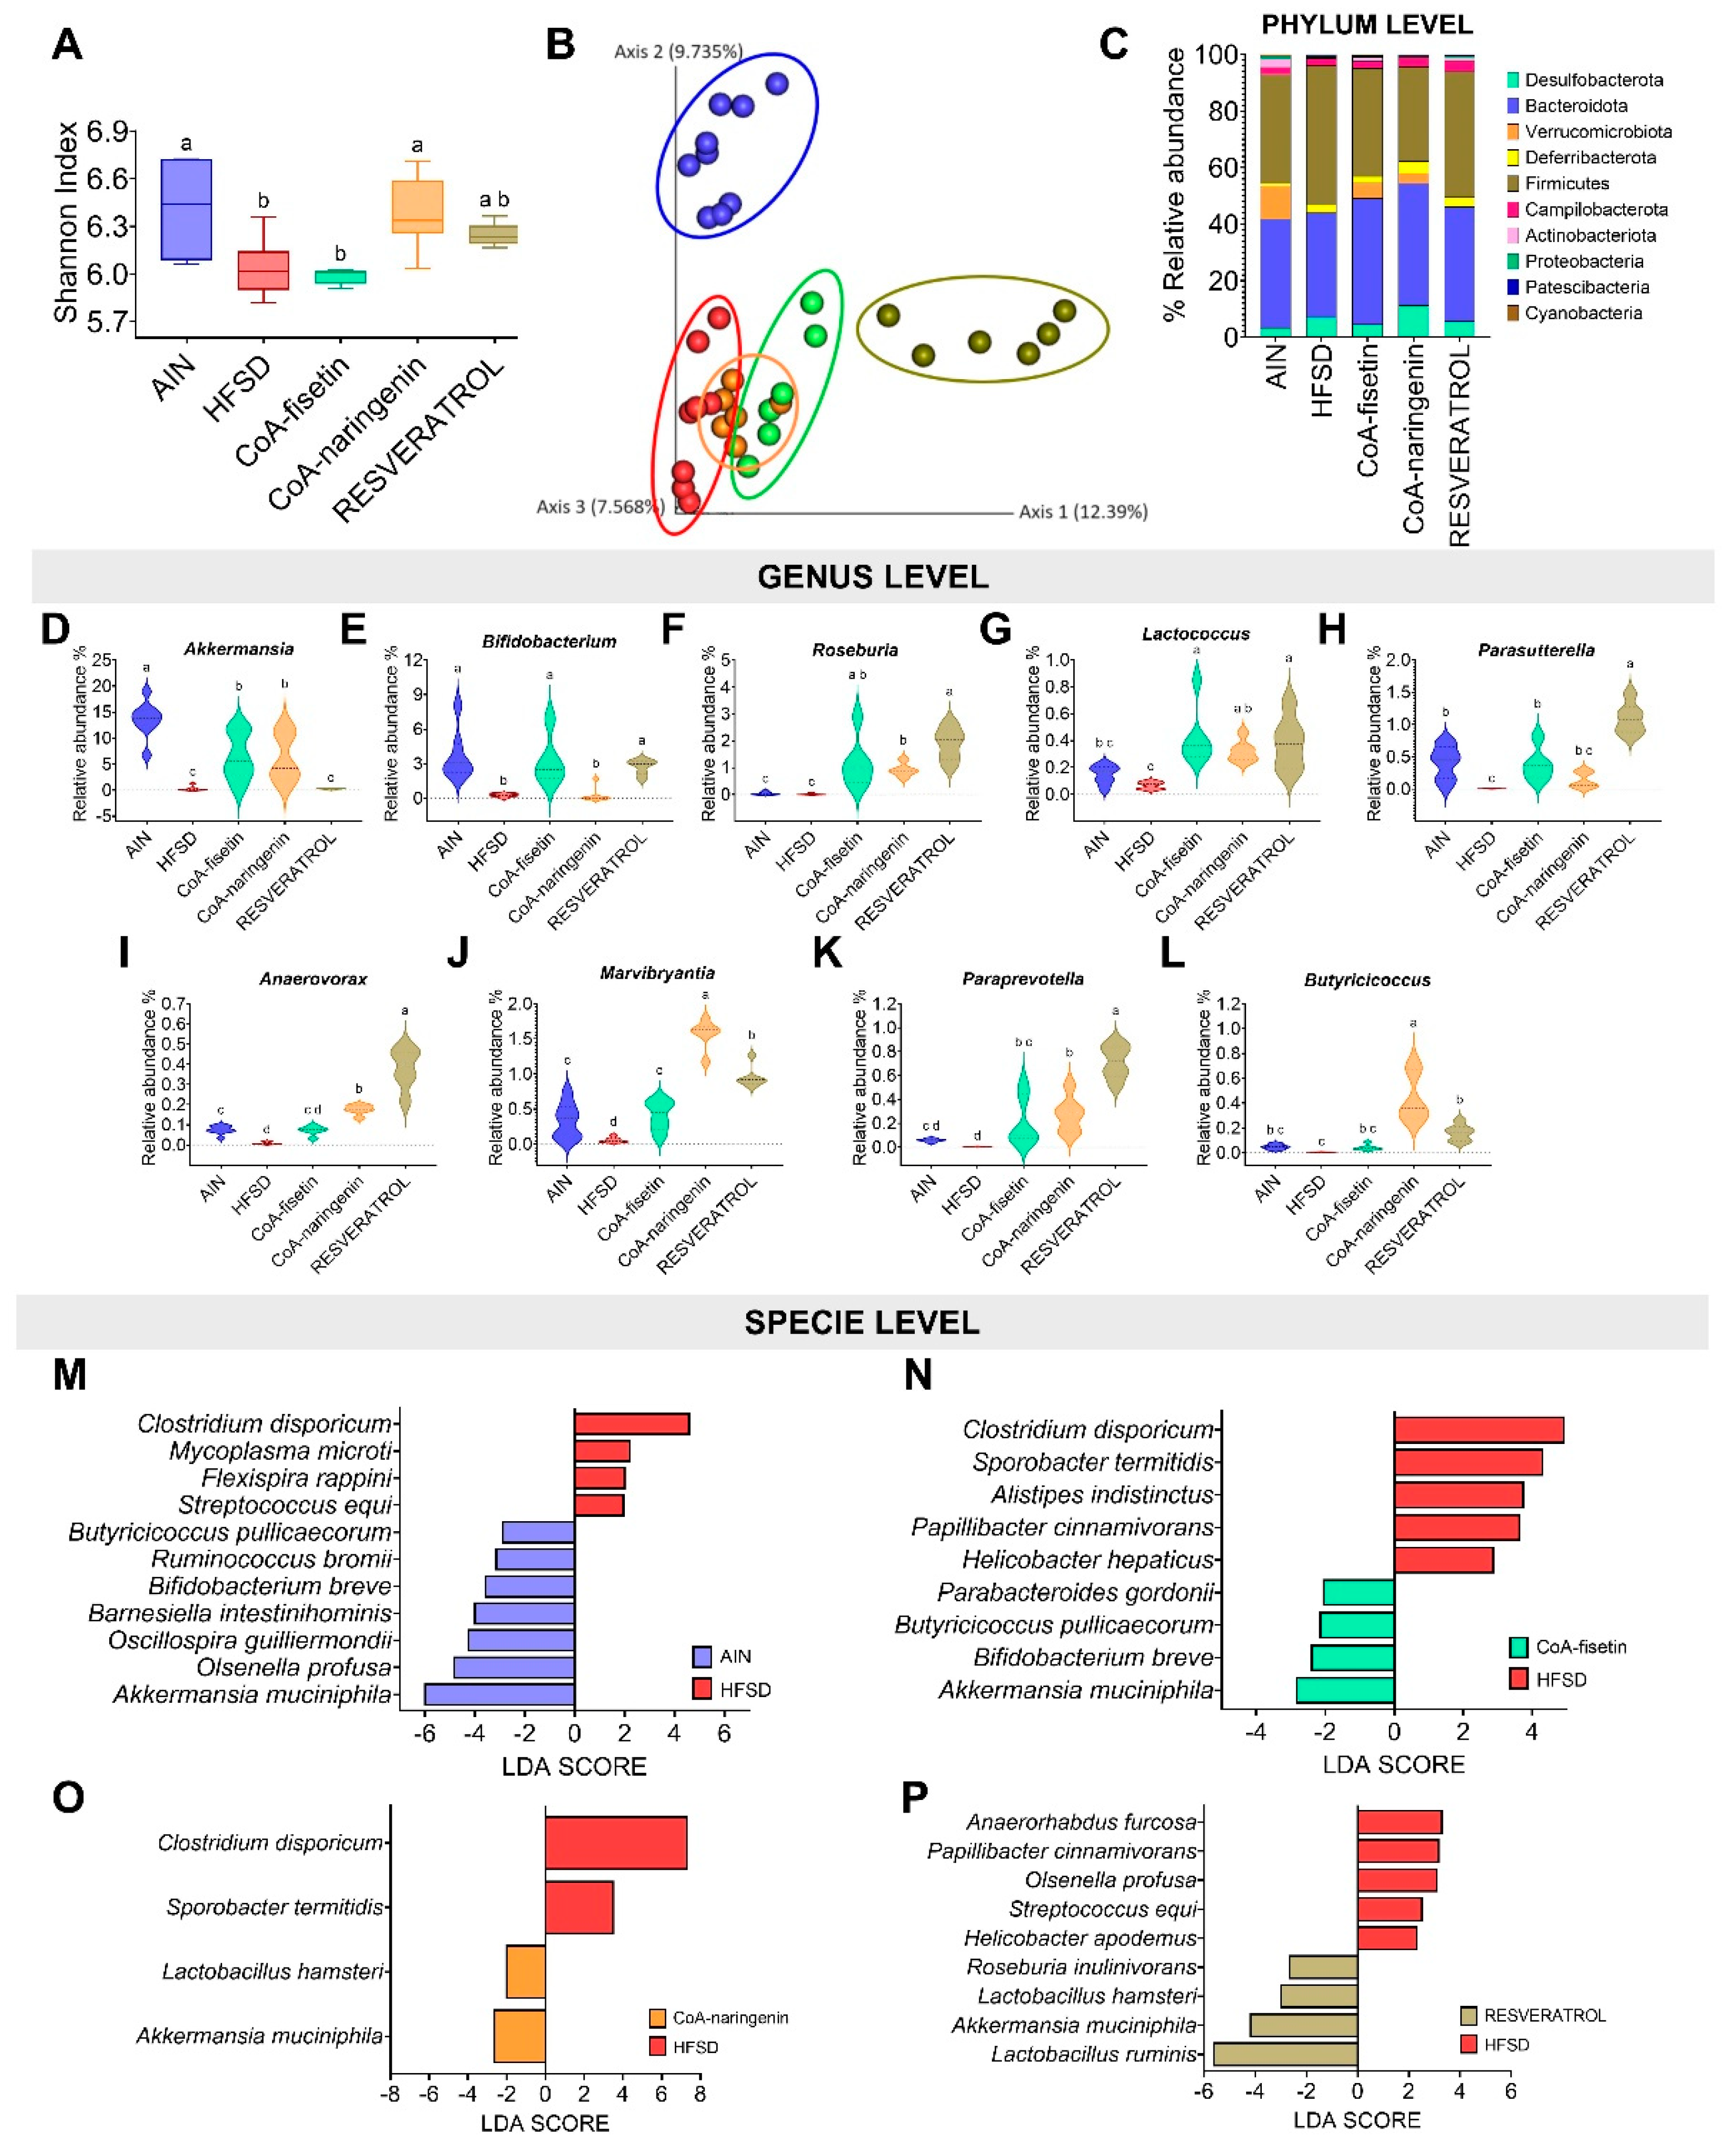
Figure 8.
Correlogram of the intestinal microbiota and metabolic markers with CoA-flavonoids consumption. (A) Correlogram of CoA-naringenin consuption, (B) Correlogram of CoA-fisetin consuption (C) of HFSD consumption. Pearson correlation.
Figure 8.
Correlogram of the intestinal microbiota and metabolic markers with CoA-flavonoids consumption. (A) Correlogram of CoA-naringenin consuption, (B) Correlogram of CoA-fisetin consuption (C) of HFSD consumption. Pearson correlation.
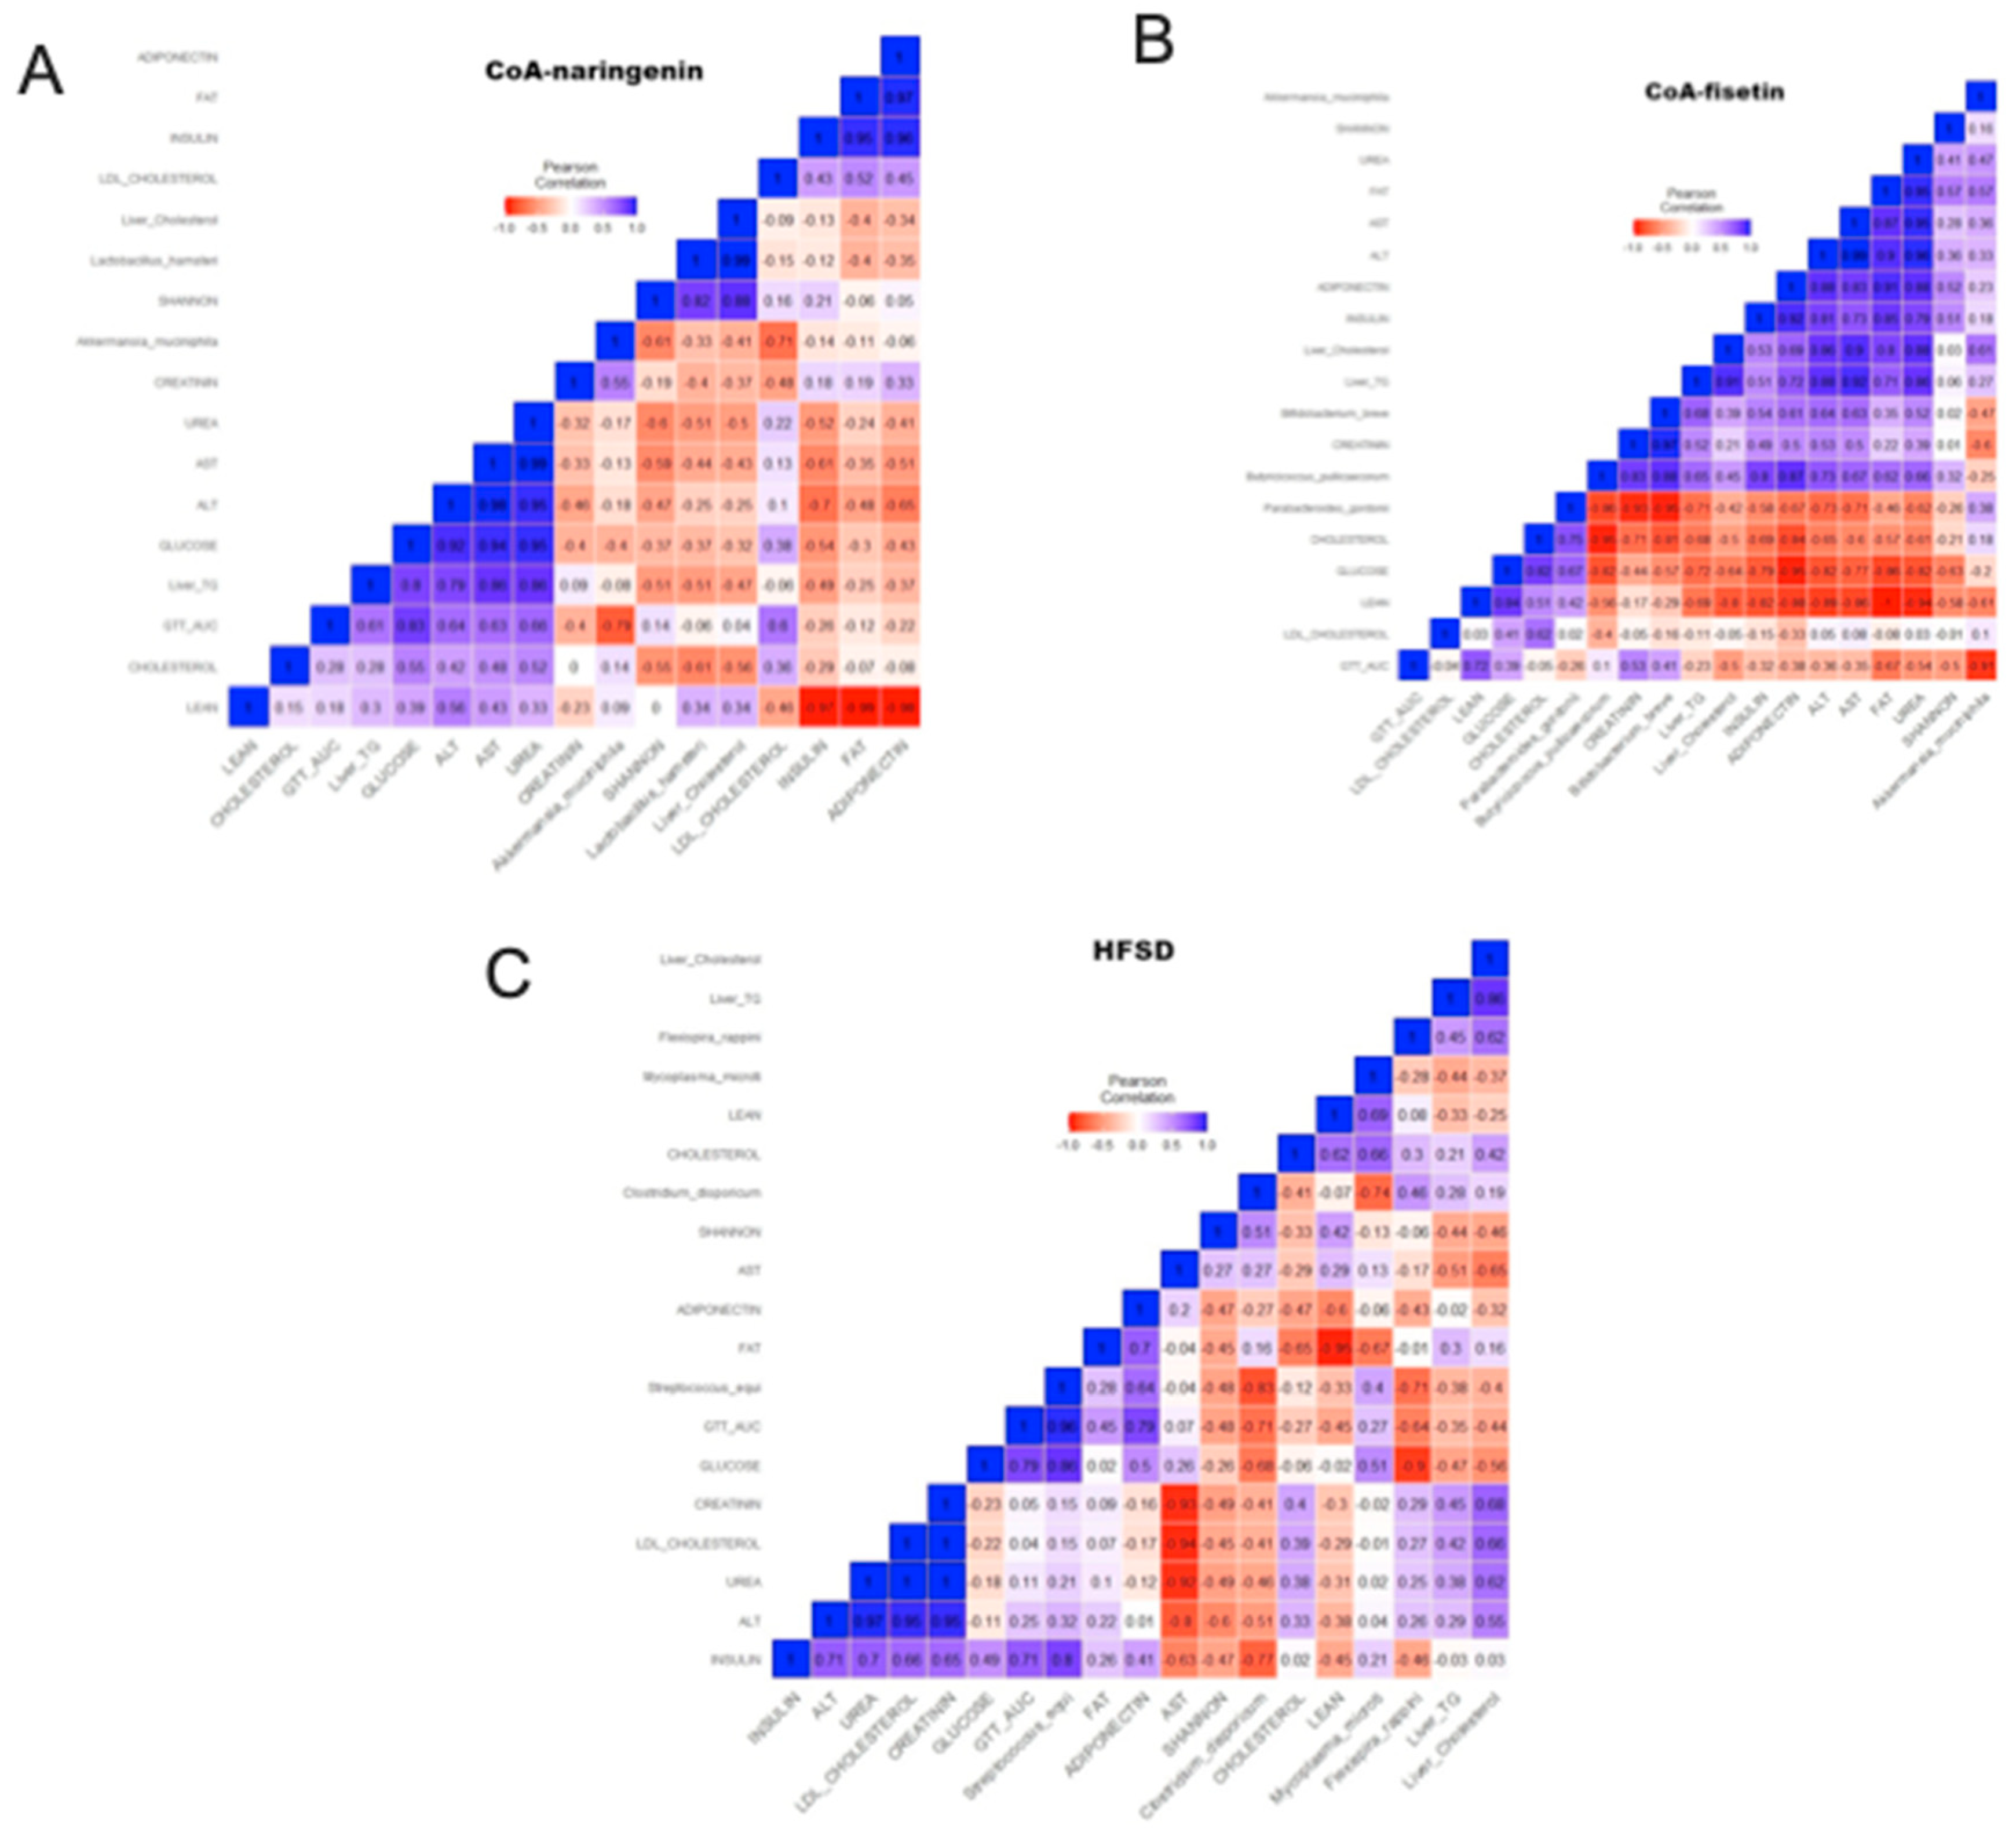

Table 1.
Composition of the different diets, the control AIN-93-Diet and the High Fat-Sucrose Diet (HFSD) with or without NPS-flavonoids and resveratrol.
Table 1.
Composition of the different diets, the control AIN-93-Diet and the High Fat-Sucrose Diet (HFSD) with or without NPS-flavonoids and resveratrol.
| Ingredients | Control (%) | HFSD (%) | HFSD NPS-flavonoids/ (%) |
HFSD Resveratrol (%) |
|---|---|---|---|---|
| L-Cystine | 0.3 | 0.3 | 0.3 | 0.3 |
| Choline bitartrate | 0.25 | 0.25 | 0.25 | 0.25 |
| Vitamin mix | 1 | 1 | 1 | 1 |
| Fiber | 5 | 5 | 5 | 5 |
| Mineral mix | 3.5 | 3.5 | 3.5 | 3.5 |
| Soybean oil | 7 | 3.1 | 3.1 | 3.1 |
| Cornstarch | 39.74 | 9 | 8.8 | 8.8 |
| Dextrinized cornstarch | 13.2 | 11.4 | 11.4 | 11.4 |
| Sucrose | 10 | 21.3 | 21.3 | 21.3 |
| Casein | 20 | 24 | 24 | 24 |
| Lard | 0 | 21.88 | 21.88 | 21.88 |
| TBHQ | 0.0014 | 0.0013 | 0.0013 | 0.0013 |
|
CoA-Flavonoids (Naringenin/fisetin) |
-- | -- | 0.2 | -- |
| Resveratrol | -- | -- | -- | 0.2 |
| TOTAL | 99.99 | 100.73 | 100.73 | 100.73 |
TBHQ: Tert-butylhydroquinone.
Disclaimer/Publisher’s Note: The statements, opinions and data contained in all publications are solely those of the individual author(s) and contributor(s) and not of MDPI and/or the editor(s). MDPI and/or the editor(s) disclaim responsibility for any injury to people or property resulting from any ideas, methods, instructions or products referred to in the content. |
© 2024 by the authors. Licensee MDPI, Basel, Switzerland. This article is an open access article distributed under the terms and conditions of the Creative Commons Attribution (CC BY) license (http://creativecommons.org/licenses/by/4.0/).
Copyright: This open access article is published under a Creative Commons CC BY 4.0 license, which permit the free download, distribution, and reuse, provided that the author and preprint are cited in any reuse.


