
Submitted:
29 April 2023
Posted:
04 May 2023
You are already at the latest version
Abstract
A new three-dimensional numerical model of a polymer electrolyte fuel cell (PEFC) with a single straight channel has been developed to primarily investigate the important impact of the double-sided microporous layer (MPL) coating on the overall performance of the fuel cell and the distribution of the current and the oxygen concentration within the cathode gas diffusion layers (GDLs). Realistic experimentally estimated interfacial contact resistance values between the gas diffusion layer and each of the bipolar plates and the catalyst layer values were incorporated into the model, and parametric studies were performed. The results showed that the double-sided MPL coating could significantly improve the fuel cell performance by up to 30%. Also, it was shown that the neglect of the contact resistance between the MPL and the catalyst layer could overestimate the fuel cell performance by up to 6%. In addition, the results showed that the fuel cell performance and the distribution of the current and oxygen are more sensitive to the porosity of the MPL facing the bipolar plate than the porosity of the MPL facing the catalyst layer. All the above results are presented and critically discussed in detail.
Keywords:
Polymer electrolyte fuel cells
; Gas diffusion layers
; Microporous layer
; Double-sided coating
; Contact resistance
; Porosity
1. Introduction
Polymer electrolyte fuel cells (PEFCs) have great potential of becoming a major alternative to fossil fuel combustion technology and especially in the transport sector. They have higher efficiency as compared to internal combustion engines as they convert the chemical energy directly into electrical energy. Also, they are light in weight, with noiseless operation, and emit low to zero pollutant emission. However, the ohmic and concentration losses associated with the polymer electrolyte fuel cells evidently lower the efficiency and performance of the cell. A way to mitigate these losses is to minimise the electrical resistance of the fuel cell and increase the pore volume available for the gas transport to the reactive sites. This can be achieved by minimising the contact resistances between the solid components of the fuel cell and designing gas diffusion media with better water management and higher gas reactant transport. Most PEFC models in the literature neglect the interfacial contact resistance between the GDL and bipolar plate (BPP). However, researchers have been able to characterise the GDL interfacial contact resistance and have reported its influence on the performance of the PEFC. For example, Zhou et al. [1,2] developed a micro-scale numerical model to estimate the contact resistance between the BPP and the GDL, using FU436a graphite plates and Toray TGP-H-030 carbon paper. They reported that the contact resistance decreased with increasing the bipolar plate asperity peak density by about 14%. Qiu et al. [3] showed that the interfacial contact resistance between the GDL and bipolar plates contributes about 80% of the ohmic losses in the PEFC by experimentally measuring the bulk resistance and investigating the microstructure for Toray carbon papers (TGP-H-060 and TGP-H-090), Tenax carbon cloths (TCC2660 and TCC3250), and Freudenberg carbon felts (H2315 and H14) under cyclic and steady loads. Lai et al. [4] developed a two- dimensional mechanical - electrical FEM model and an experimental technique to estimate the contact resistance between the bipolar plate and the GDL and reported that the contact resistance decreases rapidly as the clamping pressure was increased. For example, they found that the contact resistance decreases by 20 mΩ.cm² when the clamping pressure increases from 0.5 MPa to 3.0 MPa. Zhang et al. [5] experimentally estimated the contact resistance between the GDL and bipolar plates using experimental and numerical approaches. They reported that the contact resistance between GDLs and the bipolar plates is influenced by the clamping pressure in the PEFC stack, and it drops from 9.85 mΩ.cm² to 3.91 mΩ.cm² as the cell clamping pressure increases from 0.5 MPa to 3.0 MPa. Vikram et al. [6] reported that there exists a non-linear distribution of the contact resistance along the GDL-BPP interface and that it contributes to about two thirds of the overall ohmic losses in the PEFC. Sow et al. [7] developed a novel numerical and experimental technique to characterise the through-plane interfacial contact resistance and the through-plane bulk resistance for various SGL carbon paper GDLs. They reported that both the bulk and interfacial contact resistances of the GDL increased with PTFE treatment and that the bulk resistance of the GDL forms only 10% of the total ohmic losses in the PEFC. Ismail et al. [8] experimentally measured the interfacial contact resistance between graphite bipolar plates and uncoated and MPL coated SGL GDLs using a 4-probe ohmmeter. They reported that the contact resistance was significantly reduced with the MPL coating. For example, the measured contact resistance of the SGL 10BA carbon fibre paper decreased from 17.5 mΩ.cm² to 6.5 mΩ.cm² when coated with the MPL. Ye et al. [9] developed a multi-electrode probe technique to measure the contact resistance for Toray TGP-H-120 carbon paper and carbon cloth GDLs. They reported that the addition of an MPL coating had no effect on the bulk resistivity of either material but that the interfacial contact resistance of both GDL materials reduced with the MPL coating but increased with hydrophobic treatment.
It has been reported in the literature [10,11,12,13] that the MPL improves the water management in the cathode side of the PEFC due to its relatively small pore size and increased hydrophobicity. Also, it provides mechanical strength, against the clamping force, to the catalyst layer by increasing the surface contact between the catalyst layer and the GDL [10,13]. In addition, it improves the electrical conductivity of the GDL by reducing the interfacial contact resistance between the GDL and the catalyst layer [9] as well as that between the GDL and bipolar plate by its penetration into the GDL [8,14,15]. Ismail et al. [16] reported that the MPL coating reduced the interfacial contact resistance between the GDL and the bipolar plate. They attributed this to the compressibility of the MPL which allows it to penetrate the pores in the GDL and thereby establishing a good contact at the GDL-bipolar plate interface. There have been various studies in the open literature on novel designs of the GDL-MPL structure to improve its pore structure. For example, Kitahara et al. [14] developed a water vapour exchange system of the PEFC comprising two distinct GDL architectures: one coated with a hydrophobic MPL and the other coated with a hydrophilic MPL loaded with polyvinyl alcohol (PVA) and carbon black. They reported that the GDL coated with the hydrophilic MPL improved the water transport and enhanced the overall PEFC performance better than that coated with the hydrophobic MPL. Kitahara et al. [15] also developed a GDL with multi-layered hydrophobic and hydrophilic MPL. The hydrophilic carbon black MPL was deposited on the carbon substrate while the hydrophilic MPL, with carbon black and PVA, was deposited on the hydrophobic MPL so that it faced the catalyst layer. On the other hand, Chun et al. [17] developed a double MPL-coated GDL with a hydrophilic MPL sandwiched between the carbon substrate and the hydrophobic MPL that was in contact with the catalyst layer. They reported better fuel cell performance with the latter GDL than with the conventional hydrophobic MPL coated GDL under low humidification conditions. Wang et al. [18] fabricated a bi-functional pore structure MPL using a carbon black composite of Acetylene Black and Black pearls 2000 carbon and reported an improved power density of 0.91 W/cm² for the MPL containing 10 wt. % Black Pearls 2000. Also, Wang et al. [19] developed a composite carbon MPL consisting of Acetylene Carbon Black and Black Pearls 2000 carbon which had a bi-functional pore structure for effective mass transport management in the fuel cell. An important finding in their study is that the presence of an MPL at the GDL-bipolar plate interface reduced the electrical contact resistance between the GDL and the bipolar plate. They proposed a double-sided MPL GDL for enhanced electrical conductivity/charge transport as well as gas/water transport. The outcome of their study, as well as that of [8], forms the motivation of the investigation carried out in this work.
In this work, a three-dimensional multiphase model of the PEFC was developed to mainly investigate, for the first time, the impact of a double-sided MPL coating on the global fuel cell performance and the distribution of the current and oxygen concentration within the cathode GDL. After validating the model, parametric studies were performed by realistically changing the base experimentally estimated value of each of the interfacial contact resistances between the GDL and its adjoining components (i.e., the bipolar plate and the catalyst layer). Also, the study was extended to investigate the sensitivity of the fuel cell performance to the porosity of the MPLs facing both the bipolar plate and the catalyst layer. The outcomes of this study provide insights on the significance and feasibility of double-sided MPL coatings in PEFCs.
2. Model description and transport equations
The multiphase, isothermal PEM fuel model includes the transport of gas species, energy, charge, liquid, and dissolved water. This section details the conservation equations that govern the transport of these physical quantities as well as their source terms. The PEFC model developed in this study is based on earlier models presented in [20,21]. Detailed descriptions of the conservation equations are given in the following subsections.
2.1. Model assumptions
To simplify the PEFC model, the following assumptions have been made:
- The fuel cell operates in steady state.
- The flow in the flow channels is laminar as the Reynolds numbers are low.
- The membrane is impermeable to gases.
- Uniform compression on all components of the fuel cell.
- The catalyst layer is coated on the gas diffusion media instead of the membrane.
2.2. Model geometry
The three-dimensional, straight gas flow channels computational domain of the PEFC model is shown in Figure 1 and consists of cathode and anode bipolar plates (or current collectors), cathode and anode flow channels, cathode and anode catalyst layers, cathode and anode GDLs, cathode and anode MPLs, and the membrane electrolyte. Only half of the channel width is considered in the PEFC model due to symmetry and to reduce computational time. The geometrical, operational, and physical parameters of this model are presented in Table 1.
2.3. Governing equations
The equations which govern the transport of physical quantities are detailed in this section. However, equations (10 – (6) have already been used and defined in detail in our previous study [20] but are briefly stated here for easy of reference [20,21]. Note that the mathematical expressions of the source terms are placed in the supplementary materials attached to this paper.
Mass transport equation
where ε is the porosity of the porous medium, ρ and re the mixture fluid density and velocity vector, respectively.
Momentum transport equation
where P is the pressure of the gas mixtures, µ is the dynamic viscosity of the gas mixtures and K is the permeability of the porous medium.
Species transport equation
where is the mass fraction of species and is the effective binary diffusivity of species into . is calculated using the Bruggeman’s correlation as follows [22]:
where τ is the tortuosity of the porous medium and is bulk binary diffusivity of species into . is the source term that represents either consumption/production of species (H2, O2 or H2O).
Energy transport equation
where T is the temperature, is the specific heat capacity of the gas mixtures is the effective thermal conductivity. is the heat source term and takes one of the forms shown in the in the supplementary materials.
Charge transportequations
Two potential equations for the electronic and ionic conduction are solved. The equations are expressed as follows:
where and are the electrical (solid phase) and ionic (membrane phase) potentials respectively. and are the solid-phase potential and membrane-phase potential respectively.
Liquid water transportequations
where and are the relative permeability of liquid and gaseous phases of water, respectively, and are given as follows [20]:
where is the liquid water saturation . The capillary diffusion coefficient, , in Equation (8) is given as follows [20]:
where is the dynamic viscosity of liquid water. is the capillary pressure and is given as follows [20]:
where is the surface tension of water, is the contact angle, K is the absolute permeability.
2.4. Boundary conditions and numerical procedure
Mass flow rate boundary conditions were specified for the inlets of the anode and cathode gas flow channels. An operating temperature of 353K and the species mass fractions were also specified at the inlets of the gas flow channels with the inlet liquid water saturation set to zero. The fluid mass flow rate is defined as a function of a typical operating current density (), which is in this case 1.0 A/cm², the active area of the fuel cell), the mass fraction of the gas reactant (), and the stoichiometric ratio ( of the reactant gas which was set as 1.5 and 2 for the hydrogen and oxygen gases, respectively. Therefore, the anodic and the cathodic mass flow rates are given as follows [20]:
The boundary conditions for the anode and cathode outlets and wall terminals are the same as those specified in our previous work [21]. The equations governing the transport of mass, heat, and charge, and liquid water in the PEFC model and the coupled boundary conditions were solved iteratively, using the commercial software ANSYS FLUENT with the Semi-implicit Method for Pressure Linked Equations (SIMPLE) algorithm employed for the pressure–velocity coupled with the second-order upwind discretization scheme for the conservation of momentum, species, energy, charge, and liquid water equations. The model was found to give a mesh-independent solution with a mesh of about 1.4 million cells; doubling this number result in a variation of less than 0.3% in the key performance indicator which is, in this case, the average current density at 0.55 V. The mesh geometry is shown in Figure 2, while the geometrical, operational, and physical parameters of this model are presented in Table 1.

| Property | Value |
|---|---|
| Channel length | 5 × 10⁻² m |
| Channel height | 1.0 × 10⁻³ m |
| Channel width | 1.0 × 10⁻³ m |
| Current collector rib width | 1.0 × 10⁻³ m |
| Current collector height | 1.5 × 10⁻³ m |
| GDL thickness | 2.0 × 10⁻⁴ m |
| MPL thickness | 5.0 × 10⁻⁵ m |
| Catalyst layer thickness | 1.0 × 10⁻⁵ m |
| Membrane thickness | 5.0 × 10⁻⁵ m |
| Operating temperature | 353 K |
| Gauge pressure at anode | 1 atm |
| Gauge pressure at cathode | 1 atm |
| Relative humidity of inlet gases | 100% |
| Stoichiometric ratio, anode | 1.5 |
| Stoichiometric ratio, cathode | 2 |
| Oxygen/nitrogen molar ratio in air | 0.21/0.79 |
| Catalyst layer porosity | 0.2 |
| GDL porosity | 0.7 |
| MPL porosity | 0.6 |
| Reference hydrogen concentration, | 56.4 mol/m3 |
| Reference oxygen concentration, | 3.39 mol/ m3 |
| Electrical conductivity of current collector | 20000 S/m |
| Electrical conductivity of GDL | 5000 S/m |
| Electrical conductivity of catalyst layer | 2000 S/m |
| Electrical conductivity of MPL | 5000 S/m |
| GDL permeability | 3.0 × 10⁻¹² m2 |
| MPL permeability | 1.0 × 10⁻¹ m2 |
| Catalyst layer permeability | 2 × 10-13 m2 |
| Membrane permeability | 1.8 × 10⁻¹⁸ m2 |
| Thermal conductivity of GDLs | 1.7/21 W/(m-K) |
| Thermal conductivity of MPL | 10 W/(m-K) |
| Thermal conductivity of catalyst layers | 0.3 W/(m-K) |
| Thermal conductivity of current collector | 100 W/(m-K) |
| Thermal conductivity of the membrane | 0.25 W/(m-K) |
| GDL/MPL/CL contact angle | 110/130/95 |
| Faraday’s constant | 96485 C/mol |
| Universal gas constant | 8.314 J/(mol-K) |
| Anode inlet mass fraction of hydrogen | 0.1105 |
| Anode inlet mass fraction of water | 0.8895 |
| Cathode inlet mass fraction of oxygen | 0.1503 |
| Cathode inlet mass fraction of water | 0.3541 |
| Anode flow rate | 1.3518e-07 kg/s |
| Cathode flow rate | 1.10331e-06 kg/s |
| Anode concentration exponents | 0.5 |
| Cathode concentration exponents | 1 |
| 100 A/m² | |
| Cathode reference exchange current density, | 0.0001760881 A/m² |
| Transfer coefficients for anode reaction | 0.5 |
| Transfer coefficients for cathode reaction | 1 |
| Anode specific surface area, | 1.0 × 10⁷ m-1 |
| Cathode specific surface area, | 1.0 × 10⁷ m-1 |
3. Results and discussion
Figure 3 shows that the polarization curve for the simulated PEM fuel cell model to be in good agreement with the experimental data of Wang et al. [24]. This imparts much confidence in the model developed and therefore we could proceed with confidence with the parametric studies.
The first part of this investigation is aimed at studying the sensitivity of the performance of the modelled PEFC (with single sided and double-sided MPL-coated GDL) to the interfacial contact resistance between the fuel cell components. To achieve this aim, the experimentally estimated interfacial contact resistance values that a typical MPL-coated GDL makes with a graphite bipolar plate at a typical clamping pressure (1.5 bar) [16] was employed into the model and realistically changed. The outcomes of the study are discussed below.
3.1. Contact resistance between the GDL and the bipolar plate
Figure 4a shows the polarisation curves for seven cases where the contact resistance between the GDL and the bipolar plate has been systematically and realistically changed from 2.5 to 17.5 mΩ.cm². Note that the values 2.5, 5.0 and 7.5 mΩ.cm² are most likely the values obtained when coating the surface of the carbon substrate facing the bipolar plate with an MPL [16]; see Figure 5. As expected, the fuel cell performs better with decreasing the contact resistance between the GDL and the bipolar plate. For example, the current density at 0.55 V increased by 29.4% when the contact resistance decreased from 17.5 to 2.5 mΩ.cm². This is evidently due to the decrease in the ohmic losses of the fuel cell with the decreasing above contact resistance. Also, this signifies that using double-sided MPL-coated GDLs (the cases where 2.5, 5.0 and 7.5 mΩ.cm² were used) could significantly improve the fuel cell performance. Figure 4b shows the distribution of the current density taken at the midpoint of the cathode GDL, half the length of the fuel cell channel, at a cell potential of 0.55V. In accordance with the above global results, the case with lowest contact resistance between the GDL and the bipolar plate shows the highest local current distribution. Further, it can be observed from the latter figure that the current density, for all the cases, reaches its peak at the interface of the gas flow channel and the current collector rib and this is due to the fact that this position is the point where the transport of oxygen and the transport of charge are both ptimized. Figure 4c shows the distribution of oxygen at the same position as the current density. This figure shows that oxygen concentration increases with increasing contact resistance between the GDL and the bipolar plate; this signifies that the rate of reaction is higher with decreasing contact resistance and as such more oxygen is consumed in the catalyst layer. As a general note, for all the cases, the oxygen concertation is a maximum at the middle of the flow channel and this is due to being the position for the least mass transport resistance.
3.2. Contact resistance between the MPL and the catalyst layer
One of the assumptions for this PEM fuel cell model was that the catalyst layer is deposited directly on the gas diffusion media instead of the membrane. Therefore, the interfacial contact resistance between the GDL and the catalyst layer was assumed to be negligible, and the gas diffusion electrode is assumed to be homogenous. The assumption has been made at the initial stage so as to simplify the model and also because there are no existing experimentally estimated values of the interfacial resistance between the MPL and the catalyst layer in the open literature. However, to investigate the sensitivity of the global PEM fuel cell performance, as well as the local distribution of the current density and oxygen mass fraction, within the cathode GDL, the interfacial contact resistance between the MPL and the catalyst layer has been realistically changed between 0 and 10 mΩ.cm² for a given GDL-BBP contact resistance of 10 mΩ.cm². As expected, the fuel cell performance improves with decreasing contact resistance. To illustrate this situation, the current density at 0.55 V increased by 11.8% when the contact resistance between the MPL and the catalyst layer decreased from 10 to 0 mΩ.cm². Also, the local distribution of oxygen and current density within the cathode GDL are similar to those obtained in the previous section: current density increases and oxygen concentration decreases with increasing MPL-CL contact resistance.
3.3. Impact of MPL porosity
A parametric design investigation is carried out in this section to investigate the effect of the porosities of the MPLs on both sides of the GDL substrate and the model was simulated with various MPL porosities as shown in Table 2. Note that is the porosity of the MPL between the GDL and the catalyst layer and is the porosity of the MPL between the GDL and the bipolar plate for both anode and cathode sides of the modelled PEM fuel cell. Also, it should be noted that the porosity of the carbon substrate for all the cases is 0.7. The results of the study are shown in Figure 7. There are a number of observations that may be extracted from Figure 7a. The first observation is that the fuel cell performance, in general, improves as the porosities of the MPLs increased and this is evidently due to the reduced mass transport resistance; the best performance is realised for the MPLs with 0.8 porosities. The second observation is that the increase in the porosity of the MPL facing the bipolar plate has a more positive impact on the fuel cell performance compared to that of the MPL facing the catalyst layer. For example, the current density at 0.4 V for the set where is 0.6 and is 0.8 is greater than the set where is 0.8 and is 0.6 by around 8.2% (0.11 A/cm²). This could be attributed to the fact that the MPL facing the bipolar plate is in direct contact with the flow channel and hence the GDL is supplied with a larger amount of reactant gases as the porosity of this MPL increases. The third observation is that the fuel cell performs better with the base case (Case 1) where the GDL is single-sided MPL coated than with Case 2 where the GDL is double-sided MPL coated and having the same porosity as the MPL of Case 1. This is evidently due to the longer diffusion path in the latter case. The distribution of the local current within the cathode GDL (Figure 7b) follows more or less the same trend as the polarisation curves. Interestingly, the distribution of oxygen within the cathode GDL (Figure 7c) does not follow the same trends displayed in Figures 7a-b. This could be attributed to the combined effects of the mass transport resistance and reaction rate at the catalyst layer. For example, Case 8 (where the porosities of the two MPLs are both 0.8) does not show the least oxygen concentration within the cathode GDL as is the case in the previous sections where the case with the best fuel cell performance shows the least oxygen concentration in the GDL. This is mainly due to the fact the supply rate of oxygen outweighs its consumption rate. Further, it can be seen that the porosity of the MPL facing the bipolar plate is predominantly the limiting factor when it comes to the concentration of the reactant gases within the GDLs. For example, Case 8 (where the porosity of the MPL facing the bipolar plate is 0.4) features the least oxygen concentration within the cathode GDL. On the other hand, Case 7 (where the porosity of the MPL facing the bipolar plate is 0.8) demonstrates the maximum oxygen concentration within the cathode GDL.
4. Conclusions
This A three-dimensional, multiphase PEFC model with straight channels has been developed. The impact of the interfacial contact resistances between the GDL and each of the bipolar plate and the catalyst layer as well as the MPL porosity has been investigated through conducting a series of parametric studies. The key findings of the study are as follows:
- The interfacial contact resistance between the MPL and the catalyst layer needs to be captured in the modelled PEFC. Otherwise, the fuel cell performance could be overestimated by up to 6%.
- Incorporating an extra MPL at the interface between the GDL and the bipolar plate could significantly improve the fuel cell performance by up to 30%, and this is due to the reduction in the contact resistance between the GDL and the bipolar plate.
- The fuel cell performance is more sensitive to the porosity of the MPL facing the bipolar plate than the MPL facing the catalyst layer. This is attributed to the fact that the MPL facing the bipolar plate is in direct contact with the flow channel and hence the GDL is supplied with a larger amount of reactant gases as the porosity of this MPL increases.
- Likewise, the porosity of the MPL facing the bipolar plate is predominantly the limiting factor for the distribution of oxygen concentration within the cathode GDL.
Supplementary Materials
The following supporting information can be downloaded at the website of this paper posted on Preprints.org.
Author Contributions
Isaac Okereke: Methodology, Software, Formal analysis, Investigation, Validation, Writing - original draft, Writing – review & editing, Visualization. Mohammed S. Ismail: Conceptualization, Methodology, Software, Formal analysis, Investigation, Validation, Writing- original draft, Writing - review & editing, Supervision. Derek B. Ingham: Supervision, Writing - review & editing. Kevin J. Hughes: Supervision, Writing -review & editing. Lin Ma: Supervision, Writing - review & editing. Mohamed Pourkashanian: Supervision, Writing - review & editing, Project administration. All authors have read and agreed to the published version of the manuscript.
Funding
Not Applicable.
Data Availability Statement
The data can be available upon reasonable request.
Acknowledgments
The first author would like to acknowledge and appreciate the financial support from the Government of Nigeria through the Tertiary Education Trust Fund (TETFund) and Akwa Ibom State University.
Conflicts of Interest
The authors declare no conflict of interest.
References
- Zhou, P.; Wu C., W.; Ma G., J. Contact resistance prediction and structure optimization of bipolar plates. J. Power Sources 2006, 159, 1115–1122. [Google Scholar] [CrossRef]
- Zhou, Y.; Lin, G.; Shih A., J.; Hu S., J. A micro-scale model for predicting contact resistance between bipolar plate and gas diffusion layer in PEM fuel cells. J. Power Sources 2007, 163, 777–783. [Google Scholar] [CrossRef]
- Qiu, D.; Janßen, H.; Peng, L.; Irmscher, P.; Lai, X.; Lehnert, W. Electrical resistance and microstructure of typical gas diffusion layers for proton exchange membrane fuel cell under compression. Appl. Energy 2018, 231, 127–137. [Google Scholar] [CrossRef]
- Lai, X.; Liu, D.; Peng, L.; Ni, J. A mechanical–electrical finite element method model for predicting contact resistance between bipolar plate and gas diffusion layer in PEM fuel cell. J. Power Sources 2008, 182, pp. 153–159. [Google Scholar] [CrossRef]
- Zhang, L.; Liu, Y.; Song, H.; Wang, S.; Zhou, Y.; Hu S., J. Estimation of contact resistance in proton exchange membrane fuel cells. J. Power Sources 2006, 162, 1165–1171. [Google Scholar] [CrossRef]
- Vikram, A. , Chowdhury P.R., Phillips R. K., Hoorfar M. Measurement of effective bulk and contact resistance of gas diffusion layer under inhomogeneous compression - Part I: Electrical conductivity. J. Power Sources 2016, 320, 274–285. [Google Scholar] [CrossRef]
- Sow P., K.; Prass, S.; Kalisvaart, P.; Merida, W. Deconvolution of electrical contact and bulk resistance of gas diffusion layers for fuel cell applications. Int. J. Hydrog. Energy 2015, 40, 2850–2861. [Google Scholar] [CrossRef]
- Ismail, M. S.; Ingham, D. B.; Ma, L.; Pourkashanian, M. The contact resistance between gas diffusion layers and bipolar plates as they are assembled in proton exchange membrane fuel cells. Renew. Energy 2013, 52, 40–45. [Google Scholar] [CrossRef]
- Ye, D.; Gauthier, E.; Benziger J., B.; Pan, M. Bulk and contact resistances of gas diffusion layers in proton exchange membrane fuel cells. J. Power Sources 2014, 256, 449–456. [Google Scholar] [CrossRef]
- Lee F., C.; Ismail, M.S.; Ingham D., B.; Hughes, K.J.; Ma, L.; Lyth, S.M.; Pourkashanian, M. Alternative architectures and materials for PEMFC gas diffusion layers: A review and outlook. Renew. Sustain. Energy Rev. 2022, 166, 1–33. [Google Scholar]
- Zamel, N.; Xianguo, L. Effective transport properties for polymer electrolyte membrane fuel cell-With focus on the gas diffusion layer. Prog. Energy Combust. Sci. 2013, 39, 111–146. [Google Scholar] [CrossRef]
- El-kharouf, A.; Pollet, B.G. Chapter 4-Gas Diffusion Media and Their Degradation, in Polymer Electrolyte Fuel Cell Degradation. Academic Press, Boston 2012, 215-247.
- Ozden, A.; Shahgaldi, S.; Li, X.; Hamdullahpur, F. A review of gas diffusion layers for proton exchange membrane fuel cells—With a focus on characteristics, characterization techniques, materials and designs. Prog. Energy Combust. Sci. 2019, 74, 50–102. [Google Scholar] [CrossRef]
- Kitahara, T. , Konomi T., and Nakajima H. Microporous layer coated gas diffusion layers for enhanced performance of polymer electrolyte fuel cells. J. Power Sources 2010, 195, 2202–2211. [Google Scholar] [CrossRef]
- Kitaharaa, T.; Nakajimaa, H.; Moria, K.; Inamoto, M. Influence of Hydrophilic and Hydrophobic Double MPL Coated GDL on PEFC Performance. ECS Trans 2012, 50(2), 437–444. [Google Scholar] [CrossRef]
- Ismail, M.S.; Ingham D., B.; Ma, L.; Pourkashanian, M. The contact resistance between gas diffusion layers and bipolar plates as they are assembled in proton exchange membrane fuel cells. Renew. Energy 2013, 52, 40–45. [Google Scholar] [CrossRef]
- Chun, J. H.; Park, K. T.; Jo, D. H.; Lee, J. Y.; Kim, S. G.; Park, S. H.; Lee, E. S. ; Jyoung, J-Y.; Kim, S. H. Development of a novel hydrophobic/hydrophilic double micro porous layer for use in a cathode gas diffusion layer in PEMFC. Int. J. Hydrog. Energy, 2011; 36(14), 8422–8428. [Google Scholar]
- Wang, X.; Zhang, H.; Zhang, J.; Xu, H.; Zhu, X.; Chen, J.; Yi, B. A bi-functional micro-porous layer with composite carbon black for PEM fuel cells. J. Power Sources 2006, 162, 474–479. [Google Scholar] [CrossRef]
- Wang, X. L.; Zhang, H. M.; Zhang, J. L.; Xu, H. F.; Tian, Z. Q.; Chen, J.; Zhong, H. X.; Liang, Y. M.; Yi, B.L. Micro-porous layer with composite carbon black for PEM fuel cells. Electrochim. Acta 2006, 51, 4909–4915. [Google Scholar] [CrossRef]
- Li, S.; Yuan, J.; Andersson, M.; Xie, G.; Sunden, B. Influence of anisotropic gas diffusion layers on transport phenomena in a proton exchange membrane fuel cell. Int. J. Energy Res 2017, 41, 2034–2050. [Google Scholar] [CrossRef]
- Okereke, I. C.; Ismail, M. S.; Ingham, D.; Hughes, K. J.; Ma, L. M.Pourkashanian, M. The effects of GDL anisotropic transport properties on the PEFC performance. Int. J. Numer. Methods Heat Fluid Flow 2023, 33(2), 648–672. [Google Scholar]
- Bruggeman, D. A. G. Calculation of various physics constants in heterogeneous substances I dielectricity constants and conductivity of mixed bodies from isotropic substances. Annalen der Physik (Leipzig) 1935, 24, 636–664. [Google Scholar] [CrossRef]
- Ismail, M. S.; Ingham, D. B.; Hughes, K. J.; Ma, L.; Pourkashanian, M. Effective diffusivity of polymer electrolyte fuel cell gas diffusion layers: An overview and numerical study. Int. J. Hydrog. Energy 2015, 40(34), 10994–11010. [Google Scholar] [CrossRef]
- Ismail, M.S.; Hughes, K. J.; Ingham, D. B.; Ma, L.; Pourkashanian, M. Effects of anisotropic permeability and electrical conductivity of gas diffusion layers on the performance of proton exchange membrane fuel cells. Appl. Energy 2012, 95, 50–63. [Google Scholar] [CrossRef]
- Wang, L.; Husar, A.; Zhou, T.; Liu, H. A parametric study of PEM fuel cell performances. Int. J. Hydrog. Energy 2003, 28, 1263–1272. [Google Scholar] [CrossRef]
Figure 1.
Schematic geometry of the computational domain for the base case of the PEFC model.
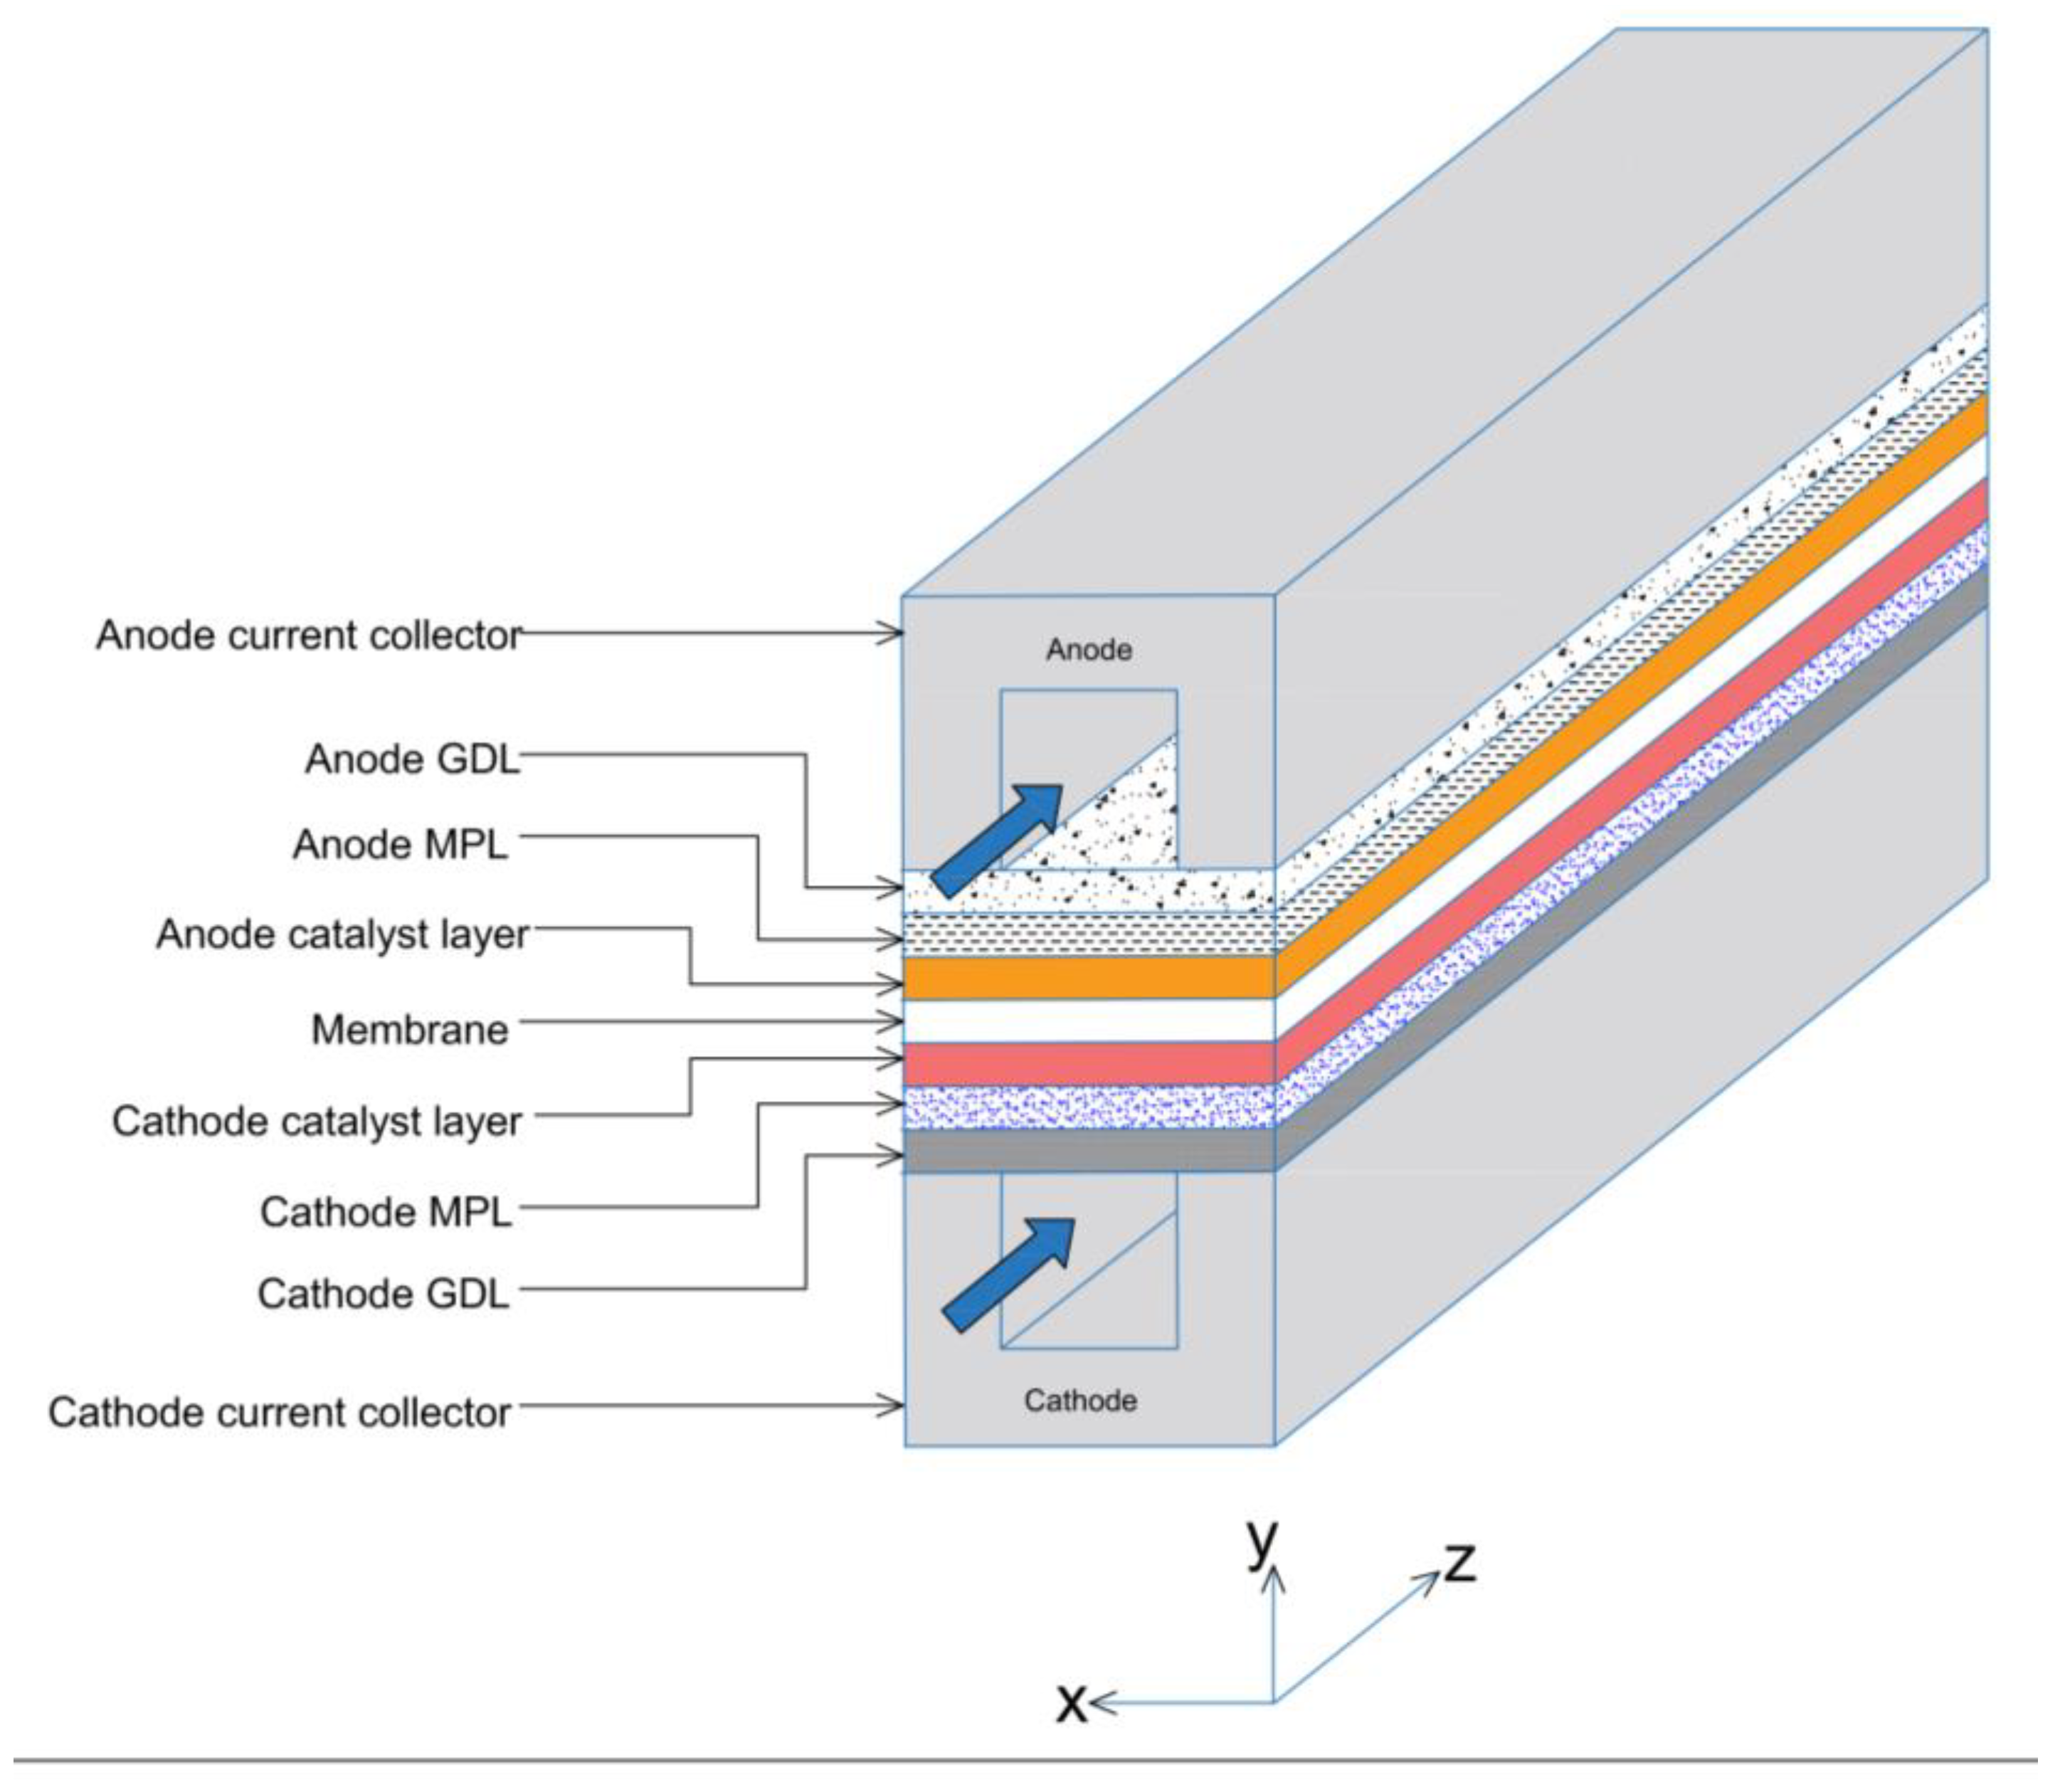
Figure 2.
The meshed geometry for the computational domain.
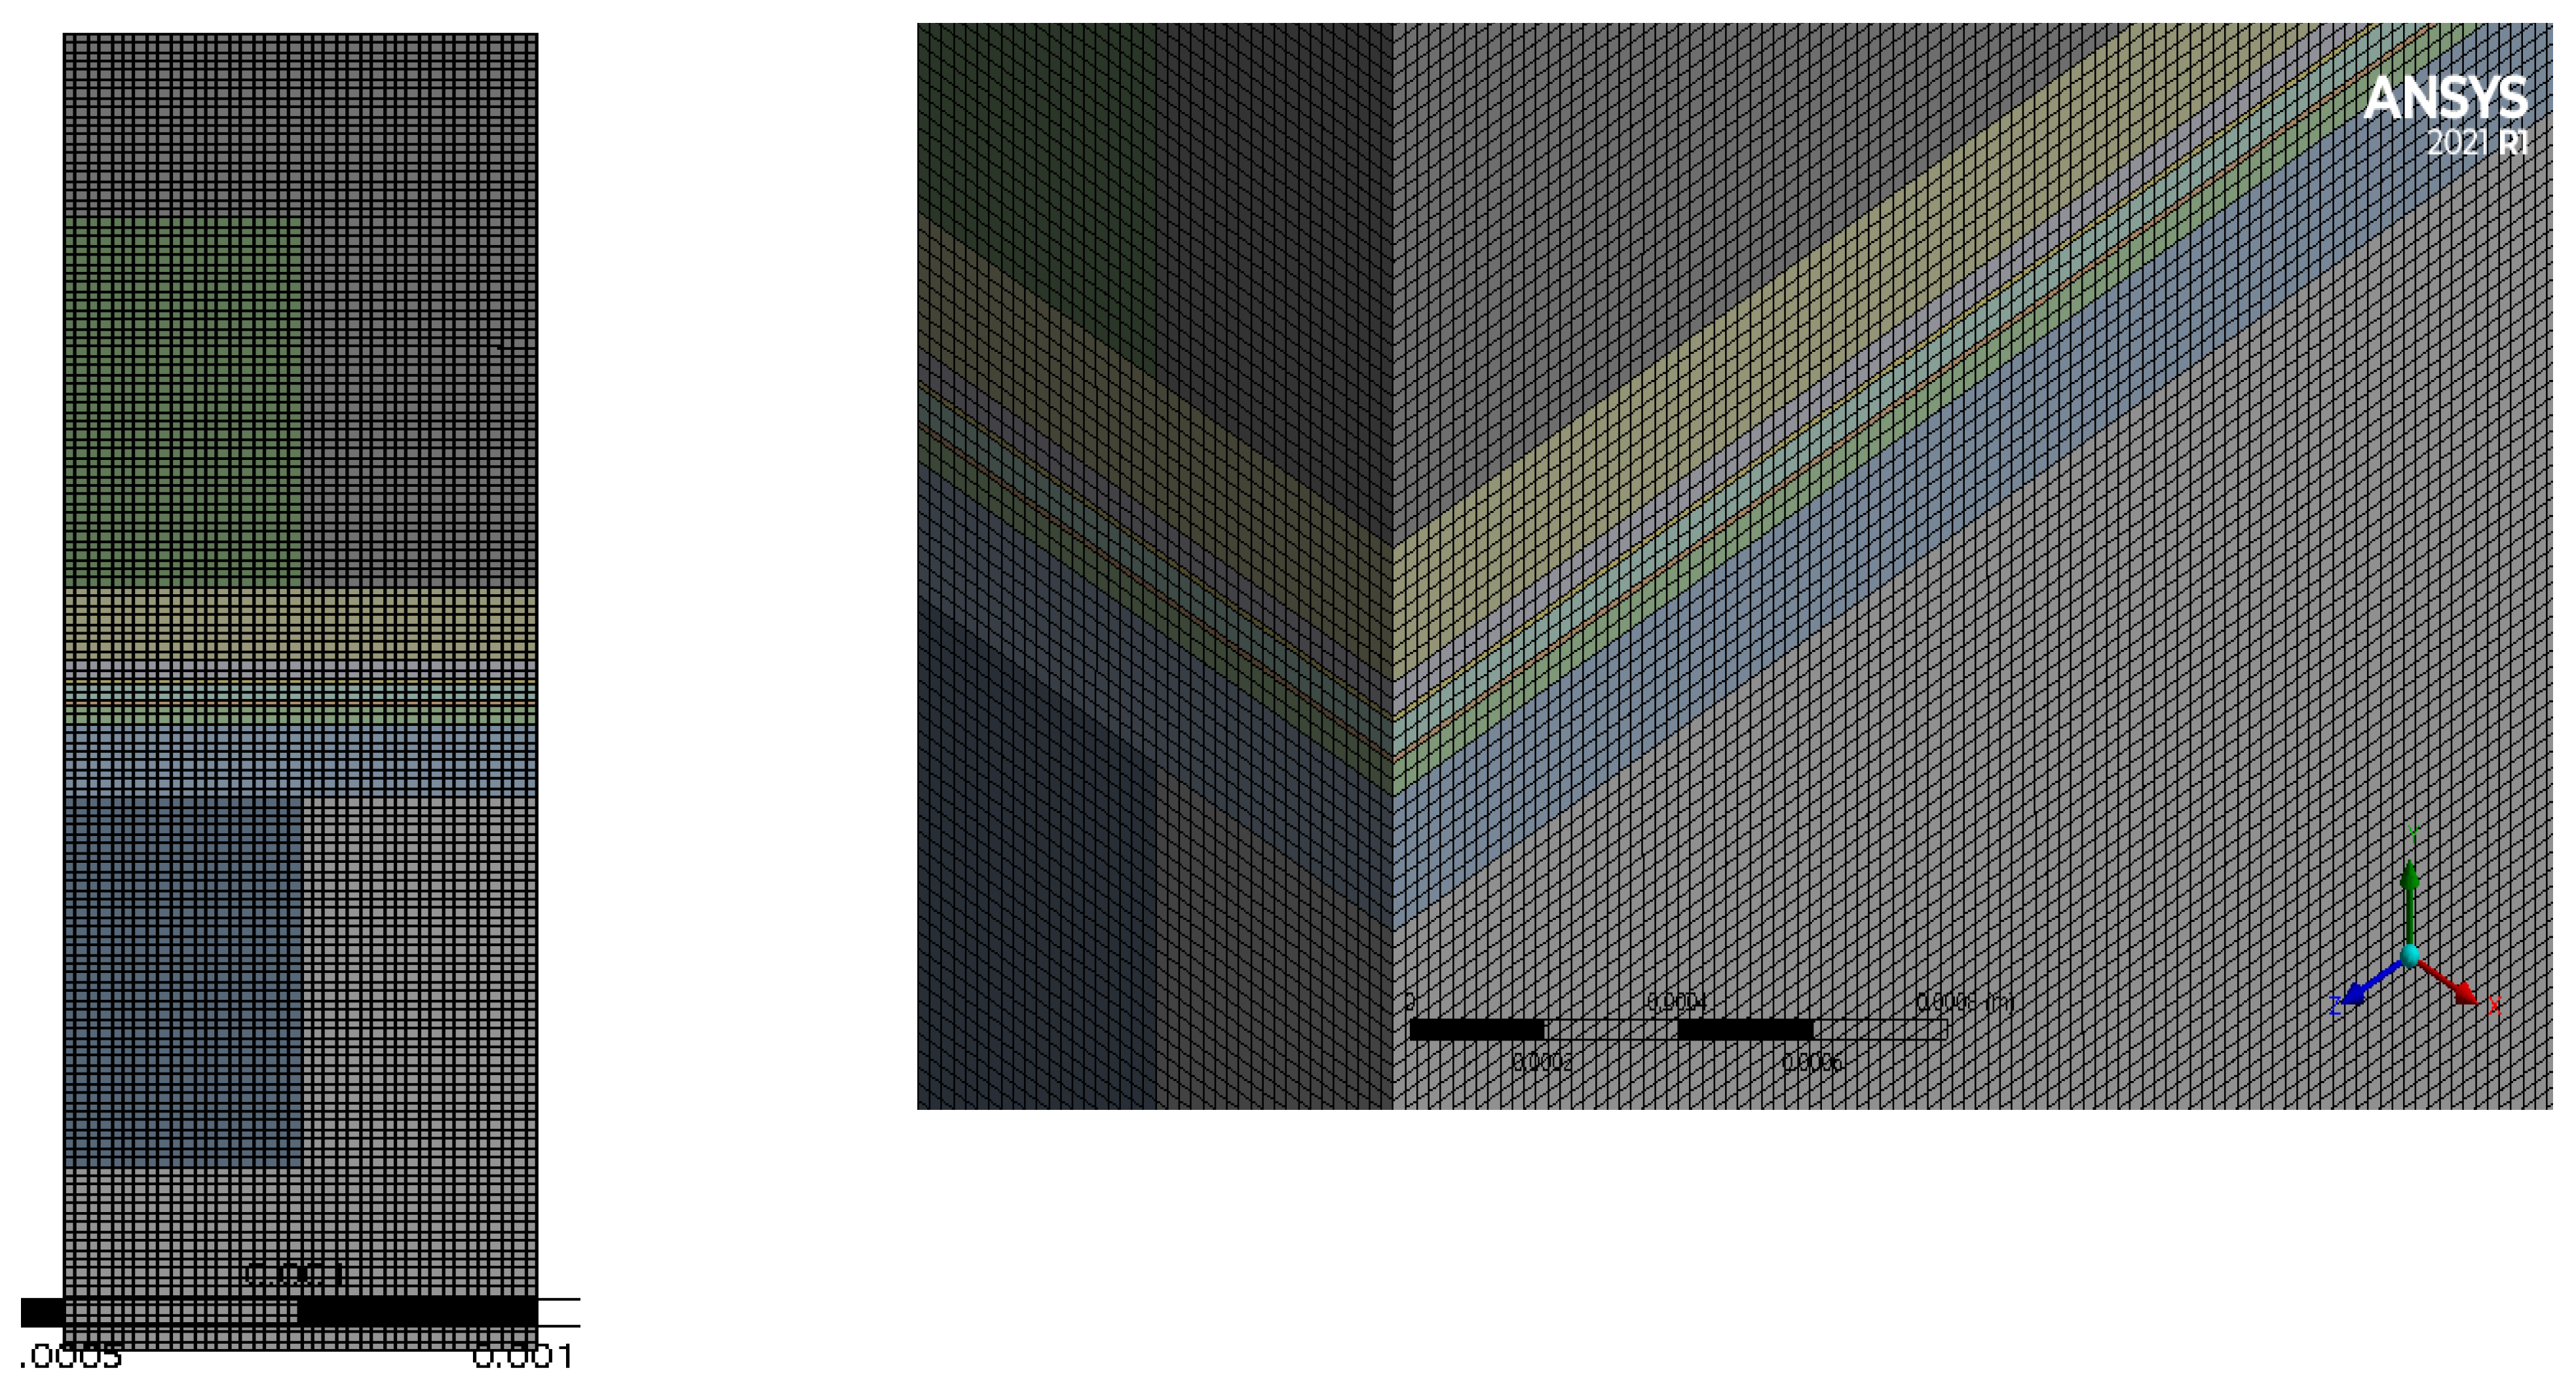
Figure 3.
The polarization curve generated from the numerical model as compared to the experimental polarization curve taken from Wang et al. [24].
Figure 3.
The polarization curve generated from the numerical model as compared to the experimental polarization curve taken from Wang et al. [24].
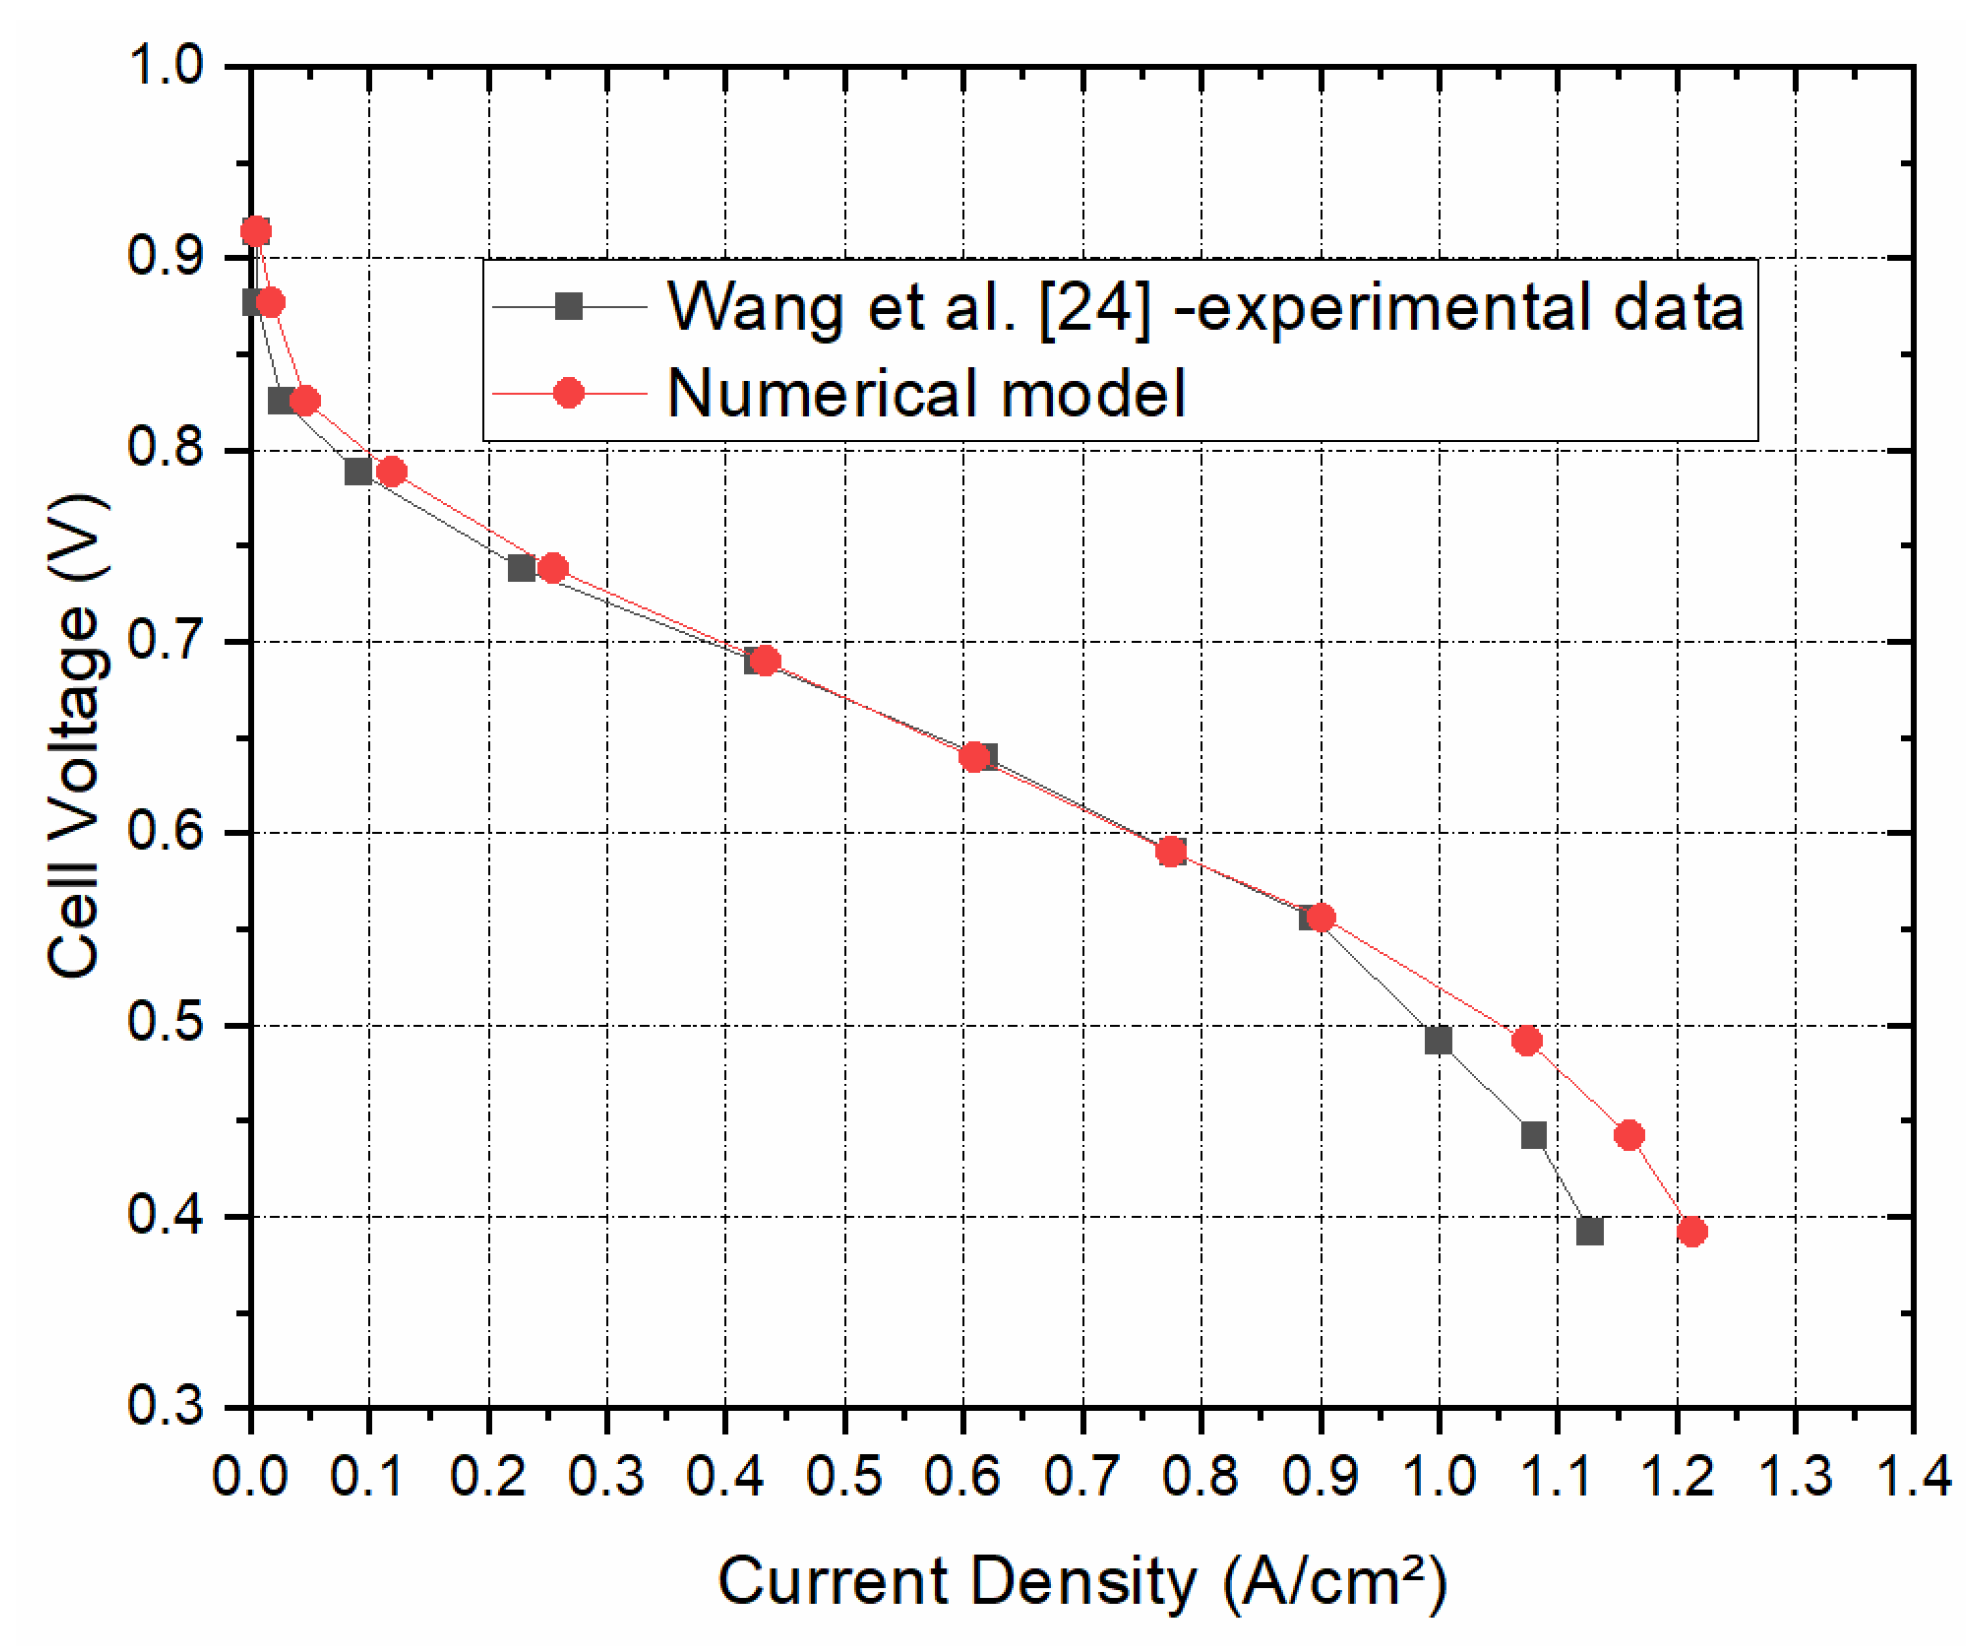
Figure 4.
(a) The polarisation curves and the distribution of (b) current density and (c) oxygen mass fraction within the cathode GDL at 0.55 V for the set of contact resistances investigated.
Figure 4.
(a) The polarisation curves and the distribution of (b) current density and (c) oxygen mass fraction within the cathode GDL at 0.55 V for the set of contact resistances investigated.
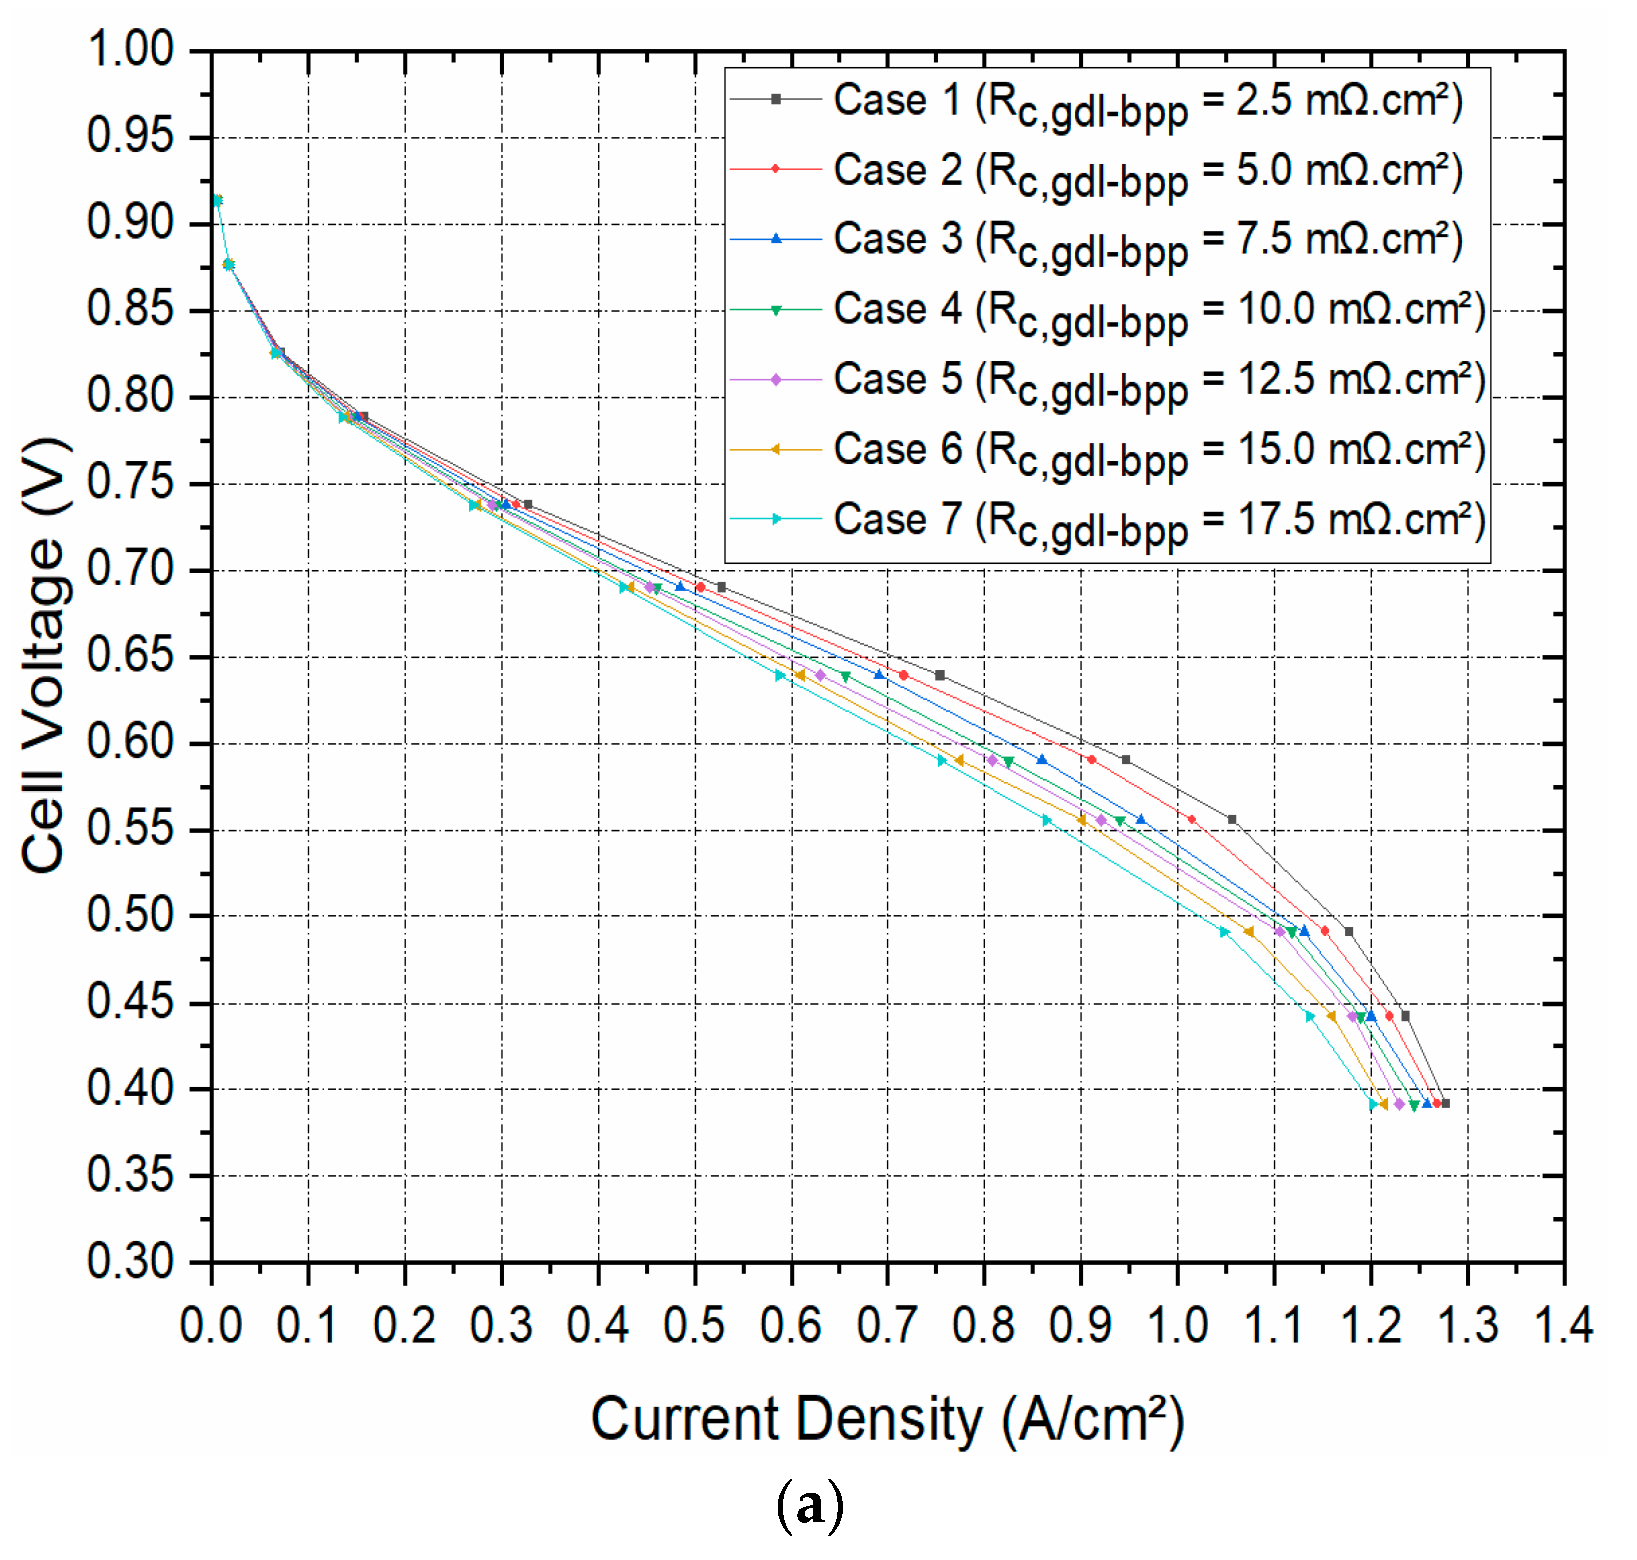
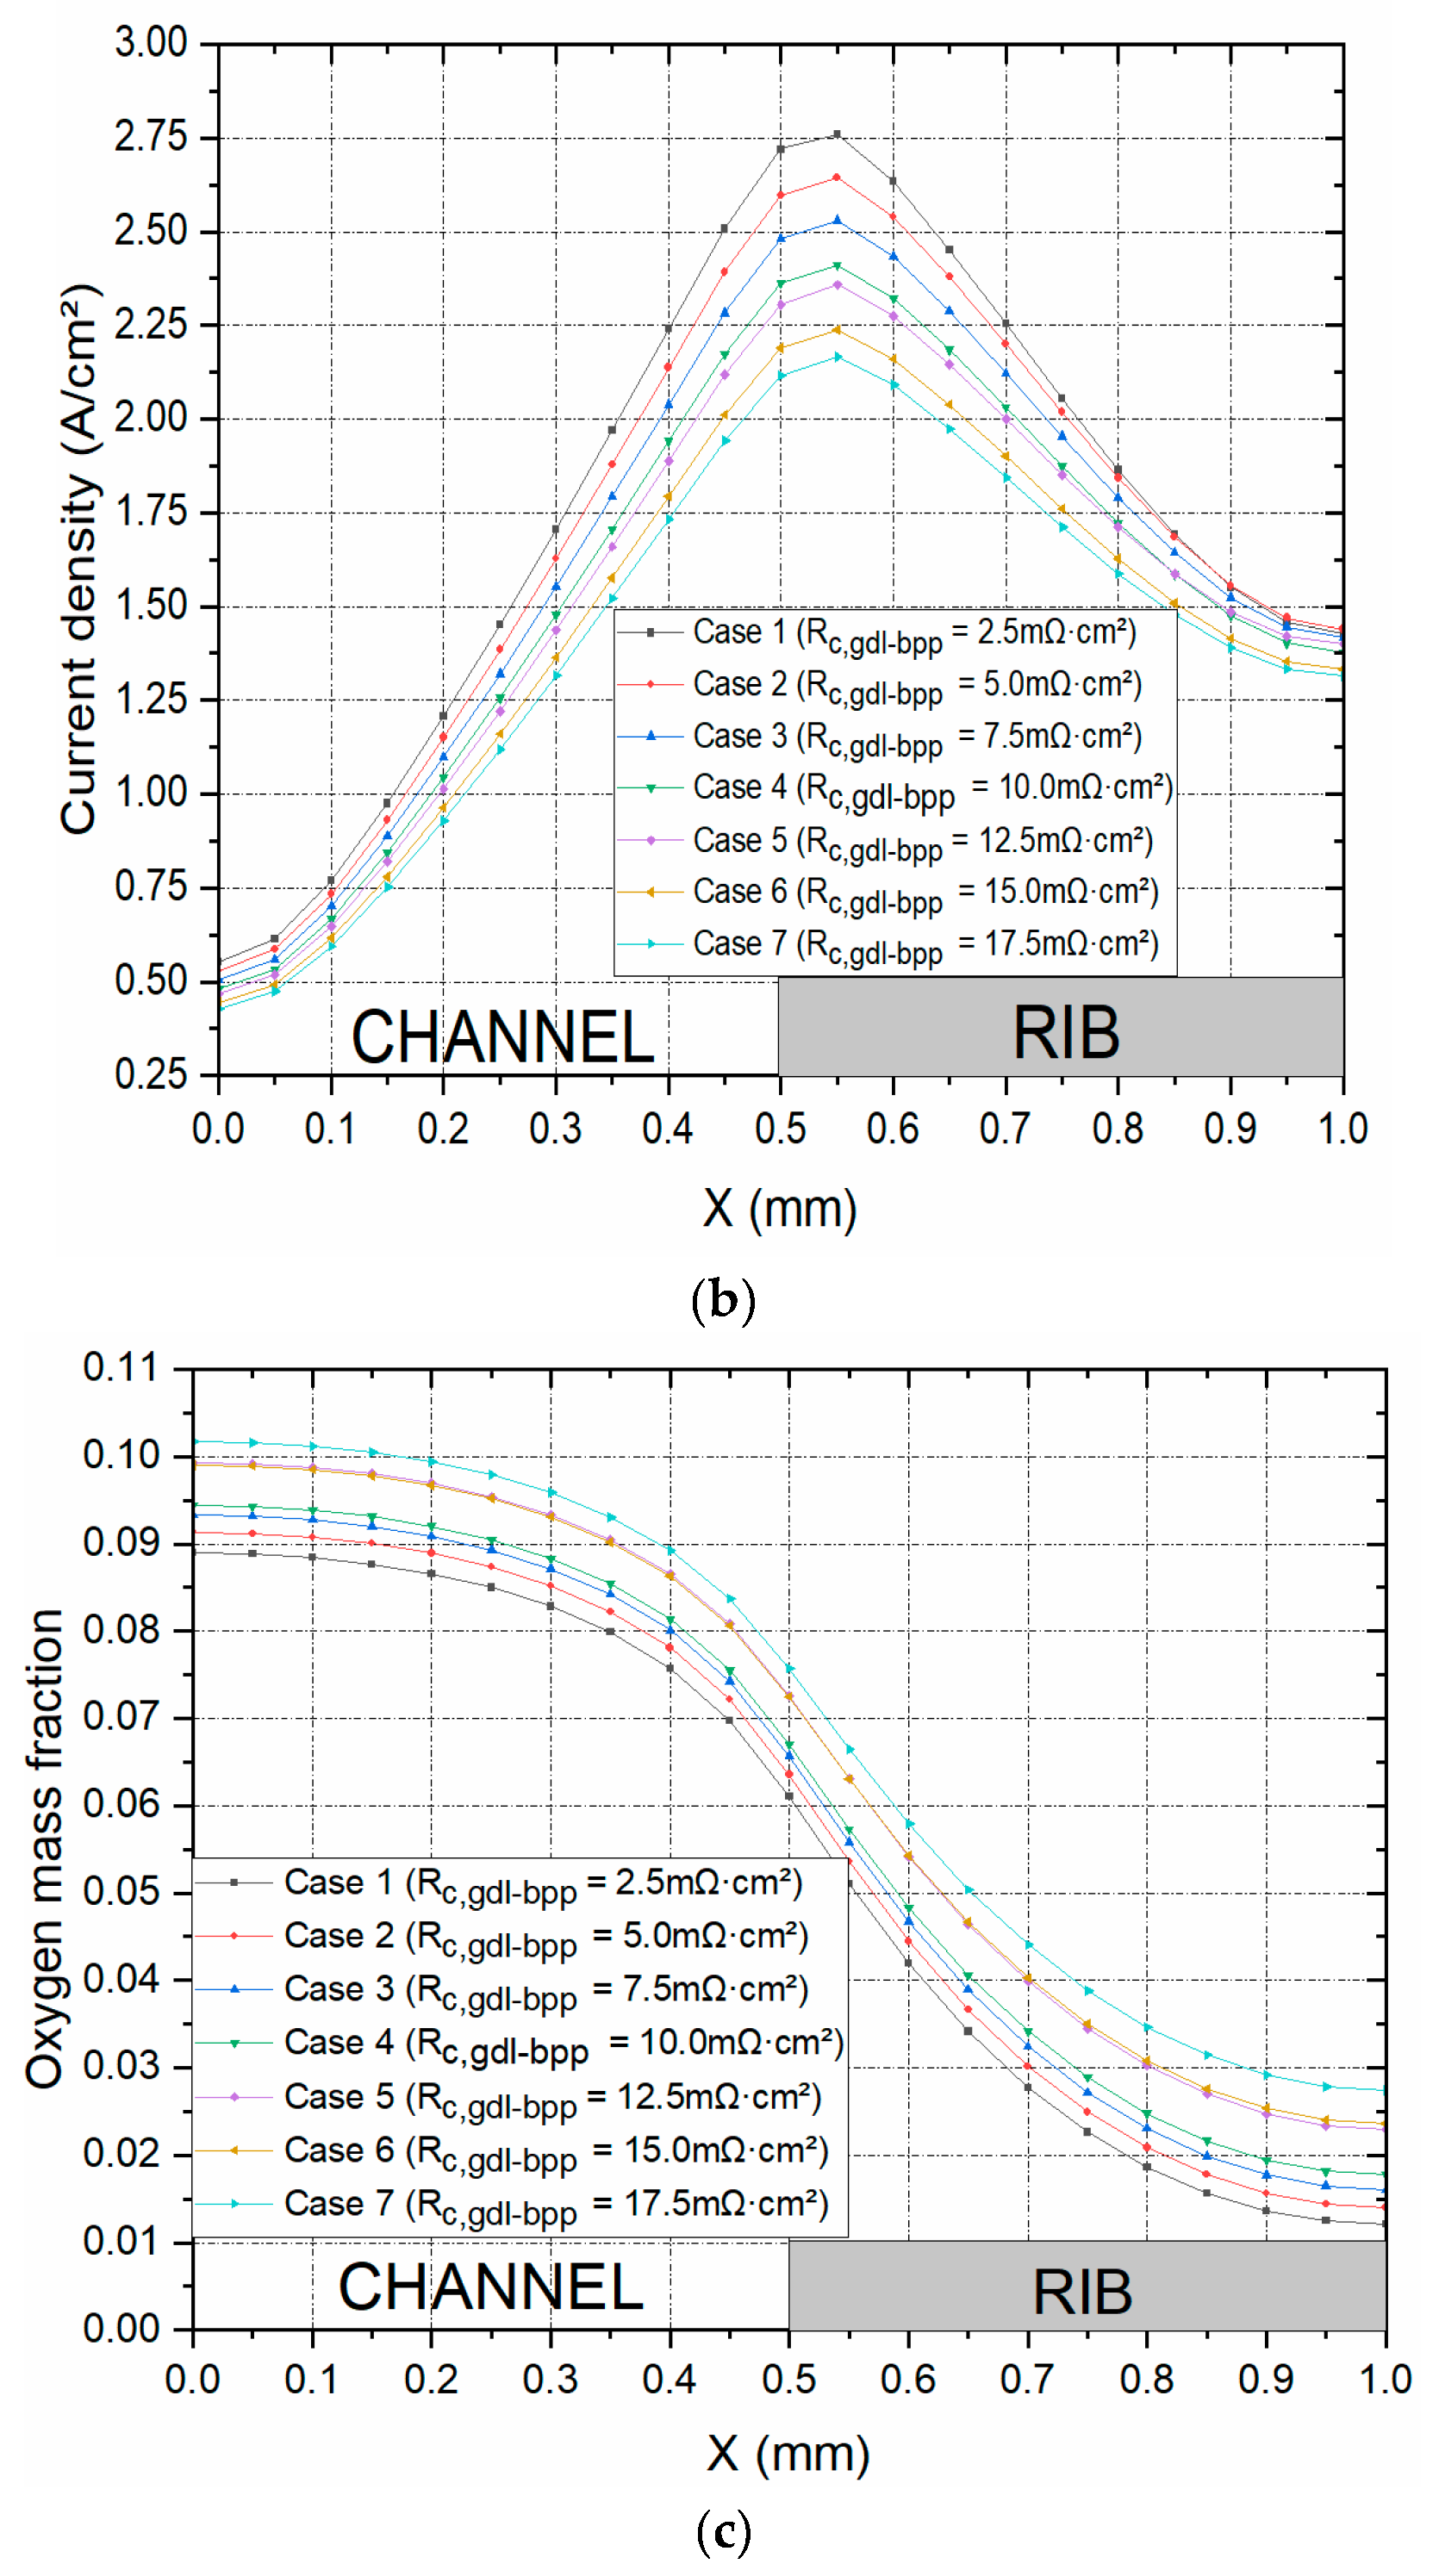
Figure 5.
Schematic geometry of the computational domain incorporating the MPL at the GDL-bipolar plate interface.
Figure 5.
Schematic geometry of the computational domain incorporating the MPL at the GDL-bipolar plate interface.
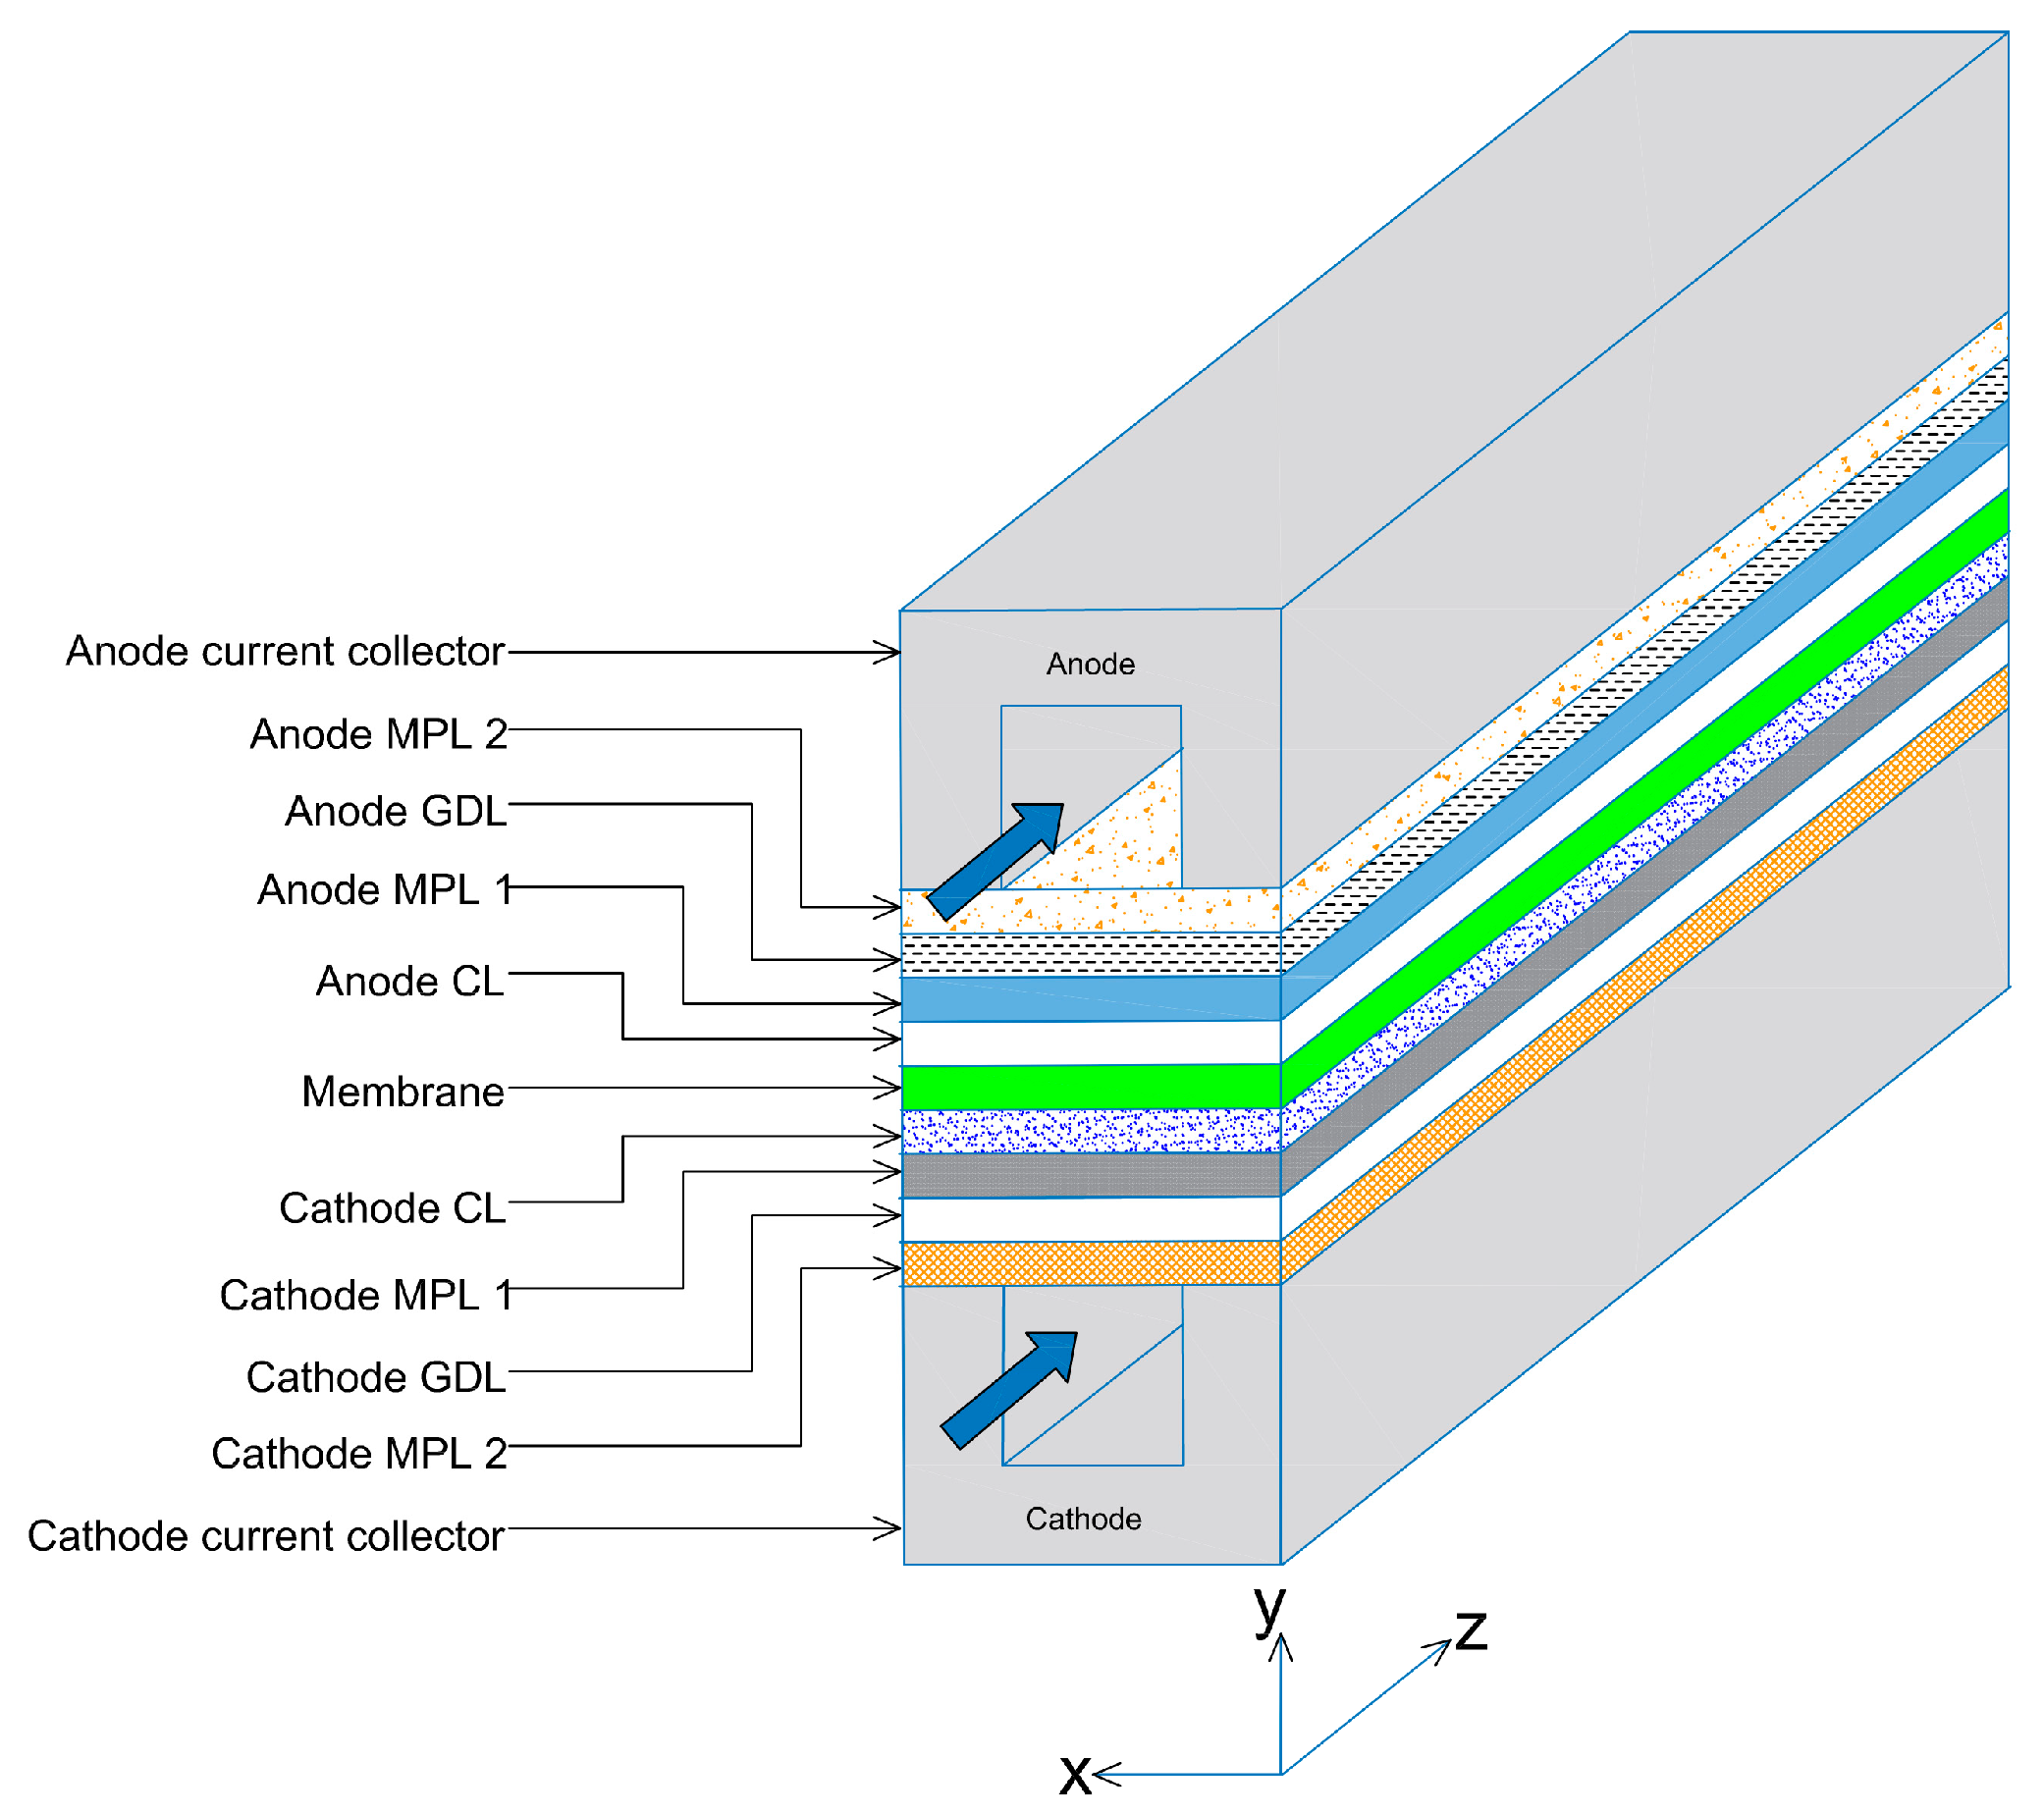
Figure 6.
Cell performance for a given GDL-BPP contact resistance of 10.0 mΩ.cm² and contact resistance values 2.5mΩ.cm², 5.0mΩ.cm², and 7.5mΩ.cm² at MPL-CL interface; (a) the polarisation curves and the distribution of (b) the current density and (c) the oxygen mass fraction within the cathode GDL at 0.55 V.
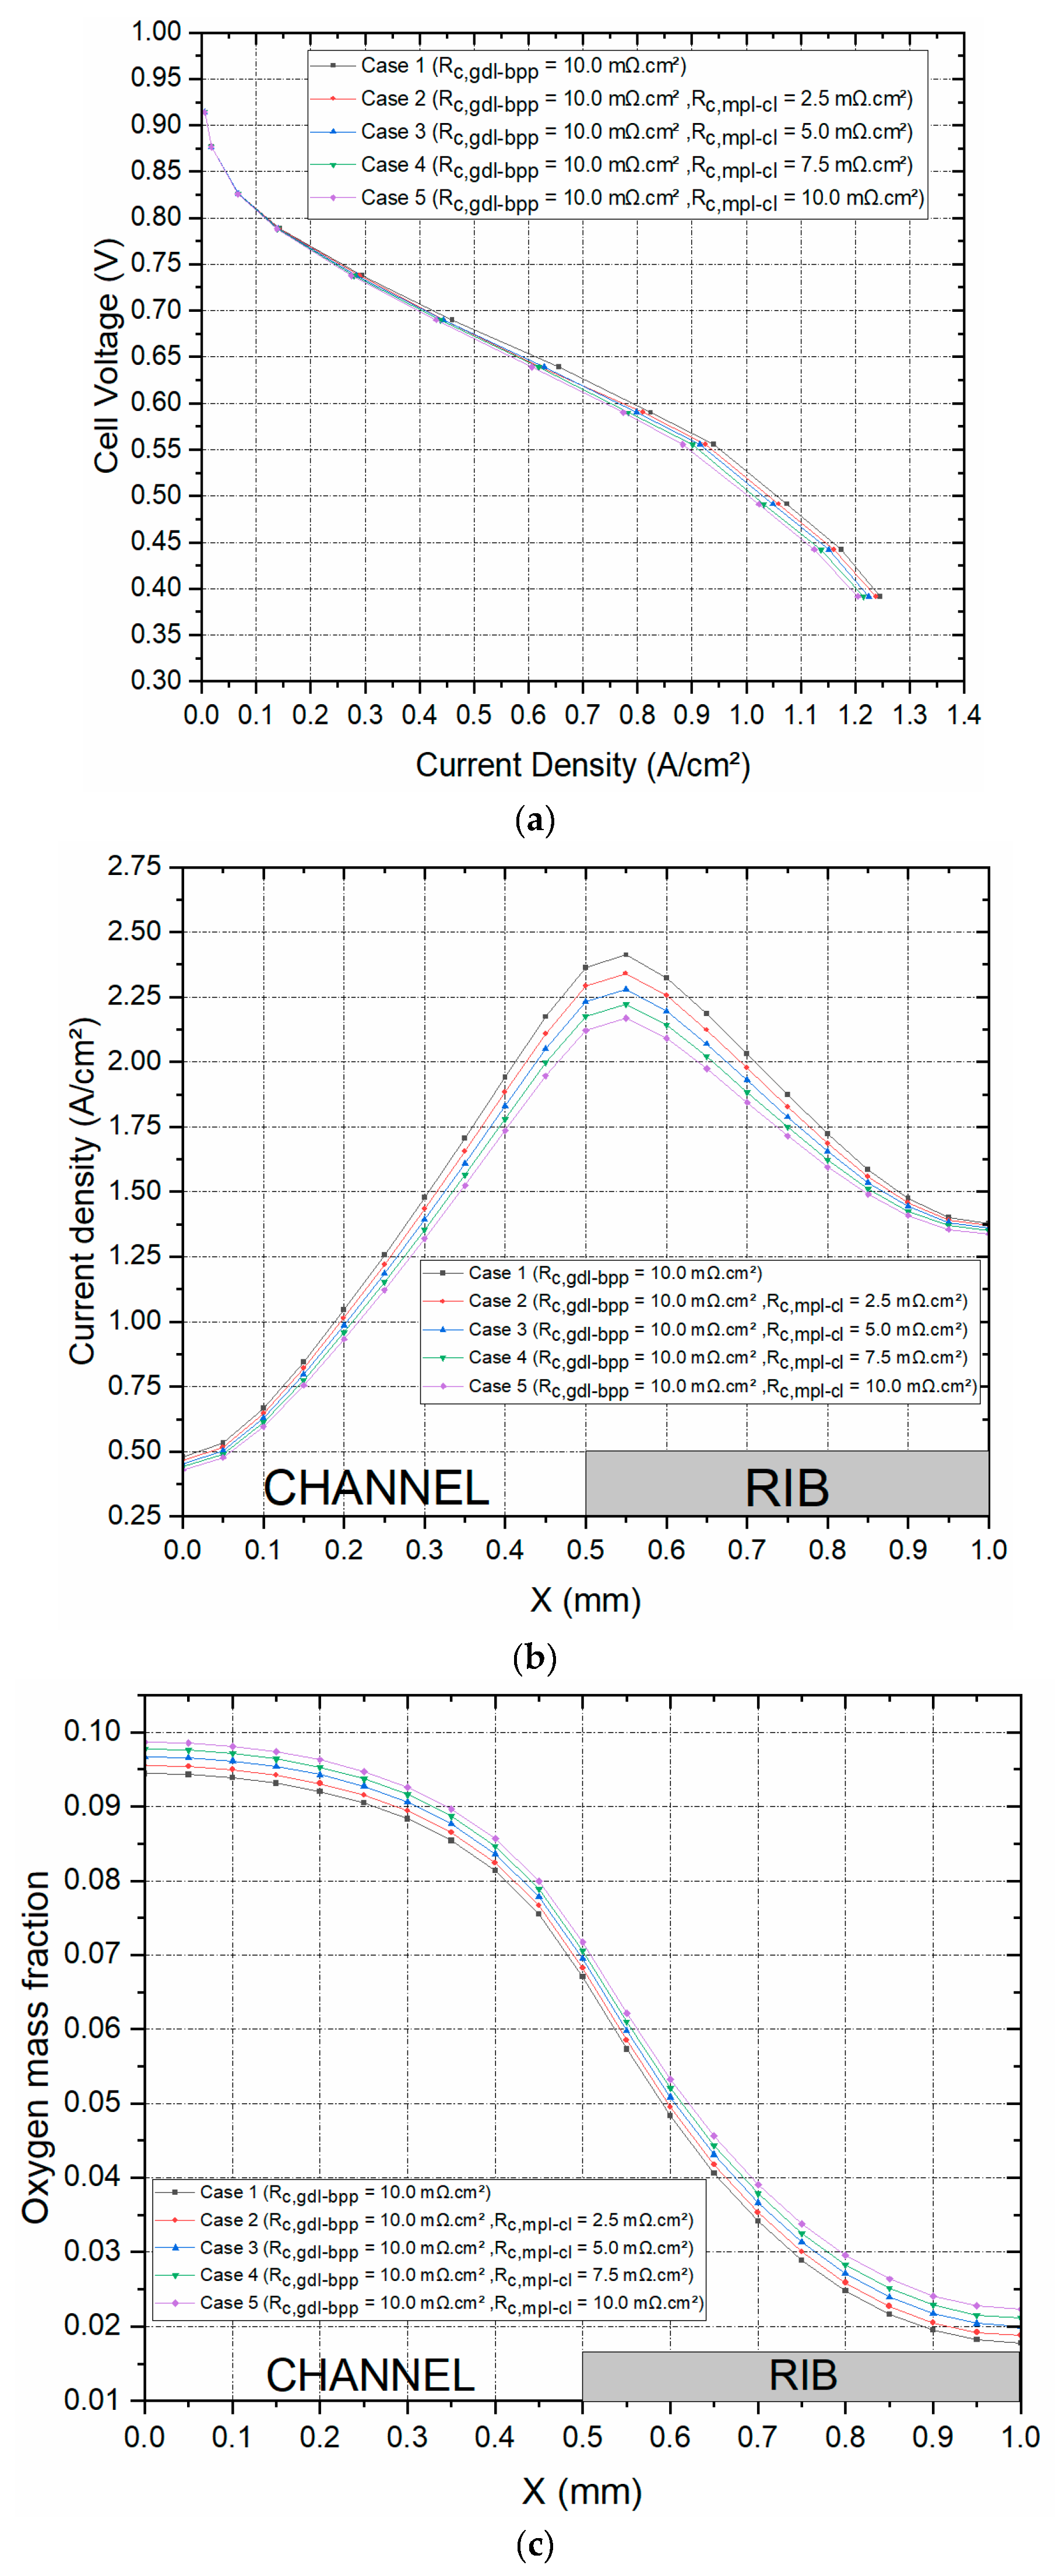
Figure 7.
(a) Polarisation curves and, the distribution of (b) current density, and (c) oxygen mass
fraction within the cathode GDL at 0.55 V for the porosities of single sided and double sided MPL-coated
GDL computation cases shown in Table 4.
Figure 7.
(a) Polarisation curves and, the distribution of (b) current density, and (c) oxygen mass
fraction within the cathode GDL at 0.55 V for the porosities of single sided and double sided MPL-coated
GDL computation cases shown in Table 4.
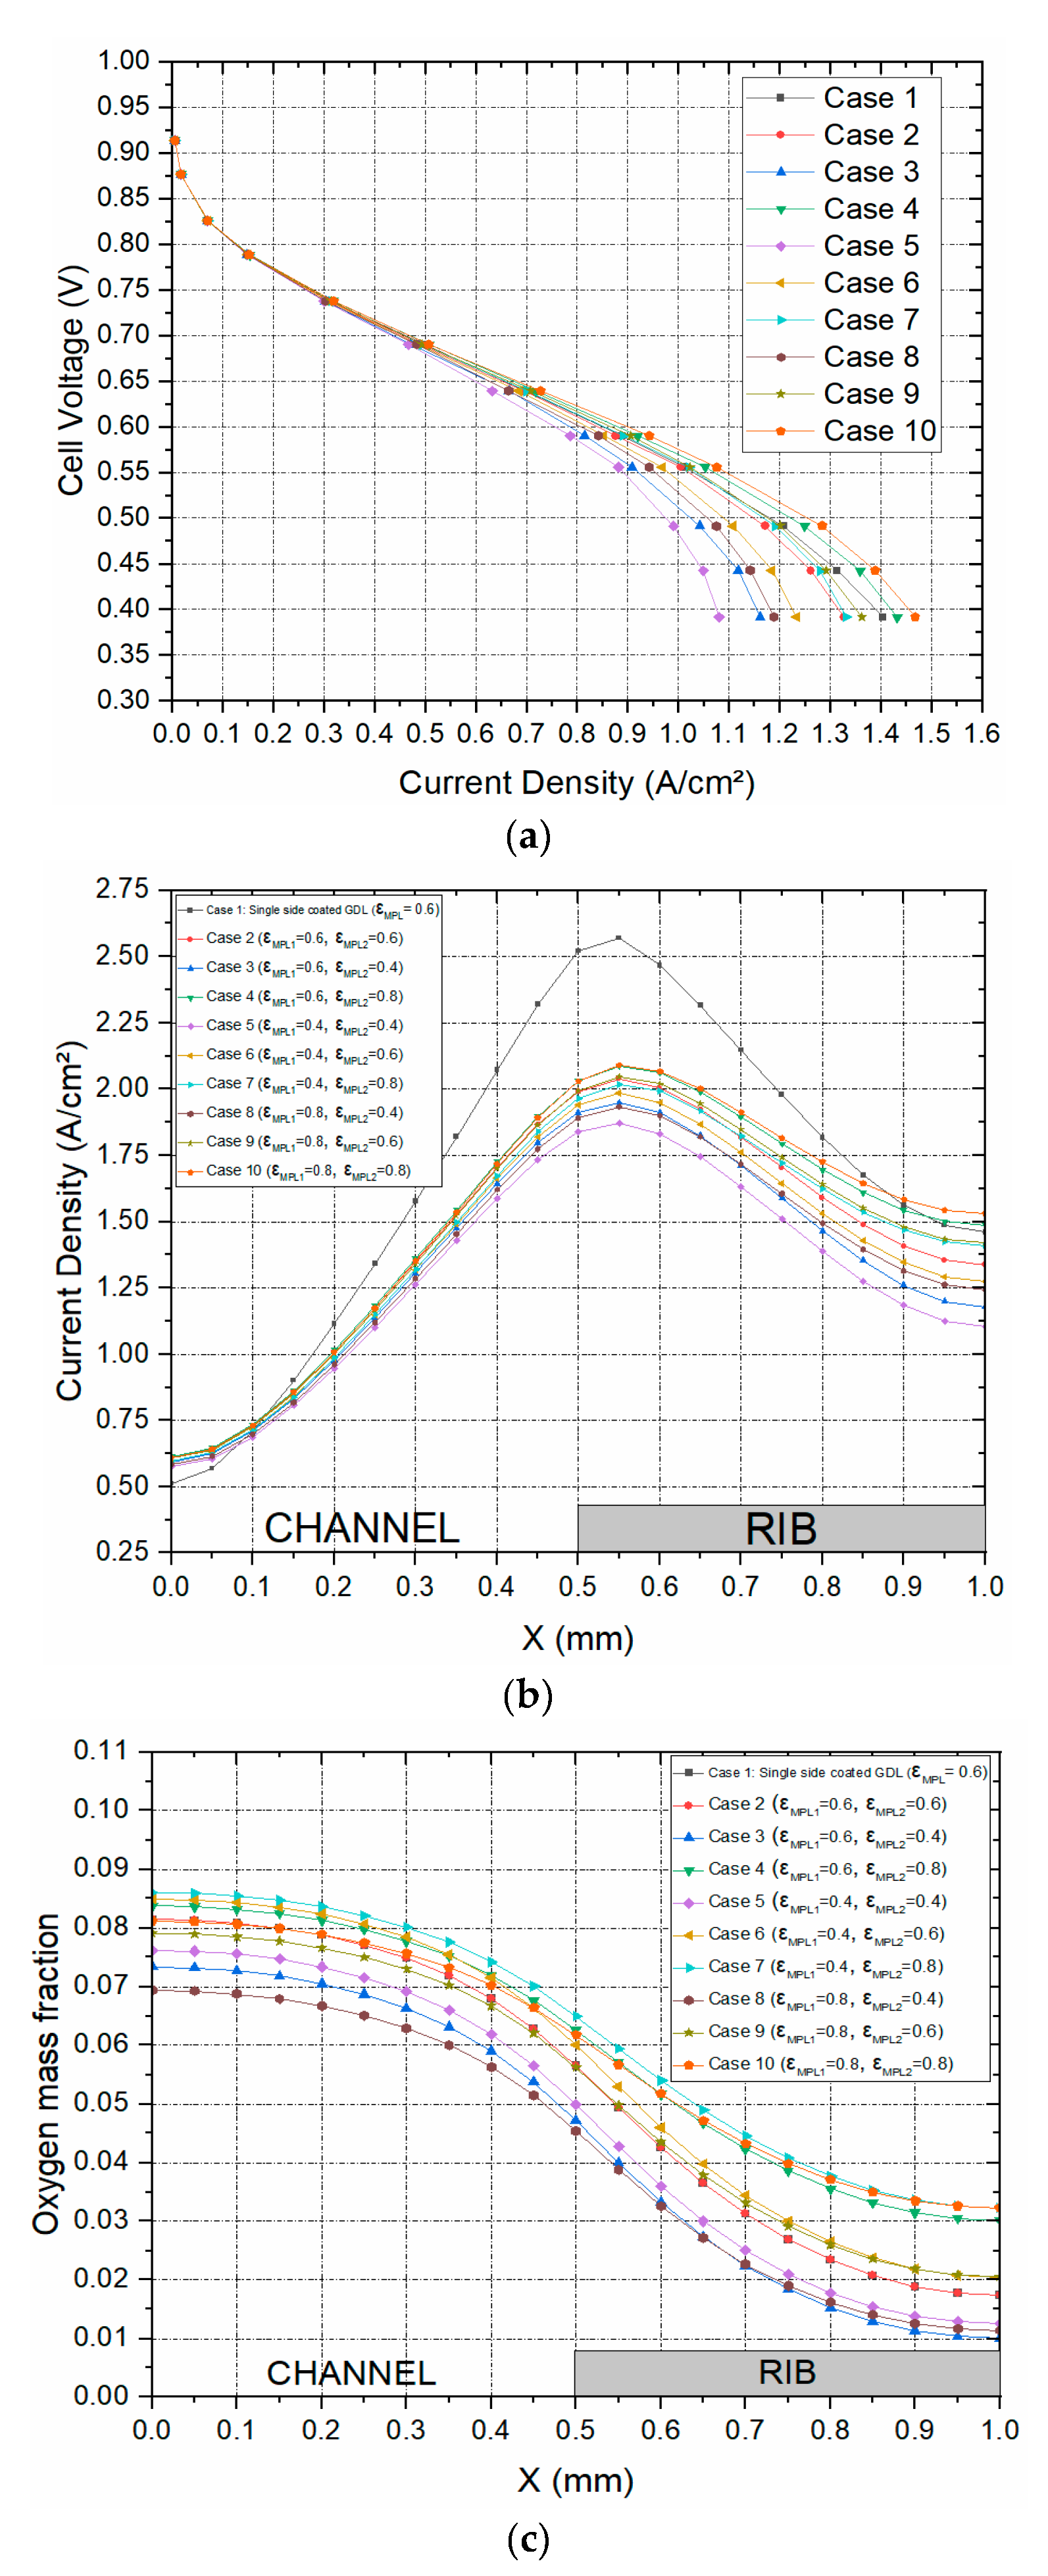
Table 2.
Cases investigated for the MPL porosities.
| Case No. | ||
| 1 (Single MPL) | 0.6 | NA |
| 2 | 0.6 | 0.6 |
| 3 | 0.6 | 0.4 |
| 4 | 0.6 | 0.8 |
| 5 | 0.4 | 0.4 |
| 6 | 0.4 | 0.6 |
| 7 | 0.4 | 0.8 |
| 8 | 0.8 | 0.4 |
| 9 | 0.8 | 0.6 |
| 10 | 0.8 | 0.8 |
Disclaimer/Publisher’s Note: The statements, opinions and data contained in all publications are solely those of the individual author(s) and contributor(s) and not of MDPI and/or the editor(s). MDPI and/or the editor(s) disclaim responsibility for any injury to people or property resulting from any ideas, methods, instructions or products referred to in the content. |
© 2023 by the authors. Licensee MDPI, Basel, Switzerland. This article is an open access article distributed under the terms and conditions of the Creative Commons Attribution (CC BY) license (http://creativecommons.org/licenses/by/4.0/).
Copyright: This open access article is published under a Creative Commons CC BY 4.0 license, which permit the free download, distribution, and reuse, provided that the author and preprint are cited in any reuse.


