
Submitted:
18 April 2023
Posted:
18 April 2023
You are already at the latest version
Abstract
The formation and development of potato tissues and organs is a complex process regulated by a variety of genes and environmental factors. However, the regulatory mechanisms underlying the growth and development are still unclear. In this study, we used autotetraploid potato JC14 as experimental subject to analyze the transcriptome of root, stem and leaf at seedling, tuber formation and tuber expansion stages to explore the spatio-temporal expression pattern of genes and genetic development characteristics. The results identified thousands of differentially expressed genes and KEGG pathway enrichment analysis showed that these genes were mainly involved in defense response and carbohydrate metabolism pathways. A total of 12 co-expressed Gene modules were identified by Weighted Gene Co-expression Network Analysis (WGCNA), and 4 modules were screened out with the highest correlation with potato stem developmental traits. Core genes in the network were further investigated and functionally annotated by computing the connectivity of genes within the module. The results unveiled number of hub genes in stems at different developmental stages, including carbohydrate metabolism related genes, the defense response related genes, and transcription factors. These findings provide important leads for further understanding of the molecular regulation and genetic mechanisms of potato tissue development.
Keywords:
Autotetraploid
; Potato
; RNA-Seq
; WGCNA analysis
; Hub genes
1. Introduction
Potato (Solanum tubulosum L.) is the most consumed non-cereal food and vegetable crop and fourth largest food crop in the world after maize, rice, and wheat [1]. It is also an excellent source of energy, protein, vitamins, and minerals. Potato species with 24, 36, 48, 60, 72 polyploidy exist in nature [2]. Among them, most of the commercially cultivated potato species are autotetraploid. Autotetraploid potato has a high frequency of chromosome recombination and a low frequency of recessive gene expression, which can be fixed by asexual propagation. However, its genome is highly heterozygous, which hinders genetic analysis and improvement. Therefore, it is important to investigate and identify molecular markers and key genes for the genetic development of autotetraploid potato. High-throughput bioinformatics approaches can be used to map genes of interest more quickly and easily than traditional molecular biology techniques [3,4]. In 2011, the genome of the heterozygous diploid potato RH (S. tuberosum group) was sequenced and assembled by the International Potato Sequencing Team (PGSC) and it provided a reference database for discovering useful genetic information from massive biological data [1].
Weighted gene co-expression network analysis (WGCNA) is a method to specify modules based on the expression data of gene chip or RNA sequencing (RNA-Seq). It uses system biology to understand co-expression networks and explore connections between genes and target traits [4]. Moreover, WGCNA provides clues for screening the signaling pathways and regulatory factors involved in the target genes [5]. At present, a large number of literatures have used WGCNA to study potato disease resistance and defense mechanisms. Yan et al. used different hormones to treat late blight resistant potato genotype SD20 and used WGCNA to analyze transcriptome data to obtain nine defense genes, which provided reliable targets for functional verification [6]. Jing et al. used WGCNA analysis to find 13 TF-hub genes related to proline metabolism and salt stress resistance in potato [7]. Guo et al. analyzed gene expression in potato tissues under nitrogen-sufficient and nitrogen-deficiency conditions, and generated 23 modules from 116 differentially expressed hub genes involved in photosynthesis, nitrogen metabolism, and secondary metabolites by WGCNA [8]. Cao et al. identified number of potato hub genes by WGCNA, including genes that regulate plant immune responses such as flagellin-sensitive 2 and chitinases [9]. Additionally, studies have also used WGCNA to explore the molecular mechanisms of plant growth and development in other species. Liu et al., constructed a co-expression network of genes in rutabaga hypocotyl tuber, and WGCNA identified 59 co-expressed gene modules. Among them, two genes, Bra-FLOR1 and Bra-CYP735A2, related to tuber growth were grouped in the same module. This module also included genes involved in carbohydrate transport and metabolism, cell wall growth, auxin regulation, and secondary metabolism [10]. To date, only few studies have investigated the growth and development of potato by WGCNA.
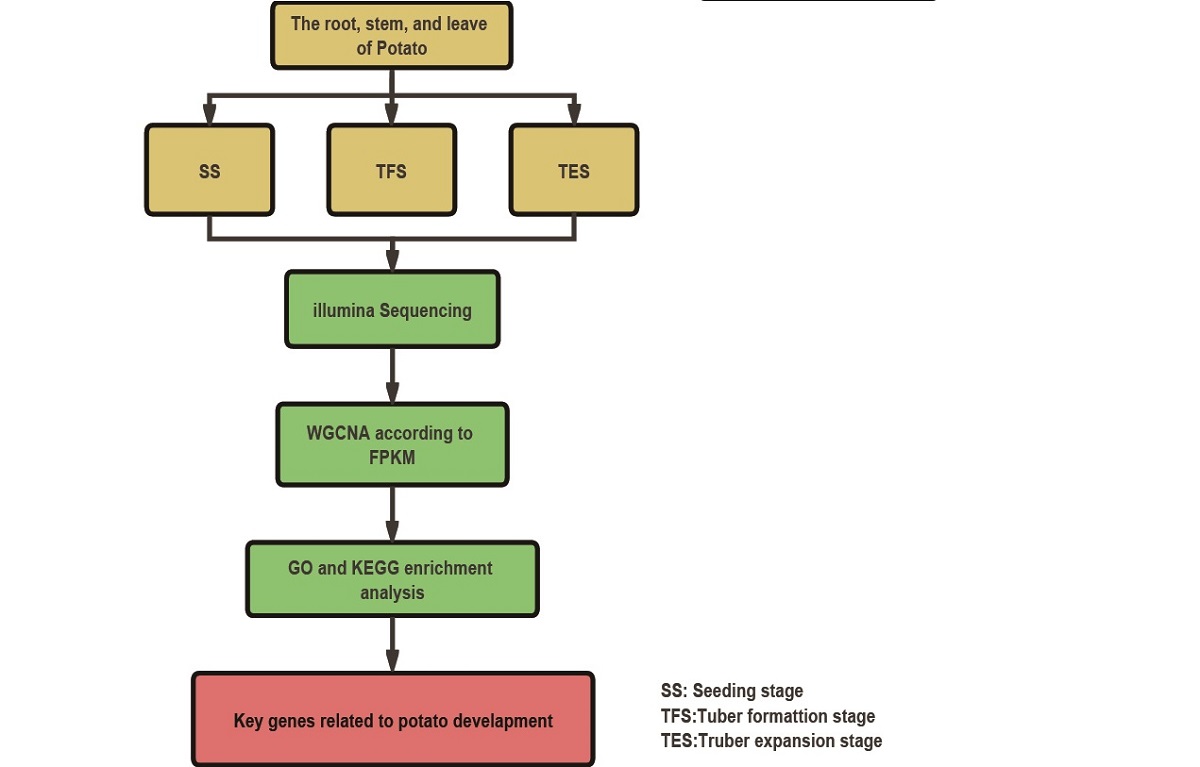
In this study, we aimed to explore the co-expression network of genes involved in potato growth and development. Firstly, transcriptome sequencing was performed on roots, stems and leaves of the autotetraploid potato JC14 at three developmental stages, and differentially expressed genes (DEGs) were analyzed. Secondly, the Gene Co-expression Network was constructed by WGCNA, and the target gene modules related to growth and development traits were screened. Thirdly, Kyoto Encyclopedia of Genes and Genomes (KEGG) and Gene ontology (GO) analysis were performed to reveal the major metabolic pathways involved in the target gene modules and the potential functions of these genes. The key genes in the module were then identified according to the connectivity of the genes in the corresponding network. Finally, real-time quantitative PCR (RT-qPCR) was used to verify the expression pattern of these key genes during growth and development in Solanum tubulosum L. This study was expected to construct a comprehensive and dynamic gene co-expression network of potato growth and development, reveal the spatio-temporal expression of genes and the regulation mechanism of traits at different developmental stages, lay a theoretical foundation for exploring the molecular mechanism of potato growth and development regulation, and provide new genetic resources for molecular breeding of autotetraploid potato.
2. Materials and Methods
2.1. Plant material culture and sampling
Potato genotype JC14 was cultivated in Nankou Pilot Base, Chinese Academy of Agricultural Sciences, Beijing (longitude 116.408490; Latitude 40.154860) in a greenhouse with natural light from 2022 to 2023. Cultivation and field management followed normal production protocols. Potato roots, stems, and leaf tissues and organs were sampled at the seedling, tuber formation, and tuber expansion stages in three biological replicates. After collection, the samples were washed with pure water, quickly froze in liquid nitrogen, and kept at -80°C for subsequent total RNA extraction.
2.2. RNA extraction, Illumina sequencing and data analysis
Total RNA from 27 samples was extracted using TIANGEN's plant RNA extraction kit by magnetic bead method (item number: DP762-T1) (TIANGEN, Beijing, China) according to the manufacturer's protocol.Total RNA purity was detected using a Nano Photometer® spectrophotometer (IMPLEN, CA, USA) and total RNA samples were tested for concentration and integrity using Agilent 2100 RNA Nano 6000 Assay Kit (Agilent Technologies, CA, USA) in the Agilent 2100 Bioanalyzer (Agilent Technologies, CA, USA). When RNA integrity RIN >= 7, the requirements of cDNA library construction and subsequent sequencing was fulfilled. After the total RNA samples were qualified, 1-3μg of which from each sample was used as starting material to construct the transcriptome sequencing library. According to the VAHTS Universal V6 RNA-seq Library Prep Kit for Illumina (No. NR604-01/02) (Vazyme, Nanjing, China), different index tags were selected to build the sequencing library. For qualified Total RNA samples, the eukaryotic mRNA was enriched by magnetic beads with Oligo (dT), and then the mRNA was broken into short fragments by adding fragmentation buffer. One-strand cDNA was synthesized with random hexamers, followed by adding buffer, dNTPs, RNase H and DNA polymerase I to synthesize double-stranded cDNA. The double-stranded cDNA was then purified using AMPure P beads purification or QiaQuick PCR kit. The purified double-stranded cDNA was subjected to end repair, A-tail addition and sequencing adapter ligation, followed by fragment size selection, and finally PCR enrichment to obtain the final cDNA library. After the library was constructed, the Qubit 3.0 was used for preliminary quantification, and the library was diluted to 1 ng/μL, and finally Bio-RAD KIT iQ SYBR GRN was used for QPCR to accurately quantify the effective concentration of the library (library effective concentration > 10 nM) to ensure library quality. The NovaSeq 6000 S4 Reagent kit V1.5 was used for clustering and sequencing on the NovaSeq 6000 S4 platform, and the double-end sequencing program (PE) was run to obtain 150 bp double-end sequencing reads.
Sequencing quality was assessed using FastQC and Trimmomatic software [11]. Raw reads were trimmed by eliminating adapters, poly-N, and low-quality reads to obtain clean data, which were then mapped to the potato reference genome using HISAT2 [12]. The reference genome was downloaded from Spud DB Potato Genomics Resource (http://spuddb.uga.edu/rh_potato_download.shtml). Transcription and expression level of genes were measured using FPKM (fragments per KB of transcript per million fragments mapped) in StringTie [13] and differential expression was analyzed using the DESeq R package [14]. In this study, a DEG was considered if the fold change was >2 and q-valuewas <0.05.
2.3. Construction of weighted co-expressed gene networks
By referring to the tutorial on the WGCNA official website, The WGCNA package of R software was used to construct the co-expressed gene network [4]. Firstly, samples with low correlation or that could not be clustered on the dendrogram were removed and cluster analysis was performed. Secondly, in order to meet the premise of scale-free network distribution, the pick soft threshold function in the WGCNA package was used to calculate the soft threshold. When the fitting curve was close to 0.9 for the first time, the threshold parameter β was selected. Then, according to the value of β, the correlation based association between phenotype and gene modules was performed to create the adjacency matrix. The adjacency matrix was further transformed into topological overlap matrix (TOM) to construct the gene connectivity network. Finally, based on the eigengenes of each module, the gene modules are identified and clustered by the dynamic tree cut method, and the modules that are closer to each other are merged into new modules. In this study, the module similarity threshold was set to 0.25, the expression threshold was set to 2, and the minimum number of genes in a module was set to 30 to partition modules.
2.4. Selection and enrichment analysis of key modules
To further investigate the gene modules related to potato growth and development, the correlation coefficients between the module characteristic genes and different samples were calculated. The module with a correlation coefficient greater than 0.5 was selected as the target gene module. DEGs in the target module were annotated using Blast2Go [15]. Blast2Go was used to retrieve gene ontology (GO) entries, including biological processes, molecular functions and cellular components. Pathway enrichment analysis of DEGs within the target module was performed using KEGG database [16].
2.5. Screening and functional analysis of hub genes
All DEGs of the four target modules were selected and using the WGCNA R package to calculate the intra-module gene significance, edges, and nodes [4] (Table S5). The information was exported to Cytoscape 3.9.1 software for gene network analysis and mapping [17]. DEGs with high connectivity in the target gene module were screened as candidate hub genes. Swiss-port databases [18] was used for homology annotation.
2.6. RT-qPCR was used to verify hub gene expression
In order to verify the reliability of RNA-seq data, 20 genes were used for RT-qPCR to determine the changes in their relative expression levels, and R package was used to calculate and plot the correlation between the relative expression levels and FPKM. And then, a total of 40 candidate hub genes were selected for RT-qPCR analysis to assess their expression levels. Primers for candidate hub genes were designed using Primer Premier 5.0 (Table S8). Potato stems from the seedling, tuber formation and tuber expansion stages were selected as raw materials. Gene expression analysis of candidate hub genes was performed on the LightCycler480 system (Roche, Rotkreuz, Switzerland) with a total reaction volume of 10 µL for RT-qPCR, this included 12.5 µL 5 µL 2X SG Fast qPCR Master Mix (Roche, Rotkreuz, Switzerland), 0.2 µL primer (10 µM), 1.0 µL template (10×diluted cDNA liquid), and 3.6 µL ddH2O. Using actin as the reference gene and the 2−∆∆ CT methods, the expression levels of selected hub genes were calculated [19]. Histograms were plotted by seaborn package in python. Three independent biological replicates were performed for each sample in this assay, significance and standard deviation was determined by independent t-test of statannot package (ns: p > 0.05; *: p < 0.05, **: p < 0.01; ***: p < 0.001; ****: p < 0.0001).
3. Results
3.1. Genome-wide transcriptome analysis
High-throughput RNA-Seq was performed on roots, stems, and leaves at three different developmental stages with three biological replicates per sample, resulting in 176.36 GB of clean reads. For each sample, the sequencing data was larger than 5.37 GB, the GC content ranged from 42.77% to 45.87%, and the percentage of Q30 bases was greater than 91.89% (Table S1). Compared with the potato (RH89-039-16) reference genome [20], the reads alignment of samples was between 66.47% and 79.37% (Table S1) and this indicated that the quality of the sequencing data was high and met the requirements for subsequent analysis. In potato root, 209, 953 and 1,018 up-regulated differential genes and 13, 380, 12, 765 and 924 down-regulated differential genes were identified between seedling stage and tuber formation stage, seedling stage and tuber expansion stage, tuber formation stage and tuber expansion stage, respectively (Figure 1A). In the stem, 113, 534 and 930 up-regulated genes and 144, 800 and 817 down-regulated genes were also discovered between any two of the three stages, respectively (Figure 1B). In leaves, 6, 701 and 982 up-regulated genes and 34, 783 and 765 down-regulated genes were screened between the two at the three stages, respectively (Figure 1C).
3.2. Construction of weighted gene co-expression network and identification of modules
After filtering genes with variance ≥ 0.5, 14, 475 genes were used to construct the weighted gene co-expression network. All 27 samples were clustered and the correlation coefficient of expression levels was calculated for each sample. Overall, the samples clustered well and no outliers appeared (Figure 2). The weight values were calculated using the pick soft threshold function included in the WGCNA software package, and the soft threshold β=28 was determined when the fitted curve was first close to 0.9 (Figure 3A). Modules with similar expression are then merged by the dynamic tree cut method. Genes with high correlation are assigned to the same module, and different branches of the cluster tree in the figure represent different gene co-expression modules, and different colors represent different modules, which are divided into 12 modules in total (Figure 3B). A total of 1, 546 genes were obtained from the 12 co-expressed gene modules. Among them, there were eight modules with 150 genes, including black, cyan, darkgreen, darkorange, grey60, midnightblue, red and steelblue and the plum1 module contained the lowest number of genes of 41 (Table S2).
The correlation coefficients between characteristic gene modules and traits were tested to explore the relationship between the identified modules and potato growth and development. Based on the correlation between the trend of gene expression modules and tissue site enrichment, the Pearson correlation coefficient (r2 >0.5) and the magnitude of significance p-value (P<0.05) were used as the screening criteria. Genes in midnightblue module was significantly enriched in roots at the tuber formation stage and plum1 was significantly enriched in roots at the tuber expansion stage. In comparison, darkturquoise, grey60, and darkgreen were significantly enriched in stems at the seedling stage, and darkgreen was significantly enriched in stems at the tuber formation stage, whereas steelblue and paleturquoise were significantly enriched in stems at tuber expansion stage. In addition, lightsteelblu1 was significantly enriched in leaves at the seedling stage, while cyan was significantly enriched in leaves at the tuber expansion stage. These results suggest that the significantly enriched modules differ across organs during the same developmental period and that the regulation of gene expression is tissue specific. Furthermore, the same tissue also has different enrichment modules and differential gene expression patterns at different developmental stages (Figure 4). Subsequently, differentially expressed genes in the darkturquoise, grey60, darkgreen, steelblue, and paleturquoise modules related to potato stem growth and development were selected for GO annotation and KEGG enrichment analysis. However, since the darkturquoise module at the seedling stage did not enrich any pathways, its subsequent analysis was therefore not conducted.
3.3. GO and KEGG enrichment analysis of key modules in different tissues
Biological process (BP), cellular component (CC) and molecular function (MF) are the three GO domains. For the four target gene modules grey60, darkgreen, steelblue and paleturquoise, the three most significantly enriched GO terms in the BP entry were metabolic process, cellular process and monomer process. CC entry contains cells, cell parts and organelles, whereas MF entry has binding, catalytic activity, and transporter activity (Figure 5A, Figure 6A, Figure 7A, and Figure 8A and Table S3). The grey60 module is enriched in olefin biosynthetic process (GO: 1900674), defense response (GO: 0006952), and chitin metabolism (GO: 0006030). The darkgreen module was enriched in carbohydrate metabolism (GO: 0005975), cell growth (GO: 0016049), cell wall polysaccharide biosynthesis (GO: 0070592), acyltransferase activity (GO: 0016746), methylammonium transmembrane transporter activity (GO: 0015200), etc. steelblue module was enriched in carbohydrate metabolism (GO: 0005975), growth regulation (GO: 0040008), thiamine metabolism (GO: 0006772), hydrolase activity (GO: 0016787), glucosidase activity (GO: 0015926), etc. Paleturquoise module was mainly enriched in amino acid metabolism (GO: 0006520), primary metabolic process (GO: 0044238), steroid metabolism (GO: 0008202), carbon-nitrogen ligase activity (GO: 0016884), acyltransferase activity (GO: 0016746), etc. In general, DEGs in the four target gene modules could be enriched in metabolic pathways related to growth and development, such as carbohydrate metabolism, cell growth, and carbon-nitrogen ligase activity.
KEGG enrichment analysis of DEGs in the four target gene modules (grey60, darkgreen, steelblue, and paleturquoise) identified 3, 5, 13, and 2 enriched pathways (FDR < 0.05), respectively (Figure 5B, Figure 6B, Figure 7B, and Figure 8B). The pathways enriched by grey60 module were mainly zeatin biosynthesis (map00908), MAPK signaling pathway (map04016) and plant-pathogen interaction (map04626). The darkgreen module was enriched in fatty acid elongation (map00062), phagosome (map04145), amino sugar and nucleotide sugar metabolism (map00520), biosynthesis of nucleotide sugars (map01250), and ascorbate and aldarate metabolism (map00053). The steelblue module was mainly enriched in thiamine metabolism (map00730), tyrosine metabolism (map00350), tropane, piperidine and pyridine alkaloid biosynthesis (map00960), citrate cycle (TCA cycle) (map00020), phenylalanine metabolism (map00360), glycine, serine and threonine metabolism (map00260), amino sugar and nucleotide sugar metabolism (map00520), isoquinoline alkaloid biosynthesis (map00950), starch and sucrose metabolism (map00500), β-alanine metabolism (map00410), etc. The main enriched pathways in the paleturquoise module were carbon metabolism (map01200) and biosynthesis of amino acids (map01230) (Table S4). In general, DEGs in seedling stems were enriched in defense-related metabolic pathways, such as MAPK and hormone signaling, plant-pathogen interaction, and so on. In tuber formation stage, DEGs were enriched in amino sugar and nucleotide sugar metabolism pathways, whereas in tuber expansion stage, DEGs were enriched in growth-related metabolic pathways, such as starch and sucrose metabolism, carbohydrate metabolism, and amino acid metabolism.
3.4. Screening and functional annotation of hub genes in the module
In each of the four target gene modules, 30 genes with high connectivity were selected as candidate hub genes for co-expression network mapping, in which the color from red to orange indicates the connectivity from high to low (Figure 5C, Figure 6C, Figure 7C and Figure 8C). Ranked according to the connectivity level, 10 candidate hub genes out of 30 candidates from each of the four modules (40 in total) were selected for subsequent analysis and discussion (Table S6). Swiss-port databases was used for homology annotation, most of which were related to carbohydrate metabolism and plant growth and development. In addition, the expression levels of hub genes obtained by RNA-Seq were made into a heat map (Figure 5D, Figure 6D, Figure 7D and Figure 8D and Table S7). The four modules had genes involved in carbohydrate metabolism and cell division, such as reduced wall acetylation 3 (RWA3, RHC02H1G1413.2) and polygalacturonase (PG, RHC08H1G2453.2) and zeatin O-glucosyltransferase (RHC05H1G02002.2). Hub genes related to defense response included glucanendo-1, 3-β-glucosidase (GLU, RHC10H1G2629.2) and Cysteine-rich repeat secretory protein 55 (CRRSP55, RHC09H1G1673.2), and hub genes related to transcription regulation included transcription factors MYB61 (RHC01H1G3797.2) and PCF3. In addition, DUF642, a recurrent conserved gene in the stems of many plants.
3.5. Validation of the hub genes by RT-qPCR
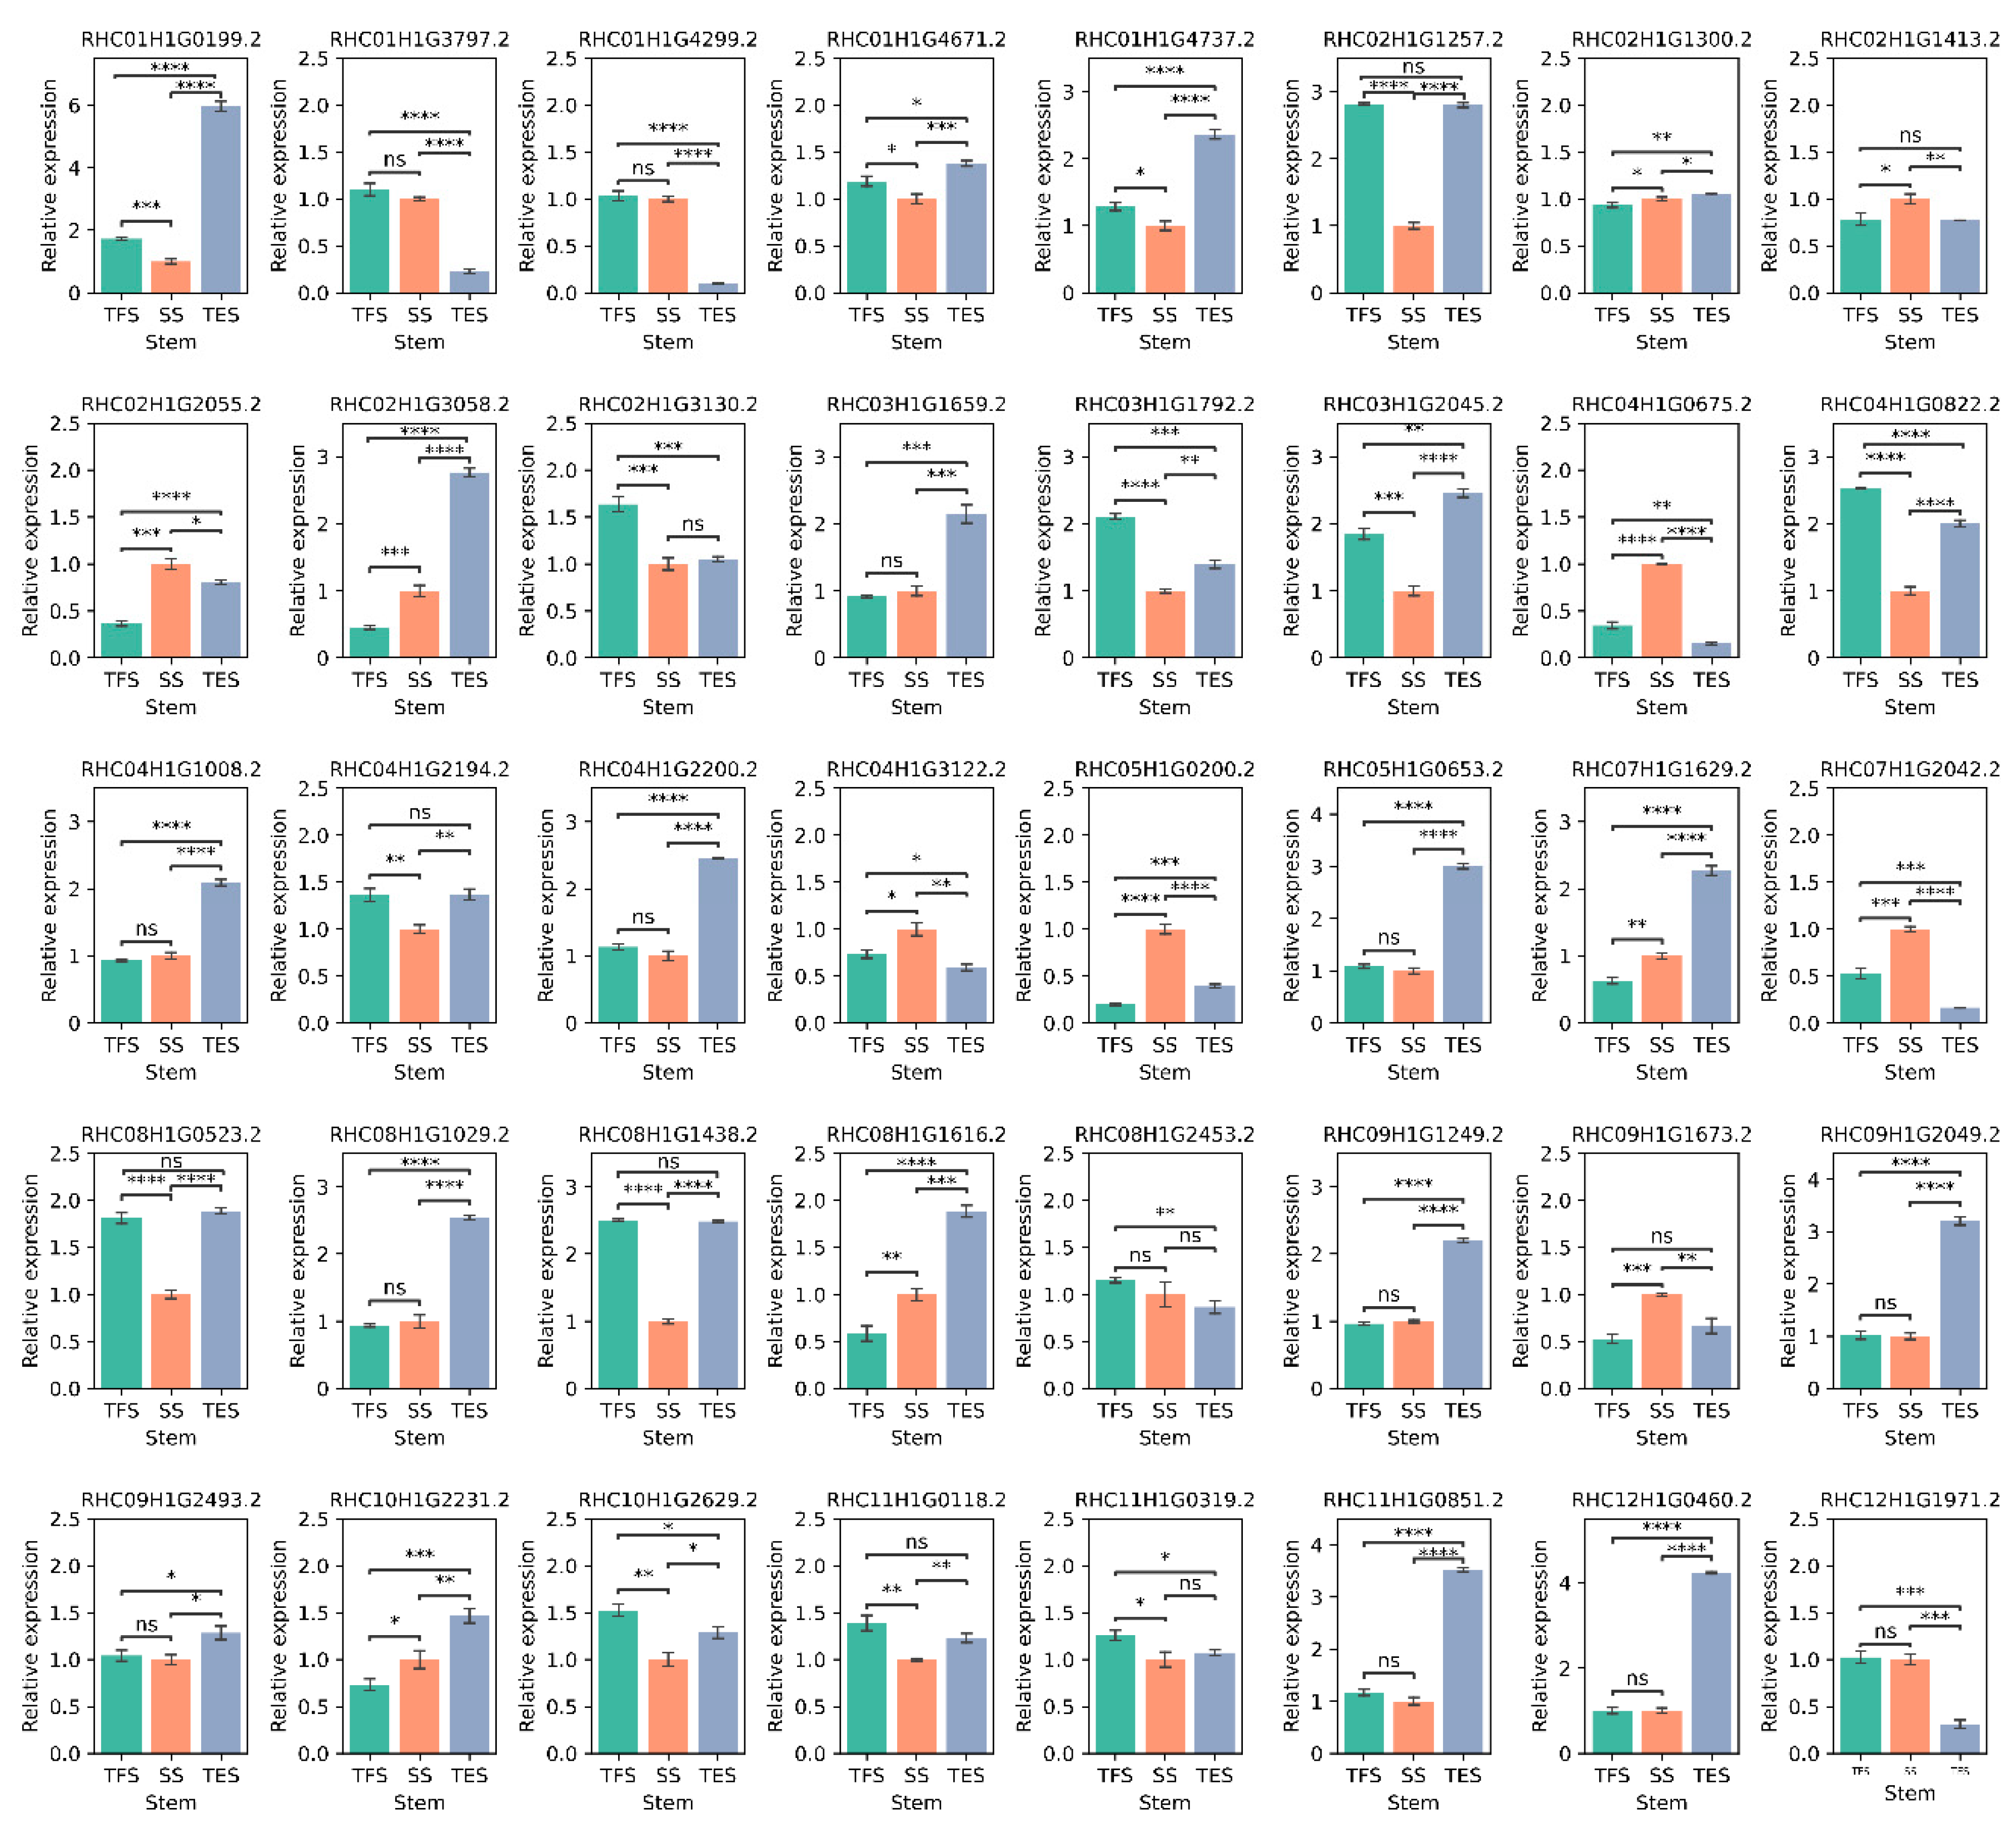
In order to verify the reliability of RNA-seq data, 20 genes were selected for RT-qPCR to determine changes in their relative expression levels. There is a good correlation between the results of RT-qPCR detection and RNA_seq (R = 0.70), which proves the reliability of the transcriptome analysis results (Figure 9). In addition, RT-qPCR was used to amplify the aforementioned 40 hub genes. Compared with the seedling stage, 14 hub genes were up-regulated at the tuber formation stage and 27 at the tuber expansion stage (Figure 10 and Table S7), which was consistent with the results of RNA-Seq (Figure 5D, 6D, 7D and 8D and Table S7). This indicates that these genes play a promoting role during the growth and development of potato stems. In comparison, 12 hub genes were down-regulated at the tuber formation stage and 10 at the tuber expansion stage (Figure 10 and Table S7), suggesting that these genes may be negative regulators of the growth and development of potato stems.
4. Discussion
Genetic analysis and improvement are obstructed by the high degree of genomic heterozygosity in cultivated cultivars of autotetraploid potatoes. Identifying key candidate genes related to growth and development can provide target gene resources for molecular breeding. Previous literatures have studied the mechanisms of potato cold resistance [21], disease resistance [22], and nitrogen utilization [8] through transcriptome approach. The mechanisms involved in the growth and development of autotetraploid potato, however, are extremely complex, gene expression changes in multiple metabolic pathways occur at different developmental stages. In this study, WGCNA was used to construct a co-expression network of weighted genes related to potato growth and development traits based on transcriptome datasets from roots, stems and leaves of potatoes at different developmental stages. A total of 12 gene modules were identified, of which 4 were significantly associated with stem growth and development. Thirty candidate hub genes with high connectivity were selected from each of the four modules to make a network diagram (Figure 5C, Figure 6C, Figure 7C and Figure 8C), and the top 10 hub genes in each module with the highest connectivity were selected for subsequent analysis. These hub genes may play important roles in potato growth and development through carbohydrate metabolism, cell growth, defense response and other related metabolic pathways.
Carbohydrate is an important energy substance and plays a crucial role in plant growth and development. Xylan is the most abundant hemicellulose, and the accuracy and location of xylan acetylation are critical for xylan function and plant growth and development. RWA protein family plays an important role in regulating cell wall acetylation after xylan synthesis and are essential for the efficient binding of xylan to cellulose [23]. Over-expression of Dendrobium officinale RWA3 significantly increased the acetylation level of polysaccharides in seeds, leaves and stems [24]. PG is involved in carbohydrate metabolism and is very important for cell wall metabolism and maintenance of plant tissue morphology. Literature suggests that PG is associated with quality processes such as fruit ripening, flavor, firmness [25]. Moreover, PG has a negative regulatory role in promoting fruit softening. PG is highly expressed in immature fruits and plays an important role in maintaining the firmness of fruits [26]. In addition, the up-regulation of genes related to cellulose and pectin metabolism pathways, including PG, will increase the tensile stress of Catalpa bungei, which is conducive to the formation of high-quality wood [27]. In this study, RWA3 and PG were highly expressed at all three stages, indicating their important involvement in the whole growth and development stages of the potato stem.
Auxin and cytokinins (CKs) are essential hormones that regulate plant growth and development. O-glucosyltransferase is involved in the metabolic process of plant CKs and catalyzes the reversible inactivation of O-glucosylation. It is an important mechanism for the homeostasis of plant CKs in vivo. Both O-glucosyltransferases and UDP glucosyltransferases are subfamilies in the glycosyltransferase superfamily. Among them, zeatin O-glucosyltransferase belongs to the CK O-glucosyltransferase superfamily [28]. Zeatin O-glucosyltransferase is a negative regulator of growth and development, and its up regulation may be the reason for the long life and slow growth of Dracaena [29]. In this study, the expression of O-glucosyl transferase was low in the stem at the tuber formation stage and high at the tuber expansion stage, which may contribute to the gradual slowing of potato growth as development progressed. However, UDP-glycosyltransferases (RHC01H1G4299.2) showed a low expression level at all three developmental stages.
Pathogenesis-related proteins are specific proteins induced under pathological conditions and play an important role in plant disease resistance. GLU is a pathogenesis related protein in the pathogenesis-related family. Its expression is highly induced several hours after soybean infection with Phakopsora pachyrhizi. Soybean PEPPA-7431740 may trigger immunity by interfering with the activity of -1, 3-β-glucosidase within glucan and inhibiting pathogen-associated molecular patterns [30]. The pesticide GLY-15 has a good antiviral activity against tobacco Mosaic virus in plants. It induces a stress response in plants, in which the expression of 12 key genes including glucan-1, 3-β-glucosidase is significantly up-regulated [31]. Other studies have shown that glucan endo-1, 3-β-glucosidase is involved in plant response to soil alkaline stress [32]. 1, 3-β-glucan is a polysaccharide widely distributed in the cell walls of several phylogenetically distant organisms, such as bacteria, fungi, plants and microalgae, and is involved in cell wall degradation [33]. CRRSP55 is a disease-related protein. MgMO237 interacted with rice defense related protein 1, 3-betaglucan synthase component (OsGSC) and OsCRRSP55 to inhibit plant basal immunity during the late parasitic stage of nematode. Thus, it promotes parasitism in gramineae [34]. In this study, GLU and CRRSP55 genes were expressed in stems at all three developmental stages (Figure 5A), suggesting that these genes may play an ongoing role in potato defense against pests and diseases.
In addition, MYB61 and PCF3 were selected as transcription factors in the module. Sugarcane MYBs play an important role in stem development and various stress responses, among which MYB61 positively responds to drought stress [35]. Seedlings of barren-tolerant wild soybean are more adaptive to phosphorus stress than common wild soybean, which absorb more phosphorus by increasing root length, and MYB61 is a key transcription factor for resistance to low phosphorus stress in barren-tolerant wild soybean [36]. Rice MYB61 may regulate the efficiency of crop nitrogen usage, which in turn affects rice growth and yield [37]. TCP (teosinte branched1/ccincinnata/proliferating cell factor) is a set of specific transcription factors plays an important role in plant growth and development, and PCF3 is a TCP family transcription factor [38]. TCP transcription factors regulate leaf curvature, flower symmetry and the synthesis of secondary metabolites. Most TCPs in Ginkgo biloba also respond to exogenous hormones such as ABA, SA and MeJA [39]. In this study, the expression of MYB61 was higher in stems at the seedling and tuber formation stages and decreased at the tuber expansion stage, suggesting that MYB61 may play a role in response to drought and low phosphorus stress and nitrogen fixation in the early growth stage of potato. As growth and development progressed, the expression of PCF3 in the stem gradually increased and was highest at the tuber expansion stage, suggesting that PCF3 may promote potato stem growth.
5. Conclusions
In this study, weighted gene co-expression networks of roots, stems, and leaves at different developmental stages were constructed, and 12 target modules were identified. Four target gene modules were associated with stem growth and development. GO and KEGG enrichment analysis showed that DEGs were mainly enriched in defense-related metabolic pathways, such as MAPK and hormone signal transduction, plant-pathogen interaction, and growth-related metabolic pathways including starch and sucrose metabolism, carbohydrate metabolism, and amino acid metabolism. Carbohydrate metabolism-related genes RWA3 and PG were highly expressed at all three stages, indicating their important involvement in the whole growth and development stage of stem. The low expression of zeatin O-glucosyl transferase in stems at tuber formation stage and high expression in tuber expansion stage may contribute to the slow growth rate of potato during development. GLU and CRRSP55 genes were expressed in stems at all three developmental stages, suggesting that these genes may play an ongoing role in potato defense against pests and diseases. In addition, MYB61 and PCF3 transcription factors were identified in the target module, and their regulation of downstream target genes affects the life process of potato. The results of this study will help to further understand the molecular mechanism of potato growth and development and provide new genetic resources for future breeding of autotetraploid potatoes.
Supplementary Materials
The following supporting information can be downloaded at the website of this paper posted on Preprints.org. Table S1: Quality of evaluation of sequencing data; Table S2: Distribution of gene number in co-expression modules; Table S3: GO enrichment analysis of four target modules; Table S4: KEGG pathways of four target modules; Table S5: Cytoscape Input values of four target modules; Table S6: Functional annotations of hub genes; Table S7: Expression patterns of candidate hub genes by transcription measured; Table S8: Primers used in this study.
Author Contributions
Conceptualization, Z.L. and Jiayin.W.; methodology, Z.L.; software, Z.L.; validation, Z.L. and Juan.W.; formal analysis, Z.L.; investigation, Z.L.; resources, Z.L. and Jiayin.W; data curation, Z.L.; writing—original draft preparation, Z.L. and C.C.; writing—review and editing, Jiayin.W.; visualization, Z.L.; supervision, Jiayin.W.; project administration, Jiayin.W.; funding acquisition, Jiayin.W. All authors have read and agreed to the published version of the manuscript.
Funding
This research received no external funding.
Informed Consent Statement
Informed consent was obtained from all subjects involved in the study.
Data Availability Statement
Transcriptome data was uploaded to NCBI database, and the accession number of GEO database was SUB12997058.
Acknowledgments
The experimental materials of autotetraploid potato were donated by researcher Guangcun Li and Dr. Shaoguang Duan from Institute of Vegetables and Flowers, Chinese Academy of Agricultural Sciences.
Conflicts of Interest
The authors declare no conflict of interest.
References
- Xu, X.; Pan, S.; Cheng, S.; Zhang, B.; Mu, D.; Ni, P.; Zhang, G.; Yang, S.; Li, R.; Wang, J.; et al. Genome sequence and analysis of the tuber crop potato. Nature 2011, 475, 189–195. [Google Scholar] [CrossRef] [PubMed]
- Spooner, D.M.; McLean, K.; Ramsay, G.; Waugh, R.; Bryan, G.J. A single domestication for potato based on multilocus amplified fragment length polymorphism genotyping. PNAS 2005, 102, 14694–14699. [Google Scholar] [CrossRef] [PubMed]
- Zhang, B.; Horvath, S. A general framework for weighted gene co-expression network analysis. Stat Appl Genet Mol Biol 2005, 4, Article17. [Google Scholar] [CrossRef] [PubMed]
- Langfelder, P.; Horvath, S. WGCNA: an R package for weighted correlation network analysis. BMC Bioinformatics 2008, 9, 559. [Google Scholar] [CrossRef] [PubMed]
- Luo, G.; Huang, X.; Chen, J.; Luo, J.; Liu, Y.; Tang, Y.; Xiong, M.; Lu, Y.; Huang, Y.; Ouyang, B. Systematic Analysis of the Grafting-Related Glucanase-Encoding GH9 Family Genes in Pepper, Tomato and Tobacco. Plants (Basel) 2022, 11, 2092. [Google Scholar] [CrossRef] [PubMed]
- Yan, W.; Jian, Y.; Duan, S.; Guo, X.; Hu, J.; Yang, X.; Li, G. Dissection of the Plant Hormone Signal Transduction Network in Late Blight Resistant Potato Genotype SD20 and Prediction of Key Resistance Genes. Phytopathology 2022. [Google Scholar] [CrossRef]
- Jing, Q.; Hou, H.; Meng, X.; Chen, A.; Wang, L.; Zhu, H.; Zheng, S.; Lv, Z.; Zhu, X. Transcriptome analysis reveals the proline metabolic pathway and its potential regulation TF-hub genes in salt-stressed potato. Front Plant Sci 2022, 13, 1030138. [Google Scholar] [CrossRef]
- Guo, H.; Pu, X.; Jia, H.; Zhou, Y.; Ye, G.; Yang, Y.; Na, T.; Wang, J. Transcriptome analysis reveals multiple effects of nitrogen accumulation and metabolism in the roots, shoots, and leaves of potato (Solanum tuberosum L.). BMC Plant Biol 2022, 22, 282. [Google Scholar] [CrossRef]
- Cao, W.; Gan, L.; Shang, K.; Wang, C.; Song, Y.; Liu, H.; Zhou, S.; Zhu, C. Global transcriptome analyses reveal the molecular signatures in the early response of potato (Solanum tuberosum L.) to Phytophthora infestans, Ralstonia solanacearum, and Potato virus Y infection. Planta 2020, 252, 57. [Google Scholar] [CrossRef]
- Liu, M.; Bassetti, N.; Petrasch, S.; Zhang, N.; Bucher, J.; Shen, S.; Zhao, J.; Bonnema, G. What makes turnips: anatomy, physiology and transcriptome during early stages of its hypocotyl-tuber development. Hortic Res 2019, 6, 38. [Google Scholar] [CrossRef]
- Bolger, A.M.; Lohse, M.; Usadel, B. Trimmomatic: a flexible trimmer for Illumina sequence data. Bioinformatics 2014, 30, 2114–2120. [Google Scholar] [CrossRef] [PubMed]
- Kim, D.; Langmead, B.; Salzberg, S.L. HISAT: a fast spliced aligner with low memory requirements. Nat Methods 2015, 12, 357–360. [Google Scholar] [CrossRef] [PubMed]
- Pertea, M.; Pertea, G.M.; Antonescu, C.M.; Chang, T.C.; Mendell, J.T.; Salzberg, S.L. StringTie enables improved reconstruction of a transcriptome from RNA-seq reads. Nat Biotechnol 2015, 33, 290–295. [Google Scholar] [CrossRef] [PubMed]
- Love, M.I.; Huber, W.; Anders, S. Moderated estimation of fold change and dispersion for RNA-seq data with DESeq2. Genome Biol 2014, 15, 550. [Google Scholar] [CrossRef] [PubMed]
- Conesa, A.; Gotz, S.; Garcia-Gomez, J.M.; Terol, J.; Talon, M.; Robles, M. Blast2GO: a universal tool for annotation, visualization and analysis in functional genomics research. Bioinformatics 2005, 21, 3674–3676. [Google Scholar] [CrossRef]
- Kanehisa, M.; Araki, M.; Goto, S.; Hattori, M.; Hirakawa, M.; Itoh, M.; Katayama, T.; Kawashima, S.; Okuda, S.; Tokimatsu, T.; et al. KEGG for linking genomes to life and the environment. Nucleic Acids Res 2008, 36, D480–D484. [Google Scholar] [CrossRef] [PubMed]
- Shannon, P.; Markiel, A.; Ozier, O.; Baliga, N.S.; Wang, J.T.; Ramage, D.; Amin, N.; Schwikowski, B.; Ideker, T. Cytoscape: a software environment for integrated models of biomolecular interaction networks. Genome Res 2003, 13, 2498–2504. [Google Scholar] [CrossRef]
- Bairoch, A. The SWISS-PROT protein sequence database and its supplement TrEMBL in 2000. Nucleic Acids Research 2000, 28, 45–48. [Google Scholar] [CrossRef]
- Livak, K.J.; Schmittgen, T.D. Analysis of relative gene expression data using real-time quantitative PCR and the 2(-Delta Delta C(T)) Method. Methods 2001, 25, 402–408. [Google Scholar] [CrossRef]
- Sun, H.; Jiao, W.B.; Krause, K.; Campoy, J.A.; Goel, M.; Folz-Donahue, K.; Kukat, C.; Huettel, B.; Schneeberger, K. Chromosome-scale and haplotype-resolved genome assembly of a tetraploid potato cultivar. Nat Genet 2022, 54, 342–348. [Google Scholar] [CrossRef]
- Chen, L.; Zhou, F.; Chen, Y.; Fan, Y.; Zhang, K.; Liu, Q.; Tu, W.; Jiang, F.; Li, G.; Zhao, H.; et al. Salicylic Acid Improves the Constitutive Freezing Tolerance of Potato as Revealed by Transcriptomics and Metabolomics Analyses. Int J Mol Sci 2022, 24, 609. [Google Scholar] [CrossRef] [PubMed]
- Glushkevich, A.; Spechenkova, N.; Fesenko, I.; Knyazev, A.; Samarskaya, V.; Kalinina, N.O.; Taliansky, M.; Love, A.J. Transcriptomic Reprogramming, Alternative Splicing and RNA Methylation in Potato (Solanum tuberosum L.) Plants in Response to Potato Virus Y Infection. Plants (Basel) 2022, 11, 635. [Google Scholar] [CrossRef] [PubMed]
- Qaseem, M.F.; Wu, A.M. Balanced Xylan Acetylation is the Key Regulator of Plant Growth and Development, and Cell Wall Structure and for Industrial Utilization. Int J Mol Sci 2020, 21, 7875. [Google Scholar] [CrossRef] [PubMed]
- Si, C.; Teixeira da Silva, J.A.; He, C.; Yu, Z.; Zhao, C.; Wang, H.; Zhang, M.; Duan, J. DoRWA3 from Dendrobium officinale Plays an Essential Role in Acetylation of Polysaccharides. Int J Mol Sci 2020, 21, 6250. [Google Scholar] [CrossRef]
- Datir, S.; Regan, S. Advances in Physiological, Transcriptomic, Proteomic, Metabolomic, and Molecular Genetic Approaches for Enhancing Mango Fruit Quality. J Agric Food Chem 2023, 71, 20–34. [Google Scholar] [CrossRef]
- Paniagua, C.; Ric-Varas, P.; Garcia-Gago, J.A.; Lopez-Casado, G.; Blanco-Portales, R.; Munoz-Blanco, J.; Schuckel, J.; Knox, J.P.; Matas, A.J.; Quesada, M.A.; et al. Elucidating the role of polygalacturonase genes in strawberry fruit softening. J Exp Bot 2020, 71, 7103–7117. [Google Scholar] [CrossRef]
- Xiao, Y.; Yi, F.; Ling, J.; Wang, Z.; Zhao, K.; Lu, N.; Qu, G.; Kong, L.; Ma, W.; Wang, J. Transcriptomics and Proteomics Reveal the Cellulose and Pectin Metabolic Processes in the Tension Wood (Non-G-Layer) of Catalpa bungei. Int J Mol Sci 2020, 21, 1686. [Google Scholar] [CrossRef]
- Zaveska Drabkova, L.; Honys, D.; Motyka, V. Evolutionary diversification of cytokinin-specific glucosyltransferases in angiosperms and enigma of missing cis-zeatin O-glucosyltransferase gene in Brassicaceae. Sci Rep 2021, 11, 7885. [Google Scholar] [CrossRef]
- Xu, Y.; Zhang, K.; Zhang, Z.; Liu, Y.; Lv, F.; Sun, P.; Gao, S.; Wang, Q.; Yu, C.; Jiang, J.; et al. A chromosome-level genome assembly for Dracaena cochinchinensis reveals the molecular basis of its longevity and formation of dragon's blood. Plant Commun 2022, 3, 100456. [Google Scholar] [CrossRef]
- Bueno, T.V.; Fontes, P.P.; Abe, V.Y.; Utiyama, A.S.; Senra, R.L.; Oliveira, L.S.; Brombini Dos Santos, A.; Ferreira, E.G.C.; Darben, L.M.; de Oliveira, A.B.; et al. A Phakopsora pachyrhizi Effector Suppresses PAMP-Triggered Immunity and Interacts with a Soybean Glucan Endo-1,3-beta-Glucosidase to Promote Virulence. Mol Plant Microbe Interact 2022, 35, 779–790. [Google Scholar] [CrossRef]
- Yu, M.; Liu, H.; Guo, L.; Zhou, T.; Shan, Y.; Xia, Z.; Li, X.; An, M.; Wu, Y. Antiviral modes of action of the novel compound GLY-15 containing pyrimidine heterocycle and moroxydine skeleton against tobacco mosaic virus. Pest Manag Sci 2022, 78, 5259–5270. [Google Scholar] [CrossRef] [PubMed]
- Singh, L.; Coronejo, S.; Pruthi, R.; Chapagain, S.; Subudhi, P.K. Integration of QTL Mapping and Whole Genome Sequencing Identifies Candidate Genes for Alkalinity Tolerance in Rice (Oryza sativa). Int J Mol Sci 2022, 23, 11791. [Google Scholar] [CrossRef] [PubMed]
- Ye, S.Q.; Zou, Y.; Zheng, Q.W.; Liu, Y.L.; Li, R.R.; Lin, J.F.; Guo, L.Q. TMT-MS/MS proteomic analysis of the carbohydrate-active enzymes in the fruiting body of Pleurotus tuoliensis during storage. J Sci Food Agric 2021, 101, 1879–1891. [Google Scholar] [CrossRef] [PubMed]
- Chen, J.; Hu, L.; Sun, L.; Lin, B.; Huang, K.; Zhuo, K.; Liao, J. A novel Meloidogyne graminicola effector, MgMO237, interacts with multiple host defence-related proteins to manipulate plant basal immunity and promote parasitism. Mol Plant Pathol 2018, 19, 1942–1955. [Google Scholar] [CrossRef] [PubMed]
- Yuan, Y.; Yang, X.; Feng, M.; Ding, H.; Khan, M.T.; Zhang, J.; Zhang, M. Genome-wide analysis of R2R3-MYB transcription factors family in the autopolyploid Saccharum spontaneum: an exploration of dominance expression and stress response. BMC Genomics 2021, 22, 622. [Google Scholar] [CrossRef] [PubMed]
- Li, M.; Zhou, J.; Lang, X.; Han, D.; Hu, Y.; Ding, Y.; Wang, G.; Guo, J.; Shi, L. Integrating transcriptomic and metabolomic analysis in roots of wild soybean seedlings in response to low-phosphorus stress. Front Plant Sci 2022, 13, 1006806. [Google Scholar] [CrossRef] [PubMed]
- Lv, Y.; Ma, J.; Wang, Y.; Wang, Q.; Lu, X.; Hu, H.; Qian, Q.; Guo, L.; Shang, L. Loci and Natural Alleles for Low-Nitrogen-Induced Growth Response Revealed by the Genome-Wide Association Study Analysis in Rice (Oryza sativa L.). Front Plant Sci 2021, 12, 770736. [Google Scholar] [CrossRef]
- Yang, T.; Li, C.; Shen, J.; Zhuang, B.; Wen, Y. [Genome-wide identification and analysis of the TCP gene family in eggplant (Solanum melongena L.)]. Sheng Wu Gong Cheng Xue Bao 2022, 38, 2974–2988. [Google Scholar] [CrossRef]
- Yu, L.; Chen, Q.; Zheng, J.; Xu, F.; Ye, J.; Zhang, W.; Liao, Y.; Yang, X. Genome-wide identification and expression pattern analysis of the TCP transcription factor family in Ginkgo biloba. Plant Signal Behav 2022, 17, 1994248. [Google Scholar] [CrossRef]
Figure 1.
Venn diagram of up and down regulated DEGs in different tissues of potato at different developmental stages. Different developmental stages: seedling stage, tuber formation stage, tuber expansion stage. (A) Venn diagram of DEGs in potato roots at different developmental stages. (B) Venn diagram of DEGs in potato stems at different developmental stages. (C) Venn diagram of DEGs in leaves at different developmental stages. SS: Seedling stage; TFS: Tuber formation stage; TES: Tuber expansion stage; up: Up-regulation; down: Down-regulation.
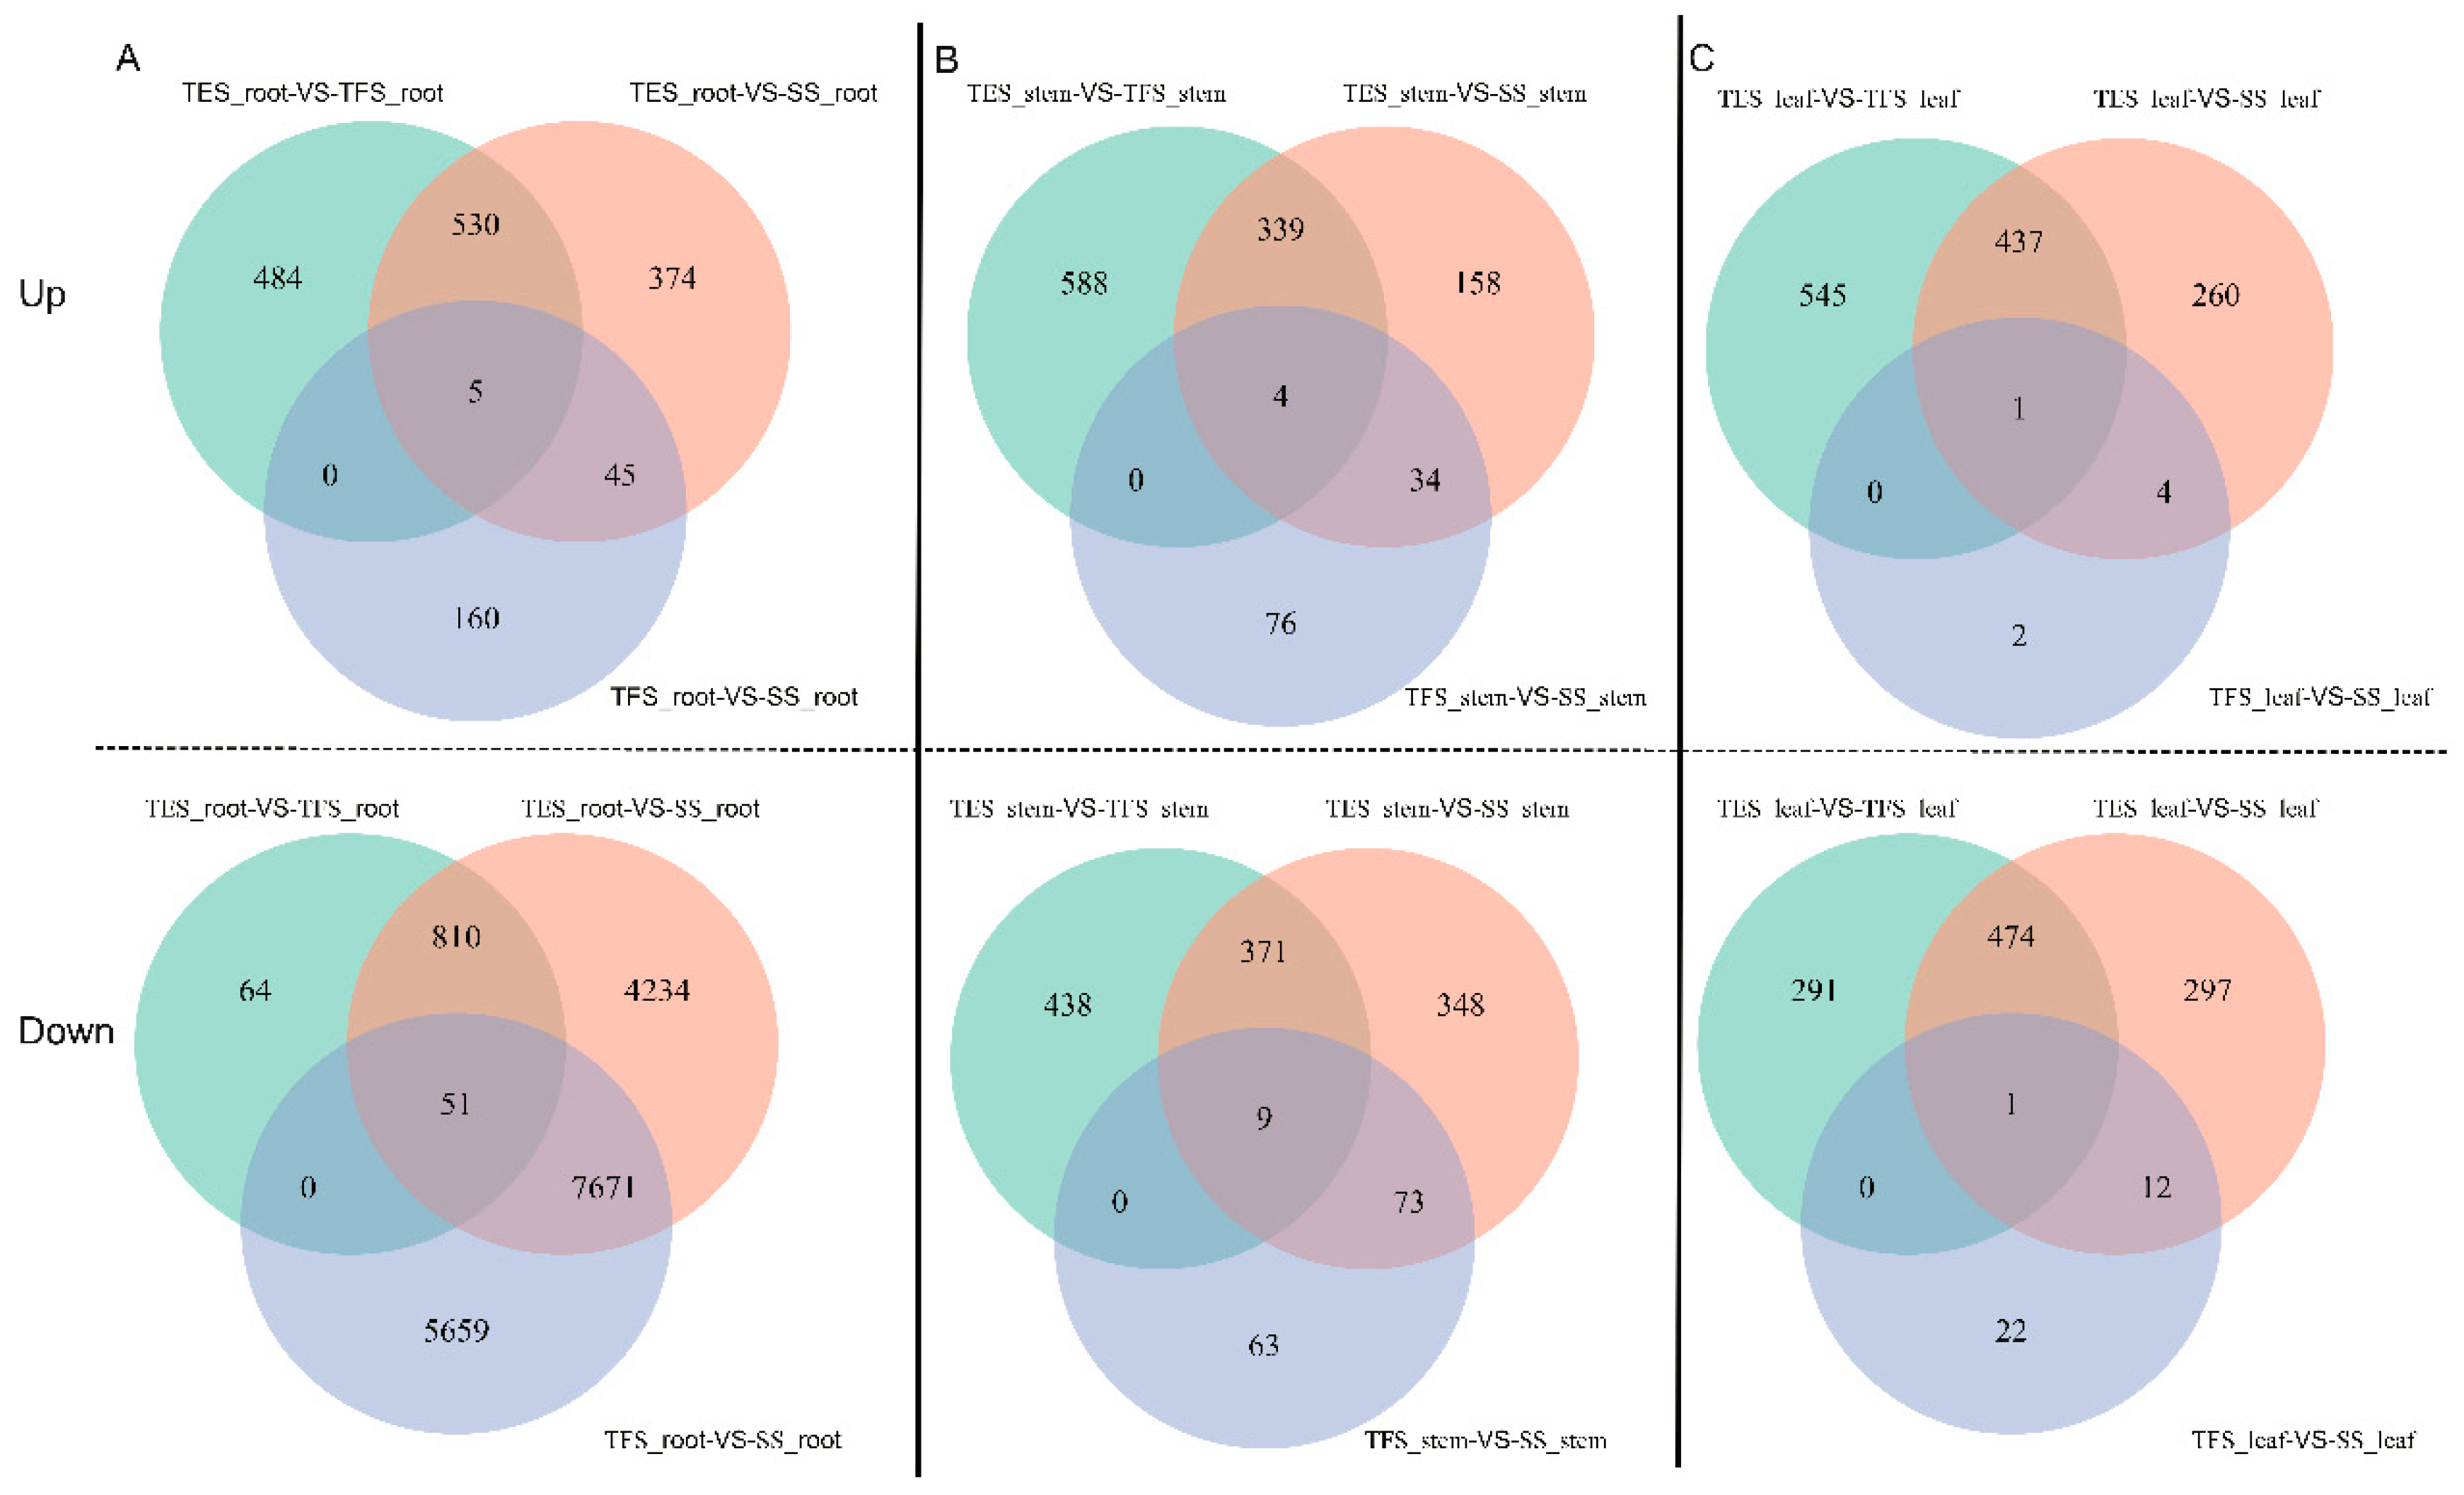
Figure 2.
Phylogenetic dendrogram of all 27 samples. SS: Seedling stage; TFS: Tuber formation stage; TES: Tuber expansion stage.
Figure 2.
Phylogenetic dendrogram of all 27 samples. SS: Seedling stage; TFS: Tuber formation stage; TES: Tuber expansion stage.
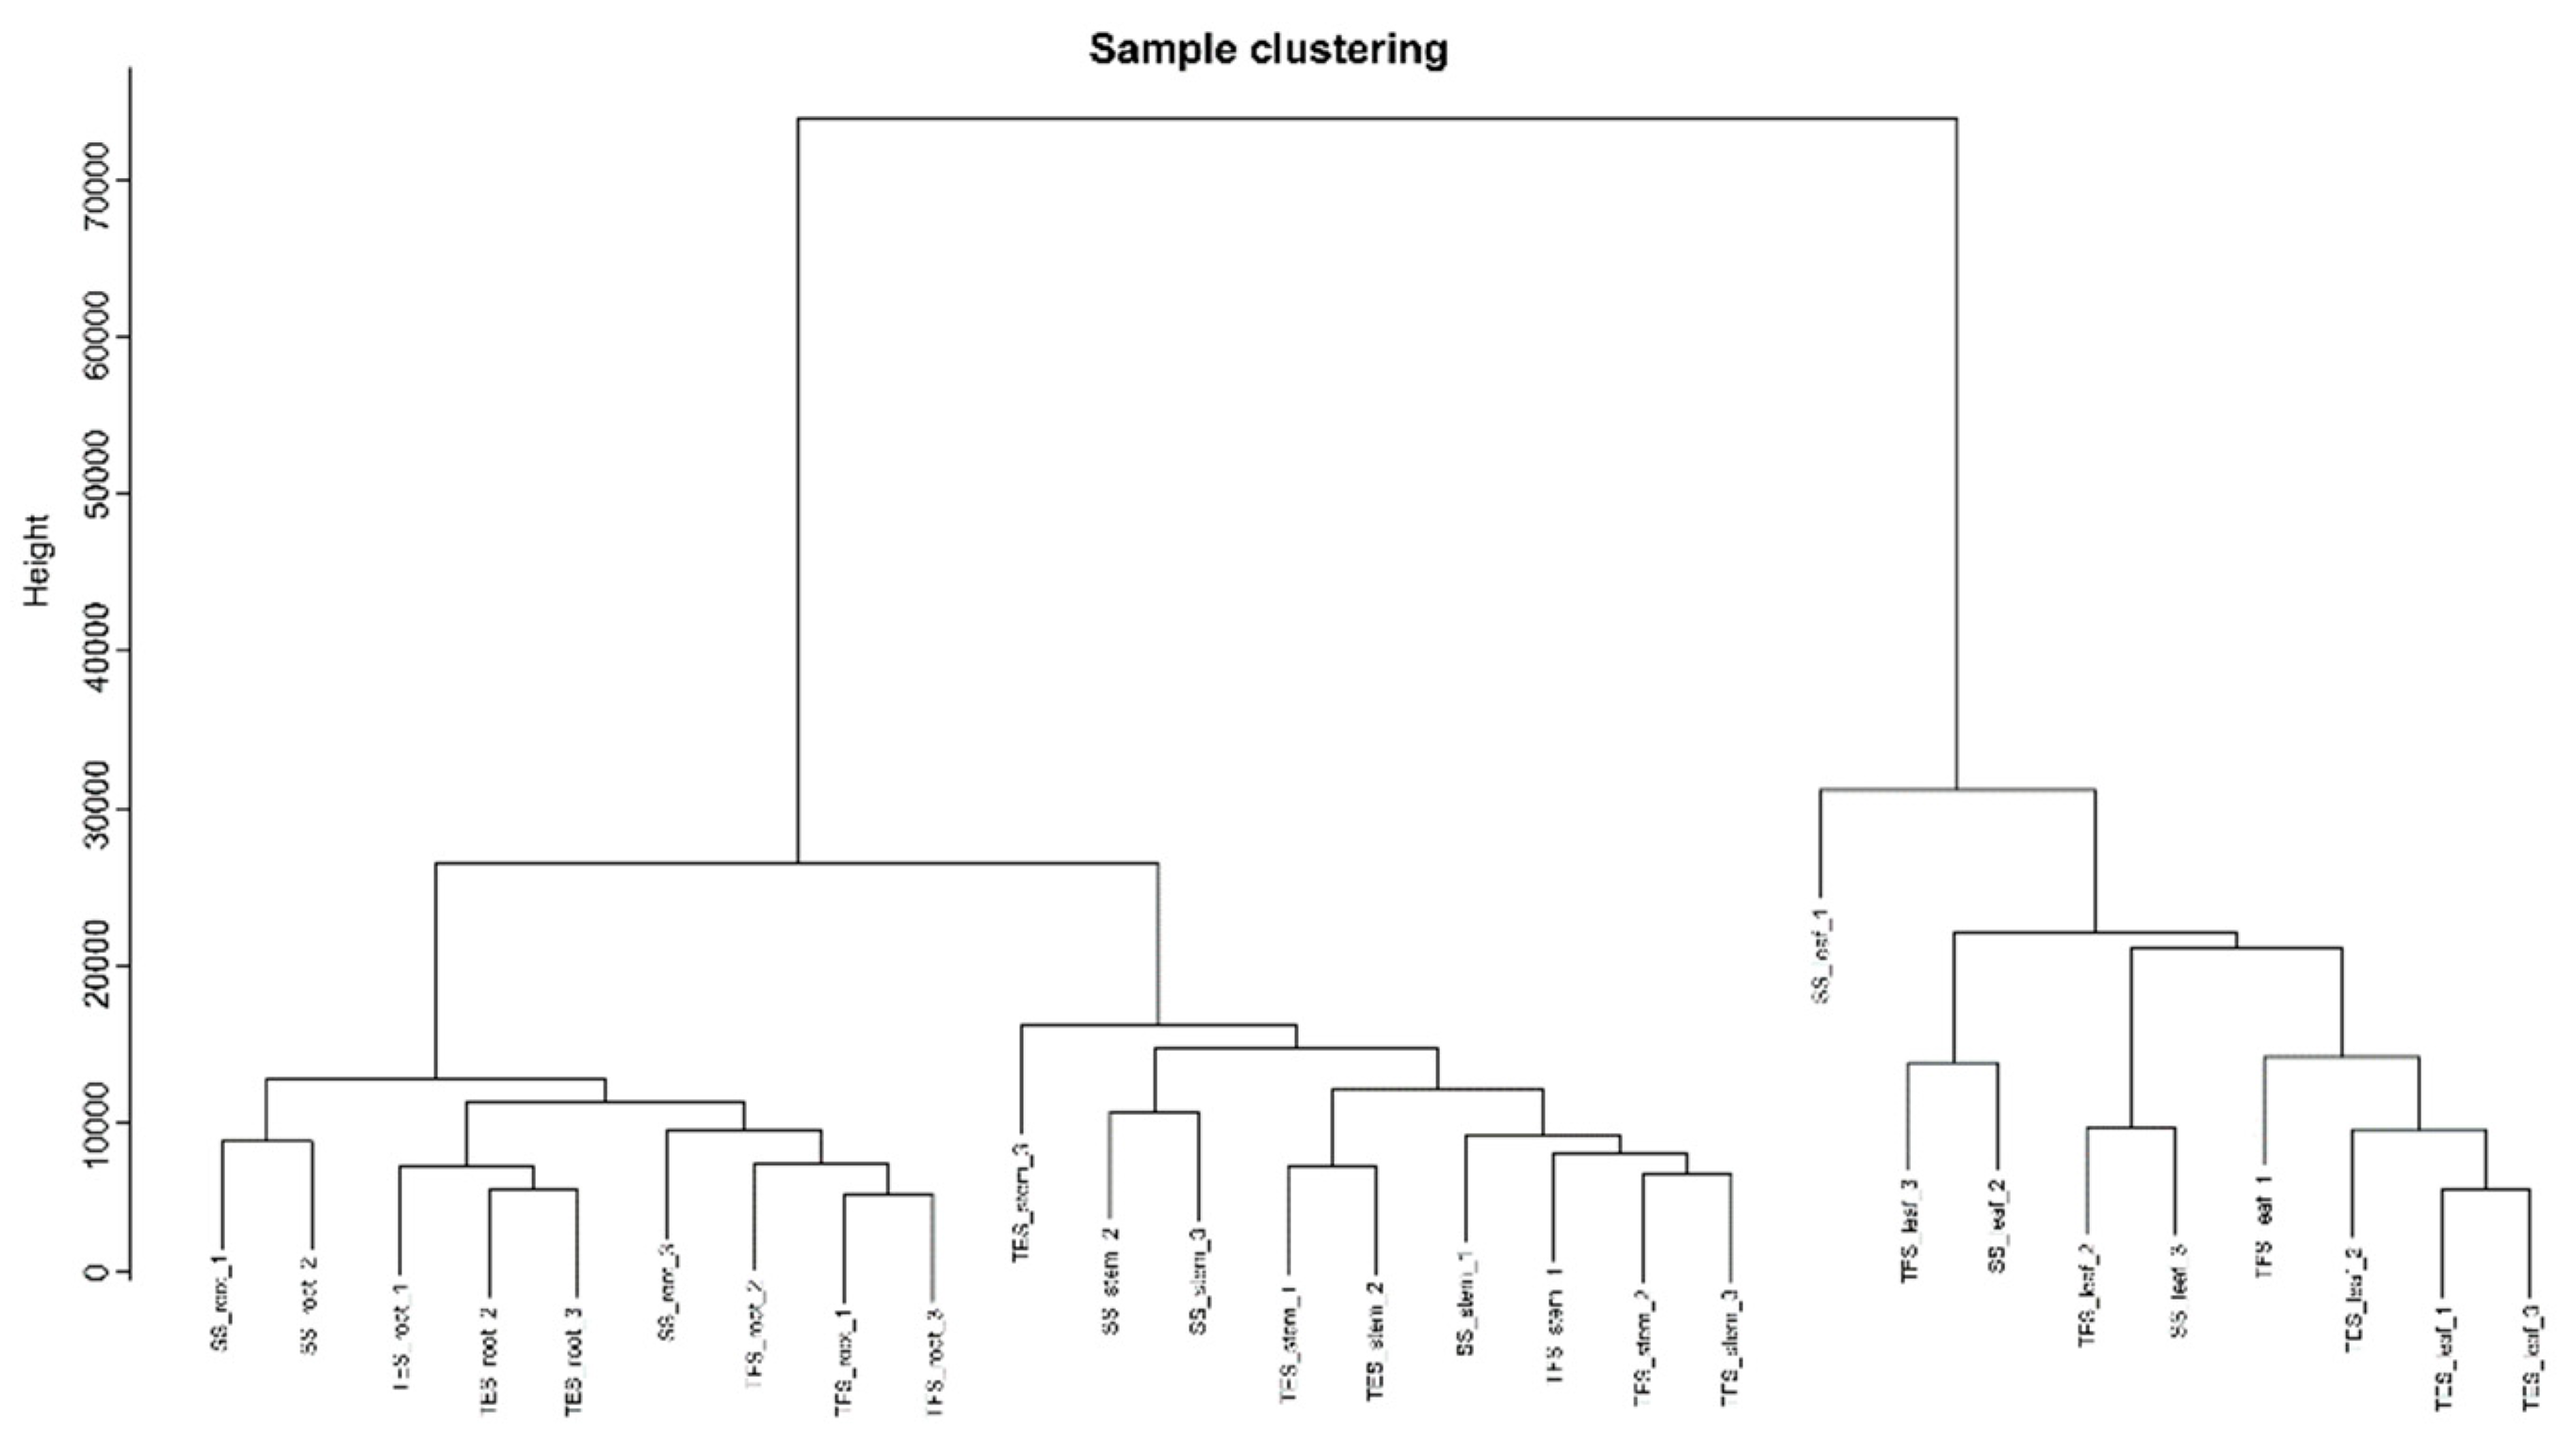
Figure 3.
Determination of soft thresholds for gene co-expression networks and detection of modules for gene cluster dendrograms. (A) Soft threshold determination. (B) Detection of modules by gene cluster dendrogram.
Figure 3.
Determination of soft thresholds for gene co-expression networks and detection of modules for gene cluster dendrograms. (A) Soft threshold determination. (B) Detection of modules by gene cluster dendrogram.
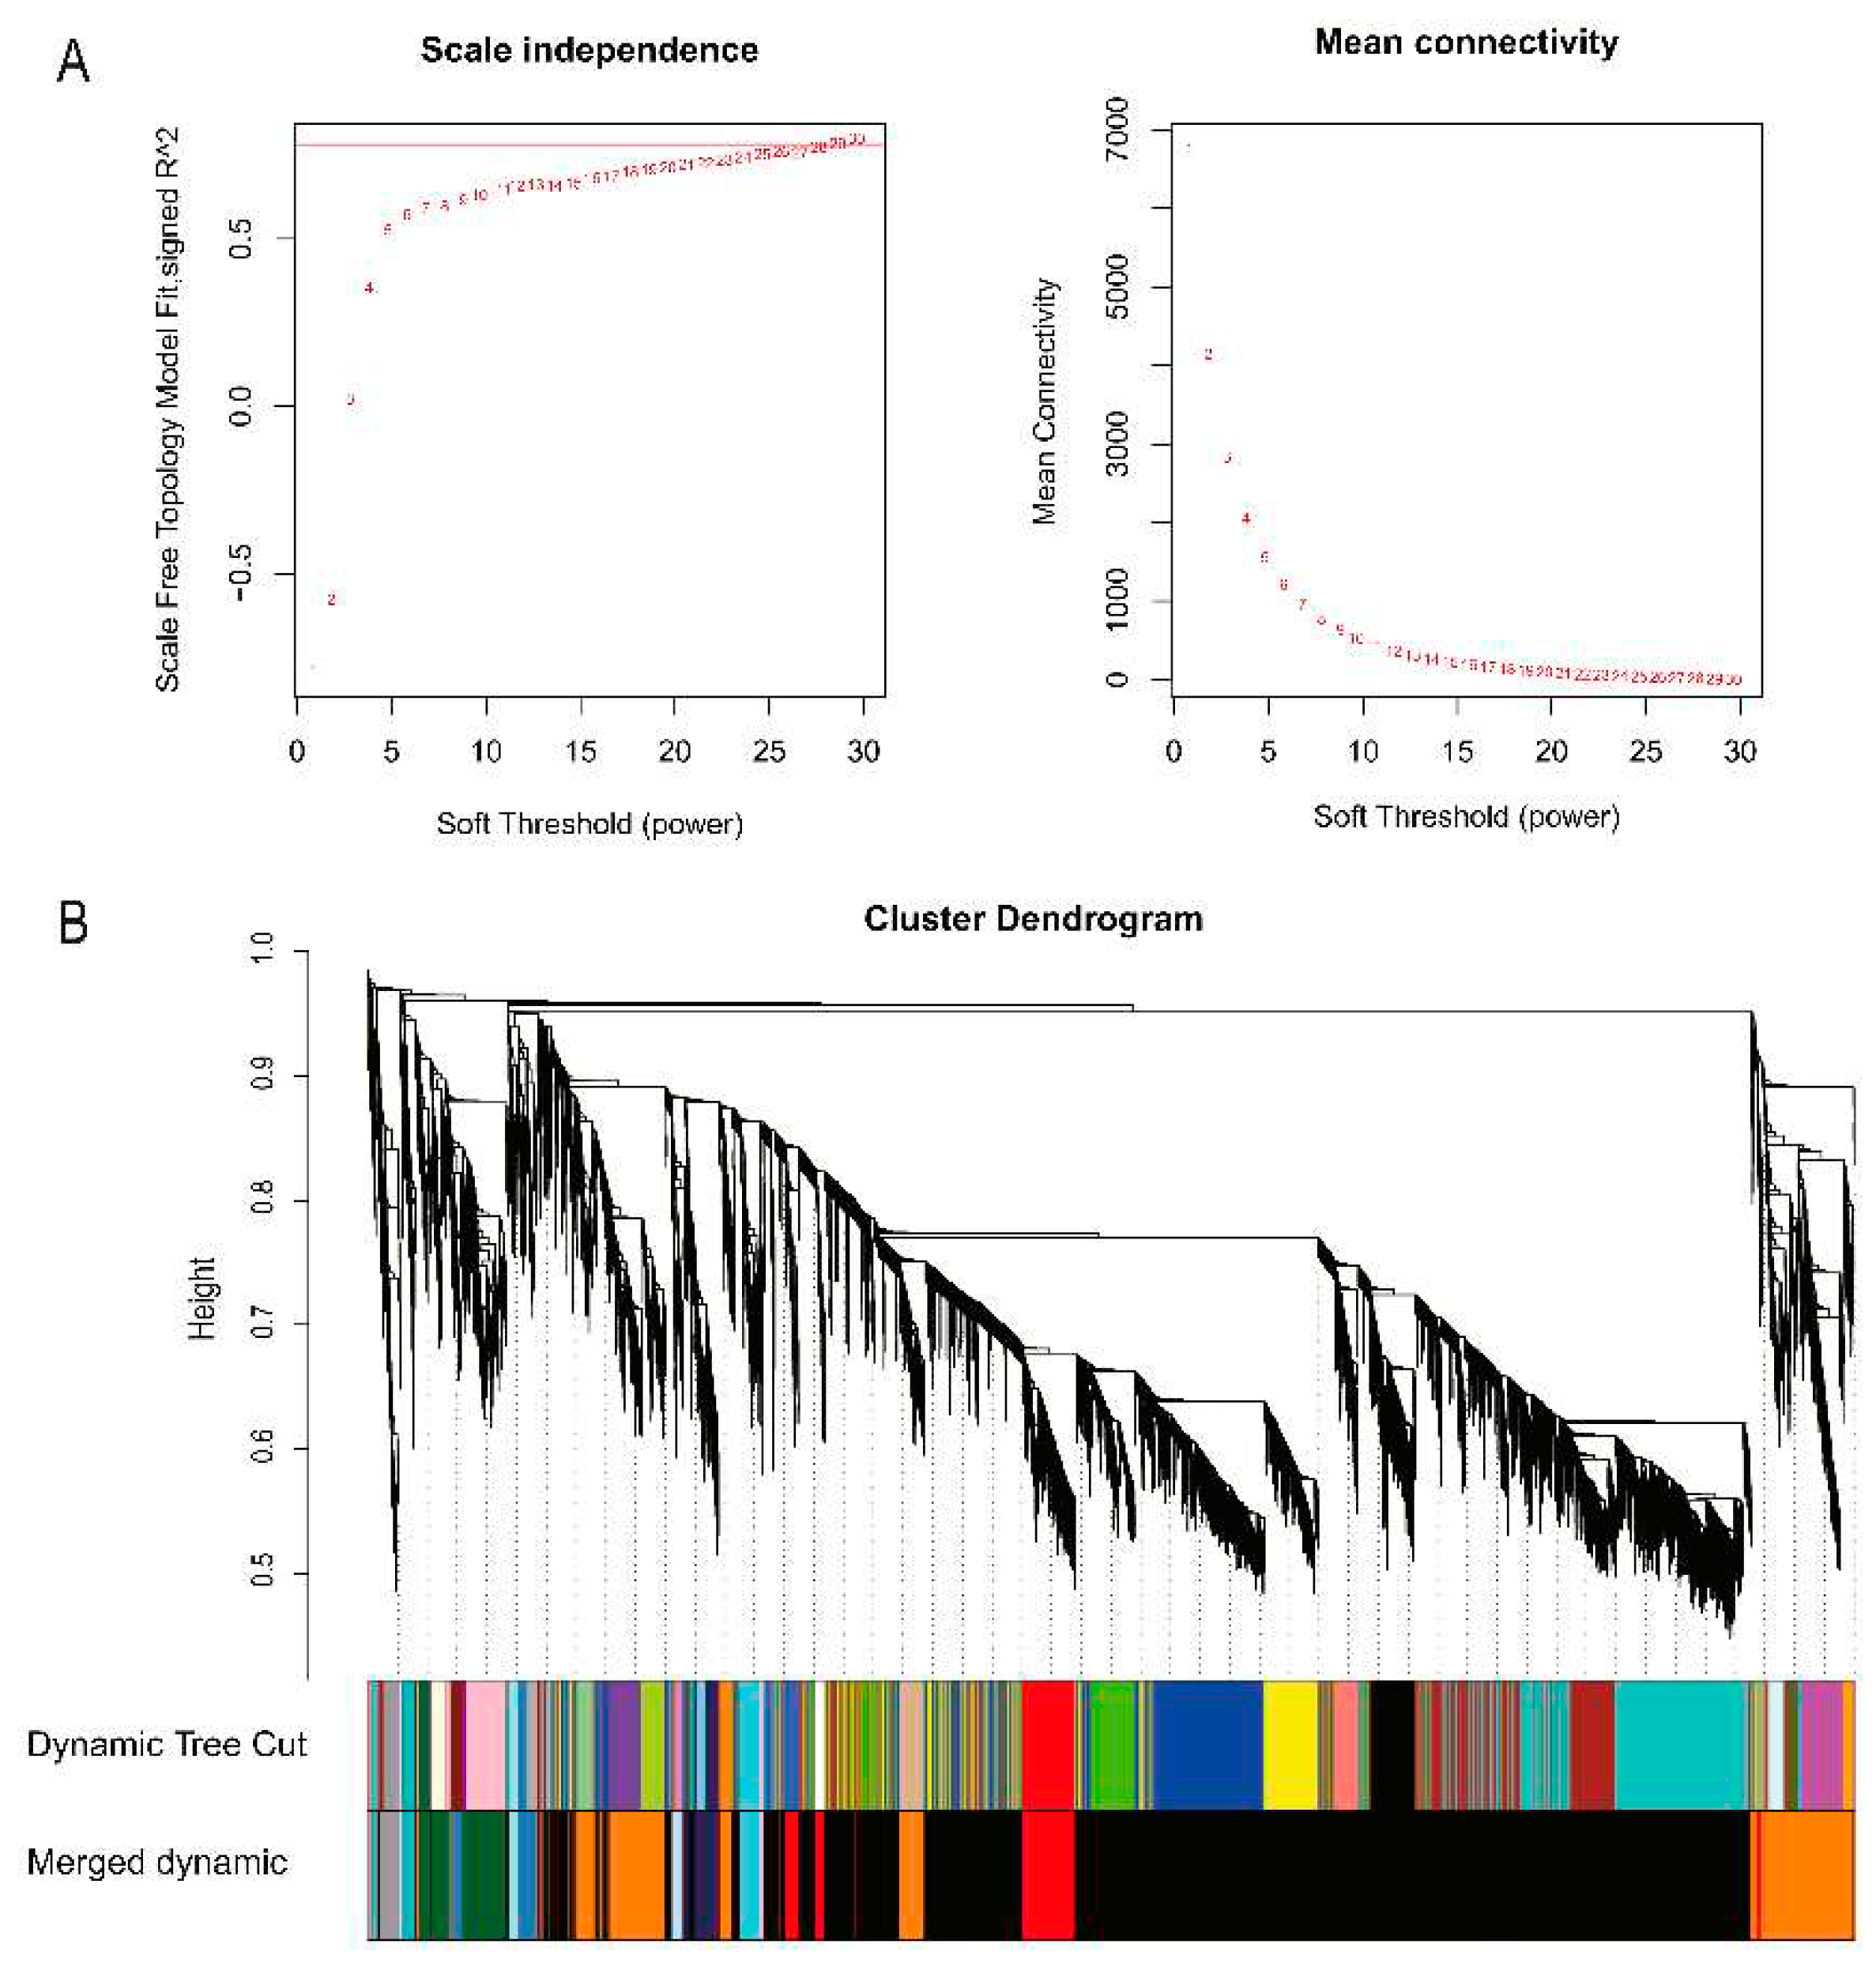
Figure 4.
Correlation analysis between modules and traits revealed by Pearson correlation coefficient. Leftmost co-expression modules are shown in different colors. Numbers in the figure indicate the correlation between the module and the trait, and numbers in parentheses are the correlation p-values. SS: Seedling stage; TFS: Tuber formation stage; TES: Tuber expansion stage.
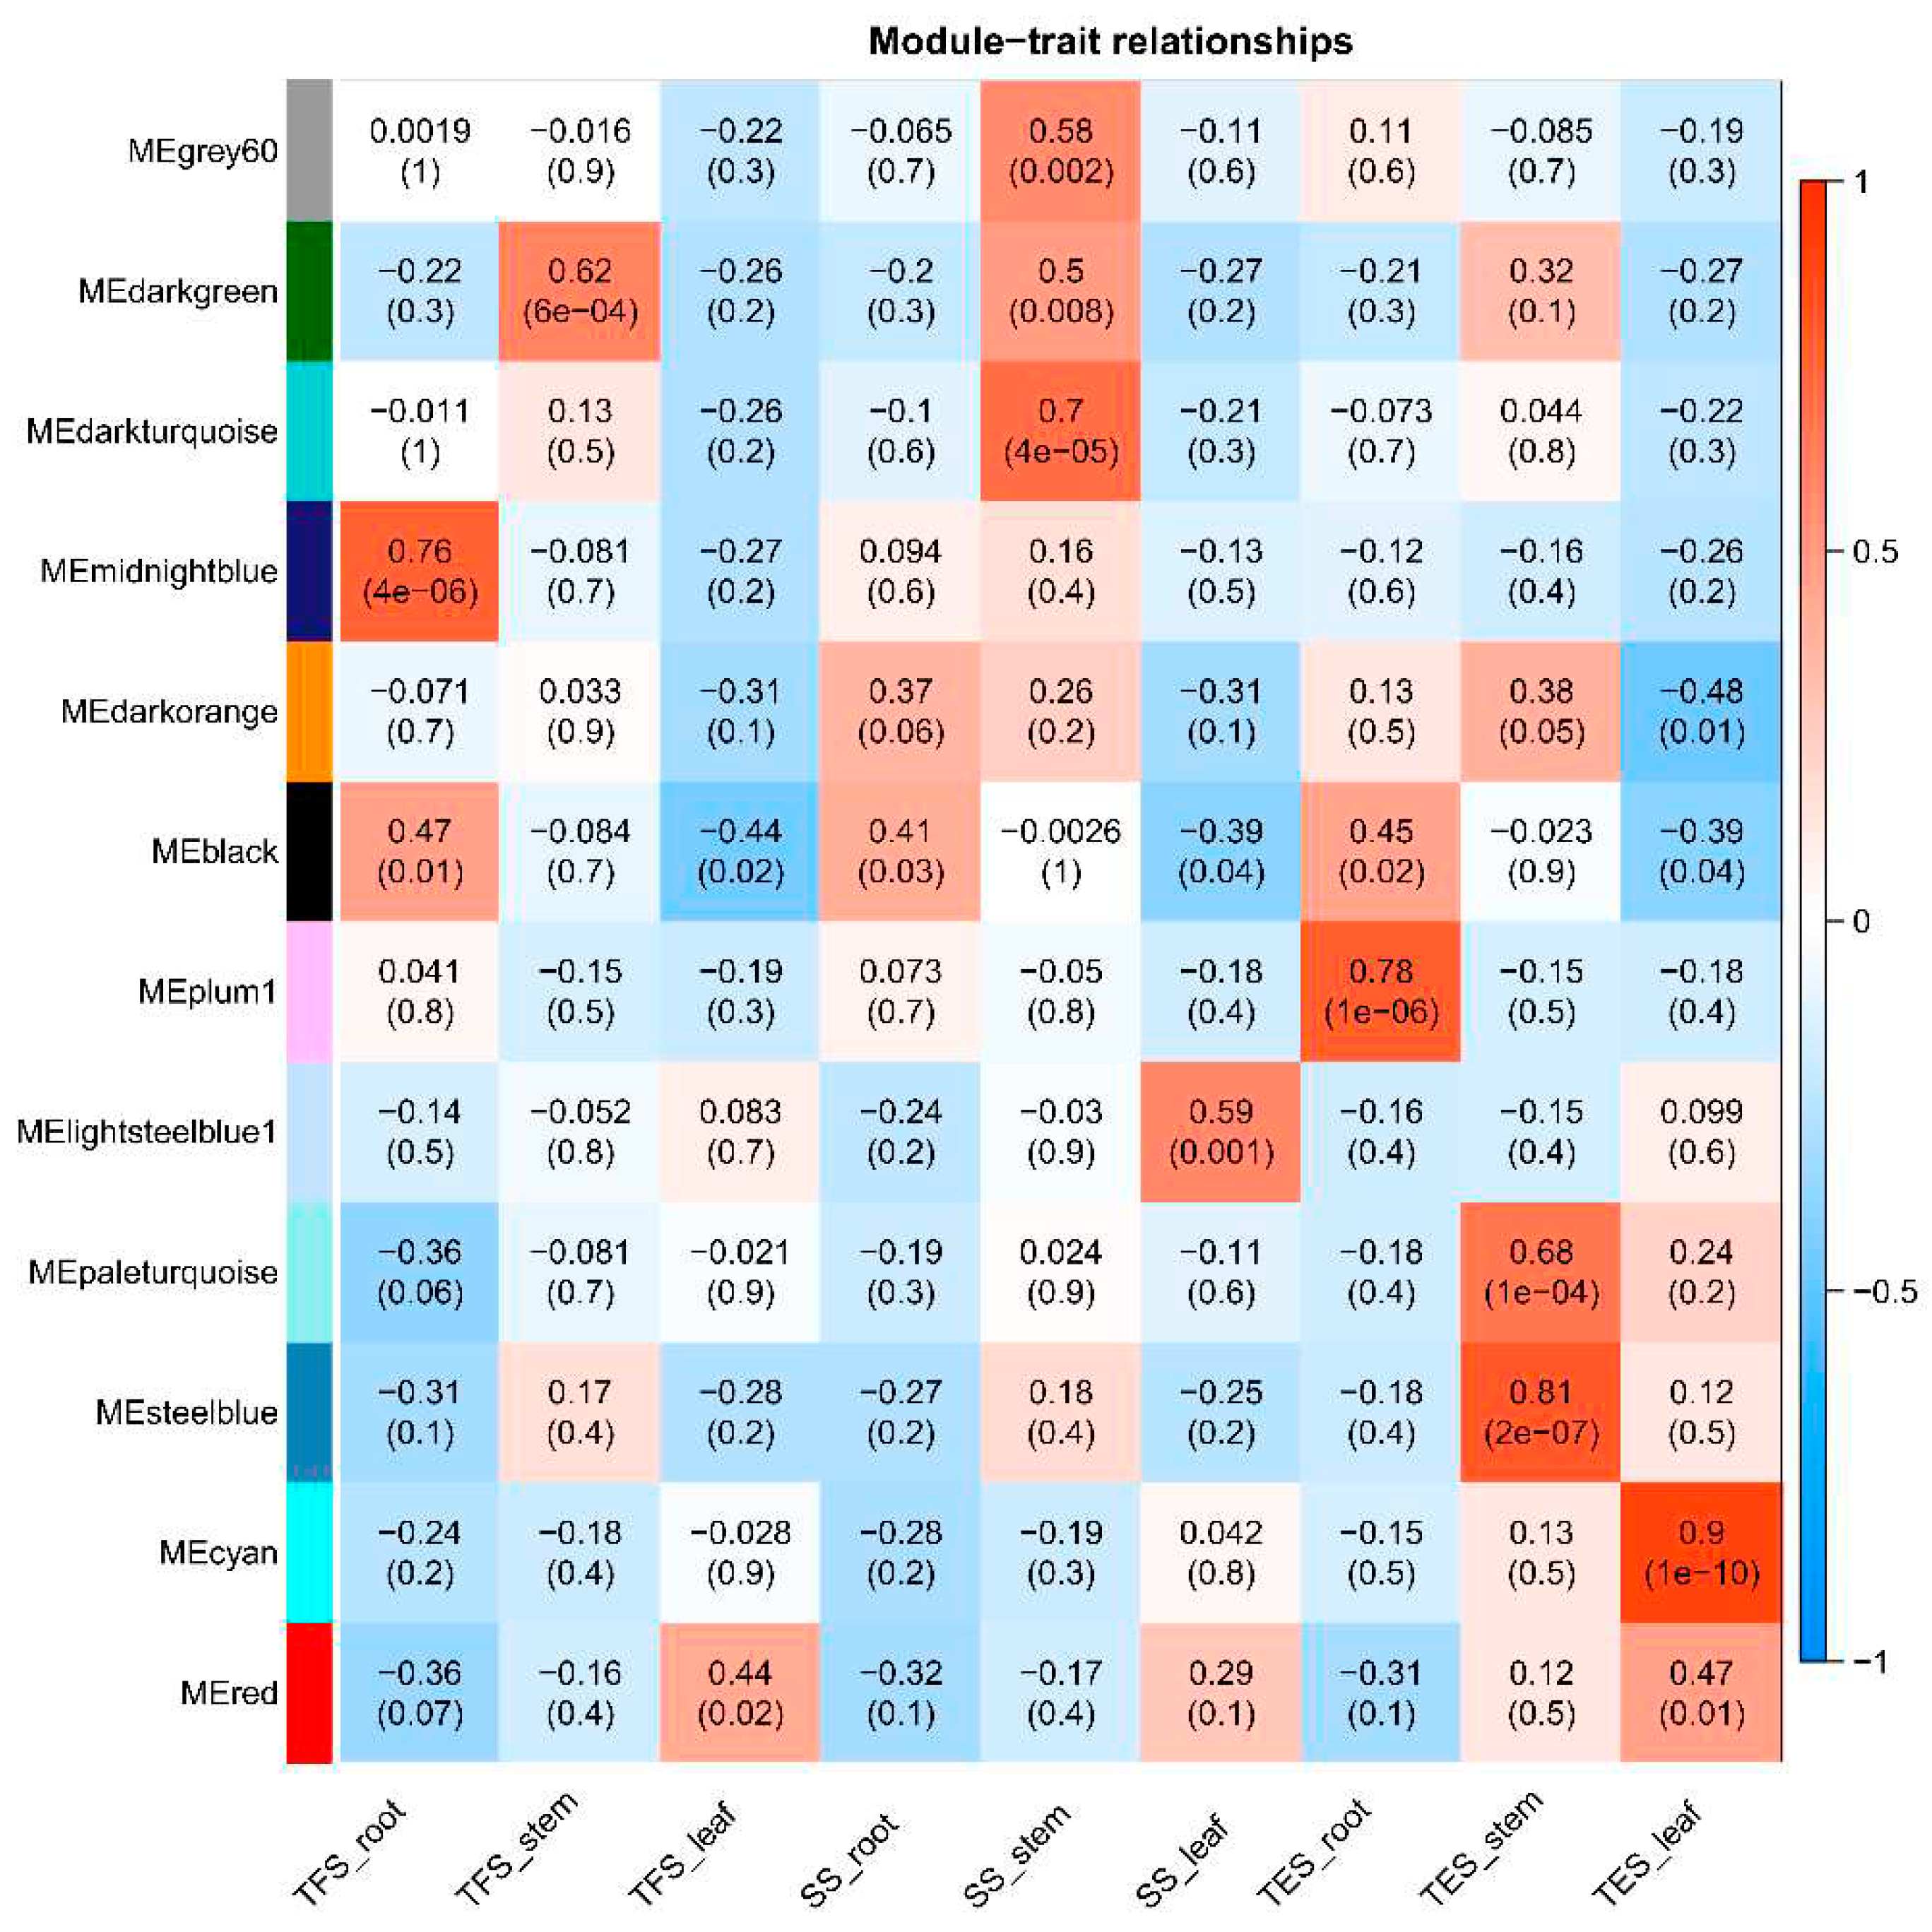
Figure 5.
Expression patterns of GO enrichment, KEGG enrichment, gene co-expression network, and hub genes in the gray60 module. (A) GO enrichment analysis. (B) KEGG enrichment analysis. (C) Gene co-expression network and hub genes. The figure shows top 30 hub genes with high connectivity, with the redder color representing higher connectivity. (D) Hub gene expression pattern in potato stems at seedling, tuber formation and tuber expansion stages. SS: Seedling stage; TFS: Tuber formation stage; TES: Tuber expansion stage.
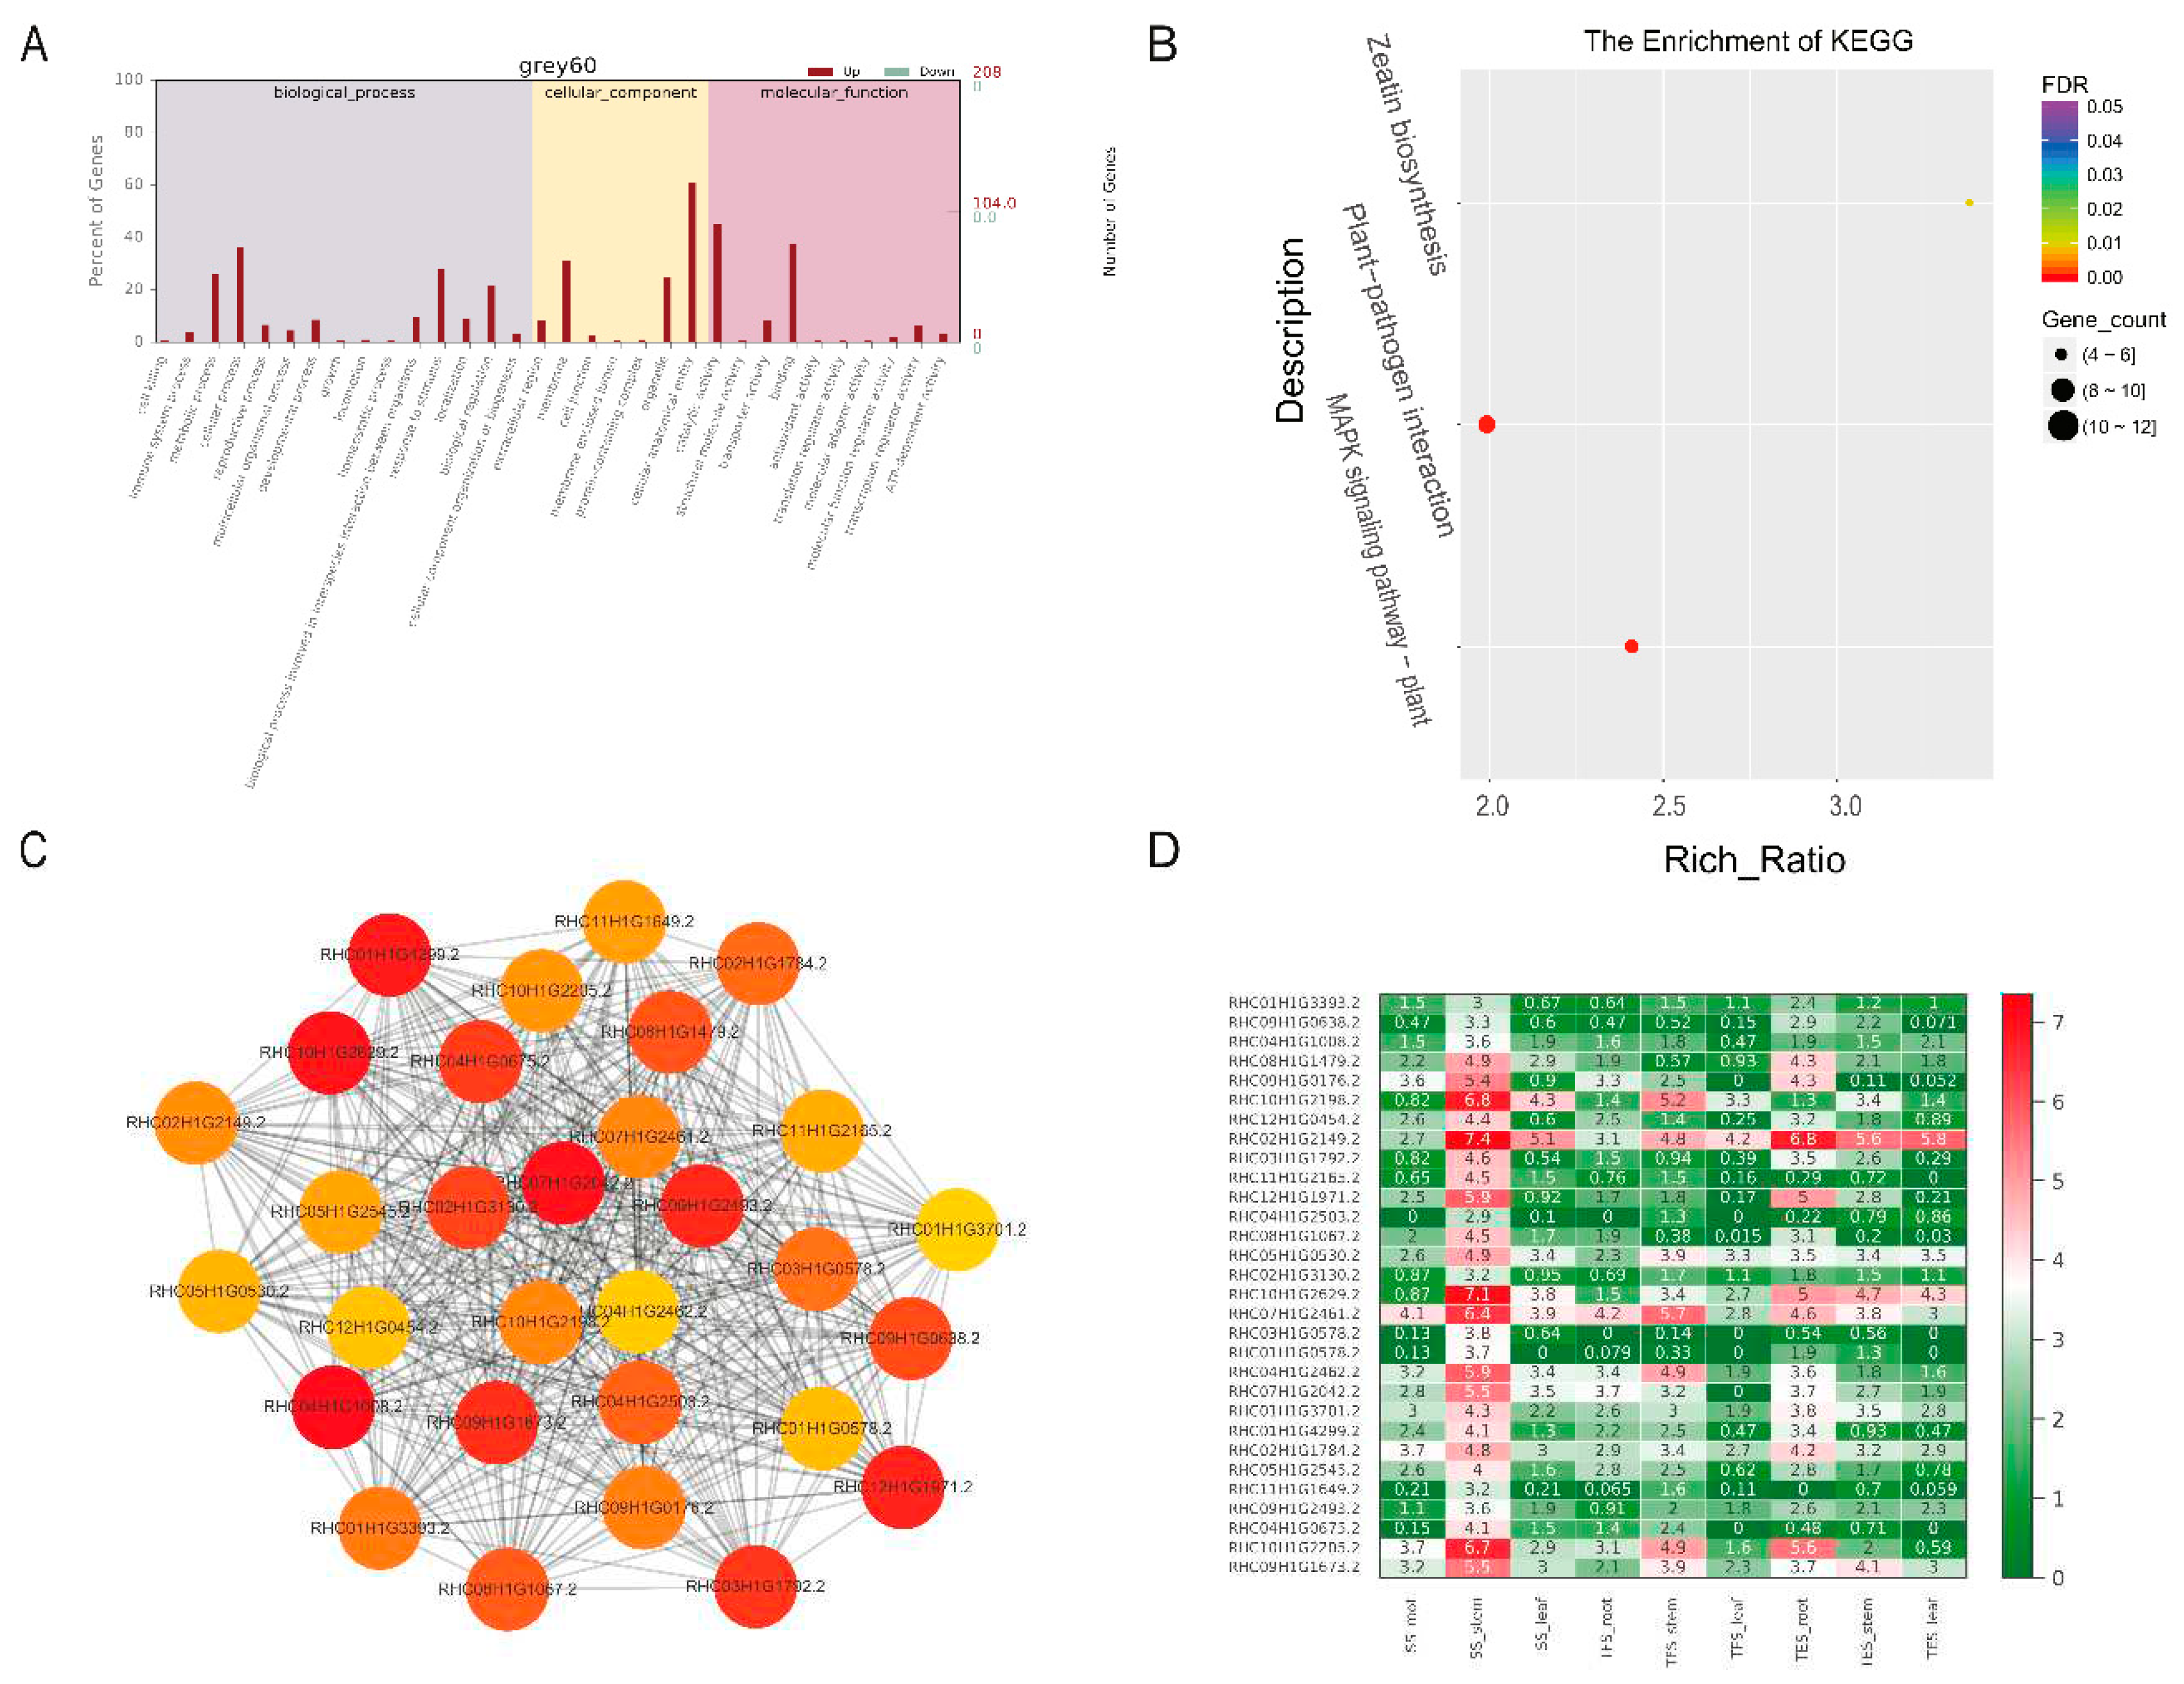
Figure 6.
Expression patterns of GO enrichment, KEGG enrichment, gene co-expression network, and hub genes in darkgreen module. (A) GO enrichment analysis. (B) KEGG enrichment analysis. (C) Gene co-expression network and hub genes. The figure shows top 30 hub genes with the highest connectivity, with the redder color representing higher connectivity. (D) Expression patterns of hub genes in potato stems at seedling stage, tuber formation stage and tuber expansion stage. SS: Seedling stage; TFS: Tuber formation stage; TES: Tuber expansion stage.
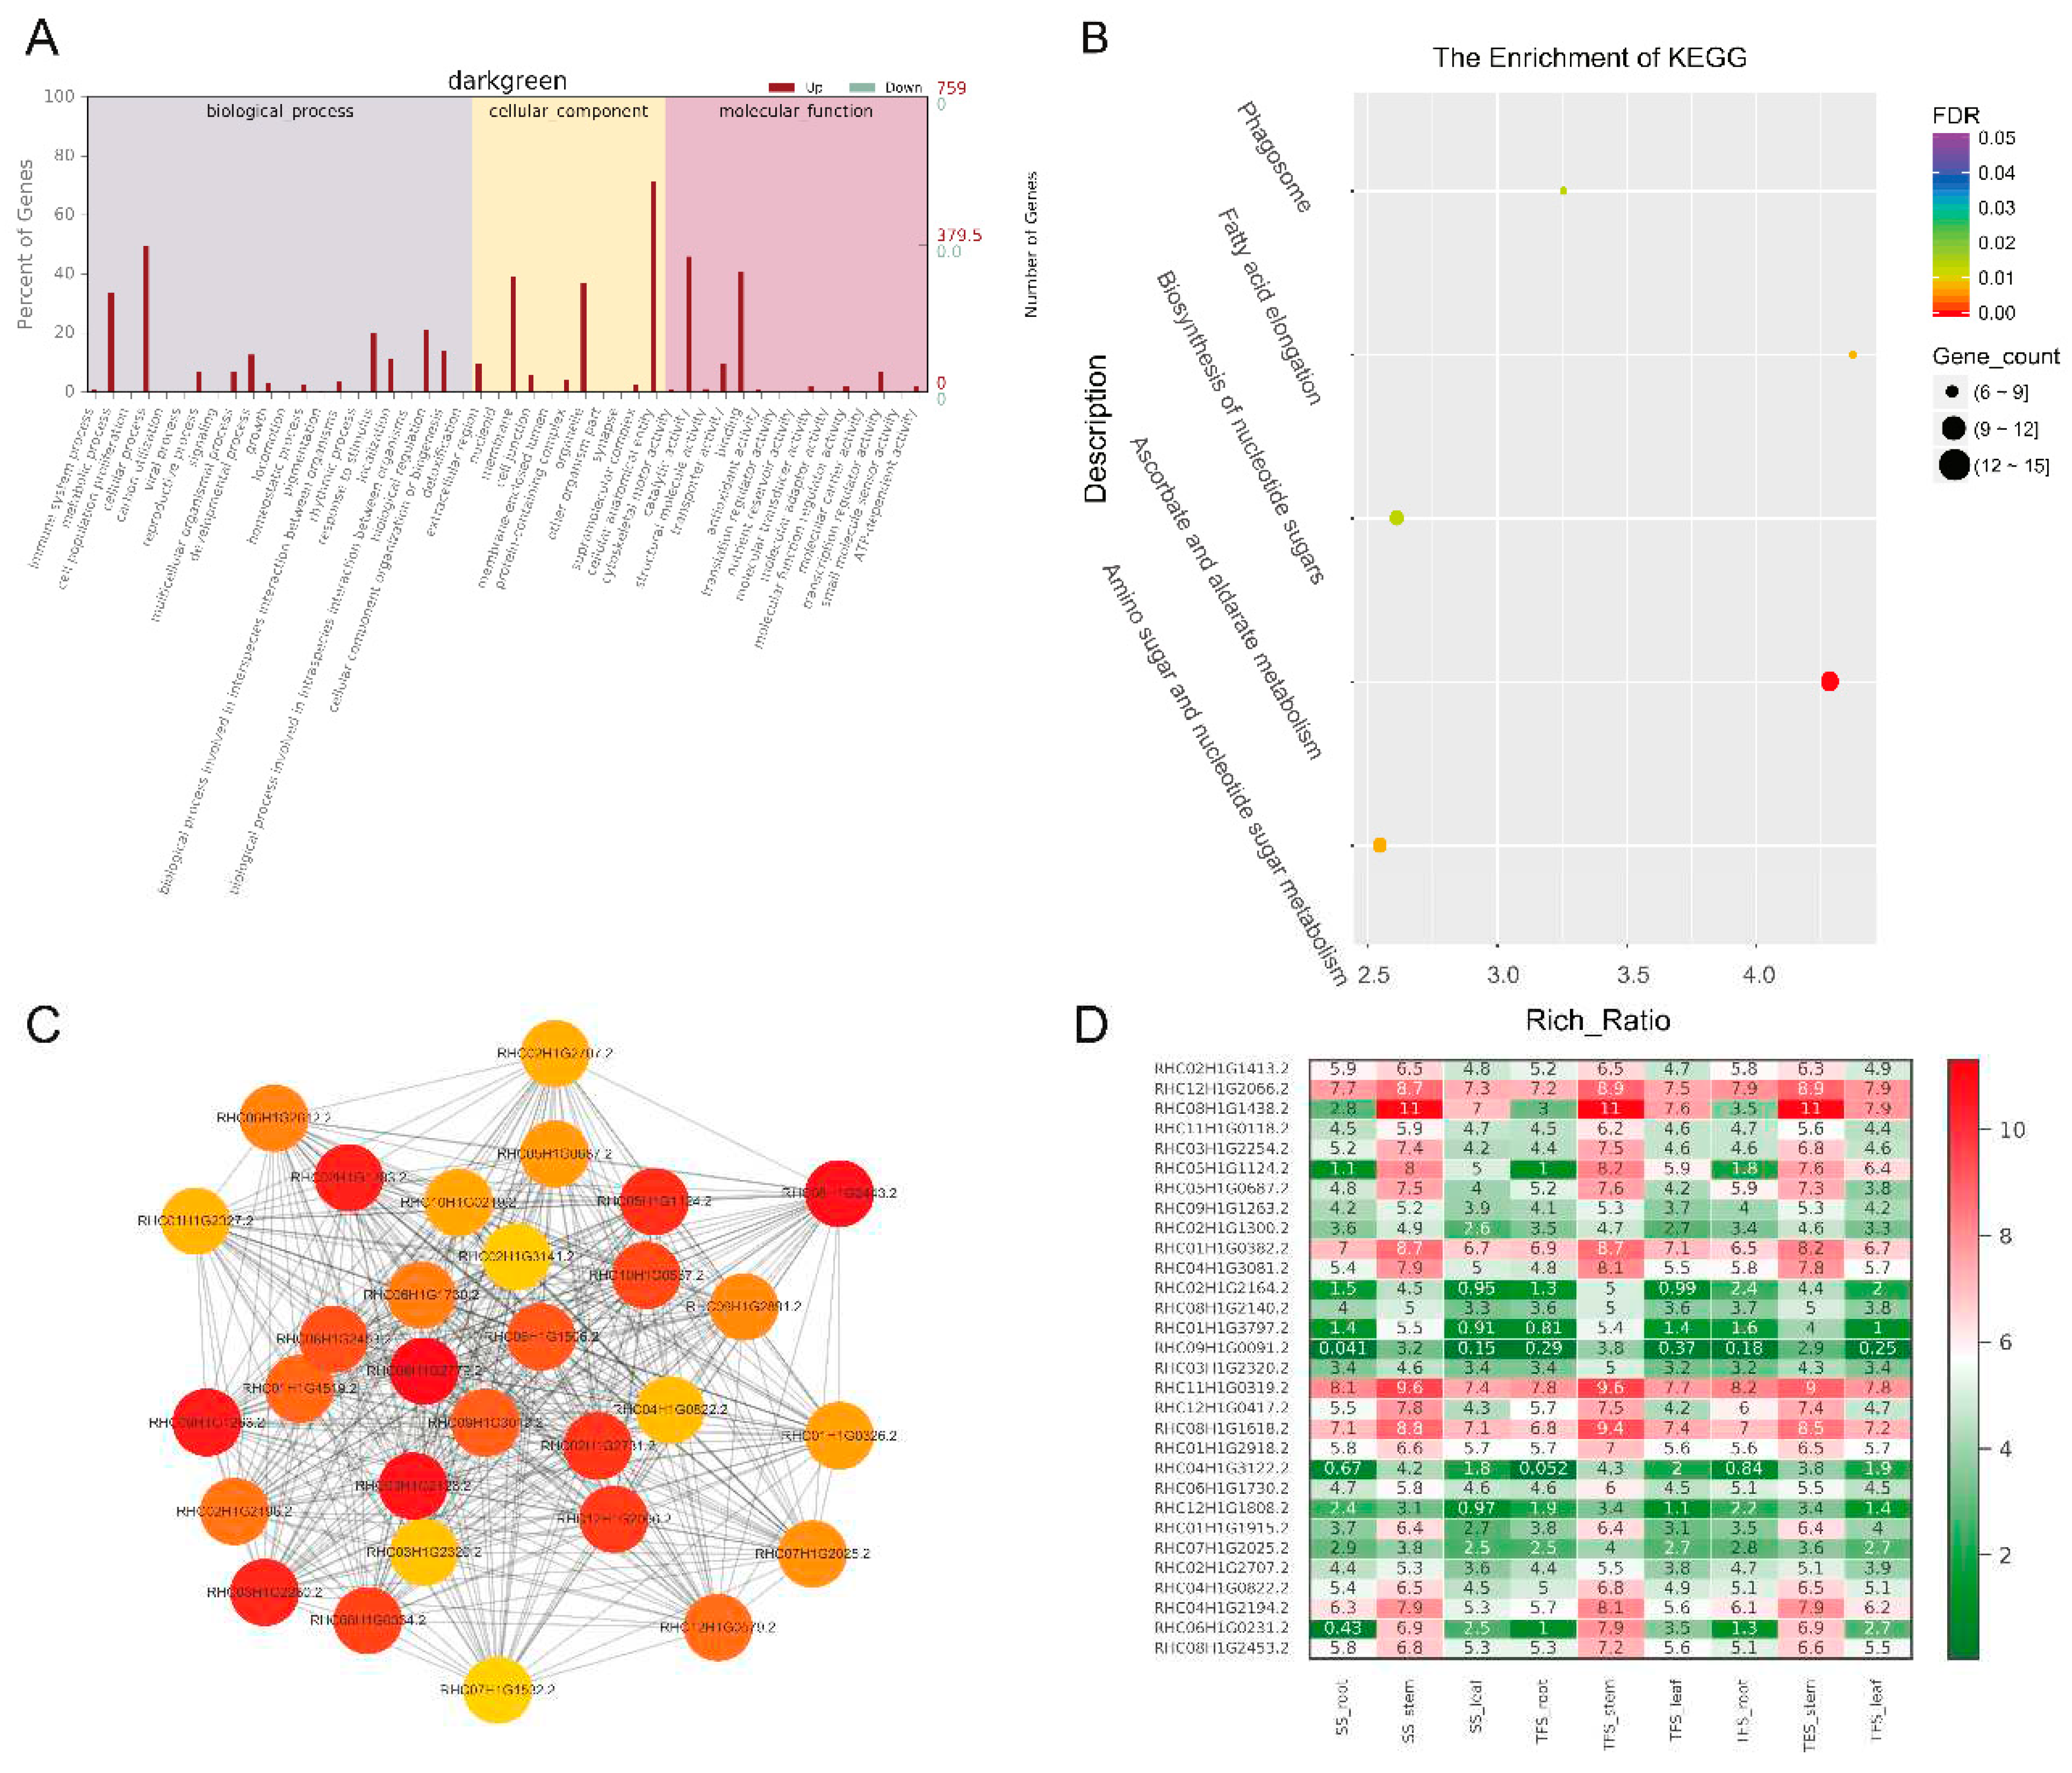
Figure 7.
GO enrichment, KEGG enrichment, gene co-expression network, and expression patterns of hub genes in steelblue module. (A) GO functional enrichment analysis. (B) KEGG functional enrichment analysis. (C) Gene co-expression network and hub genes. The figure shows top 30 hub genes with the highest connectivity, with the redder color representing higher connectivity. (D) Expression patterns of hub genes in potato stems at seedling stage, tuber formation stage and tuber expansion stage. SS: Seedling stage; TFS: Tuber formation stage; TES: Tuber expansion stage.
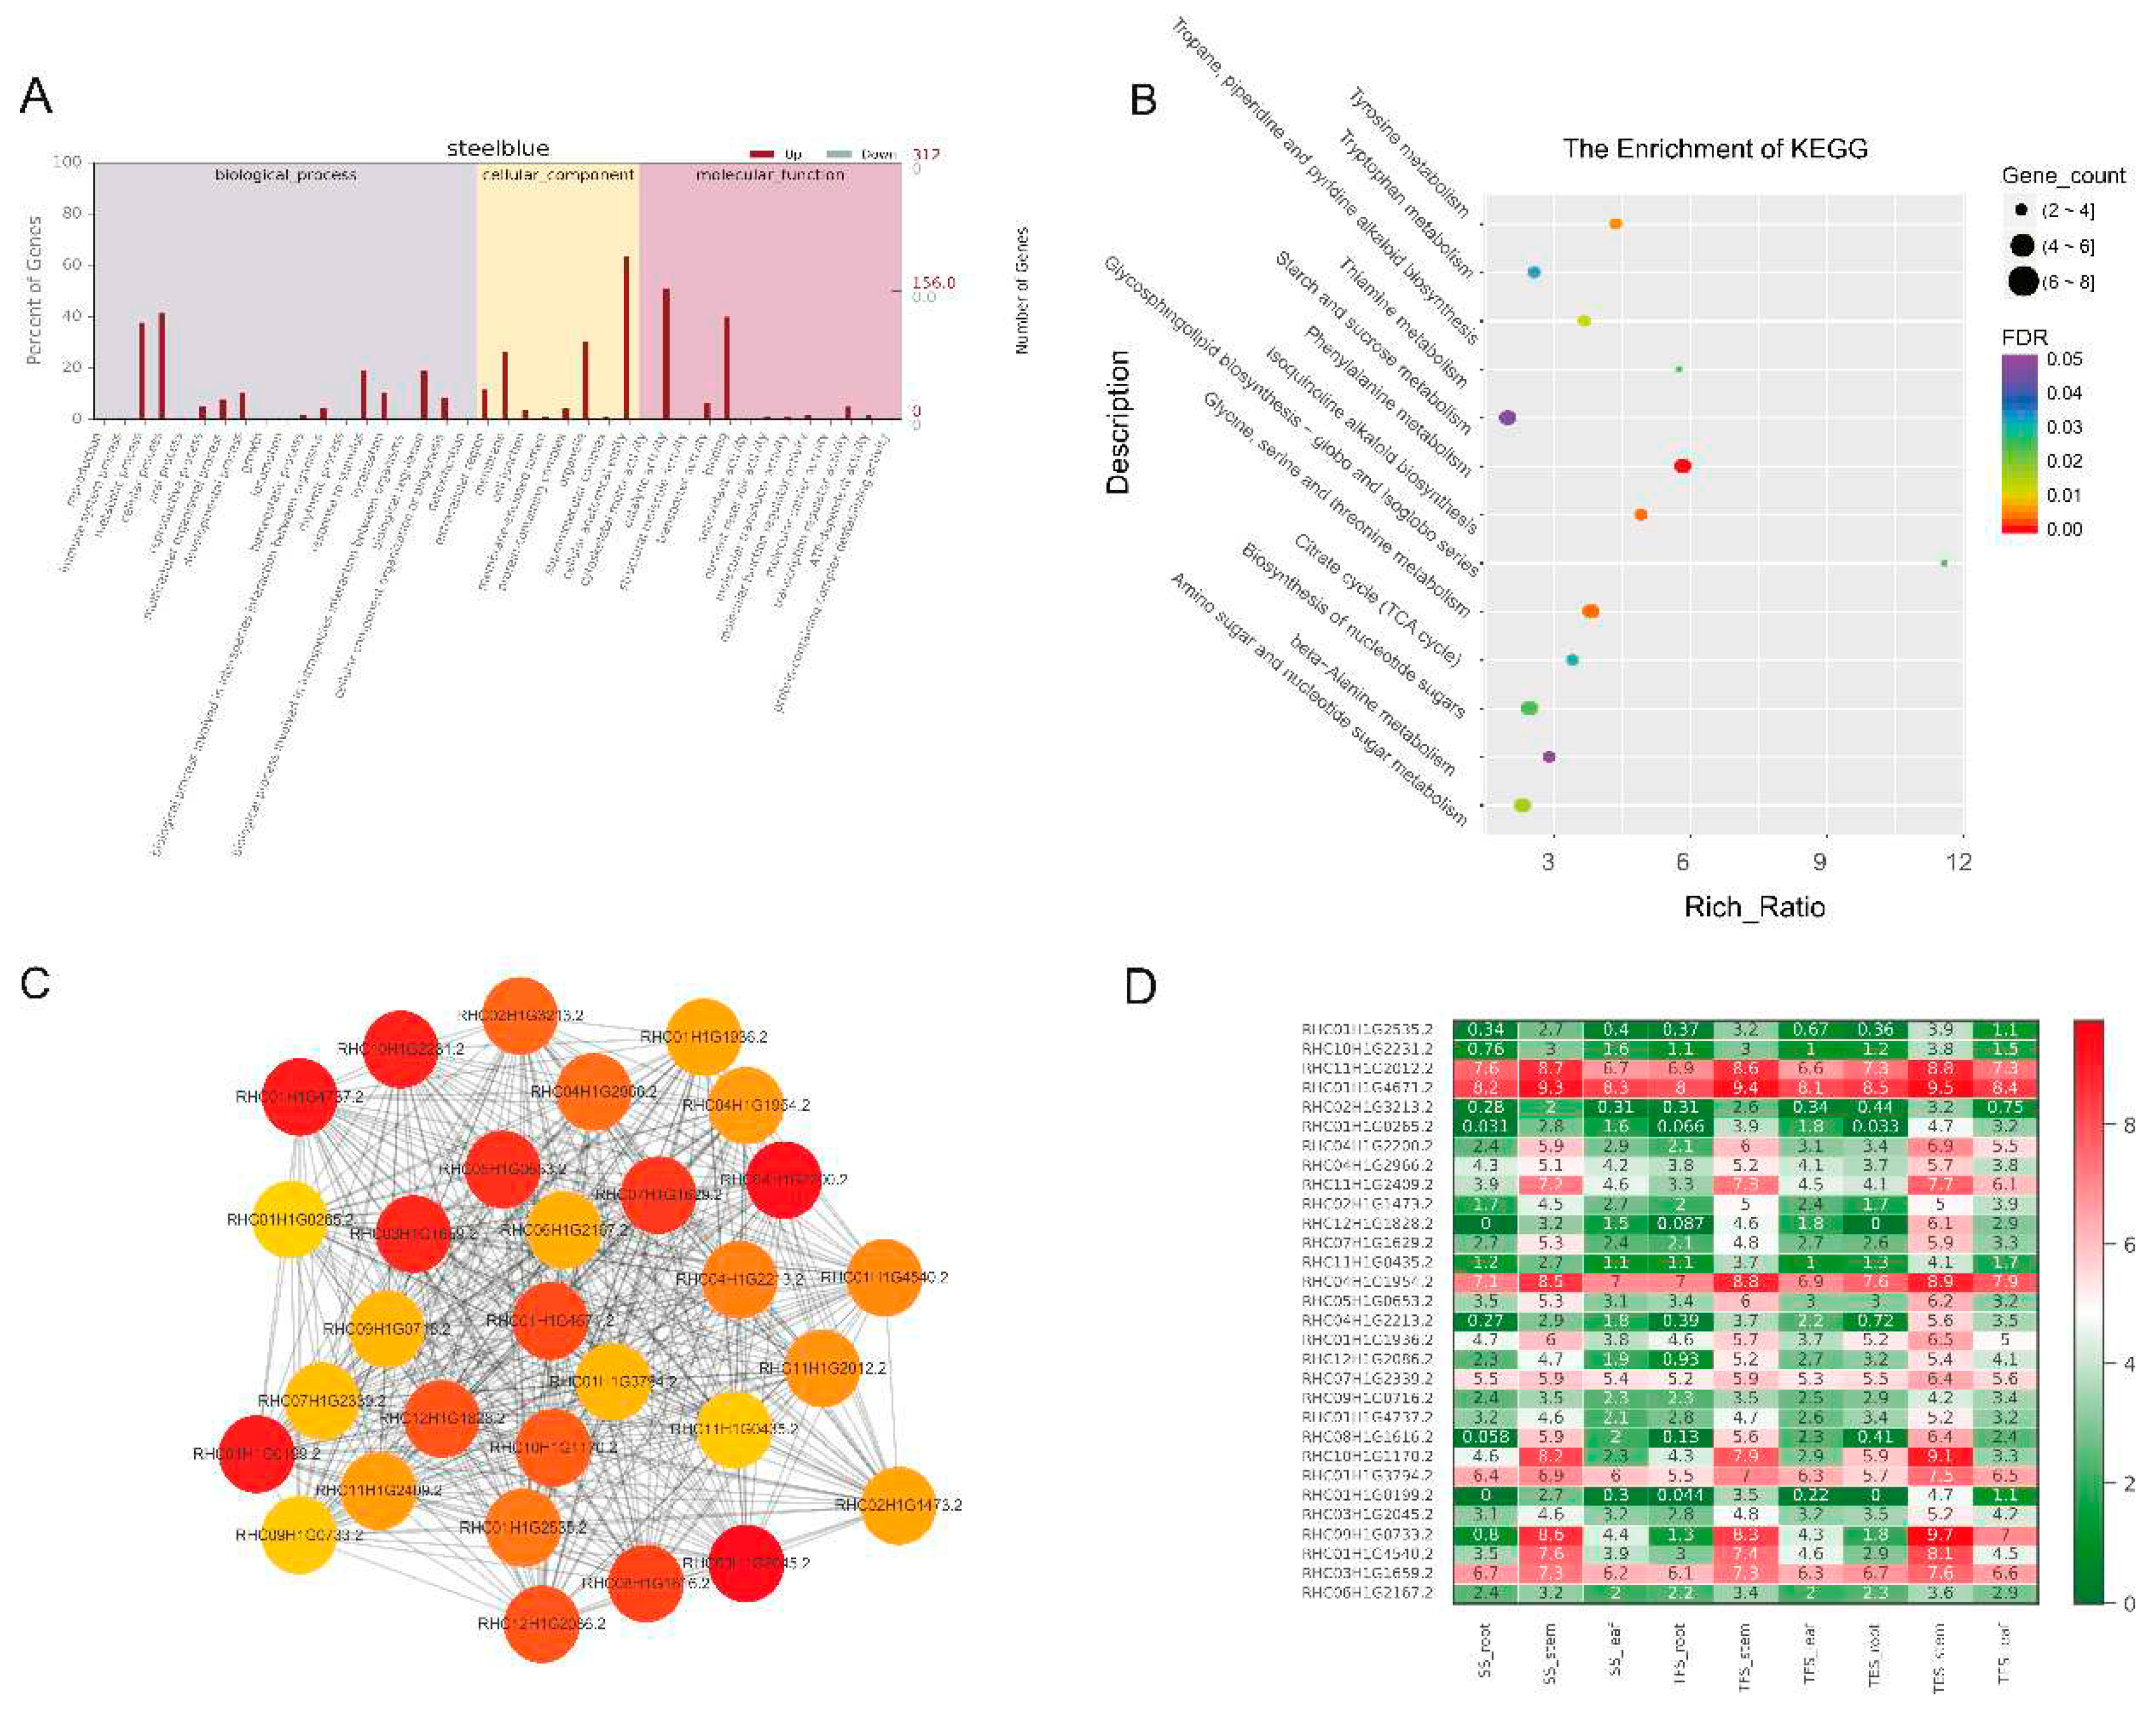
Figure 8.
Expression patterns of GO enrichment, KEGG enrichment, gene co-expression network, and hub genes in the paleturquoise module. (A) GO functional enrichment analysis. (B) KEGG functional enrichment analysis. (C) Gene co-expression network and hub genes.The figure shows top 30 hub genes with the highest connectivity, with a redder color representing higher connectivity. (D) Hub gene expression patterns in potato stems at seedling, tuber formation and tuber expansion stages. SS: Seedling stage; TFS: Tuber formation stage; TES: Tuber expansion stage.
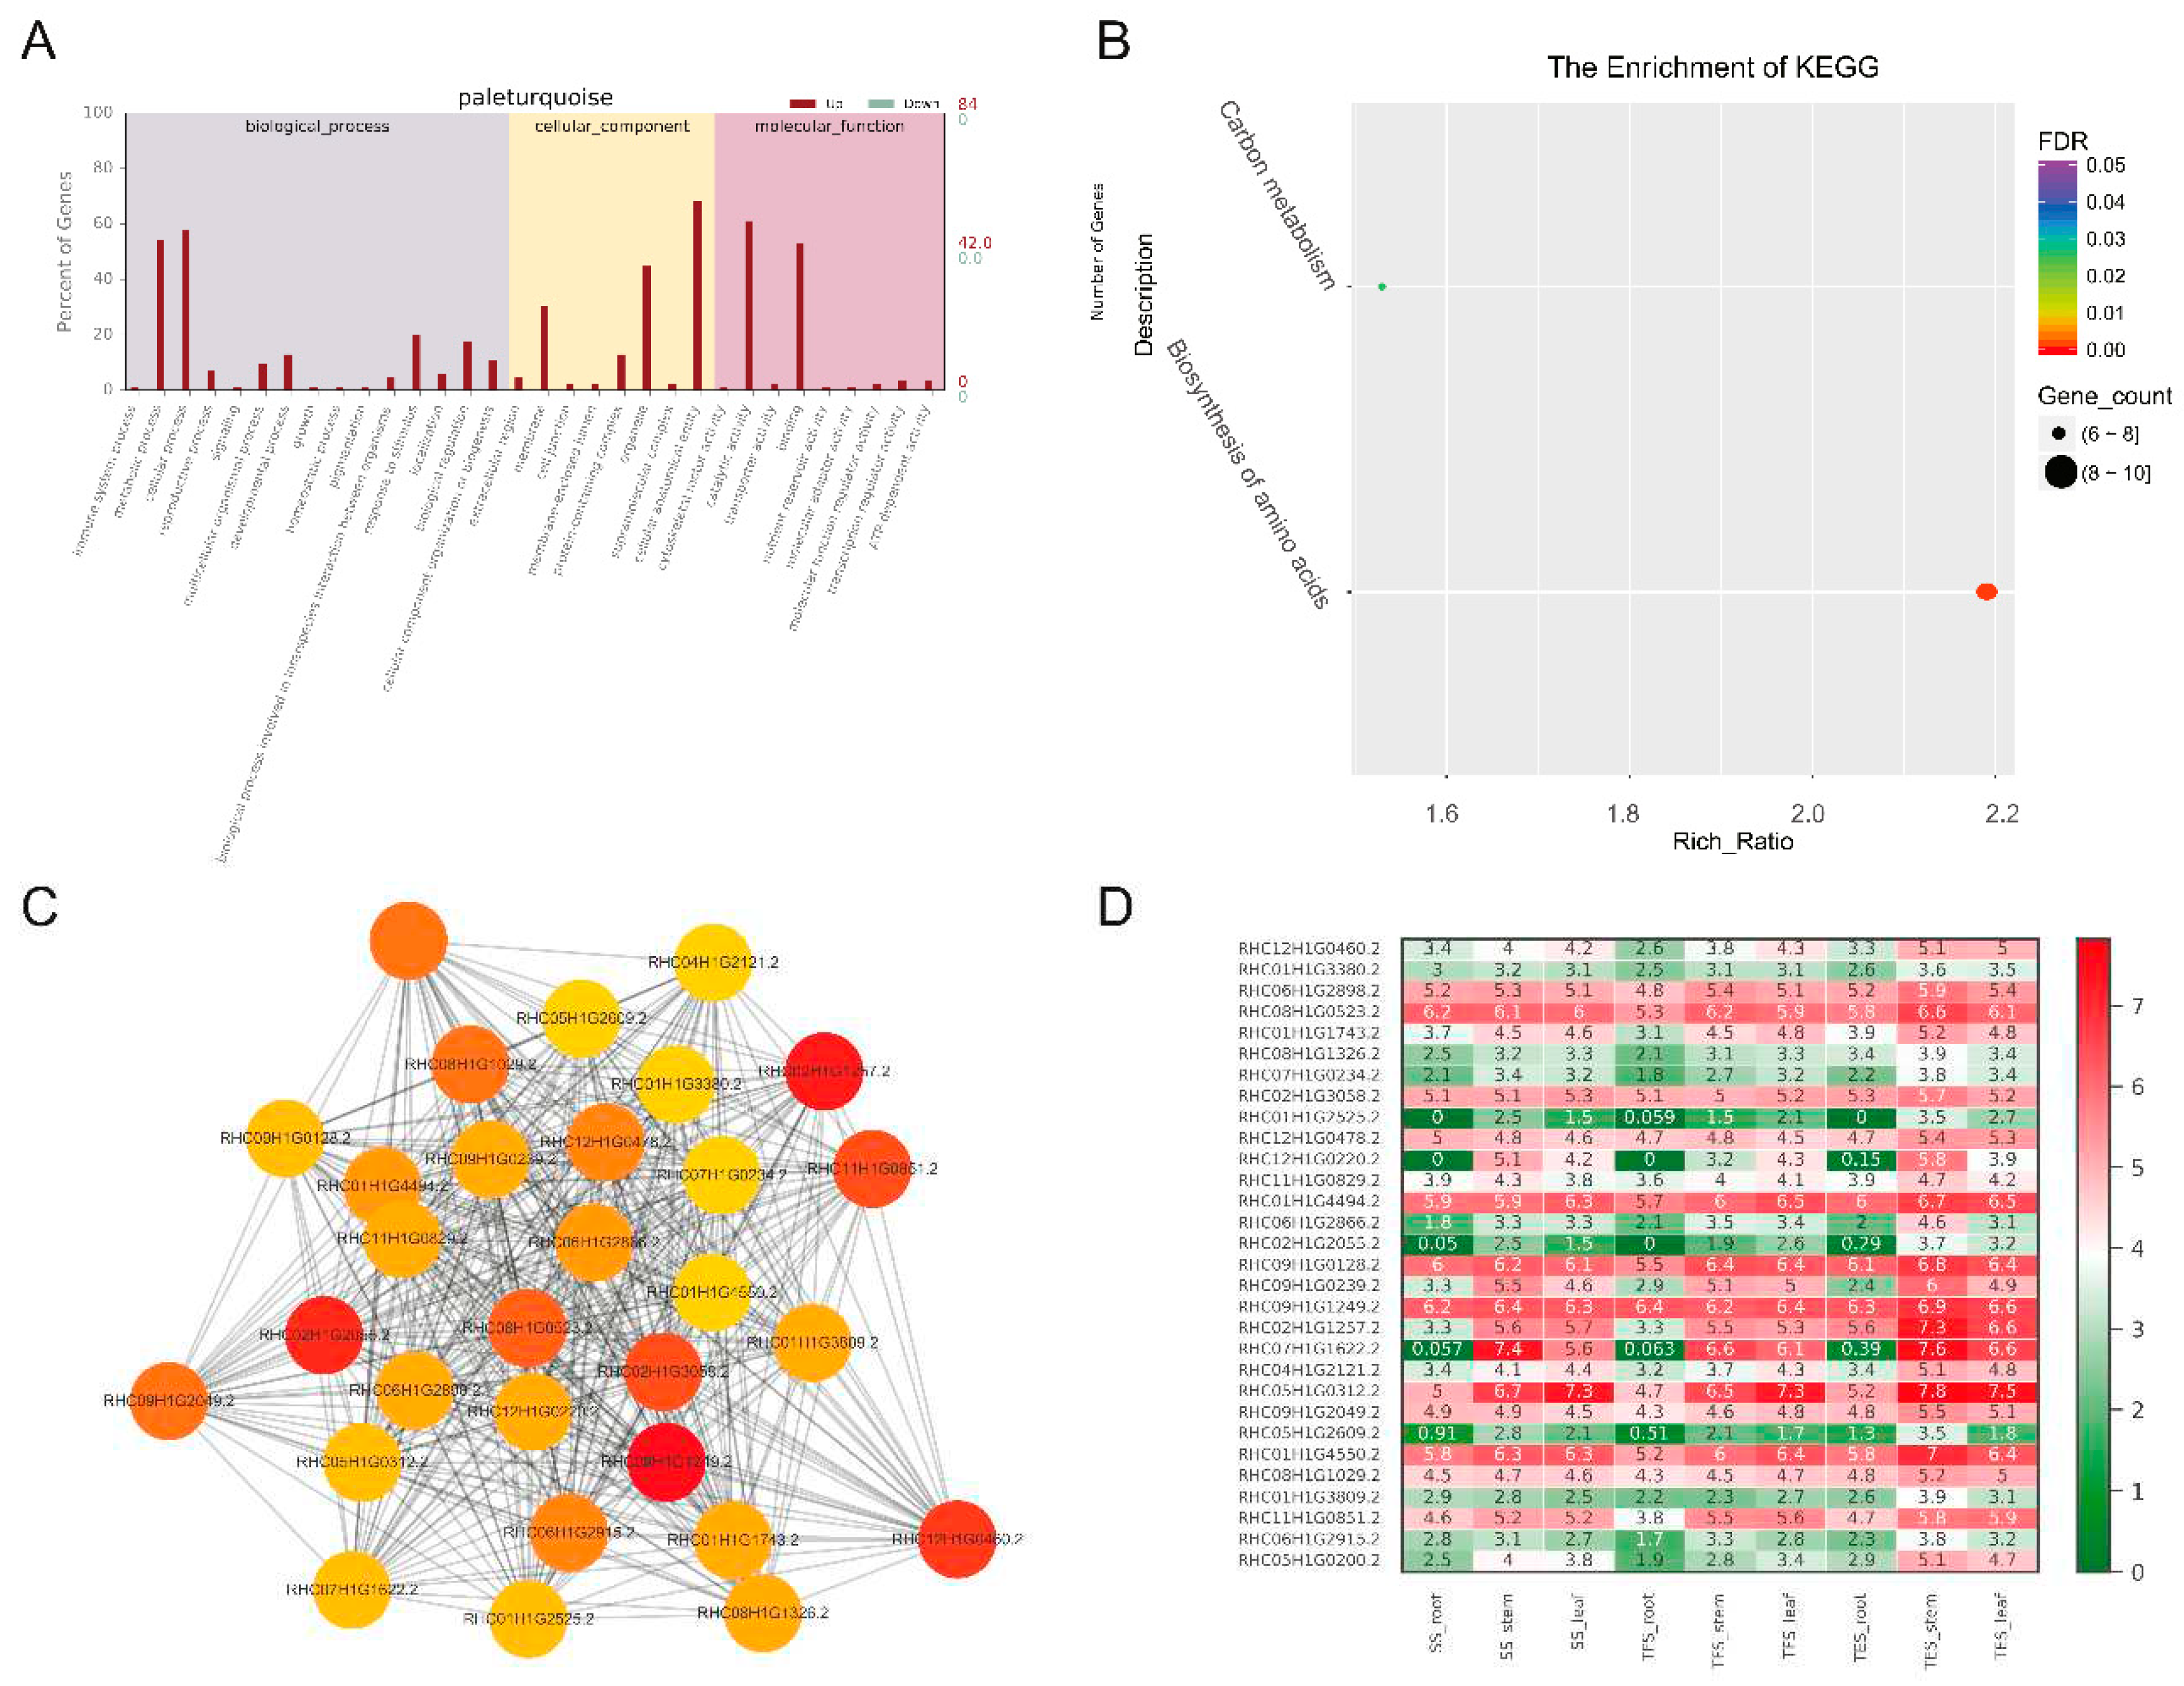
Figure 9.
The correlation of expression levels of the selected genes as determined by RNA-seq and RT-qPCR are closely correlated.
Figure 9.
The correlation of expression levels of the selected genes as determined by RNA-seq and RT-qPCR are closely correlated.
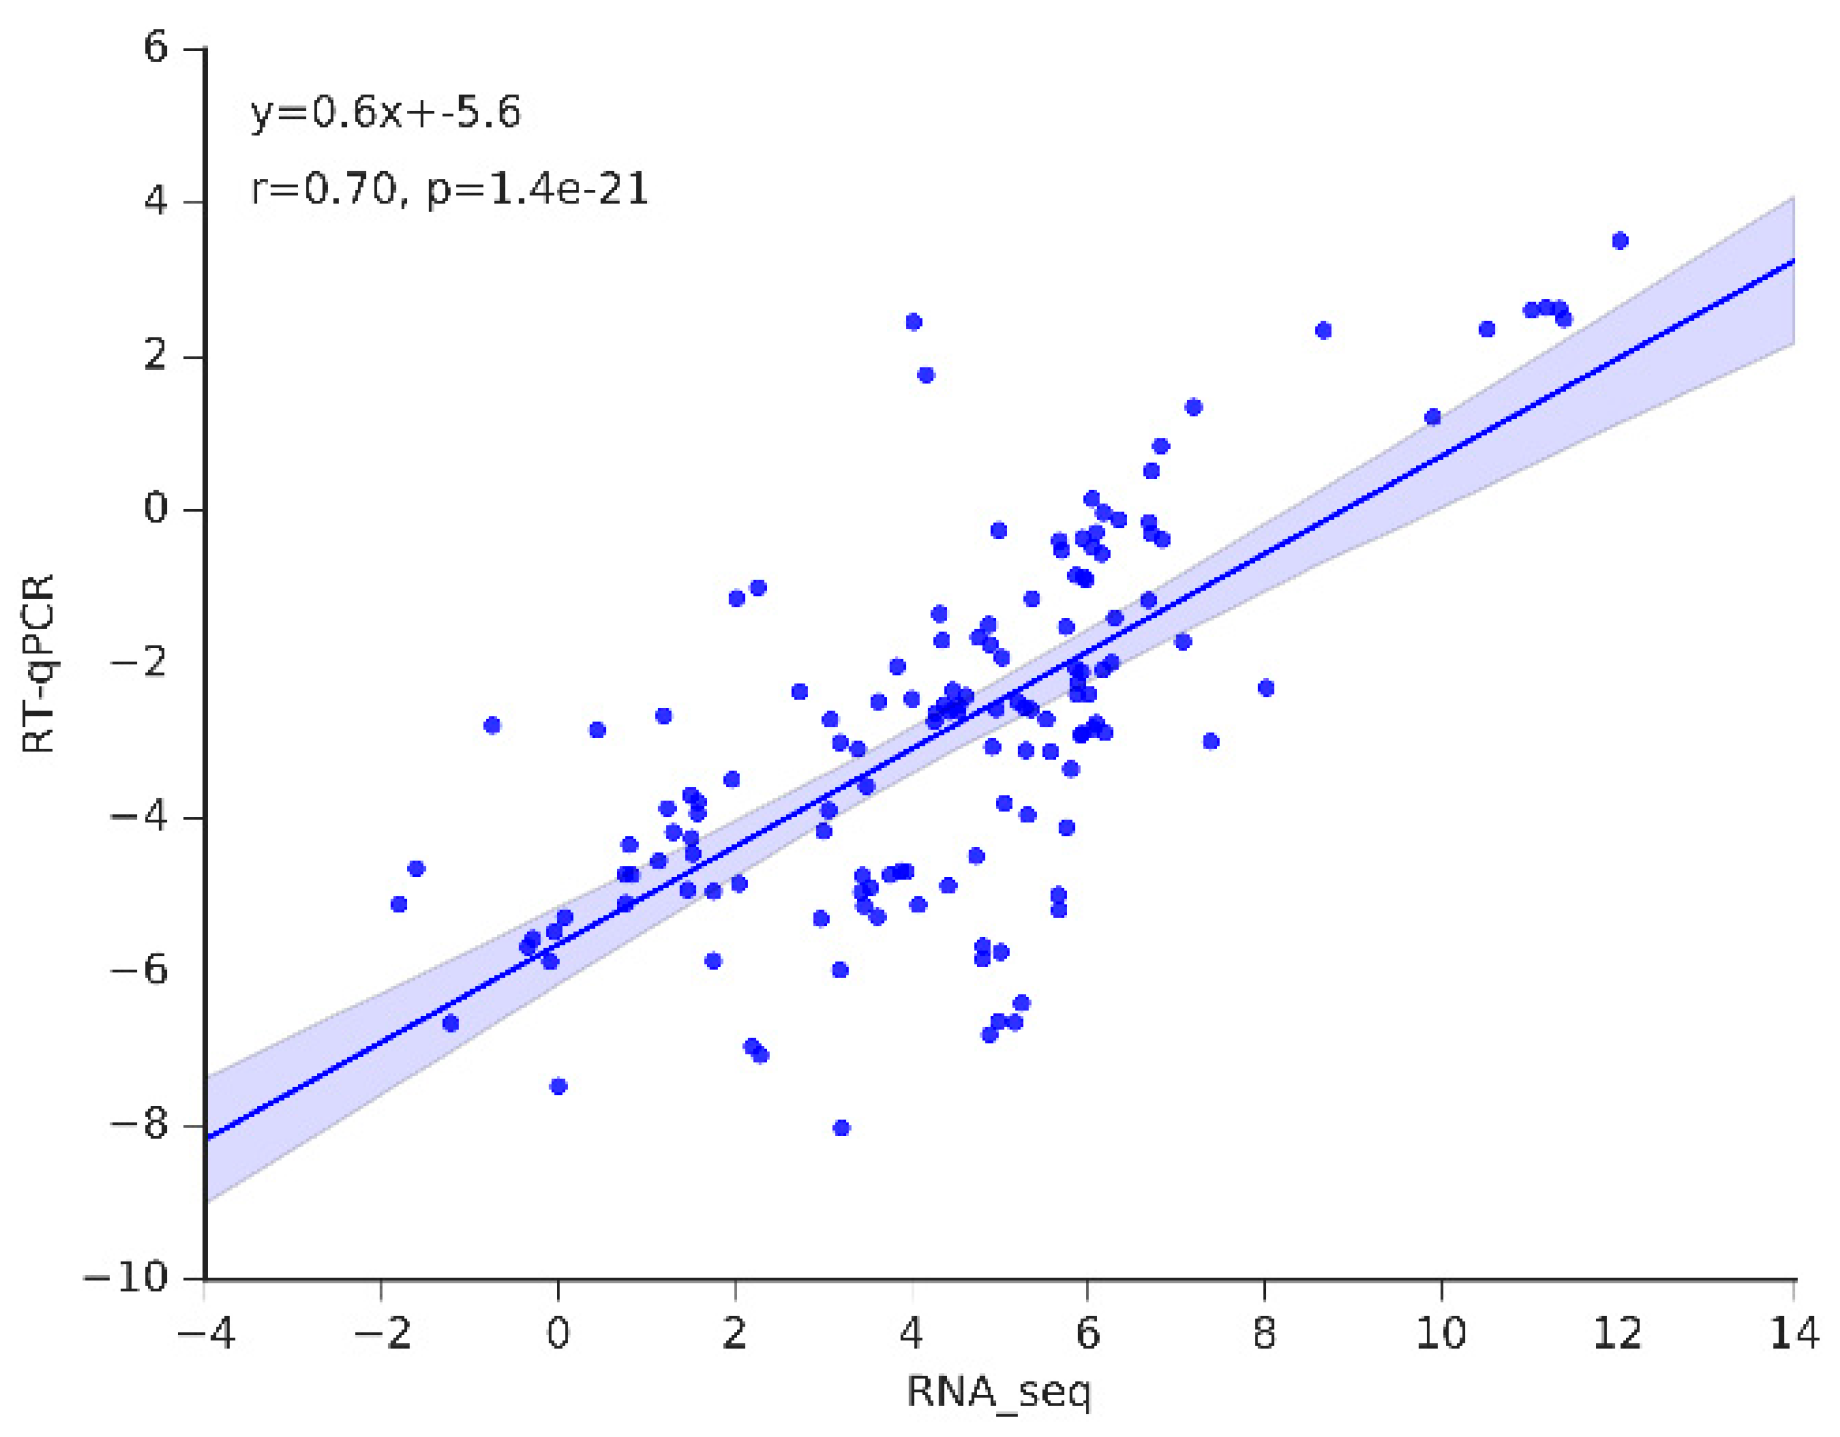
Figure 10.
Relative expression of 40 hub genes in potato stems at seedling, tuber formation and tuber expansion stages by RT-qPCR. Three independent biological replicates were performed for each sample, and significance was determined by Mann-Whitney statistical of statannot package (ns: p > 0.05; *: p < 0.05, **: p < 0.01; ***: p < 0.001; ****: p < 0.0001). SS: Seedling stage; TFS: Tuber formation stage; TES: Tuber expansion stage.
Disclaimer/Publisher’s Note: The statements, opinions and data contained in all publications are solely those of the individual author(s) and contributor(s) and not of MDPI and/or the editor(s). MDPI and/or the editor(s) disclaim responsibility for any injury to people or property resulting from any ideas, methods, instructions or products referred to in the content. |
© 2023 by the authors. Licensee MDPI, Basel, Switzerland. This article is an open access article distributed under the terms and conditions of the Creative Commons Attribution (CC BY) license (http://creativecommons.org/licenses/by/4.0/).
Copyright: This open access article is published under a Creative Commons CC BY 4.0 license, which permit the free download, distribution, and reuse, provided that the author and preprint are cited in any reuse.


