
Submitted:
19 December 2023
Posted:
19 December 2023
You are already at the latest version
Abstract
Universal Stress Protein (USP) plays an important regulatory role in the response to abiotic stress. Most of the research related to USP so far has been conducted on plant models such as Arabidopsis, rice, and cotton. The potato is one of the four major food crops in the world. Therefore, it is of great significance to study the expression pattern of the potato StUSP gene family under abiotic stress conditions. In this study, a total of 108 USP genes were identified from the genome of the Atlantic potato, divided into four subgroups. And based on the genetic structure, the physical and chemical properties of proteins and other aspects of their biological characteristics are comprehensively analyzed. Collinear analysis showed that the homologous genes of StUSPs and four other representative species (Arabidopsis, rice, coyote tobacco, and tomato) were highly conserved. The cis-regulatory elements of the StUSPs promoter are involved in plant hormones, environmental stress, mechanical damage, and light response. RNA-seq analysis showed that under different abiotic stresses, there are differences in the expression patterns of members of each subgroup. WGCNA co-expression analysis of the central gene showed that the differential co-expression gene is mainly involved in the plant-pathogen response process, plant hormone signal transduction, and the biosynthesis process of secondary metabolites. Through qRT-PCR analysis, it was confirmed that StUSP13, StUSP14, StUSP15, and StUSP41 may be important candidate genes involved in the response to adversity stress in potatoes. The results of this study provide the basis for further research on the functional analysis of StUSPs in the potato response to adversity stress.
Keywords:
Potato
; USP gene family
; abiotic stress
; bioinformatics analysis
; transcriptome
1. Introduction
At present, the potato (Solanum tuberosum) is one of the four major grain crops in the world [1]. Because of its important commodity economic value and nutritional value, the potato is of great significance to ensuring world food security [2]. Potatoes are one of the main sources of carbohydrates and vitamins, which can provide basic energy supply for human life activities. In addition, potatoes are rich in protein and a variety of biologically active ingredients that are beneficial to human health, such as terpenoids, polysaccharides, alkaloids, and polyphenols [3,4,5]. The use of potatoes as raw materials for food processing and the production of potato starch and snack products have driven the development of the potato industry [6,7]. However, most potato breeds are relatively susceptible to biological or abiotic stresses, such as pathogen infection throughout the plant's entire growth and development in the field, mechanical damage to the tuber during picking and transportation, and extensive rot brought on by the entry of pathogenic bacteria, including fusarium, from the wound during storage as a result of inadequate management. Potato yield and quality will significantly decline as a result of the emergence of diseases, the aggravation of mechanical damage, and other risks [8,9,10]. Therefore, improving the ability of potatoes to resist adversity and stress is an important aim of potato breed improvement.
Deoxynivalenol (DON), the most prevalent B-type trichothecene compound and a fungal virality factor, destroys normal cell physiological function, damages mitochondria indirectly, and significantly lowers crop yield and quality [11,12]. In plants, strategies for responding to adversity include protecting cell membranes, removing reactive oxygen species (ROS), regulating the cell cycle, and producing defensive or protective proteins [13]. USP is an ancient and conserved protein that is found in bacteria, archaea, fungi, and plants [14]. USP was first discovered in the W3110K-12 strain of E. coli (Escherichia coli) and is a 12.5 kDa cytoplasmic protein [15]. In E. coli, the USP gene is divided into six groups [16]. USP is divided into two subgroups according to its ability to bind ATP. The uspA subgroup includes uspA, uspC, and uspD; the uspFG subgroup includes uspF and uspG [17]. In plants, genes with USPA domains similar to bacteria are defined as USP genes [18]. The physiological functions of USP mainly include antioxidant stress [19], regulating cell growth and development [20], and other processes. In addition, USP is also significantly induced under unfavorable environmental conditions, which plays a positive role in the cell's tolerance to adversity [21]. Although many USP proteins have been characterized in structure and biochemistry, their role is still unknown.
Only the uspA domain is present in the E. coli USP structure, and USPA is involved in the reaction to hormones like salicylic acid, methyl jasmine, and abscisic acid [22]. But the USPs of plants are functionally diversified to a large extent through additional auxiliary domains, allowing them to have many different functions [23]. Up to now, multiple USP genes have been studied in Arabidopsis thaliana [24], Oryza sativa [25], Solanum lycopersicum [26], Gossypium herbaceum [27], and other model plants. Existing studies have shown that USP genes can improve plant resistance and alleviate cell damage caused by various stresses [28]. OsUSP1 from rice is the first USP gene discovered in the plant world. It is involved in the activation of the ethylene response signaling cascade during hypoxia and has been shown to have a positive regulatory effect on the flood resistance of rice [25]. It is reported that a total of 44 USP genes have been identified in Arabidopsis [29]. The AtUSPs promoter can be induced by plant hormones and various stresses [30]. Among them, AtUSP9, AtUSP12 [31], and AtUSP17 have been identified as being involved in multiple stress responses. AtUSP17 regulates the expression of CCA1 and TOC1, the central genes related to circadian rhythm [20]. The AtUSP17 gene was significantly induced by salt stress and injury [31], and overexpression of AtUSP17 enhanced the plant's tolerance to oxidative stress and thermal stress [32,33]. AtUSP17 regulates the salt resistance of Arabidopsis by regulating ethylene, abscisic acid, and reactive oxygen species [34]. In addition to Arabidopsis, in wild tomato (Solanum pennellii), overexpression of SpUSP promotes the closure of pores to reduce the excessive harm caused by drought stress to individual plants, thereby enhancing drought resistance. On the other hand, oxidative stress, mechanical damage, and plant hormones can all induce the expression of SpUSP [35]. As a USP protein in tomatoes,SlRd2 participates in the regulation of reactive oxygen species production and improves plant tolerance to salt and osmotic stress [36]. Overexpression of GhUSP1 and GhUSP2 in cotton can significantly improve drought tolerance [37], and GhUSP2 can regulate the growth state of plants under high temperatures and salt stress [38]. USPs directly affect the growth and development of plants. The ectopic expression of Sbusp in tobacco (Nicotiana tabacum) can enhance salt tolerance [39], and the expression of GUSP1 positively regulates the accumulation of proline, soluble sugar, and chlorophyll in plants [40]. The USP gene is potentially involved in stress response mechanisms, including the accumulation of osmoregulatory substances, reducing pore diameter by increasing the content of endogenous abscisic acid, enhancing antioxidant defense processes, promoting photosynthesis, maintaining the integrity of biofilms, and interacting with other general stress response proteins [35,41].
The role of USP protein in model plants such as Arabidopsis has been fully studied. However, in many plants, the precise molecular function and regulatory response process of USPs are not yet clear. So far, there have been no reports in the literature about the characterization of USP in potatoes. The genome sequencing of the Atlantic potato has been completed, making it possible to analyze the whole genome of the potato USP gene family. In this study, the potato USP gene family of Solanaceae was identified and analyzed, and the response characteristics of the USP gene under mechanical damage and Deoxynivalenol (DON) stress were predicted through the transcriptome. Screening multiple stress response genes laid a theoretical foundation for improving the quality and resilience of potatoes and provided a basis for potato genetic breeding.
2. Results
2.1. Genome-wide Identification and Molecular Characterization of USP in Atlantic Potatoes
In this study, 108 StUSP genes were identified in Atlantic potatoes and renamed from StUSP1 to StUSP108. The information about these StUSP genes and their corresponding proteins is shown in Table S1, including renamed genes, chromosomal physical locations, protein length (aa), molecular weight (MW), theoretical isoelectric point (pI), instability index, aliphatic index, total mean hydrophilic index, and subcellular location. The average length of StUSPs is 323 amino acids, and the protein length varies greatly from 134 aa (StUSP18) to 1433 aa (StUSP101). The average molecular weight was 35.86 kDa, and the molecular weight range was 14,610.77 Da (StUSP18) ~ 160,203.58 Da (StUSP101). The theoretical isoelectric point (pI) ranges from 4.72 (StUSP79) to 10.06 (StUSP26, StUSP36), and the aliphatic index ranges from 71.23 (StUSP56, StUSP63, StUSP73) to 111.79 (StUSP41). The hydrophilic values ranged from −0.633 (StUSP33) to 0.211 (StUSP18), and the hydrophilic values varied greatly. The instability index of StUSPs ranges from 7.31 to 61.16 (>40 indicates protein instability, <40 indicates protein stability), including 51 stable proteins and 57 unstable proteins. Subcellular prediction showed that StUSPs were located in the cytoplasm (57), chloroplasts (27), nuclei (17), plasma membranes (3), peroxisomes (2), and cytoskeleton (2). These results suggest that universal stress proteins may adapt to different functional requirements by changing the length and physicochemical properties of amino acids.
2.2. Chromosome Localization and Gene Duplication Analysis of StUSPs in Atlantic Potato
108 StUSP genes were unevenly distributed on 39 chromosomes of potatoes (Figure 1). Chromosomes chr01_3, chr06_1, chr06_2, and chr06_4 contain the most StUSPs (6 genes), and chromosomes chr01_1, chr06_3, and chr12_2 contain 5 StUSPs. In contrast, chromosomes chr02_2, chr02_3, chr04_2, chr08_1, chr08_3, chr08_4, chr10_4, chr12_1, and chr12_4 contain only one StUSP gene. However, the chromosomes of chr02_4, chr07_4, chr09_1, chr10_1, chr10_3, chr11_1, chr11_2, chr11_3, and chr11_4 do not contain the USP gene. Segment duplication and tandem duplication are the key factors in gene family expansion. In our study, 103 StUSPs were found to be in the collinear region, with 202 pairs of Segmental duplication. In addition, four tandem duplication gene pairs (StUSP13/14, StUSP20/21, StUSP31/32, and StUSP99/100) were identified on chromosomes chr01_3, chr02_1, chr03_3, and chr12_2 (Figure 2, Table S2). These results indicated that the StUSP gene family was mainly amplified through segment duplication during the evolution of the Atlantic potato. Nonsynonymous substitution rate (Ka) and synonymous substitution rate (Ks) are the basis for evaluating whether collinear genes are subjected to selection pressure. A Ka/Ks value of 1 indicates natural selection; a Ka/Ks< 1 indicates purification selection; and a Ka/Ks>1 indicates positive selection. The results showed that Ka/Ks ranges from 0.0745 to 1.4773, and most StUSPs genes underwent strong purification selection (Ka/Ks ratio < 1) after gene duplication events, suggesting that these genes have functional redundancy under certain conditions. In addition, three pairs of segment duplication (StUSP59/StUSP66, StUSP59/StUSP70, and StUSP61/StUSP72) were affected by positive selection (Ka/Ks ratio > 1), suggesting that these genes have changed proteins during the evolutionary process of stress selection (Table S3).
2.3. Phylogenetic Analysis of StUSPs
In order to better understand the evolutionary relationship of StUSP family members, we selected 26 AtUSP protein sequences from the Arabidopsis genome database. Based on multiple comparisons of 108 common stress protein amino acid sequences, MEGA 7.0 was used to construct an adjacency (NJ) phylogenetic tree, and the poisson model was used to calculate the evolutionary distance (Figure 3). Phylogenetic analysis shows that the members of StUSP can be divided into four subgroups. Among them, the USP2 subgroup contains 33 members, which is the largest subgroup. The USP4 subgroup contains a minimum of 24 members. The USP1 subgroup and the USP3 subgroup contain 26 and 25 StUSPs, respectively. The results showed that there is a common ancestor of the USPs gene between potato and Arabidopsis, and specific copying and differentiation also occurred in the evolutionary process after separation.
2.4. Analysis of StUSPs Gene Structure,Domain, Conserved Motifs, and Secondary Structure
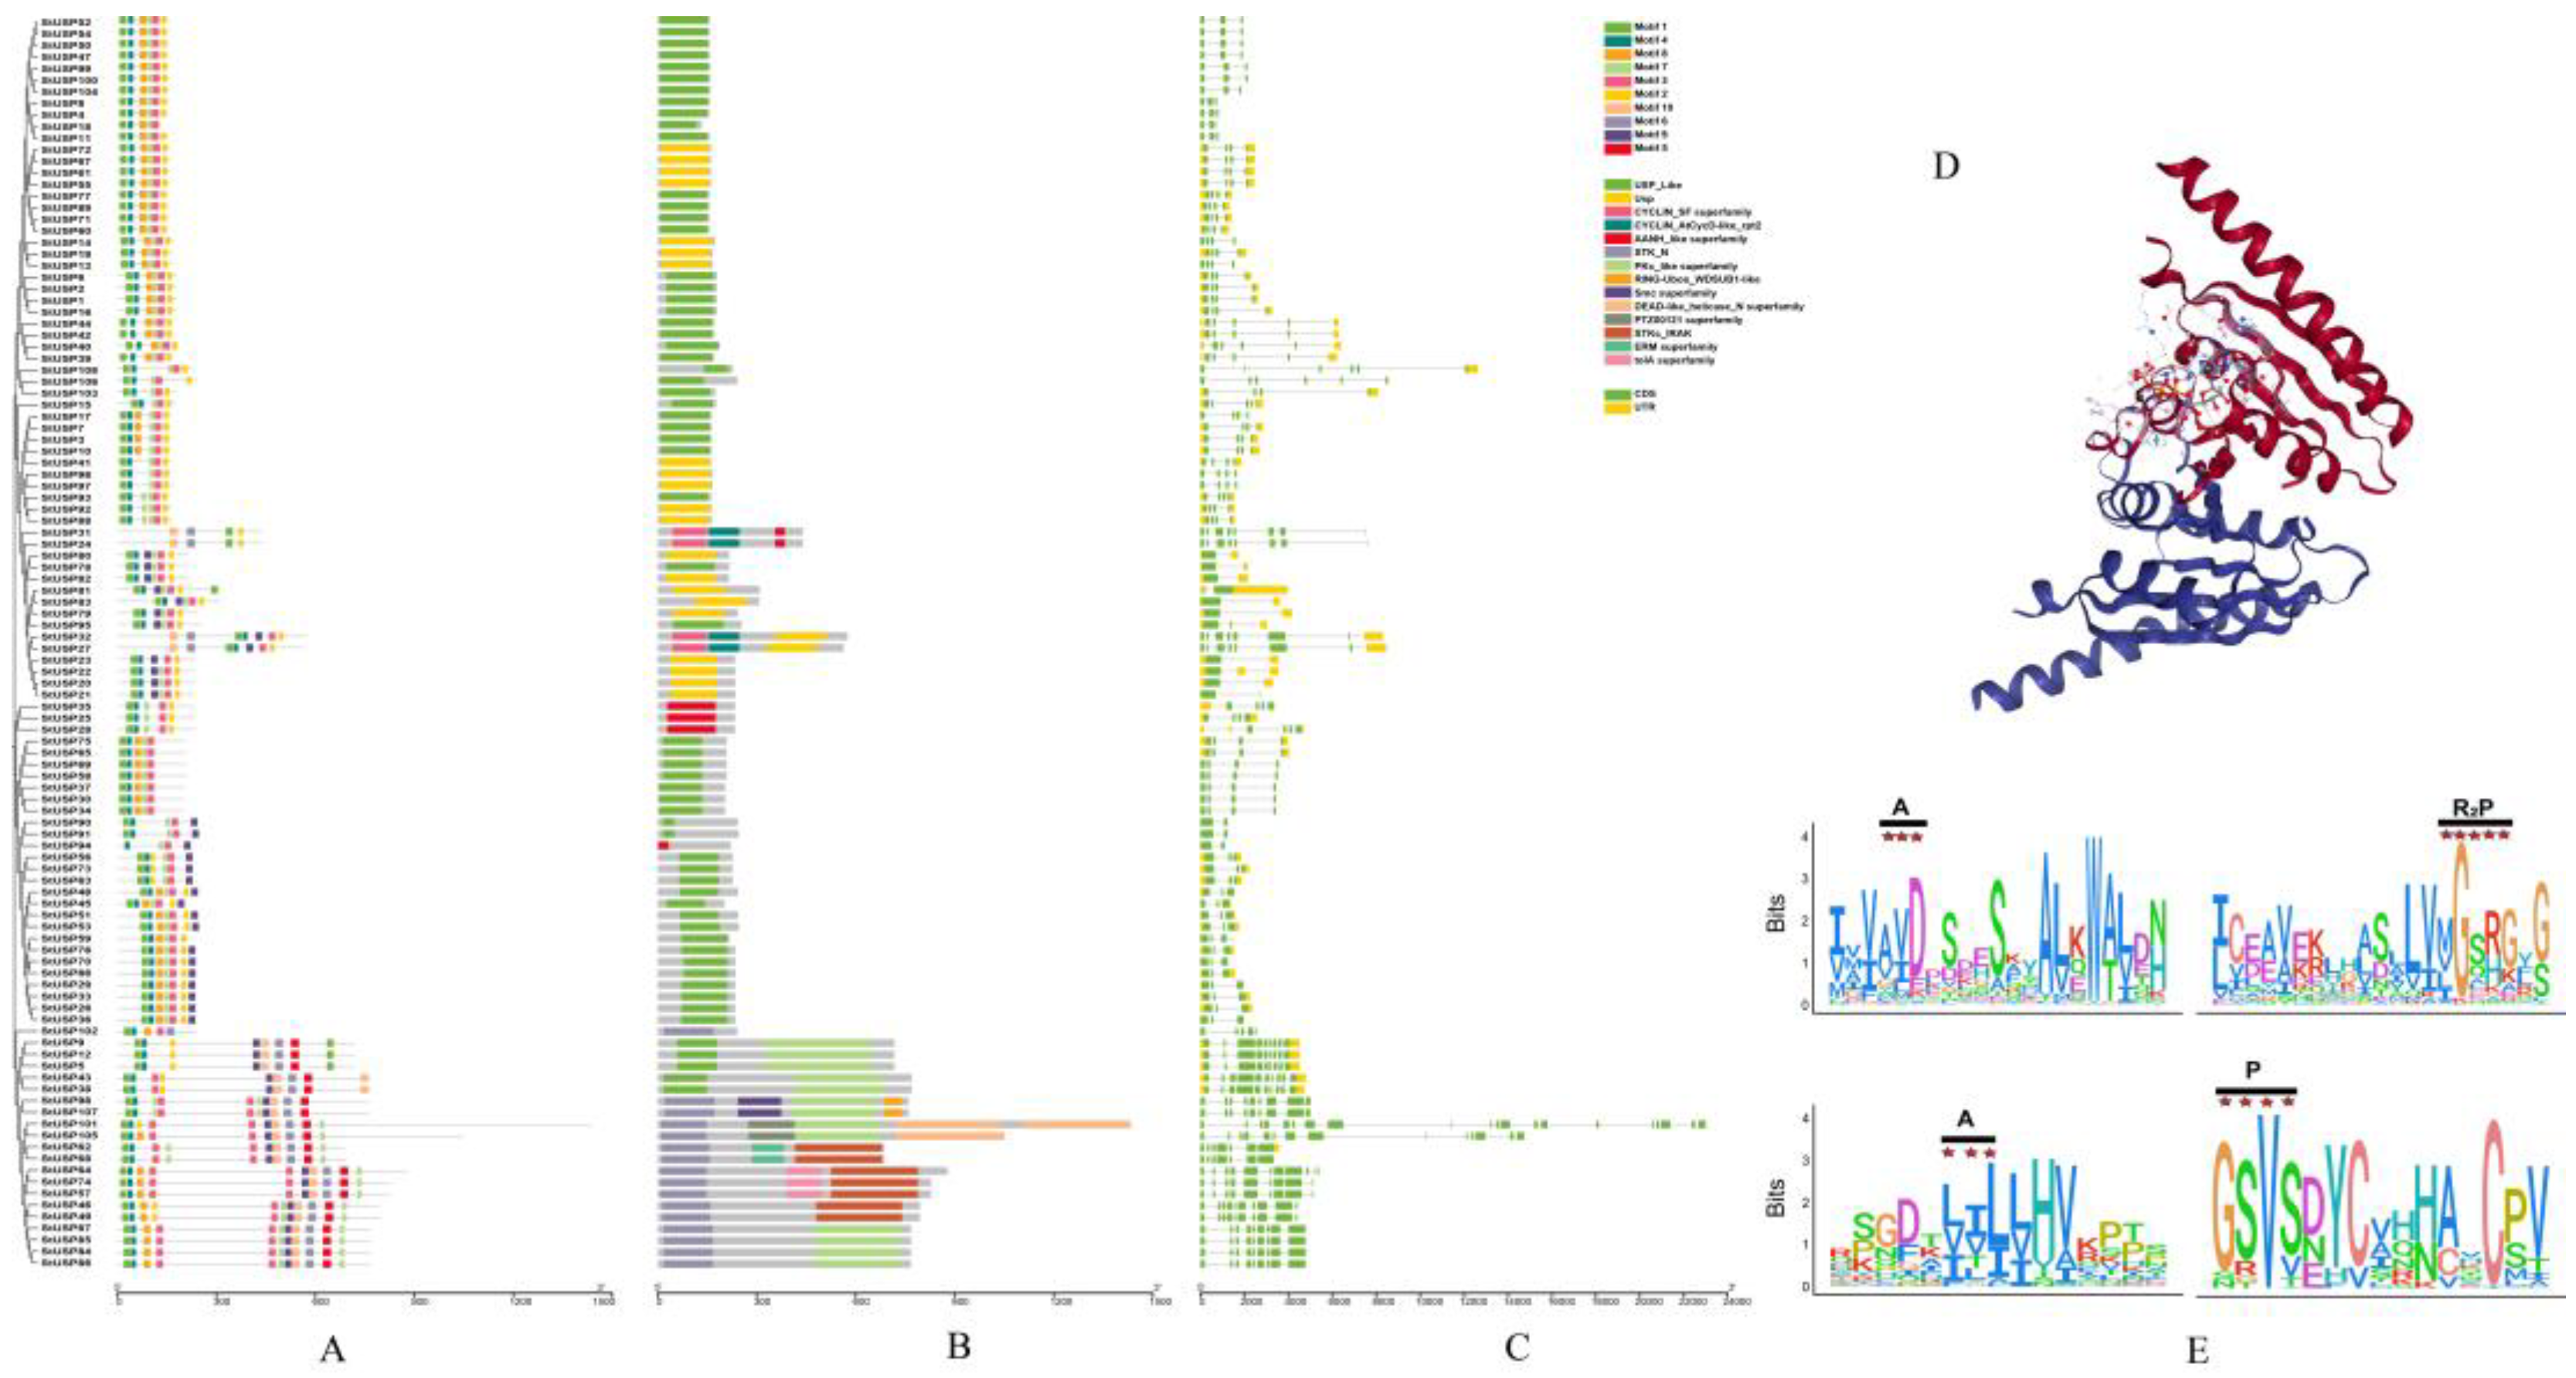
An online MEME program was used to predict 108 StUSP proteins with a total of 10 conserved motifs (Figure 4). The length and conserved sequence of each motif are listed in Table S4. The composition and distribution of the motif are relatively conservative among members of the same subgroup (Figure 4A). motif1 and motif4 are located at the N-terminal of most StUSP protein sequences, and motif2 and motif3 are located at the C-terminal. There are conserved glycine residues associated with the universal stress protein domain in these four motifs. Almost all USP1 and USP2 subgroups contain motif1, motif2, motif3, and motif4 motifs. These results show that the USP1 and USP2 subgroups have a relatively recent evolutionary history and a close phylogenetic relationship. The type and number of motifs in the same subgroup are similar, suggesting that the moiety pattern may be related to the function of the StUSP protein. Different subgroups usually have specific motifs, most of which are located at the c-terminal. For example, motif 5 is unique to the USP3 subgroup; motif 6 and motif 10 mainly appear in the USP4 subgroup; motif 8 mainly appears in the USP1 subgroup; and motif 9 mainly appears in the USP3 and USP4 subgroups.
To further explore the conserved domain of StUSPs protein, the NCBI Conserved Domain Search program was used to predict StUSPs protein (Figure 4B). Multiple sequence alignment of 108 StUSPs genes showed that StUSPs members had typical features of USP-conserved domains.The intron-exon distribution of StUSPs was analyzed by comparing the CDS sequence and the complete gene sequence (Figure 4C). Genetic structure analysis showed that the number of introns in StUSPs varied from 1 to 19. The largest number of introns is StUSP101, with 19 introns. It is worth noting that members of the same subgroup have similar structures, and most members have the same number of exons. A large number of StUSP genes (34 members, 31.48%) have a conserved gene structure of 3 introns and 4 exons, and the USP family members (26 members, 24.07%) with a conserved gene structure of 2 introns and 3 exons account for the second largest proportion. The exon-intron structure pattern is very conservative among members of the same subgroup. The sequence similarity and the high similarity of the intron-exon structure indicate that the potato universal stress protein gene may have undergone gene replication events during evolution. The more special StUSP105 has 14 exons and 13 introns, and StUSP64 has 11 exons and 10 introns. The differences in exon-intron structure patterns between members of different subgroups of StUSPs may be caused by the deletion or acquisition of exons in the process of long-term evolution.
10 conserved domains were found in the process of multiple sequence alignment(Table S5). By comparing with MJ-0577 crystal (Figure 4D), four conserved domains related to ATP binding were found (Figure 4E). For example, in ATP adenine (A), ATP phosphate (P), and ATP ribosyl (R), in these domains, not all StUSPs contain glycine (G), and StUSPs are divided into two subgroups based on the presence or absence of a complete ATP-binding conserved domain-specific binding sequence (G-2X-G-9X-G [S/T]). One domain contained ATP binding sites (55) and the other domain did not contain ATP binding sites (53). In the StUSPs secondary structure, 117 amino acids (aa) constitute the α helix on average, accounting for 36.37% of the total secondary structure. On average, 53 amino acids (18.38%) form the extended chain, and 18 amino acids (5.36%) form the beta fold. 133 amino acids constitute a random crimp, accounting for 40.11% (Table S6). The results show that random crimping and α-helix play an important role in the formation of the tertiary structure of StUSPs.
Figure 4.
StUSP gene structure, protein motif, conserved domain analysis, and amino acid residue analysis of the StUSP domain (A) The phylogenetic evolutionary tree of StUSPs is shown in the form of a tree map. The StUSPs protein motif is set to a maximum length of 25 and a minimum length of 6, with different colored rectangles representing the conserved motif 1–10 contained in StUSPs. (B) StUSPs conserved domain. Different colored rectangles represent different types of domains, and gray areas do not contain domains. (C) StUSPs gene structure The gray lines represent introns, the yellow rectangles represent the 3 'or 5' end non-coding regions, and the green rectangles represent exons. (D) MJ-0577 crystal structure model, data from Uniport.org (E) The amino acid sequence of the USP domain in the StUSP logo diagram The height of the amino acid represents the degree of conserved amino acid at this site. The higher the amino acid, the more times it occurs at this site. The black notes above the sequence indicate ATP binding sites in the crystal structure of MJ-0577. ATP adenine (A), ATP phosphate (P), and ATP ribose (R).
2.5. Analysis of Cis-acting Elements of StUSPs
Promoter cis-elements play a key role in gene expression initiation. We analyzed the cis-acting elements of 108 StUSP gene promoter regions (Table S7). The results showed that the cis-acting elements of the StUSP gene promoter region involved in stress response were mainly divided into hormone response elements, light response elements, environmental stress-related elements, and site-binding elements. Among the plant hormone response elements, the number of methyl jasmonate response elements is 482, which is the largest response element. The second most numerous is the abscisic acid response element, with 364 elements. In addition, there are auxin response elements, gibberellin response elements, and salicylic acid response elements. All members of the StUSP family have more abscisic acid response elements and methyl jasmonate response elements in the promoter region, among which ABRE response elements are the most common in the StUSP gene promoter (Figure 5). The results indicated that the expression of the StUSP gene may be regulated by plant hormones and abiotic stress during potato growth, which makes the plant have tolerance under stress.
2.6. StUSP Gene Collinear Analysis
Comparative genomics is a powerful tool for quickly identifying and locating unknown genes by comparing genes and genome structures. According to the previous gene count, chromosome localization, and phylogenetic tree analysis, the StUSPs gene was relatively conserved in the evolution of potatoes. In order to reveal the similarity of StUSPs with homologous genes of other species and further study the evolutionary relationship of potato StUSPs, we took the potato StUSPs sequence as the core and constructed a collinear relationship of StUSPs with four representative plants (tomato, Arabidopsis, rice, and coyote tobacco (Nicotiana attenuata)). The results showed that the logarithm of the collinear genes of potato and tomato was 184 pairs, the logarithm of the collinear genes of potato and Arabidopsis had 78 pairs, the logarithm of the collinear genes of potato and rice was 53 pairs, and the logarithm of the collinear genes of potato and coyote tobacco was 26 (Figure 6, Table S8). The collinearity between potato and tomato is significantly higher than that of the other three plants. The number of collinear gene pairs among Solanaceae plants varies greatly. The collinear gene pairs of potatoes and tomatoes are mainly concentrated on the chr1, chr3, chr5, chr6, and chr7 chromosomes. The collinear gene pairs of potato and coyote tobacco are mainly concentrated on the chr1 and chr12 chromosomes; the collinear gene pairs of potato and monocotyledonous model plant rice are mainly concentrated on the chr1 and chr7 chromosomes; and the collinear gene pairs of the model plant Arabidopsis are mainly concentrated on the chr1, chr4, and chr5. The results show that the StUSPs genes on the potato chr04_2 and chr_08-2 chromosomes may mainly come from tomatoes. These results show that the Atlantic potato StUSP gene family has expanded and evolved through genome-wide replication.
2.7. Analysis of Expression of StUSPs in Response to Mechanical Damageand and DON Stress
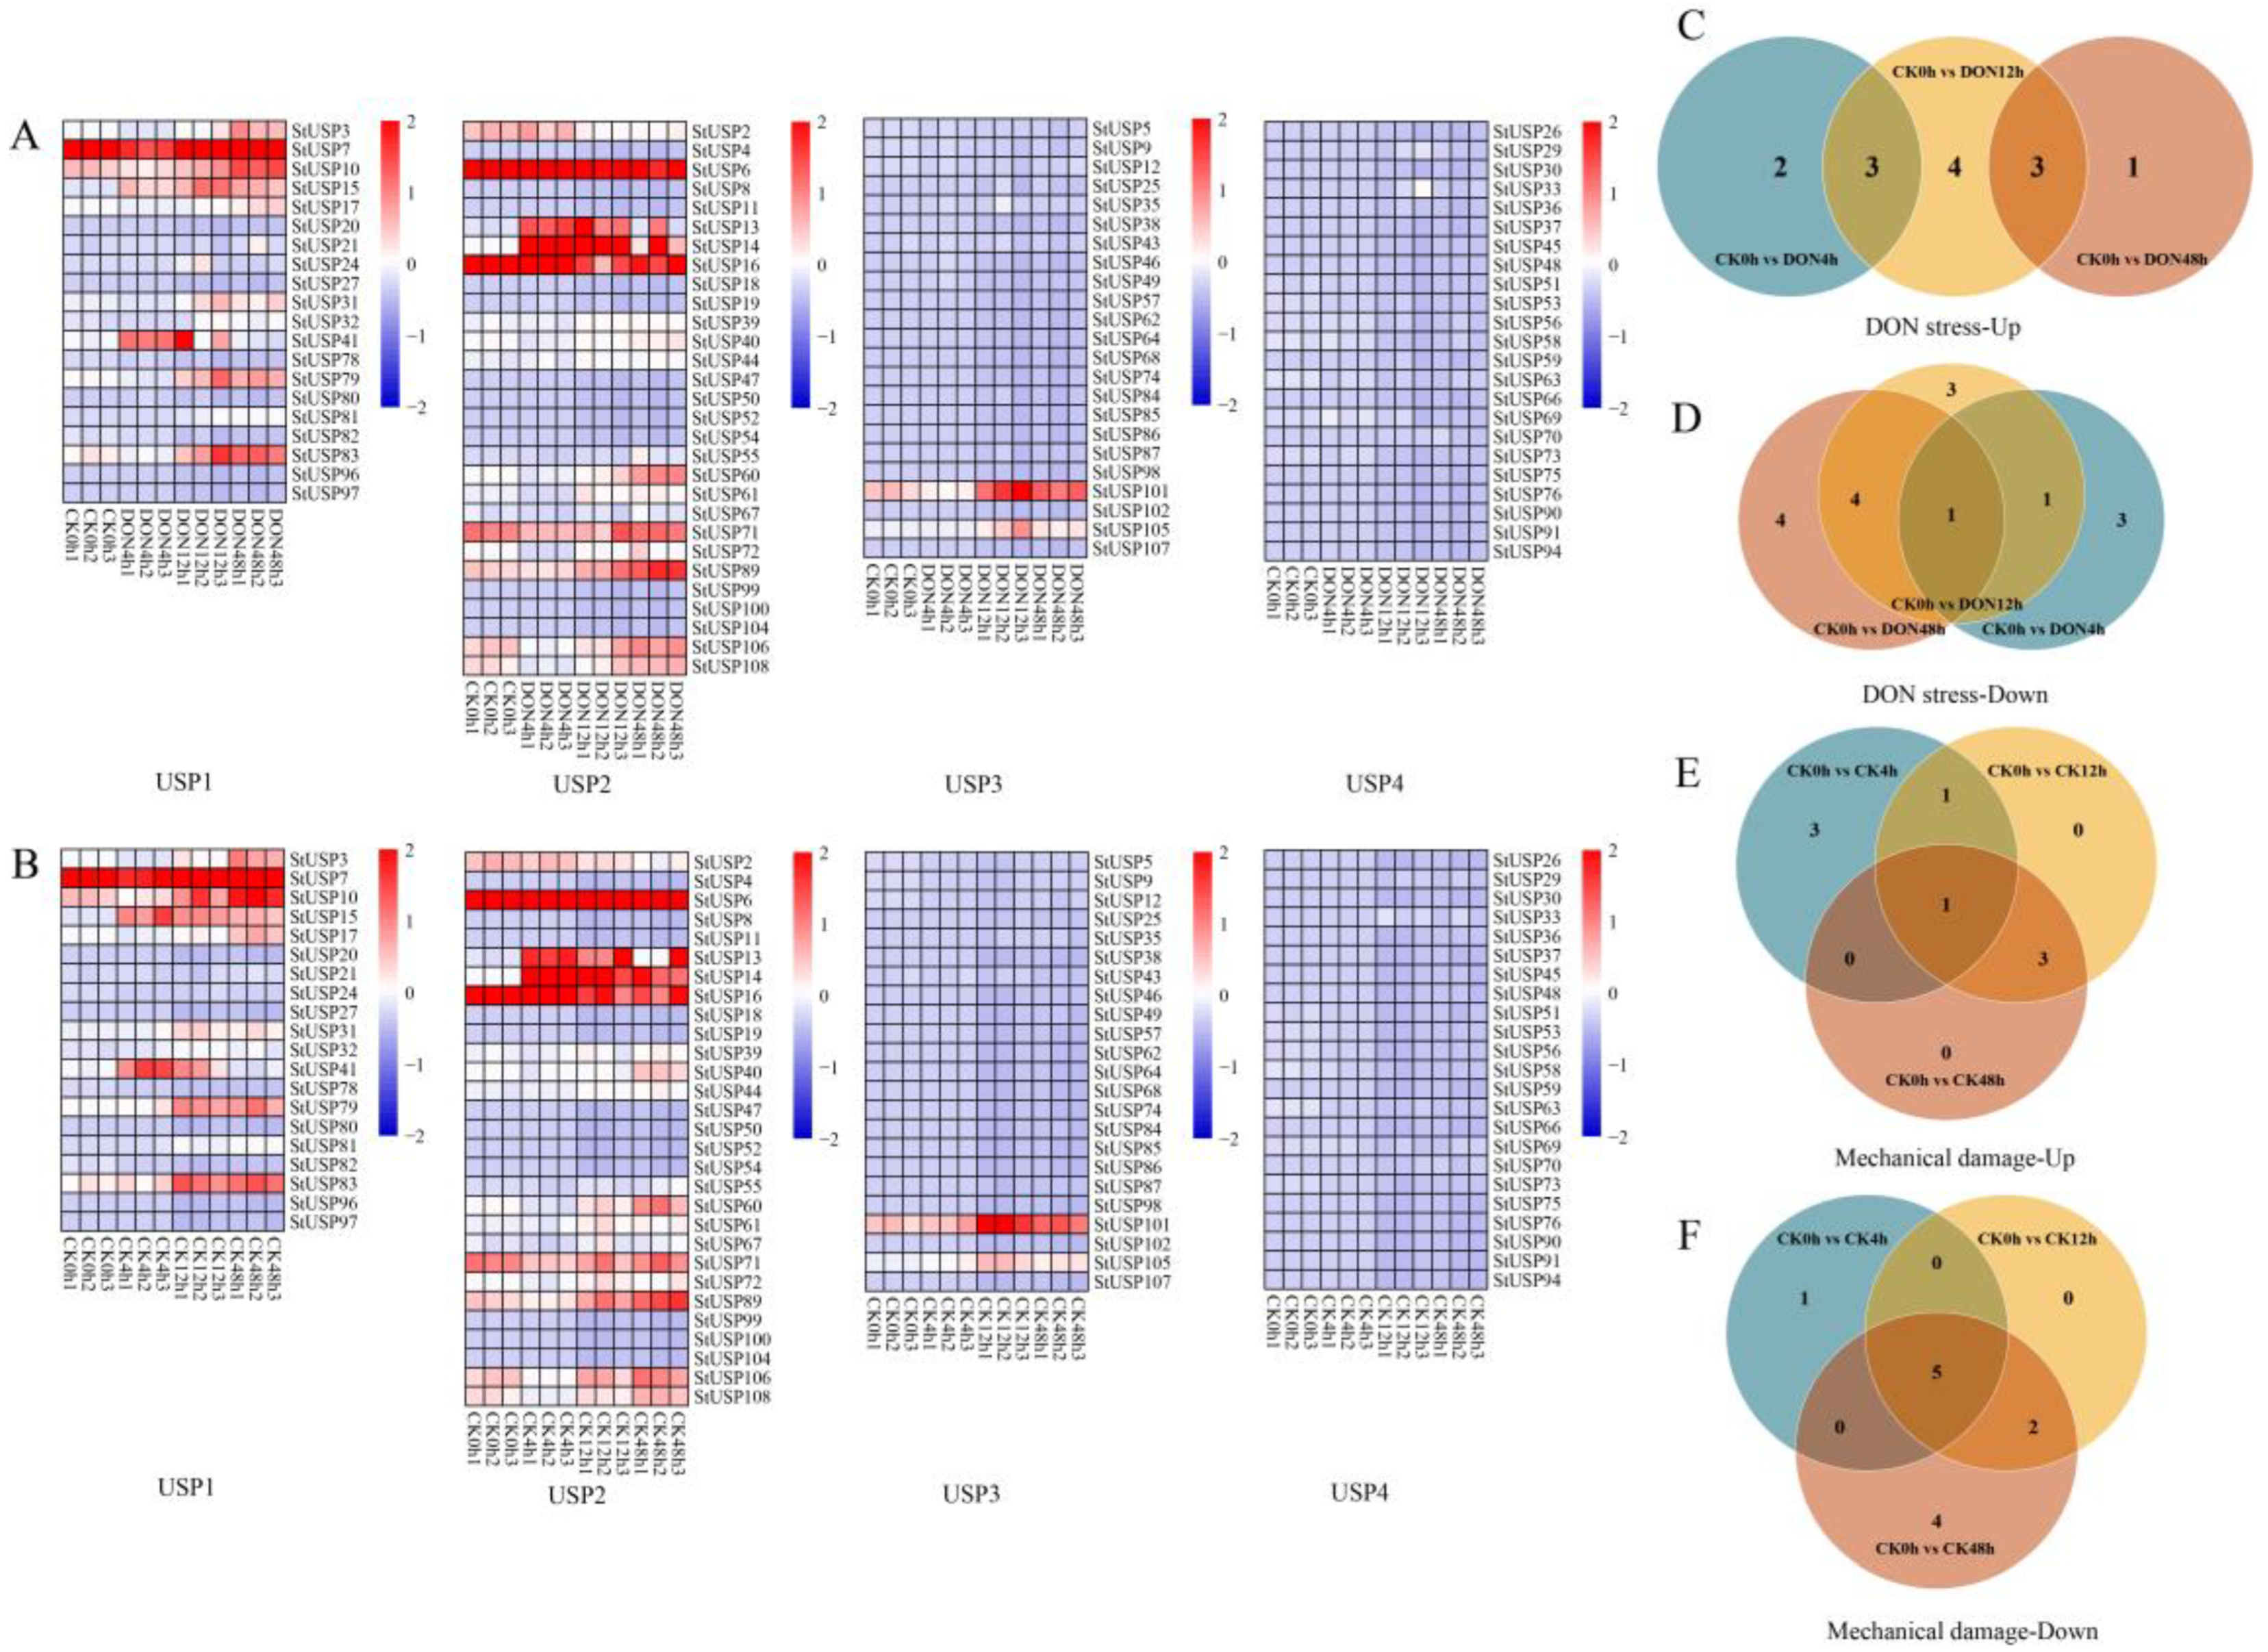
RNA-Seq was used to study the gene expression patterns of StUSPs after mechanical damage and vomiting toxin (DON) stress at different stress times (0 h, 4 h, 12 h, 48 h). The StUSP Fragments per kilobase of exon model per million mapped fragments (FPKM) values for each treatment are shown in Table S9, excluding genes with no expression or low expression levels, and finally the expression patterns of 96 StUSP genes are obtained (Figure 7A,7B). The expression levels of StUSPs in the four subgroups are different under different stresses. Among them, the StUSPs of the USP3 and USP4 subgroups mainly show low expression. However, mechanical damage and DON stress have a significant inducing effect on the StUSPs of the USP1 and USP2 subgroups, and the gene induction effect is closely related to the induction time. These results show that the StUSPs gene plays an important role in responding to mechanical damage and toxin stress. Among the 108 members of the potato StUSP gene family, more than half of the genes are highly expressed at at least one stage of potato adversity stress. About one-half of the gene expression level is basically unchanged.
In order to screen for StUSP genes involved in multiple stress responses, FPKM values were used to estimate the expression level of StUSP genes. The differential expression genes (DEGs) caused by DON stress and damage stress were shown in Venn diagrams. After 4 hours of DON treatment, 5 genes in StUSPs were upregulated and 5 genes in StUSPs were downregulated. After 12 hours of DON treatment, 10 genes in StUSPs were upregulated and 9 genes in StUSPs were downregulated(Figure 7C, 7D).Through the analysis of the pre-stress response results, after 4 hours of mechanical damage treatment, 5 genes in StUSPs were upregulated and 6 genes in StUSPs were downregulated. After 12 hours of mechanical damage treatment, 5 genes in StUSPs were upregulated and 7 genes in StUSPs were downregulated (Figure 7E, 7F). In order to determine the multiple stress response genes, we screened the upregulated genes involved in the early adversity response. In this process, we screened 6 StUSP candidate genes in response to mechanical damage and 5 StUSP candidate genes in response to toxin stress.
Figure 7.
Differential expression of the StUSP gene under DON stress and mechanical damage. (A,B): Heat map of StUSP gene expression in potatoes treated with DON stress and mechanical damage. The heat map is based on the StUSP subgroup classification. (C-F) Venn diagram of the number of DEGs in USP1 and USP2 subfamilies compared with control groups under DON stress and mechanical damage, with C,E indicating up and D,F indicating down.
2.8. StUSPs K-means Analysis
The DEGs in each treatment group were analyzed by K-means clustering, and the differential genes were grouped into 10 clusters in each stress treatment (Table S10). Among them, the 29 differential genes caused by DON stress showed a trend of high expression for 4 hours in classes 1, 4, 6, and 8, while classes 3 and 7 showed a trend of high expression for 12 hours (Figure 8A), and the 20 differential genes caused by mechanical damage showed a trend of high expression for 4 hours in classes 2 and 3, and class 8 showed a trend of high expression for 12 hours (Figure 8B). In order to screen the StUSPs genes involved in the response to multiple stresses, the clustering groups obtained from the two groups were intersected. At the same time, the gene range was further narrowed with reference to Venn analysis, and finally, 3 StUSPs genes (StUSP13, StUSP14, and StUSP41) involved in the response to mechanical damage and 3 StUSPs genes (StUSP13, StUSP14, and StUSP15) involved in the response to DON stress were selected.
2.9. Analysis of Gene Co-expression
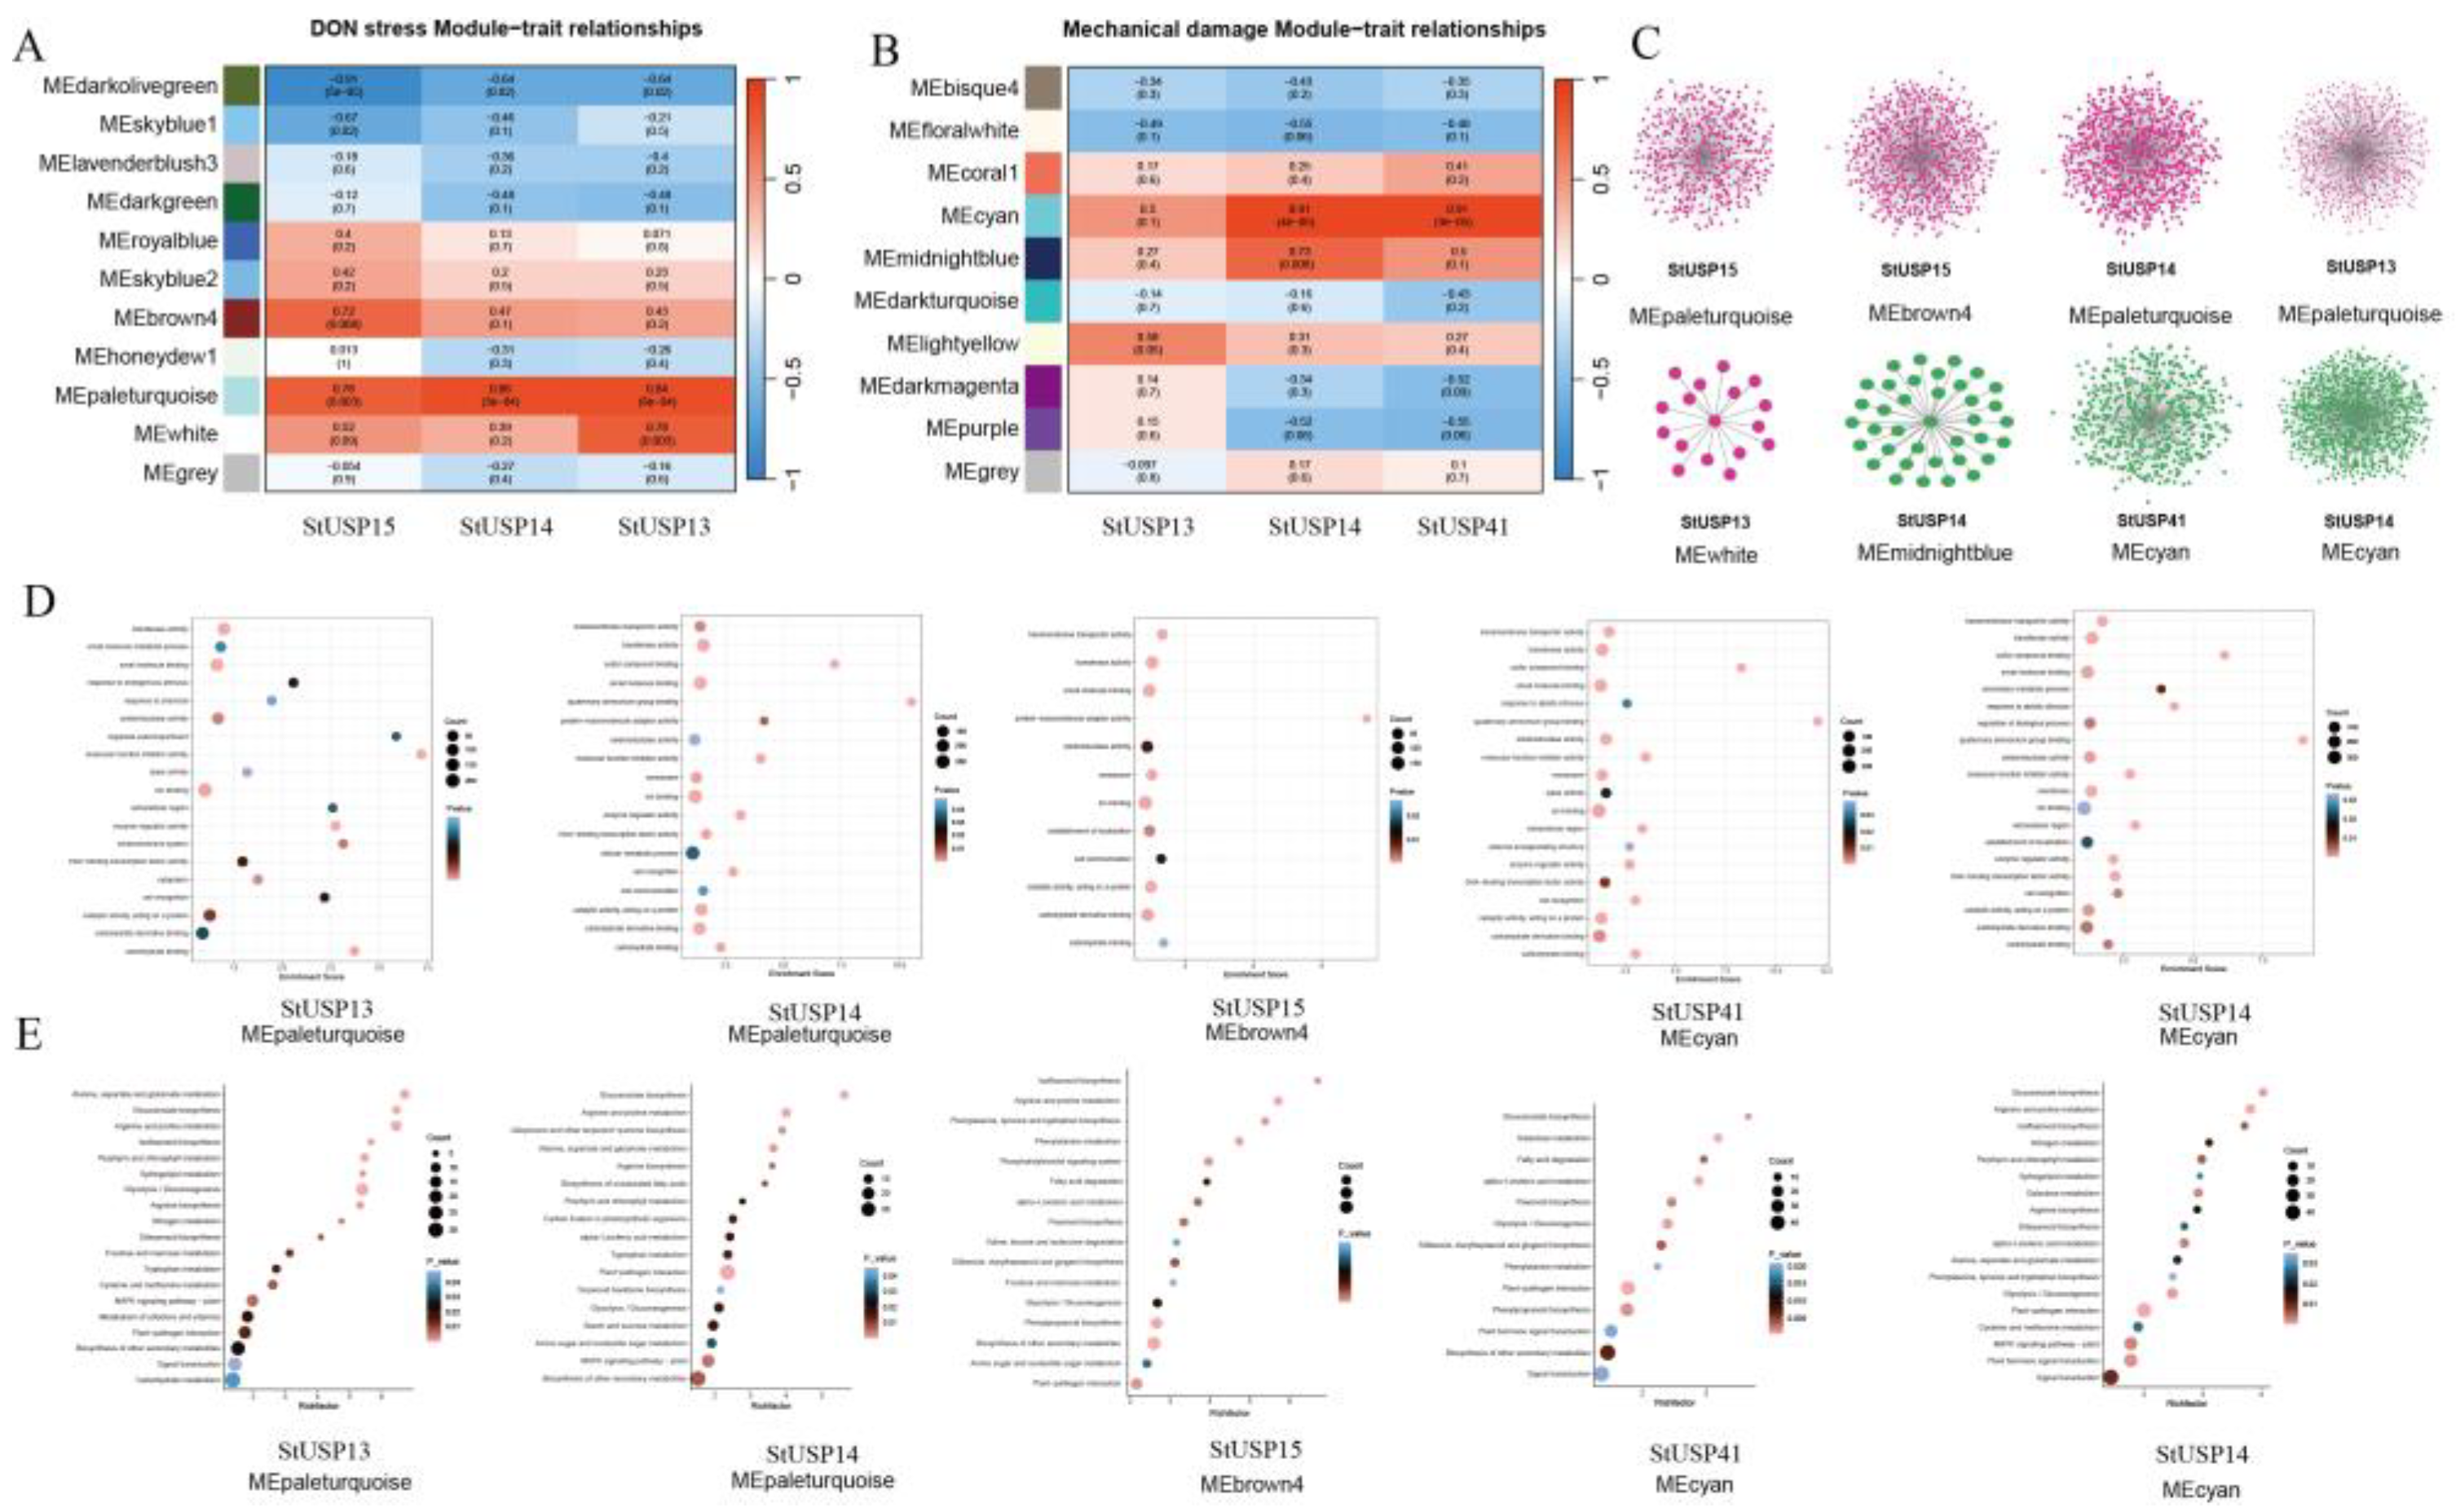
Co-expression analysis can help find genes with similar expression patterns, which is of great significance to the study of plant stress response mechanisms. These genes may be functionally closely related or participate in the same signaling pathway or physiological process. In order to elucidate the role of the StUSPs gene in the response of potatoes to multiple stresses, in this study, we used the Weighted Correlation Network Analysis (WGCNA) method, combined with the RNA-Seq data of 7 samples, which uses a dynamic shear algorithm to cluster genes and divide them into modules. By calculating the feature vectors of each module and combining similar modules, a co-expression network centered on the above three DON stress response differentially expressed genes (StUSP13, StUSP14, and StUSP15) and three mechanical damage response genes (StUSP13, StUSP14, and StUSP41) is constructed (Figure 9A). As shown in the figure, we obtained a total of 8 co-expression modules and used the central gene and its interacting differential genes to map the gene interaction network (Figure 9B). Among them, in the DON stress response, the MEBrown module centered on StUSP15 has the largest network (742 genes), followed by the MEpaleturquoise module centered on StUSP14 with 731 co-expressed genes. The MEwhite module network centered on StUSP13 is the smallest (16 genes). Among the mechanical damage response modules, the MECyan module network centered on StUSP14 is the largest (863 genes), followed by the MEcyan module centered on StUSP41 with 468 co-expressed genes, and the MEmidnightblue module network centered on StUSP14 is the smallest (36 genes). This co-expression network further proves the complex function and potential role of the StUSP gene family in the process of multiple stress responses.
In order to explore the biological processes that these co-expressed genes may be involved in, we selected five modules with a large number of co-expressed genes (StUSP13, StUSP14, StUSP15, and StUSP41) that are involved in a variety of stress responses for gene set enrichment analysis (Figure 9C). There are a total of 11 significantly enriched GO terms. Common GO terms include transferase activity, molecular function inhibitor activity, enzyme regulator activity, small molecule binding, catalytic activity, carbohydrate derivative binding, ion binding, carbohydrate binding, DNA-binding transcription factor activity, oxidoreductase activity, and cell recognition. It shows that these four genes may play an important role in binding activity and catalytic activity in response to multiple stresses (Figure 9D). In response to DON stress, the co-expressed gene networks of StUSP13 and StUSP15 are mainly enriched in GO terms to regulate responses to endogenic stimulus, small-molecule metabolic processes, and response to chemical.The StUSP14 co-expressed gene network is significantly enriched in GO terms to regulate transmembrane transporter activity, cellular metabolic processes, and other biological processes. We suspect that these genes may respond to DON stress by regulating ion balance and cell metabolism. Among the genes that respond to injury stress, the StUSP41 co-expressed gene network is significantly enriched in response to abiotic stimulus and transmembrane transporter activity. The StUSP14 co-expressed gene network is significantly enriched in biological processes such as transmembrane transporter activity, response to abiotic stimulus, regulation of biological process, and secondary metabolic process.This suggests that our genes may respond to the damage caused by mechanical damage to plants by regulating transmembrane transporter activity and secondary metabolic pathways. Interestingly, the StUSP13, StUSP14, StUSP15, and StUSP41 genes have the same expression patterns in the two stresses, so we speculate that these genes are closely related to stress response.
KEGG enrichment analysis shows (Figure 9E) that in the process of DON stress response, the genes co-expressed with StUSP13 are significantly enriched in the biosynthesis of isoflavones, plant-pathogen response, plant hormone signal transduction, MAPK signaling pathway, and other metabolic processes, and the genes co-expressed with StUSP14 are significantly enriched in the amino acid metabolism process, plant-pathogen response process, starch and sucrose metabolism process, MAPK signaling pathway, and secondary metabolite synthesis. The biosynthesis of flavonoids, plant-pathogen response, phenylpropane biosynthesis, amino acid metabolism, and secondary metabolite synthesis processes of genes co-expressed with StUSP15 are significantly enriched. In the process of mechanical damage response, the genes co-expressed with StUSP14 are significantly enriched in the biosynthesis of flavonoids, the biosynthesis of phenylpropane, the plant-pathogen response, plant hormone signal transduction, and the synthesis of secondary metabolites, and the genes co-expressed with StUSP41 are significantly enriched in the biosynthesis of flavonoids, the biosynthesis of phenylpropane, the plant-pathogen response, the biosynthesis of isoflavones, and the synthesis of secondary metabolites.
Figure 9.
WGCNA analysis of differential gene co-expression networks. (A,B) Correlation between modules-central gene and corresponding p-values (in parentheses). The colored panel on the left shows the individual module information. The color code on the right shows the correlation between modules-central gene. (C) Eight modules with a correlation greater than 0.7 to the central gene construct a gene co-expression network, where dots represent genes and lines indicate that they have co-expression relationships. (D) Bubble map of Go enrichment analysis of coexpressed gene sets of key modules, showing the path of p-value<0.05. (E) Bubble map of KEGG enrichment analysis of coexpressed gene sets of key modules, showing the path of p-value<0.05.
2.10. qRT-PCR Verifies StUSP Gene Expression
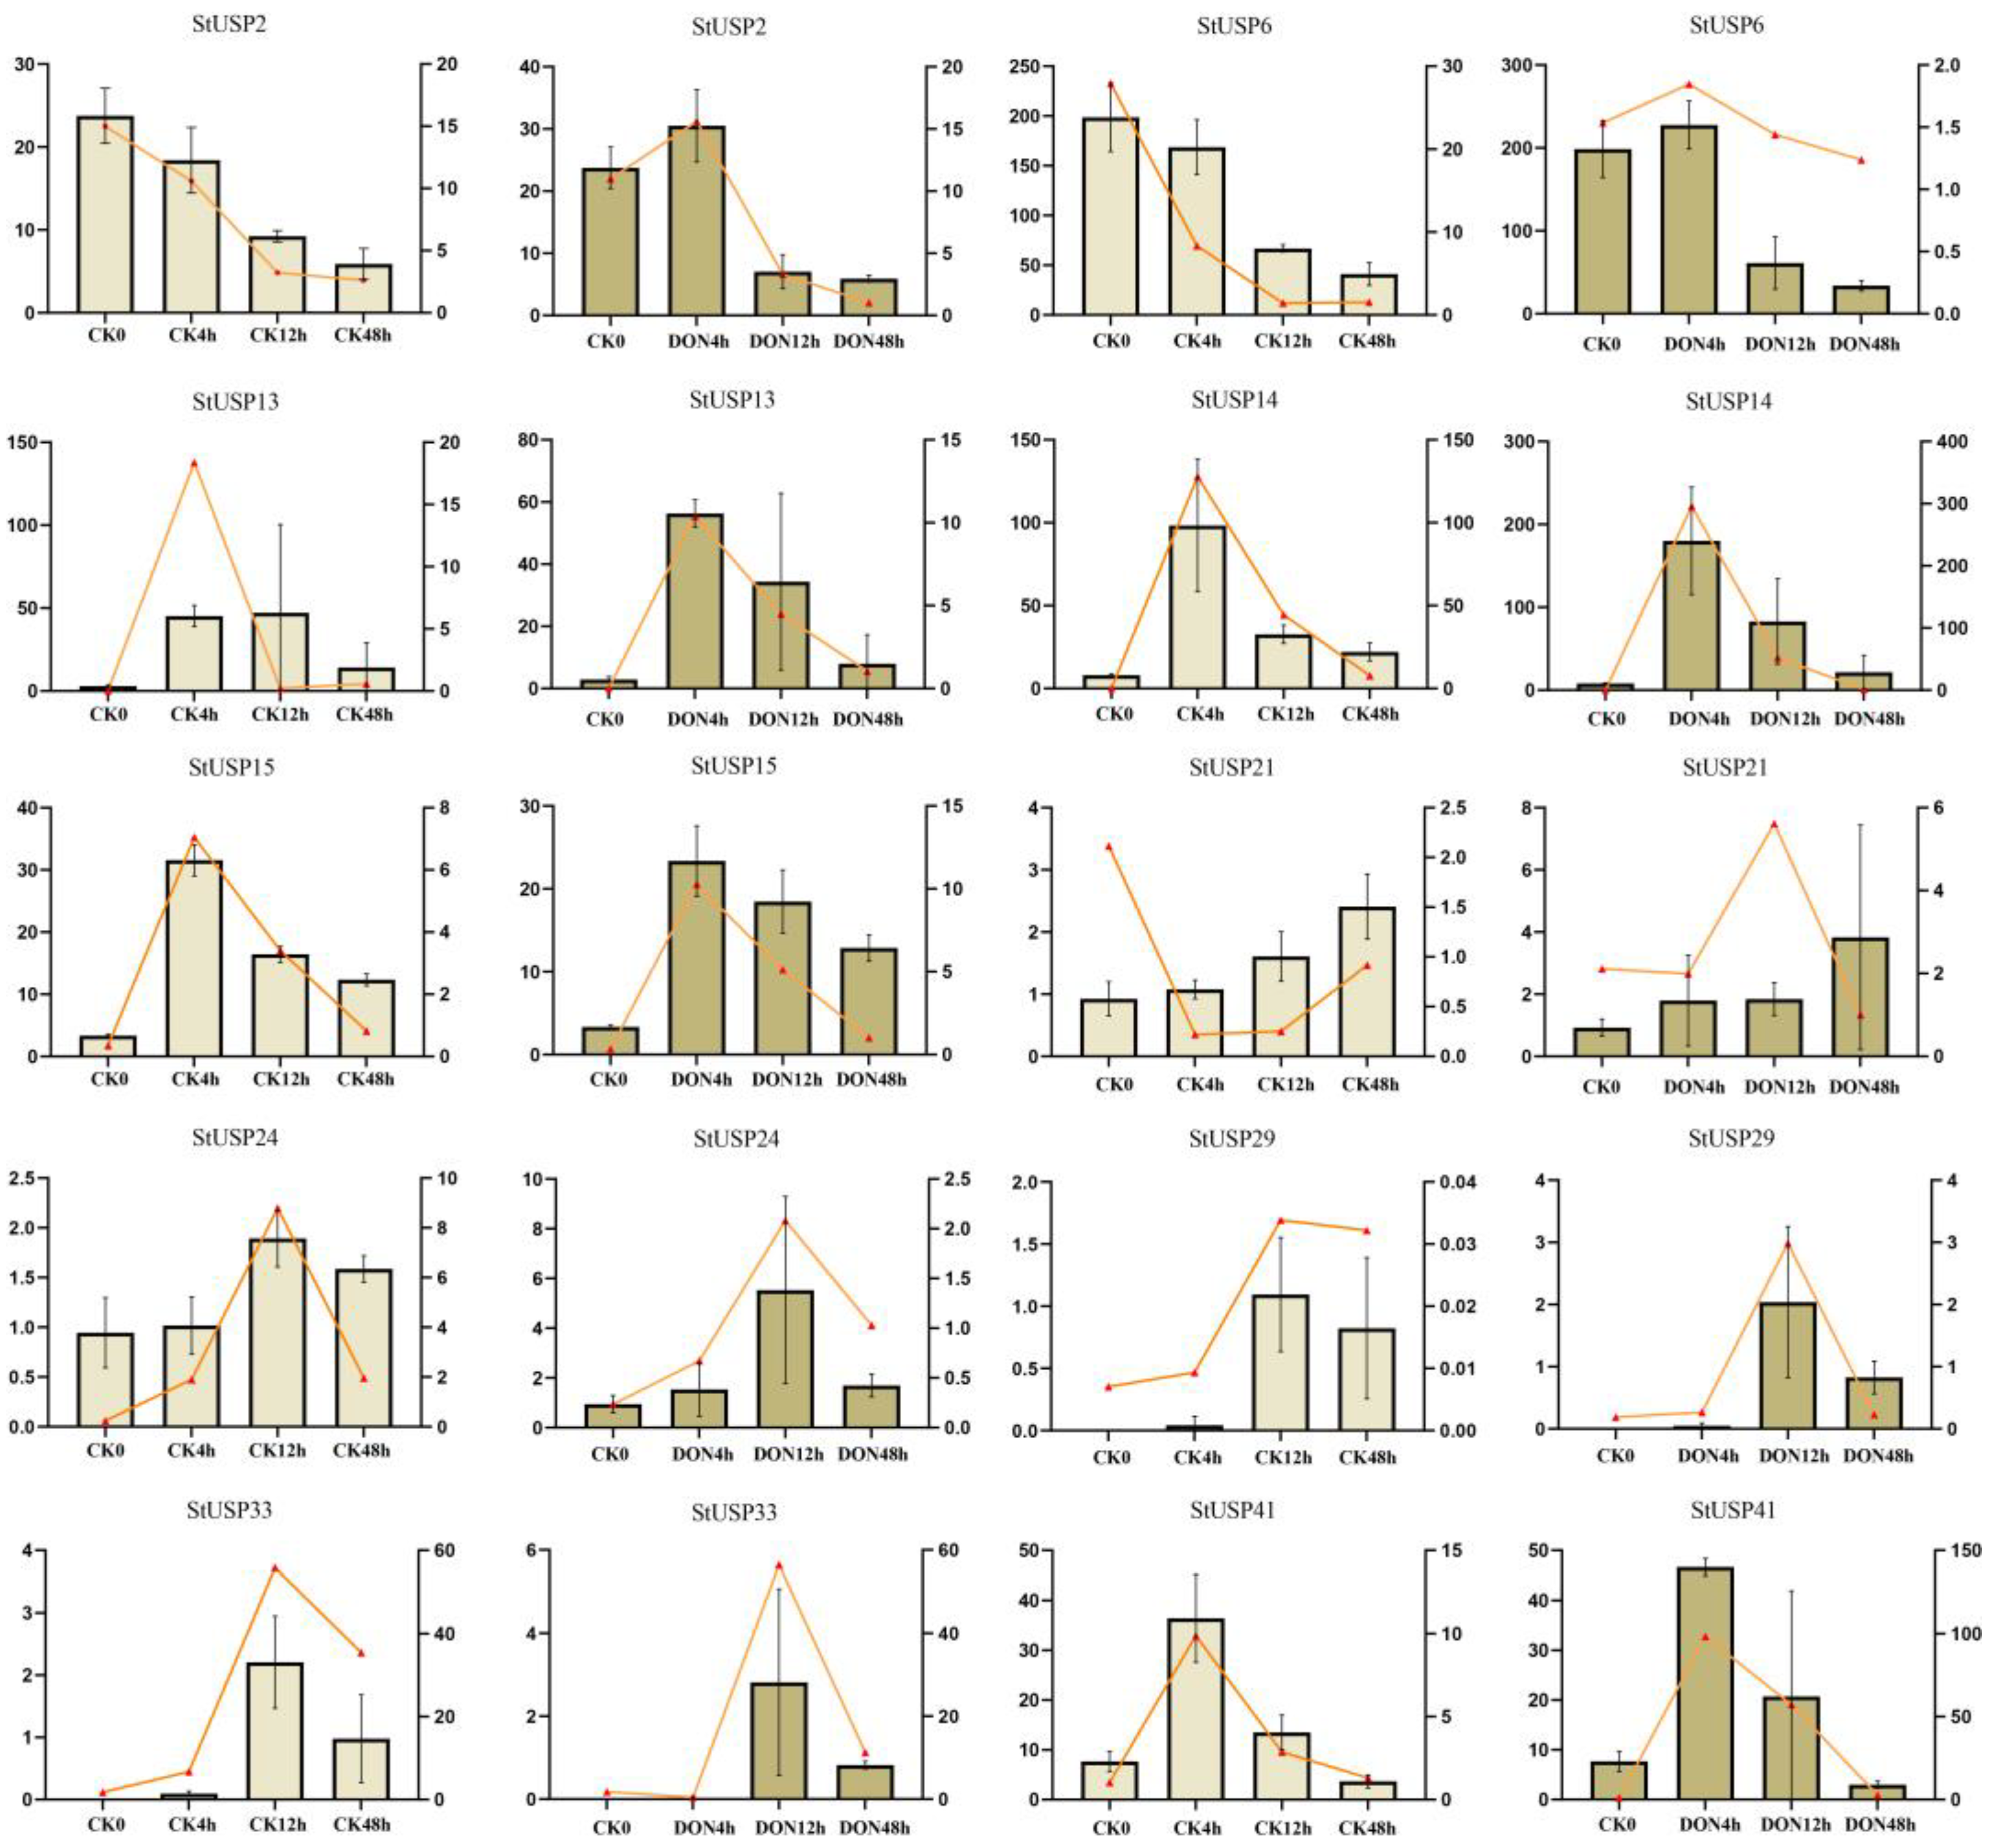
Based on RNA-seq, we speculate that 10 StUSP genes (StUSP2, 6, 13, 14, 15, 21, 24, 29, 33, and 41) in potatoes are involved in the adversity response process of potatoes. We used quantitative real-time fluorescence quantitative PCR (qRT-PCR) to quantitatively determine the expression of potato mRNA at different mechanical damage and DON stress levels. β-actin protein is used as an internal reference gene for gene normalization. The expression trends of genes in RNA-Seq and qRT-PCR are basically similar. Some differences in gene expression trends may be due to experimental errors in RNA-Seq or qRT-PCR. In the process of multiple stress responses, the expression of genes StUSP13, StUSP14, StUSP15, and StUSP41 is relatively high at 4 h. The expression of genes StUSP24, StUSP29, and StUSP33 is relatively high at 12 h. The gene expression levels of StUSP13, StUSP14, and StUSP41 are significantly induced in the response process to multiple stresses. In the response process to multiple stresses, the expression of the StUSP14 gene is the highest among all genes. This gene exhibits significant response characteristics to mechanical damage and DON stress. The primers are listed in the supplementary document (Figure S9).
Figure 10.
Gene expression levels are based on RNA-Seq FPKM and qRT-PCR. CK0h represents the control group; CK4h, CK12h, and CK48h represent 4h, 12h, and 48h after mechanical damage treatment, respectively. DON4h, DON12h, and DON48h stand for 4h, 12h, and 48h after treatment with DON toxin, respectively. The bar chart and the left y axis represent FPKM, and the line chart and the right y axis represent q-RT-PCR.
3. Disscussion
USPs are widely distributed in various organisms and are an important part of the defense system. Through cellular tolerance mechanisms, organisms are endowed with tolerance to multiple stress responses [22]. In plants, USPs are directly involved in many physiological and metabolic activities and play an important role in regulating plant growth and development [42], resisting environmental interference [43], and responding to biological and abiotic stresses [44]. A large number of USPs have been identified in plants that respond to abiotic stress, such as Arabidopsis [45], cotton [46], barley (Hordeum vulgare) [47], rice [24], wheat (Triticum aestivum) [27], and Pigeonpea (Cajanus cajan) [48], but few USPs have been identified with functional characteristics. The identification of the total StUSP gene and the response pattern of the StUSP gene under adversity conditions are important steps in understanding its downstream signaling and determining its regulatory pathway. These proteins have not been reported to have specific functions in potatoes, so the lack of genome-wide analysis of genes containing USP domains hinders a comprehensive understanding of the evolutionary history and biological functions of potato StUSPs. Among the large number of StUSP gene members, we have prioritized the StrUSP gene that responds to adversity. Genome-wide analysis of the USP gene family has been identified in many species, and a single plant genome may usually contain 20–50 members [49], including 44 members in Arabidopsis [45], 85 in wheat [27], 42 in tomato [50], 21 in grape (Vitis vinifera) [51], 32 in Dan-Shen Root (Salvia miltiorrhiza) [52], and so on.
A total of 108 potato StUSP genes were identified in this study, more than those in Arabidopsis, rice, tomato, and coyote tobacco. As a homologous tetraploid, the genome size of the Atlantic potato is 2.57 Gb [53], while the genome sizes of Arabidopsis [54], rice [55], tomato [56], and coyote tobacco [57] are 116 Mb, 363 Mb, 802 Mb, and 2.254 Gb, respectively. In this case, there may be a direct correlation between the number of USP genes and genome size in these plants. It is reported that polyploidy and gene region-specific duplication (tandem duplication and Segmental duplication) are important mechanisms for the generation and expansion of plant gene families [58].
In our study, based on phylogenetic analysis and collinear analysis, it was found that the members of the AtUSPs gene family of Arabidopsis thaliana can divide the USPs in potatoes into four subgroups. Most subgroups contain AtUSP members from Arabidopsis. However, in the USP3 subgroup, some StUSPs are not divided into clusters with AtUSPs, which indicates that they may not come from a common ancestor with Arabidopsis. In addition, the USP gene family can also undergo species-specific differentiation after separation. The evolutionary relationship between species is presented by the number of collinear gene pairs. In order to reveal the similarity and evolutionary relationship of USPs between different species, the collinear relationship between four other representative plants and StUSP homologous genes is analyzed. The results showed that StUSPs had the highest homology with USPs in tomatoes and relatively low homology with USPs in coyote tobacco. Studies have shown that the differentiation of homologous genes caused by gene duplication can promote the production of new characteristics or functions of genes. Over time, the functions of gene family members have also changed. A total of 4 pairs of tandem repeat genes and 202 pairs of Segmental duplication genes were identified in the potato StUSP gene family, which indicates that Segmental duplication events are the main source of amplification of the StUSP gene family in potatoes. This result may be due to the homologous tetraploid of Atlantic potatoes.
The evolution of gene families depends to a large extent on the arrangement of gene structure. The different nucleotide sequence lengths of StUSPs between different subgroups and even different members of the same subgroups indicate the complexity of the Atlantic potato genome. The molecular weight and isoelectric point values of StUSPs proteins and other physical and chemical properties are also different between family members, which indicates that there are differences in their functions. In addition, the StUSPs protein contains 10 conserved motifs of different compositions, and members of the same subgroup contain similar motif types and numbers of motifs, proving the conserved nature and diversity of the potato StUSPs gene family. The composition of StUSPs exons and introns varies greatly between the subgroups, but the genetic structure of the members of the same subgroups is very different, which shows that the StUSPs genes in the subgroups are highly conserved. The gene structure of the members of the USP1 and USP2 subgroups is highly similar. Most gene members have 4 exons and 3 introns, as well as 3 exons and 2 introns splicing patterns. Such genes account for more than 50% of the entire StUSP gene family. The members of the USP4 subgroup have the largest number of introns and still exhibit low expression patterns under multiple stresses. We speculate that the genetic structure differences of the members are large because intron insertion events occur in the domain region of StUSPs very occasionally, and this intron pattern remains conserved during long-term evolution. The number of introns is positively correlated with the time required for gene transcription and translation. The smaller the number of introns, the faster the gene is expressed when the environment changes, thereby performing a more effective function [59]. The results showed that StUSP13, StUSP14, StUSP15, and StUSP41 all contain splicing patterns of 4 exons and 3 introns. Therefore, we speculate that these two genes may have a more important function in responding to multiple stresses. The StUSPs protein is composed of a highly conserved USP family protein domain, and the evolutionarily closely related proteins are more similar in the composition of the conserved domain. In addition to the characteristic domains, most proteins also contain STK_N, STKc_IRAK, CYCLIN_AtCycD-like_rpt2, and PKc_like superfamily domains. The structural diversity of protein domains may be one of the reasons why StUSPs have multiple physiological and metabolic functions.
The cis-regulatory elements of the promoter play a key role in initiating gene expression, and the presence of different CIS-regulatory elements in the promoter sequence may lead to different gene expression patterns [60]. Through the analysis of cis-acting elements, genes with specific functions related to plant adversity responses can be effectively screened in plants. In this study, a total of 40 Cis-element sequences related to stress response were identified in the promoter region of the StUSPs gene, and each member contains at least 10 or more elements, which indicates that the expression of the StUSPs gene family is affected by environmental stress. Among these elements, 10 are related to plant hormone response, 24 are related to light response elements, and 3 are related to stress regulatory elements. The diverse cis regulatory elements in the promoter region of the StUSPs gene may also reflect functional differentiation at the transcriptional level.
Previous reports have shown that the AtUSP promoter can be highly induced by a variety of abiotic stress sources and can produce multiple stress tolerances [61]. In another study of cotton plants, it was found that the promoter of the USP gene responds to ABA, salt stress, and heavy metals [62]. In addition, the wild tomato USP gene was induced by ABA, injury, and cold stress [39]. This shows that the regulatory elements of the StUSPs gene play an important role in the potato's defense against different environmental stresses and can effectively regulate the potato's cell tolerance after environmental stress and maintain a normal growth state.
In a variety of plants, USPs genes have been shown to be related to biological and abiotic stress. For example, the function of SlRd2 in tomatoes regulates SlCipk6-mediated ROS production [63]. A universal stress protein in MsUSPA is involved in regulating the synthesis of hormones and secondary metabolites. Overexpression of MsUSPA can increase the activity of antioxidant enzymes and reduce the accumulation of ROS [64]. In cottons, GhUSP1 and GhUSP2 are involved in the response to salt stress [65]. In this study, gene expression data was used to analyze the functional effects of the StUSPS gene and identify the different expression patterns of the StUSPS gene under different abiotic stresses. The results showed that there is functional differentiation of the StUSPS gene between different subgroups. The USP3 and USP4 subgroups are insensitive to stress response, and the response of the USP1 and USP2 subgroups to stress is closely related to the response time. Generally speaking, genes with similar structures are gathered in the same superfamily, and these genes may have similar biological functions. According to the expression pattern of AT2g47710 (AtUSP10) , it was significantly induced under salt stress and osmotic stress conditions [66]. In the process of identifying drought-responsive universal stress proteins in leafy plants, AT3g62550 is considered to be involved in drought stress response [67]. Studies have shown that the accumulation of At2g21620 protein under abiotic stress is significantly increased [68], At3g03270 can be induced by ERF-VII protein RAP2.12 (related to Apetala 2.12), and regulates the production of ROS in Arabidopsis [69]. Therefore, homologous clusters in the USP1 and USP2 subgroups may have similar functions. In this study, StUSP13 and StUSP14 in the same cluster as Arabidopsis AT2g47710 and AT3g62550, StUSP15 in the same cluster as At2g21620, and StUSP41 in the same cluster as At3g03270 showed similar response patterns under mechanical damage and toxin stress. These genes may be involved in the response to mechanical damage and toxic stress.
In this study, there are different expression patterns between StUSPs genes, and it is inferred that the functional differentiation of family gene members should also coexist. For example, StUSP13 and StUSP14 belong to tandem repeat gene pairs. The results of the study showed that StUSP13 and StUSP14 were significantly upregulated in the early stages of the two stress treatments. Among them, the expression levels of these two genes were particularly high after 4 hours of treatment, while StUSP19 was repeated as a Segmental of StUSP13 and StUSP14 gene pairs and showed low expression levels in all time periods of the two stress treatments. In theory, there are non-functional, neofunctional, and sub-functional evolutionary directions for repetitive genes. It is inferred that in the long process of evolution, StUSP19 has degenerated and lost its original function.
The results of RNA-Seq analysis showed that under mechanical damage and DON stress, the expression of StUSP15 and StUSP41 of the USP1 subgroup and StUSP13 and StUSP14 of the USP2 subgroup were significantly induced, and under 4 hours of stress, the gene expression level of StUSP14 was the highest. By analyzing the differential gene conditions and gene expression levels under stress, it was found that these genes showed significant responses in the process of multiple stress responses and showed positive responses to adversity. It is reported that USPs are mainly involved in the regulatory process related to stress response. [70,71,72] According to the expression law of USPs in other organisms, StUSPs can be used as a key resistance gene for functional research. It is speculated that they may have the regulatory effect of enhancing the potato's resistance to fungal infection and maintaining normal life activity. In order to further understand the functions of StUSP13, StUSP14, StUSP15, and StUSP41, we used them as the central genes for WGCNA analysis by screening the co-expression network module and then performing gene enrichment annotation and KEGG enrichment analysis on the co-expressed genes in the module. The results of gene set enrichment analysis show that the genes co-expressed with them in the response to multiple stresses are significantly enriched in regulating ion binding, transmembrane transporter activity, and cell response to stimulation. This shows that different regulatory factors and regulatory gene networks play an important role in specific biological functions. KEGG enrichment analysis showed that StUSP13 and StUSP14 are mainly involved in plant hormone signal transduction, plant response to pathogens, and MAPK signal transduction by regulating co-expressed genes, while StUSP15 and StUSP41 are mainly involved in phenylpropane biosynthesis, flavonoid biosynthesis, isoflavone biosynthesis, and the synthesis of secondary metabolites in response to the damage caused by adversity to potatoes. The metabolism and signal transduction processes of these substances enhance the defense against adversity by adjusting the cell's own tolerance to environmental stress in response to the production of reactive oxygen species (ROS), effective protein turnover, and changes in Ca2+ cell levels under mechanical damage.
The results of the study show that StUSP13, StUSP14, StUSP15, and StUSP41 are regulatory genes of the potato StUSP gene family in response to multiple stresses. In addition, the expression patterns of 10 StUSPS genes under mechanical damage and DON toxin stress were analyzed by qRT-PCR. In addition to StUSP2, StUSP6, and StUSP21, a total of seven genes are significantly regulated by the two stress treatments, suggesting that StUSPS may be involved in the crosstalk of different signaling pathways under stress. This study systematically analyzed the biological characteristics and expression patterns of USPs. These analyses not only help to screen valuable candidate StUSPs genes for further functional research but also have important implications for agricultural production and the genetic improvement of potato crop resistance.
4. Material and Methods
4.1. Identification of the USP Gene
In this study, the HMM model of the conserved domain USP (PF00582) of the universal stress protein was downloaded from the PFam website (https://pfam.xfam.org/, accessed on 12 August 2023) [73], and HMMER3.0 was used (http://hmmer.org/download.html, accessed on 27 August 2023) to search for USP candidate gene family members [74]. We obtained the protein sequence of AtUSP from the Arabidopsis database TAIR (http://www.arabidopsis.org/) and compared the sequences of candidate members using the BLASTP method (E≤1e−5) [45]. After manually removing redundant proteins, NCBI-CDD [75] was used to retrieve candidate protein sequences containing complete USP domains in the genome of the Atlantic potato. The genes were renamed according to their position on the chromosome, and they were named StUSP1 to StUSP108.
4.2. Physical Mapping of Genes on Chromosomes and Collinearity Analysis
The start and end locations of all genes on 48 chromosomes were obtained from the potato database (spuddb.uga.edu), and StUSPs collinearity analysis was performed using MCScanX [76]. The presence of segment duplication and tandem duplication events was defined based on the physical location of genes in chromosomes [77], and the ratio of nonsynonymous substitution to synonymous substitution (Ka/Ks) of duplicate gene pairs was determined by KaKs_Calculator [78]. Dual Synteny Plot was used to analyze the collinearity of StUSPs with other species (Arabidopsis, rice, coyote tobacco, and tomato) [79]. TBtools software was used to visualize the results [80].
4.3. Multiple Sequence Alignment and Phylogenetic Analysis
In order to explore the evolutionary relationship of the USP gene family, the Muscle program in MEGA 7 [81] software was used to perform multiple sequence comparisons of USP proteins between potato and Arabidopsis thaliana, and the phylogenetic tree was constructed by the neighbor-joining method. using the maximum likelihood (ML) with 1000 bootstraps and other parameters default. ITOL (https://itol.embl.de/, accessed on 29 August 2023) was adopted to beautify the evolutionary tree.
4.4. Exon-intron, Conserved Motif Analysis, and Cis-acting Element Analysis
The StUSP gene structure (exon-intron) was defined by TBtools software, and the conserved motif of the StUSP protein was obtained from the online MEME program (https://meme-suite.org/, accessed on 28 August 2023) [82]. Use the following parameters: minimum width set to 6 bp, maximum width set to 25 bp, and maximum number of motifs set to 10. The structure and conserved domain of the StUSP gene were visualized by TBtools. The upstream 2000-bp sequence of the start codon of each StUSP gene was obtained from the potato genome through the Plant CARE database for StUSP cis elements in a sequence of gene promoters for on-line retrieval [83].
4.5. Analysis of Physical and Chemical Properties, Secondary Structure, and Subcellular Localization
Amino acid number, molecular weight, isoelectric point, hydrophobic index, and other information about StUSP members were analyzed by ExPASy (https://www.expasy.org/, accessed on 28 August 2023) [84]. WoLF PSORT (https://wolfpsort.hgc.jp, accessed on 4 September 2023) was used to predict protein subcellular localization[85].SOPMA(https://npsa-prabi.ibcp.fr/cgi-bin/npsa_automat.pl?page=npsa_sopma.html, accessed on 28 August 2023) was used to predict the secondary structure of the StUSP protein [86].
4.6. Plant Materials and Stress Treatment
To study the dynamic response of the StUSP gene family to multiple stresses, Atlantic potato tubers were sprayed with 5 ng/mL vomitoxin aqueous solution (DON, purchased from Fermentek, Jerusalem, Israel) at 4 h, 12 h, and 48 h (recorded as DON4 h, DON12 h, and DON48 h). Potato tubers were scratched 1 cm deep with sterile blades at 4h, 12h, and 48h (recorded as CK4h, CK12h, and CK48h), and samples were taken at 0h under sterile water treatment (recorded as CK0h) as a control group. All samples of potato tubers were frozen in liquid nitrogen and stored at -80 °C. All groups of samples were bioreplicated three times. At the same time, the normal-growing potato plants were treated with DON stress and mechanical damage, and the sampling time was the same as above. All samples were frozen in liquid nitrogen and stored at -80 °C, and the samples were bioreplicated three times.
4.9. Analysis of RNA-seq and StUSP Gene Expression
The potato transcriptome sequencing was performed by the Metware company (https://www.metware.cn/) based on the Illumina Novoseq 6000 system. The RNA-seq library was constructed using Illumina Stranded Total RNA Prep (3 bioreplicates at a time). The original data were filtered according to standard to obtain high-quality sequencing data (Clean reads), and then Hisat2 (v2.2.1) was used to locate Clean reads and the Atlantic reference genome [87]. Read counts of genes were standardized by FPKM. Differential genes were identified using the default parameter of the DESeq2 (v1.38.0) package. DEG was identified with the truncation value |log2(fold change)|≥2. P<0.05 was used as the screening criteria [88]. FPKM values of StUSPs genes were extracted to show the expression patterns of StUSPs genes at different processing stages, and heat maps were generated by the Pheatmap (v1.0.12) software package [89]. K-means algorithm was used to perform cluster analysis on differential genes to screen candidate genes [90]. Unigenes were then queried for the Kyoto Encyclopedia of Genes and Genomes (KEGG) [91] and Gene Ontology (GO) [92] to obtain functional annotations. The selected differential genes were analyzed by GO annotation and KEGG enrichment with TBtools software.
4.8. Weighted Gene Co-expression Network Analysis (WGCNA)
The gene co-expression network was constructed using R software (v4.2.1) and WGCNA (v1.71) [93]. The Pearson correlation coefficient was used to construct the inter-gene correlation matrix (the threshold was 0.8). After threshold filtering, the power adjacency function is used to transform the correlation matrix into an adjacency matrix. In order to characterize the nonlinear relationship between genes, a topological overlap matrix (TOM matrix) was constructed from TOM correlation coefficients. The blockwise Modules function of the R software package is used to divide modules and combine similar modules into module eigenvectors (MEs matrix) and eigenmatrixes. The co-expression network was constructed to analyze the correlation between module feature genes and central genes. Network visualization is accomplished by computing the central gene via Cytoscape software (v3.7.2) [94].
4.7. Real-time Quantitative PCR (qRT-PCR) Verification
BIOER's LineGene 9620 real-time fluorescence quantitative PCR system was used to select 10 genes for qRT-PCR analysis, and β-action was used as the reference gene. These genes include StUSP2, StUSP6, StUSP13, StUSP14, StUSP15, StUSP21, StUSP24, StUSP9, StUSP33, and StUSP41, and the primer sequences were designed using prime-blast [95]. Total RNA was extracted from each treated sample using the Total RNA Rapid Extraction Kit (ER501-01, TransGen Biotech, Beijing, China). and reverse-transcribed to cDNA using TransScript®One-Step gDNA Removal and cDNA Synthesis SuperMix (AT311, TransGen Biotech, Beijing, China). qRT-PCR was performed using the ChamQ Universal SYBR qPCR Master Mix (Q711, Vazyme, Nanjing, China) kit. Three independent and repeated data were calculated using the 2−∆∆Ct method [96].
5. Conclusion
In this study, 108 universal stress protein genes were identified from the recently published Atlantic Potato Genome Database and divided into USP1, USP2, USP3, and USP4 subgroups. Each subgroup has a specific gene structure and motif composition. The StUSPs gene is randomly distributed on 39 chromosomes. A total of 4 pairs of gene StUSPs were found to be derived from tandem repeats, and 202 pairs of StUSP genes were derived from Segmental duplication. This shows that Segmental duplication events are the main driving force for the evolution of the potato StUSP gene family. There is a collinear relationship between the potato StUSPs gene and four representative plant homologous genes, which will be conducive to the study of comparative gene functions in the future. The cis-regulatory element of the StUSPs promoter is involved in the regulation of environmental factors such as plant hormones, environmental stress, and light responses. RNA-seq data and qRT-PCR analysis showed that potato StUSP gene members showed different expression patterns under mechanical damage and DON stress, suggesting that potato Universal Stress Protein has obvious functional differentiation. StUSP13, StUSP14, StUSP15, and StUSP41 also exhibit similar response patterns under multiple stresses, and their corresponding gene networks are related to a variety of signal transduction and biological processes of secondary metabolite synthesis. This research provides a new understanding of the structure, evolution, and function of the plant USP gene family and provides valuable information for further research on the biological role of the StUSPs gene in the process of potato adversity.
Supplementary Materials
The following supporting information can be downloaded at the website of this paper posted on Preprints.org.
Author Contributions
T.Q.: Writing-original draft, Formal analysis, Writing-review and editing. F.H., X.Z., J.W., Z.Z. and H.J.: Formal analysis. B.Z., C.D., Y.C.: Data curation. X.F: Conceptualization, Supervision. Y.W.: Conceptualization, Supervision, Writing-original draft. F.L.: Conceptualization, Supervision. All authors have read and agreed to the published version of the manuscript.
Funding
This research was funded by The National Natural Science Foundation of China, grant number U22A20443; Research expenses of Provincial Research Institutes of Heilongjiang Province, grant number CZKYF2023-1-B020; Supported by the Strategic Priority Research Program of the Chinese Academy of Sciences, grant number XDA28030302; Heilongjiang Province Key Research and Development Plan project, grant number GA23B015.
Institutional Review Board Statement
Not applicable.
Informed Consent Statement
Not applicable.
Data Availability Statement
The RNA-seq datasets in this study are available from the NCBl Sequence Read Archive under project PRINA943451 and CNCB Sequence Read Archive under project PRJCA021942.
Conflicts of Interest
The authors declare no conflict of interest.
References
- Han, X.; Yang, R.; Zhang, L.; Wei, Q.; Zhang, Y.; Wang, Y.; Shi, Y. A Review of Potato Salt Tolerance. Int. J. Mol. Sci. 2023, 24, 10726. [Google Scholar] [CrossRef] [PubMed]
- Hameed, A.; Zaidi, S.S.; Shakir, S.; Mansoor, S. Applications of New Breeding Technologies for Potato Improvement. Front. Plant Sci. 2018, 9, 925. [Google Scholar] [CrossRef]
- Zhang, Y.; Li, Y.; Cao, C.; Cao, J.; Chen, W.; Zhang, Y.; Wang, C.; Wang, J.; Zhang, X.; Zhao, X. Dietary flavonol and flavone intakes and their major food sources in Chinese adults. Nutr. Cancer 2010, 62, 1120–1127. [Google Scholar] [CrossRef]
- Kondo, Y.; Higashi, C.; Iwama, M.; Ishihara, K.; Handa, S.; Mugita, H.; Maruyama, N.; Koga, H.; Ishigami, A. Bioavailability of vitamin C from mashed potatoes and potato chips after oral administration in healthy Japanese men. Br. J. Nutr. 2012, 107, 885–892. [Google Scholar] [CrossRef]
- Burlingame, B.; Mouillé, B.; Charrondière, R. Nutrients, bioactive non-nutrients and anti-nutrients in potatoes. J. Food Compos. Anal. 2009, 22, 494–502. [Google Scholar] [CrossRef]
- Monteiro Cordeiro de Azeredo, H.; Carvalho de Matos, M.; Madazio Niro, C. Something to chew on: technological aspects for novel snacks. J. Sci. Food Agric. 2022, 102, 2191–2198. [Google Scholar] [CrossRef] [PubMed]
- Ahmed, H.A.; Barpete, S.; Akdogan, G.; Aydİn, G.; Sancak, C.; Ozcan, S. Efficient regeneration and Agrobacterium tumefaciens mediated genetic transformation of potato (Solanum tuberosum L.). Fresenius Environ. Bull. 2018, 27, 3020–3027. [Google Scholar]
- Loebenstein, G.; Gaba, V. Viruses of potato. Adv. Virus Res. 2012, 84, 209–246. [Google Scholar] [PubMed]
- Wahrenburg, Z.; Benesch, E.; Lowe, C.; Jimenez, J.; Vulavala, V.K.R.; Lü, S.; Hammerschmidt, R.; Douches, D.; Yim, W.C.; Santos, P.; et al. Transcriptional regulation of wound suberin deposition in potato cultivars with differential wound healing capacity. Plant J. 2021, 107, 77–99. [Google Scholar] [CrossRef] [PubMed]
- Liu, J.; Sun, Z.; Zou, Y.; Li, W.; He, F.; Huang, X.; Lin, C.; Cai, Q.; Wisniewski, M.; Wu, X. Pre- and postharvest measures used to control decay and mycotoxigenic fungi in potato (Solanum tuberosum L.) during storage. Crit. Rev. Food Sci. Nutr 2022, 62, 415–428. [Google Scholar] [CrossRef]
- Hou, S.; Ma, J.; Cheng, Y.; Wang, H.; Sun, J.; Yan, Y. The toxicity mechanisms of DON to humans and animals and potential biological treatment strategies. Crit. Rev. Food Sci. Nutr. 2023, 63, 790–812. [Google Scholar] [CrossRef] [PubMed]
- Hao, G.; Tiley, H.; McCormick, S. Chitin Triggers Tissue-Specific Immunity in Wheat Associated with Fusarium Head Blight. Front. Plant Sci. 2022, 13, 832502. [Google Scholar] [CrossRef] [PubMed]
- Kim, D.J.; Bitto, E.; Bingman, C.A.; Kim, H.J.; Han, B.W.; Phillips, G.N., Jr. Crystal structure of the protein At3g01520, a eukaryotic universal stress protein-like protein from Arabidopsis thaliana in complex with AMP. Proteins 2015, 83, 1368–1373. [Google Scholar] [CrossRef] [PubMed]
- Vollmer, A.C.; Bark, S.J. Twenty-Five Years of Investigating the Universal Stress Protein: Function, Structure, and Applications. Adv. Appl. Microbiol. 2018, 102, 1–36. [Google Scholar] [PubMed]
- Nyström, T.; Neidhardt, F.C. Cloning, mapping and nucleotide sequencing of a gene encoding a universal stress protein in Escherichia coli. Mol. Microbiol. 1992, 6, 3187–3198. [Google Scholar] [CrossRef]
- Gustavsson, N.; Diez, A.; Nyström, T. The universal stress protein paralogues of Escherichia coli are co-ordinately regulated and co-operate in the defence against DNA damage. Mol. Microbiol. 2002, 43, 107–117. [Google Scholar] [CrossRef]
- Sousa, M.C.; McKay, D.B. Structure of the universal stress protein of Haemophilus influenzae. Structure 2001, 9, 1135–1141. [Google Scholar] [CrossRef]
- VanBogelen, R.A.; Hutton, M.E.; Neidhardt, F.C. Gene-protein database of Escherichia coli K-12: edition 3. Electrophoresis 1990, 11, 1131–1166. [Google Scholar] [CrossRef] [PubMed]
- Li, W.T.; Wei, Y.M.; Wang, J.R.; Liu, C.J.; Lan, X.J.; Jiang, Q.T.; Pu, Z.E.; Zheng, Y.L. Identification, localization, and characterization of putative USP genes in barley. Theor. Appl. Genet. 2010, 121, 907–917. [Google Scholar] [CrossRef] [PubMed]
- Dhanyalakshmi, K.H.; Nataraja, K.N. Universal stress protein-like gene from mulberry enhances abiotic stress tolerance in Escherichia coli and transgenic tobacco cells. Plant Biol. 2021, 23, 1190–1194. [Google Scholar] [CrossRef] [PubMed]
- Havis, S.; Bodunrin, A.; Rangel, J.; Zimmerer, R.; Murphy, J.; Storey, J.D.; Duong, T.D.; Mistretta, B.; Gunaratne, P.; Widger, W.R.; et al. A Universal Stress Protein That Controls Bacterial Stress Survival in Micrococcus luteus. J. Bacteriol. 2019, 201, e00497–19. [Google Scholar] [CrossRef]
- Shinozaki, K.; Yamaguchi-Shinozaki, K. Gene networks involved in drought stress response and tolerance. J. Exp. Bot. 2007, 58, 221–227. [Google Scholar] [CrossRef] [PubMed]
- Cui, X.; Zhang, P.; Hu, Y.; Chen, C.; Liu, Q.; Guan, P.; Zhang, J. Genome-wide analysis of the Universal stress protein A gene family in Vitis and expression in response to abiotic stress. Plant Physiol. Biochem. 2021, 165, 57–70. [Google Scholar] [CrossRef] [PubMed]
- Park, S.C.; Jung, Y.J.; Lee, Y.; Kim, I.R.; Seol, M.A.; Kim, E.J.; Jang, M.K.; Lee, J.R. Functional characterization of the Arabidopsis universal stress protein AtUSP with an antifungal activity. Biochem. Biophys. Res. Commun. 2017, 486, 923–929. [Google Scholar] [CrossRef] [PubMed]
- Sauter, M.; Rzewuski, G.; Marwedel, T.; Lorbiecke, R. The novel ethylene-regulated gene OsUsp1 from rice encodes a member of a plant protein family related to prokaryotic universal stress proteins. J. Exp. Bot. 2002, 53, 2325–2331. [Google Scholar] [CrossRef] [PubMed]
- Gutiérrez-Beltrán, E.; Personat, J.M.; de la Torre, F.; Del Pozo, O. Universal Stress Protein Involved in Oxidative Stress Is a Phosphorylation Target for Protein Kinase CIPK6. Plant Physiol. 2017, 173, 836–852. [Google Scholar] [CrossRef] [PubMed]
- Hassan, S.; Ahmad, A.; Batool, F.; Rashid, B.; Husnain, T. Genetic modification of Gossypium arboreum universal stress protein (GUSP1) improves drought tolerance in transgenic cotton (Gossypium hirsutum). Physiol. Mol. Biol. Plants 2021, 27, 1779–1794. [Google Scholar] [CrossRef] [PubMed]
- Singh, A.; Singhal, C.; Sharma, A.K.; Khurana, P. Identification of universal stress proteins in wheat and functional characterization during abiotic stress. Plant Cell Rep. 2023, 42, 1487–1501. [Google Scholar] [CrossRef]
- Kerk, D.; Bulgrien, J.; Smith, D.W.; Gribskov, M. Arabidopsis proteins containing similarity to the universal stress protein domain of bacteria. Plant Physiol. 2003, 131, 1209–1219. [Google Scholar] [CrossRef]
- Bhuria, M.; Goel, P.; Kumar, S.; Singh, A.K. The Promoter of AtUSP Is Co-regulated by Phytohormones and Abiotic Stresses in Arabidopsis thaliana. Front. Plant Sci. 2016, 7, 1957. [Google Scholar] [CrossRef]
- Bhuria, M.; Goel, P.; Kumar, S.; Singh, A.K. Genome-wide identification and expression profiling of genes encoding universal stress proteins (USP) identify multi-stress responsive USP genes in Arabidopsis thaliana. Plant Physiol. 2019, 24, 434–445. [Google Scholar] [CrossRef]
- Jung, Y.J.; Melencion, S.M.; Lee, E.S.; Park, J.H.; Alinapon, C.V.; Oh, H.T.; Yun, D.J.; Chi, Y.H.; Lee, S.Y. Universal Stress Protein Exhibits a Redox-Dependent Chaperone Function in Arabidopsis and Enhances Plant Tolerance to Heat Shock and Oxidative Stress. Front. Plant Sci. 2015, 6, 1141. [Google Scholar] [CrossRef] [PubMed]
- Melencion, S.M.B.; Chi, Y.H.; Pham, T.T.; Paeng, S.K.; Wi, S.D.; Lee, C.; Ryu, S.W.; Koo, S.S.; Lee, S.Y. RNA Chaperone Function of a Universal Stress Protein in Arabidopsis Confers Enhanced Cold Stress Tolerance in Plants. Int. J. Mol. Sci. 2017, 18, 2546. [Google Scholar] [CrossRef] [PubMed]
- Bhuria, M.; Goel, P.; Kumar, S.; Singh, A.K. AtUSP17 negatively regulates salt stress tolerance through modulation of multiple signaling pathways in Arabidopsis. Physiol. Plant 2022, 174, 13635. [Google Scholar] [CrossRef] [PubMed]
- Loukehaich, R.; Wang, T.; Ouyang, B.; Ziaf, K.; Li, H.; Zhang, J.; Lu, Y.; Ye, Z. SpUSP, an annexin-interacting universal stress protein, enhances drought tolerance in tomato. J. Exp. Bot. 2012, 63, 5593–5606. [Google Scholar] [CrossRef]
- Gutiérrez-Beltrán, E.; Personat, J.M.; de la Torre, F.; Del Pozo, O. A Universal Stress Protein Involved in Oxidative Stress Is a Phosphorylation Target for Protein Kinase CIPK6. Plant Physiol. 2017, 173, 836–852. [Google Scholar] [CrossRef]
- Hassan, S.; Qadir, I.; Aslam, A.; Rashid, B.; Bilal Sarwar, M.; Husnain, T. Cloning, Genetic Transformation and Cellular Localization of Abiotic Stress Responsive Universal Stress Protein Gene (GUSP1) in Gossypium hirsutum. Iran. J. Biotechnol. 2020, 18, 2312. [Google Scholar]
- Akram, A.; Arshad, K.; Hafeez, M. Cloning and expression of universal stress protein 2 (usp2) gene in Escherichia coli. Biol. Clin. Sci. Res. J. 2021, 2, 2708–2261. [Google Scholar] [CrossRef]
- Udawat, P.; Jha, R.K.; Sinha, D.; Mishra, A.; Jha, B. Overexpression of a Cytosolic Abiotic Stress Responsive Universal Stress Protein (SbUSP) Mitigates Salt and Osmotic Stress in Transgenic Tobacco Plants. Front. Plant Sci. 2016, 7, 518. [Google Scholar] [CrossRef]
- Hassan, S.; Ahmad, A.; Batool, F.; Rashid, B.; Husnain, T. Genetic modification of Gossypium arboreum universal stress protein (GUSP1) improves drought tolerance in transgenic cotton (Gossypium hirsutum). Physiol. Mol. Biol. Plants 2021, 27, 1779–1794. [Google Scholar] [CrossRef]
- Hafeez, M.N.; Khan, M.A.; Sarwar, B.; Hassan, S.; Ali, Q.; Husnain, T.; Rashid, B. Mutant Gossypium universal stress protein-2 (GUSP-2) gene confers resistance to various abiotic stresses in E. coli BL-21 and CIM-496-Gossypium hirsutum. Sci. Rep. 2021, 11, 20466. [Google Scholar] [CrossRef]
- Galindo Blaha, C.A.; Schrank, I.S. An Azospirillum brasilense Tn5 mutant with modified stress response and impaired in flocculation. Antonie Van. Leeuwenhoek 2003, 83, 35–43. [Google Scholar] [CrossRef] [PubMed]
- Sen, S.; Rai, R.; Chatterjee, A.; Rai, S.; Yadav, S.; Agrawal, C.; Rai, L.C. Molecular characterization of two novel proteins All1122 and Alr0750 of Anabaena PCC 7120 conferring tolerance to multiple abiotic stresses in Escherichia coli. Gene 2019, 685, 230–241. [Google Scholar] [CrossRef] [PubMed]
- Merkouropoulos, G.; Andreasson, E.; Hess, D.; Boller, T.; Peck, S.C. An Arabidopsis protein phosphorylated in response to microbial elicitation, AtPHOS32, is a substrate of MAP kinases 3 and 6. J. Biol. Chem. 2008, 283, 10493–10499. [Google Scholar] [CrossRef] [PubMed]
- Kerk, D.; Bulgrien, J.; Smith, D.W.; Gribskov, M. Arabidopsis proteins containing similarity to the universal stress protein domain of bacteria. Plant Physiol. 2003, 131, 1209–1219. [Google Scholar] [CrossRef] [PubMed]
- Maqbool, A.; Zahur, M.; Husnain, T.; Riazuddin, S. GUSP1 and GUSP2, Two Drought-Responsive Genes in Gossypium arboreum Have Homology to Universal Stress Proteins. Plant Mol. Biol. Report. 2009, 27, 109–114. [Google Scholar] [CrossRef]
- Li, W.T.; Wei, Y.M.; Wang, J.R.; Liu, C.J.; Lan, X.J.; Jiang, Q.T.; Pu, Z.E.; Zheng, Y.L. Identification, localization, and characterization of putative USP genes in barley. Theor. Appl. Genet. 2010, 121, 907–917. [Google Scholar] [CrossRef] [PubMed]
- Sinha, P.; Pazhamala, L.T.; Singh, V.K.; Saxena, R.K.; Krishnamurthy, L.; Azam, S.; Khan, A.W.; Varshney, R.K. Identification and Validation of Selected Universal Stress Protein Domain Containing Drought-Responsive Genes in Pigeonpea (Cajanus cajan L.). Front. Plant Sci. 2016, 6, 1065. [Google Scholar] [CrossRef]
- Chi, Y.H.; Koo, S.S.; Oh, H.T.; Lee, E.S.; Park, J.H.; Phan, K.A.T.; Wi, S.D.; Bae, S.B.; Paeng, S.K.; Chae, H.B.; et al. The Physiological Functions of Universal Stress Proteins and Their Molecular Mechanism to Protect Plants From Environmental Stresses. Front. Plant Sci. 2019, 10, 750. [Google Scholar] [CrossRef]
- Diao, J.; Gu, W.; Jiang, Z.; Wang, J.; Zou, H.; Zong, C.; Ma, L. Comprehensive Analysis of Universal Stress Protein Family Genes and Their Expression in Fusarium oxysporum Response of Populus davidiana × P. alba var. pyramidalis Louche Based on the Transcriptome. Int. J. Mol. Sci. 2023, 24, 5405. [Google Scholar] [CrossRef]
- Cui, X.; Zhang, P.; Hu, Y.; Chen, C.; Liu, Q.; Guan, P.; Zhang, J. Genome-wide analysis of the Universal stress protein A gene family in Vitis and expression in response to abiotic stress. Plant Physiol. Biochem. 2021, 165, 57–70. [Google Scholar] [CrossRef] [PubMed]
- Wang, X.F.; Su, J.; Yang, N.; Zhang, H.; Cao, X.Y.; Kang, J.F. Functional Characterization of Selected Universal Stress Protein from Salvia miltiorrhiza (SmUSP) in Escherichia coli. Genes 2017, 8, 224. [Google Scholar] [CrossRef] [PubMed]
- Hoopes, G.; Meng, X.; Hamilton, J.P.; Achakkagari, S.R.; de Alves Freitas Guesdes, F.; Bolger, M.E.; Coombs, J.J.; Esselink, D.; Kaiser, N.R.; Kodde, L.; et al. Phased, chromosome-scale genome assemblies of tetraploid potato reveal a complex genome, transcriptome, and predicted proteome landscape underpinning genetic diversity. Mol. Plant 2022, 15, 520–536. [Google Scholar] [CrossRef] [PubMed]
- Arabidopsis Genome Initiative. Analysis of the genome sequence of the flowering plant Arabidopsis thaliana. Nature 2000, 408, 796–815. [Google Scholar] [CrossRef] [PubMed]
- Duitama, J.; Silva, A.; Sanabria, Y.; Cruz, D.F.; Quintero, C.; Ballen, C.; Lorieux, M.; Scheffler, B.; Farmer, A.; Torres, E.; et al. Whole genome sequencing of elite rice cultivars as a comprehensive information resource for marker assisted selection. PLoS ONE 2015, 10, e0124617. [Google Scholar] [CrossRef] [PubMed]
- Tomato Genome Consortium. The tomato genome sequence provides insights into fleshy fruit evolution. Nature 2012, 485, 635–641. [Google Scholar] [CrossRef] [PubMed]
- Xu, S.; Brockmöller, T.; Navarro-Quezada, A.; Kuhl, H.; Gase, K.; Ling, Z.; Zhou, W.; Kreitzer, C.; Stanke, M.; Tang, H.; et al. Wild tobacco genomes reveal the evolution of nicotine biosynthesis. Proc. Natl. Acad. Sci. USA 2017, 114, 6133–6138. [Google Scholar] [CrossRef]
- Zafar, M.M.; Rehman, A.; Razzaq, A.; Parvaiz, A.; Mustafa, G.; Sharif, F.; Mo, H.; Youlu, Y.; Shakeel, A.; Ren, M. Genome-wide characterization and expression analysis of Erf gene family in cotton. BMC Plant Biol. 2022, 22, 134. [Google Scholar] [CrossRef]
- Vadde, B.V.L. Not-so-selfish DNA? Intronic enhancers fine-tune spatiotemporal gene expression. Plant Cell 2021, 33, 1851–1852. [Google Scholar] [CrossRef]
- Oudelaar, A.M.; Higgs, D.R. The relationship between genome structure and function. Nat. Rev. Genet. 2021, 22, 154–168. [Google Scholar] [CrossRef]
- Bhuria, M.; Goel, P.; Kumar, S.; Singh, A.K. Genome-wide identification and expression profiling of genes encoding universal stress proteins (USP) identify multi-stress responsive USP genes in Arabidopsis thaliana. Plant Physiol. Rep. 2019, 24, 434–445. [Google Scholar] [CrossRef]
- Zahur, M.; Maqbool, A.; Ifran, M.; Barozai, M.Y.; Rashid, B.; Riazuddin, S.; Husnain, T. Isolation and functional analysis of cotton universal stress proteinpromoter in response to phytohormones and abiotic stresses. Mol. Biol. 2009, 43, 628–635. [Google Scholar] [CrossRef]
- Wu, Y.; Zuo, L.; Ma, Y.; Jiang, Y.; Gao, J.; Tao, J.; Chen, C. Protein Kinase RhCIPK6 Promotes Petal Senescence in Response to Ethylene in Rose (Rosa Hybrida). Genes. 2022, 13, 1989. [Google Scholar] [CrossRef] [PubMed]
- Yang, M.; Che, S.; Zhang, Y.; Wang, H.; Wei, T.; Yan, G.; Song, W.; Yu, W. Universal stress protein in Malus sieversii confers enhanced drought tolerance. J. Plant Res. 2019, 132, 825–837. [Google Scholar] [CrossRef] [PubMed]
- Merkouropoulos, G.; Tsaftaris, A.S. Differential Expression of Gossypium hirsutum USP-Related Genes, GhUSP1 and GhUSP2, During Development and upon Salt Stress. Plant Mol. Biol. Rep. 2013, 31, 1539–1547. [Google Scholar] [CrossRef]
- Cho, K.H.; Kim, M.Y.; Kwon, H.; Yang, X.; Lee, S.H. Novel QTL identification and candidate gene analysis for enhancing salt tolerance in soybean (Glycine max (L.) Merr.). Plant Sci. 2021, 313, 111085. [Google Scholar] [CrossRef] [PubMed]
- Arabia, S.; Sami, A.A.; Akhter, S.; Sarker, R.H.; Islam, T. Comprehensive in silico Characterization of Universal Stress Proteins in Rice (Oryza sativa L.) With Insight Into Their Stress-Specific Transcriptional Modulation. Front. Plant Sci 2021, 12, 712607. [Google Scholar] [CrossRef] [PubMed]
- Kazuko, Y.S.; Masahiro, K.; Satomi, U.; Kazuo, S. Molecular cloning and characterization of 9 cdnas for genes that are responsive to desiccation in arabidopsis thaliana: sequenceanalysis of one cdna clone that encodes a putative transmembrane channel protein. Plant Cell Physiol. 1992, 3, 217–224. [Google Scholar]
- Gonzali, S.; Loreti, E.; Cardarelli, F.; Novi, G.; Parlanti, S.; Pucciariello, C.; Bassolino, L.; Banti, V.; Licausi, F.; Perata, P. Universal stress protein HRU1 mediates ROS homeostasis under anoxia. Nat. Plants 2015, 1, 15151. [Google Scholar] [CrossRef] [PubMed]
- Ye, X.; van der Does, C.; Albers, S.V. SaUspA, the Universal Stress Protein of Sulfolobus acidocaldarius Stimulates the Activity of the PP2A Phosphatase and Is Involved in Growth at High Salinity. Front. Microbiol. 2020, 11, 598821. [Google Scholar] [CrossRef]
- de Souza, C.S.; Torres, A.G.; Caravelli, A.; Silva, A.; Polatto, J.M.; Piazza, R.M. Characterization of the universal stress protein F from atypical enteropathogenic Escherichia coli and its prevalence in Enterobacteriaceae. Protein Sci. 2016, 25, 2142–2151. [Google Scholar] [CrossRef] [PubMed]
- Udawat, P.; Mishra, A.; Jha, B. Heterologous expression of an uncharacterized universal stress protein gene (SbUSP) from the extreme halophyte, Salicornia brachiata, which confers salt and osmotic tolerance to E. coli. Gene 2014, 536, 163–170. [Google Scholar] [CrossRef] [PubMed]
- Mistry, J.; Chuguransky, S.; Williams, L.; Qureshi, M.; Salazar, G.A.; Sonnhammer, E.L.L.; Tosatto, S.C.E.; Paladin, L.; Raj, S.; Richardson, L.J.; et al. Pfam: The protein families database in 2021. Nucleic Acids Res. 2021, 49, D412–D419. [Google Scholar] [CrossRef] [PubMed]
- Mistry, J.; Finn, R.D.; Eddy, S.R.; Bateman, A.; Punta, M. Challenges in homology search: HMMER3 and convergent evolution of coiled-coil regions. Nucleic Acids Res. 2013, 41, e121. [Google Scholar] [CrossRef]
- Marchler-Bauer, A.; Derbyshire, M.K.; Gonzales, N.R.; Lu, S.; Chitsaz, F.; Geer, L.Y.; Geer, R.C.; He, J.; Gwadz, M.; Hurwitz, D.I.; et al. CDD: NCBI’s conserved domain database. Nucleic Acids Res. 2015, 43, D222–D226. [Google Scholar] [CrossRef] [PubMed]
- Wang, Y.; Tang, H.; Debarry, J.D.; Tan, X.; Li, J.; Wang, X.; Lee, T.H.; Jin, H.; Marler, B.; Guo, H.; et al. MCScanX: a toolkit for detection and evolutionary analysis of gene synteny and collinearity. Nucleic Acids Res. 2012, 40, e49. [Google Scholar] [CrossRef]
- Panchy, N.; Lehti-Shiu, M.; Shiu, S.H. Evolution of Gene Duplication in Plants. Plant Physiol. 2016, 171, 2294–2316. [Google Scholar] [CrossRef]
- Zhang, Z.; Li, J.; Zhao, X.Q.; Wang, J.; Wong, G.K.; Yu, J. KaKs_Calculator: calculating Ka and Ks through model selection and model averaging. Genom. Proteom. Bioinform. 2006, 4, 259–263. [Google Scholar] [CrossRef]
- Tang, H.; Bowers, J.E.; Wang, X.; Ming, R.; Alam, M.; Paterson, A.H. Synteny and collinearity in plant genomes. Science 2008, 320, 486–488. [Google Scholar] [CrossRef]
- Chen, C.; Chen, H.; Zhang, Y.; Thomas, H.R.; Frank, M.H.; He, Y.; Xia, R. TBtools: An Integrative Toolkit Developed for Interactive Analyses of Big Biological Data. Mol. Plant 2020, 13, 1194–1202. [Google Scholar] [CrossRef] [PubMed]
- Kumar, S.; Stecher, G.; Tamura, K. MEGA7: Molecular Evolutionary Genetics Analysis Version 7.0 for Bigger Datasets. Mol. Biol. Evol. 2016, 33, 1870–1874. [Google Scholar] [CrossRef] [PubMed]
- Bailey, T.L.; Boden, M.; Buske, F.A.; Frith, M.; Grant, C.E.; Clementi, L.; Ren, J.; Li, W.W.; Noble, W.S. Meme Suite: tools for motif discovery and searching. Nucleic Acids Res. 2009, 37, W202–W208. [Google Scholar] [CrossRef] [PubMed]
- Lescot, M.; Déhais, P.; Thijs, G.; Marchal, K.; Moreau, Y.; Van de Peer, Y.; Rouzé, P.; Rombauts, S. PlantCARE, a database of plant cis-acting regulatory elements and a portal to tools for in silico analysis of promoter sequences. Nucleic Acids Res. 2002, 30, 325–327. [Google Scholar] [CrossRef] [PubMed]
- Gasteiger, E.; Gattiker, A.; Hoogland, C.; Ivanyi, I.; Appel, R.D.; Bairoch, A. ExPASy: The proteomics server for in-depth protein knowledge and analysis. Nucleic Acids Res. 2003, 31, 3784–3788. [Google Scholar] [CrossRef] [PubMed]
- Horton, P.; Park, K.J.; Obayashi, T.; Fujita, N.; Harada, H.; Adams-Collier, C.J.; Nakai, K. WoLF PSORT: protein localization predictor. Nucleic Acids Res. 2007, 35, W585–W587. [Google Scholar] [CrossRef] [PubMed]
- Geourjon, C.; Deléage, G. SOPMA: significant improvements in protein secondary structure prediction by consensus prediction from multiple alignments. Comput. Appl. Biosci. 1995, 11, 681–684. [Google Scholar] [CrossRef]
- Kim, D.; Paggi, J.M.; Park, C.; Bennett, C.; Salzberg, S.L. Graph-based genome alignment and genotyping with HISAT2 and HISAT-genotype. Nat. Biotechnol. 2019, 37, 907–915. [Google Scholar] [CrossRef] [PubMed]
- Love, M.I.; Huber, W.; Anders, S. Moderated estimation of fold change and dispersion for RNA-seq data with DESeq2. Genome Biol. 2014, 15, 550. [Google Scholar] [CrossRef] [PubMed]
- Kolde R: pheatmap: Pretty Heatmaps.R package version 1.0.12 ed.2019.
- McLachlan, G.J.; Bean, R.W.; Ng, S.K. Clustering. Methods Mol. Biol. 2017, 1526, 345–362. [Google Scholar] [PubMed]
- Kanehisa, M.; Goto, S. KEGG: kyoto encyclopedia of genes and genomes. Nucleic Acids Res. 2000, 28, 27–30. [Google Scholar] [CrossRef] [PubMed]
- Gene Ontology Consortium. Gene Ontology Consortium: going forward. Nucleic Acids Res. 2015, 43, D1049–D1056. [Google Scholar] [CrossRef] [PubMed]
- Langfelder, P.; Horvath, S. WGCNA: an R package for weighted correlation network analysis. BMC Bioinform. 2008, 9, 559. [Google Scholar] [CrossRef] [PubMed]
- Shannon, P.; Markiel, A.; Ozier, O.; Baliga, N.S.; Wang, J.T.; Ramage, D.; Amin, N.; Schwikowski, B.; Ideker, T. Cytoscape: a software environment for integrated models of biomolecular interaction networks. Genome Res. 2003, 13, 2498–2504. [Google Scholar] [CrossRef]
- Ye, J.; Coulouris, G.; Zaretskaya, I.; Cutcutache, I.; Rozen, S.; Madden, T.L. Primer-BLAST: a tool to design target-specific primers for polymerase chain reaction. BMC Bioinform. 2012, 13, 134. [Google Scholar] [CrossRef]
- Yang, Z.; Zhang, R.; Zhou, Z. Identification and Validation of Reference Genes for Gene Expression Analysis in Schima superba. Genes. 2021, 12, 732. [Google Scholar] [CrossRef]
Figure 1.
StUSP chromosome location map The chromosome location map is drawn according to the gene location information on the chromosome. The location of genes can be estimated by referring to the scale on the left.
Figure 1.
StUSP chromosome location map The chromosome location map is drawn according to the gene location information on the chromosome. The location of genes can be estimated by referring to the scale on the left.
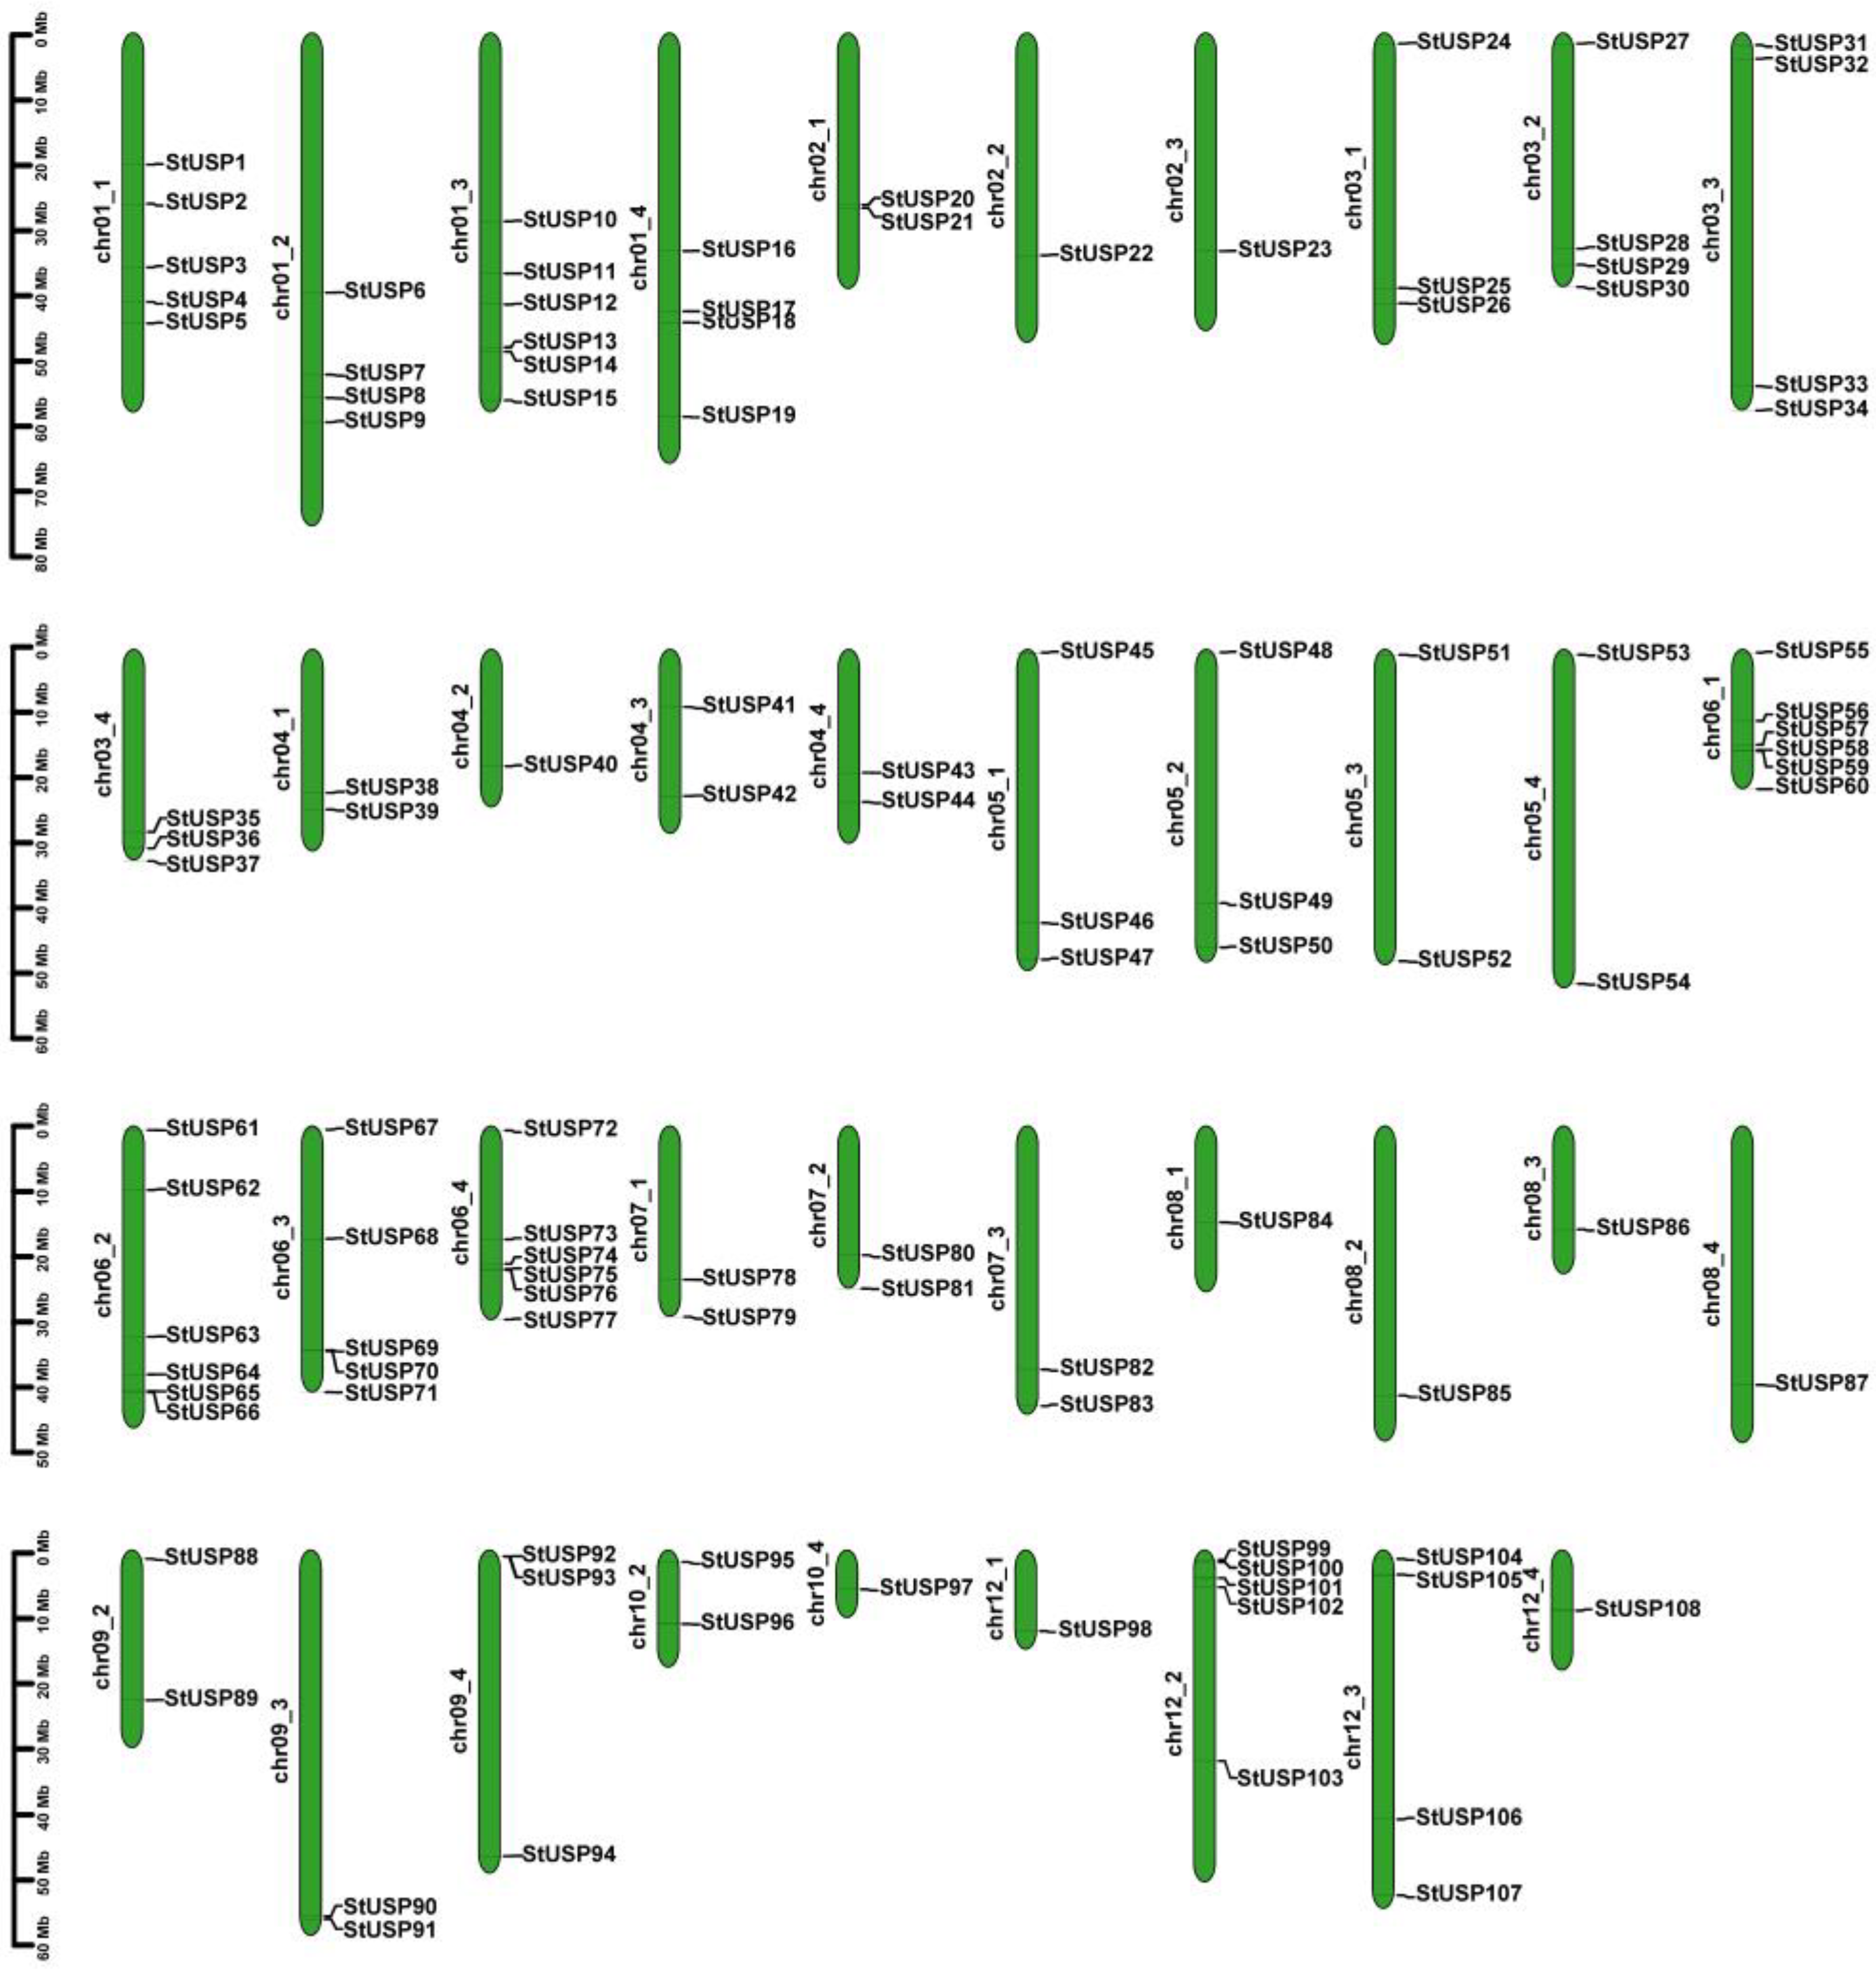
Figure 2.
The synteny analysis of StUSPs in the potato genome The inner and outer rings represent the chromosome skeleton in turn and the gene density heat map (red for high gene density, green for low gene density). GC ratio histogram (the higher the Gc ratio, the higher the histogram). N-ratio histogram (the more unknown bases the chromosome contains at this site,the higher the column). The collinear pairs of StUSPs genes in the potato genome are highlighted by colored lines. .
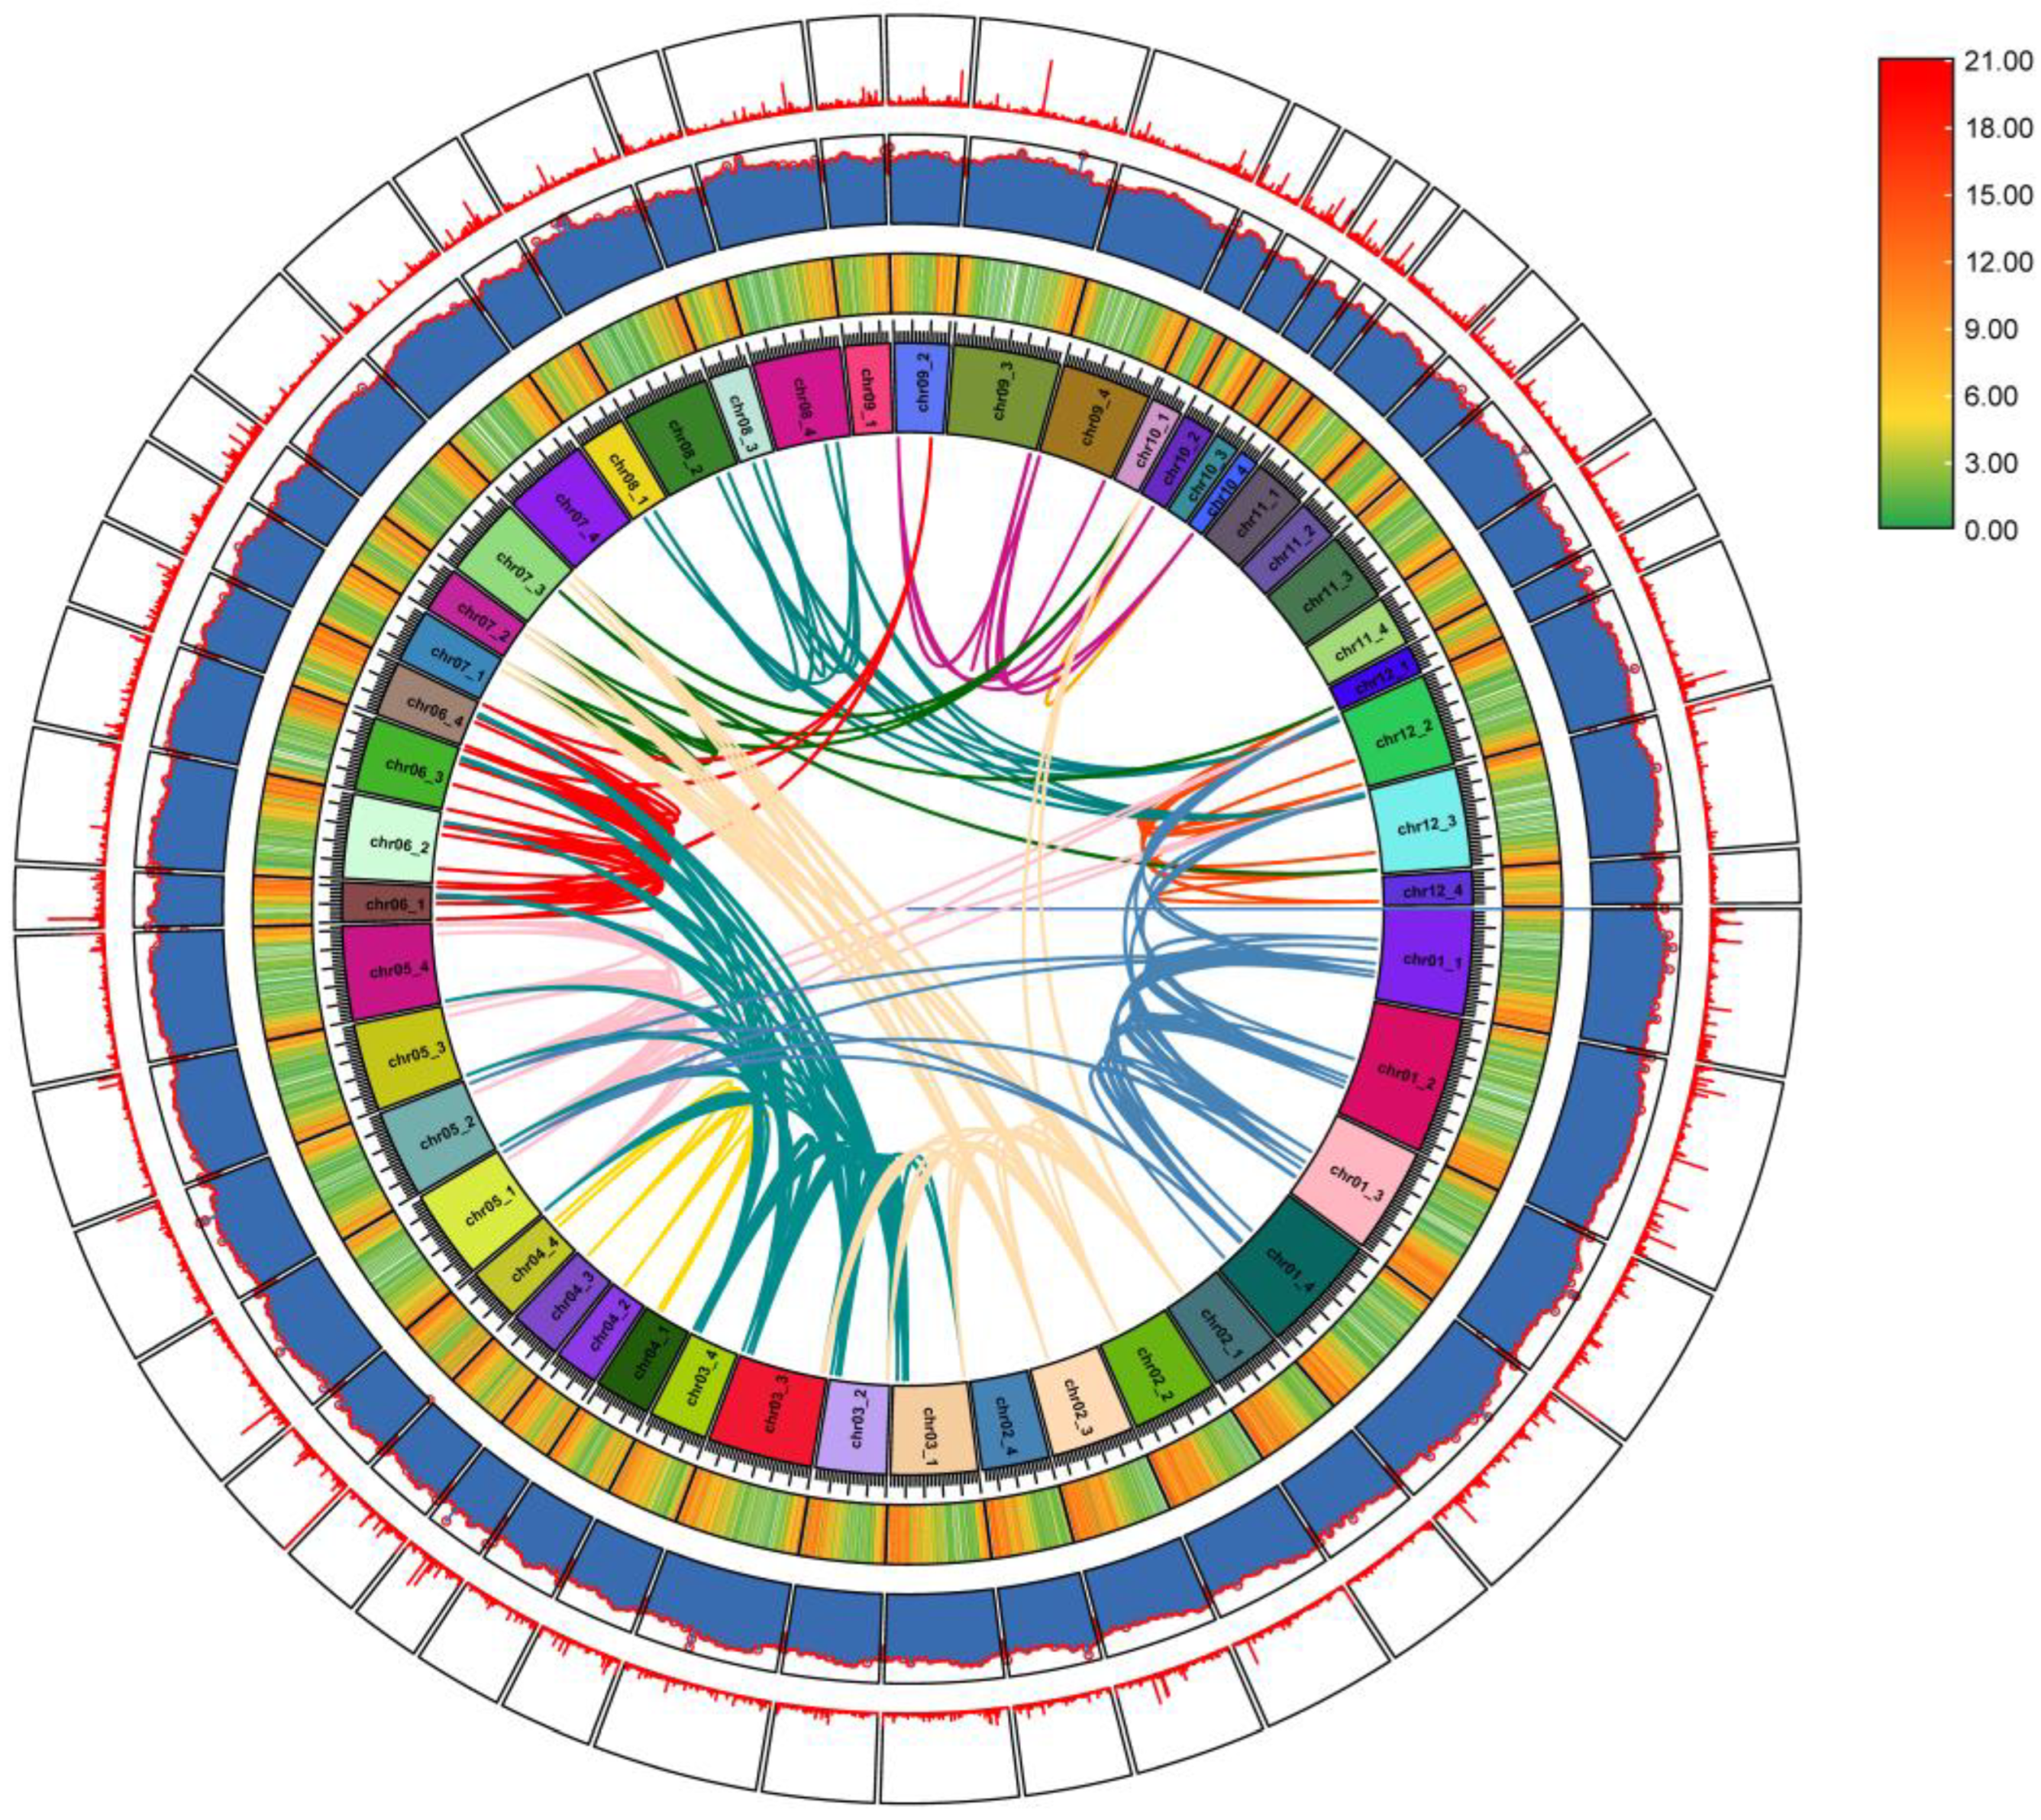
Figure 3.
USPs protein phylogenetic analysis Muscle was used to compare 26 AtUSPs and 108 StUPSs protein sequences, and MEGA7.0 was applied to construct the phylogenetic evolutionary tree using the neighbor-joining method. Shades of different colors indicate USPs subgroup grouping. Different colored circles represent different species of USP proteins, with red circles representing potatoes and blue circles representing Arabidopsis thaliana.
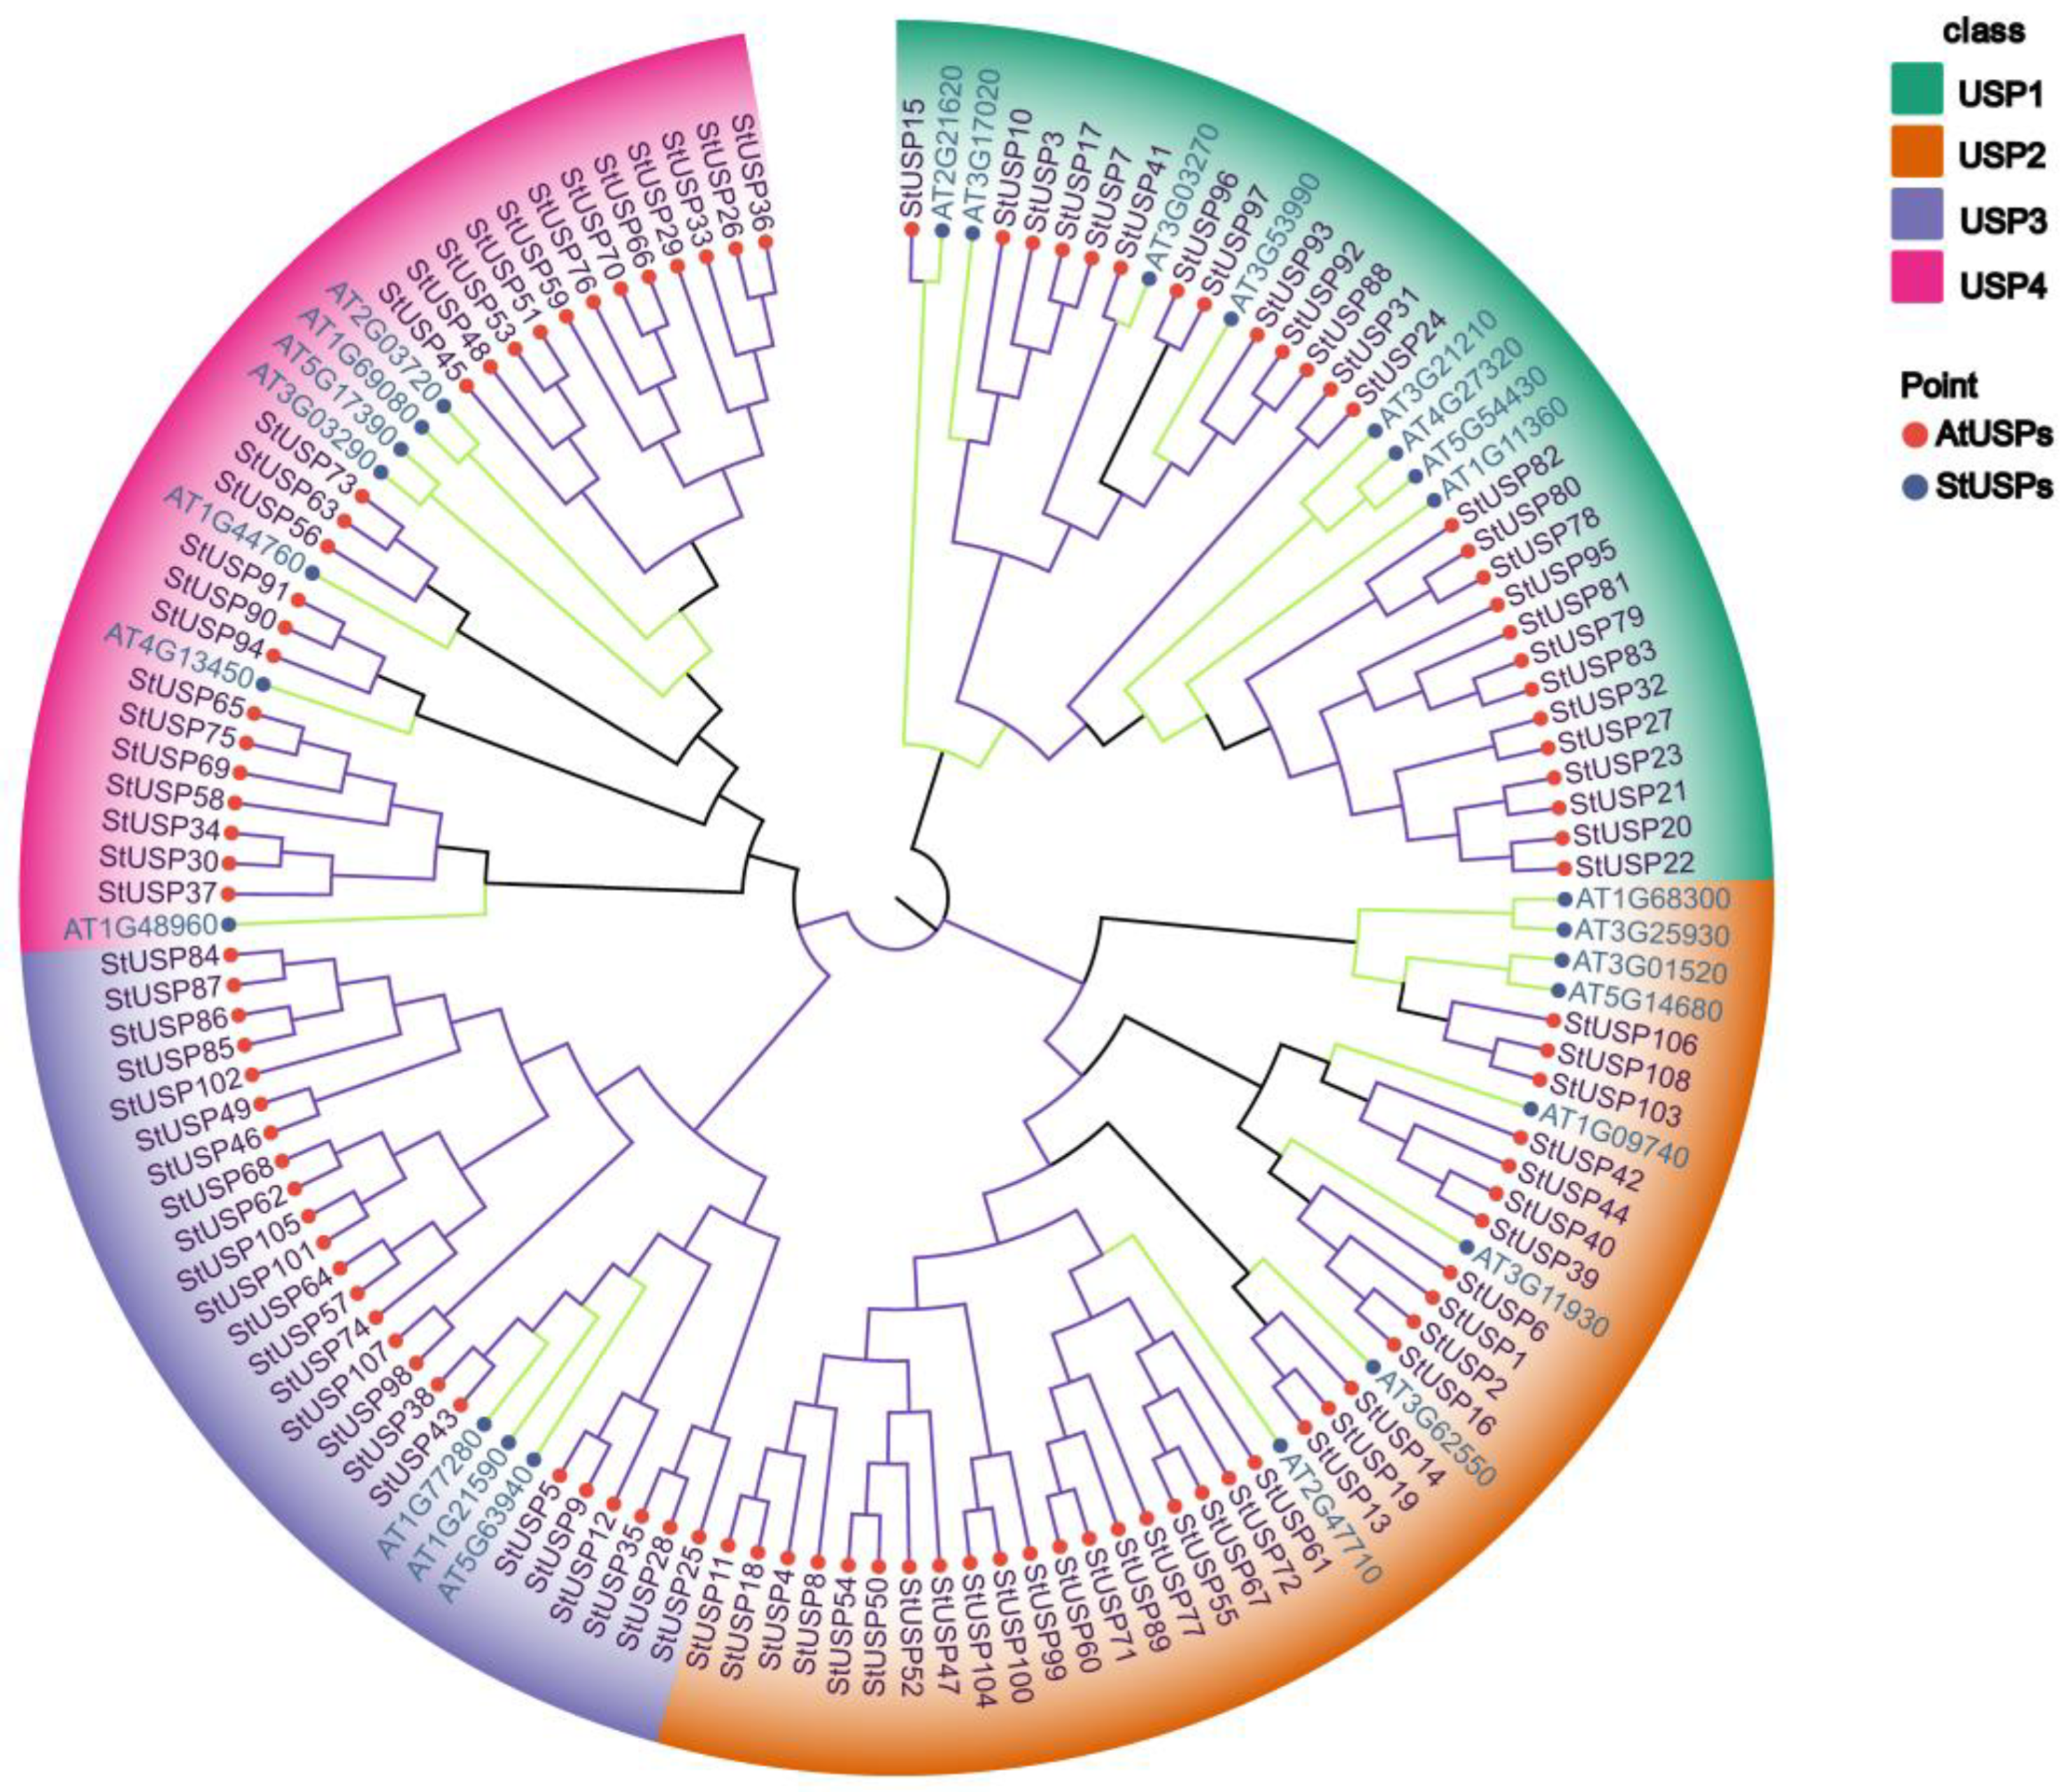
Figure 5.
Predicted cis-elements in the promoter regions of Atlantic potato StUSP genes. The color code on the right shows the number of cis-acting elements and notes the response types of the more abundant elements.
Figure 5.
Predicted cis-elements in the promoter regions of Atlantic potato StUSP genes. The color code on the right shows the number of cis-acting elements and notes the response types of the more abundant elements.
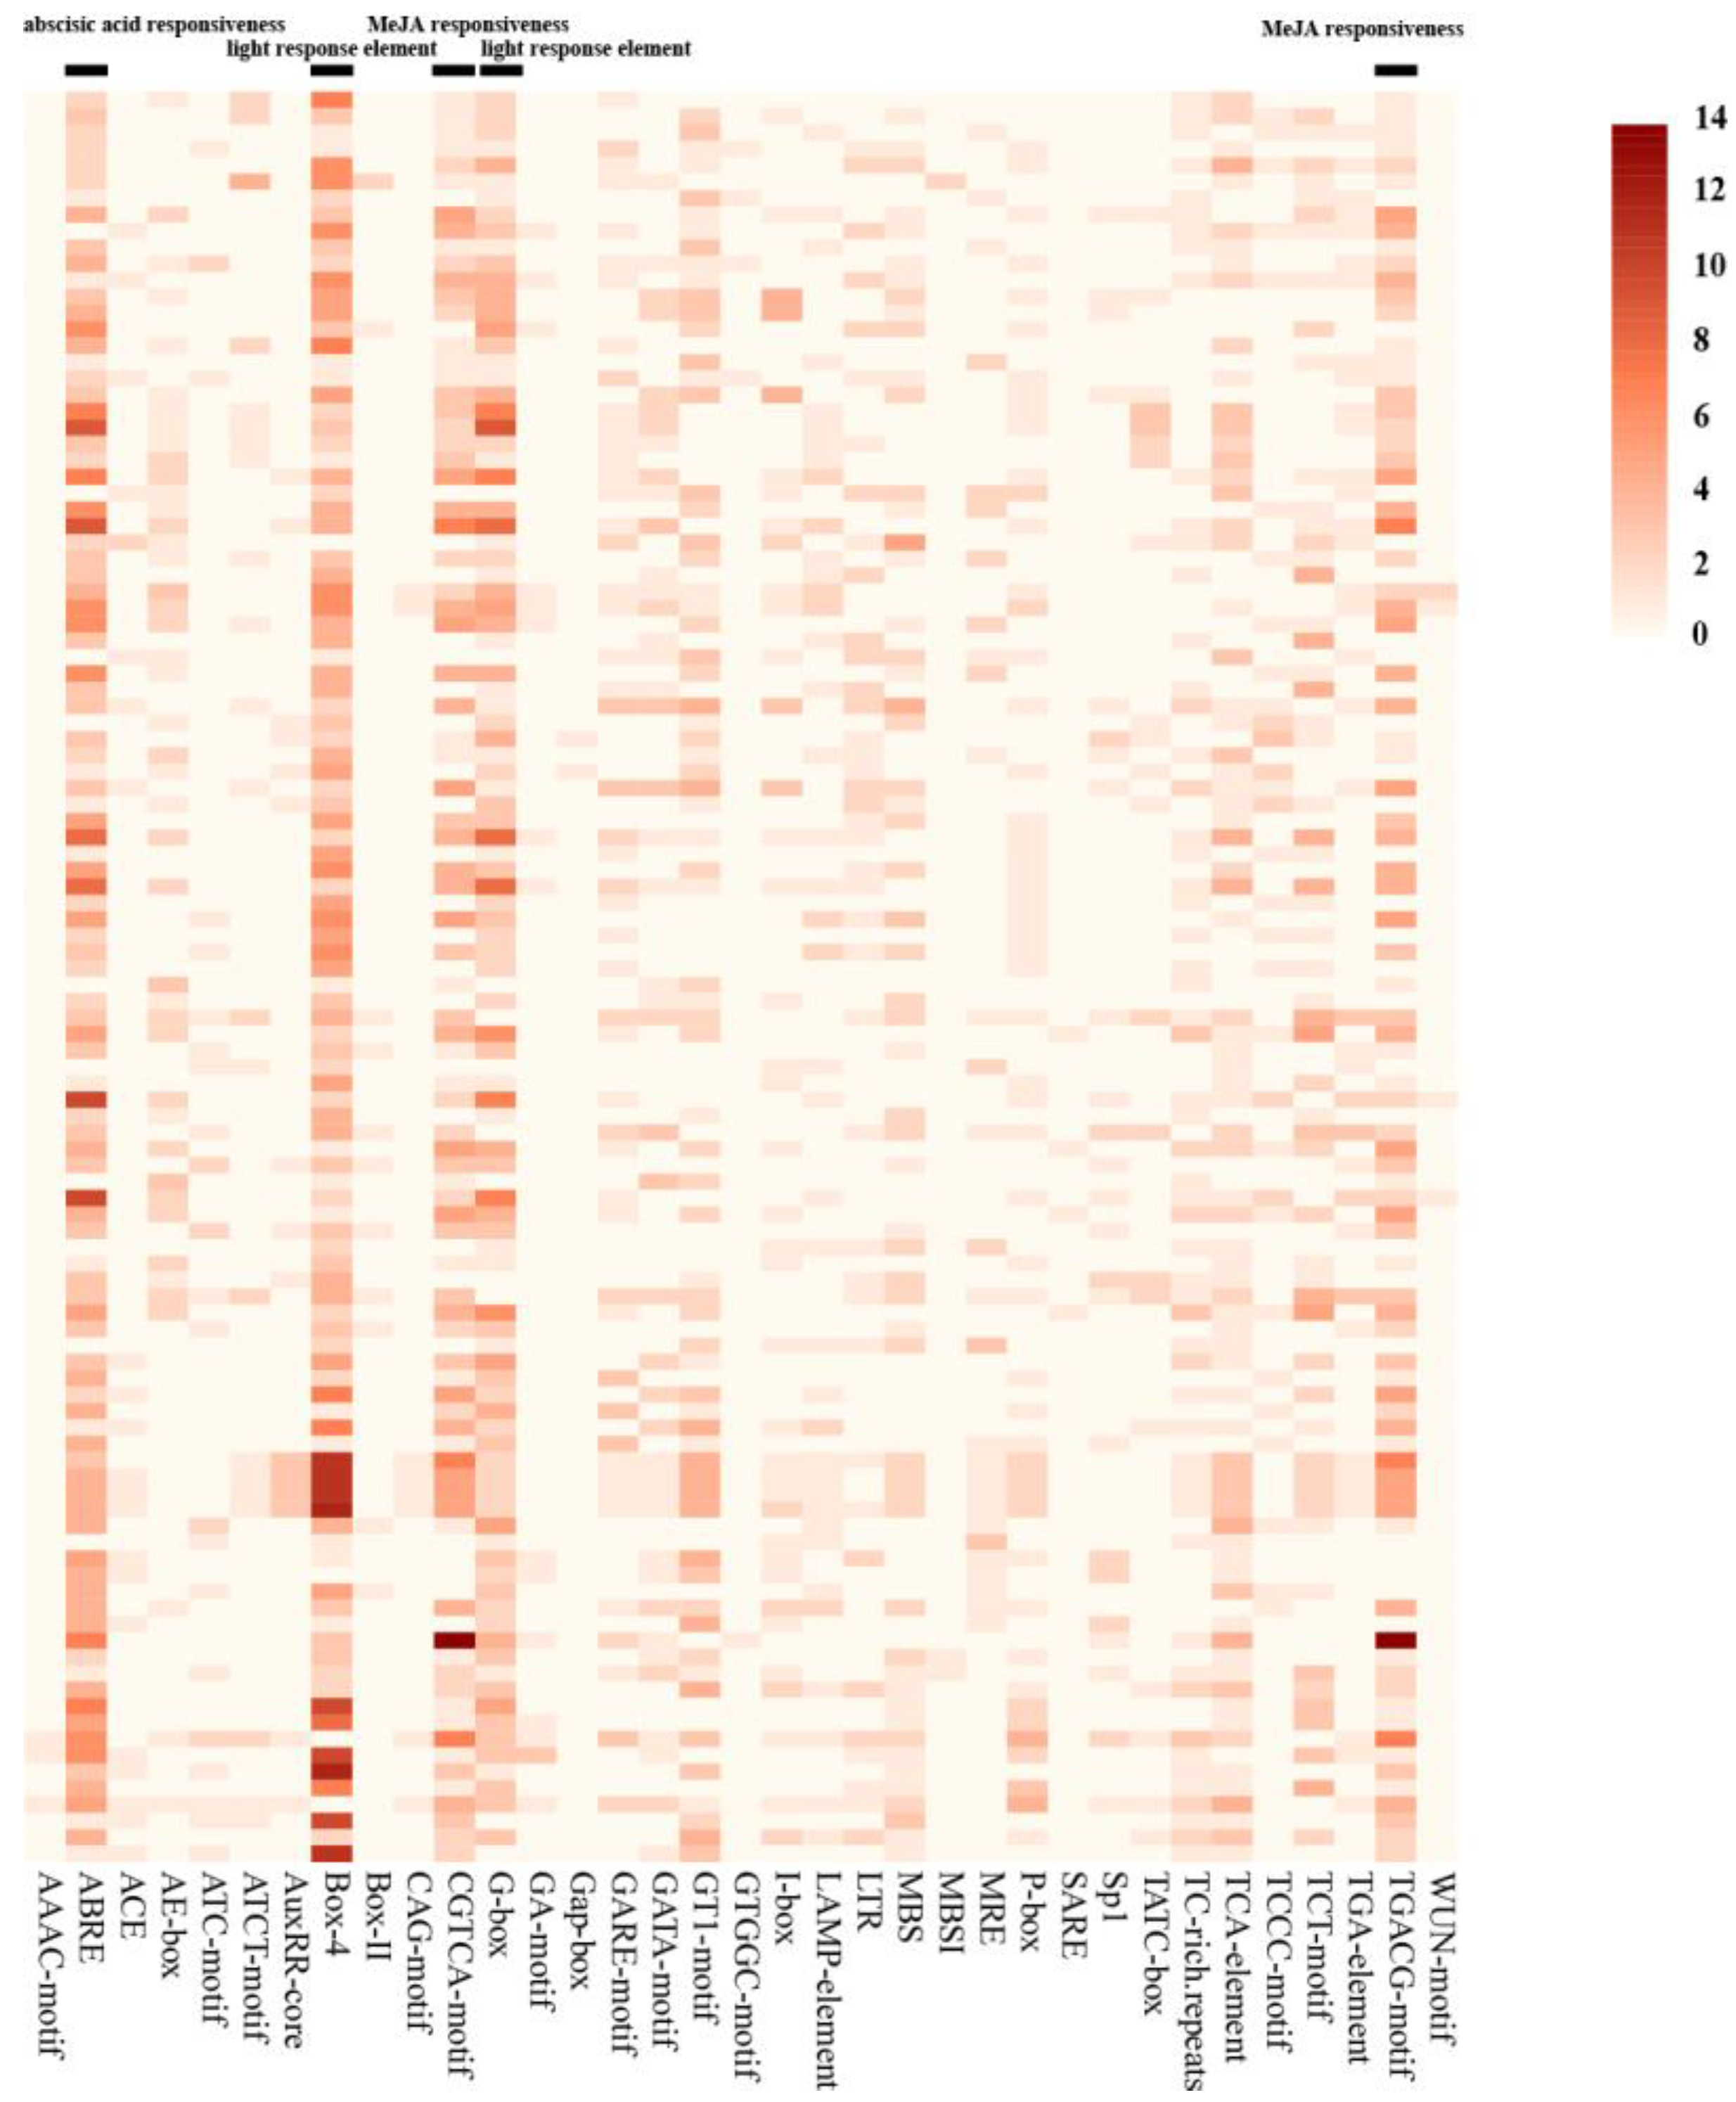
Figure 6.
Homology analysis of USP genes between the Atlantic potato and four other plants. The gray lines represent gene blocks in the Atlantic potato that are homologous to other genomes. The collinearity relationship between potato and Solanum lycopersicum, Arabidopsis thaliana, Oryza sativa, and Nicotiana tabacum USPs genes were analyzed by MCscanX, and collinear gene pairs were highlighted by red lines. The gray lines represent gene blocks in the Atlantic potato that are homologous to other genomes.
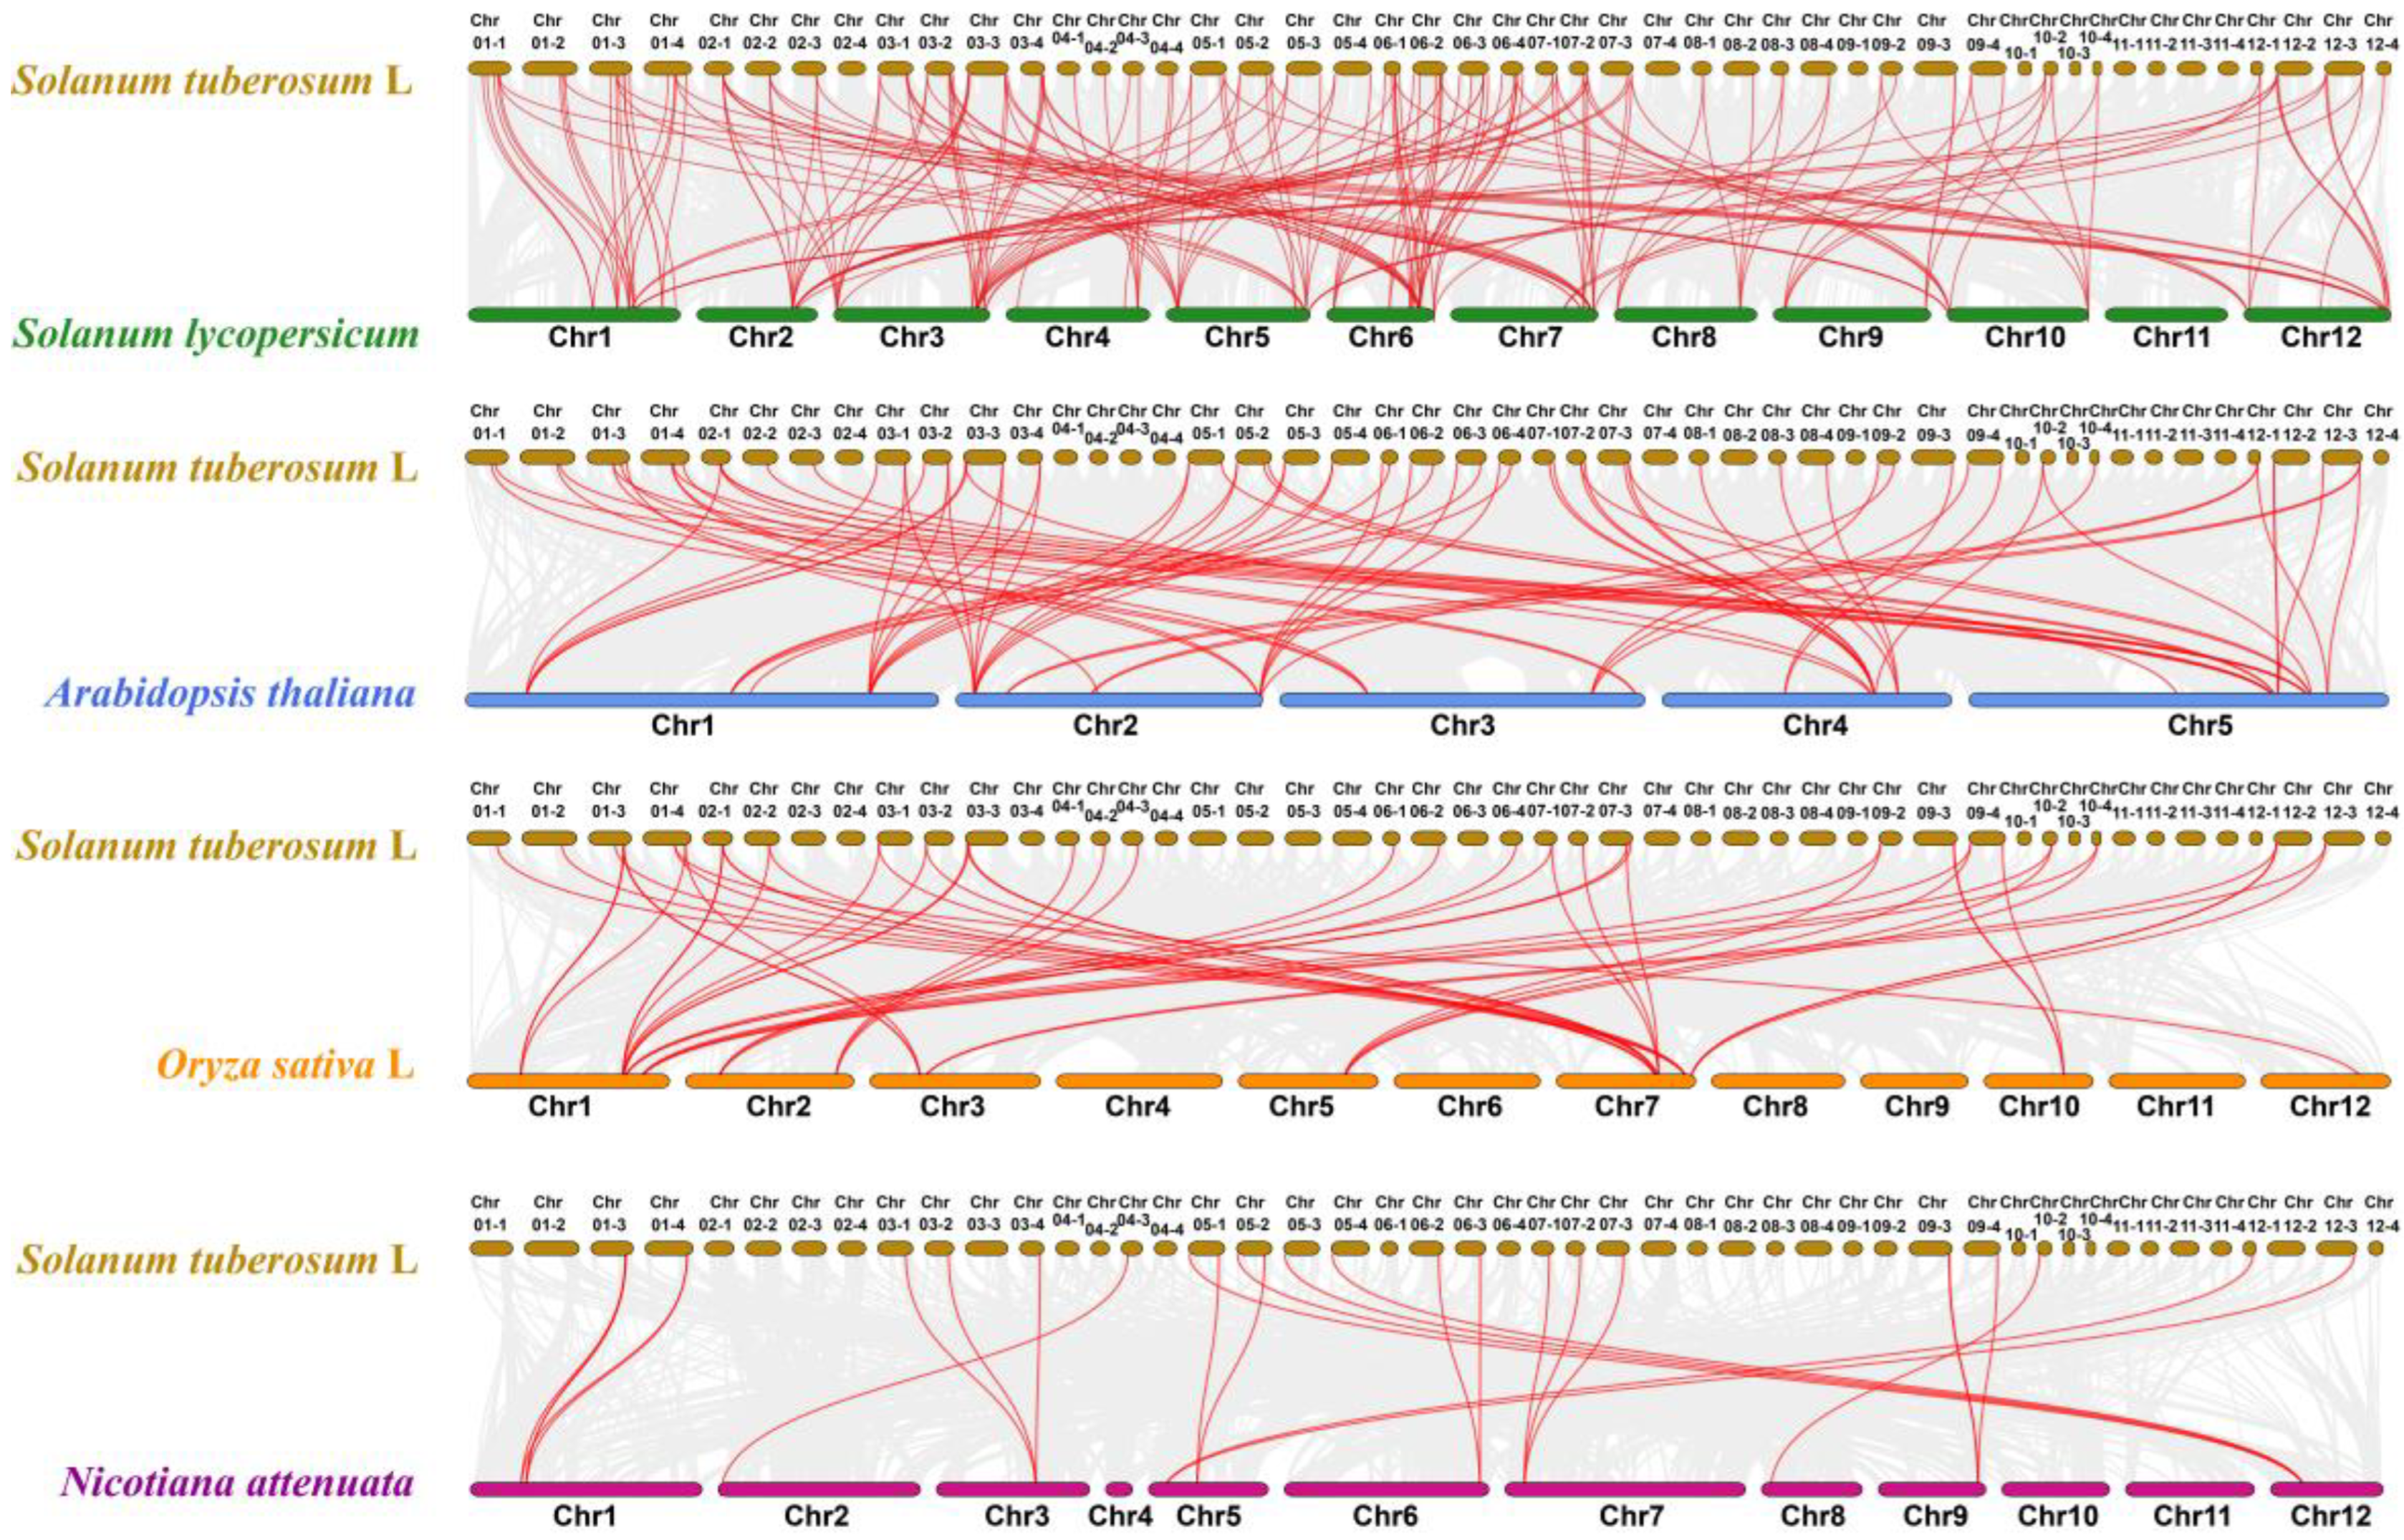
Figure 8.
K-means clustering analysis of DEG profiles (A,B) The black line represents the expression model. The other colorful lines are the expression profiles of each DEG. The x-axis represents different treatment times. The y-axis represents the standardized value. A stands for DON stress, and B stands for mechanical damage treatment.
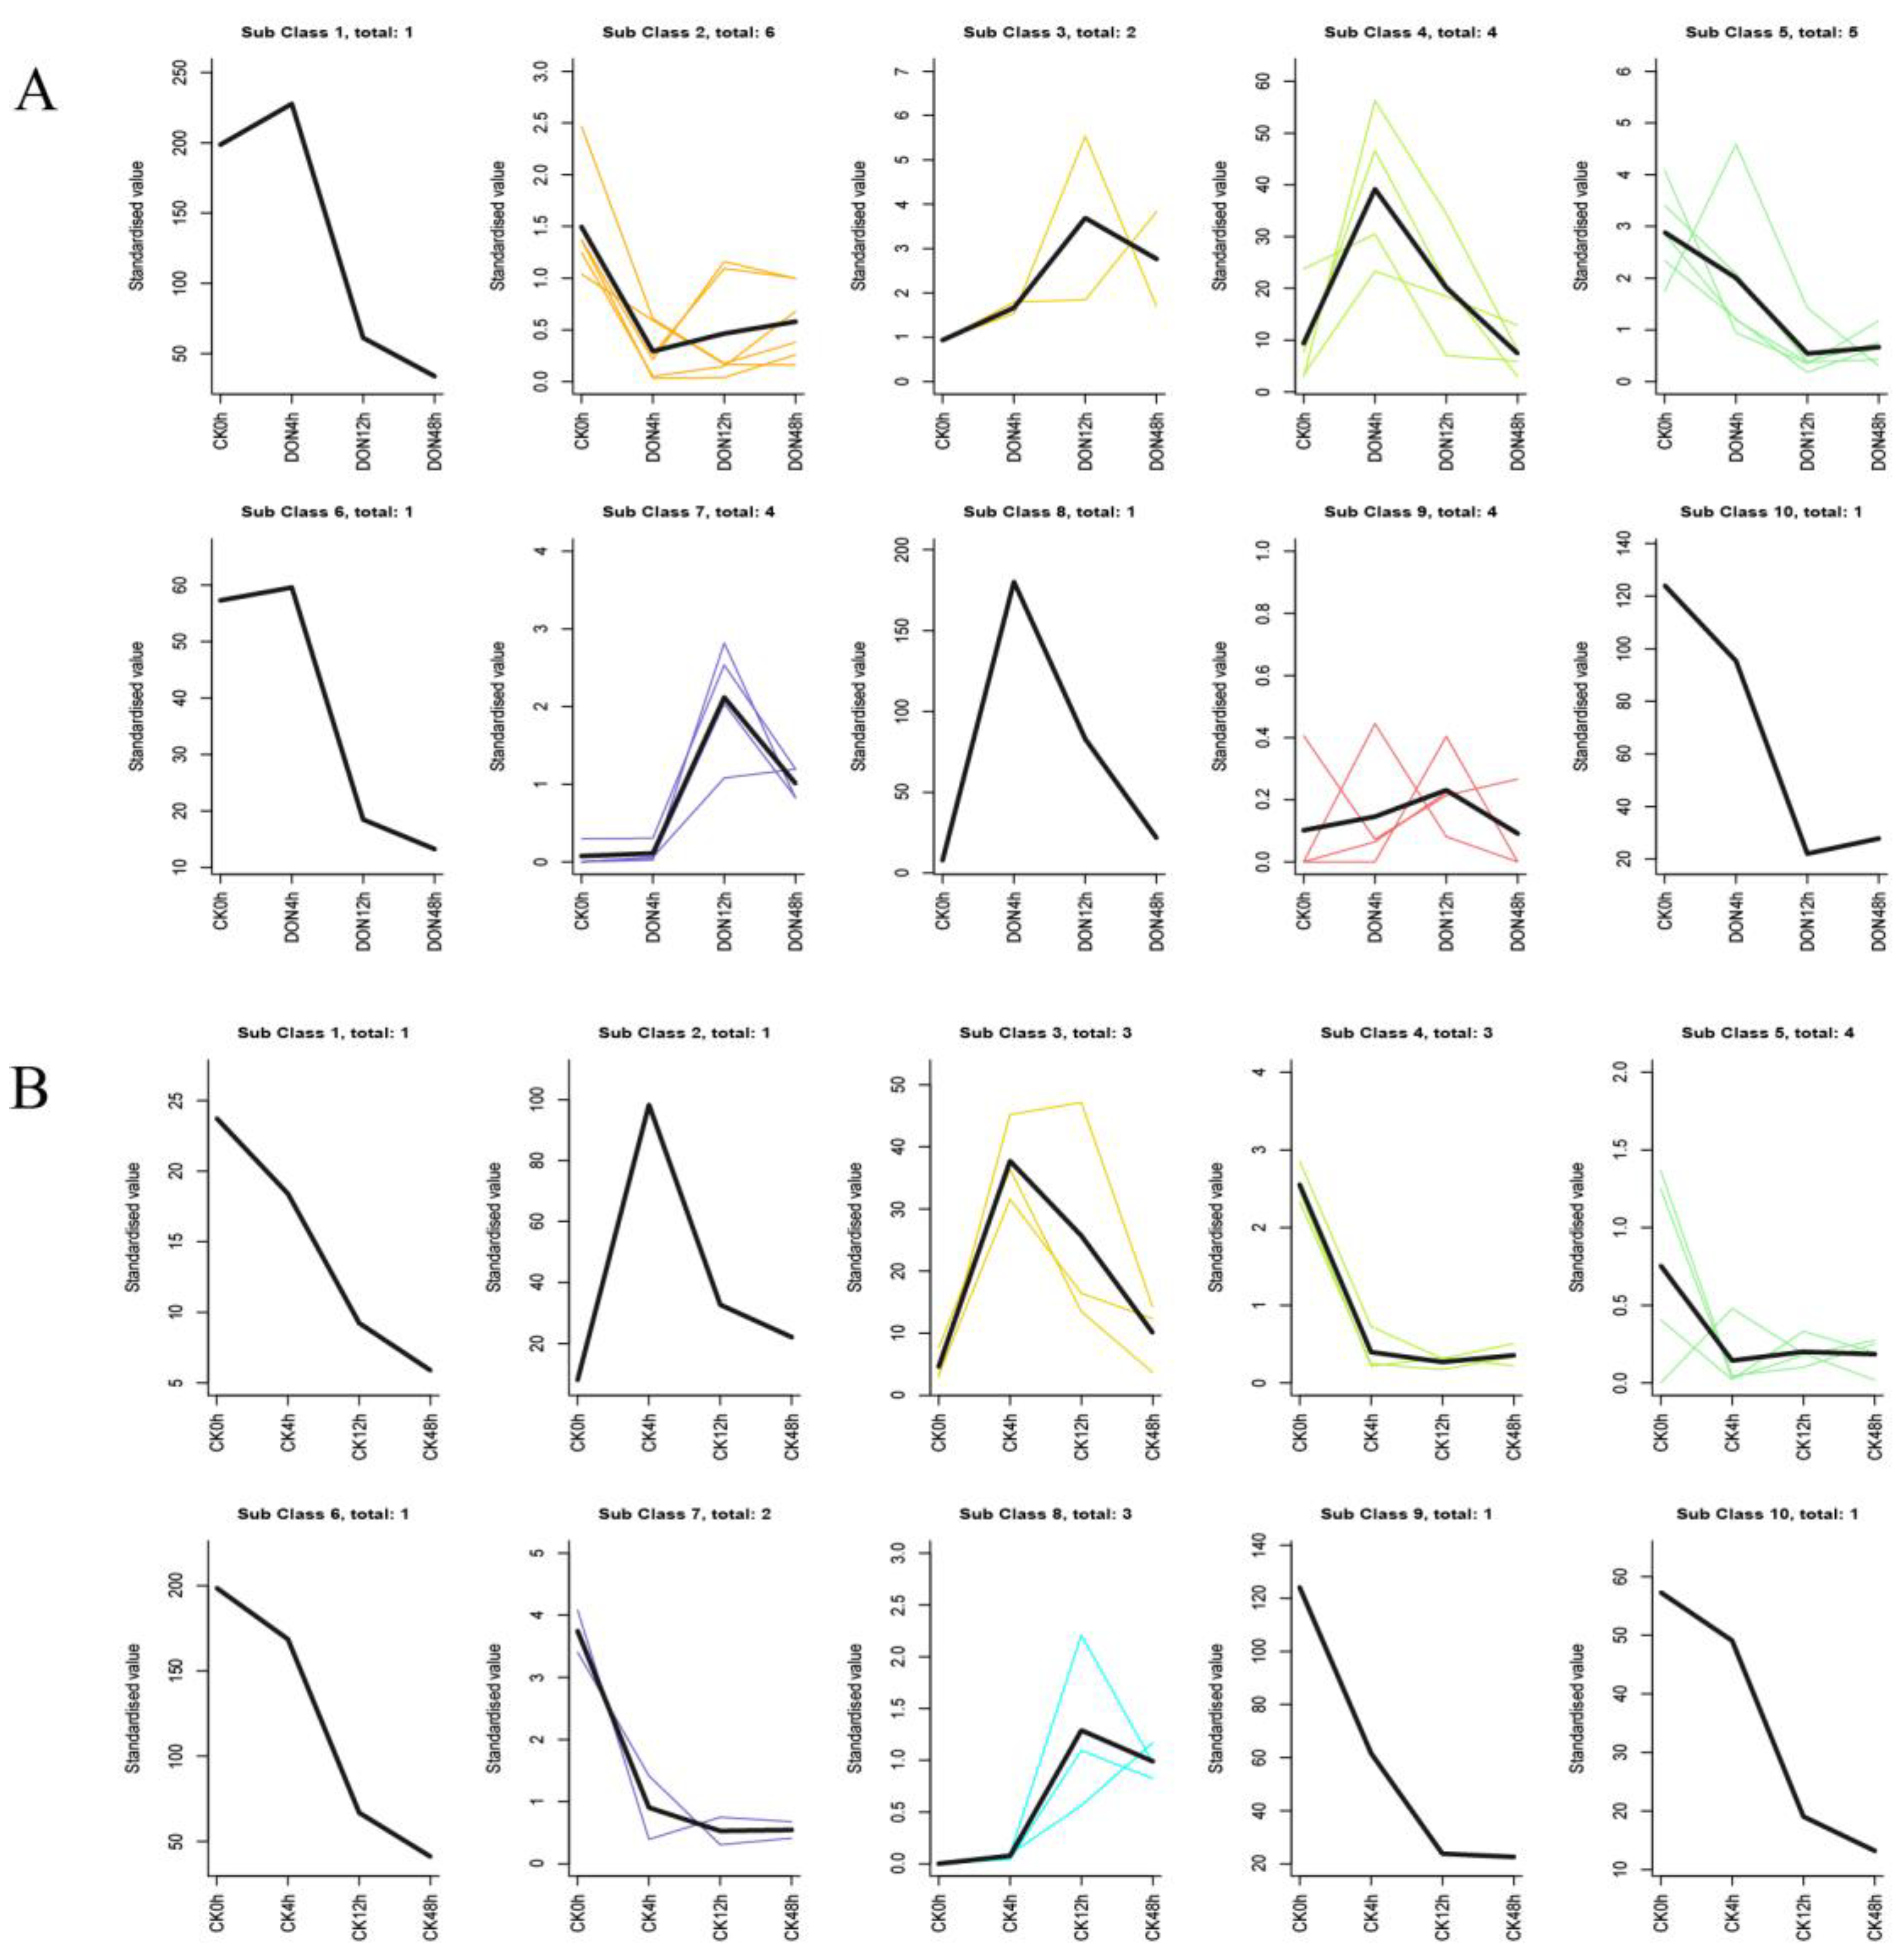
Disclaimer/Publisher’s Note: The statements, opinions and data contained in all publications are solely those of the individual author(s) and contributor(s) and not of MDPI and/or the editor(s). MDPI and/or the editor(s) disclaim responsibility for any injury to people or property resulting from any ideas, methods, instructions or products referred to in the content. |
© 2023 by the authors. Licensee MDPI, Basel, Switzerland. This article is an open access article distributed under the terms and conditions of the Creative Commons Attribution (CC BY) license (http://creativecommons.org/licenses/by/4.0/).
Copyright: This open access article is published under a Creative Commons CC BY 4.0 license, which permit the free download, distribution, and reuse, provided that the author and preprint are cited in any reuse.


