
Submitted:
13 April 2023
Posted:
14 April 2023
You are already at the latest version
Abstract
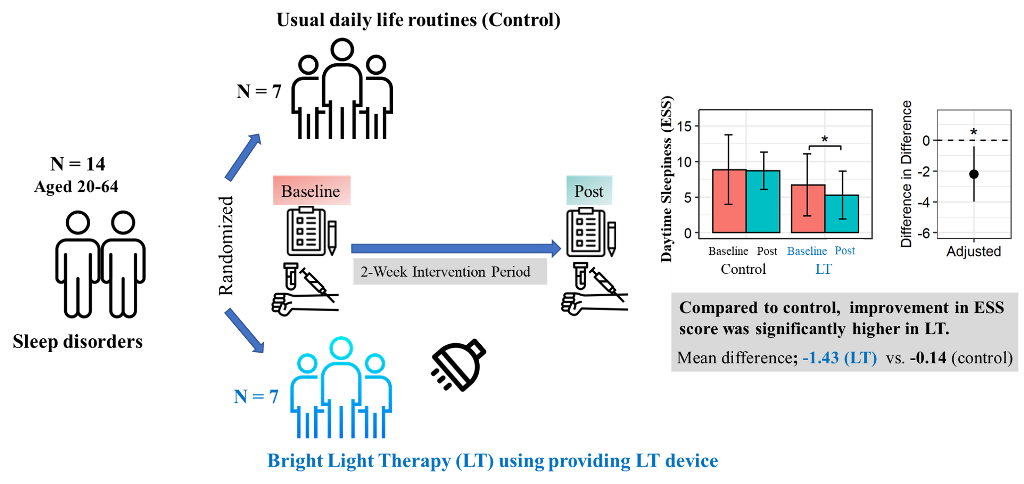
Background and Objectives: Light therapy (LT) is used as an adjunctive treatment for sleep problems. This study evaluates the impact of LT on sleep quality and sleep-related parameters in patients with sleep disorders. Materials and Methods: We performed a pilot randomized, open-label clinical trial. Fourteen patients aged 20–60 years with sleep disorders for more than three months were randomized into the control and LT groups (1:1 ratio). The LT group was instructed to use a device that provides bright LT (6000 K, 380 lux, wavelength 480 nm) for at least 25 minutes before 09:00 am for two weeks. A self-reported questionnaire was used to evaluate circadian preference, mood, and sleep-related parameters. We analyzed serum cortisol levels and clock genes expression. Results: The Epworth Sleepiness Scale (ESS), insomnia severity index, and Pittsburgh Sleep Quality index were significantly improved within the LT group only after the two-week period. When comparing the two groups, only the change in ESS significant was significant (mean difference; control: -0.14 vs LT: -1.43, p=0.021) after adjusting for baseline characteristics. There were no significant differences in serum cortisol or clock genes expression. Conclusions: LT can improve daytime sleepiness in patients with sleep disorders; however, further well-designed studies are warranted to confirm its efficacy.
Keywords:
light therapy
; sleep disorder
; daytime sleepiness
; circadian rhythm
; clock gene
1. Introduction
The influence of sleep on health has been verified in many previous studies [1,2]. Most studies proved that sleep is essential for maintaining basic human functions such as cognition, emotions, and metabolism [3]. Sleep problems have been emerging as social and public health issues because they can affect daily activity and function [4] and promote the development of metabolic diseases, such as hypertension [5,6], diabetes [7], and obesity [8,9]. In addition, they can increase the risk of cancer [10], mental health conditions [11,12], and psychiatric disorders [13]. According to epidemiological studies, the prevalence of insomnia in the general population ranges from 6 to 20% [14,15]. In a similar fashion, a study in South Korea has also confirmed that the incidence rate of insomnia is 1 out of 5 adults [16].
Recent studies have focused on the implication of the circadian system, which has a significant impact on the sleep-wake cycle, fluctuations in hormones secretion, cardiovascular health, and glucose homeostasis, in sleep problems [17]. In fact, circadian rhythms are biological cycles that allow human beings to adjust their physiology and behavior according to changes in the external environment. These cycles are regulated by the suprachiasmatic nucleus (SCN) of the hypothalamus. The circadian rhythm is guided by various environmental signals, of which light is the most influential [18]. Dramatic shifts in life patterns induced by technological development and cultural changes have fundamentally altered our external environment, and people's circadian rhythms have been affected as well. In this context, circadian disruption and dysregulation in adults are associated with sleep disorders [18,19]. Therefore, it is necessary to prevent disharmony in the circadian rhythm and maintain a balanced state by providing light with the appropriate timing, intensity, duration, and wavelength similar to natural light; however, modern city lifestyles make this difficult. There are many studies that investigate the utility of sources of artificial lighting in the management of sleep problems [19,20]. Pharmacological agents, cognitive behavioral therapy, and psychosocial interventions have been traditionally used to treat sleep problems, but light therapy (LT) is receiving more attention due to the limitations that accompany the traditional therapies, such as drug side effects, cost, and limitations of time and space [21,22]. LT is natural, simple, relatively inexpensive, and useful as an adjuvant treatment for sleep disorders due to its few interactions with other treatment options. A recently published meta-analysis of 53 studies involving 1,154 participants found that LT is generally effective in treating sleep problems [19]; however, only few studies have examined the effects of LT on sleep-related parameters. Therefore, this study aimed to investigate the improvement in circadian rhythm through LT and evaluate the effect of the latter on sleep quality and sleep-related parameters.
2. Materials and Methods
2.1. Study design and patients
This study was a pilot, randomized, open-label, two-arm clinical trial that was conducted over a period of two weeks. The study protocol was approved by the Institutional Review Board of Yongin Severance Hospital (IRB No. 9-2022-0025) (date of approval: 30/03/2022) and registered at the Clinical Research Information Service (CRIS, KCT0007293) (date of registration: 17/05/2022). This study was conducted in compliance with the principles of the Declaration of Helsinki. Informed consent was obtained from all subjects. Patients were recruited from 18/04/2022, to 27/06/2022, at Yongin Severance Hospital (Yongin, South Korea). Patients aged 20–60 years who had sleep disorders for more than three months were eligible for enrollment. The exclusion criteria were as follows: sleep disorders included in the 5th edition of the Diagnostic and Statistical Manual of Mental Disorders (DSM-5) except for primary insomnia disorder (e.g., hypersomnolence disorder, narcolepsy, obstructive sleep apnea hypopnea, central sleep apnea, sleep-related hypoventilation, etc.), sleep disorders related to other mental disorders, sleep disorders related to other medical conditions history of psychiatric illness, and patients starting other treatments for insomnia within three months.
2.2. Randomization and study protocol
Participants were randomly assigned in a 1:1 ratio to the control and LT groups. Randomization was performed using a centralized computer-generated system. During the two-week period, there were no dropouts. Finally, this study was completed by seven participants in the control group and seven in the LT group (Figure 1). The control group was instructed to maintain their usual daily life routines without any intervention. The LT group was provided with a small LT device (Olly, Samsung Electronics C-lab company, Luple, Seoul, South Korea). The LT device was designed to provide an intensity of at 480 nm wavelength range to capture morning sunlight and a human-centric lighting (HCL) LED. The LT group was instructed to receive bright LT (6000 K, 380 lux) for at least 25 minutes daily before 9:00 am for two weeks. Photometer assessment results by the Korea Photonics Technology Institute is presented in Supplementary Figure S1. Participants were instructed to keep the light device approximately 30 cm from their face and not to move away or change the direction of their gaze from the light device.
2.3. Clinical and biochemistry analyses
Study visits were scheduled at screening, baseline, and after two weeks. Body weight and height were measured. Body mass index (BMI) (kg/m2) was calculated as height in kilograms divided by the square of height in meters. Systolic blood pressure (SBP) and diastolic blood pressure (DBP) were measured in a sitting position using the right arm at least after 5 minutes of rest. Lifestyle (smoking, alcohol consumption, and exercise) and underlying diseases (diabetes, hypertension, and dyslipidemia) were assessed using a self-reported questionnaire. The participants were categorized into the following: current smoker or not and current drinker or not. Physical activity was defined as exercising for more than 30 minutes and more than three times a week. We used a binary variable for the presence or absence of a history of hypertension, dyslipidemia, or diabetes.
Blood samples were obtained after more than 8 hours of fasting. White blood cell (WBC) counts were quantified by flow cytometry using XN2000 (Sysmex, Kobe, Japan). Insulin levels were analyzed by chemiluminescent microparticle immunoassay using the Architect i2000SR (Abbott, Abbott Park, IL, USA). Lipids (total cholesterol [TC], low-density lipoprotein cholesterol [LDL-C], non-high-density lipoprotein cholesterol [non-HDL-C], triglycerides [TG], and high-density lipoprotein cholesterol [HDL-C]) were analyzed using an enzymatic color test. C-reactive protein (CRP) levels were analyzed using an immunoturbidimetric method. The homeostasis model assessment of insulin resistance (HOMA-IR) was calculated using the following equation: fasting glucose (mmol/L) × fasting insulin (µU/mL) / 22.5.
Cortisol and adrenocorticotropic hormone (ACTH) levels were assessed using an electrochemiluminescence immunoassay (Roche Cobas 8000 e801, Germany). Serotonin levels were assessed by liquid chromatography-MS/MS using an electrochemiluminescence immunoassay (SCIEX, 5500 Qtrap, USA).
A heart rate variability (HRV) analyzer with a three-lead electrocardiogram (Medicore Co., Ltd, Gyeonggi, Korea) was used for 5 minutes in the supine position in a quiet room. Common HRV indices such as the standard deviation of normal-to-normal intervals (SDNN), total power (TP), low frequency (LF), high frequency (HF), and LF/HF ratio were measured.
2.4. Actigraphy
All participants wore a wrist actigraphy device (ActiGraph wGT3X-BT, ActiGraph, Pensacola, FL, US). This actigraphy device was worn on the non-dominant wrist using a wrist strap. The participants were asked to wear the device continuously throughout the day. The device was set to sampling counts per one minute epochs. Actigraphy data were analyzed using the ActiLife software (ActiGraph, LLC). During the two weeks, sleep efficiency, total sleep time, time in bed, wake after sleep onset, and number of nocturnal awakenings were measured using actigraphy. To minimize heterogeneity, sleep habits were recorded daily using a sleep diary.
2.5. Sleep-related questionnaire
A self-report questionnaire was used to evaluate circadian preference, mood, and sleep-related parameters. Mental health metrics were assessed using the Patient Health Questionnaire (PHQ-9). The PHQ-9 assesses depression severity over the past two weeks. It is comprised of nine items, and the total score is 27 points. A PHQ-9 score of ≥ 10 is considered as major depression [23]. The Korean version of the Morningness-Eveningness Questionnaire (MEQ) was used to assess the circadian preference [24,25]. The MEQ consists of 19 questions that ask people to consider their “feeling best” rhythms and indicate preferred sleep time and daily performance in various everyday life. The scores range from 16 to 86 points. A higher score indicates a morning preference. Overall sleep quality and sleep disturbance were measured using the Pittsburgh Sleep Quality Index (PSQI), one of the most widely used sleep diagnostic questionnaire tools [26]. The total PSQI score ranges from 0 to 21, with higher scores indicating poorer sleep quality. Insomnia severity index (ISI) is a self-report tool that measures subjective symptoms, consequences of insomnia, and degree of concerns and distress [27]. The total score ranges from 0 to 28. A higher score indicates more severe insomnia. The Stanford Sleepiness Scale (SSS) is a self-rating scale that measures a patient's subjective evaluation of sleepiness on a seven-point Likert-scale [28]. Epworth Sleepiness Scale (ESS) consists of eight question and ranges from 0 to 24. A higher score indicates a higher level of daytime sleepiness [29].
2.6. Real-time reverse transcription polymerase chain reaction (RT-PCR) analysis of clock genes
Gene expression was analyzed using peripheral blood mononuclear cells (PBMCs). Blood samples were collected in ethylenediaminetetraacetic acid (EDTA) tubes. PBMCs were isolated by density gradient centrifugation at 3000 rpm for 30 minutes in Ficoll-Paque medium (GE Healthcare Life Sciences, Pittsburgh, PA, USA). Total RNA was extracted using the TRI reagent, and cDNA was synthesized with 1 μg of total RNA using an RT-PCR Kit (Takara Bio Inc., Shiga, Japan). PCR was performed using a Thermal Cycler Dice Real-time System (Takara Bio, Inc.). Amplification was performed under the following conditions: 40 cycles of denaturation at 95°C for 10 seconds, annealing at 60°C for 10 seconds, and extension at 72°C for 10 seconds. Relative gene expression was analyzed using the comparative Ct method. Gene expression was determined using the 2−ΔΔCt method as the fold difference between ΔCt of the target sample and ΔCt of the calibrator sample. All reactions were performed in triplicates.
2.7. Statistical analysis
Data are presented as mean ± standard deviation (SD) for continuous variables or number (percentage) for categorical variables. Differences in the baseline characteristics between the two groups were compared using an independent t-test. The Chi-squared test was used to compare differences in categorical variables, including smoking status, drinking status, exercise, diabetes, hypertension, and dyslipidemia between the two groups. Differences within the groups after the two-week period were compared using the paired t-test. Differences in changes between groups were identified using linear regression to adjust for each baseline value. Restricted cubic spline analysis was used to determine the change patterns of sleep parameters during the two weeks. Two-sided p-values less than 0.05 were considered statistically significant. All statistical analyses were performed using SAS version 9.4 (SAS Institute Inc., Cary, NC, USA) and R software (version 4.1.1; R Foundation for Statistical Computing, Vienna, Austria).
3. Results
3.1. Patient Characteristics
Of the 14 participants in this study, 92.9% were women. Table 1 shows the baseline characteristics of the study population. Baseline characteristics were similar between control and LT groups in terms of age (37.0 ± 10.8 years vs. 47.4 ± 6.7 years, respectively; p = 0.054) and sex (6 females vs 7 females; p > 0.999). Underlying diseases such as diabetes, hypertension, and dyslipidemia were similar between the two groups. Smoking, alcohol consumption, and physical activity habits were also similar between the two groups.
3.2. Changes in biochemical and physical parameters
Table 2 shows the changes in the biochemical and heart rate variability parameters in the two groups before and after the two-week period after adjusting for each baseline value. A significant decrease in fasting glucose level was noted in the control group (from 98.0 ± 5.3 mg/dl to 91.1 ± 8.1 mg/dl, p = 0.031). The adjusted mean changes in fasting glucose level did not differ between the two groups after adjusting for each baseline value. Serum cortisol levels decreased in the LT group (9.7 ± 3.6 ㎍/dl vs. 7.6 ± 3.1 ㎍/dl, difference= -2.1 ± 2.7, p = 0.085), but the difference was not statistically significant. Moreover, the adjusted mean change in serum cortisol levels was greater in the experimental group than in the control group, although the difference was not statistically significant (mean changes in difference; -0.2 ± 2.2 ㎍/dl in control vs -2.1 ± 2.7 ㎍/dl in LT group, p = 0.073).
3.3. Changes in sleep patterns and quality
Figure 2 shows the changes in the biochemical and heart rate variability parameters in the two groups before and after the two-week period after adjusting for each baseline value. A significant decrease in fasting glucose level was noted in the control group (from 98.0 ± 5.3 mg/dl to 91.1 ± 8.1 mg/dl, p = 0.031). The adjusted mean changes in fasting glucose level did not differ between the two groups after adjusting for each baseline value. Serum cortisol levels decreased in the LT group (9.7 ± 3.6 ㎍/dl vs. 7.6 ± 3.1 ㎍/dl, difference= -2.1 ± 2.7, p = 0.085), but the difference was not statistically significant. Moreover, the adjusted mean change in serum cortisol levels was greater in the experimental group than in the control group, although the difference was not statistically significant (mean changes in difference; -0.2 ± 2.2 ㎍/dl in control vs -2.1 ± 2.7 ㎍/dl in LT group, p = 0.073).
Figure 3 shows the changes in metrics related to sleep and mood assessed using questionnaires in both groups after adjusting for each baseline score. In the control group, there were no significant changes in ESS, ISI, PSQI, SSS, MEQ, and PHQ-9 scores before and after the two-week period. In the LT group, the ESS, ISI, and PSQI scores significantly improved after the intervention (ESS: 6.7 ± 4.3 to 5.3 ± 3.4, p = 0.025; ISI: 11.3 ± 4.4 to 7.7±2.0, p = 0.024; PSQI: 10.6 ± 2.9 to 9.6 ± 2.8, p = 0.004). There were no significant changes in the MEQ, PHQ-9, or SSS scores. However, when comparing the two groups, only the improvement in the ESS score was significantly higher in the LT group compared to the control group (mean difference; -0.14 ± 3.19 in control group vs -1.43 ± 1.27 in LT group, p = 0.021) after adjusting for each baseline score.
3.4. Changes in Clock genes expression
Figure 4 presents the clock genes expression levels in PBMCs before and after the two-week period. Although there were no statistically significant changes in clock genes expression in both groups, the mean level of CLOCK gene mRNA was decreased (1.33 to 1.06, difference = -0.269) in the control group, while it was increased (1.22 to 1.65, difference = 0.429) in the LT group. In a similar fashion, the mean level of PER1 gene mRNA was decreased (2.40 to 1.76, difference = -0.637) in the control group, while it was increased (1.43 to 1.53, difference = 0.102) in the LT group. Furthermore, the mean level of PER3 gene mRNA was decreased (1.35 to 1.09, difference = -0.260) in the control group, while it increased (1.29 to 1.57, difference = 0.282) in the LT group.
3.5. Compliance and Safety
All the participants completed the study (n = 14). The safety assessment consisted of an evaluation of adverse events. Although one person reported mild glare, there were no serious adverse events.
4. Discussion
In this study, we investigated the effects of morning blue LT on sleep-related parameters and mechanisms in adults with sleep problems. Light has strong non-visual impact on behavioral and physiological functions, including sleep-wake regulation, cognitive function, and hormone secretion. These light-dependent effects are mediated mainly by intrinsically photosensitive retinal ganglion cells (ipRGCs), which contain the photopigment melanopsin. The maximum sensitivity of ipRGC is in the short-wavelength blue region of the spectrum (approximately 460–480 nm), commonly referred to as “blue light.” Classical markers of the circadian system (cortisol and clock genes) as well as subjective (self-report) and objective (actigraphy) outcomes related to sleep were studied to determine the effectiveness of LT, specifically its effects on the human circadian system using monochromatic blue light illumination. Some improvements in subjective and objective sleep-related parameters observed in the LT group in this study are consistent with previous findings [30,31] that exposure to bright blue-rich morning light improves daytime sleepiness and rapid alertness. This supports the potentially positive effects of LT on insomnia. We also found inconsistencies between the LT and control groups, which is similar to the results of previous studies that reported the effect of LT on sleep problems. Van Massen et al [19]. explained that this inconsistency can be related to the sleep problem type, number of treatment days, and sleep duration differences. Yeung et al [32]. also reported a placebo effect when assessing self-reported insomnia. This suggests that it may be more challenging to detect the exclusive effect of LT on insomnia or that a larger sample size may be required. In addition, light exposure not only during the morning but also at night should be considered.
We also evaluated the effect of LT by measuring serum cortisol levels. Cortisol levels in the LT group were lower than those in the control group, showing a potential trend for the effect of LT on cortisol. This is in line with previous studies showing that cortisol levels decreased after exposure to morning light [33]. However, the observed trend was not statistically significant, which may be due to the timing of light exposure being too late to elicit cortisol secretion and the small sample size. Gabel et al [34]. reported that the effect of blue light on cortisol is only effective when applied early in the morning, near the wake-up time. Sheer et al [35]. also suggested that the inconsistent results of cortisol change are because cortisol levels are affected by not only the duration and light intensity but also the biological timing of LT exposure. We also examined salivary melatonin levels in both groups on the first day and the last day of the clinical trial, and found a tendency toward phase advancement of the melatonin circadian rhythm in the LT group in comparison to the control group. No significant changes were observed in either group (data not shown). Most previous studies have focused on the effects of nighttime light exposure on non-visual forming responses in which light recognized by ipRGCs projects through the SCN in the brain and affects melatonin secretion in the pineal gland, which is very sensitive to short-wavelength light [36]. Further studies incorporating both morning and night light exposure are required.
To date, few studies have investigated the relationship between clock gene expression and LT. Rabia et al [37]. found a decrease in PER1 and PER2 in patients with chronic insomnia and shift-working healthcare personnel and reported that the decrease in PER1 and PER2 gene expression is a result of short sleep periods. Based on previous research, in this study, we investigated a correlation between LT and clock genes expression. Overall, as a result of the t-test, we could not find significant differences in the expression levels of clock genes between the LT and control groups. In the case of PER1 gene, the mean level of mRNA slightly increased from 1.43 to 1.53 in the LT group, whereas the mean level decreased significantly from 2.40 to 1.76 in the control group. This pattern may be interpreted as LT being effective. However, the PER2 gene showed a tendency to decrease in both the LT and control groups, and the level of decline was similar. In other words, a potential effect of LT was observed on the PER1 gene but not on the PER2 gene. Thus, to confirm the statistical significance of this tendency, additional studies are needed. Further studies on improving the protocol are needed to minimize the variability of clock genes between individuals [38,39] and to investigate the expression of various clock genes in the peripheral blood under various conditions, including the timing, duration, and intensity of light exposure.
This study had several limitations. First, because we conducted this exploratory study to investigate the effect of morning LT on sleep-related parameters and the circadian system, the sample size was small. However, in this exploratory study, we observed meaningful changes in daytime sleepiness. The power was 0.531 (for ESS). Based on the current study, we are attempting to design another clinical trial with a sufficient sample size. Second, this study only involved a short trial period of two weeks, and it is still unclear whether LT has long-term efficacy in the treatment of patients with sleep disorders.
In addition, because light exposure is part of daily life, it is difficult to completely exclude the interference effect of artificial light. Although light is the most powerful zeitgeber, a stimulus synchronizing internal with external time, phase advancement can also occur during daytime physical exercise. Roenneberg et al [40]. reported, in a study using questionnaire data, that sleep time was increased by approximately 30 minutes when additional time was spent outdoors, but the relative contribution of light and physical activity to sleep has not yet been established. In addition, it was difficult to exclude the influence of physical activity during the day during the study participation period because it was difficult to assess. Although the absence of placebo is common in LT studies [41], there was no placebo condition in this study, and participants played a self-controlled role. It is known that blue light emitted from screens of digital devices can cause sleep disorders by reducing melatonin secretion [42]; however, the participants of this study were not subject to strict restrictions on daily life, such as suppression of the use of digital devices at night. Thus, future research will require a study on personalized light exposure time.
Despite these limitations, the present study is the first to comprehensively examine the influence of morning LT on sleep-related parameters, hormones, and circadian genes.
5. Conclusions
In this double-blind, open-label, feasibility study, we found that morning LT im-proved daytime sleepiness in adults with insomnia. We suggest that morning LT could improve the quality of life of adults with daytime sleepiness. Further large randomized controlled trials are needed to identify the impact of LT on sleep parameters, hormones, and circadian rhythms.
Supplementary Materials
The following supporting information can be downloaded at the website of this paper posted on Preprints.org. Figure S1: Photometer assessment results by the Korean Photonics Technology Institute.
Author Contributions
Conceptualization, T.-H.H and Y.-J.K.; methodology, J.Y., S.-J.H, H. L., E. S.; formal analysis, J.Y., S.-J.H, H. L., E. S.; writing—original draft preparation, J.Y., S.-J.H, H. L., E. S., Y.-J.K.; writing—review and editing, Y.-J.K.; supervision, T.-H.H and Y.-J.K.; project administration, T.-H.H and Y.-J.K.; funding acquisition, T.-H.H and Y.-J.K. All authors have read and agreed to the published version of the manuscript.
Funding
This research was funded by the Korea Evaluation Institute of Industrial Technology (KEIT) granted funded by the Ministry of Trade, Industry & Energy (MOTIE, Korea), grant number 20016881.
Institutional Review Board Statement
The study was conducted in accordance with the Declaration of Helsinki, and approved by the Institutional Review Board of Yongin Severance Hospital (IRB No. 9-2022-0025 and date of approval: 30/03/2022).
Informed Consent Statement
Informed consent was obtained from all subjects involved in the study.
Data Availability Statement
The datasets generated and analyzed during the current study are available from the corresponding author upon reasonable request.
Acknowledgments
This study was supported by the Health IT Center of Yonsei University Severance Hospital.
Conflicts of Interest
The authors declare no conflict of interest.
References
- Grandner, M. A. & Pack, A. I. Sleep disorders, public health, and public safety. JAMA 306, 2616-2617 (2011). [CrossRef]
- Silvestri, R. & Aricò, I. Sleep disorders in pregnancy. Sleep Science 12, 232 (2019). [CrossRef]
- Goldstein, A. N. & Walker, M. P. The role of sleep in emotional brain function. Annual review of clinical psychology 10, 679 (2014). [CrossRef]
- Kessler, R. C. et al. Insomnia and the performance of US workers: results from the America insomnia survey. Sleep 34, 1161-1171 (2011). [CrossRef]
- Vgontzas, A. N. , Liao, D., Bixler, E. O., Chrousos, G. P. & Vela-Bueno, A. Insomnia with objective short sleep duration is associated with a high risk for hypertension. Sleep 32, 491-497 (2009). [CrossRef]
- Nagai, M. , Hoshide, S. & Kario, K. Sleep duration as a risk factor for cardiovascular disease-a review of the recent literature. Current cardiology reviews 6, 54-61 (2010). [CrossRef]
- Cappuccio, F. P. , D'Elia, L., Strazzullo, P. & Miller, M. A. Quantity and quality of sleep and incidence of type 2 diabetes: a systematic review and meta-analysis. Diabetes care 33, 414-420 (2010). [CrossRef]
- Ayas, N. T. et al. A prospective study of self-reported sleep duration and incident diabetes in women. Diabetes care 26, 380-384 (2003). [CrossRef]
- Gottlieb, D. J. et al. Association of sleep time with diabetes mellitus and impaired glucose tolerance. Archives of internal medicine 165, 863-867 (2005). [CrossRef]
- Jiao, L. et al. Sleep duration and incidence of colorectal cancer in postmenopausal women. British journal of cancer 108, 213-221 (2013). [CrossRef]
- Spira, A. P. , Chen-Edinboro, L. P., Wu, M. N. & Yaffe, K. Impact of sleep on the risk of cognitive decline and dementia. Current opinion in psychiatry 27, 478 (2014). [CrossRef]
- Sabia, S. et al. Association of sleep duration in middle and old age with incidence of dementia. Nature Communications 12, 1-10 (2021). [CrossRef]
- Lapierre, S. et al. Daily hassles, physical illness, and sleep problems in older adults with wishes to die. International Psychogeriatrics 24, 243-252 (2012). [CrossRef]
- Morin, C. M. et al. Prevalence of insomnia and its treatment in Canada. The Canadian Journal of Psychiatry 56, 540-548 (2011). [CrossRef]
- Roth, T. et al. Prevalence and perceived health associated with insomnia based on DSM-IV-TR; international statistical classification of diseases and related health problems, tenth revision; and research diagnostic criteria/international classification of sleep disorders, criteria: results from the America insomnia survey. Biological psychiatry 69, 592-600 (2011). [CrossRef]
- Ohayon, M. M. & Hong, S.-C. Prevalence of insomnia and associated factors in South Korea. Journal of psychosomatic research 53, 593-600 (2002). [CrossRef]
- Serin, Y. & Tek, N. A. Effect of circadian rhythm on metabolic processes and the regulation of energy balance. Annals of Nutrition and Metabolism 74, 322-330 (2019). [CrossRef]
- Duffy, J. F. & Wright Jr, K. P. Entrainment of the human circadian system by light. Journal of biological rhythms 20, 326-338 (2005).
- Van Maanen, A. , Meijer, A. M., van der Heijden, K. B. & Oort, F. J. The effects of light therapy on sleep problems: a systematic review and meta-analysis. Sleep medicine reviews 29, 52-62 (2016). [CrossRef]
- Aulsebrook, A. E. , Jones, T. M., Mulder, R. A. & Lesku, J. A. Impacts of artificial light at night on sleep: a review and prospectus. Journal of Experimental Zoology Part A: Ecological and Integrative Physiology 329, 409-418 (2018). [CrossRef]
- Morin, C. M. & Benca, R. Chronic insomnia. The Lancet 379, 1129-1141 (2012). [CrossRef]
- Geiger-Brown, J. M. et al. Cognitive behavioral therapy in persons with comorbid insomnia: a meta-analysis. Sleep medicine reviews 23, 54-67 (2015). [CrossRef]
- Kroenke, K. , Spitzer, R. L. & Williams, J. B. The PHQ-9: validity of a brief depression severity measure. J Gen Intern Med (2001). 16, 606-613. [CrossRef]
- Horne, J. A. & Ostberg, O. A self-assessment questionnaire to determine morningness-eveningness in human circadian rhythms. International journal of chronobiology 4, 97-110 (1976).
- Yu, J. H. et al. Evening chronotype is associated with metabolic disorders and body composition in middle-aged adults. The Journal of clinical endocrinology and metabolism (2015). 100, 1494-1502. [CrossRef]
- Buysse, D. J. , Reynolds, C. F., 3rd, Monk, T. H., Berman, S. R. & Kupfer, D. J. The Pittsburgh Sleep Quality Index: a new instrument for psychiatric practice and research. Psychiatry research 28, 193-213 (1989).
- Bastien, C.H.; Vallières, A.M. Validation of the Insomnia Severity Index as an outcome measure for insomnia research. Sleep Med 2001, 2, 297–307. [Google Scholar] [CrossRef]
- MacLean, A. W.; Fekken, G. B. Psychometric evaluation of the Stanford Sleepiness Scale. J Sleep Res 1992, 1, 35–39. [Google Scholar] [CrossRef]
- Lapin, B. R. , Bena, J. F., Walia, H. K. & Moul, D. E. The Epworth Sleepiness Scale: Validation of One-Dimensional Factor Structure in a Large Clinical Sample. J Clin Sleep Med (2018) 14, 1293-1301. [CrossRef]
- Münch, M. et al. Blue-enriched morning light as a countermeasure to light at the wrong time: effects on cognition, sleepiness, sleep, and circadian phase. Neuropsychobiology 74, 207-218 (2016). [CrossRef]
- Hatori, M. & Panda, S. The emerging roles of melanopsin in behavioral adaptation to light. Trends in molecular medicine 16, 435-446 (2010). [CrossRef]
- Yeung, V. , Sharpe, L., Glozier, N., Hackett, M. L. & Colagiuri, B. A systematic review and meta-analysis of placebo versus no treatment for insomnia symptoms. Sleep medicine reviews 38, 17-27 (2018). [CrossRef]
- Jung, C. M. et al. Acute effects of bright light exposure on cortisol levels. Journal of biological rhythms 25, 208-216 (2010). [CrossRef]
- Gabel, V. et al. Effects of artificial dawn and morning blue light on daytime cognitive performance, well-being, cortisol and melatonin levels. Chronobiology international 30, 988-997 (2013). [CrossRef]
- Scheer, F. & Buijs, R. M. Light affects morning salivary cortisol in humans. Journal of Clinical Endocrinology and Metabolism 84, 3395-3398 (1999).
- Cajochen, C. et al. High sensitivity of human melatonin, alertness, thermoregulation, and heart rate to short wavelength light. The journal of clinical endocrinology & metabolism 90, 1311-1316 (2005).
- Emeklİ, R. et al. Comparing expression levels of PERIOD genes PER1, PER2 and PER3 in chronic insomnia patients and medical staff working in the night shift. Sleep Medicine 73, 101-105 (2020). [CrossRef]
- James, F. O. , Boivin, D. B., Charbonneau, S., Bélanger, V. & Cermakian, N. Expression of clock genes in human peripheral blood mononuclear cells throughout the sleep/wake and circadian cycles. Chronobiology international 24, 1009-1034 (2007). [CrossRef]
- Archer, S. N. , Viola, A. U., Kyriakopoulou, V., von Schantz, M. & Dijk, D.-J. Inter-individual differences in habitual sleep timing and entrained phase of endogenous circadian rhythms of BMAL1, PER2 and PER3 mRNA in human leukocytes. Sleep 31, 608-617 (2008). [CrossRef]
- Roenneberg, T. , Wirz-Justice, A. & Merrow, M. Life between clocks: daily temporal patterns of human chronotypes. Journal of biological rhythms 18, 80-90 (2003). [CrossRef]
- Eastman, C. Is Bright Light Therapy a Placebo. Seasonal Affective Disorder Practice and Research, 103-112 (2001).
- Shechter, A. , Kim, E. W., St-Onge, M.-P. & Westwood, A. J. Blocking nocturnal blue light for insomnia: A randomized controlled trial. Journal of psychiatric research 96, 196-202 (2018). [CrossRef]
Figure 1.
Flow chart of the study population.
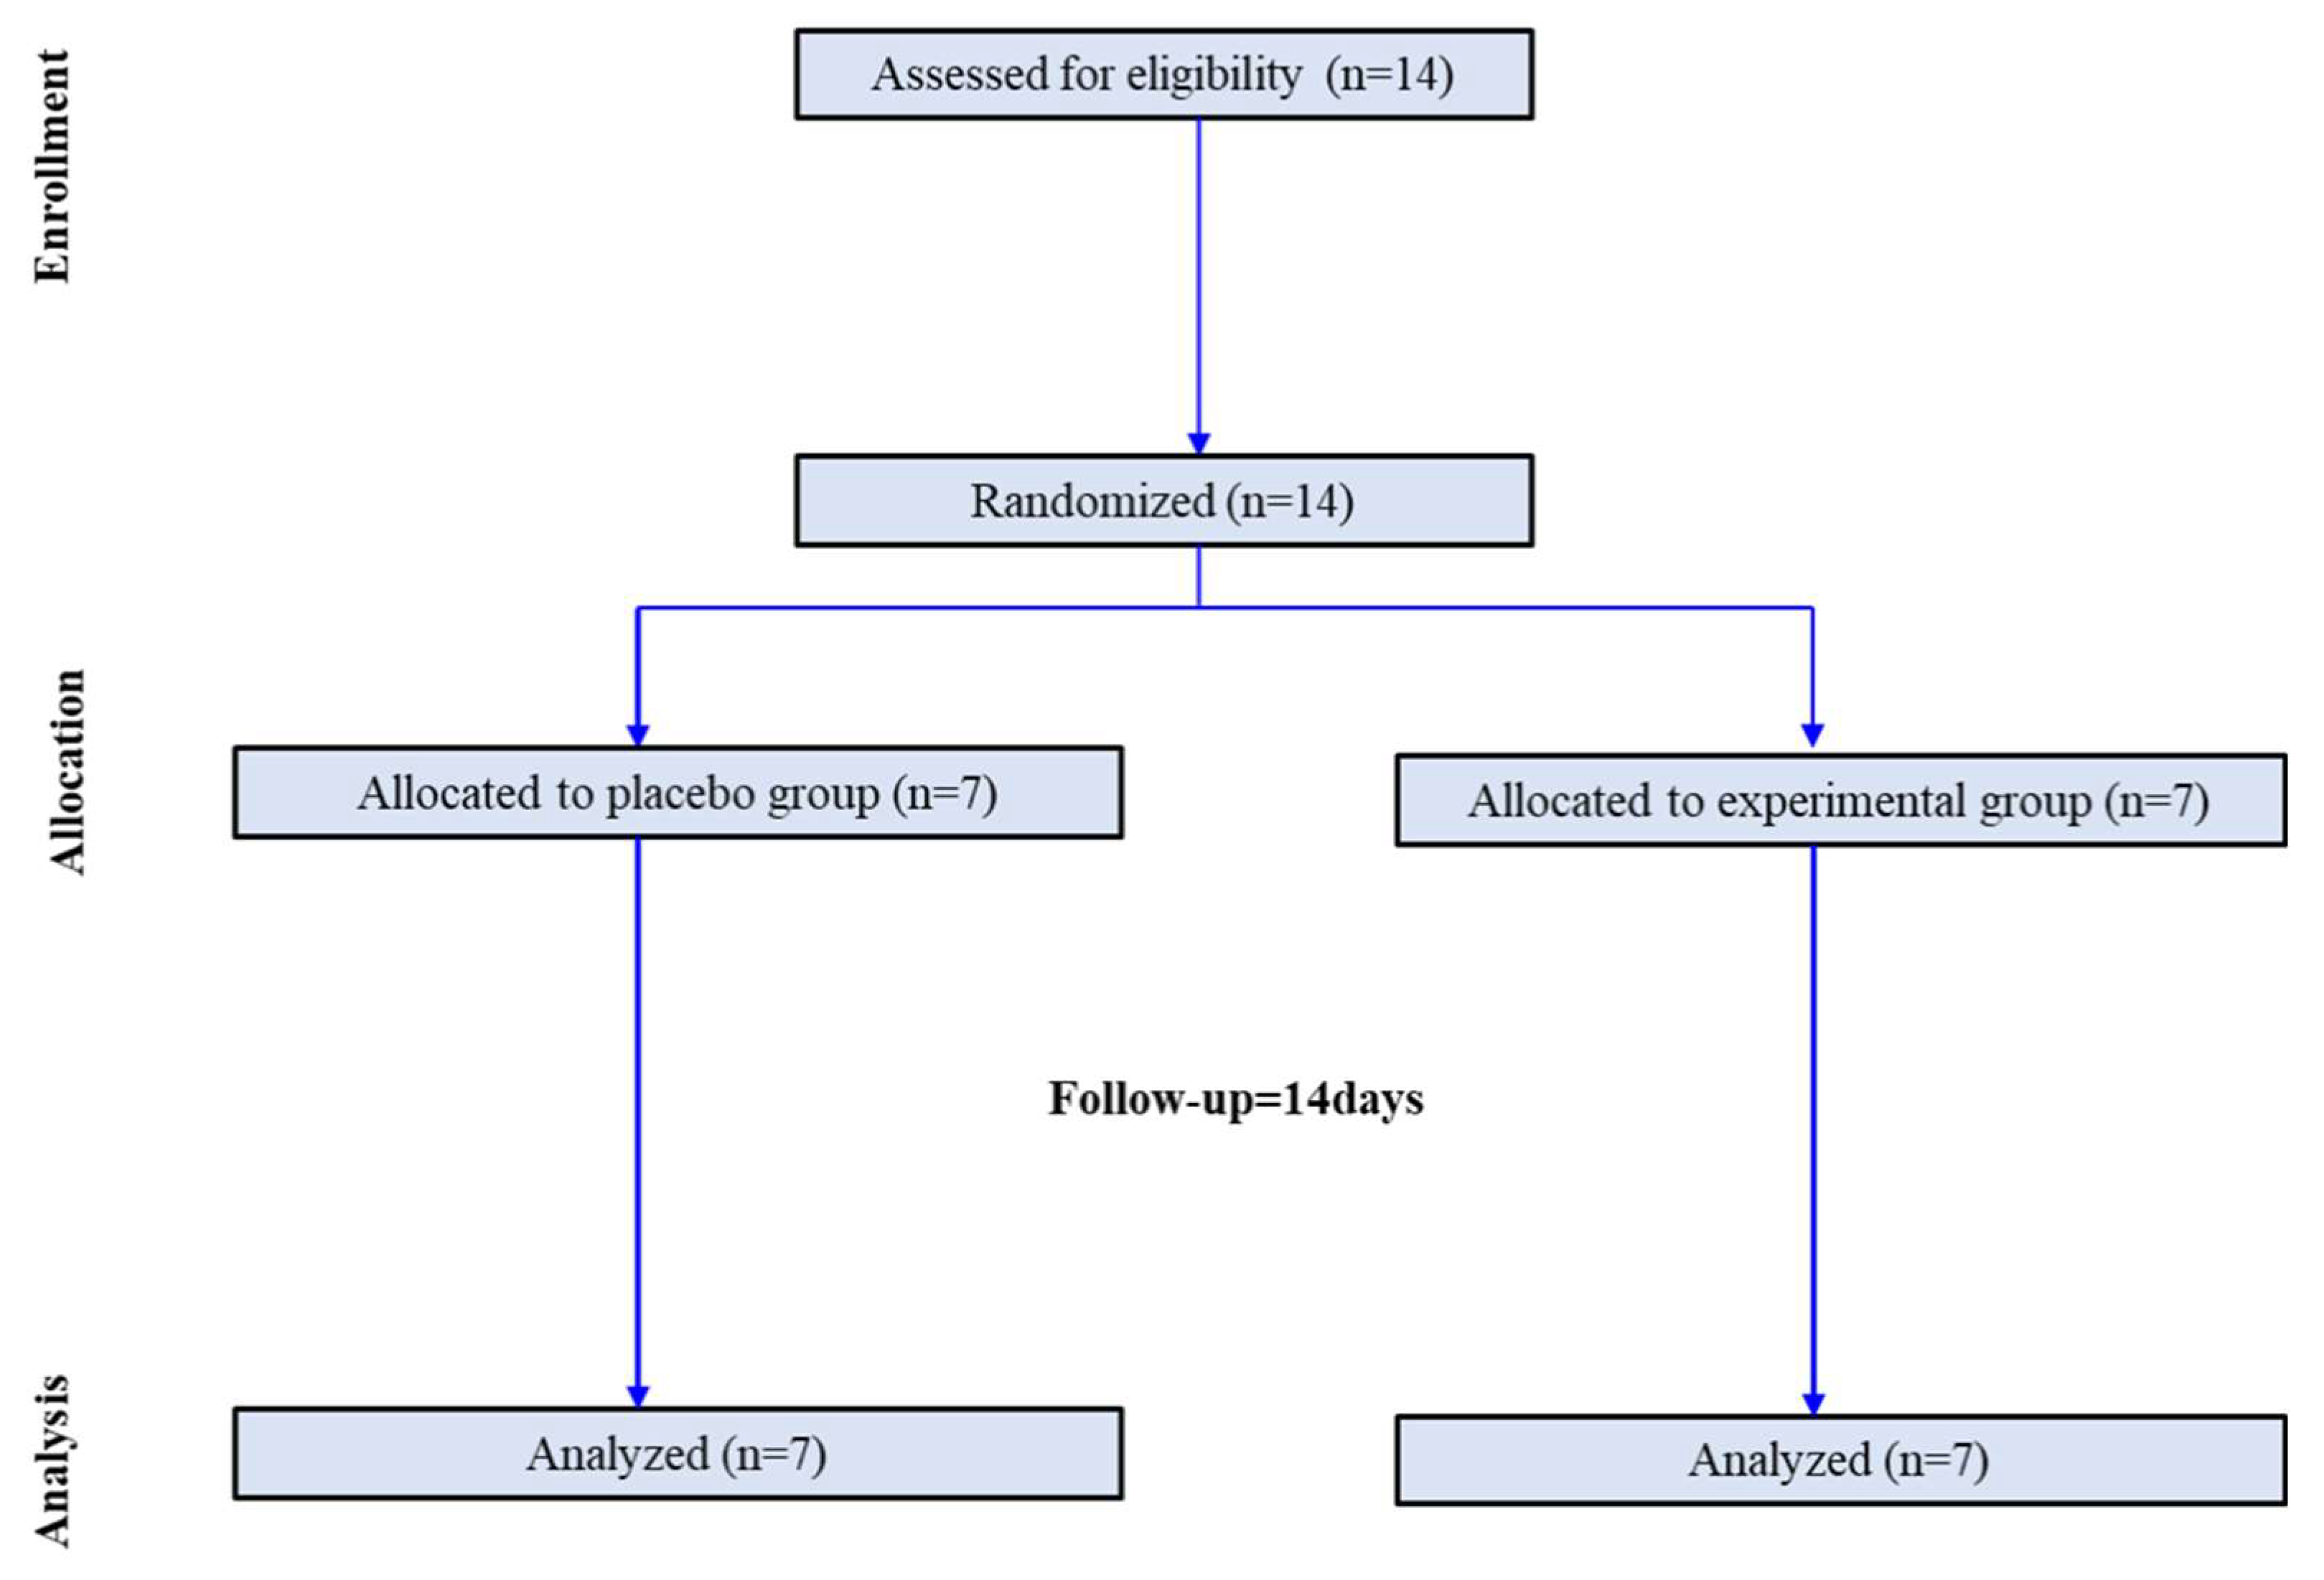
Figure 2.
Sleep parameters assessed by actigraphy during the two weeks. Group 1: control group, Group 2: light therapy (LT) group.
Figure 2.
Sleep parameters assessed by actigraphy during the two weeks. Group 1: control group, Group 2: light therapy (LT) group.
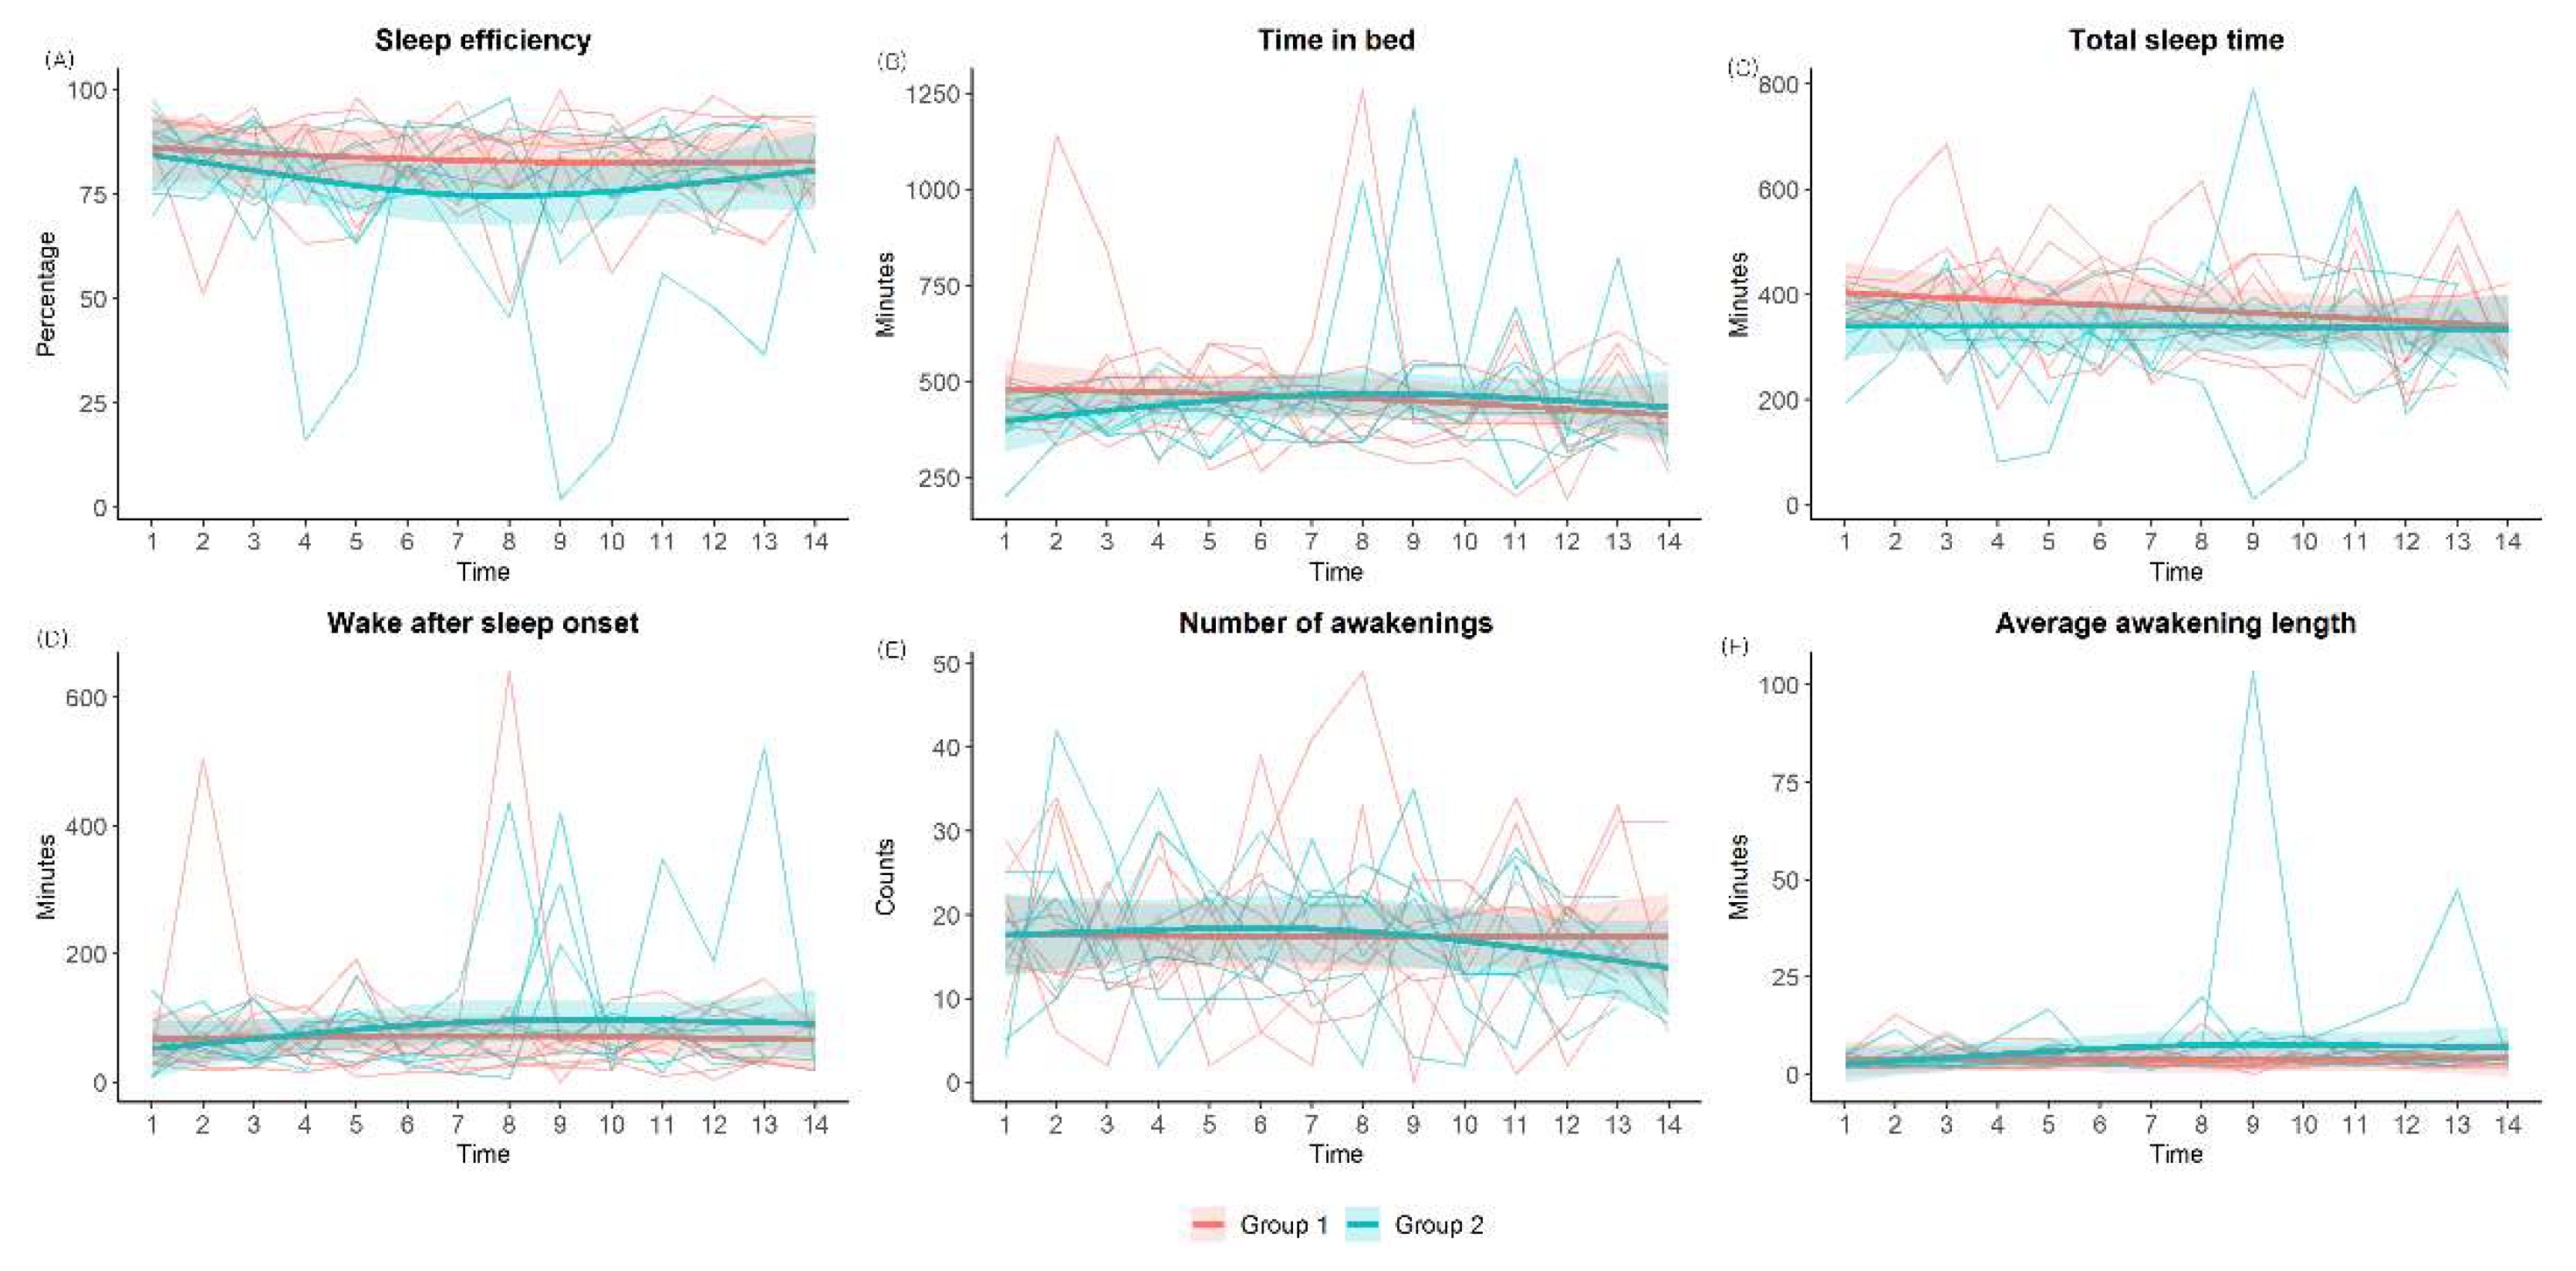
Figure 3.
Changes in sleep- and mood-related parameters during the clinical trial.
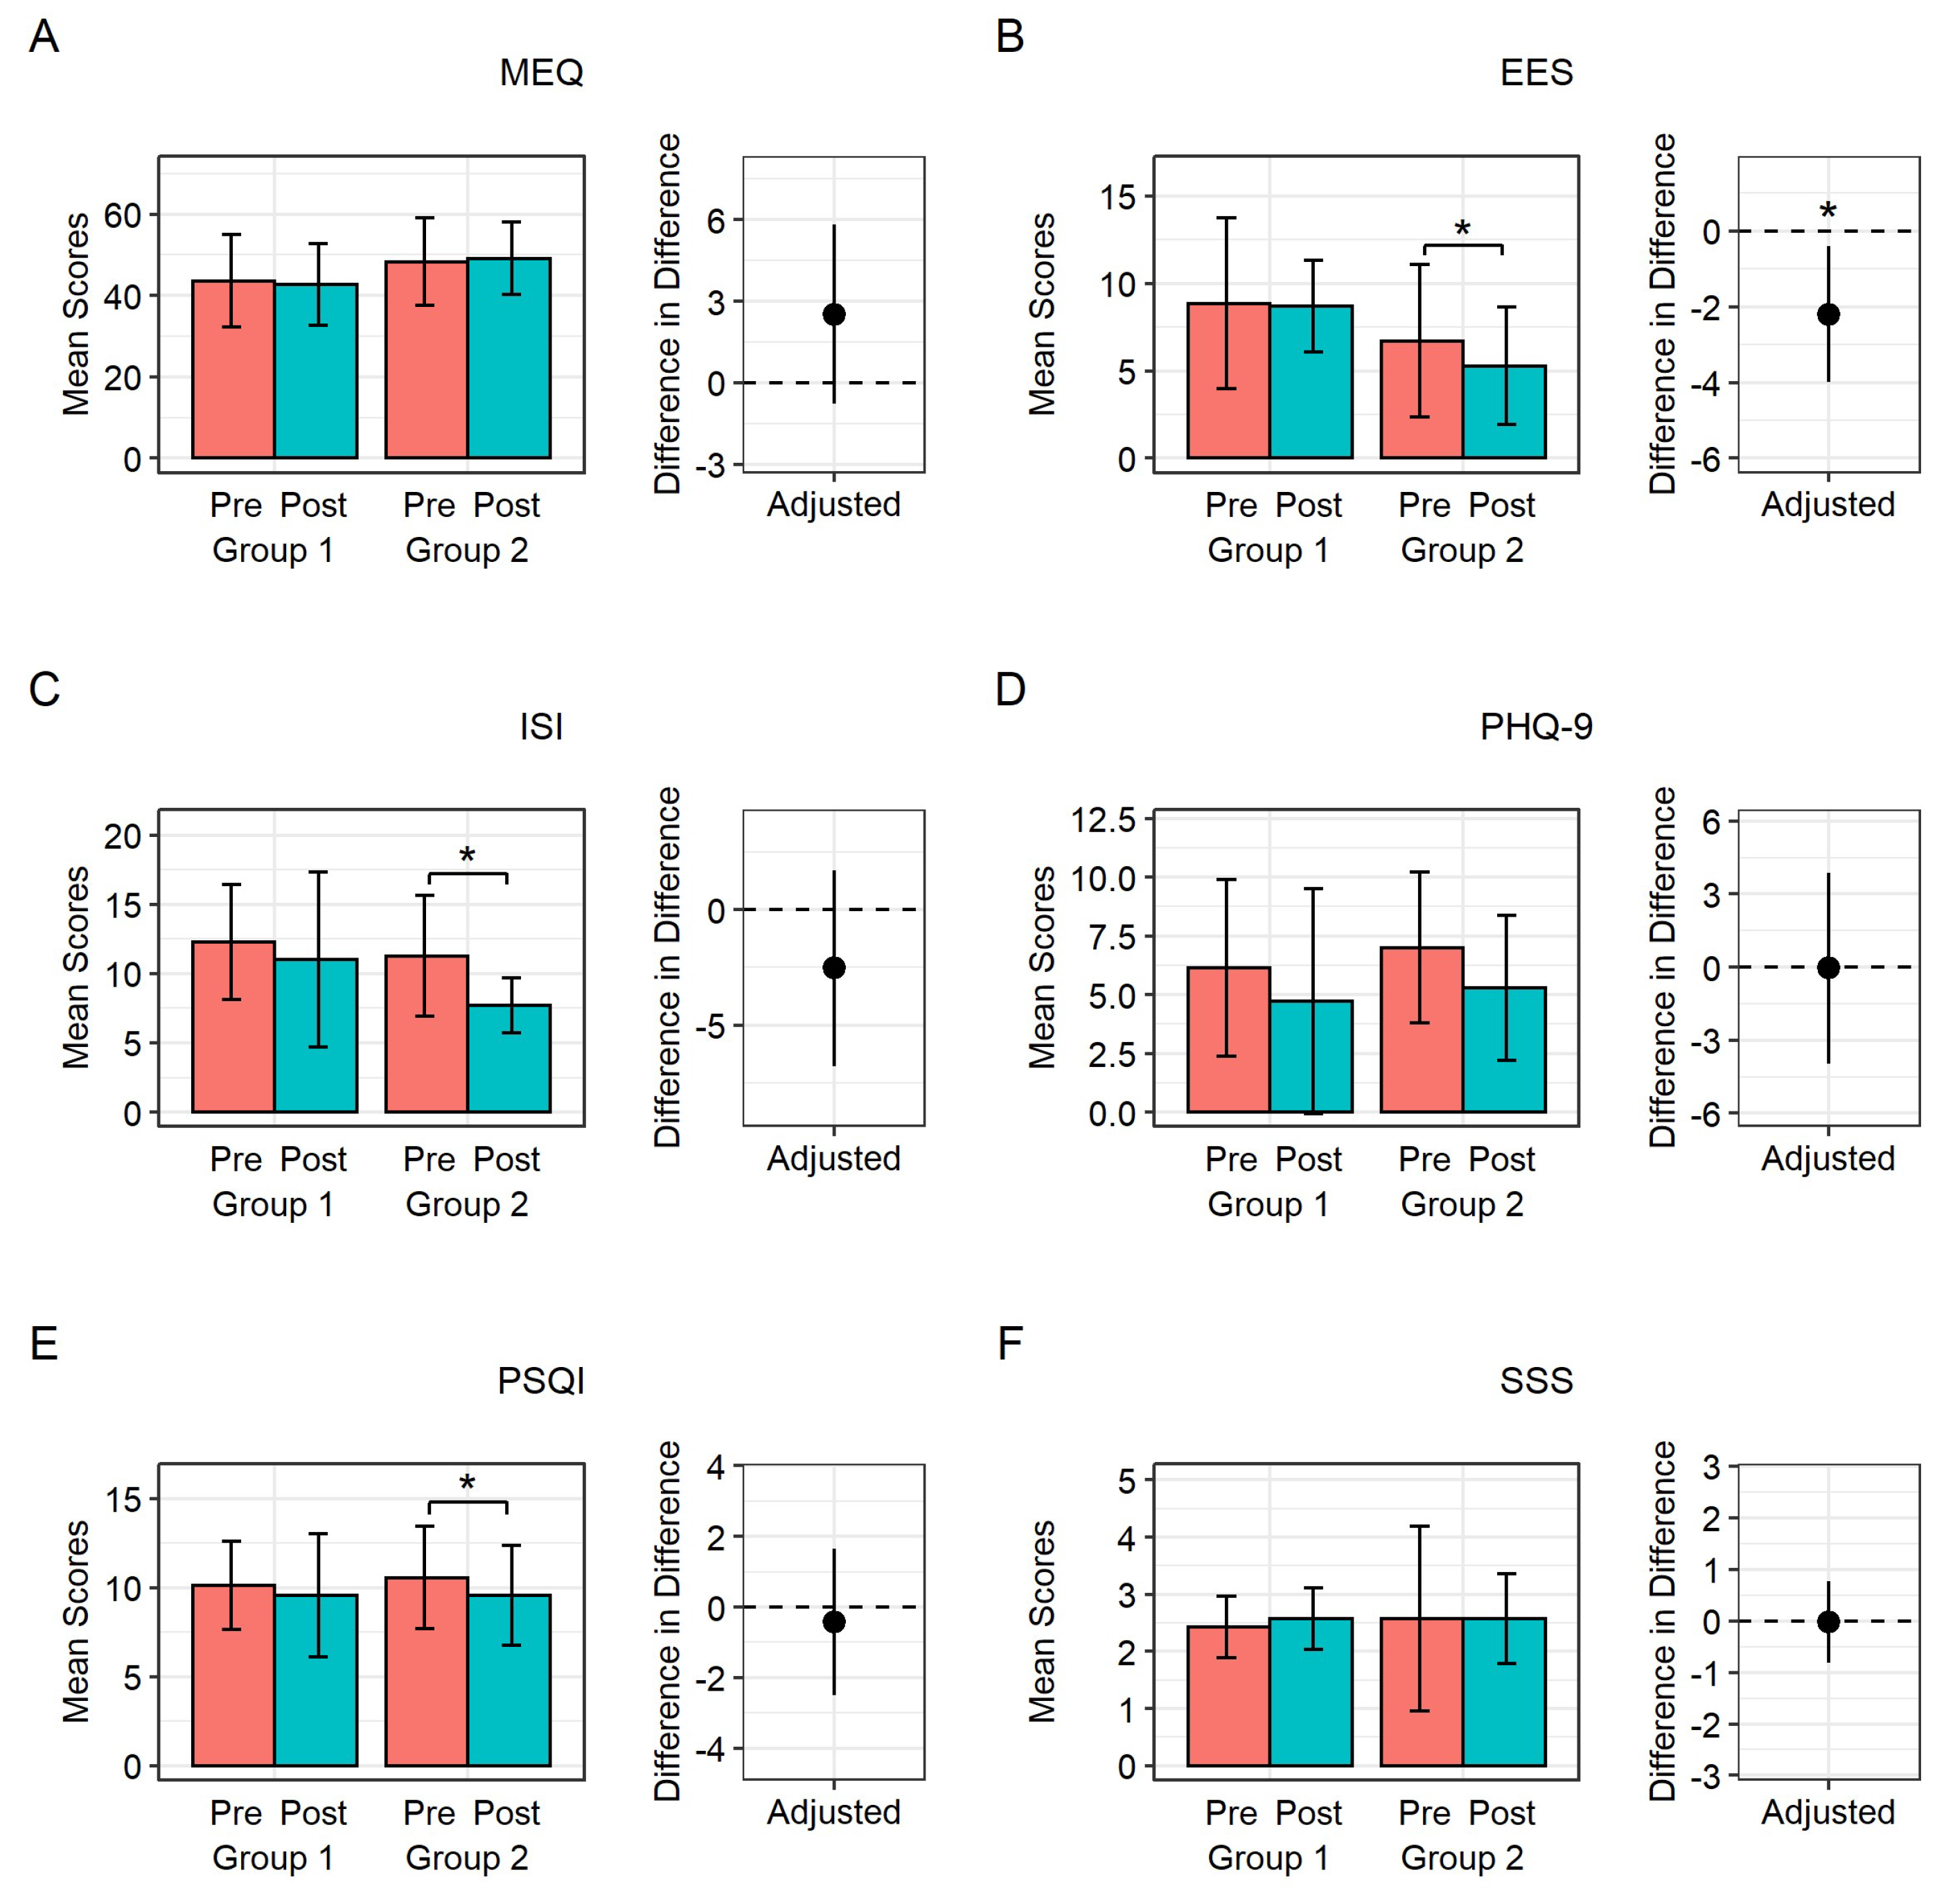
Figure 4.
Clock genes expression in peripheral blood mononuclear cells before and after the two-week period. Pre G1: Before clinical trial in the control group, Post G1: After clinical trial in the control group. Pre G2: Before clinical trial in the light therapy group, Post G2: After clinical trial in the light therapy group.
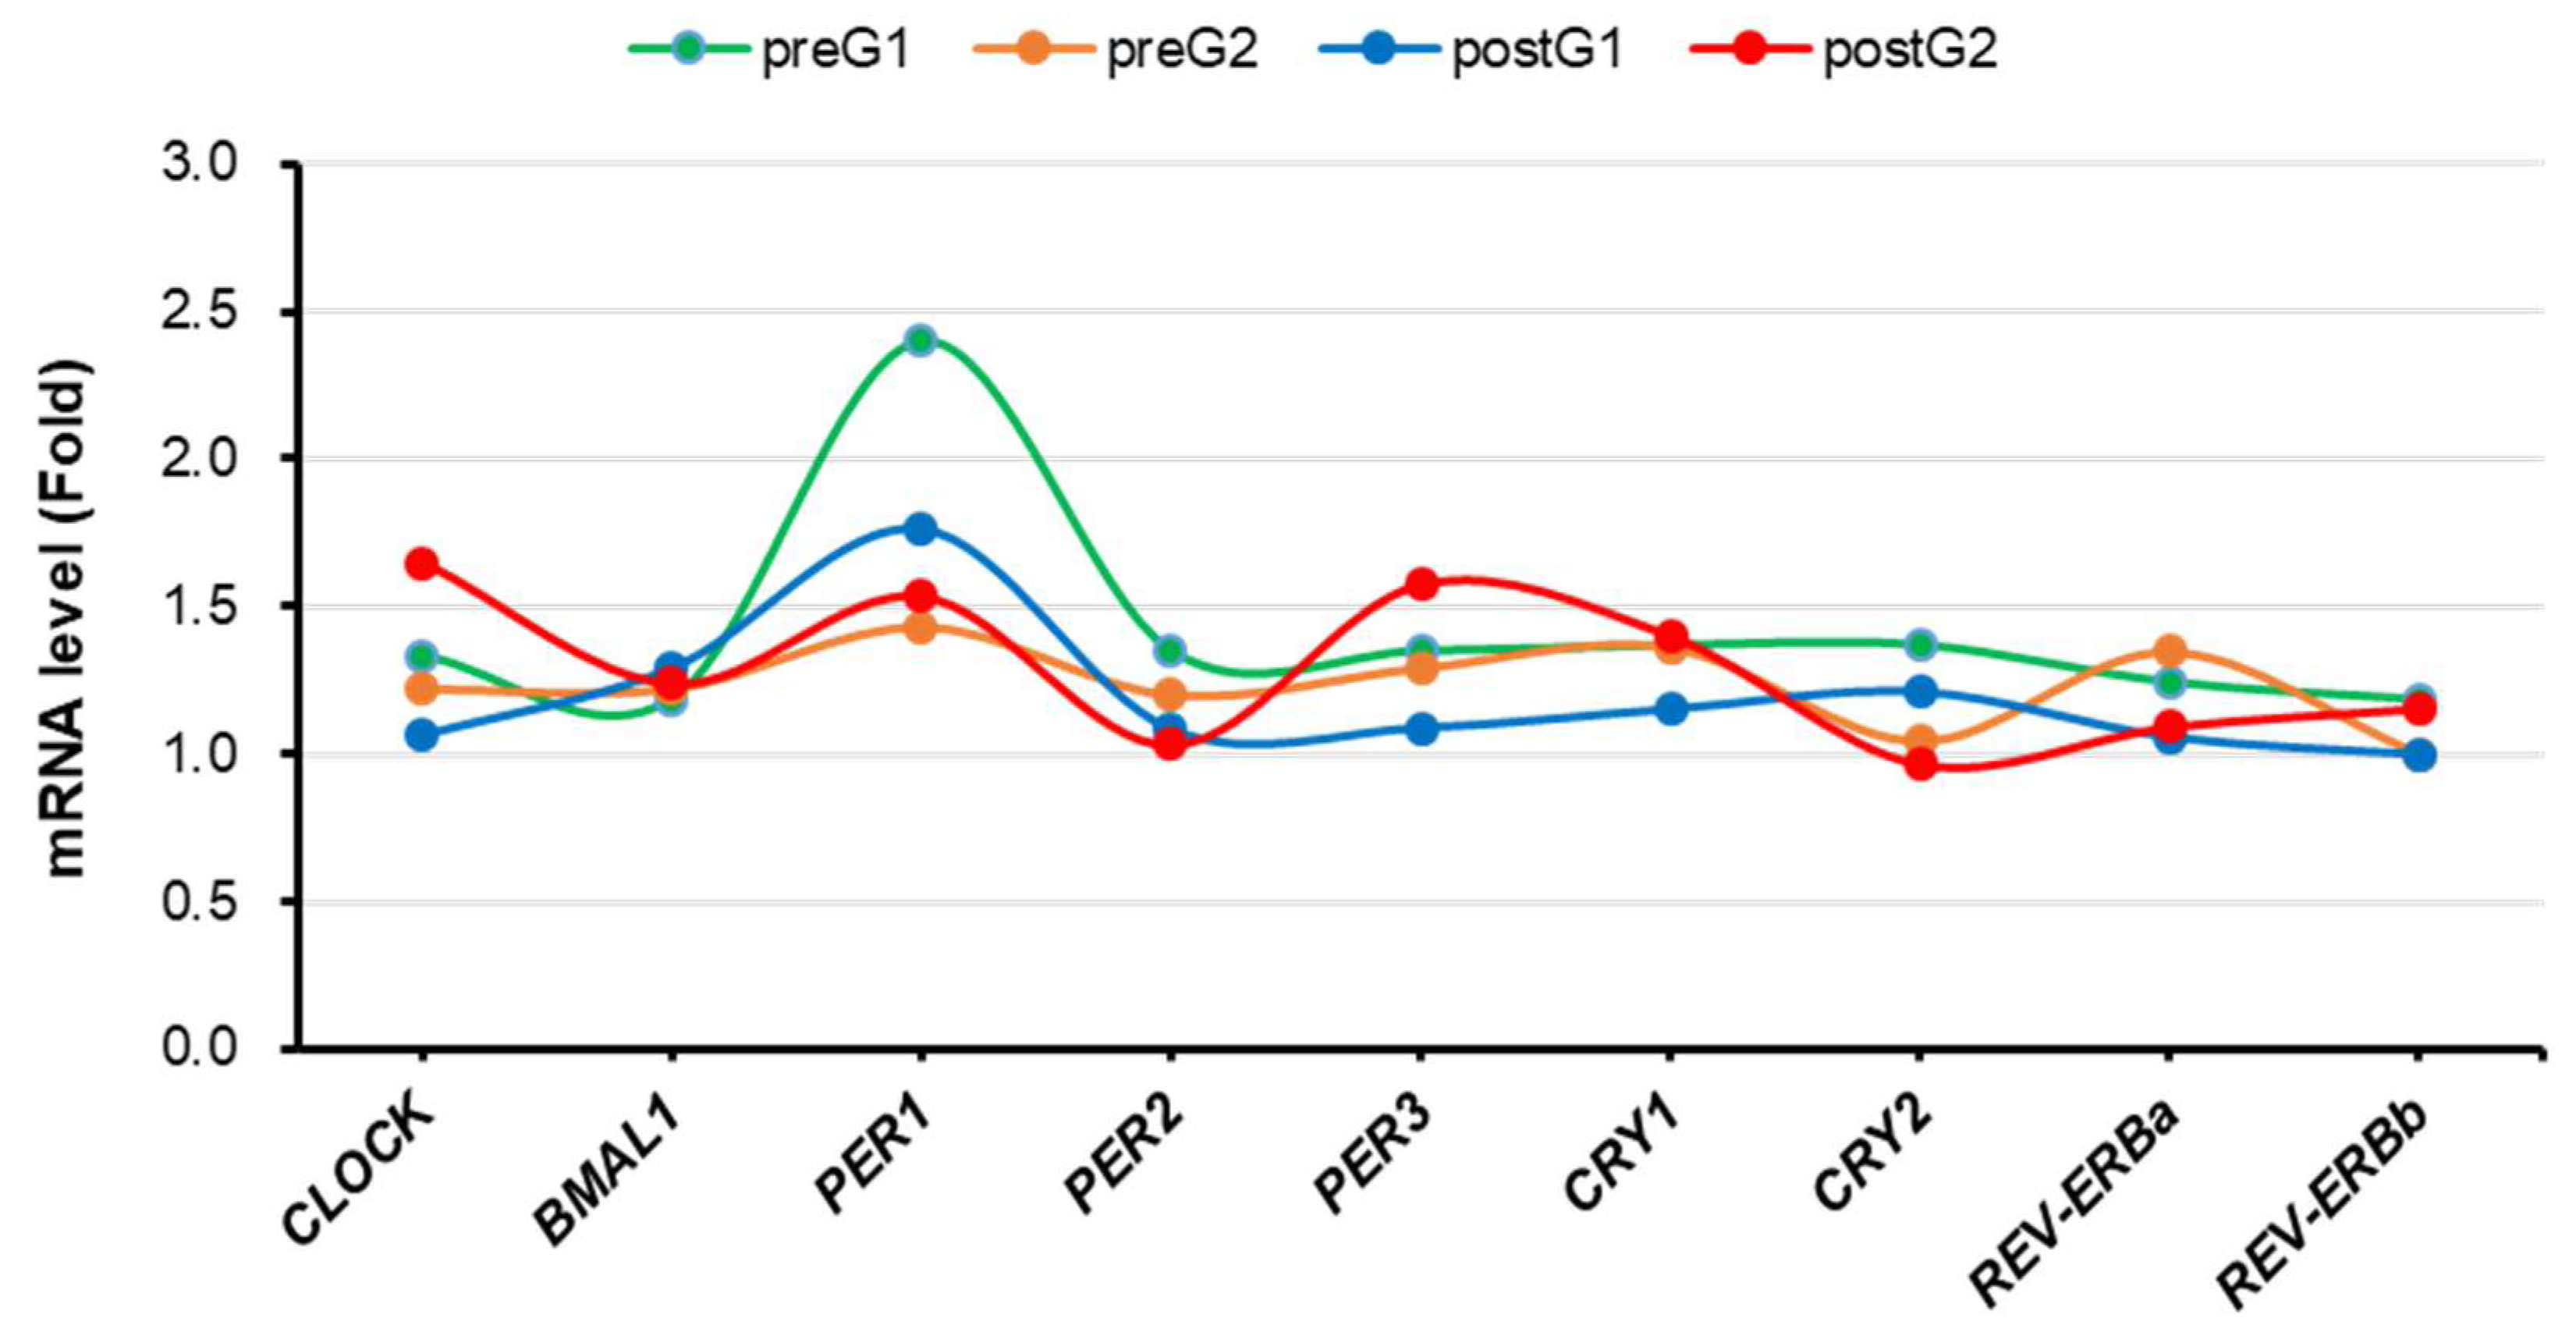

Table 1.
Baseline characteristics of study population.
| Variable | Overall (n = 14) |
Control group (n = 7) |
Experimental group(LT) (n = 7) |
p-value |
|---|---|---|---|---|
| Age, years | 42.2 ± 10.2 | 37.0 ± 10.8 | 47.4 ± 6.7 | 0.054 |
| Gender, n (%) | >0.999 | |||
| Women | 13 (92.9) | 6 (85.7) | 7 (100.0) | |
| Men | 1 (7.1) | 1 (14.3) | 0 (0.0) | |
| Weight, kg | 62.1 ± 12.2 | 60.0 ± 13.1 | 64.3 ± 11.7 | 0.533 |
| Height, m | 161.9 ± 8.7 | 162.4 ± 10.5 | 161.5 ± 7.4 | 0.863 |
| Body mass index, kg/m2 | 23.5 ± 3.1 | 22.5 ± 2.2 | 24.6 ± 3.7 | 0.217 |
| SBP, mmHg | 121.9 ± 9.4 | 119.4 ± 6.7 | 124.3 ± 11.6 | 0.360 |
| DBP, mmHg | 74.3 ± 7.1 | 71.1 ± 7.2 | 77.4 ± 5.9 | 0.102 |
| Diabetes, n (%) | >0.999 | |||
| Yes | 1 (7.1) | 0 (0.0) | 1 (14.3) | |
| No | 13 (92.9) | 7 (100.0) | 6 (85.7) | |
| Hypertension, n (%) | ||||
| Yes | 0 (0.0) | 0 (0.0) | 0 (0.0) | |
| No | 14 (100.0) | 7 (100.0) | 7 (100.0) | |
| Dyslipidemia, n (%) | 0.445 | |||
| Yes | 2 (14.3) | 0 (0.0) | 2 (28.6) | |
| No | 12 (85.7) | 7 (100.0) | 5 (71.4) | |
| Smoking, n (%) | >0.999 | |||
| Yes | 1 (7.1) | 1 (14.3) | 0 (0.0) | |
| No | 13 (92.9) | 6 (85.7) | 7 (100.0) | |
| Drinking, n (%) | >0.999 | |||
| Yes | 9 (64.3) | 4 (57.1) | 5 (71.4) | |
| No | 5 (35.7) | 3 (42.9) | 2 (28.6) | |
| Exercise, n (%) | >0.999 | |||
| Yes | 9 (64.3) | 4 (57.1) | 5 (71.4) | |
| No | 5 (35.7) | 3 (42.9) | 2 (28.6) |
p-value was calculated using the independent two sample t-test.
Table 2.
Characteristics and changes in the control and experimental groups (LT) at baseline and after intervention.
Table 2.
Characteristics and changes in the control and experimental groups (LT) at baseline and after intervention.
| Variable | Control group | Experimental group (LT) | p-value† | ||||||
|---|---|---|---|---|---|---|---|---|---|
| Pre | Post | Diff | p-value* | Pre | Post | Diff | p-value* | ||
| WBC | 6.8 ± 2.4 | 6.0 ± 1.1 | -0.8 ± 1.8 | 0.284 | 7.1 ± 1.7 | 7.1 ± 1.4 | -0.1 ± 0.6 | 0.810 | 0.059 |
| Glucose,mg/dl | 98.0 ± 5.3 | 91.1 ± 8.1 | -6.9 ± 6.5 | 0.031 | 109.0 ± 15.0 | 101.6 ± 10.4 | -7.4 ± 8.6 | 0.062 | 0.369 |
| TC, mg/dl | 170.1 ± 27.5 | 168.3 ± 16.0 | -1.9 ± 23.3 | 0.840 | 186.3 ± 30.9 | 185.9 ± 29.5 | -0.4 ± 4.0 | 0.784 | 0.404 |
| TG,mg/dl | 188.4 ± 252.9 | 103.1 ± 41.2 | -85.3 ± 227.9 | 0.360 | 168.3 ± 133.4 | 120.0 ± 31.9 | -48.3 ± 131.5 | 0.369 | 0.313 |
| HDL-C, mg/dl | 57.6 ± 10.5 | 61.4 ± 8.3 | 3.0 ± 9.2 | 0.308 | 65.3 ± 10.7 | 64.7 ± 12.7 | -0.6 ± 7.5 | 0.847 | 0.658 |
| LDL-C, mg/dl | 94.7 ± 24.8 | 99.7 ± 15.5 | 5.0 ± 17.8 | 0.484 | 109.9 ± 34.3 | 113.0 ± 31.5 | 3.1 ± 11.7 | 0.505 | 0.743 |
| Insulin, IU/L | 16.2 ± 16.6 | 12.7 ± 11.0 | -3.5 ± 6.8 | 0.225 | 14.9 ± 11.2 | 7.2 ± 3.5 | -7.7 ± 11.9 | 0.138 | 0.132 |
| HOMA IR | 4.0 ± 4.0 | 2.8 ± 2.3 | -1.6 ± 2.1 | 0.198 | 4.2 ± 3.4 | 1.8 ± 1.0 | -2.4 ± 3.5 | 0.120 | 0.187 |
| HsCRP, mg/dl | 0.6 ± 0.5 | 0.5 ± 0.5 | -0.1 ± 0.5 | 0.700 | 0.8 ± 1.5 | 1.1 ± 1.7 | 0.4 ± 1.6 | 0.577 | 0.409 |
| Cortisol, ㎍/dl | 11.0 ± 4.5 | 10.8± 3.7 | -0.2 ± 2.2 | 0.792 | 9.7± 3.6 | 7.6 ± 3.1 | -2.1 ± 2.7 | 0.085 | 0.073 |
| ACTH | 24.2 ± 17.4 | 22.0 ± 10.5 | -2.2 ± 9.7 | 0.575 | 27.5 ± 14.4 | 24.5 ± 9.7 | -3.0 ± 12.0 | 0.526 | 0.818 |
| Serotonin | 165.0 ± 73.5 | 168.2 ± 97.9 | 3.2 ± 71.6 | 0.909 | 136.6 ± 132.5 | 146.0 ± 115.0 | 9.4 ± 39.6 | 0.551 | 0.950 |
| MHR(bpm) | 86.9 ± 16.1 | 89.6 ± 8.4 | 2.6 ± 8.4 | 0.436 | 75.4 ± 7.8 | 77.3 ± 8.8 | 1.9 ± 6.9 | 0.488 | 0.089 |
| SDNN(ms) | 27.1 ± 16.6 | 25.3 ± 7.5 | -1.8 ± 14.0 | 0.749 | 29.0 ± 11.4 | 28.4 ± 13.0 | -0.6 ± 5.2 | 0.762 | 0.639 |
| TP(m/s2) | 761.7 ± 842.5 | 438.6 ± 275.6 | -323.0 ± 830.5 | 0.343 | 805.1 ± 634.4 | 870.9 ± 984.9 | 65.7 ± 685.1 | 0.808 | 0.273 |
| LFNorm | 60.6 ± 16.9 | 36.8 ± 11.7 | -23.8 ± 16.8 | 0.009 | 56.1 ± 27.7 | 51.1 ± 19.6 | -5.1 ± 30.5 | 0.674 | 0.115 |
| HFNorm | 39.4 ± 16.9 | 63.2 ± 11.7 | 23.8 ± 16.8 | 0.009 | 43.9 ± 27.7 | 49.0 ± 19.6 | 5.1 ± 30.5 | 0.674 | 0.115 |
| LF/HF Ratio | 2.4 ± 2.5 | 0.6± 0.4 | -1.7 ± 2.5 | 0.118 | 2.7 ± 3.3 | 1.5 ± 1.3 | -1.2 ± 3.6 | 0.402 | 0.147 |
WBC, White blood cells; TC, Total cholesterol; TG, Triglyceride; HDL-C, High-density lipoprotein cholesterol; LDL-C, Low density lipoprotein cholesterol; HOMA-IR, Homeostatic model assessment for insulin resistance; hsCRP, High sensitive C-reactive protein; ACTH, Adrenocorticotropic hormone; MHR, Mean heart rate; SDNN, Standard deviation of normal-to-normal interval; TP, Total power; LFnormal, Normalized low frequency; HFnormal, Normalized high frequency. *p-value was calculated using paired t-test. †p-value was calculated using linear regression to adjust baseline value.
Disclaimer/Publisher’s Note: The statements, opinions and data contained in all publications are solely those of the individual author(s) and contributor(s) and not of MDPI and/or the editor(s). MDPI and/or the editor(s) disclaim responsibility for any injury to people or property resulting from any ideas, methods, instructions or products referred to in the content. |
© 2023 by the authors. Licensee MDPI, Basel, Switzerland. This article is an open access article distributed under the terms and conditions of the Creative Commons Attribution (CC BY) license (http://creativecommons.org/licenses/by/4.0/).
Copyright: This open access article is published under a Creative Commons CC BY 4.0 license, which permit the free download, distribution, and reuse, provided that the author and preprint are cited in any reuse.


