Submitted:
27 March 2025
Posted:
29 March 2025
You are already at the latest version
Abstract
Sleep disorders are highly prevalent in society and require focused attention within healthcare systems. While patient history, reported complaints, and subjective sleep questionnaires can provide initial insights into the potential sleep issues, polysomnography (PSG) remains the gold standard for diagnosing various sleep disorders. However, long waiting times for PSG appointments in many healthcare facilities pose challenges for timely diagnosis and treatment. This study aimed to evaluate the diagnostic value of subjective measures, including patient-reported parameters, in comparison to the objective findings of PSG. This study included 562 patients who underwent clinical evaluation and PSG testing at the Hospital of Lithuanian University of Health Sciences Kaunas Clinics between 2018 and 2024. We report diagnostic accuracy of different sleep questionnaires (Epworth Sleepiness Scale (ESS), Insomnia Severity Index (ISI), Berlin Questionnaire (BQ), Ullanlina Narcolepsy Scale (UNS), Innsbruck REM Sleep Behaviour Disorder Inventory (RBD-I), REM Sleep Behaviour Disorder Single-Question Screen (RBD1Q), Paris Arousal Disorders Severity Scale (PADSS)) to detect various sleep disorders in our population. When comparing our findings with previous literature, we found that the screening tools generally demonstrated slightly lower performance in our population. However, our results suggest that certain individual questions from comprehensive questionnaires may provide comparable diagnostic value while reducing patient burden. We propose a targeted screening approach that integrates fundamental clinical parameters, key screening questions, and selected validated questionnaires, enabling primary care and outpatient clinicians to more efficiently identify patients who may require referral for specialized sleep evaluation and treatment.
Keywords:
sleep
; polysomnography
; sleep disorders
; sleep questionnaires
1. Introduction
The global burden of sleep disorders is increasing, yet insufficient attention is given to sleep-related health issues. Given that sleep constitutes nearly one-third of our lives, disturbances in sleep quality and duration can have significant consequences on overall health. A recent review analysing data from over 180,000 patients during the COVID-19 pandemic reported a prevalence of poor sleep quality at an astonishing 47.12%, short sleep duration at 40.81%, long sleep duration at 31.61%, and insomnia symptoms at 21.15% [1]. Also, sleep disturbance is related to deteriorating cardiovascular health, increased risk of stroke, myocardial infarction, memory problems, dementia and other [2]. These findings highlight the critical need for enhanced efforts in the prevention, early identification, treatment, and rehabilitation of sleep disturbances to promote healthy aging and improve overall well-being.
Patients presenting with sleep-related complaints are typically classified into one or more common diagnostic categories, such as obstructive sleep apnoea (OSA), insomnia, narcolepsy, parasomnias, restless legs syndrome (RLS), periodic limb movement disorder (PLMD), and rapid-eye-movement (REM) sleep behaviour disorder (RBD). Pinpointing the exact diagnosis often requires additional objective evaluation, with polysomnography (PSG) serving as the gold standard for confirming sleep disorders. However, long waiting times for PSG appointments in many healthcare facilities pose challenges for timely diagnosis and treatment.
Before PSG, patients are usually instructed to maintain a sleep diary, document daily sleep complaints, and complete various validated questionnaires that help preliminarily identify potential conditions, such as OSA, parasomnias, or RBD. Although these questionnaires are not obligatory, they provide clinicians with valuable supplementary information for interpreting PSG results and refining the diagnostic process.
In our clinical practice, we employ a range of validated questionnaires, including the Epworth Sleepiness Scale (ESS), Insomnia Severity Index (ISI), Berlin Questionnaire (BQ), Ullanlina Narcolepsy Scale (UNS), Innsbruck REM Sleep Behaviour Disorder Inventory (RBD-I), REM Sleep Behaviour Disorder Single-Question Screen (RBDQ1), Paris Arousal Disorders Severity Scale (PADSS), and the Restless Legs Syndrome Rating Scale (RLSRS). While this comprehensive approach aims to capture the full spectrum of sleep disorders, patients frequently express concerns about the volume of questionnaires. Many reports feeling overwhelmed and perceive overlapping content among the tools, which can lead to reduced motivation and compliance.
This feedback raises critical considerations about the clinical utility and efficiency of these instruments. It calls for a reassessment of whether all the questionnaires are equally valuable in contributing to the diagnostic process or whether certain tools could be consolidated to enhance patient experience without compromising diagnostic accuracy. Additionally, it highlights the potential for developing a single, highly sensitive and specific questionnaire that could streamline the diagnostic workflow and potentially minimize the reliance on PSG for certain sleep disorders. Such efforts would improve both patient satisfaction and the efficiency of clinical workflows.
In this study, we retrospectively analysed data from over 500 patients who underwent clinical evaluation and polysomnography (PSG) at the Hospital of Lithuanian University of Health Sciences Kaunas Clinics, Neurology Department between 2018 and 2024. We present literature analysis and the distribution of various sleep disorders within our clinical setting, along with demographic characteristics and the most frequently observed comorbidities. Additionally, we evaluated the diagnostic accuracy of commonly used sleep questionnaires and assessed their relevance in the diagnostic process.
Obstructive Sleep Apnoea
OSA is a sleep breathing disorder characterized by recurrent episodes of complete (apnoea) or partial (hypopnea) upper airway collapse during sleep, which result in intermittent oxygen desaturation and/or arousals from sleep, leading to sleep fragmentation or non-restorative sleep [3]. Individuals with suspected OSA commonly present with symptoms such as excessive daytime sleepiness, loud snoring, and episodes of gasping, choking, or apnoea during sleep, which are frequently reported by a bed partner [4,5]. PSG is considered the gold standard for the diagnosis of OSA. It is typically diagnosed when the apnoea-hypopnea index (AHI) or respiratory disturbance index (RDI) is ≥15 events per hour or AHI/RDI ≥5 events/hour in the presence of one or more associated symptoms, such as excessive daytime sleepiness, fatigue, waking up with sensations of breath-holding or loud snoring. OSA is classified as mild (AHI/RDI ≥5 events/hour), moderate (AHI/RDI ≥15 events/hour), and severe (AHI/RDI ≥30 events/hour) [6,7]. Alternative screening tools, including the Berlin Questionnaire (BQ), the STOP-BANG Questionnaire, the STOP Questionnaire, and the Epworth Sleepiness Scale (ESS), have been widely used for the evaluation of OSA [7].
The first screening tool for OSA, which was included in our study, is Epworth Sleepiness Scale (ESS). The ESS is an eight-item questionnaire designed to assess daytime sleepiness in adults. It evaluates the propensity to fall asleep during routine activities, such as reading, watching television, or driving, by assigning a score of 0 to 3 for each activity. The total score ranges from 0 to 24, with higher values indicating greater levels of daytime sleepiness. While a score ≤10 is considered within the normal range, scores >10 suggest pathological sleepiness [8]. Among other questionnaires the ESS has the lowest sensitivity for detecting OSA, with sensitivity values of 54% for mild OSA, 47% for moderate OSA, and 58% for severe OSA and demonstrates relatively higher specificity, with values of 65% for mild OSA, 62% for moderate OSA, and 60% for severe OSA [7]. Despite its low sensitivity for detecting OSA, the ESS demonstrates acceptable test-retest reliability for evaluating treatment responses to stimulant therapy in clinical trial settings [9].
Another screening tool for OSA included in our study was the BQ. The BQ consists of questions grouped into three categories: category 1 – snoring, category 2 – daytime sleepiness, category 3 – hypertension and body mass index (BMI). Scoring is determined as follows: categories 1 and 2 are considered positive if frequent symptoms (>3–4 times per week) are reported, while category 3 is positive if there is a history of hypertension or a BMI >30 kg/m². A positive score in two or more categories indicates a high risk of OSA, with a sensitivity of 86% and a specificity of 77% [10]. When compared to other questionnaires the BQ demonstrates sensitivity rates of 76% for mild, 77% for moderate and 84% for severe OSA along with specificity rates of 59% for mild, 44% for moderate and 38% for severe OSA [7]. However, due to its low sensitivity and specificity, BQ is not typically used as a diagnostic tool for patients with OSA in sleep clinics [11].
Several alternative questionnaires, not included in our study, are also effective screening tools for OSA. Compared to other questionnaires, the STOP-BANG has the highest sensitivity rates – 88% for mild OSA, 90% for moderate OSA, and 93% for severe OSA - but also shows lower specificity rates of 42%, 36%, and 35% for mild, moderate, and severe OSA, respectively [7].
Insomnia
In our study we also analysed another prevalent sleep disorder – insomnia. According to International Classification of Sleep Disorders, Third Edition (ICSD-3) insomnia is defined as difficulty initiating or maintaining sleep or experiencing poor sleep quality, despite the adequate sleep opportunities for sleep, leading to daytime dysfunction. Insomnia can be classified as either short-term or chronic. Short-term insomnia lasts a few days or weeks, while chronic insomnia occurs at least three times per week and persists for at least three months. Diagnosis of insomnia is confirmed when all four criteria are met: difficulty initiating or maintaining sleep, sleep difficulties occurring despite adequate opportunities to sleep, daytime dysfunction, which may include fatigue, malaise, concentration or memory impairment or other related symptoms, sleep disorder is not caused by other medical conditions, medications or substance use [12,13].
Self-report questionnaires are commonly used to evaluate symptoms and severity of insomnia. In our study we included Insomnia Severity index (ISI) questionnaire, which consists of seven items evaluating sleep disturbances, including sleep onset, sleep maintenance and early morning awakening problems, sleep dissatisfaction, daytime dysfunction, the perceived noticeability of sleep problems by others and distress caused by insomnia. Each item is scored using a 5-point Likert scale, ranging from 0 (no problem) to 4 (severe problem) with a total score from 0 to 28. The scoring thresholds classify individuals as follows: 0-7 (no clinically significant insomnia), 8-14 (sub-threshold insomnia), 15-21 (moderate insomnia), 22-28 (severe insomnia). A total score ≥10 demonstrates a sensitivity of 86.1% and specificity of 87.7% for detecting insomnia in community samples [14].
Hypersomnia
Hypersomnia is a group of sleep disorders characterized by excessive daytime sleepiness (EDS) despite sufficient or even prolonged sleep duration, which greatly affects daily functioning. Main types of hypersomnia are narcolepsy (type I and II), idiopathic hypersomnia, Klein-Levin syndrome, insufficient sleep syndrome and secondary hypersomnia due to medical or psychiatric conditions (e.g. Parkinson’s disease, depression, multiple sclerosis, traumatic brain injury) or due to medication and substance use (e.g. alcohol, drugs). The main disorder in this group is narcolepsy. It is a sleep disorder, which is characterized by clinical features, such as cataplexy, excessive daytime sleepiness, hypnagogic or hypnopompic hallucinations, sleep paralysis and disrupted nighttime sleep. According to ICSD-S-TR criteria, narcolepsy diagnosis is confirmed when the person experiences cataplexy and either has sleep latency of ≤ 8 minutes and two or more sleep-onset REM periods (SOREMPs) on a Multiple Sleep Latency Test (MSLT) [15] or there is a SOREMP (within 15 minutes of sleep onset) detected on nocturnal polysomnogram. Narcolepsy type I is also diagnosed when hypocretin is deficient (≤110 pg/mL) [15]. However, various screening questionnaires are also useful for identifying narcolepsy symptoms [16,17,18]. ESS, which evaluates excessive daytime sleepiness, is not only used for OSA screening, but is also highly relevant in narcolepsy evaluation. For patients with narcolepsy, ESS scores are typically greater than 15 [17,18]. The Ullanlinna Narcolepsy Scale (UNS), included in our study, is a validated questionnaire used for assessing symptoms associated with narcolepsy. It consists of 11 items that evaluate two main narcolepsy clinical symptoms - cataplexy and abnormal sleep patterns. The total score ranges between 0 to 44, with a mean score of 27.3 observed in patients with narcolepsy [16]. A score below 9 strongly suggests against the diagnosis [19]. The UNS demonstrates excellent diagnostic performance, with a sensitivity of 100% and a specificity of 98.8% [16]. However, another study found that sensitivity and specificity for UNS for differentiating narcolepsy type 1 from other disorders were 83.5% and 84.1% respectively [19]. An alternative tool for the screening of narcolepsy is Swiss narcolepsy scale (SNS) with the reported sensitivity of 89% and specificity of 88% [20].
Parasomnias
Parasomnias are sleep disorders involving abnormal, disruptive motor, verbal, or behavioural activities during sleep or transitions between wakefulness and sleep [21]. This group of disorders is categorized as non-REM (NREM), REM-related and other parasomnias. NREM parasomnias include confusional arousals, sleepwalking, sleep terrors, sexsomnia, and sleep-related eating disorders. These conditions are linked to the N3 slow-wave stage of NREM sleep [22].
[23] Effective diagnostic tools are crucial for distinguishing parasomnias from other conditions and providing proper treatment [24]. Diagnosis primarily relies on clinical history, including sleep patterns, medication use, and input from bed partners or parents [25,26]. Video-PSG is a key diagnostic tool for NREM parasomnias and differential diagnostics for other causes of nocturnal paroxysms.
The Paris Arousal Disorders Severity Scale (PADSS) is a validated questionnaire for assessing parasomnia symptoms. It is self-administered in less than five minutes and has three sections: behaviours (PADSS-A), episode frequency (PADSS-B), and disorder impact (PADSS-C). Behaviours are scored 0 to 2, episode frequency from "never" to "more than two per night," and consequences from "never" to "often." Total scores range from 0 to 50. Options like "less than one episode per year" ensure normal controls can report infrequent symptoms like night screams. PADSS shows strong diagnostic accuracy with a sensitivity of 83.6% and specificity of 87.8% [27]. However, the PADSS was specifically designed for assessing sleepwalking and sleep terrors. A Dutch study has suggested further research to evaluate the questionnaire’s applicability across different countries and its ability to detect other NREM parasomnias [28].
The Arousal Disorders Questionnaire (ADQ) is an alternative to PADSS for diagnosing confusional arousals, such as sleepwalking, and sleep terrors. It has demonstrated sensitivity of 83% and specificity of 93%. The ADQ is useful in clinical settings, particularly sleep and epilepsy centres, as it reduces reliance on resource-intensive procedures like PSG. This makes it a practical tool for early detection and management of parasomnias [29].
REM Sleep Behaviour Disorder (RBD)
RBD is a REM sleep parasomnia, characterized by the loss of muscle atonia and the physical enactment of vivid, often aggressive dreams during the REM phase of sleep [30,31]
Early diagnosis of RBD is critical for preventing injury caused by dream enactment behaviours and for identifying the early stages of neurodegenerative conditions, particularly synucleinopathies, including Parkinson’s disease, multiple system atrophy, and dementia with Lewy bodies [31,32,33]. The diagnostic process for RBD should adhere to the criteria outlined in the International Classification of Sleep Disorders, 3rd Edition (ICSD-3-TR). Initial steps include a comprehensive clinical evaluation and the identification of a positive history of RBD symptoms [34]. Subsequently, PSG is mandatory to confirm REM sleep atonia (RWA) and to document detailed motor behaviours and vocalizations during REM sleep. Before an RBD diagnosis is established, other possible causes, including alternative sleep disorders, mental health conditions, medication effects, or substance use, must be excluded [33].
The RBD Single-Question Screen (RBD1Q) is an effective tool for rapid initial screening in primary care settings. It uses a single “yes” or “no” response to assess the presence of symptoms suggestive of RBD. According to a Canadian study, RBD1Q demonstrated robust performance, with a sensitivity of 93.8% and a specificity of 87.2%, aiding in the identification of patients requiring further evaluation [35].
For more comprehensive screening following the initial step, the Innsbruck REM Sleep Behaviour Disorder Inventory (RBD-I) is a reliable tool. This questionnaire includes seven REM-specific and two non-REM control items, providing a detailed evaluation of RBD-related symptoms such as dream enactment, vocalizations, and motor activity. Results yield a numerical score that reflects the likelihood of RBD, with a cutoff score of 0.25, calculated as the ratio of positive symptoms to the total number of questions answered. The RBD-I demonstrated diagnostic accuracy, with a sensitivity of 91.4% and a specificity of 85.7% [36].
The RBD Screening Questionnaire (RBDSQ) is another validated alternative for identifying probable cases of RBD. It consists of 10 items evaluating symptoms such as dream enactment behavior, specific dream content, complex motor activity during sleep, dream recall, sleep disturbances, and coexisting neurological conditions. Scores range from 0 to 13, with a cutoff value of 5 or higher, indicating a positive result [37]. The RBDSQ has been validated in multiple languages and settings. For example, the Italian version of RBDSQ demonstrated a sensitivity of 84.2% [38]. Additionally, its specificity was reported to be 78%, affirming its reliability in detecting RBD [39].
2. Methods
Approval to conduct this study was obtained from the Kaunas Regional Biomedical Research Ethics Committee on January 30, 2025 (Approval No. BE-2-7). We retrospectively analysed data from 562 adult patients who underwent routine video-polysomnography (PSG) at the Neurology Department, Hospital of Lithuanian University of Health Sciences Kaunas Clinics, between 2018 and 2024. All patients were referred for PSG due to subjective sleep disturbances identified during routine neurological consultations in the outpatient department. The inclusion process of patient cases is illustrated in the STROBE diagram (Figure 1). For each patient, we assessed paper-based records detailing sleep quality, comorbidities, regularly used medications, and responses to validated sleep questionnaires. Additionally, we analysed video-PSG results to establish PSG-confirmed diagnoses. To ensure diagnostic accuracy, the final sleep diagnosis was verified by cross-referencing PSG findings with the patients’ clinical records.
Statistical analysis was performed using IBM SPSS 29.0 program. Data in the tables is presented using absolute and percentage values, also mean ± standard deviation (SD). For non-normally distributed data non-parametric Mann-Whitney U test was used. For the comparison of categorical data, the Chi-Square (χ2) Test was used. To test diagnostic accuracy of different screening tools Receiver Operatic Characteristics (ROC) curve was used. Data from ROC curve analysis is expressed using Area Under the Curve (AUC), 95% confidence intervals (95% CI), sensitivity and specificity values at an optimal cutoff value. Statistically significant values were considered when p<0.05.
3. Results
Out of 562 patients included in the final analysis, 362 (64.4%) were diagnosed with obstructive sleep apnoea (OSA), 80 (14.2%) with insomnia, 32 (5.7%) with hypersomnia, 40 (7.1%) with parasomnia, and 16 (2.8%) with REM sleep behaviour disorder (RBD). 74 patients (12.6%) received more than 1 sleep disorder diagnosis. Demographic characteristics are presented in Table 1. Significant gender differences were observed in the distribution of OSA and hypersomnia, with males more frequently diagnosed with OSA (p=0.015) and females more commonly affected by hypersomnia (p<0.001). Age-related variations were also noted, as patients with OSA (p<0.001), insomnia (p=0.006), and RBD (p=0.003) were significantly older, whereas those with hypersomnia (p=0.004) and parasomnia (p<0.001) were significantly younger. Body mass index (BMI) was significantly higher in patients with OSA (p<0.001) but showed no substantial differences among other sleep disorder groups. Additionally, OSA patients exhibited the highest burden of comorbidities, including primary arterial hypertension (PAH), atrial fibrillation (AF), diabetes, and dyslipidaemia, compared to other sleep disorders.
3.1. Obstructive Sleep Apnea (OSA)
The diagnosis of obstructive sleep apnoea (OSA) was based on polysomnography (PSG) recordings, using the apnoea-hypopnea index (AHI) as the defining criterion. Among 562 patients evaluated over seven years in our sleep centre, 362 (64.4%) were diagnosed with OSA (AHI > 5/h). Within this group, mild OSA (AHI 5–15/h) was identified in 162 (44.8%) patients, moderate OSA (AHI 15–30/h) in 90 (24.9%), and severe OSA (AHI >30/h) in 100 (27.6%) patients. The Berlin Questionnaire (BQ) was used for OSA screening, with 560 completed evaluations. Among the BQ categories, 341 (60.7%) patients reported habitual snoring (≥3–4 nights per week) or loud snoring disturbing their sleep partner or witnessed apnoea’s (positive category 1). Excessive daytime sleepiness or fatigue (positive category 2) was reported by 252 (44.8%) patients, with some experiencing episodes of falling asleep while driving. Category 3, which assesses body mass index (BMI) and arterial hypertension, was positive in 295 (52.5%) patients. A high risk of OSA (≥2 positive BQ categories) was identified in 304 (54.1%) patients, while 256 (45.6%) were classified as low risk. The overall diagnostic performance of the BQ in detecting any stage of OSA in our cohort was moderate, with a sensitivity of 67.6% and specificity of 68.8% (AUC = 0.682, 95% CI 0.636–0.729, p<0.001) based on ROC curve analysis. Notably, category 1 and category 3 individually demonstrated improved diagnostic performance: category 1 showed a sensitivity of 75.1% and specificity of 63.8% (AUC = 0.694, 95% CI 0.648–0.741, p<0.001), while category 3 had a sensitivity of 68.6% and specificity of 74.9% (AUC = 0.718, 95% CI 0.673–0.762, p<0.001). Table 2 and Figure 2 summarize the overall performance of the BQ and its individual components in diagnosing mild, moderate, and severe OSA (only statistically significant results are presented).
3.2. Insomnia
In our cohort, 80 patients (14.2%) were diagnosed with insomnia. The ISI score for insomnia patients was significantly higher (17.84 ± 4.94 vs 12.24 ± 5.98, p<0.001). ROC curve analysis of ISI for insomnia diagnosis demonstrated moderate sensitivity (77.2%) and specificity (63.3%) at an optimal cutoff of 14.5 points (AUC = 0.762, 95% CI 0.710–0.814, p<0.001) (Figure 3A).
3.3. Parasomnia
Among 562 cases, 40 patients (7.1%) were diagnosed with parasomnia, excluding cases of REM sleep behaviour disorder (RBD), which were analysed separately. For screening, we routinely employed the Paris Arousal Disorder Severity Scale (PADSS) to assess parasomnia risk. The PADSS score for parasomnia patients was significantly higher (13.35 ± 6.82 vs 5.7 ± 4.88, p<0.001). ROC curve analysis of PADSS for parasomnia diagnosis demonstrated moderate sensitivity (57.5%) but high specificity (90.5%) at an optimal cutoff of 12.5 points (AUC = 0.822, 95% CI 0.753–0.801, p<0.001) (Figure 3B).
3.4. Hypersomnia
Hypersomnia was diagnosed based on PSG recordings, with the Multiple Sleep Latency Test (MSLT) performed when indicated. A total of 32 patients (5.7%) were diagnosed with idiopathic hypersomnia. The UNS score for hypersomnia patients was significantly higher (11.5 ± 7.07 vs 5.71 ± 4.02, p<0.001). ROC curve analysis of UNS for hypersomnia screening yielded moderate sensitivity (84.4%) and specificity (58.0%) at a cutoff of 5.5 points (AUC = 0.784, 95% CI 0.711–0.858, p<0.001) (Figure 3C).
3.5. REM Sleep Behaviour Disorder (RBD)
Among 562 participants, 16 (2.8%) were diagnosed with RBD. The RBD-I-9 score for RBD patients was significantly higher (0.38 ± 0.21 vs 0.2 ± 0.19, p<0.001). As shown in Figure 4, the sensitivity and specificity of RBD1Q were 73.3% and 81.0%, respectively (AUC = 0.772, 95% CI 0.641–0.903, p<0.001). The RBD-I-9 scale showed higher sensitivity (93.3%) but lower specificity (52.5%) at a cutoff value of 0.17 (AUC = 0.758, 95% CI 0.665–0.851, p=0.001). These findings indicate that RBD-I-9 is more effective in identifying RBD cases in clinical settings, while a negative RBDQ1 result is more reliable in ruling out the disorder. Additionally, we analysed individual items of the RBD-I-9 scale to determine their screening utility. Interestingly, questions 1 (sensitivity 75.0%, specificity 58.1%) and 2 (sensitivity 75.0%, specificity 84.2%) demonstrated the highest diagnostic value (Table 3). These questions assess whether the patient experiences dreams involving aggressive situations requiring self-defence and whether they scream, talk, or curse during sleep.
3.6. Epworth Sleepiness Scale (ESS)
Figure 5 represents diagnostic accuracy of ESS to detect different sleep disorders. ESS showed statistically significant power only in detecting severe OSA (AUC 0.603, 95% CI 0.541-0.665, p=0,001; sensitivity 73.2% and specificity of 44.1% at the cut-off value of 5.5 points) and hypersomnia (AUC 0.823, 95% CI 0.754-0.892, p<0.001; sensitivity 87.1% and specificity 76.8% at the cut-off value of 10.5 points).
4. Discussion
In our clinical practice, we offer patients the opportunity to undergo video-polysomnography (video-PSG) testing, providing an evidence-based diagnosis along with tailored recommendations for further management. However, much can be done in the outpatient setting, particularly in primary care clinics, to facilitate the early detection and prevention of sleep disorders. While sleep questionnaires are valuable screening tools, they can be extensive and time-consuming, creating barriers to implementation in busy clinical settings.
Our study demonstrates that the widely used Epworth Sleepiness Scale (ESS) is only moderately effective in detecting severe obstructive sleep apnea (OSA) (sensitivity 73.2%, specificity 44.1%) but performs better in detecting hypersomnia (sensitivity 87.1%, specificity 76.8%). These findings differ somewhat from previous studies, which reported sensitivity values of 54% for mild OSA, 47% for moderate OSA, and 58% for severe OSA using ESS [5]. This discrepancy may reflect differences in our patient population or in the administration and interpretation of the questionnaire in our clinical context.
The Berlin Questionnaire (BQ) also showed moderate overall performance (sensitivity 67.8%, specificity 68.8%), which is lower than the originally reported sensitivity of 86% and specificity of 77% [8]. Interestingly, we found that positive category 3, which considers body mass index (BMI) and blood pressure, emerged as a simpler and potentially more effective screening tool for OSA risk (sensitivity 68.6%, specificity 74.9%). This finding suggests that basic clinical parameters easily obtainable in primary care settings may offer comparable screening utility to more complex questionnaires for certain sleep disorders.
When comparing our findings with previous literature, we observed that our screening tools generally performed slightly worse in our population. For insomnia, the ISI showed sensitivity of 77.2% and specificity of 63.3%, compared to the reported values of 86.1% and 87.7% in community samples [15]. For parasomnia, PADSS demonstrated lower sensitivity (57.5%) but higher specificity (90.5%) compared to the originally reported sensitivity of 83.6% and specificity of 87.8% [32]. For hypersomnia, UNS showed sensitivity of 84.4% and specificity of 58.0%, which differs from the excellent diagnostic performance originally reported (sensitivity 100%, specificity 98.8%) [18]. These discrepancies highlight the importance of validating screening tools in diverse clinical settings and populations. Factors such as cultural and linguistic differences, comorbidity patterns, referral biases, and variation in questionnaire administration may all contribute to the observed differences. Additionally, the retrospective nature of our study and the specialized sleep centre setting may have influenced the patient composition and questionnaire responses. Regarding REM sleep behaviour disorder (RBD), we found that RBD1Q (sensitivity 73.3%, specificity 81.0%) was somewhat superior to RBD-I-9 (sensitivity 93.3%, specificity 52.5%) in our population. These values differ from previously reported figures for RBD1Q (sensitivity 93.8%, specificity 87.2%) [40] and RBD-I-9 (sensitivity 91.4%, specificity 85.7%) [41]. Interestingly, our analysis revealed that question 2 of RBD-I-9, which assesses dreams involving aggression and vocalizations during sleep, demonstrated improved prognostic performance (sensitivity 75.0%, specificity 84.2%). This finding suggests that selected individual questions from comprehensive questionnaires might offer comparable diagnostic utility with reduced patient burden.
Based on our findings and their comparison with existing literature, we propose an efficient screening approach for sleep complaints in outpatient settings. This approach should include:
1. Basic clinical assessment. Measurement of BMI and blood pressure, upper airway and mandibular anatomical features, along with a focused history of snoring and apnoeic episodes, particularly for OSA screening.
2. Targeted screening questions: For parasomnias, inquire about unusual nocturnal behaviours; for RBD, use the single-question RBD1Q ("Do you act out your dreams?") or RBD-I-9 question 2 ("Do you scream, talk, or curse during sleep?").
3. Selected validated questionnaires: Apply the ESS for evaluating excessive daytime sleepiness, particularly when hypersomnia is suspected; use the ISI for insomnia symptoms; and employ the PADSS when parasomnia is suspected based on the initial screening questions.
This streamlined approach would cover the majority of common sleep disorders, including OSA, insomnia, parasomnias, hypersomnia, and RBD, while minimizing the questionnaire burden on patients and clinicians. The approach could be further refined by developing digital tools or decision support systems that guide clinicians through this targeted screening process based on presenting symptoms.
Several limitations should be acknowledged in interpreting our findings. First, our study population consisted of patients referred to a specialized sleep centre, which may represent more severe or complex cases compared to the general population or primary care settings. Second, we did not specifically assess questionnaire performance for restless leg syndrome (RLS) and periodic limb movement disorder (PLMD), which are important components of the sleep disorder spectrum. Third, cultural and linguistic factors may have influenced questionnaire responses, as most of these tools were originally developed in different settings. Fourth, the retrospective design limited our ability to standardize questionnaire administration and interpretation across all patients. Finally, we did not evaluate the economic implications or patient acceptability of different screening approaches.
Future research should focus on prospectively validating our proposed streamlined screening approach in diverse clinical settings, particularly in primary care where early detection is most valuable. Additionally, the development and validation of culturally appropriate, brief screening tools that can simultaneously assess multiple sleep disorders would be beneficial. Studies examining the integration of subjective questionnaires with objective measures, such as home sleep testing or wearable technology, could further enhance diagnostic accuracy while maintaining accessibility. Lastly, evaluating the long-term outcomes and cost-effectiveness of early detection through optimized screening protocols would provide valuable information for healthcare policy and resource allocation.
In conclusion, while our findings confirm that validated sleep questionnaires have utility in screening for various sleep disorders, their performance in our clinical setting differed somewhat from previously reported values. Our results support a more focused and strategic approach to sleep disorder screening, which could improve early detection while optimizing resource utilization. By implementing a targeted screening protocol that combines basic clinical parameters, key screening questions, and selected validated questionnaires, clinicians in primary care and other outpatient settings could more effectively identify patients who would benefit from referral for specialized sleep evaluation and treatment.
5. Conclusions
While our findings confirm that validated sleep questionnaires have utility in screening for various sleep disorders, their performance in our clinical setting differed somewhat from previously reported values. Our results support a more focused and strategic approach to sleep disorder screening, which could improve early detection while optimizing resource utilization. By implementing a targeted screening protocol that combines basic clinical parameters, key screening questions, and selected validated questionnaires, clinicians in primary care and other outpatient settings could more effectively identify patients who would benefit from referral for specialized sleep evaluation and treatment.
Author Contributions
Conceptualization, T.V., K.P., E.P.; Methodology, T.V., E.P.; Software, T.V.; Validation, E.P.; Formal analysis, T.V.; Investigation, T.V.; Resources, K.P., E.P.; Data curation, T.V., D.L., J.T., E.P.; Writing—original draft preparation, T.V., D.L., J.T.; Writing—review & editing, K.P., E.P.; Visualization, T.V.; Supervision, E.P.; Project administration, K.P., E.P. All authors have read and agreed to the published version of the manuscript.
Funding
This research received no external funding.
Institutional Review Board Statement
The study was conducted in accordance with the Declaration of Helsinki and approved by the Kaunas Regional Biomedical Research Ethics Committee on January 30, 2025 (Approval No. BE-2-7).
Informed Consent Statement
Informed consent was not obtained directly from the participants. However, all patients evaluated and treated for sleep disorders at the Hospital of the Lithuanian University of Health Sciences Kaunas Clinics signed a standard hospital admission agreement, which includes provisions regarding the use of their data for scientific purposes. Only patients who provided consent for data usage through this agreement were included in this retrospective study. This methodology was also reviewed and approved by Kaunas Regional Biomedical Research Ethics Committee.
Data Availability Statement
All data is available on reasonable request to the corresponding author.
Conflicts of Interest
The authors declare no conflicts of interest.
References
- Du M, Liu M, Wang Y, Qin C, Liu J. Global burden of sleep disturbances among older adults and the disparities by geographical regions and pandemic periods. SSM Popul Health 2023 December 23;25:101588.
- Ramos AR, Wheaton A-WA, Johnson DA. Sleep Deprivation, Sleep Disorders, and Chronic Disease. Prev Chronic Dis 2023 August 31;20:E77.
- Sankri-Tarbichi, A.G. Obstructive sleep apnea-hypopnea syndrome: Etiology and diagnosis. Avicenna J Med 2012 January 01;2(1):3–8.
- Mehrtash M, Bakker JP, Ayas N. Predictors of Continuous Positive Airway Pressure Adherence in Patients with Obstructive Sleep Apnea. Lung 2019 April 01;197(2):115–121.
- Carneiro-Barrera A, Diaz-Roman A, Guillen-Riquelme A, Buela-Casal G. Weight loss and lifestyle interventions for obstructive sleep apnoea in adults: Systematic review and meta-analysis. Obes Rev 2019 May 01;20(5):750–762.
- Kapur VK, Auckley DH, Chowdhuri S, Kuhlmann DC, Mehra R, Ramar K, et al. Clinical Practice Guideline for Diagnostic Testing for Adult Obstructive Sleep Apnea: An American Academy of Sleep Medicine Clinical Practice Guideline. J Clin Sleep Med 2017 March 15;13(3):479–504.
- Chiu H, Chen P, Chuang L, Chen N, Tu Y, Hsieh Y, et al. Diagnostic accuracy of the Berlin questionnaire, STOP-BANG, STOP, and Epworth sleepiness scale in detecting obstructive sleep apnea: A bivariate meta-analysis. Sleep Med Rev 2017 December 01;36:57–70.
- Goncalves MT, Malafaia S, Moutinho Dos Santos J, Roth T, Marques DR. Epworth sleepiness scale: A meta-analytic study on the internal consistency. Sleep Med 2023 September 01;109:261–269.
- Rosenberg R, Babson K, Menno D, Morris S, Baladi M, Hyman D, et al. Test-retest reliability of the Epworth Sleepiness Scale in clinical trial settings. J Sleep Res 2022 April 01;31(2):e13476.
- Thurtell MJ, Bruce BB, Rye DB, Newman NJ, Biousse V. The Berlin questionnaire screens for obstructive sleep apnea in idiopathic intracranial hypertension. J Neuroophthalmol 2011 December 01;31(4):316–319.
- Ahmadi N, Chung SA, Gibbs A, Shapiro CM. The Berlin questionnaire for sleep apnea in a sleep clinic population: relationship to polysomnographic measurement of respiratory disturbance. Sleep Breath 2008 March 01;12(1):39–45.
- Kaur H, Spurling BC, Bollu PC. Chronic Insomnia. StatPearls Treasure Island (FL): StatPearls Publishing LLC; 2025.
- Sateia MJ. International classification of sleep disorders-third edition: highlights and modifications. Chest 2014 November 01;146(5):1387–1394.
- Morin CM, Belleville G, Belanger L, Ivers H. The Insomnia Severity Index: psychometric indicators to detect insomnia cases and evaluate treatment response. Sleep 2011 May 01;34(5):601–608.
- Slowik JM, Collen JF, Yow AG. Narcolepsy. StatPearls Treasure Island (FL): StatPearls Publishing LLC; 2025.
- Hublin C, Kaprio J, Partinen M, Koskenvuo M, Heikkila K. The Ullanlinna Narcolepsy Scale: validation of a measure of symptoms in the narcoleptic syndrome. J Sleep Res 1994 March 01;3(1):52–59.
- Weaver TE, Mathias SD, Crosby RD, Bron M, Bujanover S, Menno D, et al. Relationship between sleep efficacy endpoints and measures of functional status and health-related quality of life in participants with narcolepsy or obstructive sleep apnea treated for excessive daytime sleepiness. J Sleep Res 2021 June 01;30(3):e13210.
- Kuts A, Poluektov M, Zakharov A, Govzman V, Ponomareva I, Yakupov E, et al. Clinical and neurophysiological characteristics of 89 patients with narcolepsy and cataplexy from the Russian Narcolepsy Network. J Clin Sleep Med 2023 February 01;19(2):355–359.
- Sarkanen T, Alakuijala A, Partinen M. Ullanlinna Narcolepsy Scale in diagnosis of narcolepsy. Sleep 2019 March 01;42(3):zsy238. [CrossRef]
- Christian Sturzenegger,, Christian R Baumann, Scilit, Preprints.org, Google Scholar, et al. Swiss Narcolepsy Scale: A Simple Screening Tool for Hypocretin-Deficient Narcolepsy with Cataplexy. clinical and translational neuroscience 2018 Aug 27;2(2).
- Singh S, Kaur H, Singh S, Khawaja I. Parasomnias: A Comprehensive Review. Cureus 2018 December 31;10(12):e3807.
- Irfan M, Schenck CH, Howell MJ. NonREM Disorders of Arousal and Related Parasomnias: an Updated Review. Neurotherapeutics 2021 January 01;18(1):124–139.
- Fariba KA, Tadi P. Parasomnias. StatPearls Treasure Island (FL): StatPearls Publishing LLC; 2025.
- Loddo, G., Lopez, R., Cilea, R. , et al. Disorders of Arousal in adults: new diagnostic tools for clinical practice. Sleep Science Practice 2019 Oct 2;3(5).
- Hrozanova M, Morrison I, Riha RL. Adult NREM Parasomnias: An Update. Clocks Sleep 2018 November 23;1(1):87–104.
- Lopez R, Dauvilliers Y. Challenges in diagnosing NREM parasomnias: Implications for future diagnostic classifications. Sleep Med Rev 2024 February 01;73:101888.
- Arnulf I, Zhang B, Uguccioni G, Flamand M, Noel de Fontreaux A, Leu-Semenescu S, et al. A scale for assessing the severity of arousal disorders. Sleep 2014 January 01;37(1):127–136.
- van Mierlo P, Hermans LWA, Arnulf I, Pijpers A, Overeem S, van Gilst MM. Validation of the Dutch translation of the Paris Arousal Disorders Severity Scale for non-REM parasomnias in a 1-year and 1-month version. J Clin Sleep Med 2022 April 01;18(4):1135–1143.
- Loddo G, La Fauci G, Vignatelli L, Zenesini C, Cilea R, Mignani F, et al. The Arousal Disorders Questionnaire: a new and effective screening tool for confusional arousals, Sleepwalking and Sleep Terrors in epilepsy and sleep disorders units. Sleep Med 2021 April 01;80:279–285.
- Dauvilliers Y, Schenck CH, Postuma RB, Iranzo A, Luppi P, Plazzi G, et al. REM sleep behaviour disorder. Nat Rev Dis Primers 2018 August 30;4(1):19–5.
- Lee W, Baek S, Im H, Lee S, Yoon J, Thomas RJ, et al. REM Sleep Behavior Disorder and Its Possible Prodromes in General Population: Prevalence, Polysomnography Findings, and Associated Factors. Neurology 2023 December 04;101(23):e2364–e2375.
- Postuma RB, Iranzo A, Hu M, Hogl B, Boeve BF, Manni R, et al. Risk and predictors of dementia and parkinsonism in idiopathic REM sleep behaviour disorder: a multicentre study. Brain 2019 March 01;142(3):744–759.
- Sobreira-Neto MA, Stelzer FG, Gitai LLG, Alves RC, Eckeli AL, Schenck CH. REM sleep behavior disorder: update on diagnosis and management. Arq Neuropsiquiatr 2023 December 01;81(12):1179–1194.
- St Louis EK, Boeve BF. REM Sleep Behavior Disorder: Diagnosis, Clinical Implications, and Future Directions. Mayo Clin Proc 2017 November 01;92(11):1723–1736.
- Postuma RB, Arnulf I, Hogl B, Iranzo A, Miyamoto T, Dauvilliers Y, et al. A single-question screen for rapid eye movement sleep behavior disorder: a multicenter validation study. Mov Disord 2012 June 01;27(7):913–916.
- Frauscher B, Ehrmann L, Zamarian L, Auer F, Mitterling T, Gabelia D, et al. Validation of the Innsbruck REM sleep behavior disorder inventory. Mov Disord 2012 November 01;27(13):1673–1678.
- Pena-Pereira MA, Sobreira-Neto MA, Sobreira E, Chagas MHN, Oliveira DSd, Rodrigues GR, et al. Validation of the Brazilian Portuguese version of the Rapid Eye Movement Sleep Behavior Disorder Screening Questionnaire (RBDSQ-BR). Arq Neuropsiquiatr 2020 October 01;78(10):629–637.
- Stiasny-Kolster K, Mayer G, Schafer S, Moller JC, Heinzel-Gutenbrunner M, Oertel WH. The REM sleep behavior disorder screening questionnaire--a new diagnostic instrument. Mov Disord 2007 December 01;22(16):2386–2393.
- Marelli S, Rancoita PMV, Giarrusso F, Galbiati A, Zucconi M, Oldani A, et al. National validation and proposed revision of REM sleep behavior disorder screening questionnaire (RBDSQ). J Neurol 2016 December 01;263(12):2470–2475.
Figure 1.
STROBE diagram.
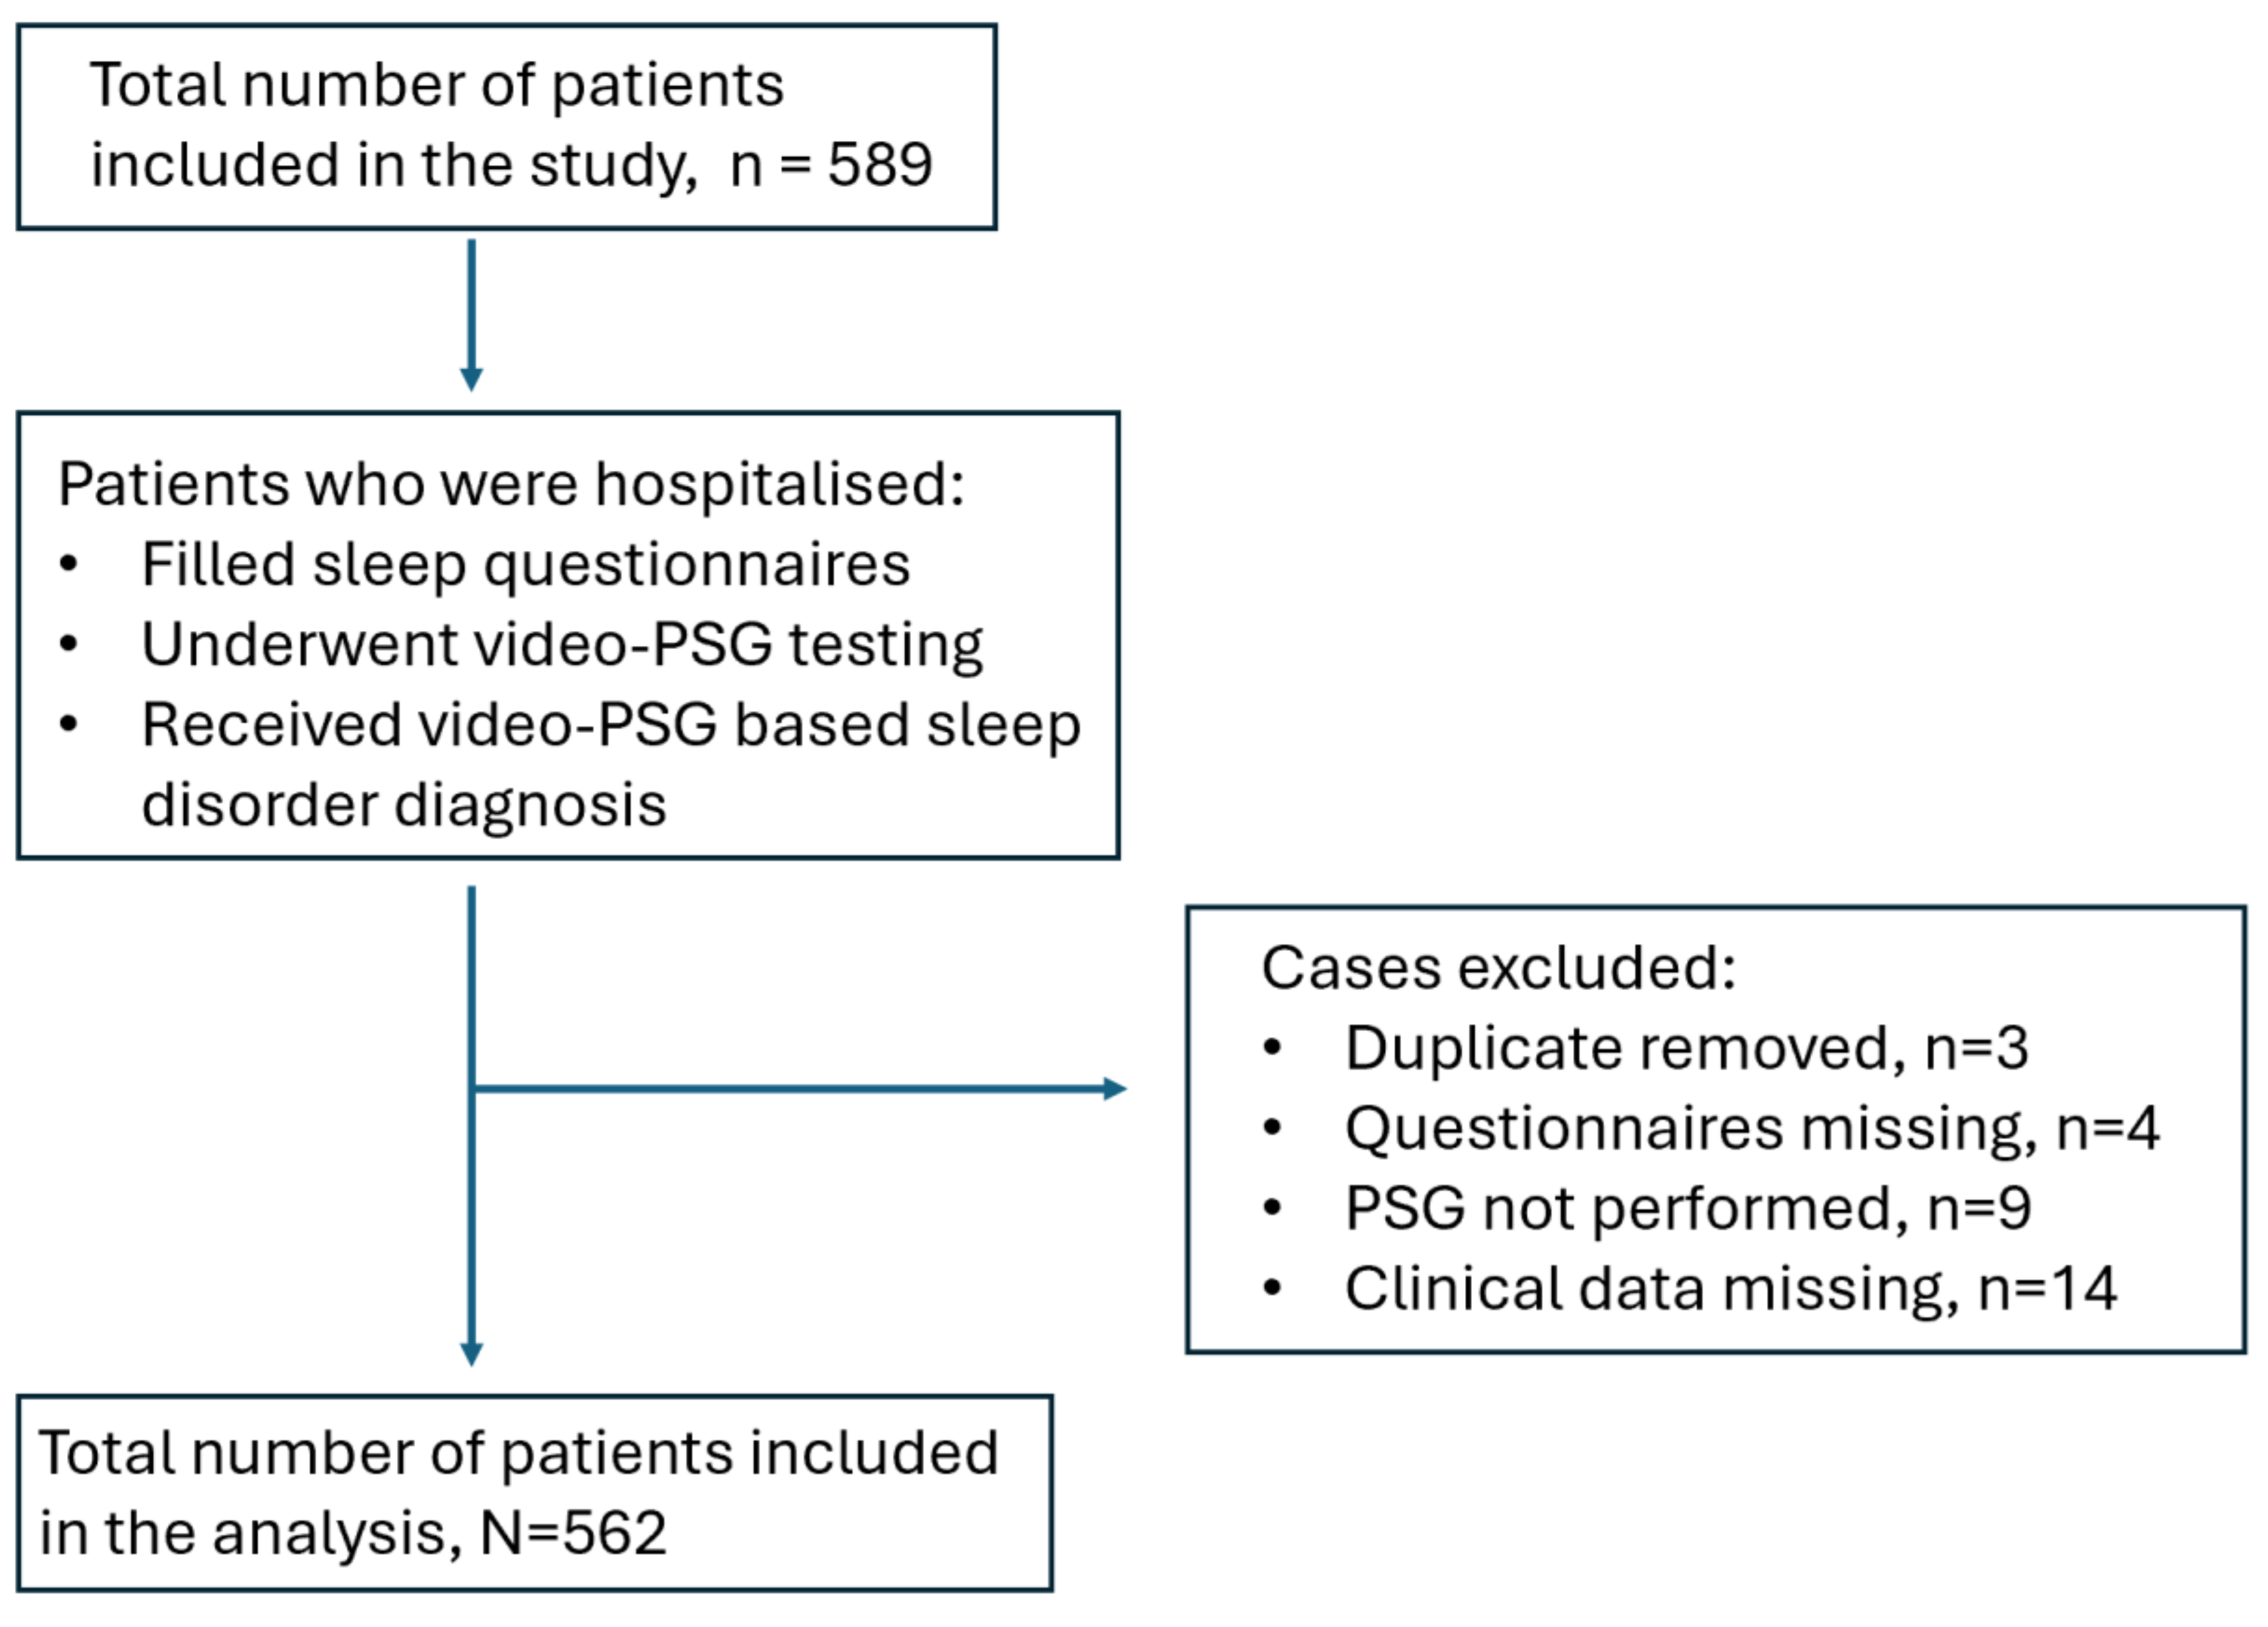
Figure 2.
ROC curve analysis of Berlin Questionnaire for diagnosing obstructive sleep apnoea. A – overall performance of BQ diagnosing any OSA. B – BQ for diagnosing mild OSA. C - BQ for diagnosing intermediate OSA. D - BQ for diagnosing severe OSA.
Figure 2.
ROC curve analysis of Berlin Questionnaire for diagnosing obstructive sleep apnoea. A – overall performance of BQ diagnosing any OSA. B – BQ for diagnosing mild OSA. C - BQ for diagnosing intermediate OSA. D - BQ for diagnosing severe OSA.
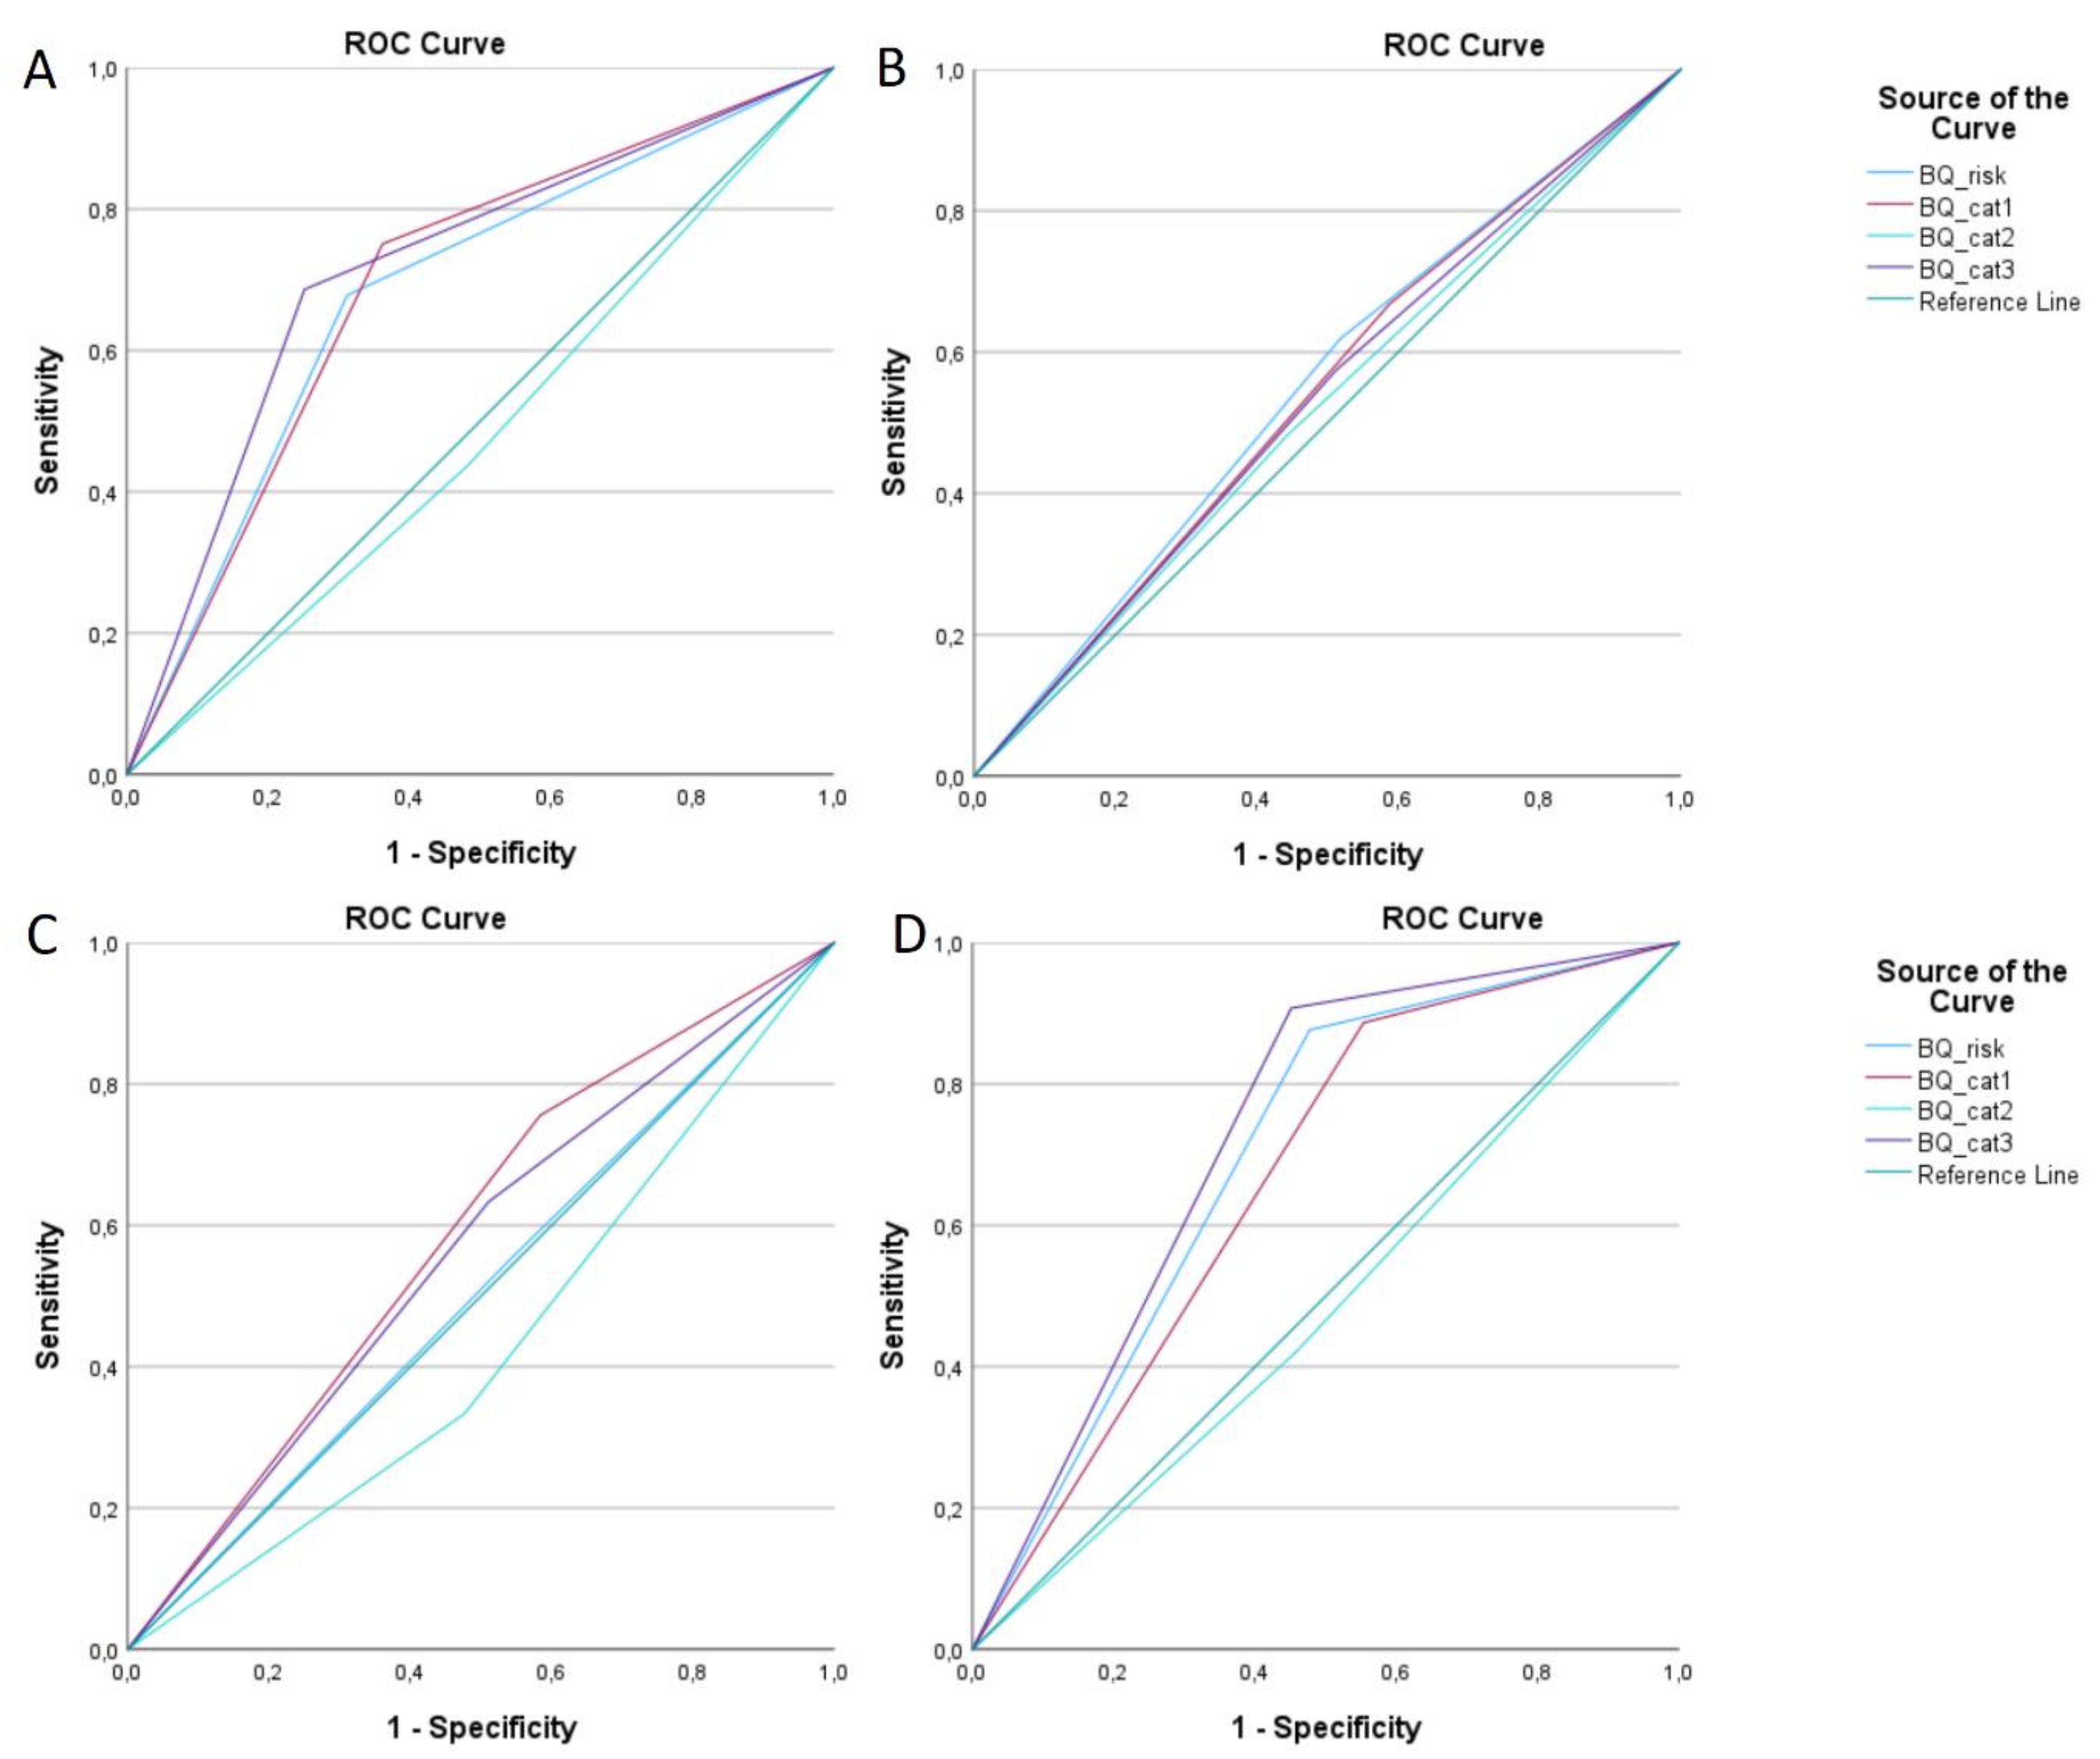
Figure 3.
ROC curve analysis: A) ISS for diagnosing insomnia; B) PADSS for diagnosing parasomnia; C – UNS for diagnosing hypersomnia.
Figure 3.
ROC curve analysis: A) ISS for diagnosing insomnia; B) PADSS for diagnosing parasomnia; C – UNS for diagnosing hypersomnia.
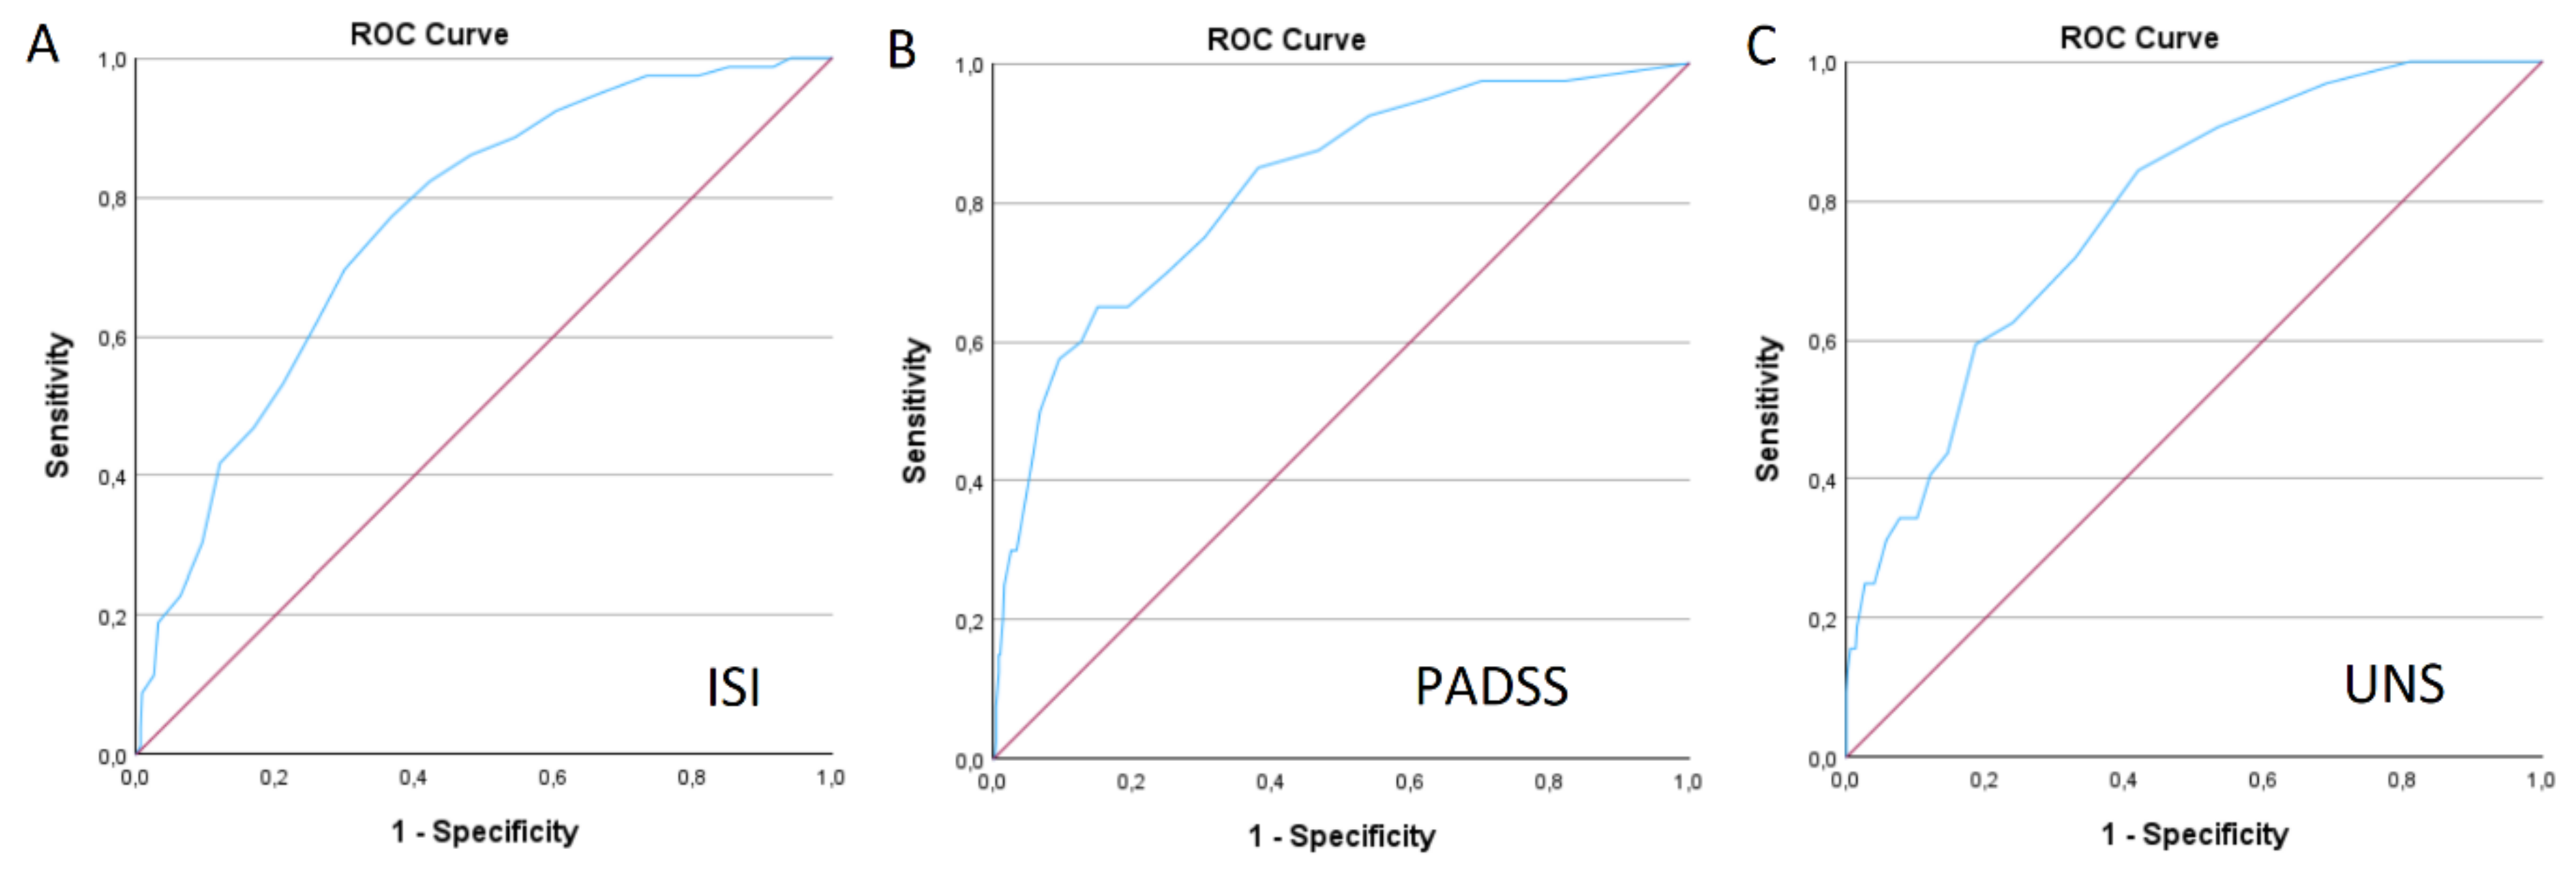
Figure 4.
ROC curve analysis of RBD-I-9 and RBDQ1 for diagnosing REM sleep behaviour disorder. A – comparison of both questionnaires. B – comparison of each RBD-I-9 questions for diagnosing purposes of RBD.
Figure 4.
ROC curve analysis of RBD-I-9 and RBDQ1 for diagnosing REM sleep behaviour disorder. A – comparison of both questionnaires. B – comparison of each RBD-I-9 questions for diagnosing purposes of RBD.
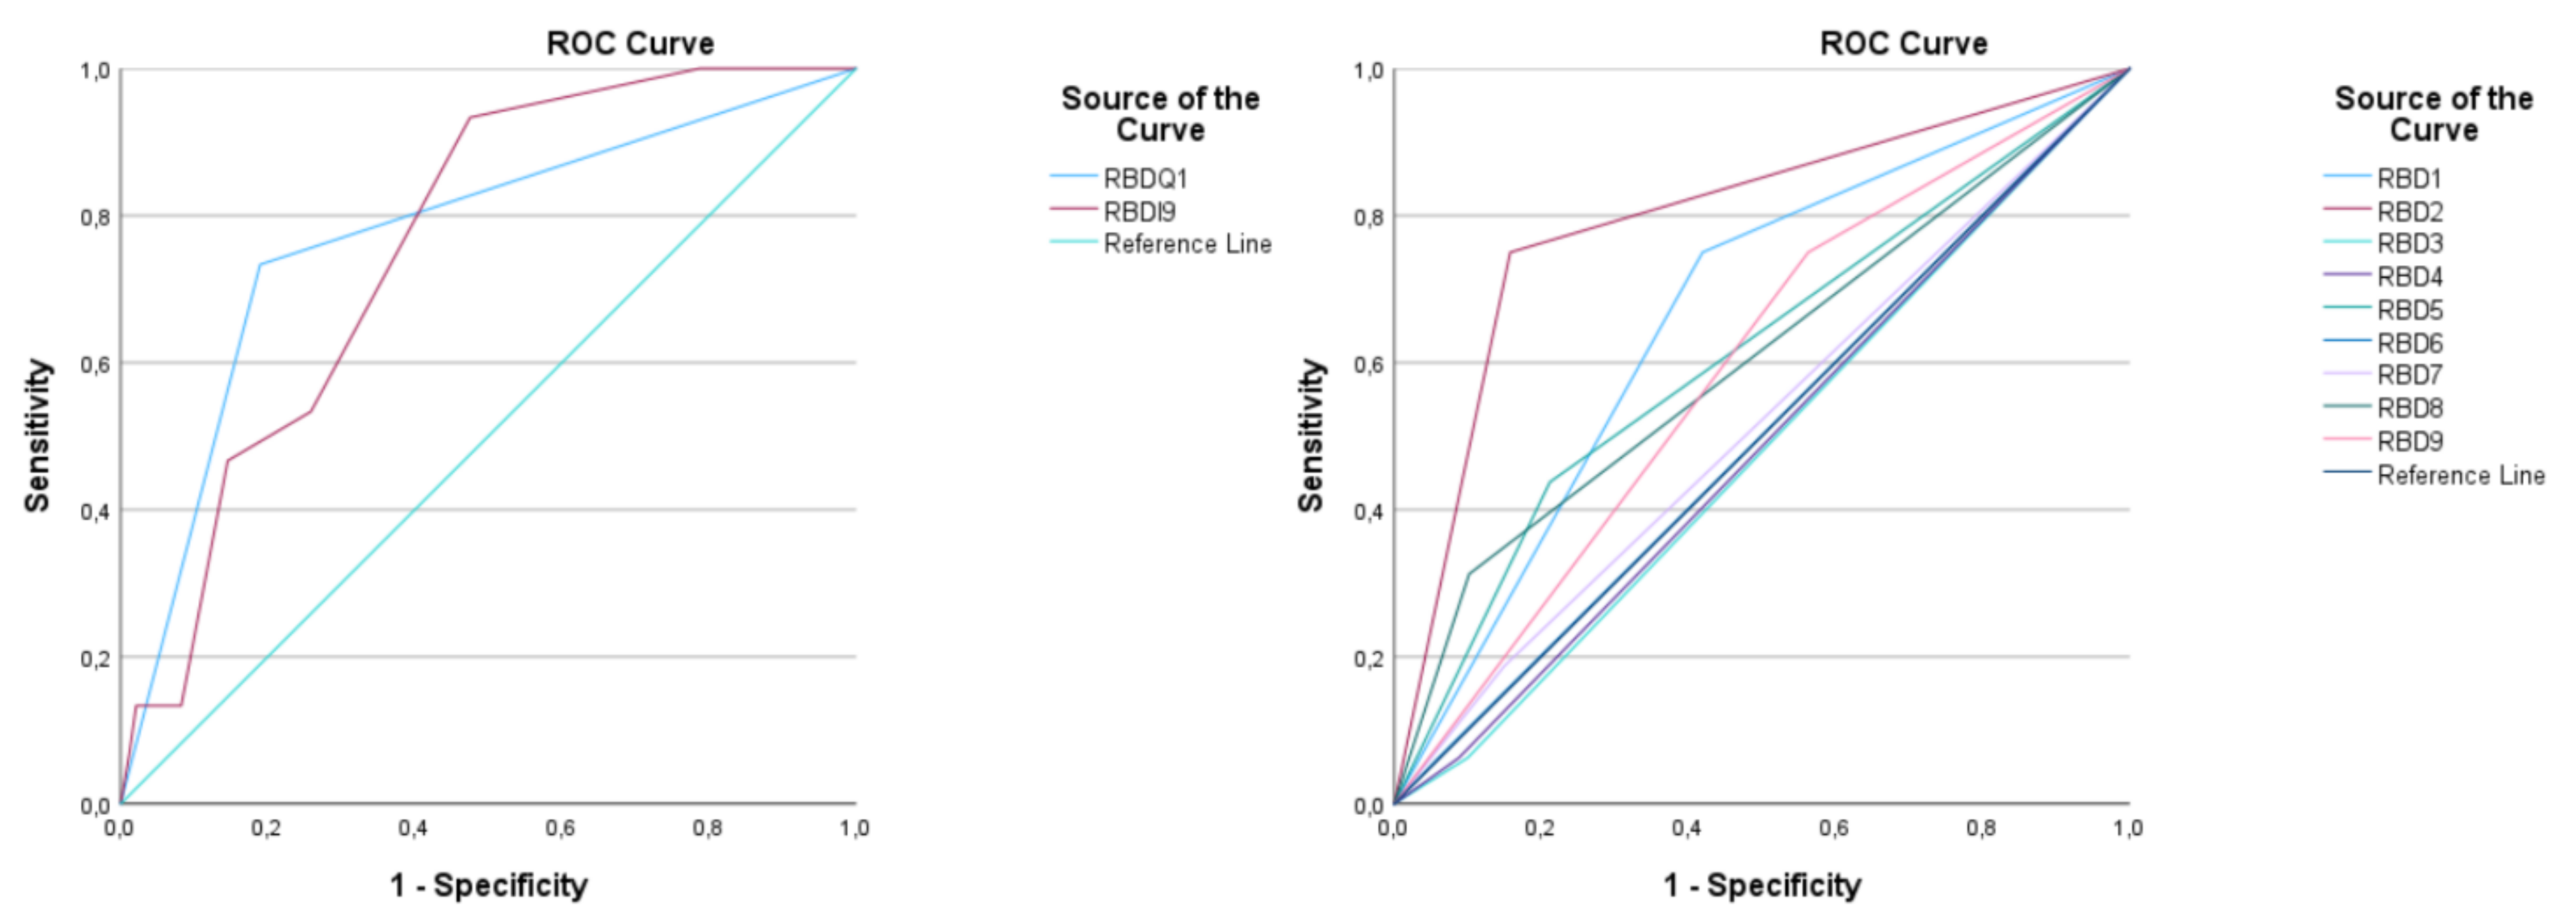
Figure 5.
ROC curve analysis of Epworth sleepiness scale (ESS) for detecting various sleep disorders. A – obstructive sleep apnoea (OSA), B – severe OSA, C – hypersomnia, D – insomnia, E – RBD, F – parasomnia.
Figure 5.
ROC curve analysis of Epworth sleepiness scale (ESS) for detecting various sleep disorders. A – obstructive sleep apnoea (OSA), B – severe OSA, C – hypersomnia, D – insomnia, E – RBD, F – parasomnia.
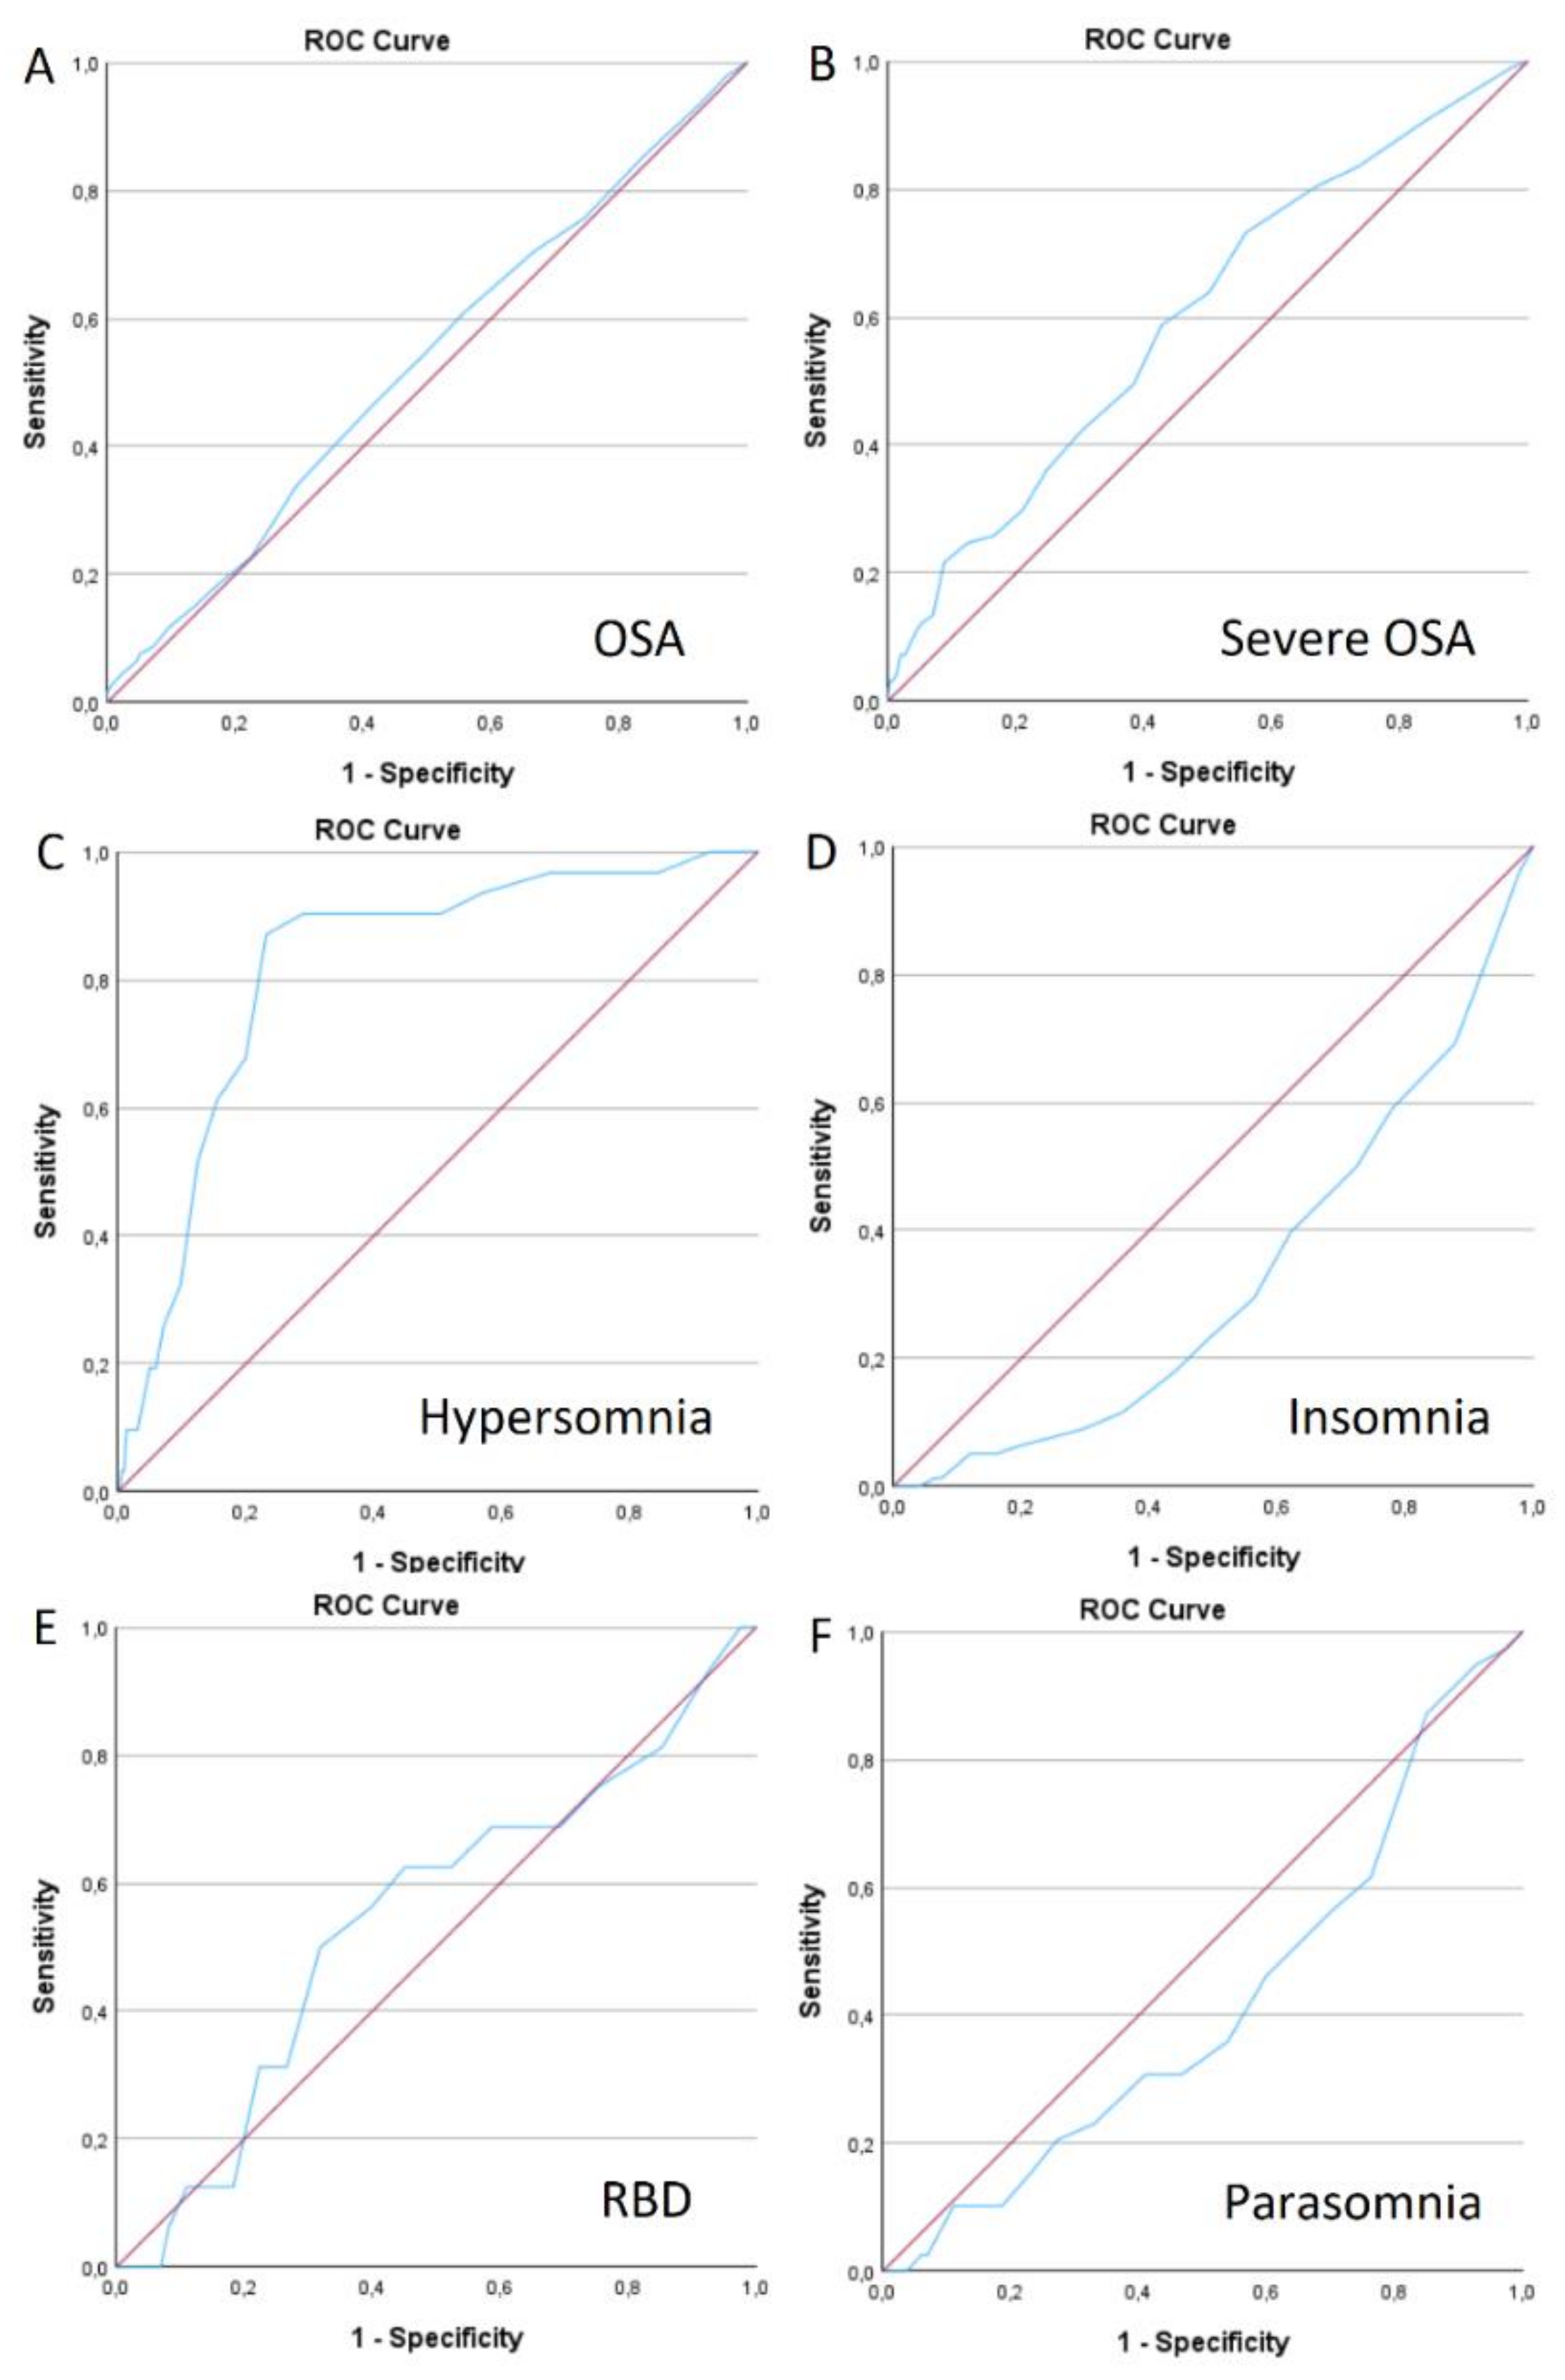

Table 1.
Demographical characteristics.
| Sleep disorder | OSA | Insomnia | Hypersomnia | Parasomnias | RBD |
|---|---|---|---|---|---|
| Prevalence | 362, 64.4% | 80, 14.2% | 32, 5.7% | 40, 7.1% | 16, 2.8% |
| Gender | F 153, 42.3% M 209, 57.7% * p=0.015 |
F 39, 48.8% M 41, 51.2% |
F 24, 75.0% M 8, 25.9% * p<0.001 |
F 19, 47.5% M 21, 52.5% |
F 7, 43.8% M 9, 56.3% |
| Age, years | (-) 38.9±15.5 (+) 53.03±14.3 * p<0.001 |
(-) 47.2±16.0 (+) 52.6±16.6 * p=0.006 |
(-) 48.5±16.3 (+) 40.2±12.5 * p=0.004 |
(-) 49.02±15.7 (+) 34.5±16.6 * p<0.001 |
(-) 47.6±16.2 (+) 59.2±11.4 * p=0.003 |
| BMI, kg/m2 | (-) 24.8±4.2 (+) 30.6±6.7 * p<0.001 |
(-) 28.7±6.8 (+) 27.6±4.5 |
(-) 28.5±6.3 (+) 29.1±10.2 |
(-) 28.7±6.4 (+) 26.9±8.6 |
(-) 28.6±6.5 (+) 26.5±9.1 |
| Comorbidities - PAH |
(-) 23, 13.7% (+) 145, 49.2% * p<0,001 |
27, 43.5% |
(-) 21, 84.0% (+) 4, 16.0% * p=0.023 |
6, 20.7% |
4, 30.8% |
| - AF | (-) 3, 1.9% (+) 24, 8.2% * p=0,008 |
5, 8.1 | 1, 4.0% | 1, 3.4% | 1, 7.7% |
| - Diabetes | (-) 7, 4.6% (+) 32, 10.9% * p=0,025 |
8, 12.9% | 1, 4.2% | 1, 3.4% | 0 |
| - Dyslipidaemia | (-) 11, 7.0% (+) 59, 18.6% * p<0,001 |
12, 17.4% | 1, 3.8% | 1, 4.3% | 1, 7.1% |
| - PD | 6, 2.0% | 0 | 0 | 1, 2.5% | 8, 50.0% |
| - Epilepsy | 20, 6.8% | 0 | 1, 4.0% | 1, 3.4% | 0 |
| - MS | 1, 0.3% | 0 | 0 | 0 | 0 |
OSA – obstructive sleep apnoea, RBD – REM sleep behaviour disorder, BMI – body mass index, PAH – primary arterial hypertension, AF – atrial fibrillation, PD – Parkinson’s disease, MS – multiple sclerosis, (+) – positive trait, (-) – negative trait; results are expressed as absolute values and percentage, as well as mean ± standard deviation (SD) and p value (*only statistically significant values presented).
Table 2.
Overall performance of BQ for diagnosing OSA.
| OSA | BQ | AUC | 95% CI | Sensitivity | Specificity | p-value |
|---|---|---|---|---|---|---|
| Mild | Overall | 0.551 | 0.498-0.603 | 61.9% | 48.2% | 0.062 |
| Intermediate | Cat. 1 | 0.586 | 0.524-0.648 | 75.6% | 41.6% | 0.01 |
| Cat. 2 | 0.428 | 0.365-0.492 | 33.3% | 52.4% | 0.032 | |
| Overall | 0.505 | 0.440-0.570 | 55.6% | 45.5% | 0.875 | |
| Severe | Cat. 1 | 0.667 | 0.614-0.719 | 88.7% | 44.7% | <0.001 |
| Cat. 3 | 0.728 | 0.680-0.776 | 90.7% | 54.9% | <0.001 | |
| Overall | 0.700 | 0.648-0.751 | 87.6% | 52.3% | <0.001 | |
| Overall | Cat. 1 | 0.694 | 0.648-0.741 | 75.1% | 63.8% | <0.001 |
| Cat. 3 | 0.718 | 0.427-0.527 | 68.6% | 74.9% | <0.001 | |
| Overall | 0.683 | 0.637-0.730 | 67.8% | 68.8% | <0.001 |
OSA – obstructive sleep apnoea, BQ – Berlin Questionnaire, AUC – area under the curve, 95% CI – 95% confidence interval.
Table 3.
Comparison of every question in RBD-I-9 scale and RBD1Q for diagnosing RBD.
| RBD-I-9 questions | AUC | 95% CI | p-value | Sensitivity | Specificity |
|---|---|---|---|---|---|
| Question 1 | 0.665 | 0.538-0.793 | 0.024 | 75.0% | 58.1% |
| Question 2 | 0.796 | 0.671-0.921 | <0.001 | 75.0% | 84.2% |
| Question 3 | 0.481 | 0.342-0.621 | 0.799 | - | - |
| Question 4 | 0.487 | 0.346-0.628 | 0.863 | - | - |
| Question 5 | 0.613 | 0.462-0.764 | 0.124 | - | - |
| Question 6 | 0.501 | 0.357-0.645 | 0.986 | - | - |
| Question 7 | 0.519 | 0.372-0.666 | 0.797 | - | - |
| Question 8 | 0.605 | 0.449-0.762 | 0.151 | - | - |
| Question 9 | 0.594 | 0.461-0.727 | 0.202 | - | - |
| Overall RBDI9 | 0.758 | 0.665-0.851 | 0.001 | 93.3% | 52.5% |
| RBD1Q | 0.772 | 0.641-0.903 | <0.001 | 73.3% | 81.0% |
RBD-I-9 – Innsbruck REM Sleep Behaviour Disorder Inventory 9-item scale, AUC – area under the curve, 95% CI – 95% confidence interval.
Disclaimer/Publisher’s Note: The statements, opinions and data contained in all publications are solely those of the individual author(s) and contributor(s) and not of MDPI and/or the editor(s). MDPI and/or the editor(s) disclaim responsibility for any injury to people or property resulting from any ideas, methods, instructions or products referred to in the content. |
© 2025 by the authors. Licensee MDPI, Basel, Switzerland. This article is an open access article distributed under the terms and conditions of the Creative Commons Attribution (CC BY) license (http://creativecommons.org/licenses/by/4.0/).
Copyright: This open access article is published under a Creative Commons CC BY 4.0 license, which permit the free download, distribution, and reuse, provided that the author and preprint are cited in any reuse.


