
Submitted:
01 August 2025
Posted:
05 August 2025
You are already at the latest version
Abstract
Introduction: Sleep in intensive care unit (ICU) patients is frequently disrupted, which may adversely affect their overall health and recovery. despite the implementation of various strategies to promote sleep, accurately assessing its quality remains complex. This pilot study aimed to evaluate both the quality and quantity of sleep in ICU patients using actigraphy (ACT) and the Richards-Campbell Sleep Questionnaire (RCSQ), and to compare the diagnostic performance of these two tools. Methods: We conducted a prospective observational study including 228 ICU patients. Sleep was assessed using both the RCSQ and ACT. Receiver Operating Characteristic (ROC) curve analysis was used to evaluate the discriminative ability of each tool (Area Under the Curve [AUC], sensitivity, specificity), with optimal cut-off points determined using Youden's Index. The Mann-Whitney U test was used to compare sleep parameters between patients classified as having good or poor sleep based on ACT measurements. Results: The mean RCSQ score was 38.16 ± 17.09, indicating poor perceived sleep quality. Sleep onset latency (based on RCSQ) was 35.71 ± 21.44 minutes, with a mean of 40.32 ± 20.03 awakenings. According to ACT, sleep latency was 39.23 ± 22.09 minutes, and total sleep duration was 198.15 ± 128.42 minutes (approximately 3 hours and 18 minutes), which is significantly below recommended levels. The average number of awakenings recorded 24.85. In terms of diagnostic performance, the RCSQ demonstrated excellent discriminative ability (AUC = 1.00 for the total score), while ACT showed more variable results: Total sleep duration had a good AUC of 0.91, while sleep latency showed a lower performance with an AUC of 0.50. Conclusion: The RCSQ proved to be more reliable than ACT in assessing sleep quality in ICU patients, providing consistent results across multiple parameters, including sleep depth, latency, and number of awakenings. Conversely, ACT yielded less consistent findings, particularly regarding sleep latency and nighttime interruptions. Further studies are warranted to refine objective tools for evaluating sleep in critically ill patients.
Keywords:
sleep
; actigraphy
; Richards-Campbell sleep questionnaire
; intensive care unit
1. Introduction
Sleep disorders are common among patients in intensive care units (ICUs), significantly affecting their health and overall well-being [1]. Numerous studies have highlighted profound alterations in sleep architecture in this population, such as increased sleep fragmentation, frequent awakenings, and lighter sleep stages [2,3]. These sleep abnormalities are not only frequent but have also been associated with higher mortality rates and poorer clinical outcomes among hospitalized patients. Furthermore, research has revealed disruptions in circadian rhythms, prolonged daytime sleep, and a high incidence of ICU delirium, all of which contribute to the neuropsychological burden experienced by these patients [4,5]. Patients often perceive sleep disturbances as a significant source of stress, and their effects may persist long after ICU discharge, contributing to post-intensive care syndrome symptoms, including cognitive and psychological impairments in survivors [6,7].
Polysomnography (PSG) is currently considered the gold standard for evaluating sleep quality in the ICU environment. However, this method presents several limitations, including its technical complexity, high cost, and time-consuming procedures [3]. In addition, the presence of abnormal electroencephalographic (EEG) activity in critically ill patients raises questions about the applicability and reliability of the standard scoring system recommended by the American Academy of Sleep Medicine in this specific context. These limitations have led to the exploration of alternative methods to assess sleep in ICU patients [8].
Actigraphy (ACT), a widely recognised non-invasive technique, has emerged as a promising alternative to PSG. This method records motor activity during sleep, allowing the measurement of body movements at predefined intervals (e.g., 15, 30, or 60 seconds) [9]. The data collected via accelerometry is stored and analysed using specific algorithms. The choice of algorithm, adapted to the specific patient population, is crucial to ensure the sensitivity and specificity of the assessment. Although ACT offers advantages such as ease of use and cost-effectiveness, its reliability remains a significant limitation [10]. In clinical practice, ACT is often used in combination with other methods, particularly to evaluate the impact of clinical interventions on sleep.
In addition to objective measures, subjective assessment of sleep quality is commonly performed using questionnaires. The Richards-Campbell Sleep Questionnaire (RCSQ) is among the most widely used instruments in this context. It consists of five items assessing different dimensions of sleep: sleep depth, sleep latency, number of awakenings, ease of returning to sleep, and overall sleep quality, along with an optional item evaluating noise disturbances. Each item is rated on a visual analogue scale ranging from 0 to 100, where 0 represents the worst possible sleep and 100 represents the best possible sleep [11]. The psychometric properties of the Moroccan version of the RCSQ have demonstrated high reliability (Cronbach's alpha between 0.89 and 0.92) and good criterion validity compared to PSG (r = 0.58, p < 0.001) [12].
This study aimed to assess both the quality and quantity of sleep in ICU patients using both the RCSQ and ACT, and to analyze the diagnostic accuracy of these two assessment tools.
2. Results
Descriptive results of the sample are presented in Table 2. The mean age of patients was 54.25 ± 16.76 years, indicating notable variability. The mean body mass index (BMI) was 23.13 ± 4.86 kg/m², suggesting a generally normal weight profile. The pain score (VAS) averaged 4.07 ± 3.24, indicating moderate pain intensity among most patients, with considerable inter-individual variability. The Charlson Comorbidity Index had a mean of 1.25 ± 1.37, while Quick SOFA and APACHE II scores averaged 0.73 ± 0.85 and 10.66 ± 5.76, respectively.
The average ICU length of stay was 5.44 ± 2.53 days, with significant variation among patients. RCSQ scores revealed a generally poor perception of sleep quality:
Perceived sleep depth: 39.03 ± 22.43, sleep latency: 35.71 ± 21.44, number of awakenings: 40.32 ± 20.03, return to sleep: 38.88 ± 18.81, overall sleep quality: 38.93 ± 17.12, Noise/disturbance: 33.23 ± 17.72. The overall RCSQ score was 38.16 ± 17.09, reflecting a generally unsatisfactory quality of sleep in this ICU population.
In contrast, actigraphy data showed slightly different trends. Sleep latency (ACT): 39.23 ± 22.09 minutes, total sleep duration: 198.15 ± 128.42 minutes (approximately 3.3 hours), which is well below the recommended levels for restorative sleep. Sleep interruptions: 52.28 ± 24.85 episodes per night, and overall sleep efficiency score: 37.03 ± 19.2. These actigraphic findings corroborate the RCSQ results, confirming poor sleep quality in this critically ill population.
Table 3 provides a detailed analysis of the comparative diagnostic performance of the RCSQ and actigraphic parameters. Specifically, it assesses their ability to discriminate between patients with good sleep (n = 64) and those with poor sleep (n = 164). To this end, several key indicators were examined: the optimal cut-off values determined using Youden’s Index, the area under the ROC curve (AUC) with its standard deviation (SD), p-value, as well as the sensitivity, specificity, and diagnostic accuracy percentages.
Firstly, regarding the RCSQ, the results demonstrate that sleep depth (threshold = 53) shows robust diagnostic performance (AUC = 0.84; SD = 0.0204; p < 0.001). This parameter combines a sensitivity of 82% with a specificity of 85%. Similarly, sleep latency (threshold = 43) exhibits comparable performance (AUC = 0.86; SD = 0.0130; p < 0.001), although its profile favours higher sensitivity (92%) at the expense of slightly lower specificity (80%). Furthermore, the number of awakenings (threshold = 57) exhibits excellent discriminative power (AUC = 0.85; SD = 0.0257; p < 0.001), providing an optimal balance between sensitivity (76%) and specificity (94%). Moreover, analysis of the remaining RCSQ components reinforces these observations. The ability to return to sleep after an awakening (threshold = 53) demonstrated good diagnostic accuracy (AUC = 0.82; SD = 0.0276; p < 0.001). Similarly, perceived overall sleep quality (threshold = 38) yielded particularly convincing results (AUC = 0.83; SD = 0.0215; p < 0.001). However, it is the RCSQ total score (threshold = 49.4) that proved to be the most effective, displaying perfect performance (AUC = 1.00; SD = 0.00; p < 0.001) with 100% sensitivity and 99.56% specificity.
In contrast, actigraphic data presented a more nuanced picture. Although total sleep time (threshold = 277 minutes) achieved excellent diagnostic performance (AUC = 0.91; SD = 0.0124; p < 0.001) (Figure 1.b), other parameters such as sleep latency (AUC = 0.50; SD = 0.00314; p < 0.001) (Figure 1.a) and number of interruptions (AUC = 0.50; SD = 0.0223; p < 0.001) (Figure 1.c) showed limited discriminative capacity. However, it is noteworthy that the total sleep efficiency score (threshold = 49) matched the exceptional performance of the total RCSQ score (AUC = 1.00; SD = 0.0; p < 0.001) (Figure 1.f). Conversely, sleep depth measured by actigraphy, with an optimal threshold of 0, exhibited limited discriminative capacity (AUC = 0.54; SD = 0.0169; p = 0.020) (Figure 1.d), characterized by maximal specificity (100%) but zero sensitivity. Similarly, sleep regularity, also with a threshold of 0, showed slightly better but still moderate performance (AUC = 0.65; SD = 0.2878; p < 0.001) (Figure 1.e), once again displaying an imbalanced profile with perfect specificity (100%) but insufficient sensitivity (8%) (Figure 1.f). These findings suggest that while sleep regularity may serve as a specific marker, it fails to identify most patients with sleep disturbances.
In summary, these results highlight the overall superiority of the RCSQ as a tool for evaluating sleep quality in hospital settings. They particularly underscore the excellent psychometric reliability of the RCSQ total score, while also acknowledging the specific utility of certain actigraphic parameters, such as total sleep duration. Ultimately, this comparative analysis reveals potential complementarities between the two assessment methods, offering a more comprehensive and accurate evaluation of sleep quality in intensive care patients.
Table 4 compares the demographic, clinical, and sleep parameters between two groups of patients: those with poor sleep quality (n = 164) and those with good sleep quality (n = 64). This comparative analysis is based on objective actigraphy measurements and clinical data, with means and standard deviations reported for each group, along with p-values derived from the Mann-Whitney U test.
The results immediately highlight significant demographic differences. Among participants with poor sleep quality, 57.32% were women and 42.68% were men. In contrast, in the group with good sleep quality, 20.31% were women and 79.69% were men. This difference between groups is statistically significant (p < 0.001), indicating a higher proportion of men among good sleepers and a higher proportion of women among poor sleepers. Furthermore, patients in the poor sleep group were older on average (56.09 ± 16.19 years) compared to those in the good sleep group (49.52 ± 17.4 years, p = 0.010).
The analysis of clinical scores also reveals substantial differences:
The pain score (VAS) was significantly higher in the poor sleep group (4.79 ± 3.12 vs. 2.22 ± 2.78, p < 0.001), as were the Charlson Comorbidity Index (1.45 ± 1.36 vs. 0.77 ± 1.26, p < 0.001), the SOFA score (0.82 ± 0.86 vs. 0.5 ± 0.8, p = 0.004), and the APACHE II score (11.65 ± 5.65 vs. 8.14 ± 5.26, p < 0.001). Regarding sleep parameters derived from actigraphy, the differences between groups were particularly striking: Objectively measured sleep latency was nearly twice as long in poor sleepers (45.2 ± 22.01 minutes vs. 23.94 ± 13.21 minutes, p < 0.001), total sleep time showed a substantial gap (143.07 ± 103.14 minutes vs. 339.3 ± 61.34 minutes, p < 0.001), representing nearly 3.5 hours of difference, additionally, the number of sleep interruptions was significantly higher in the poor sleep group (60.33 ± 24.35 vs. 31.66 ± 9.48, p < 0.001).
These findings support two key conclusions: first, there is a strong association between sleep quality and various clinical markers; and second, sleep disturbances in the ICU are not limited to subjective perception but manifest as objective alterations measurable via actigraphy. Finally, the consistency across demographic, clinical, and sleep-related data suggests that patients with poor sleep quality form a distinct subgroup with specific characteristics, potentially requiring targeted management strategies.
3. Discussion
Assessing sleep quality in intensive care unit (ICU) patients remains a major challenge due to multiple physiological and environmental factors disrupting sleep. Patients in these units are frequently subjected to intensive medical treatments, frequent interventions, and care conditions that impair their ability to achieve restorative sleep [16,17]. This study compared two sleep assessment tools: the Richards-Campbell Sleep Questionnaire (RCSQ), a subjective method, and actigraphy (ACT), an objective method, to determine their reliability and limitations in the ICU setting. The findings revealed poor sleep quality, as assessed by both subjective and objective methods, although the two methods displayed different performances in terms of sensitivity and specificity.
RCSQ results, with an average score of 38.16 ± 17.09, indicate that patients perceive their sleep quality as poor. This score is well below the threshold of 50, which is commonly accepted as the cut-off for good sleep quality. These results are consistent with other studies conducted on ICU patients. Naik et al. (2018) reported an average score of 46, suggesting that ICU patients frequently experience sleep disturbances due to the hospital environment and medical treatments, which are often responsible for poor sleep quality [18]. Specific RCSQ parameters such as sleep latency (35.71 ± 21.44 minutes) and the number of awakenings (40.32 ± 20.03) also demonstrated difficulties in falling and staying asleep findings in line with those of Zang et al. (2023) and Ahn et al. (2023), who reported elevated sleep latency and increased awakenings in ICU settings [19,20]. However, the use of the RCSQ in ICU settings has important limitations, primarily linked to the clinical condition of patients. Factors such as sedative administration, the presence of delirium, and central nervous system (CNS) dysfunction can impair patients’ subjective perception of their sleep. Talvacchia et al. (2024) emphasised that these factors may limit the reliability of patient self-assessments [21]. In this study, RCSQ results highlight clear difficulties in maintaining restorative sleep, directly linked to medical and environmental disruptions.
ACT, used as an objective method to assess sleep quality, showed that the average sleep duration was 198.15 ± 128.42 minutes, or approximately 3.5 hours well below than the recommended 7 to 9 hours for restorative sleep [22]. Similar findings were reported by Nilius et al. (2023) and Romagnoli et al. (2020), who observed reduced sleep durations in ICU patients, insufficient for recovery [23,24].
Furthermore, the frequency of sleep interruptions was high (52.28 ± 24.85 episodes per night), also reflects poor sleep quality in this population. Boyko et al. (2017) also reported frequent interruptions in ICU environments, which interfere with sleep continuity and disrupt regular sleep cycles [25]. Nonetheless, ACT also has significant limitations in the ICU context, particularly due to reduced voluntary motor activity resulting from medical treatments and the sedative effects of these treatments. Delaney et al. (2021) and Bigué et al. (2020) noted that ACT is less reliable for evaluating sleep in immobile patients, which is often the case in the ICU. This reduction in movement can affect ACT readings and lead to an underestimation of sleep quality, thereby limiting the effectiveness of this tool as a standalone diagnostic in critical care [26,27].
This study also allowed for a comparison between subjective and objective assessments. Both methods indicated poor sleep quality, but the correlation between them was weak. The RCSQ showed area under the ROC curve (AUC) values close to 1.00 for several parameters such as sleep depth, sleep latency, and number of awakenings, confirming that the RCSQ is a reliable tool for identifying good-quality sleep. In contrast, ACT showed low sensitivity for key parameters, such as sleep latency and sleep interruptions, raising concerns about its effectiveness as a standalone diagnostic tool. These findings are consistent with those of Conley et al. (2019), who reported that ACT has lower sensitivity compared to more robust methods, such as polysomnography (PSG), the gold standard for sleep assessment [28].
Regarding BMI, this study observed that patients with a higher BMI had significantly poorer sleep quality. This result aligns with findings from Figorilli et al. (2025) and Carneiro et al. (2019), who reported a relationship between obesity and sleep disorders. Obesity may contribute to sleep disturbances due to increased body mass and associated respiratory comorbidities, indicating the need to consider BMI as a potential risk factor in ICU sleep assessments [29,30]. As for gender differences, this study revealed that women in the ICU experienced significantly poorer sleep quality than men. Interestingly, Altman et al. (2017) reported that men were more likely to experience sleep disorders in ICU settings, possibly due to specific comorbidities or greater susceptibility to treatment effects [31].
Ultimately, while ACT offers benefits as an objective method of sleep assessment, this study confirms that ACT alone is insufficient for evaluating sleep quality in ICU settings. ACT lacks sensitivity and specificity for key sleep parameters, such as sleep latency and sleep interruptions. Future research should aim to improve the accuracy of objective tools, such as polysomnography, while continuing to explore ACT as a complementary method. Thus, combining subjective and objective methods could enable more complete and accurate evaluations of sleep quality in ICU patients. This comprehensive approach may help identify the influencing factors and guide the development of effective strategies to improve sleep in this vulnerable population.
4. Materials and Methods
Study Design
It was a cross-sectional, observational study. Data were collected prospectively from patients admitted to the ICUs of three hospitals in the Souss-Massa region, located in southern Morocco, during the period from February 16, 2023 to March 15, 2025.
Population and Sampling
Patients were selected using an exhaustive sampling method, including all patients admitted during the study period who met the inclusion criteria. The final sample consisted of 228 critically ill patients admitted to the ICU, aged 18 years or older, who were Arabic-speaking and had provided informed consent. Patients were excluded if they had hearing or speech impairments, a pre-existing diagnosis of dementia, documented substance use disorders, or a Glasgow Coma Scale score below 15.
Data Collection
Sleep characteristics and quality were assessed simultaneously using the Richards-Campbell Sleep Questionnaire (RCSQ) and actigraphy (ACT). Patient inclusion, actigraphic monitoring, and questionnaire administration were conducted by two nurses with prior training in the use of these instruments.
Assessment Tools
- AM-RCSQ
Sleep was evaluated using the Moroccan Arabic version of the validated RCSQ (AM-RCSQ) [12]. This five-item questionnaire assesses various dimensions of sleep, including perceived sleep depth, sleep latency, number of awakenings, sleep efficiency, and time spent awake. Each item is scored on a visual analogue scale (VAS) ranging from 0 to 100 mm, with higher scores indicating better perceived sleep. The mean of the five items constitutes the global AM-RCSQ score.
The questionnaire was administered three times during the patient’s ICU stay, always at the same time (9:00 a.m.). On average, the questionnaire took four minutes to complete.
- b. Actigraphy
Actigraphy was performed using the Withings Sleep Analyser, which was placed under the mattress for three consecutive nights. Given the study’s focus on nocturnal sleep and its pilot design, data were recorded from 7:00 p.m. to 7:00 a.m.
The associated software, integrated into the Health Mate application, enables the visualization, analysis, and tracking of various sleep parameters, including sleep duration, sleep stages, and nighttime awakenings [13].
The actigraphic parameters analysed are detailed in Table 1.
Sleep Quality
An RCSQ total score ≥ 50 was used to define good sleep (sensitivity 88.24%, specificity 86.67%; receiver operating characteristic [ROC] area = 0.92, 95% confidence interval [CI]). Patients with a total RCSQ score below 50 were considered to have poor sleep [14]. This cut-off was established through statistical analysis to determine the optimal balance between sensitivity and specificity. Similarly, a total sleep efficiency score by actigraphy ≥ 50 was used to define good sleep [13].
Ethical Approval
This cross-sectional study was conducted with adult patients and received approval from the Biomedical Research Ethics Committee (CERB) of the Faculty of Medicine and Pharmacy of Rabat (Ref. No. 154/24). Authorisation to collect data was granted by the Regional Department of Health and Social Protection of the Souss-Massa region. Prior to participation, all patients received a detailed explanation of the study and provided written informed consent, in accordance with the ethical standards governing biomedical research [15].
Data Analysis
Descriptive statistics (absolute/relative frequencies, mean, and standard deviation [SD]) were used to analyse demographic and clinical data and to assess the different components of the questionnaire.
Statistical analysis was performed using STATA software version 17.0 (STATA Corporation, College Station Road, Houston, Texas, USA). Diagnostic accuracy (binary discrimination ability) of the tools was assessed using ROC curve analysis and Youden's Index, with a significance threshold set at p < 0.05. AUC values between 0.75 and 0.92 indicate good diagnostic capacity, between 0.92 and 0.97 excellent, and between 0.97 and 1.00 excellent diagnostic performance.
Relationships between certain RCSQ items and actigraphy parameters were assessed using Spearman's correlation coefficient. Fisher's exact test was used to examine the association between sleep quality and gender. Differences in sleep quality, as measured by the AM-RCSQ and actigraphy, were compared using the non-parametric Mann-Whitney U test, with statistical significance set at p < 0.05.
5. Conclusions
Accurately measuring sleep quality in ICU patients remains a significant challenge, both in terms of practical implementation and data interpretation. This study demonstrated that the RCSQ, with its excellent discriminative power, is a reliable subjective tool for assessing patients' perception of sleep quality. Additionally, ACT provided objective data revealing concerning patterns, such as a short average sleep duration, which is well below clinical recommendations. Moreover, significant differences based on gender and age suggest an important influence of demographic factors. However, this research faced several limitations. First, the impact of sedative drugs on actigraphy readings could not be fully controlled. Second, the clinical condition of patients may have influenced their responses to the RCSQ.
Nevertheless, the findings open up important perspectives for sleep management in ICU settings. Future research should focus on two main directions: improving actigraphy algorithms to adapt them to the specific challenges of immobilised ICU patients and developing integrated approaches that combine subjective and objective tools. While the RCSQ has proven effective, its association with other tools appears essential to obtain a comprehensive view of sleep disorders in critical care. This dual approach may lead to more targeted interventions, ultimately improving both the quality of care and patient outcomes.
Strengths and Limitations
This study presents several important limitations that should be acknowledged. First, the influence of sedative medications on actigraphy data could not be fully controlled, which may have affected the accuracy of objective sleep measurements. Second, the subjective nature of the RCSQ might be influenced by patients’ clinical conditions, such as delirium or neurological impairments, potentially biasing self-reported sleep quality. Third, the study’s setting in a specific region of Morocco may limit the generalizability of findings to other healthcare contexts. Fourth, the cross-sectional and pilot design restricts the assessment of changes over time and causal relationships. Finally, some potential confounders like concurrent treatments, pain levels, and environmental factors were not exhaustively controlled. Despite these limitations, the study provides valuable insights by simultaneously assessing sleep quality with both subjective (RCSQ) and objective (actigraphy) tools in a relatively large ICU patient cohort. The excellent discriminative performance of the RCSQ total score and the identification of significant demographic and clinical associations highlight the clinical relevance of the findings. Furthermore, this research opens avenues for improving sleep assessment methods and tailoring interventions to enhance patient outcomes in critical care.
Future studies should build on these results with larger, multicenter, and longitudinal designs to validate and extend the understanding of sleep disturbances in ICU patients, ultimately guiding better management strategies.
Author Contributions
Conceptualisation, A.J. and T.D.; Formal analysis, Y.B.; Investigation, A.L. and K.O.; Methodology, A.L. and T.D.; Software, Y.B.; Supervision, A.J. and T.D.; Validation, A.J. and T.D.; Writing – original draft, A.L.; Writing – review & editing, K.O. and A.J. All authors have read and agreed to the published version of the manuscript.
Funding
No funding was received for this research.
Institutional Review Board Statement
The protocol received formal approval from the Ethics Committee for Biomedical Research, Faculty of Medicine and Pharmacy, Mohammed V University in Rabat, Morocco (approval No. 154/24, approved on 25 Septembre 2024).
Informed Consent Statement
Informed consent was obtained from all subjects involved in the study.
Data Availability Statement
The datasets generated and analyzed during the current study are available from the corresponding author on reasonable request.
Conflicts of Interest
All authors certify that they have no affiliations with or involvement in any organization or entity with any financial interest (such as honoraria; educational grants; participation in speakers’ bureaus; membership, employment, consultancies, stock ownership, or other equity interest; and expert testimony or patent-licensing arrangements), or non-financial interest (such as personal or professional relationships, affiliations, knowledge or beliefs) in the subject matter or materials discussed in this manuscript.
References
- Halvorsen, K.; Jensen, J.F.; Collet, M.O.; Olausson, S.; Lindahl, B.; Hansen, B.S.; Lind, R.; Eriksson, T. Patients' experiences of well-being when being cared for in the intensive care unit—An integrative review. J. Clin. Nurs. 2021, 31, 3–19. [Google Scholar] [CrossRef]
- Burman D, Muzumdar H. Sleep architecture and physiology. Management of Sleep Disorders in Psychiatry New York. 2020:12-22.
- Alegria, L.; Brockmann, P.; Repetto, P.; Leonard, D.; Cadiz, R.; Paredes, F.; Rojas, I.; Moya, A.; Oviedo, V.; García, P.; et al. Improve sleep in critically ill patients: Study protocol for a randomized controlled trial for a multi-component intervention of environment control in the ICU. PLOS ONE 2023, 18, e0286180. [Google Scholar] [CrossRef]
- Daou M, Telias I, Younes M, Brochard L, Wilcox ME. Abnormal sleep, circadian rhythm disruption, and delirium in the ICU: are they related? Frontiers in Neurology. 2020;11:549908. [CrossRef]
- Mart MF, Roberson SW, Salas B, Pandharipande PP, Ely EW, editors. Prevention and management of delirium in the intensive care unit. Seminars in respiratory and critical care medicine; 2021: Thieme Medical Publishers, Inc.
- Voiriot, G.; Oualha, M.; Pierre, A.; Salmon-Gandonnière, C.; Gaudet, A.; Jouan, Y.; Kallel, H.; Radermacher, P.; Vodovar, D.; Sarton, B.; et al. Chronic critical illness and post-intensive care syndrome: from pathophysiology to clinical challenges. Ann. Intensiv. Care 2022, 12, 1–14. [Google Scholar] [CrossRef]
- Gupta, L.; Subair, M.N.; Munjal, J.; Singh, B.; Bansal, V.; Gupta, V.; Jain, R. Beyond survival: understanding post-intensive care syndrome. Acute Crit. Care 2024, 39, 226–233. [Google Scholar] [CrossRef]
- Malhotra, R.K.; Kirsch, D.B.; Kristo, D.A.; Olson, E.J.; Aurora, R.N.; Carden, K.A.; Chervin, R.D.; Martin, J.L.; Ramar, K.; Rosen, C.L.; et al. Polysomnography for Obstructive Sleep Apnea Should Include Arousal-Based Scoring: An American Academy of Sleep Medicine Position Statement. J. Clin. Sleep Med. 2018, 14, 1245–1247. [Google Scholar] [CrossRef]
- Hussain, Z.; Sheng, Q.Z.; Zhang, W.E.; Ortiz, J.; Pouriyeh, S. Non-invasive Techniques for Monitoring Different Aspects of Sleep: A Comprehensive Review. ACM Trans. Comput. Heal. 2022, 3, 1–26. [Google Scholar] [CrossRef]
- Rahimi-Eichi H, Coombs III G, Bustamante CMV, Onnela J-P, Baker JT, Buckner RL. Open-source longitudinal sleep analysis from accelerometer data (DPSleep): Algorithm development and validation. JMIR mHealth and uHealth. 2021;9(10):e29849. [CrossRef]
- Richards, K.C.; O’sUllivan, P.S.; Phillips, R.L. Measurement of Sleep in Critically Ill Patients. J. Nurs. Meas. 2000, 8, 131–144. [Google Scholar] [CrossRef]
- Lkoul, A.; Oum’barek, K.; Baba, M.A.; Jniene, A.; Dendane, T. Translation and Validation of the Richards–Campbell Sleep Questionnaire for Intensive Care Unit Patients in Morocco: Reliability and Validity Assessment. Clocks Sleep 2025, 7, 31. [Google Scholar] [CrossRef]
- Edouard, P.; Campo, D.; Bartet, P.; Yang, R.-Y.; Bruyneel, M.; Roisman, G.; Escourrou, P. Validation of the Withings Sleep Analyzer, an under-the-mattress device for the detection of moderate-severe sleep apnea syndrome. J. Clin. Sleep Med. 2021, 17, 1217–1227. [Google Scholar] [CrossRef]
- Locihová, H.; Axmann, K.; Žiaková, K.; Šerková, D.; Černochová, S. Sleep quality assessment in intensive care: actigraphy vs. Richards-Campbell sleep questionnaire. Sleep Sci. 2020, 13, 235–241. [Google Scholar] [CrossRef]
- Association, WM. World Medical Association Declaration of Helsinki: ethical principles for medical research involving human subjects. Jama. 2013;310(20):2191-4. [CrossRef]
- Dorsch JJ, Martin JL, Malhotra A, Owens RL, Kamdar BB, editors. Sleep in the intensive care unit: strategies for improvement. Seminars in respiratory and critical care medicine; 2019: Thieme Medical Publishers.
- Birdja, D.; Özcan, E. Better Sleep Experience for the Critically Ill: A Comprehensive Strategy for Designing Hospital Soundscapes. Multimodal Technol. Interact. 2019, 3, 36. [Google Scholar] [CrossRef]
- Sinha, S.; Soneja, M.; Naik, R.D.; Gupta, K.; Elavarasi, A.; Sreenivas, V. Sleep quality and quantity in intensive care unit patients: A cross-sectional study. Indian J. Crit. Care Med. 2018, 22, 408–414. [Google Scholar] [CrossRef]
- Christina-Athanasia S, Georgios K, Athanasia L, Papageorgiou D. SLEEP QUALITY AND CIRCADIAN RHYTHM DISRUPTION IN CRITICALLY ILL PATIENTS IN INTENSIVE CARE UNIT. medRxiv. 2024:2024.09. [CrossRef]
- Zhang, Y.; Zhang, Y.; Teng, M.; Wang, B.; Cheng, M.; Zhong, S.; Zhang, X.; Ding, X.; Liu, C.; Ma, J. Study on the Sleep Quality Classification and Influencing Factors of Adult ICU Awake Patients Based on Latent Profile Analysis: A Cross-Sectional Survey. Nat. Sci. Sleep 2023, 15, 861–871. [Google Scholar] [CrossRef]
- Talvacchia, K. Implementation of a Nonpharmacological Sleep Bundle in a Surgical Intensive Care Unit. 2024.
- Works HP, NY N, Rupa O, Patient F. The science of sleep: Functional medicine for restorative sleep. Science. 2023.
- Nilius, G.; Richter, M.; Schroeder, M. Updated Perspectives on the Management of Sleep Disorders in the Intensive Care Unit. Nat. Sci. Sleep 2021, ume 13, 751–762. [Google Scholar] [CrossRef]
- Romagnoli, S.; Villa, G.; Fontanarosa, L.; Tofani, L.; Pinelli, F.; De Gaudio, A.R.; Ricci, Z. Sleep duration and architecture in non-intubated intensive care unit patients: an observational study. Sleep Med. 2020, 70, 79–87. [Google Scholar] [CrossRef]
- Boyko, Y.; Jennum, P.; Toft, P. Sleep quality and circadian rhythm disruption in the intensive care unit: a review. Nat. Sci. Sleep 2017, ume 9, 277–284. [Google Scholar] [CrossRef]
- Delaney, L.J.; Litton, E.; Melehan, K.L.; Huang, H.-C.C.; Lopez, V.; Van Haren, F. The feasibility and reliability of actigraphy to monitor sleep in intensive care patients: an observational study. Crit. Care 2021, 25, 1–12. [Google Scholar] [CrossRef]
- Bigué, J.L.; Duclos, C.; Dumont, M.; Paquet, J.; Blais, H.; Menon, D.K.; Bernard, F.; Gosselin, N. Validity of actigraphy for nighttime sleep monitoring in hospitalized patients with traumatic injuries. J. Clin. Sleep Med. 2020, 16, 185–192. [Google Scholar] [CrossRef]
- Conley, S.; Knies, A.; Batten, J.; Ash, G.; Miner, B.; Hwang, Y.; Jeon, S.; Redeker, N.S. Agreement between actigraphic and polysomnographic measures of sleep in adults with and without chronic conditions: A systematic review and meta-analysis. Sleep Med. Rev. 2019, 46, 151–160. [Google Scholar] [CrossRef]
- Figorilli, M.; Velluzzi, F.; Redolfi, S. Obesity and sleep disorders: A bidirectional relationship. Nutr. Metab. Cardiovasc. Dis. 2025, 35, 104014. [Google Scholar] [CrossRef]
- Carneiro, G.; Zanella, M.T. Obesity metabolic and hormonal disorders associated with obstructive sleep apnea and their impact on the risk of cardiovascular events. Metabolism 2018, 84, 76–84. [Google Scholar] [CrossRef]
- Altman, M.T.; Knauert, M.P.; Pisani, M.A. Sleep Disturbance after Hospitalization and Critical Illness: A Systematic Review. Ann. Am. Thorac. Soc. 2017, 14, 1457–1468. [Google Scholar] [CrossRef]
Figure 1.
Area under ROC curve, a. Sleep latency, b. Sleep duration, c. Interruption, d. Sleep depth, e. Sleep regularity, f. Score total.
Figure 1.
Area under ROC curve, a. Sleep latency, b. Sleep duration, c. Interruption, d. Sleep depth, e. Sleep regularity, f. Score total.
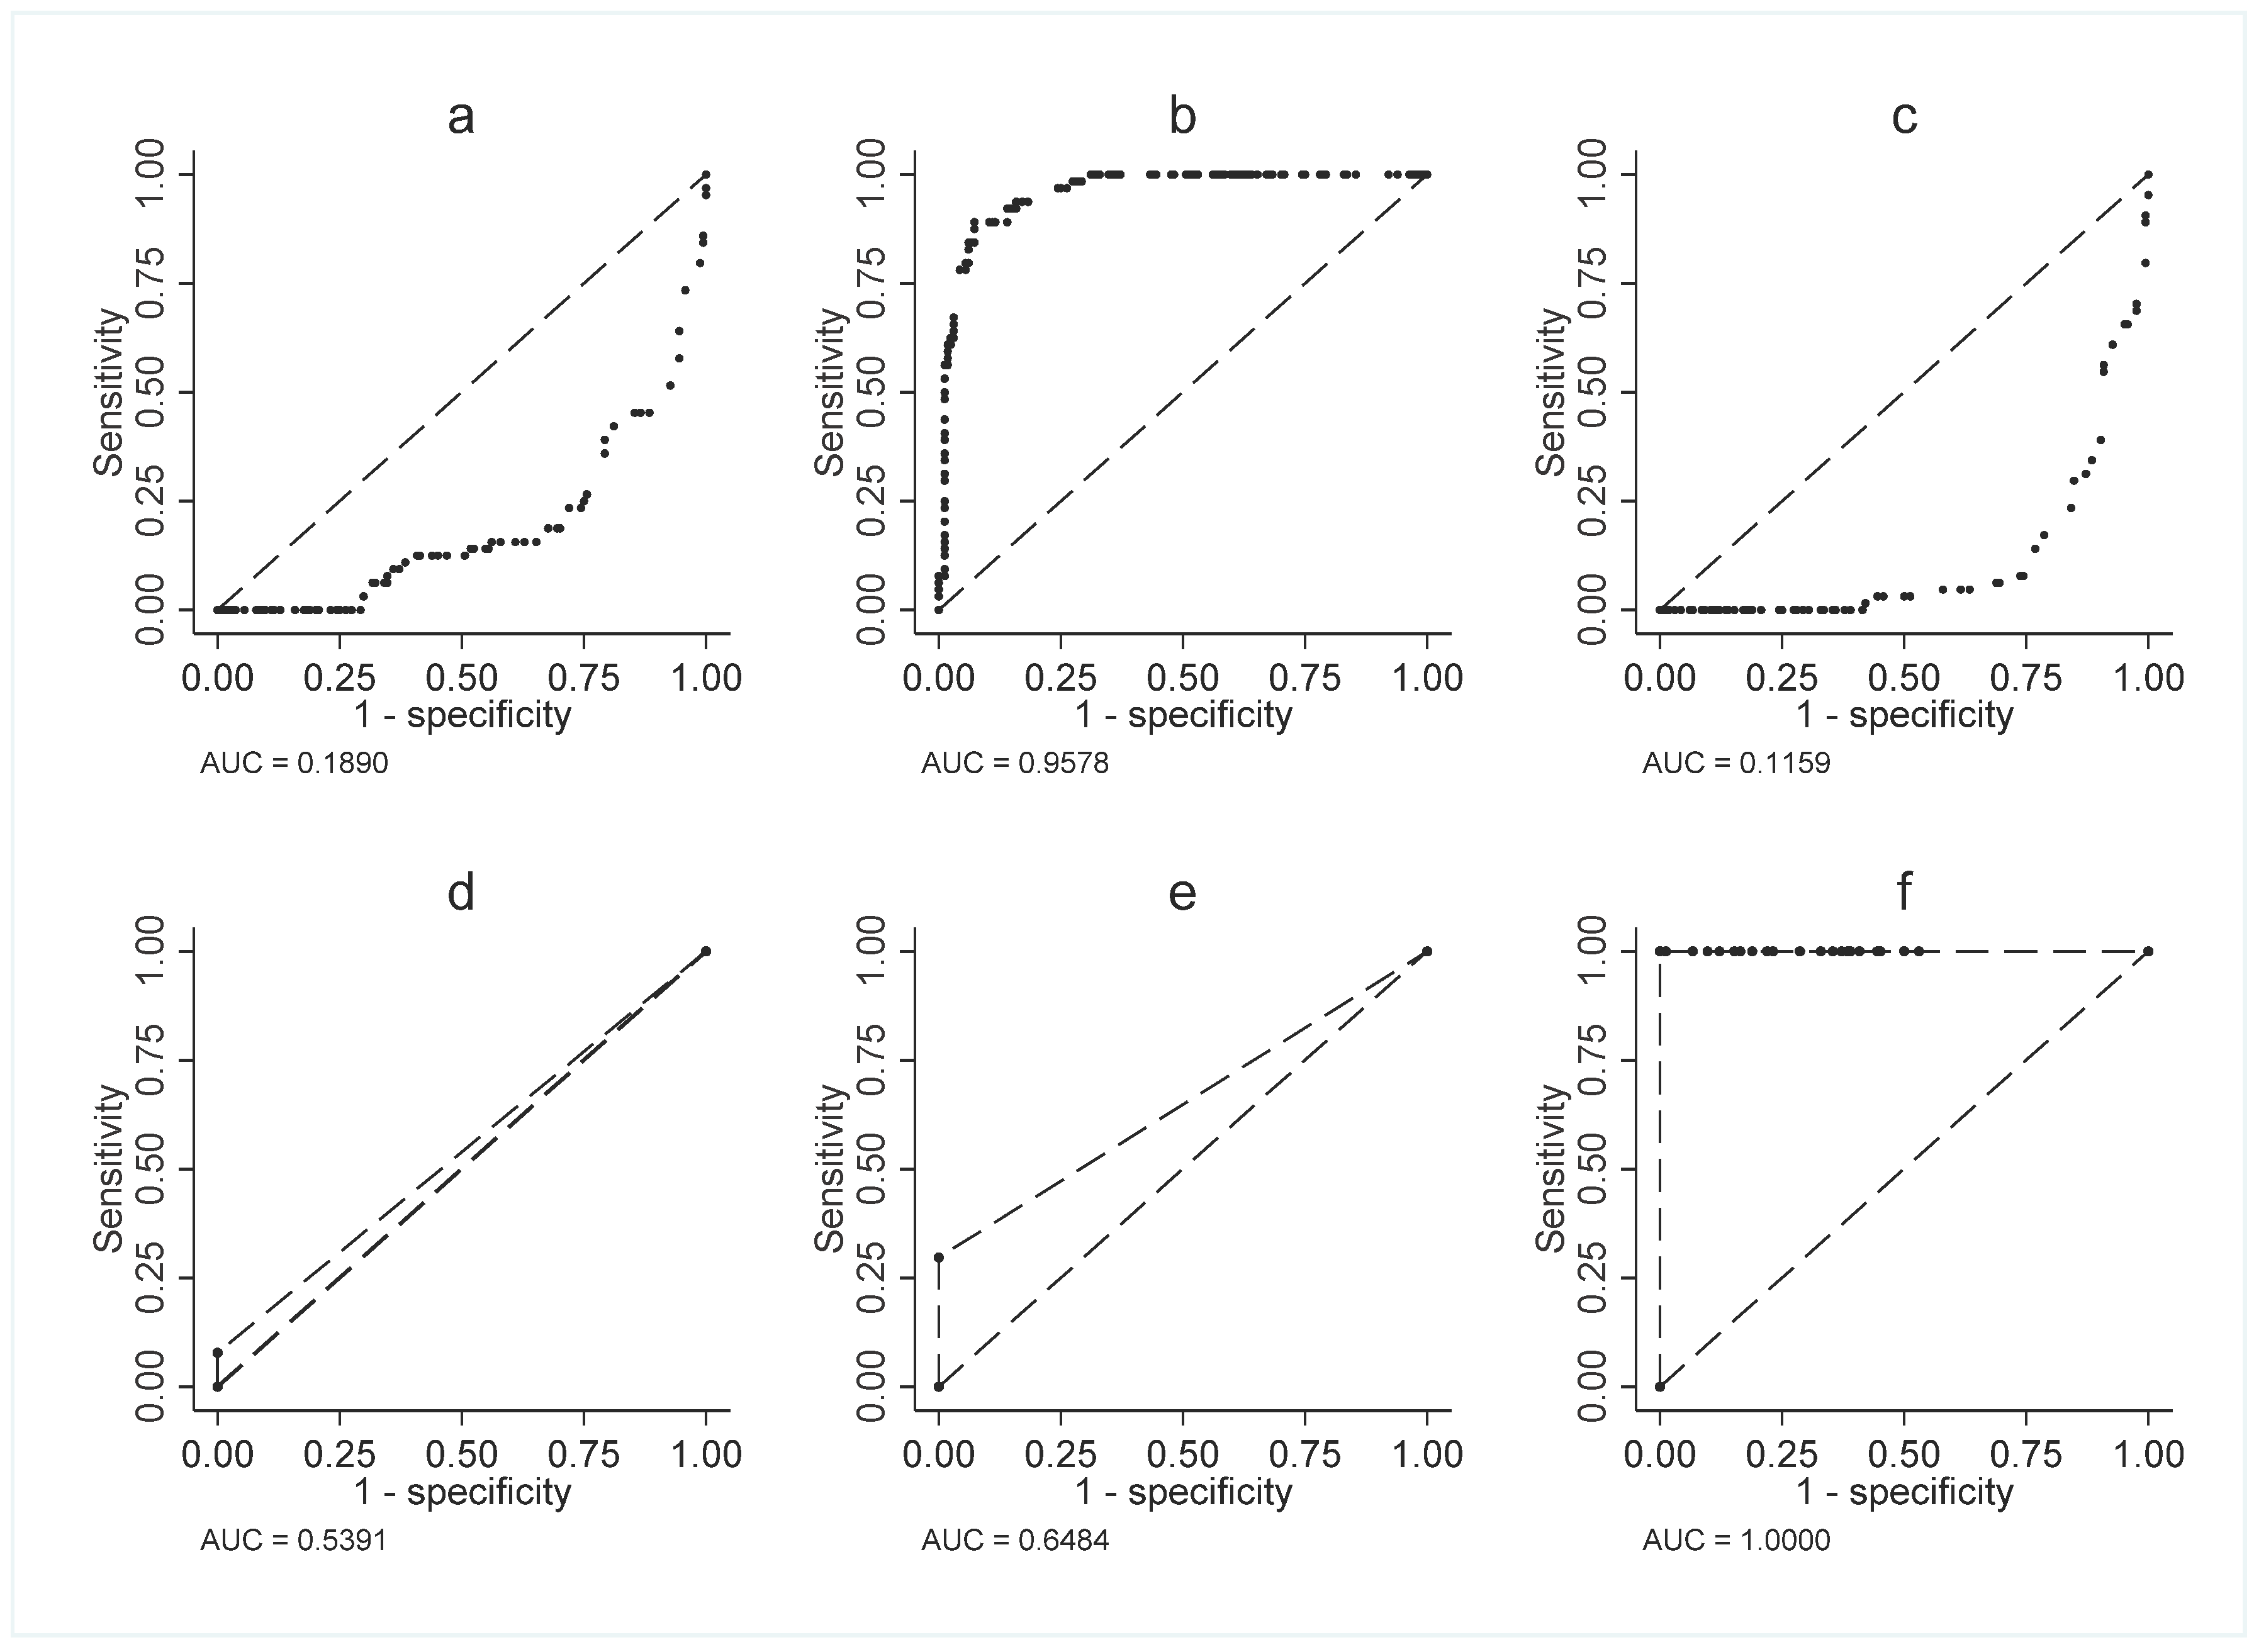

Table 2.
Descriptive statistics of key characteristics and variables of the sample (n = 228).
| Variables | Mean ± SD | |
|---|---|---|
| Patients | Age [Years] | 54,25 ± 16,76 |
| BMI [kg/m²] | 23,13 ± 4,86 | |
| Pain-score VAS (Visual Analogue Scale) | 4,07 ± 3,24 | |
| Charlson score | 1,25 ± 1,37 | |
| SOFA score | 0,73 ± 0,85 | |
| APACHE II score | 10,66 ± 5,76 | |
| Length of Stay [Days] | 5,44 ± 2,53 | |
| RCSQ | Sleep Depth [Score] | 39,03 ± 22,43 |
| Sleep Latency [Score] | 35,71 ± 21,44 | |
| Number of Sleep Interruptions | 40,32 ± 20,03 | |
| Return to Sleep After Awakening [Score] | 38,88 ± 18,81 | |
| Perceived Sleep Quality [Score] | 38,93 ± 17,12 | |
| Noise [Score] | 33,23 ± 17,72 | |
| RCSQ Total [Score] | 38,16 ± 17,09 | |
| Actigraphy | Sleep Onset Latency [min] | 39,23 ± 22,09 |
| Total Sleep Time [min] | 198,15 ± 128,42 | |
| Number of Sleep Interruptions | 52,28 ± 24,85 | |
| Overall Sleep Quality [score] | 37,03 ± 19,2 |
Table 3.
ROC Analysis of AM-RCSQ and Actigraphy Parameters for Sleep Discrimination among Participants (n = 228).
Table 3.
ROC Analysis of AM-RCSQ and Actigraphy Parameters for Sleep Discrimination among Participants (n = 228).
| Variable | Cut-off value a | Youden’s statistic | AUC (SD) b | p-value c | Sensitivity (%) | Specificity (%) | Accuracy (%) | |
|---|---|---|---|---|---|---|---|---|
| RCSQ | Sleep Depth | 53 | 0.6711 | 0.84 (0.0204) | < 0.001 | 82.00 | 85.00 | 82.46 |
| Sleep Latency | 43 | 0.7173 | 0.86 (0.0130) | < 0.001 | 92.00 | 80.00 | 82.02 | |
| Number of Awakenings | 57 | 0.6940 | 0.85 (0.0257) | < 0.001 | 76.00 | 94.00 | 89.04 | |
| Return to Sleep After Awakening | 53 | 0.6341 | 0.82 (0.0276) | < 0.001 | 73.00 | 90.00 | 84.65 | |
| Perceived Sleep Quality | 38 | 0.6575 | 0.83 (0.0215) | < 0.001 | 96.00 | 70.00 | 74.12 | |
| Noise | 40 | 0.6540 | 0.83 (0.0196) | < 0.001 | 82.00 | 84.00 | 73.25 | |
| Total AM-RCSQ Score | 49.4 | 1.0000 | 1.00 (0.00) | < 0.001 | 100.00 | 100.00 | 99.56 | |
| Actigraphy | Sleep Latency | 97 | 0.0000 | 0.5 (0.0314) | < 0.001 | 0.00 | 100.00 | 71.49 |
| Total Sleep Duration | 277 | 0.817 | 0.91 (0.0124) | < 0.001 | 89.00 | 93.00 | 89.47 | |
| Number of Sleep Interruptions | 124 | 0.0000 | 0.50 (0.0223) | < 0.001 | 0.00 | 100.00 | 71.49 | |
| Sleep Depth | 0 | 0.078 | 0.54 (0.0169) | < 0.020 | 08.00 | 100.00 | 0.00 | |
| Sleep Efficiency | 0 | 0.297 | 0.65 (0.2878) | < 0.001 | 30.00 | 100.00 | 0.00 | |
| Total Score (Sleep Quality) | 49 | 1.000 | 1.00 (0.0) | < 0.001 | 100.00 | 100.00 | 99.12 |
a: Cut-off value: Empirical optimal cut point. b: AUC: area under curve at cutpoint, SD: standard deviation. c: p-value of Youden’s Index.
Table 4.
Actigraphy Parameters and Clinical Characteristics by Sleep Quality Groups (n = 228).
| Variables | Mean ± SD | p | |
|---|---|---|---|
| Poor sleep quality n=164 (%=71,9) | Good sleep quality n=64 (%=28,1) | ||
| Gender | < 0.001 a | ||
| Female (n=107, %=46,9) | 94 (87,85) | 13 (12,15) | - |
| Male (n=121, %=53,1) | 70 (57,85) | 51 (42,15) | - |
| Age [Years] | 56,09 ± 16,19 | 49,52 ± 17,4 | 0,010 b |
| BMI [kg/m²] | 23,23 ± 4,96 | 22,89 ± 4,63 | 0,764 b |
| VAS score (Visual Analogue Scale) | 4,79 ± 3,12 | 2,22 ± 2,78 | < 0.001 b |
| Charlson score | 1,45 ± 1,36 | 0,77 ± 1,26 | < 0.001 b |
| SOFA score | 0,82 ± 0,86 | 0,5 ± 0,8 | 0,004 b |
| APACHE II score | 11,65 ± 5,65 | 8,14 ± 5,26 | < 0,001 b |
| Length of Stay [Days] | 5,77 ± 2,64 | 4,59 ± 1,99 | < 0,001 b |
| Sleep Onset Latency [min] | 45,2 ± 22,01 | 23,94 ± 13,21 | < 0,001 b |
| Total Sleep Time [min] | 143,07 ± 103,14 | 339,3 ± 61,34 | < 0,001 b |
| Number of Sleep Interruptions | 60,33 ± 24,35 | 31,66 ± 9,48 | < 0,001 b |
| Overall Sleep Quality [score] | 28,1 ± 13,91 | 59,92 ± 9,39 | < 0,001 b |
a: Khi² test bilateral statistical significance. b: Mann-Whitney U test bilateral statistical significance.
Table 1.
Definitions of Actigraphy Parameters.
| Actigraphy parameters | unit | Definition |
|---|---|---|
| Sleep onset latency | Minutes | The elapsed time between wakefulness inhibition and sleep onset |
| Total sleep time | Minutes | The total time spent sleeping, from sleep onset to final awakening. |
| Number of awakenings | Épisodes | The number of awakenings during the night. |
| Sleep depth | Score | Duration of the deep sleep phase (NREM Stage 3) |
| Sleep efficiency | Score | The proportion of time spent sleeping relative to time spent in bed. |
| Global sleep quality score | Score | Sleep quality, rated on a scale of 0 to 100. |
Disclaimer/Publisher’s Note: The statements, opinions and data contained in all publications are solely those of the individual author(s) and contributor(s) and not of MDPI and/or the editor(s). MDPI and/or the editor(s) disclaim responsibility for any injury to people or property resulting from any ideas, methods, instructions or products referred to in the content. |
© 2025 by the authors. Licensee MDPI, Basel, Switzerland. This article is an open access article distributed under the terms and conditions of the Creative Commons Attribution (CC BY) license (http://creativecommons.org/licenses/by/4.0/).
Copyright: This open access article is published under a Creative Commons CC BY 4.0 license, which permit the free download, distribution, and reuse, provided that the author and preprint are cited in any reuse.


