
Submitted:
12 April 2023
Posted:
13 April 2023
You are already at the latest version
Abstract
The mutton quality of Chinese Tan lambs (Ovis aries) has declined as feeding patterns have shifted from pasturing to pen rationing. Mutton quality is affected by fatty acids, and rumen microorganisms play a role in the synthesis of short-chain fatty acids, long-chain fatty acids, and conjugated linoleic acids. We used 16S rDNA sequencing to analyze the effects of two feeding patterns on the rumen bacteria of Tan lambs. In a randomized block design with 24 newborn Tan lambs, 12 lambs were fed by ewes in pasture and 12 were fed by pen-fed ewes. At 2 months, the biceps femoris and the longissimus dorsi were analyzed by gas chromatography for intramuscular fat content and fatty acid composition, and DNA in the rumen contents was extracted and used to analyze the structure of the bacterial community. Different feeding patterns had no significant effect on the intramuscular fat content of the biceps femoris and longissimus dorsi of the lambs, but there was a significant effect on fatty acid composition. Rumen bacteria were significantly more diverse in the pasture group than in the pen-ration group (P < 0.01). Twenty-one phyla were identified in the pasture group, and 14 phyla were identified in the pen-ration group. The dominant phyla in the pasture group were Bacteroidetes and Fibrobacteres; the dominant phyla in the pen-ration group were Proteobacteria and Bacteroidetes. The relative abundance of Proteobacteria was significantly higher in the pen-ration group than in the pasture group (P < 0.01). Diversity at the genus level was also higher in the pasture group, with 176 genera in the pasture group and 113 genera in the pen-ration group. The dominant genera in the pasture group were Prevotella_1, Rikenellaceae_RC9_gut_group, and Bacteroidales_BS11_gut_group_Na; the dominant genera in the pen-ration group were Prevotella_1, Prevotella_7, Succinivibrionaceae_UCG-001, and Succinivibrionaceae_NA.
Keywords:
Alpha diversity
; Beta diversity
; Mutton quality
; Pasture-fed
; Pen-fed
; Tan lambs
The rumen is a complex microbial ecosystem that plays a vital role in digestion and the maintenance of health in ruminants (Zened et al., 2013). Many substances that cannot be used directly by ruminants are converted into accessible nutrients through fermentation in the rumen. At birth, the ruminant is free of bacteria, fungi, protozoa, and other microorganisms. Diet and age simultaneously drive changes in the structure and abundance of bacterial communities in the developing rumen (Juliana et al., 2017). With the intake of milk and contact with the environment, microorganisms begin to appear in the rumen and then multiply. The development of the structure and function of the rumen microbial community in juveniles directly affects the production of adults.
Rumen microbial metabolites are closely related to the fat metabolism of the host (Rui et al.,2020) The short-chain fatty acids produced by rumen microbial fermentation is an important factor affecting the de nove synthesis of fatty acid (Shingfield et al., 2013). Biohydrogenation by rumen microbial metabolism affect the transformation of polyunsaturated fatty acids to saturated fatty acids (Bessa et al., 2000,Jenkins et al., 2007). Fatty acid metabolism in the rumen has a major influence on the fatty acid composition of ruminant meats and milk and also affects the synthesis of flavor substances (Jenkins et al., 2007; Wang et al., 2019). The content and composition of fat largely determine the color, tenderness, juiciness and flavor of meat (Okeudo et al.,2005,Zappaterra et al.,2016).
Studies in yaks have found that dietary changes affect the expression abundance of fatty acid synthesis genes and fatty acid transport genes, and affect intramuscular fat deposition and meat quality(Kang et al.,2020).The meat quality of Tan mutton decreased from grazing to pen-ration feeding.The diversity of rumen flora of Tan sheep changed under grazing conditions (Fu et al., 2020).Microorganisms have an important influence on the quality of ruminant meat, but comparative studies of the diversity of the rumen microbiome of Tan lambs under pasture and pen-ration conditions have not been reported.
We studied similarities and differences in 2-month-old Tan lambs raised under different feeding patterns to explore the effect of feeding pattern on the rumen microbe and fatty acid composition of Tan lambs.
1. Material and Methods
1.1. Experimental Design
The experimental procedure was approved by the Institutional Animal Care and Use Committee at Ningxia University (NXU1074901). 24 healthy newborn Tan lambs were selected, according to the birth date, body weight, fat and hair color, the experimental sheep were randomly divided into 2 treatments: pasture group and pen-ration group. The lambs in the pasture group followed the grazing lactating ewe to suckle and could freely eat the pasture grass. The composition of the pasture grass was 40% Astragalus adsurgens(Crude protein 18.18%, crude fat 2.73%, crude fiber 24.09%), 20% Lespedeza davurica(Crude protein 5.12%, crude fat 2.32%, crude fiber 10.29%), 5% Sophora alopecuroides(Crude protein 23.12%, crude fat 3.15%, crude fiber 33.26%), 10% Caragana korshinskii(Crude protein 22.19%, crude fat 4.91%, crude fiber 27.78%), 10% Glycyrrhizae radix(Crude protein4.87%, crude fat 4.13%, crude fiber 36.65%), and 10% Achnatherum splendens(Crude protein 20.56%, crud fat 2.21%, crude fiber 38.65%). Lambs in the pen-ration group were fed with lactating ewes in the stable. And all experimental lamb were free to eat the starter at 3 weeks old. The composition of the starter is shown in Table 1.
1.2. Sample Collection
At the age of 2 months, five Tan lambs in each group were randomly selected and slaughtered according to the standard procedure at the Institutional Animal Care and Use Committee at Ningxia University. The rumen was removed immediately after slaughter, and 50 mL of its contents was collected and mixed.The samples were put into a cryopreservation tube and stored at -80°C.The carcasses were then chilled at 4 °C for24h. After 24h in the chilling room, and they were transferred to the laboratory for dissection under refrigerated conditions.Then 10 g biceps femoris(Biceps femoris was removed from the topsides and visible fat and connective tissue were trimmed) and 10 g longissimus dorsi(A muscular longissimus dorsi area was generated between ribs 12 and 13 on the left sliced surface) were cut with surgical scissors, The muscle were vacuum packed and stored in the freezer at -80℃ until further analysis .
1.3. Determination of Fat and Fatty Acids
Fat was extracted from the samples with the chloroform-methanol method (Folch et al., 1957) and saponified with NaOH. Then boron trifluoride-methanol solution was used to methyl-esterify the saponified fatty acids (Wijngaarden, 1967), which were then analyzed by gas chromatography (Agilent, 7820a), Gas phase condition: capillary column db-23, 60.00mm × 0.25mm × 0.15mm, temperature programmed, keep 140 ℃ for 1min after injection, then rise to 175 ℃ at 80 ℃ / min, and then rise to 230 ℃ at 1 ℃ / min for 2min. The inlet temperature is 250 ℃, the detector temperature is 250 ℃, the split ratio is 50:1, and the injection volume is 1μL. The data were initially sorted in Excel 2010. Then, the random block design in SAS8.2 statistical software was used to compare the differences between groups. P < 0.05 means significant difference, P < 0.01 means extremely significant.
1.4. DNA Extraction of Rumen Bacterial
The rumen contents were transferred to a centrifuge bottle containing CO2 to maintain anaerobic conditions and kept on ice for no more than 20 min prior to processing. Cooling samples with ice does not affect the sample or subsequent analysis (Wu et al., 2010). The rumen contents were centrifuged at 10,000 g, and the precipitate was dissolved in extraction buffer (100 mM Tris-HCl, 10 mM ethylenediaminetetraacetic acid, 0.15 M NaCl; pH 8.0). A total of 1 g precipitate was dissolved in 4 mL buffer and incubated with the rumen contents at 4°C for 1 h to maximize the release of particle-associated bacteria by cooling (Dehority and Grubb, 1980). The suspension was centrifuged at 500 g for 15 min at 4°C to remove broken plant particles while keeping the bacterial cells suspended, then passed through a four-layer cheesecloth, centrifuged (10,000 g, 25 min, 4°C), and stored at –20°C until DNA extraction.
We extracted DNA from pretreated rumen contents using the E.Z.N.A. stool DNA Kit ( USA, Norcross, Omega Biotek) according to the manufacturer’s protocols and stored it at –20°C. The quantity and quality of the DNA was measured with NanoDrop 2000 (Thermo Fisher Scientific, Wilmington, Del., USA).
1.5. 16S rDNA Gene PCR and Sequencing
The 16S rDNA V3–V4 region of the eukaryotic ribosomal RNA gene was amplified by PCR (95°C for 2 min; followed by 27 cycles at 98°C for 10 s, 62°C for 30 s, and 68°C for 30 s; and a final extension at 68°C for 10 min) using primers 341F: CCTACGGGNGGCWGCAG and 806R: GGACTACHVGGGTATCTAAT, where the barcode was an eight-base sequence unique to each sample. PCR reactions were performed in triplicate 50 µL mixture containing 5 µL 10× KOD buffer, 5 µL 2.5 mM dNTPs, 1.5 µL of each primer (5 µM), 1 µL KOD polymerase, and 100 ng template DNA.
The 16S rDNA was sequenced with the Hiseq2500 PE250 platform (Guangzhou Gene Denovo Technology, Guangzhou, China; Caporaso et al., 2010).
1.6. Number of Operational Taxonomic Units (OTUs) and Species Classification of Rumen Bacterial
1.6.1. Number of OTUs
We clustered effective tags into OTUs of ≥97% similarity using UPARSE pipeline (Edgar, 2013). The tag sequence with the highest abundance was selected as a representative sequence of the cluster. Between-groups Venn analysis was performed in R to identify unique and common OTUs. The multiple comparison for the OTUs analysis were applied using the LSD method (least significance difference test) analyzed by completely random analysis of variance in SAS (V8.2).
1.6.2. Species Classification
The two groups of samples were divided into species classification trees according to the distribution of each level. Assessments of the differences in dominant species in different samples and multiple sequence alignment were conducted with MUSCLE (V3.8.31; Edgar, 2004).
1.7. Analysis of Rumen Bacterial Alpha Diversity
Chao1, Simpson, and all other alpha diversity indices were calculated in QIIME (version 1.9.1; Caporaso et al., 2010). Comparisons of OTU and alpha index among groups were performed with the random block design in SAS8.2 statistical software was used to compare the differences between groups. P < 0.05 means significant difference, P < 0.01 means extremely significant.
1.8. Analysis of Rumen Bacterial Beta Diversity
Beta diversity analysis was used to evaluate differences in samples in terms of species complexity. The beta diversity of both weighted and unweighted UniFrac was calculated with QIIME (version 1.9.1).
Cluster analysis was preceded by principal component analysis, which was performed to reduce the dimension of the original variables using the FactoMineR and ggplot2 packages in R (version 2.15.3).
Unweighted pair-group method with arithmetic means (UPGMA) clustering was performed as a type of hierarchical clustering to interpret the distance matrix using the average linkage and was performed in QIIME (version 1.9.1).
1.9. Correlation Analysis
The pearson correlation coefficient between every level of bacteria and fatty acid were calculatedin R (V3.5.1). The network analysis was performed using igraph package in R.
2. Results
2.1. Fat and Fatty Acids
There was no significant difference in intramuscular fat(IMF)content between the biceps femoris and longissimus dorsi of Tan lambs. According to the results for 19 fatty acids in the biceps femoris and longissimus dorsi of Tan lambs in the two feeding conditions (Table 2). the content of C6, C12, C13, C14:1, C15 and C16 fatty acids was significantly higher in the biceps femoris of Tan lambs in the pen-ration group than the pasture group (P < 0.05). the content of C6, C11, C13, C14:1 and C16 fatty acids was significantly higher in the longissimus dorsi of Tan lambs in the pen-ration group than in the pasture group (P < 0.05). The fatty acids c18:2n6c, c18:3n3, c20:4n6, c20:5n3 and c22:6n3were significantly higher in the biceps femoris and longissimus dorsi of the pasture group than the pen-ration group (P < 0.05). Different feeding patterns had no significant effect on the intramuscular fat content of the biceps femoris and longissimus dorsi of Tan lambs, but there was a significant effect on fatty acid composition.
2.2. Number of OTUs and Species Classification
2.2.1. Number of OTUs
When the microbial community of the two different habitats was analyzed, the distribution of some species was similar, and the distribution of others was specific to one or the other habitat to a certain extent. As shown in the Venn diagram in Figure 1, there were 2520 OTUs of rumen bacteria in the pasture group and 1249 in the pen-ration group. Of these OTUs, 792 were found in both groups. The number of OTUs of rumen bacteria was significantly higher in the pasture group than in the pen-ration group (Table 3). Thus, the microbial diversity of rumen fluid was significantly higher in the pasture group than in the pen-ration group.
2.2.2. Species Classification
In the classification tree for rumen contents, Proteobacteria were found mostly in the pen-ration group, whereas almost all Verrucomicrobia and Fibrobacteres were in the pasture group (Figure 2).
2.3. Diversity of the Rumen Microbiome
2.3.1. Alpha Diversity
OTU Rarefaction Curve and Shannon Rarefaction Curve
when the sequence depth reached 75,000 reads, the two groups of curves tended to flatten, which indicates that the current sequence depth was sufficient to cover all species in the sample and for the analysis of sample microbial diversity.
Analysis of Alpha Diversity
Alpha diversity, or the diversity in a particular habitat or ecosystem, can indicate the degree of isolation of the habitat based on the species. As shown in Table 3, the sample coverage rate was greater than 99%, which indicates that the sample collection was sufficient to reflect the diversity of the rumen microbiome. The ACE index and Chao1 index were significantly higher in the pasture group than in the pen-ration group (P < 0.01), which indicates that the richness of the rumen microbiome was greater in the pasture group than in the pen-ration group. The Shannon index and Simpson index were also greater in the pasture group than in the pen-ration group, which indicates that the diversity of rumen bacteria was significantly higher in the pasture group than in the pen-ration group (P < 0.01).
2.3.2. Beta Diversity
Beta Diversity Index
The distance between samples in the pen-ration group was 0.3 to 0.4; thus, no significant difference in bacteria was detected among samples in this group. The control distance in the pasture group was 0.2 to 0.4, which indicates that bacteria were less homogeneous in the pasture group than in the pen-ration group (Figure 3). Regarding the presence or absence of species in the two groups, the distance value of the pasture group was higher than that of the pen-ration group, which indicates that the diversity of rumen bacteria was greater in the pasture group than in the pen-ration group. After we weighted for abundance, the difference among microbiota in both groups was further reduced. Thus, the distance between samples was 0.0 to 0.1 in the pen-ration group and 0.1 to 0.3 in the pasture group.
Principal Component Analysis
As shown in Figure 4, the abscissa is the first principal component, and the ordinate is the second principal component. On the abscissa, the samples of the two feeding groups were completely separate and distinct, which indicates that the structure of the bacteria was different between the two groups. In the diagram for the whole cluster analysis, in the first principal factor (70.4%) and second principal factor (3.2%), the distribution of samples in the pen-ration group was concentrated, and the distribution of samples in the pasture group was dispersed; the two groups of samples were completely separate in the first principal factor. This shows that the uniformity of the pen-ration group was high, the uniformity of the pasture group was poor, and the difference between the two groups was obvious.
UPGMA Cluster Analysis
At the phylum level in the UPGMA classification tree, the relative abundance of Bacteroidetes and Fibrobacteres was significantly higher in the pasture group than in the pen-ration group (Figure 5), and these phyla were the dominant bacteria in the rumens of the pasture group of Tan lambs. Proteobacteria and Bacteroidetes were the dominant bacteria in the rumens of the pen-ration group. The relative abundance of Proteobacteria was significantly higher in the pen-ration group than in the pasture group (P < 0.01). At the genus level, the relative abundance of Succinivibrionaceae_UCG-001 and Prevotella_7 was significantly higher in the pen-ration group than in the pasture group (P < 0.01; Figure 6), whereas the relative abundance of Rikenellaceae_RC9_gut_group, Fibrobacter, and Treponema was higher in the pasture group than in the pen-ration group.
2.4. Analysis of the Structure of Rumen Bacteria
2.4.1. Phylum Level
Among the dominant phyla (Table 4), the relative abundance of Bacteroidetes, Verrucomicrobia, and Proteobacteria was significantly higher in the pasture group than in the pen-ration group (P < 0.01), and the relative abundance of Firmicutes and Fibrobacteres was significantly higher in the pen-ration group than in the pasture group (P < 0.05).
2.4.2. Genus Level
With further refinement of the classification to the genus level, we identified 199 genera from the rumen communities of the two feeding groups, including 176 genera in the pasture group and 113 genera in the pen-ration group. Only 38 genera were identified with relatively high abundance, accounting for more than 92% of the total genera in each sample (Table 5). The relative abundance of Prevotella and Succinivibrionaceae_UCG-001 and Succinivibrionaceae_NA was significantly higher in the pen-ration group than in the pasture group (P < 0.01, P < 0.05). The relative abundance of Prevotellaceae_UCG-003, Prevotellaceae_NK3B31_group, Rikenellaceae_RC9_gut_group, NA, Ruminococcus_1, Ruminococcus_2, Treponema_2, Christensenellaceae_R-7_group, Ruminococcus_1, and Butyrivibrio_2 was significantly higher in the pasture group than in the pen-ration group (P < 0.01). In addition, the relative abundance of Fibrobacter, Succinivibrionaceae_UCG-002 was significantly higher in the pasture group than in the pen-ration group (P < 0.05).
2.5. Correlation Analysis
The contents of c18:3n3 and c20:5n3 in the two muscles were positively correlated with the relative abundance of Tenericutes and Bacteroidetes (R2 > 0.75) and negatively correlated with Proteobacteria (R2 < –0.75) (Figure 7 and Figure 8).The contents of c18:3n3 and c20:5n3 in the two muscles were positively correlated with Christensenellaceae_R-7_group, Ruminococcaceae_NK4A214_group, Butyrivibrio_2, Saccharofermentans, Lachnospiraceae_NK4A136_group, Anaerovorax, coprostanoligenes_group, probable_genus_10, Ruminococcaceae_UCG-005, and Prevotellaceae_Ga6A1_group (R2 > 0.75) and negatively correlated with Succinivibrionaceae_UCG-001 (R2 < –0.75) (Figure 9 and Figure 10). The correlations between c18:2n6c, C14, C6, C15, C12, C16:1, and C16 and the above-mentioned bacteria were the opposite.
3. Discussion
In our experiments, there was no significant difference in intramuscular fatcontent. González-Calvo et al.(2015)reported that the IMF content did not differ with the dietary treatment, the experimental lamb weight was 22 to 24 kg before slaughtering. Nie et al.(2022)that supplemental probiotics can affect muscle fibre characteristics, increase intramuscular fat deposition, the target slaughter weight of experimental lamb was assumed as 30 kg .It is speculated that in addition to the dietary pattern, the growth stage is also an important factor affecting the intramuscular fat deposition of sheep, in this study , the experimental sheep were slaughtered at 2 months.Lamb age may be influenced by variation in the maturation patterns of the individual muscles and therefore IMF%(Anderson et al., 2015).
Hollo et al. (2005) reported that the content of polyunsaturated fatty acid in fat samples from Hungarian Grey and Holstein Friesian bulls changed differently because of different diets. In our experiments, The fatty acids c18:2n6c, c18:3n3, c20:4n6, c20:5n3 and c22:6n3were significantly higher in the biceps femoris and longissimus dorsi of the pasture group than the pen-ration group. Ekiz et al. (2013) found differences in intramuscular fat and fatty acid content in 45 Kivircik lambs under different feeding conditions: Lambs of U-W-G (n = 12) were kept together with the main flock and grazed on pasture in the daytime, they and the pasture group had similar feeding conditions, and 18:3n3 and c20:5n3 were higher than for the other feeding patterns. Grazing feeding is more conducive to the synthesis of polyunsaturated fatty acid of meat in Tan lambs.
Rumen microbial bacteria mainly include bacteria, anaerobic fungi, and protozoa (Xie et al., 2018), of which bacteria are the most abundant. but such that18:3n3 and c20:5n3, which are related to the biological hydrogenation of rumen microorganisms.In this study, indices of rumen bacterial richness (ACE index, Chao1 index) and diversity (Shannon index, Simpson index) were significantly lower in the pen-ration group than in the pasture group. This is consistent with previous research. For example, Grilli et al. (2016) found that a high-grain diet simplified and reduced the diversity index of the rumen microbiome. Moreover, Yáñez-Ruiz et al. (2010) found that the structure and composition of rumen microbial bacteria are related to diet type. In one study, there were fewer rumen bacteria in lambs fed a high-concentrate diet than in pasturing lambs, which shows that the high-concentrate diets was negatively correlated with the microbial composition of the rumen (Ji et al., 2016). different feeding patterns significantly affected the abundance of dominant bacteria in the rumens of these Tan lambs. We found that The relative abundance of Succinivibrionaceae_UCG-001 and Succinivibrionaceae_NA was significantly higher in the pen-ration group than in the pasture group(0.455% vs 39.047%; 0.099% vs 6.378%). The lambs fed a linseed diet showed decreased amounts of ruminal Fibrobacter succinogenes(Fei Li et al.,2020 ),and intake of the linseed diet for 28 d was sufficient to obtain a desirable n-6 PUFA to n-3 PUFA ratio in the muscle of lambs.Succinivibrionaceae plays an important role in the process of fatty acid hydrogenation, hydrogenating unsaturated fatty acids and reducing the content of unsaturated fatty acids(Bessa et al., 2000,Jenkins et al., 2007). rapeseed or linseed oil administration to sheep rations modified polysaccharidase activities in the rumen(Małgorzata P et al., 2020). Yang et al. (2015) showed that adding roughage to calf granules significantly increased the abundance of R. albus, B. fibrisolvens, Ruminobacter amylophilus, and Lactobacillus in the rumen. In our experiments,the abundance of Succinivibrionaceae_UCG-001 and Succinivibrionaceae_NA in the rumens of Tan lambs significantly reduced in grazing feeding group,and therefore, the fatty acids c18:2n6c, c18:3n3, c20:4n6, c20:5n3 and c22:6n3were significantly higher in the biceps femoris and longissimus dorsi of the pasture group than the pen-ration group. higher proportions of C20:4 n-6, C20:5 n-3 and C22:5 n-3 and higher indices for elongation and desaturation activity in the intramuscular fat of lambs in different pasture(M. Lourenco et al., 2007).
The Butyrivibrio group, has been well documented to be the main bacterium involved in the ruminal biohydrogenation of PUFAs.The abundance of the genus Butyrivibrio_2 and Butyrivibrio fibrisolvens increased in rumen of lambs of linseed diet (Fei Li et al.,2020 ).Similar results were reported by Yoshimura et al. (2018) in dairy cow.in this study we found that Butyrivibrio_2 was significantly higher in the pasture group than in the pen-ration group,however, The abundance of Butyrivibrio is less than 0.5%. The Lachnobacterium plays an important role on the biological hydrogenation of rumen microorganisms(Olinda et al., 2022).in the current study,we found that the abundance of Lachnospiraceae_XPB1014_group and Lachnospiraceae_NK4A136_group was significantly higher in the pasture group than in the pen-ration group,but, the abundance of them are less than 1% respectively. Compared with the 39% abundance of Succinivibrionaceae_UCG-001 of rumen in tan sheep of pen-ration feeding, which will play a major role in he biological hydrogenation of rumen microorganisms,and so,the contents of polyunsaturated fatty acid were not been biohydrogenated in the muscles of the Tan lambs .
4. Conclusions
The diversity of rumen bacteria was significantly higher in a pasture group of Tan lambs than in a pen-ration group. the contents of polyunsaturated fatty acid were significantly higher in the muscles of the Tan lambs in the grazing group, and the abundance of Succinivibrionaceae_UCG-001 and Succinivibrionaceae_NA, which are involved in rumen biohydrogenation, was higher in the pen-ration group.
Acknowledgments
This work was funded by the National Nature Science Foundation of China (Grant No. 31660668), Ningxia Natural Science Foundation (Grant No.2021AAC03104).
References
- Anderson, F.; Pannier, L.; Pethick, D.; Gardner, G. Intramuscular fat in lamb muscle and the impact of selection for improved carcass lean meat yield. Animal 2015, 9, 1081–1090. [Google Scholar] [CrossRef] [PubMed]
- Bessa, R.; Santos-Silva, J.; Ribeiro, J.; Portugal, A. Reticulo-rumen biohydrogenation and the enrichment of ruminant edible products with linoleic acid conjugated isomers. Livest. Prod. Sci. 2000, 63, 201–211. [Google Scholar] [CrossRef]
- Caporaso, J.G.; Kuczynski, J.; Stombaugh, J.; Bittinger, K.; Bushman, F.D.; Costello, E.K.; Fierer, N.; Gonzalez Peña, A.; Goodrich, J.K.; Gordon, J.I.; et al. QIIME allows analysis of high-throughput community sequencing data. Nat. Methods 2010, 7, 335–336. [Google Scholar] [CrossRef] [PubMed]
- Edgar, R.C. MUSCLE: Multiple sequence alignment with high accuracy and high throughput. Nucleic Acids Res. 2004, 32, 1792–1797. [Google Scholar] [CrossRef]
- Edgar, R.C. UPARSE: highly accurate OTU sequences from microbial amplicon reads. Nat. Methods 2013, 10, 996–998. [Google Scholar] [CrossRef] [PubMed]
- Ekiz, B. , Demirel, G., Yilmaz, A., Ozcana, M., Yalcintana, H., Kocaka, O., Altinel, A., 2013. Slaughter characteristics, carcass quality and fatty acid composition of lambs under four different production systems. Small Ruminant Research. 114(1), 26–34.
- Folch, J.; Lees, M.; Stanley, G.H.S. A simple method for the isolation and purification of total lipides from animal tissues. J. Biol. Chem. 1957, 226, 497–509. [Google Scholar] [CrossRef] [PubMed]
- Fu, Z.; Xu, X.; Zhang, J.; Zhang, L. Effect of different feeding methods on rumen microbes in growing Chinese Tan sheep. Rev. Bras. de Zootec. 2020, 49. [Google Scholar] [CrossRef]
- Gao, J.; Wang, M.-Z.; Jing, Y.-J.; Sun, X.-Z.; Wu, T.-Y.; Shi, L.-F. Impacts of the unsaturation degree of long-chain fatty acids on the volatile fatty acid profiles of rumen microbial fermentation in goats in vitro. J. Integr. Agric. 2016, 15, 2827–2833. [Google Scholar] [CrossRef]
- Grilli, D.J. , Fliegerová, K., Kopečný, J., PaezLama, S., Egea, V., Sohaefer, N., Pereyra, C., Ruiz, M.S., Sosa, M.A., Arenas, G.N., Mrázek, J., 2016. Analysis of the rumen bacterial diversity of goats during shift from forage to concentrate diet. Anaerobe. 42, 17–26.
- Holl, G. , Nuernberg, K., Repa, I., Holl, I., Seregi, J., Pohn, G., Ender, K., 2005. Effect of feeding on the composition of the intramuscular fat in longissimus muscle and different fatty tissues of Hungarian Grey and Holstein Friesian bulls. 1. Fatty acid profile. Archiv Fur Tierzucht. 48(6), 537–546.
- Jenkins, T.C.; Wallace, R.J.; Moate, P.J.; Mosley, E.E. BOARD-INVITED REVIEW: Recent advances in biohydrogenation of unsaturated fatty acids within the rumen microbial ecosystem1. J. Anim. Sci. 2008, 86, 397–412. [Google Scholar] [CrossRef]
- Ji, S.K. , Jiang, C.G., Li, R., Diao, Q.Y., Tu, Y.N., Zhang, N.F., Si, B.W., 2016. Growth performance and rumen microorganism differ between segregated weaning lambs and pasturing lambs. Journal of Integrative Agriculture. 15, 872–878.
- Juliana, D. , Marcos, I.M., Melline, F.N., Rafael, T.R., Fernanda, S.M., Hilrio, C.M., Kimberly, A.D.M., Garret, S., 2017. Effect of pre-weaning diet on the ruminal archaeal, bacterial, and fungal communities of dairy calves. Frontiers in Microbiology. 8, 1553.
- Kang, K.; Ma, J.; Wang, H.; Wang, Z.; Peng, Q.; Hu, R.; Zou, H.; Bao, S.; Zhang, W.; Sun, B. High-energy diet improves growth performance, meat quality and gene expression related to intramuscular fat deposition in finishing yaks raised by barn feeding. Veter- Med. Sci. 2020, 6, 755–765. [Google Scholar] [CrossRef]
- L, González-Calvo, M, Joy, Blanco,E,Dervishi,F,Molino.,P2015. Effect of vitamin e supplementation or alfalfa grazing on fatty acid composition and expression of genes related to lipid metabolism in lambs. Journal of Animal Science.
- Li, F.; Zhang, Z.; Li, X.; Zhu, B.; Guo, L.; Li, F.; Weng, X. Effect of duration of linseed diet supplementation before slaughter on the performances, meat fatty acid composition and rumen bacterial community of fattening lambs. Anim. Feed. Sci. Technol. 2020, 263, 114457. [Google Scholar] [CrossRef]
- Lourenco, M. , Van Ranst, G., De Smet, S., Raes, K., & Fievez, V.,2007. Effect of grazing pastures with different botanical composition by lambs on rumen fatty acid metabolism and fatty acid pattern of longissimus muscle and subcutaneous fat. Animal An International Journal of Animal Bioscience, 1(04), 537-545.
- Majewska, M.P.; Miltko, R.; Krawczyńska, A.; Bełżecki, G.; Kowalik, B. Rapeseed and linseed oil supplementation affects hydrolytic activities in the rumen of sheep. Livest. Sci. 2020, 240, 104175. [Google Scholar] [CrossRef]
- Nie, C.; Hu, Y.; Chen, R.; Guo, B.; Li, L.; Chen, H.; Chen, H.; Song, X. Effect of probiotics and Chinese medicine polysaccharides on meat quality, muscle fibre type and intramuscular fat deposition in lambs. Ital. J. Anim. Sci. 2022, 21, 811–820. [Google Scholar] [CrossRef]
- Olinda, Guerreiro, Susana, P., Alves, & David, et al., 2022. Inclusion of the aerial part and condensed tannin extract from cistus ladanifer l. in lamb diets - effects on growth performance, carcass and meat quality and fatty acid composition of intramuscular and subcutaneous fat. Meat science, 160, 107945.
- Osborne, J.M.; Dehority, B.A. Synergism in Degradation and Utilization of Intact Forage Cellulose, Hemicellulose, and Pectin by Three Pure Cultures of Ruminal Bacteria. Appl. Environ. Microbiol. 1989, 55, 2247–50. [Google Scholar] [CrossRef] [PubMed]
- Okeudo, N.; Moss, B. Interrelationships amongst carcass and meat quality characteristics of sheep. Meat Sci. 2005, 69, 1–8. [Google Scholar] [CrossRef] [PubMed]
- A Paz, H.; E Hales, K.; E Wells, J.; A Kuehn, L.; Freetly, H.C.; Berry, E.D.; Flythe, M.D.; Spangler, M.L.; Fernando, S.C. Rumen bacterial community structure impacts feed efficiency in beef cattle. J. Anim. Sci. 2018, 96, 1045–1058. [Google Scholar] [CrossRef] [PubMed]
- Polan, C.E.; McNeill, J.J.; Tove, S.B. BIOHYDROGENATION OF UNSATURATED FATTY ACIDS BY RUMEN BACTERIA. J. Bacteriol. 1964, 88, 1056–1064. [Google Scholar] [CrossRef] [PubMed]
- Rui Hu, Huawei Zou, Hongze Wang, 2020. Dietary Energy Levels Affect Rumen Bacterial Populations that Influence the Intramuscular Fat Fatty Acids of Fattening Yaks (Bos grunniens)[J]. Animals, 10(1474):1-16.
- Stevenson, D.M.; Weimer, P.J. Dominance of Prevotella and low abundance of classical ruminal bacterial species in the bovine rumen revealed by relative quantification real-time PCR. Appl. Microbiol. Biotechnol. 2009, 83, 987–988. [Google Scholar] [CrossRef]
- Wang, C.L. , Hao, Z.L., Li, F.D., Yu, Y., Lang, X., Ma, Y.J., Nian, F., Guo, J.P., 2010. Anatomical changes of digestive tract and rumen functional development in pasturing lamb at the age of 0-56 d. Chinese Journal of Animal & Veterinary Sciences. 41, 417–424.
- Wijngaarden, V.D. , 1967. Modified rapid preparation of fatty acid ester from lipids for gas chromatographic analysis. Analytical Chemistry. 39(7), 848–849.
- Wu, G.D.; Lewis, J.D.; Hoffmann, C.; Chen, Y.-Y.; Knight, R.; Bittinger, K.; Hwang, J.; Chen, J.; Berkowsky, R.; Nessel, L.; et al. Sampling and pyrosequencing methods for characterizing bacterial communities in the human gut using 16S sequence tags. BMC Microbiol. 2010, 10, 1–14. [Google Scholar] [CrossRef] [PubMed]
- Xiao, J.; Guo, L.; Alugongo, G.; Wang, Y.; Cao, Z.; Li, S. Effects of different feed type exposure in early life on performance, rumen fermentation, and feed preference of dairy calves. J. Dairy Sci. 2018, 101, 8169–8181. [Google Scholar] [CrossRef] [PubMed]
- Xie, B. , Zhang, N.F., Zhang, C.X., Diao, Q.Y., 2018. Effect of roughage on rumen development of young ruminants and its mechanism. Chinese Journal of Animal Nutrition. 30, 1245–1252.
- Yáñez-Ruiz, D.R.; Macías, B.; Pinloche, E.; Newbold, C.J. The persistence of bacterial and methanogenic archaeal communities residing in the rumen of young lambs. FEMS Microbiol. Ecol. 2010, 72, 272–278. [Google Scholar] [CrossRef] [PubMed]
- Yang, H.B. , Liu, H., Zhan, J.S., Lin, M., Zhao, G.Q., 2015. Effects of diet pellets with different concentrate-roughage ratios on rumen fermentation parameters and microorganism abundance in weaned bull calves. Acta Prataculturae Sinica. 12, 131–138.
- Zappaterra, M. , Deserti, M., Mazza, R., Braglia, S., Zambonelli, P., & Davoli, R.,2016. A gene and protein expression study on four porcine genes related to intramuscular fat deposition. Meat Science, 121(nov.), 27-32.
- Zened, A.; Combes, S.; Cauquil, L.; Mariette, J.; Klopp, C.; Bouchez, O.; Troegeler-Meynadier, A.; Enjalbert, F. Microbial ecology of the rumen evaluated by 454 GS FLX pyrosequencing is affected by starch and oil supplementation of diets. FEMS Microbiol. Ecol. 2013, 83, 504–514. [Google Scholar] [CrossRef] [PubMed]
- Zhang, Y.S. , Yan, S.M., Sun, G.P., 2018. Effects of two fattening methods on rumen fermentation function of Aerbasi white cashmere goat lambs. Feed Industry. 11, 29–32.
Figure 1.
Venn diagram of microbial OTUs in the rumen fluid of two feeding groups (G2, pasture group; R2, pen-ration group) of Tan lambs.
Figure 1.
Venn diagram of microbial OTUs in the rumen fluid of two feeding groups (G2, pasture group; R2, pen-ration group) of Tan lambs.
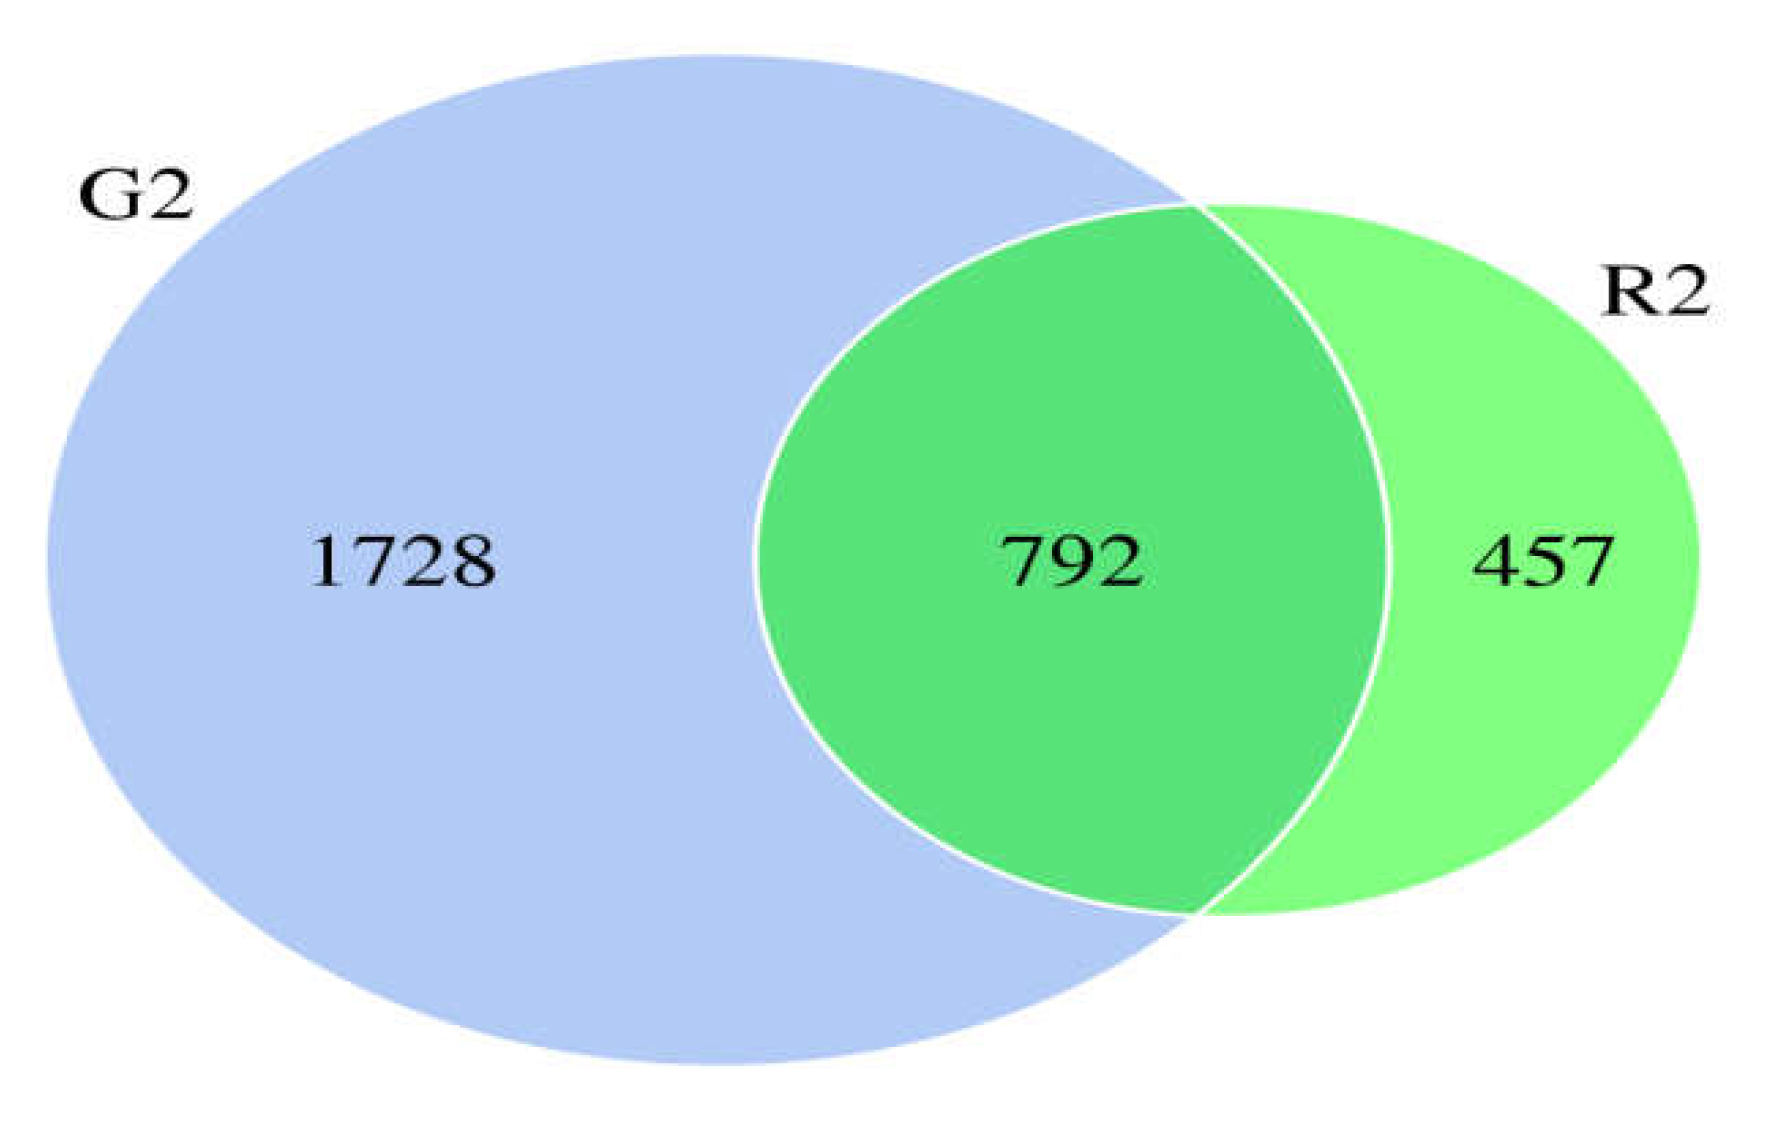
Figure 2.
Classification tree for microbial groups in the rumen fluid of Tan sheep in two feeding groups: pasture group (G2, red) and pen-ration group (R2, green).
Figure 2.
Classification tree for microbial groups in the rumen fluid of Tan sheep in two feeding groups: pasture group (G2, red) and pen-ration group (R2, green).
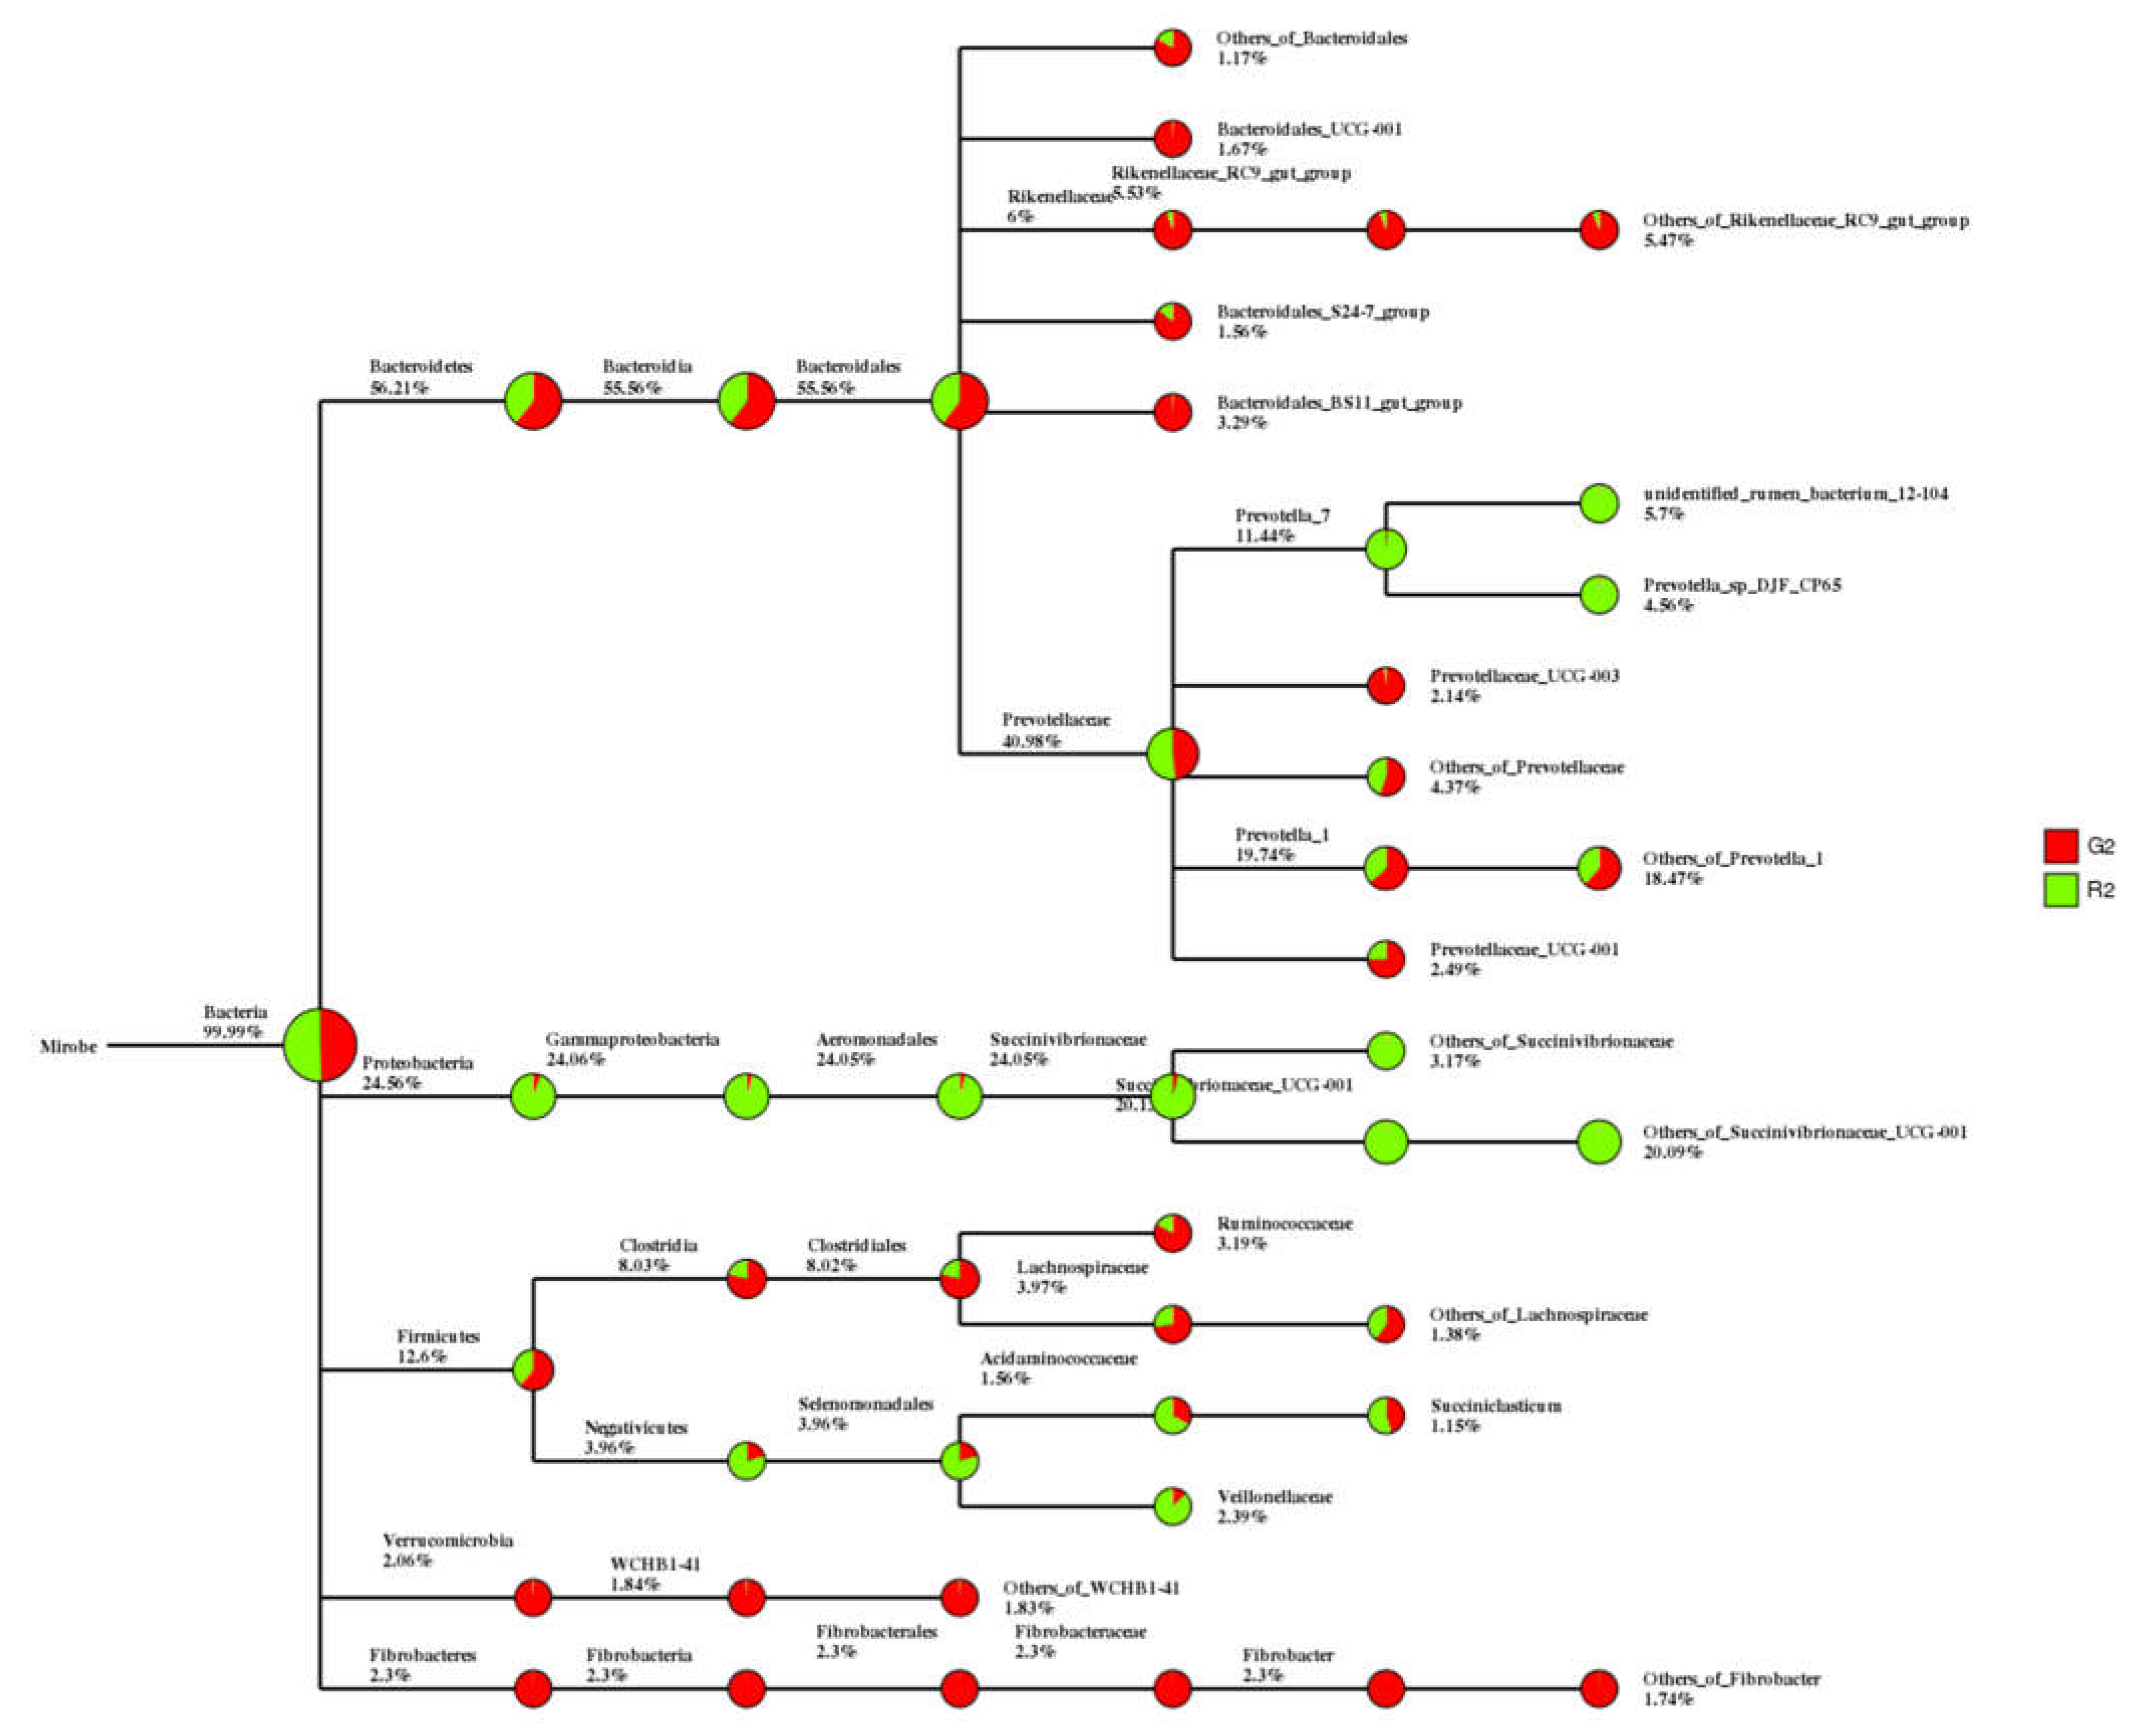
Figure 3.
Unweighted Unifrac index heat map for rumen microbial samples from two different feeding groups of Tan lambs: pasture group (G2) and pen-ration group (R2).
Figure 3.
Unweighted Unifrac index heat map for rumen microbial samples from two different feeding groups of Tan lambs: pasture group (G2) and pen-ration group (R2).
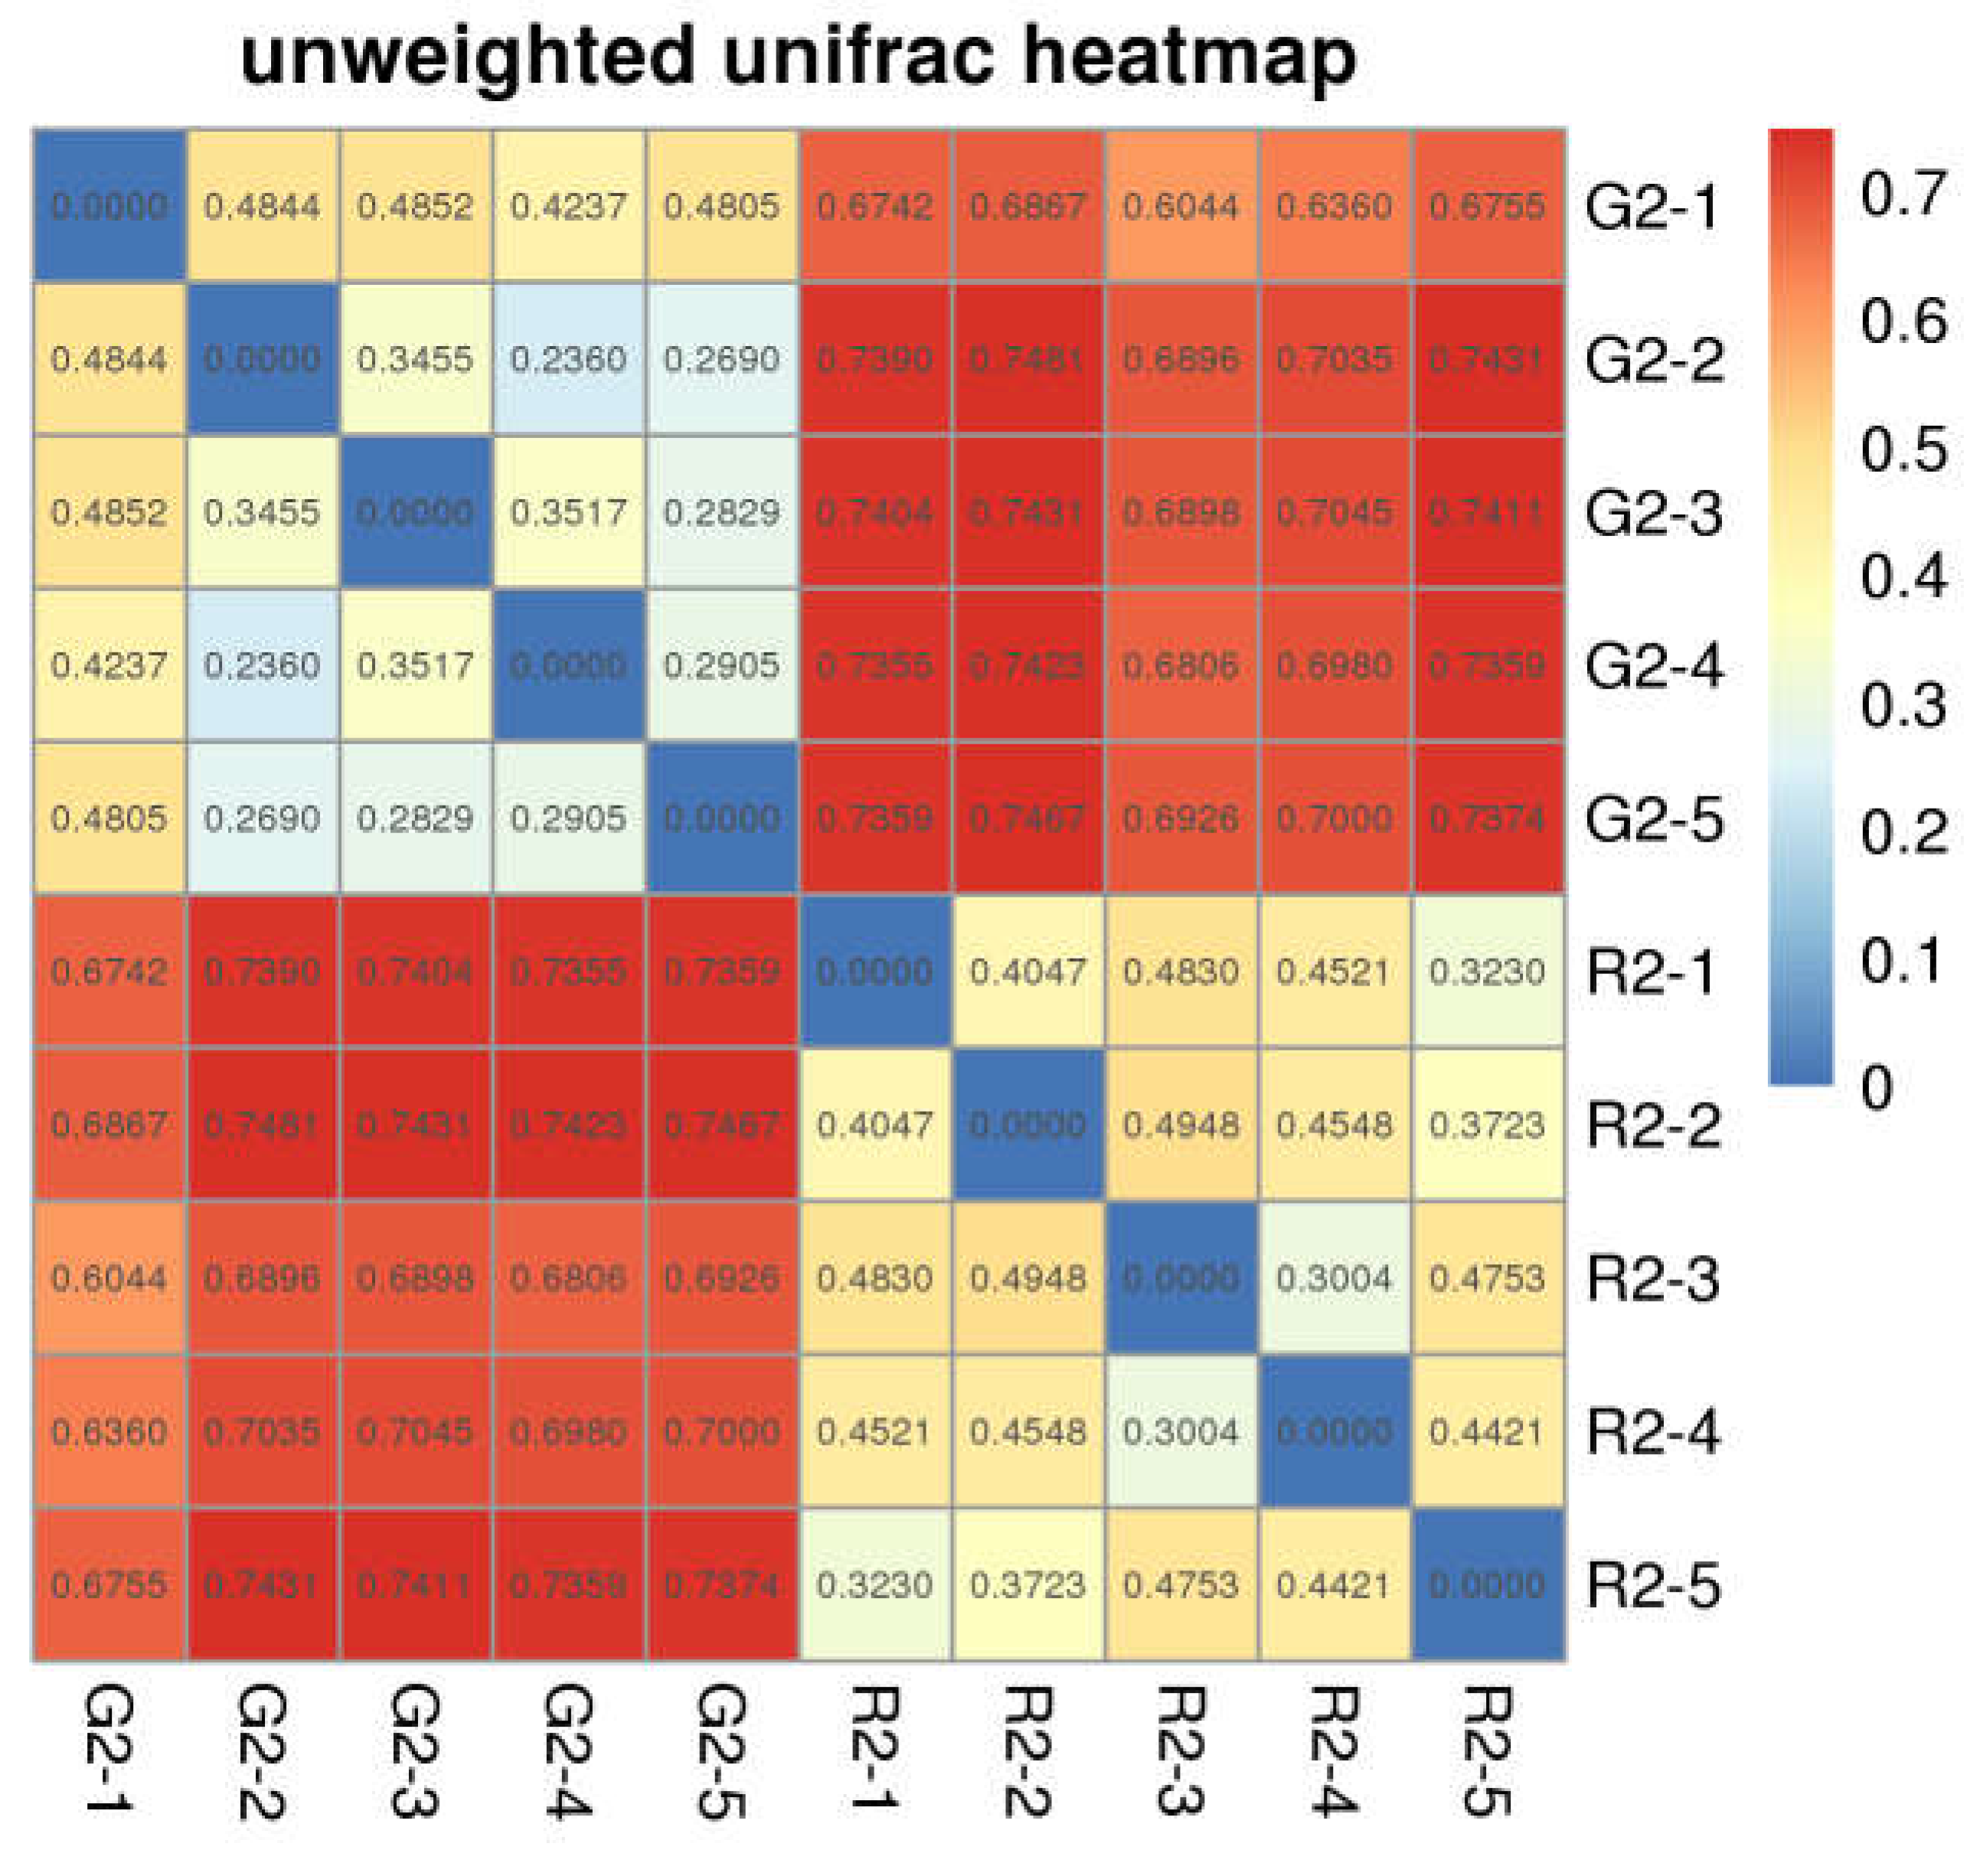
Figure 4.
OTU PCA plot of the rumen microb 1.
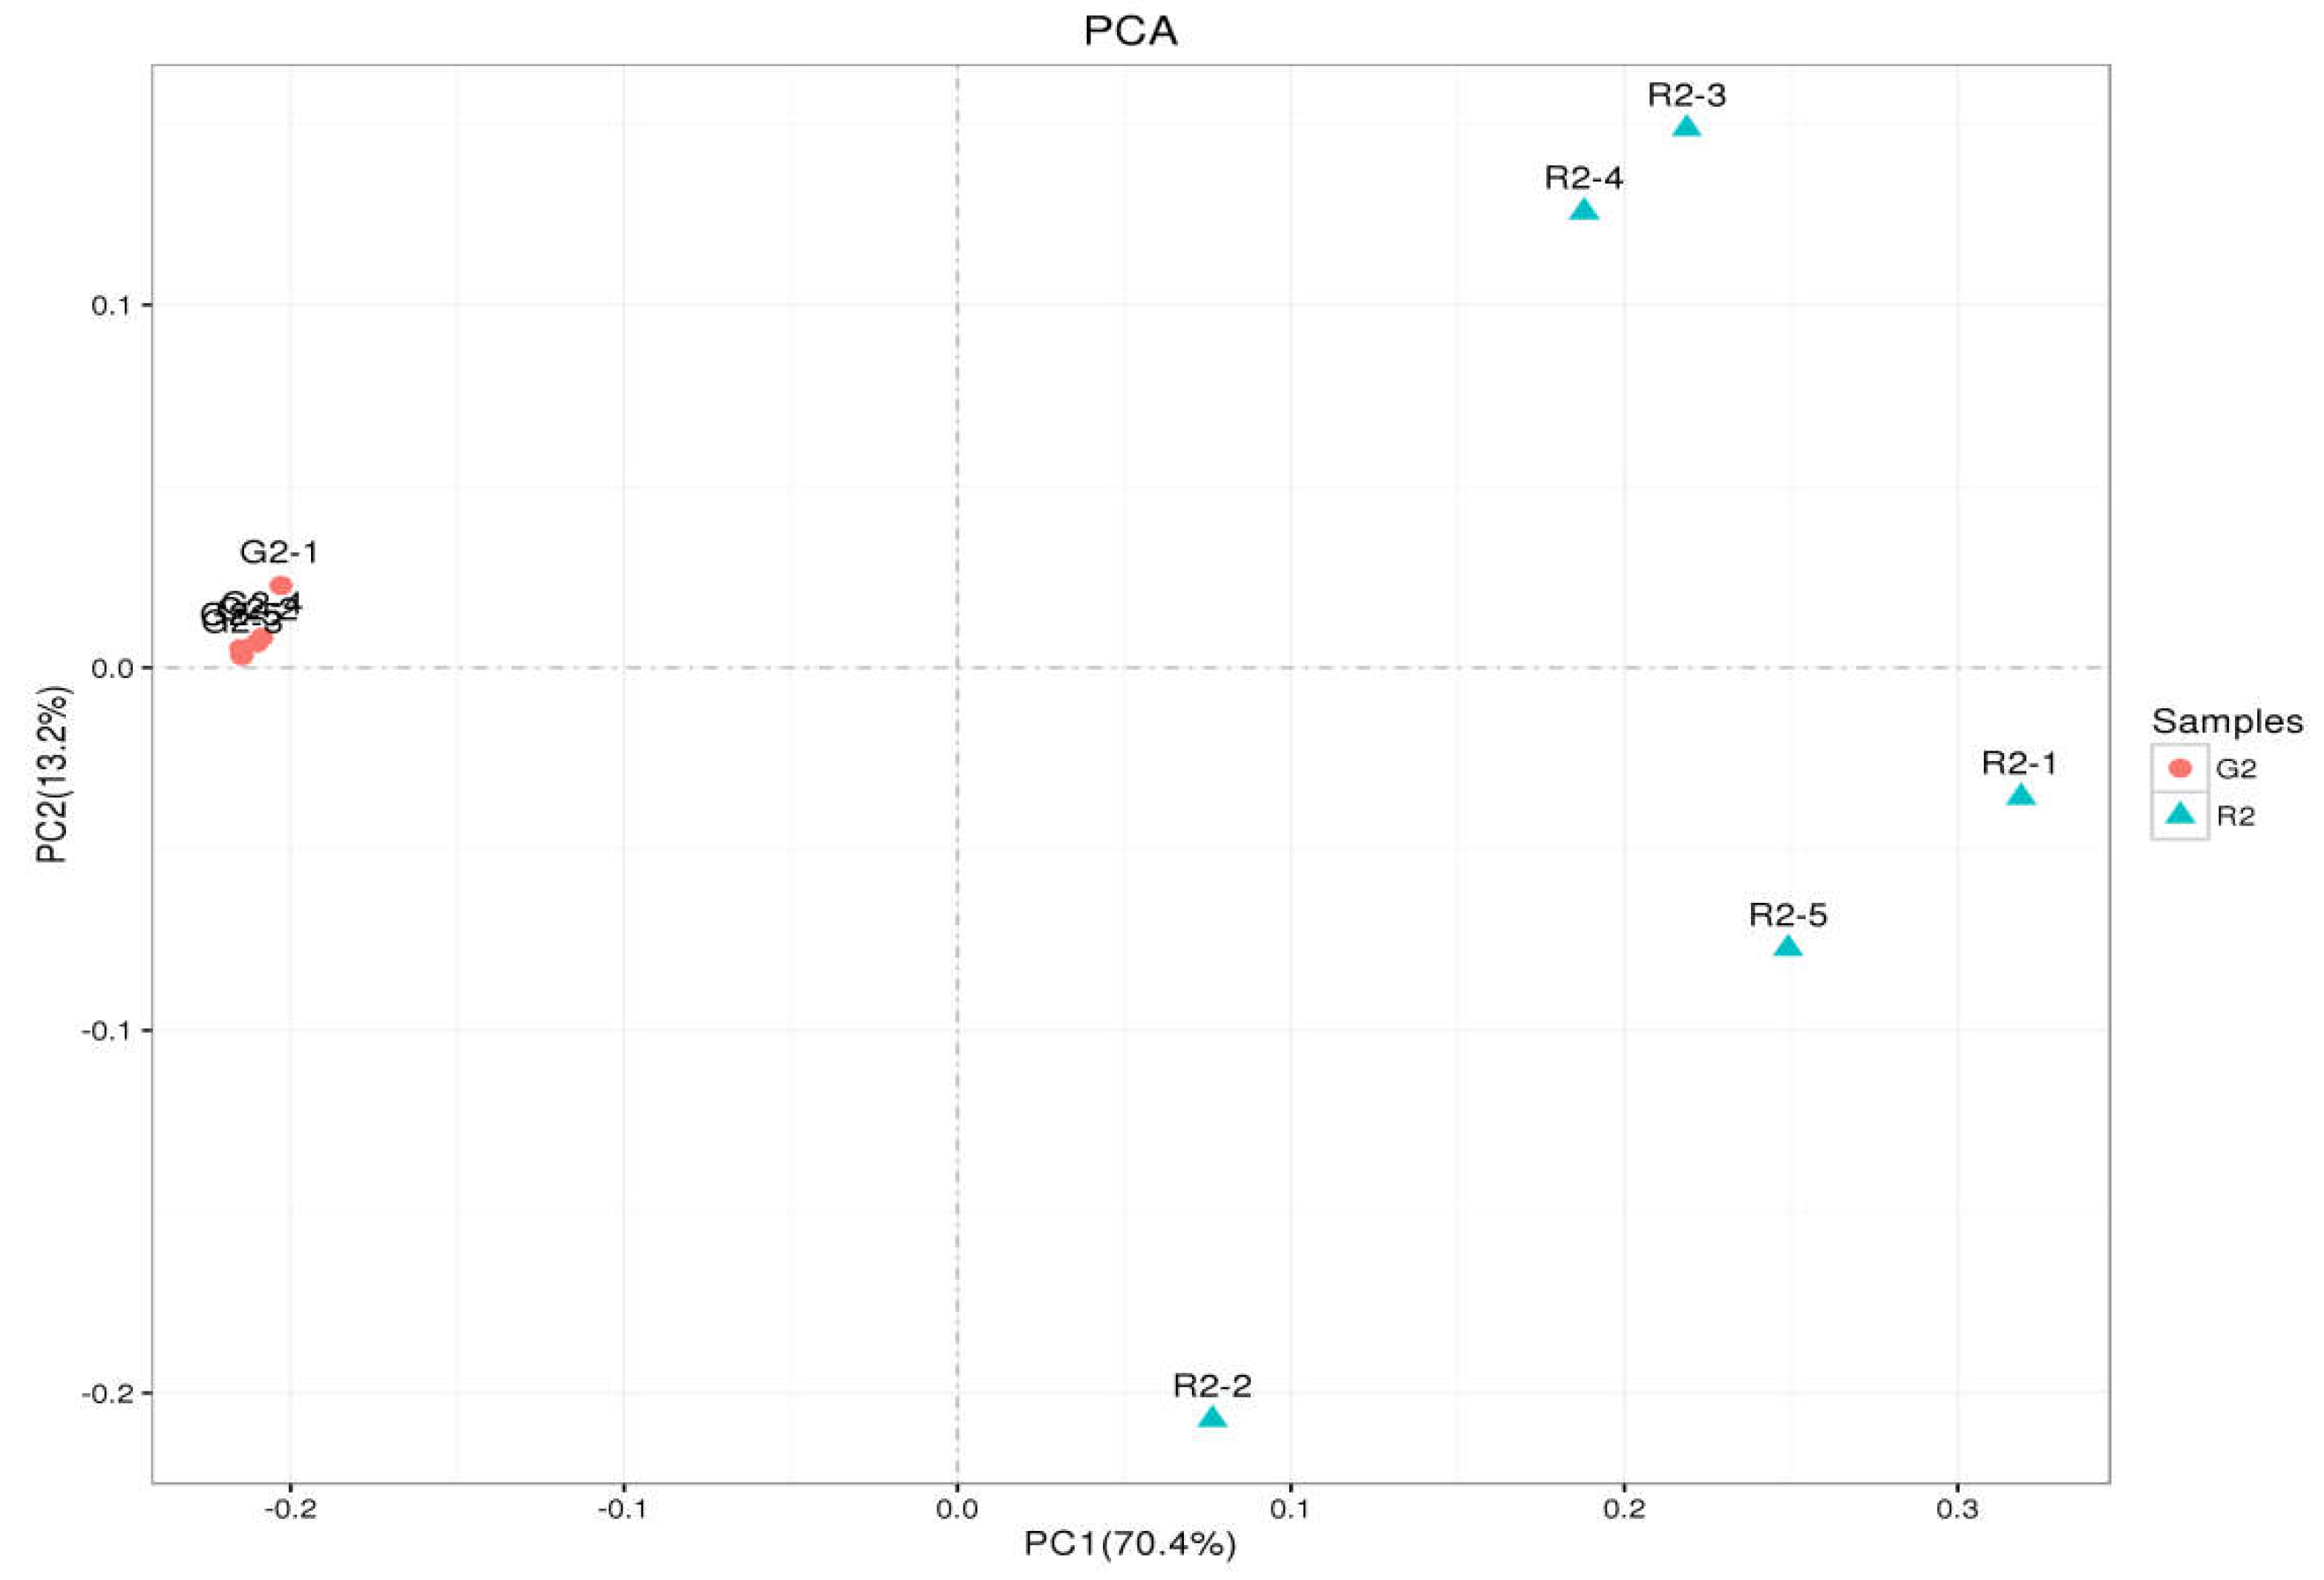
Figure 5.
UPGMA clustering tree at the phylum level for rumen microbes in two feeding groups of Tan lambs: pasture group (G2) and pen-ration group (R2).
Figure 5.
UPGMA clustering tree at the phylum level for rumen microbes in two feeding groups of Tan lambs: pasture group (G2) and pen-ration group (R2).

Figure 6.
UPGMA clustering tree at the genus level for rumen microbes in two feeding pattern of Tan lambs: pasture group (G2) and pen-ration group (R2).
Figure 6.
UPGMA clustering tree at the genus level for rumen microbes in two feeding pattern of Tan lambs: pasture group (G2) and pen-ration group (R2).
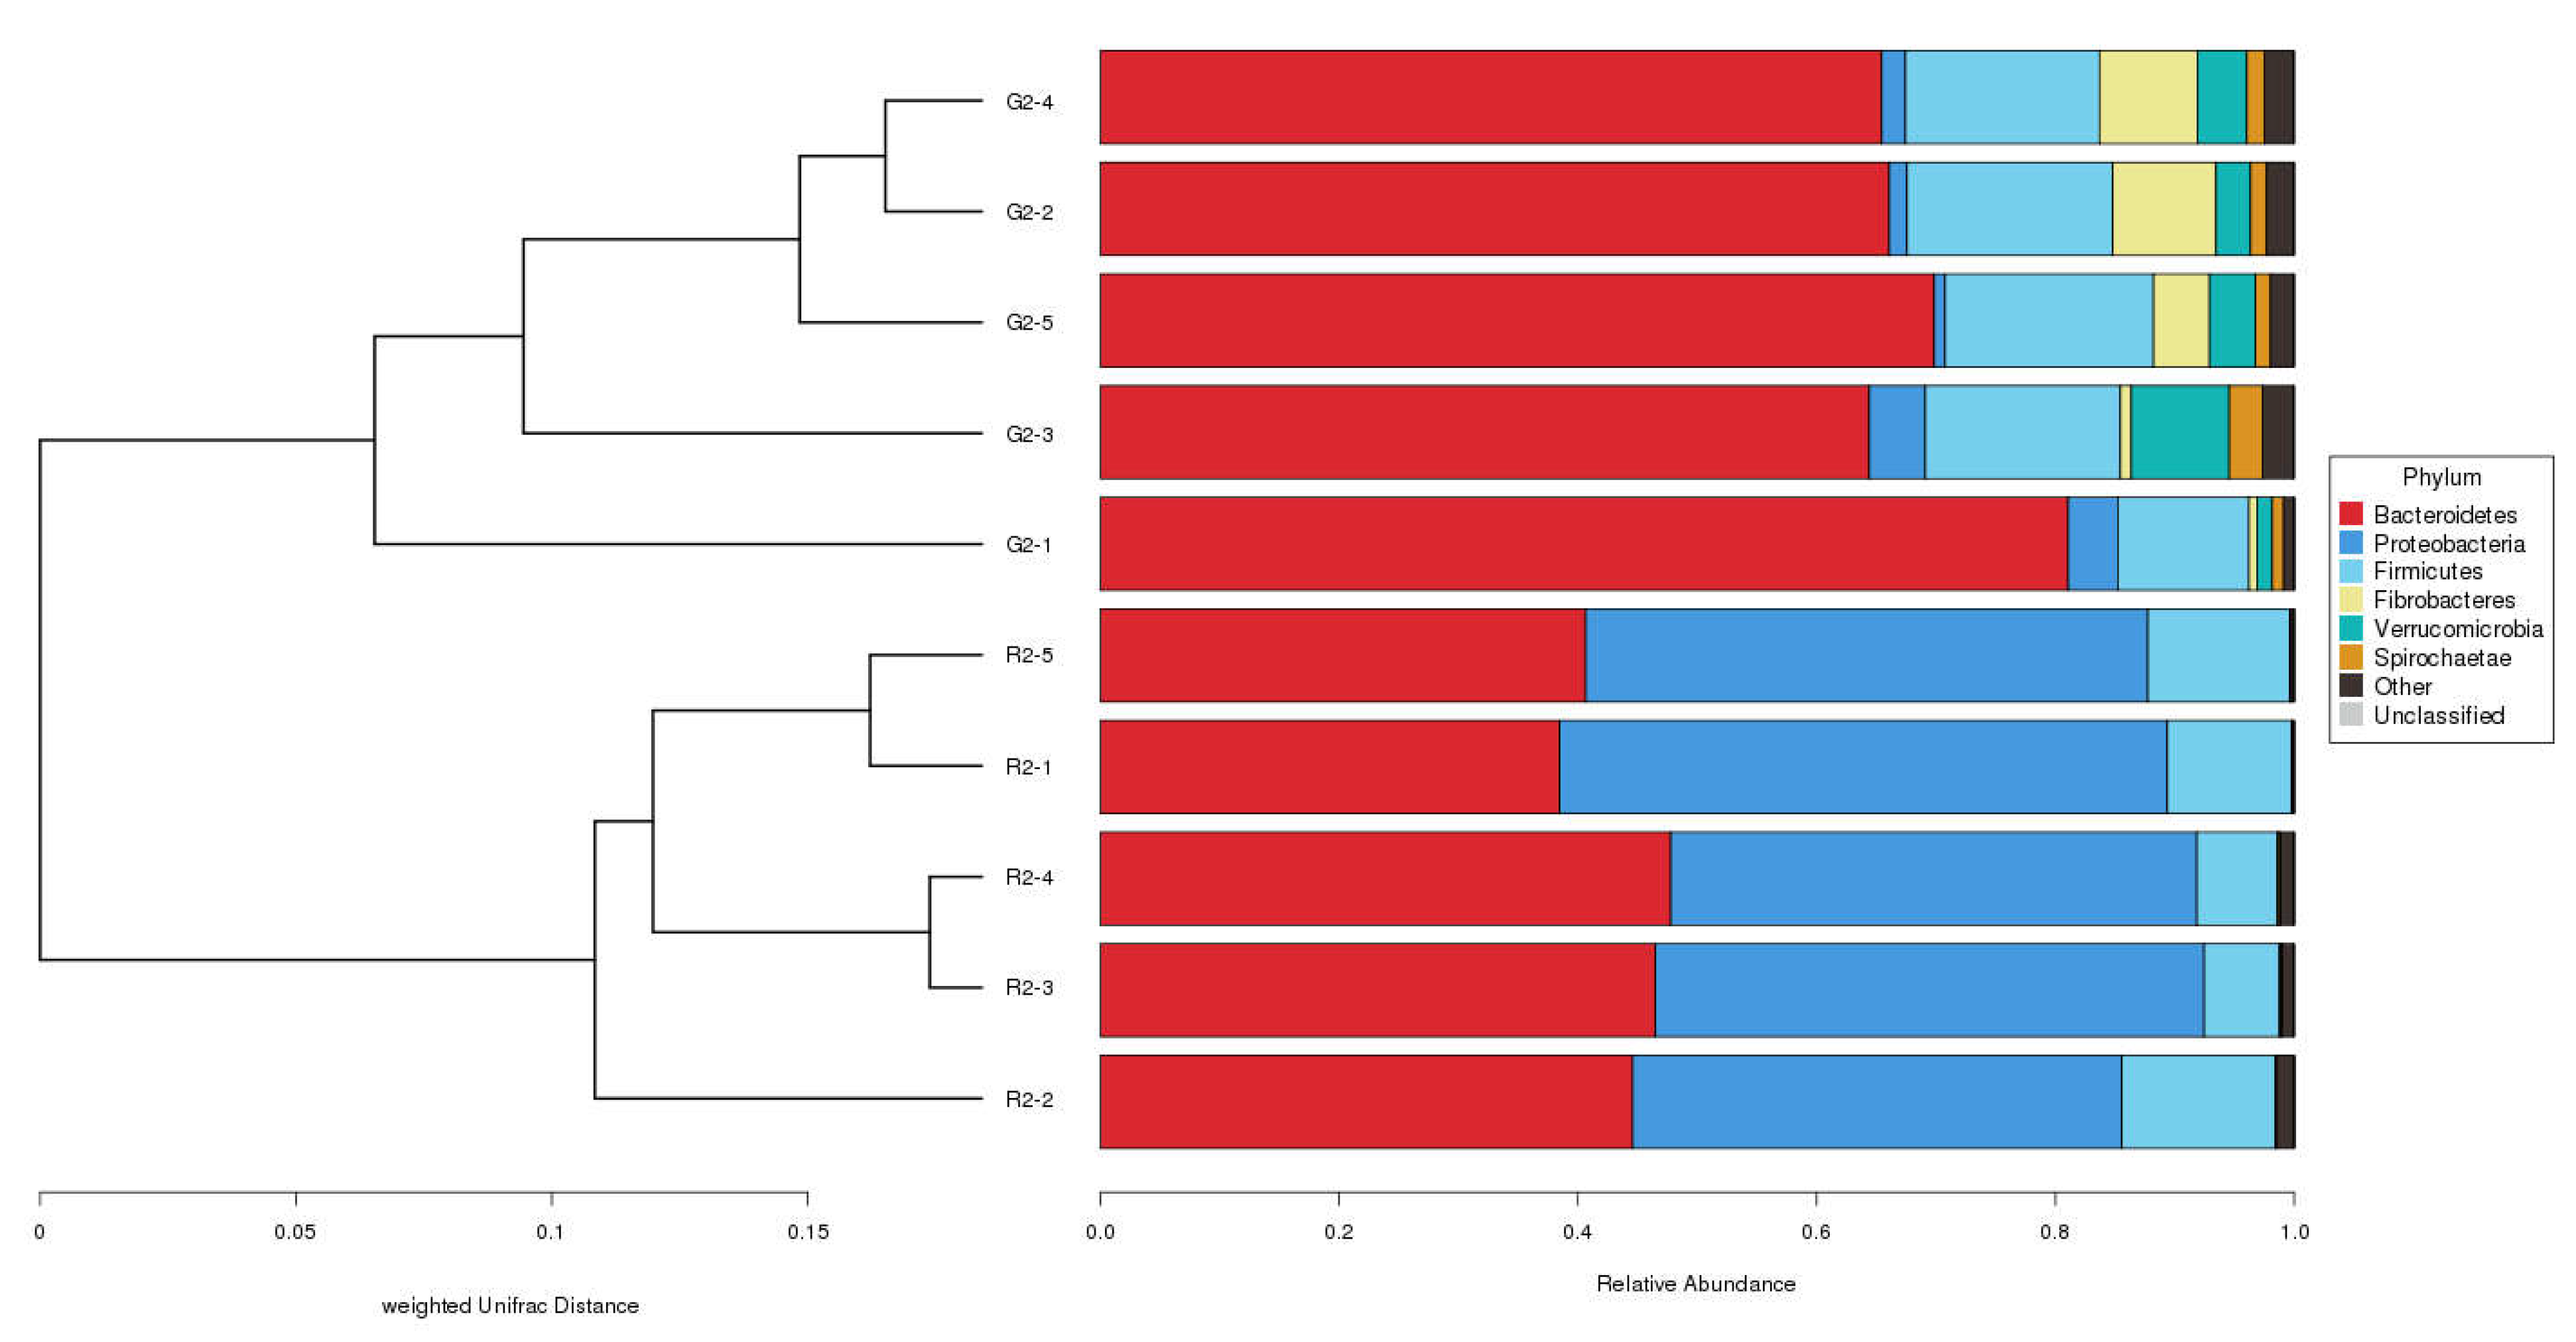
Figure 7.
Correlation analysis between phylum level and fatty acids in Longissimus dorsi: blackish green, fatty acids; purplish red, phylum; red line, positive correlation; blue line, negative correlation.
Figure 7.
Correlation analysis between phylum level and fatty acids in Longissimus dorsi: blackish green, fatty acids; purplish red, phylum; red line, positive correlation; blue line, negative correlation.
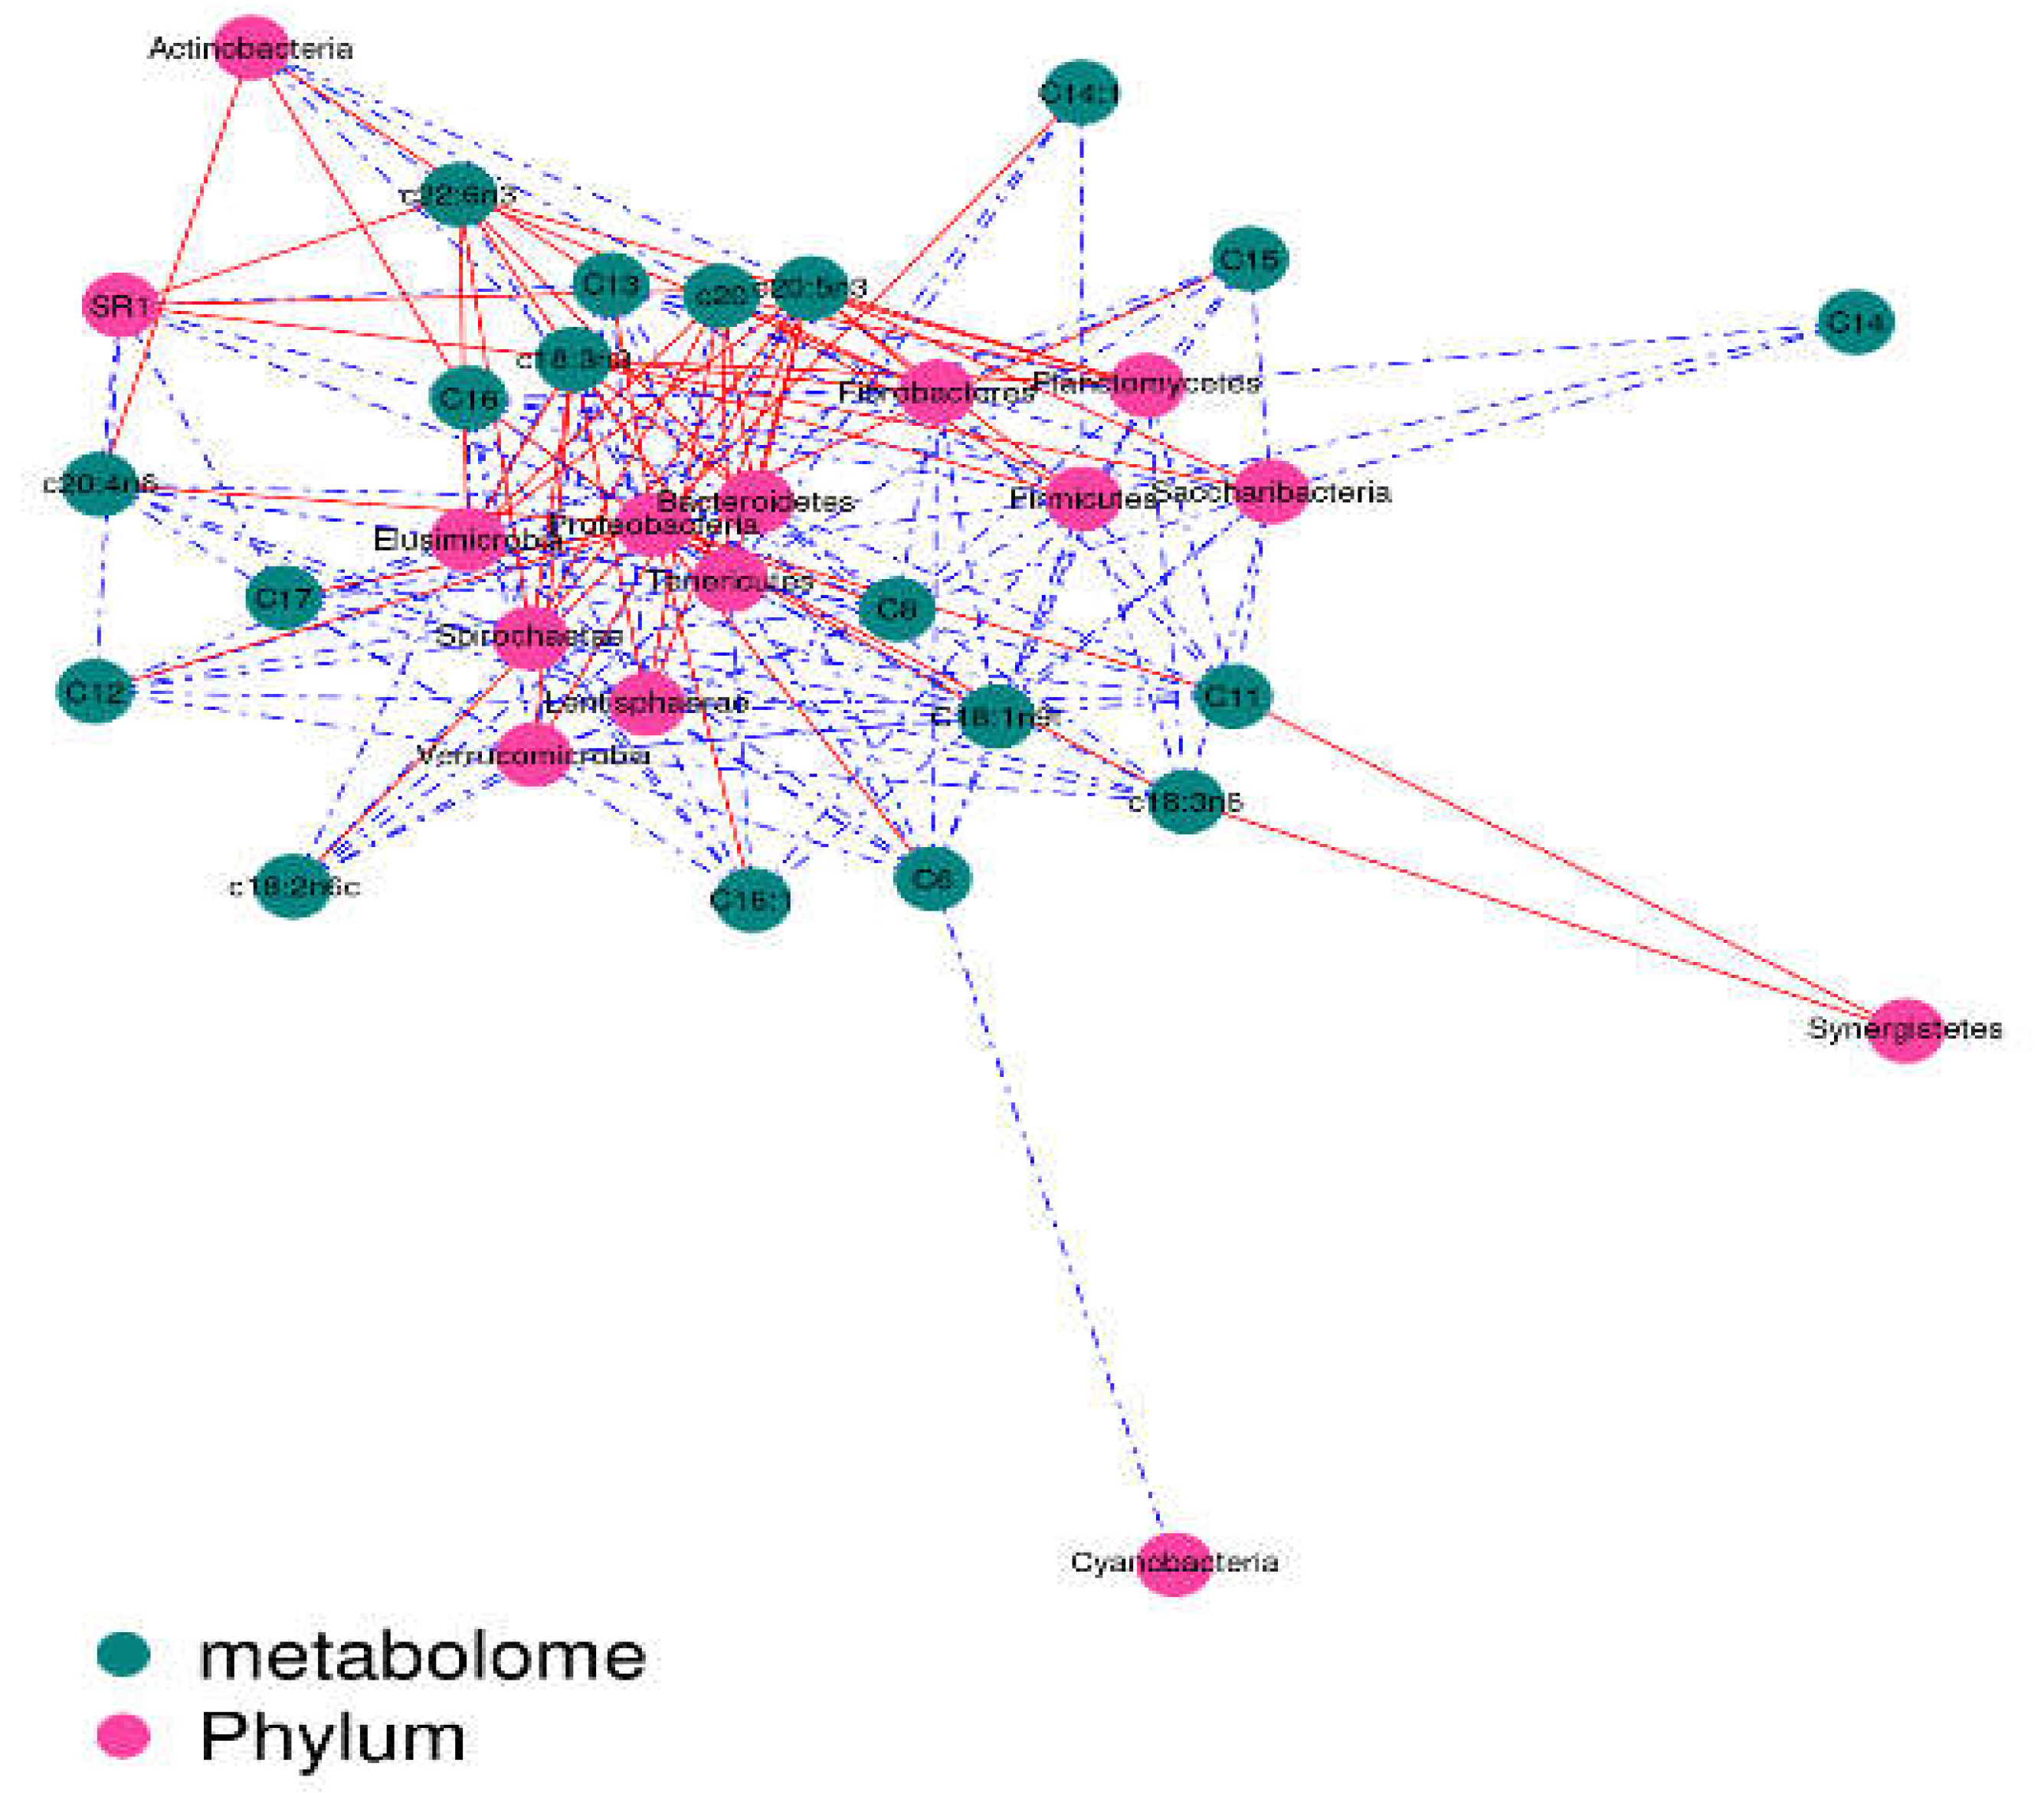
Figure 8.
Correlation analysis between phylum level and fatty acids in Biceps femoris : blackish green, fatty acids; purplish red, phylum; red line, positive correlation; blue line, negative correlation. .
Figure 8.
Correlation analysis between phylum level and fatty acids in Biceps femoris : blackish green, fatty acids; purplish red, phylum; red line, positive correlation; blue line, negative correlation. .
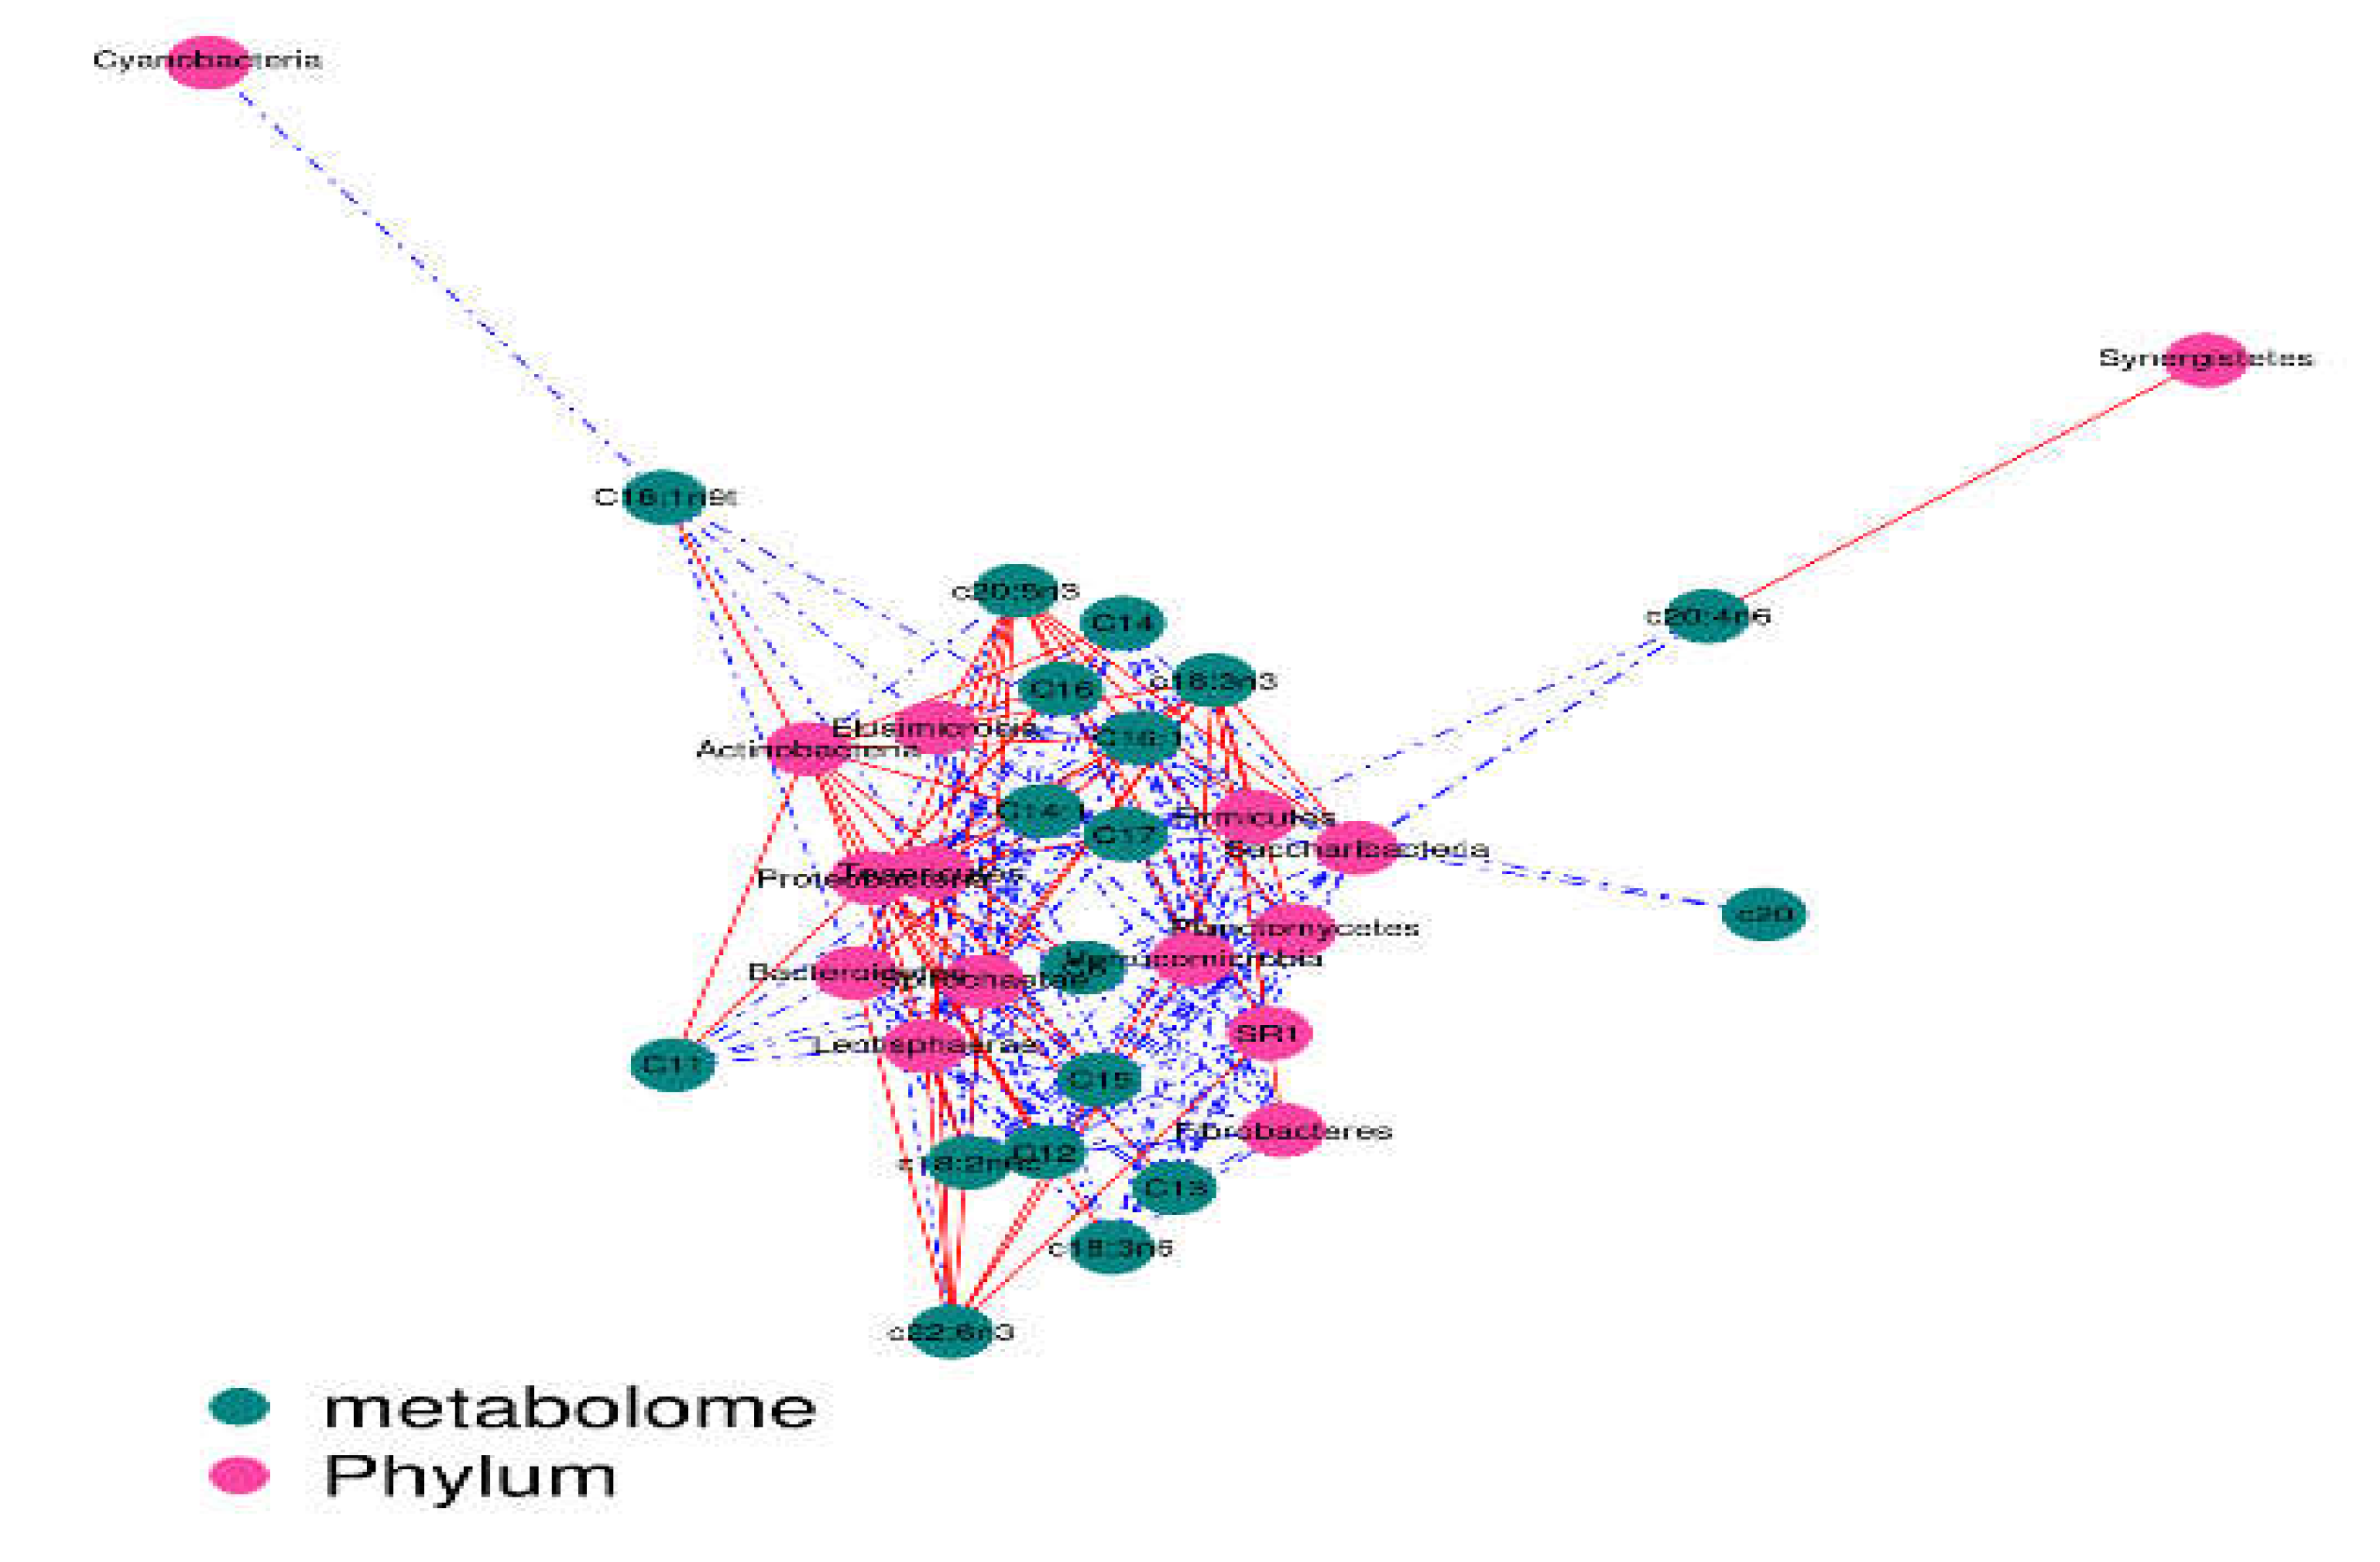
Figure 9.
Correlation analysis between genus level and fatty acids in Longissimus dorsi: blackish green, fatty acids; purplish red, genus; red line, positive correlation; blue line, negative correlation.
Figure 9.
Correlation analysis between genus level and fatty acids in Longissimus dorsi: blackish green, fatty acids; purplish red, genus; red line, positive correlation; blue line, negative correlation.
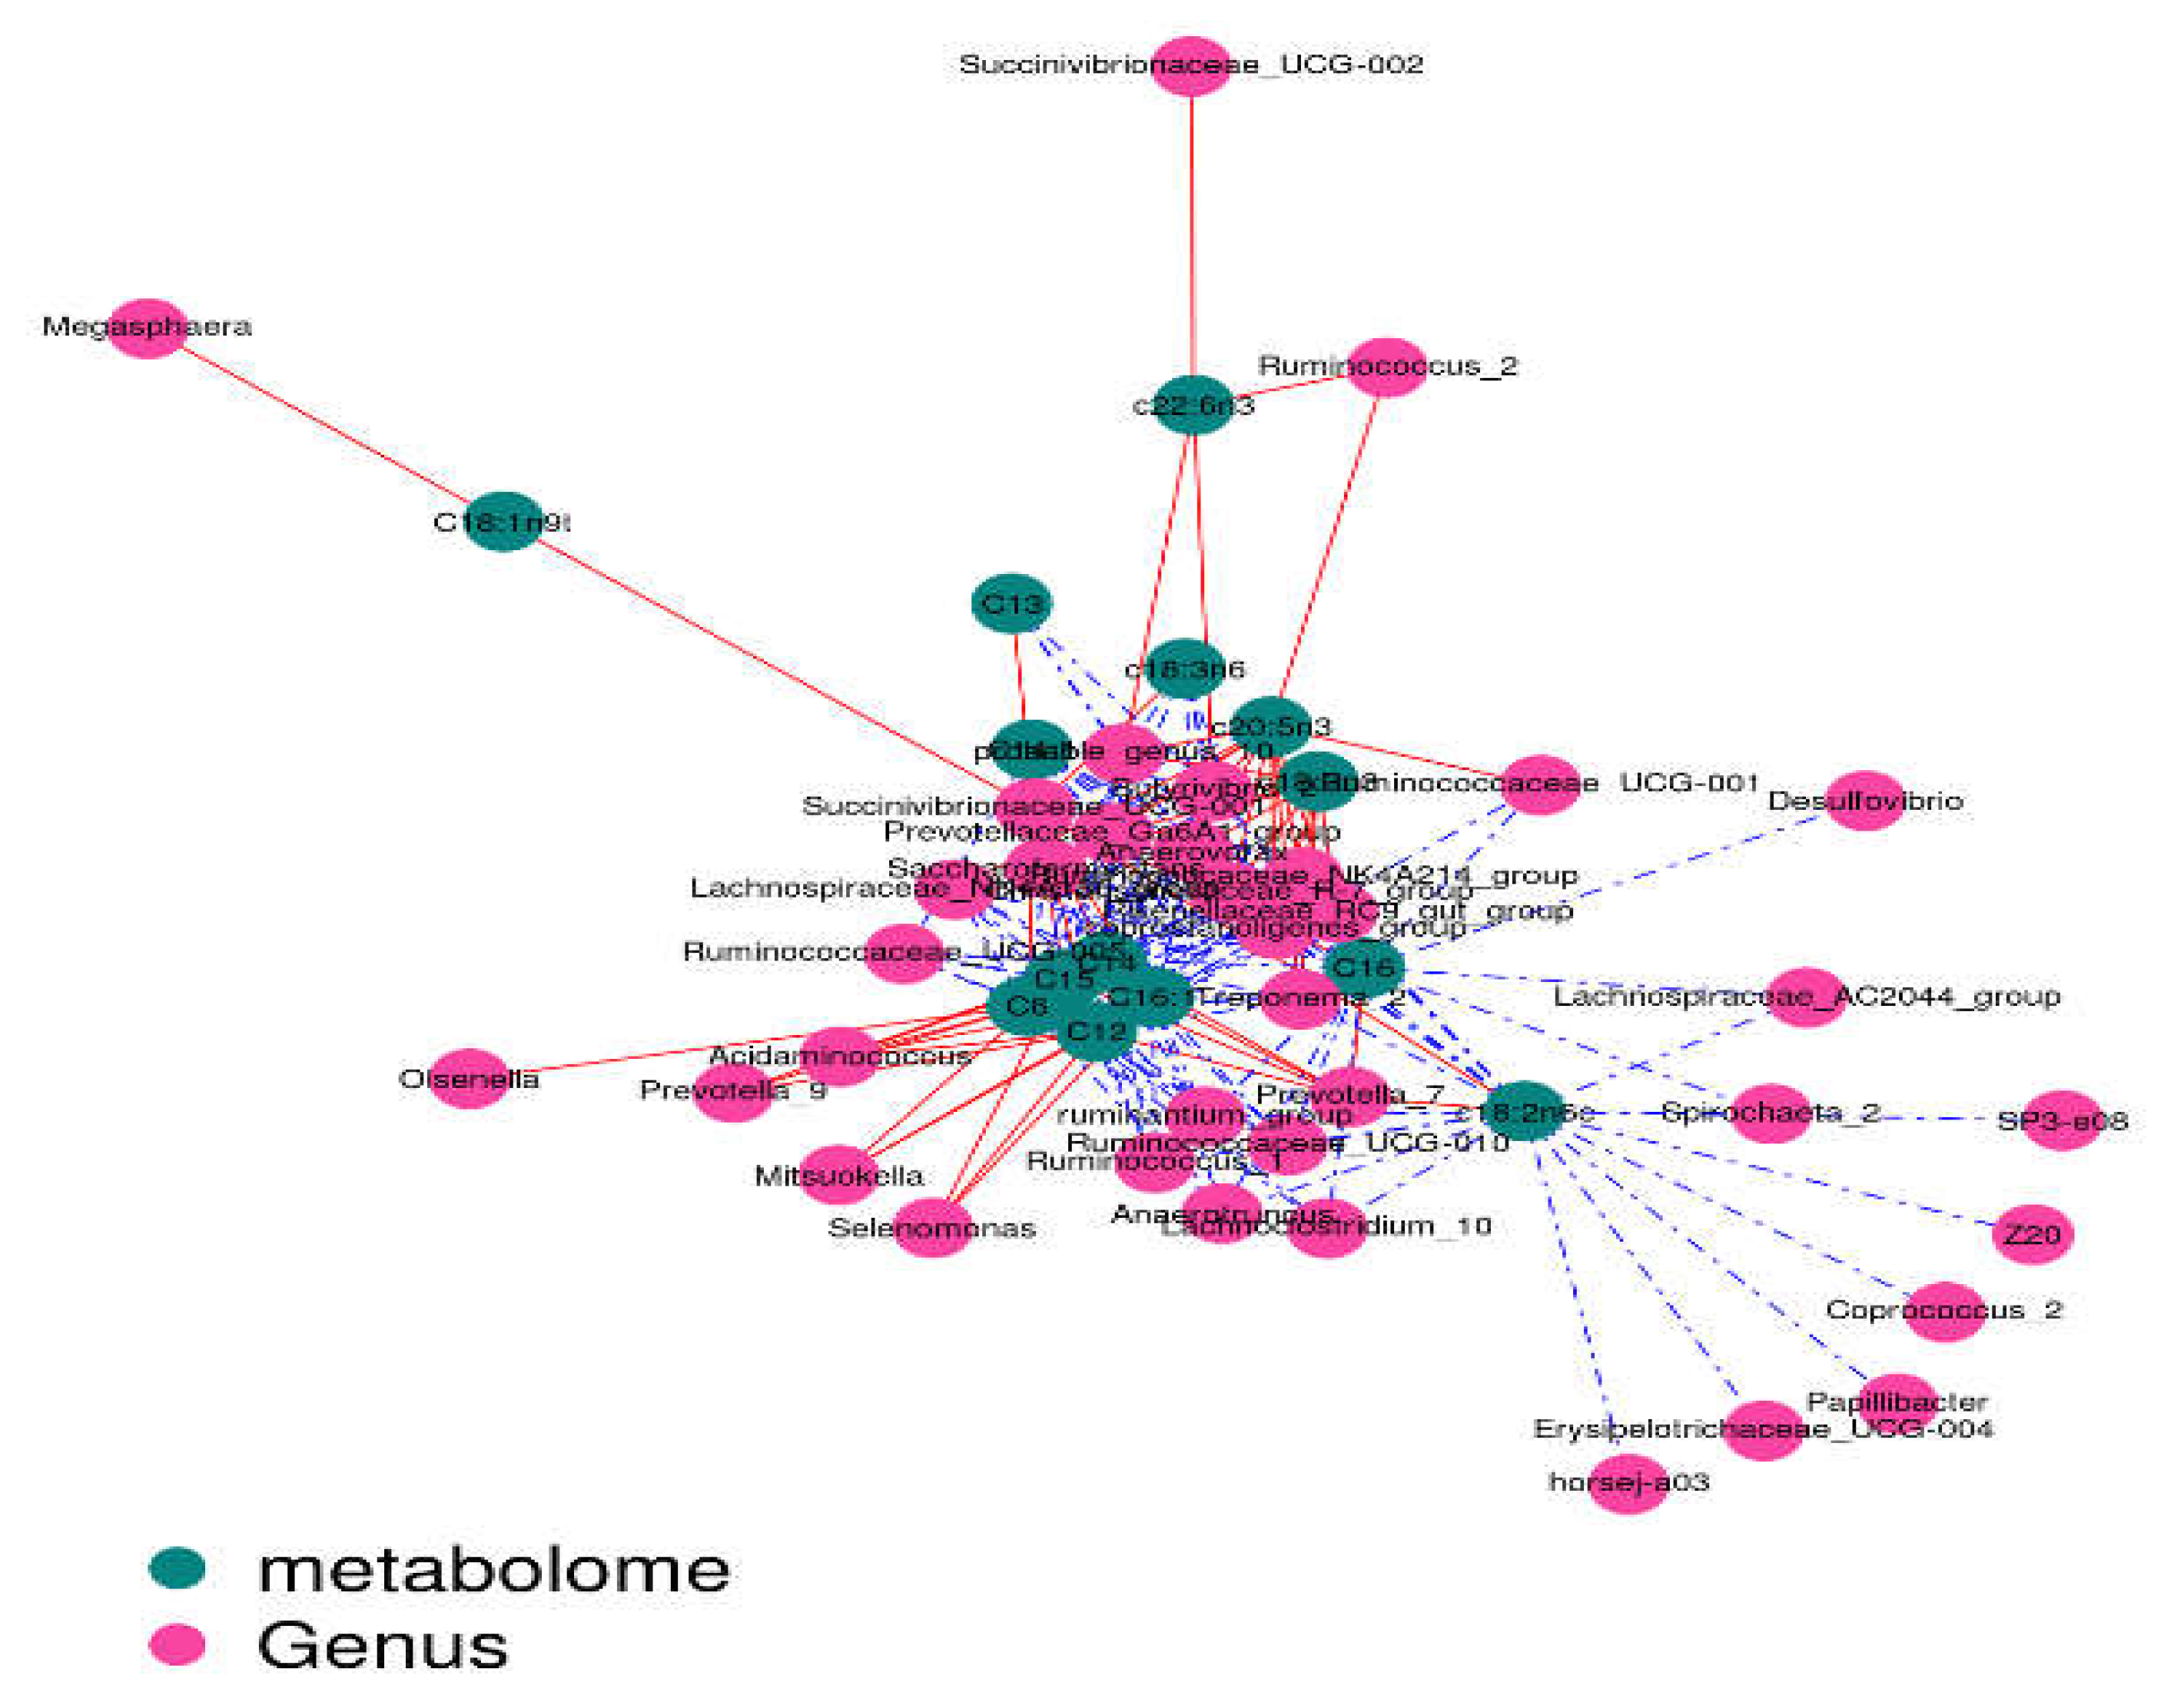
Figure 10.
Correlation analysis between genus level and fatty acids in Biceps femoris: blackish green, fatty acids; purplish red, genus; red line, positive correlation; blue line, negative correlation.
Figure 10.
Correlation analysis between genus level and fatty acids in Biceps femoris: blackish green, fatty acids; purplish red, genus; red line, positive correlation; blue line, negative correlation.
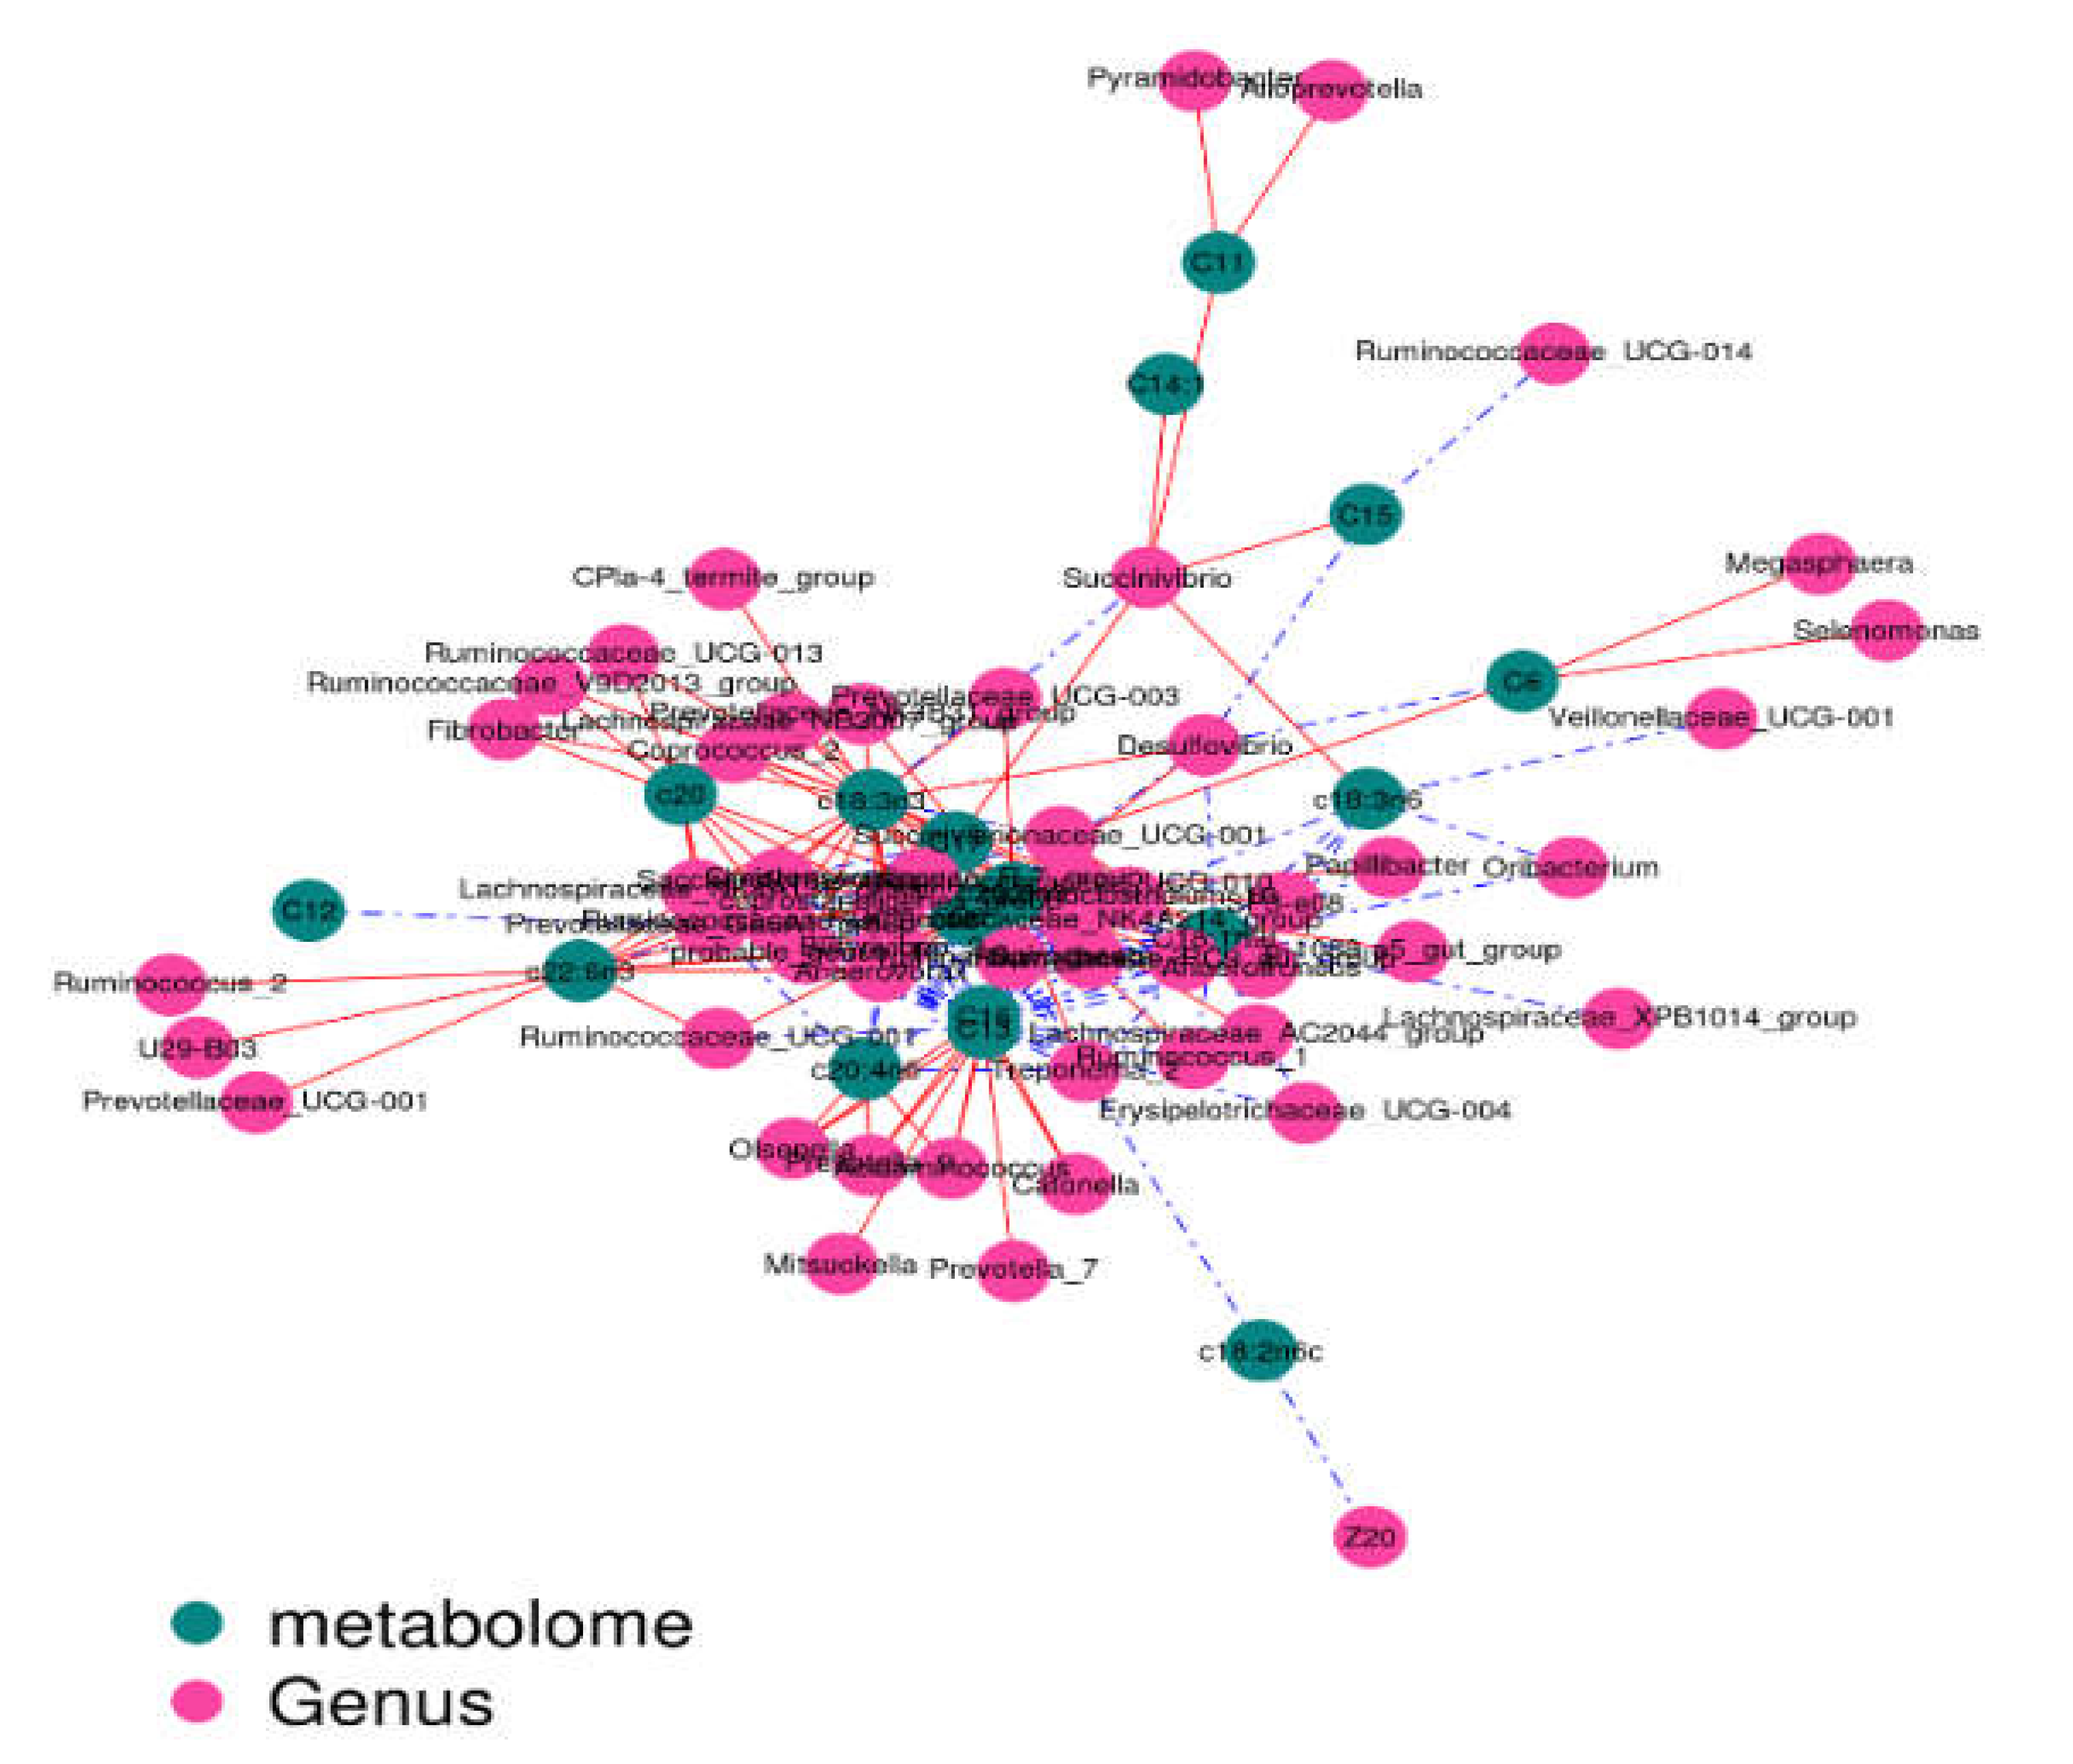

Table 1.
Composition and nutrient levels of the starting diet (dry matter basis) %.
| Ingredient | Content | Nutrient Level | Content |
|---|---|---|---|
| Corn | 55 | Crude protein | 20.50 |
| Soybean meal | 30 | Ca | 0.73 |
| Wheat bran | 7 | P | 0.44 |
| Molasses | 5 | Neutral detergent fibre | 10.35 |
| CaHPO4 | 1.50 | Digestible energy (MJ/kg) 2) | 11.60 |
| NaCl | 1 | ||
| Premix 1) | 0.50 | ||
| Total | 100 |
1) The premix provided the following per kilogram of diet: vitamin A: 15 × 104 IU, vitamin D3: 5 × 10⁴ IU, vitamin E: 20 × 104 IU, niacin: 200 mg, pantothenic acid: 100 mg, biotin: 10 mg, Fe: 1600 mg, Cu: 250 mg, Mn: 2650 mg, Zn: 1000 mg, I: 15 mg, Se: 7.5 mg, Co: 7.5 mg. 2) Digestible energy (DE) was a calculated value; all others were measured values.
Table 2.
Intramuscular fat content and fatty acid composition of biceps femoris and longissimus dorsi (g·100 g-1).
Table 2.
Intramuscular fat content and fatty acid composition of biceps femoris and longissimus dorsi (g·100 g-1).
| Item | Biceps Femoris | Longissimus Dorsi | ||||||
|---|---|---|---|---|---|---|---|---|
| Pen-Ration Group | Pasture Group | SEM | p-Value | Pen-Ration Group | Pasture Group | SEM | p-Value | |
| Fat (%) | 2.26 | 2.11 | 0.18 | 0.316 | 1.73 | 1.98 | 0.21 | 0.242 |
| C6 | 0.94 | 0.11 | 0.03 | 0.002 | 0.23 | 0.09 | 0.02 | 0.026 |
| C8 | 0.10 | 0.08 | 0.05 | 0.186 | 0.05 | 0.03 | 0.04 | 0.073 |
| C11 | 0.07 | 0.08 | 0.02 | 0.068 | 0.33 | 0.04 | 0.01 | 0.008 |
| C12 | 0.80 | 0.06 | 0.01 | 0.001 | 0.61 | 0.55 | 0.02 | 0.062 |
| C13 | 0.11 | 0.03 | 0.02 | 0.003 | 0.08 | 0.04 | 0.02 | 0.003 |
| C14 | 6.65 | 6.72 | 0.27 | 0.154 | 6.42 | 8.82 | 0.30 | 0.131 |
| C14:1 | 0.49 | 0.03 | 0.01 | 0.005 | 0.37 | 0.15 | 0.02 | 0.035 |
| C15 | 1.09 | 0.20 | 0.03 | 0.001 | 0.82 | 1.24 | 0.04 | 0.108 |
| C16 | 66.89 | 48.73 | 2.31 | 0.000 | 71.32 | 50.40 | 2.43 | 0.002 |
| C16:1 | 2.71 | 2.14 | 0.10 | 0.132 | 2.93 | 3.08 | 0.12 | 0.055 |
| C17 | 2.24 | 4.47 | 0.13 | 0.569 | 2.12 | 3.17 | 0.11 | 0.058 |
| C18:1n9t | 2.61 | 3.18 | 0.12 | 0.135 | 2.73 | 2.66 | 0.11 | 0.065 |
| c18:2n6c | 9.56 | 16.89 | 0.53 | 0.002 | 7.52 | 16.30 | 0.48 | 0.013 |
| c20 | 0.08 | 0.11 | 0.05 | 0.231 | 0.02 | 0.21 | 0.01 | 0.032 |
| c18:3n6 | 0.29 | 0.26 | 0.06 | 0.060 | 0.21 | 0.22 | 0.05 | 0.089 |
| c18:3n3 | 0.69 | 4.17 | 0.10 | 0.003 | 0.53 | 3.48 | 0.08 | 0.000 |
| c20:4n6 | 4.29 | 7.99 | 0.25 | 0.036 | 3.55 | 6.45 | 0.20 | 0.021 |
| c20:5n3 | 0.18 | 3.10 | 0.07 | 0.000 | 0.11 | 2.30 | 0.05 | 0.000 |
| c22:6n3 | 0.23 | 1.64 | 0.09 | 0.031 | 0.05 | 0.75 | 0.02 | 0.006 |
Note: In the same row, values with different lowercase superscripts are significantly different (P < 0.05). For values with different capital superscripts, the differences are highly significant (P < 0.01).
Table 3.
Diversity indices of rumen samples from two feeding groups of Tan lambs: pasture group and pen-ration group.
Table 3.
Diversity indices of rumen samples from two feeding groups of Tan lambs: pasture group and pen-ration group.
| Items | Pasture Group | Pen-Ration Group | SEM | p-Value |
|---|---|---|---|---|
| OTU | 1611.200 | 694.000 | 32.689 | 0.001 |
| ACE index | 1913.600 | 970.900 | 35.121 | 0.001 |
| Chao1 index | 1910.265 | 951.180 | 33.675 | 0.001 |
| Shannon index | 7.709 | 3.770 | 0.271 | 0.000 |
| Simpson index | 0.985 | 0.785 | 0.008 | 0.001 |
| Coverage | 0.998 | 0.996 | 0.001 | 0.069 |
Table 4.
Effects of two different feeding patterns on the percentages of phyla in the rumen bacteria of Tan lambs.
Table 4.
Effects of two different feeding patterns on the percentages of phyla in the rumen bacteria of Tan lambs.
| Phylum | Pasture Group | Pen-Ration Group | SEM | p-Value |
|---|---|---|---|---|
| Bacteroidetes | 69.371 | 43.600 | 1.768 | 0.001 |
| Firmicutes | 15.656 | 9.669 | 0.379 | 0.010 |
| Fibrobacteres | 4.627 | 0.007 | 0.001 | 0.024 |
| Verrucomicrobia | 4.073 | 0.030 | 0.085 | 0.007 |
| Proteobacteria | 2.644 | 45.795 | 0.713 | 0.000 |
| Spirochaetae | 1.564 | 0.096 | 0.001 | 0.002 |
| Cyanobacteria | 0.669 | 0.573 | 0.002 | 0.739 |
| Lentisphaerae | 0.433 | 0.001 | 0.000 | 0.004 |
| Planctomycetes | 0.319 | 0.000 | 0.000 | 0.016 |
| SR1 | 0.169 | 0.000 | 0.000 | 0.039 |
| Tenericutes | 0.137 | 0.001 | 0.000 | 0.000 |
| Saccharibacteria | 0.097 | 0.021 | 0.000 | 0.024 |
| Elusimicrobia | 0.093 | 0.018 | 0.000 | 0.009 |
| Synergistetes | 0.078 | 0.108 | 0.000 | 0.412 |
| Bacteria_NA | 0.030 | 0.016 | 0.000 | 0.071 |
| Actinobacteria | 0.026 | 0.065 | 0.000 | 0.076 |
| Euryarchaeota | 0.010 | 0.000 | 0.000 | 0.001 |
| Armatimonadetes | 0.002 | 0.000 | 0.000 | 0.012 |
| WA-aaa01f12 | 0.001 | 0.000 | 0.000 | 0.060 |
| Chloroflexi | 0.001 | 0.000 | 0.000 | 0.245 |
| Fusobacteria | 0.001 | 0.000 | 0.000 | 0.621 |
Table 5.
Effects of two different feeding patterns on the percentages of genera in the rumen bacteria of Tan lambs.
Table 5.
Effects of two different feeding patterns on the percentages of genera in the rumen bacteria of Tan lambs.
| Genus | Pasture Group | Pen-Ration Group | SEM | P-Value |
|---|---|---|---|---|
| Prevotella | 25.88 | 36.48 | 1.032 | 0.005 |
| Prevotellaceae_NA | 4.846 | 3.827 | 0.015 | 0.671 |
| Prevotellaceae_UCG-003 | 4.350 | 0.077 | 0.003 | 0.007 |
| Prevotellaceae_UCG-001 | 3.756 | 1.252 | 0.002 | 0.066 |
| Prevotellaceae_NK3B31_group | 0.859 | 0.001 | 0.000 | 0.004 |
| Rikenellaceae_RC9_gut_group | 10.664 | 0.621 | 0.004 | 0.001 |
| Rikenellaceae_NA | 0.400 | 0.000 | 0.000 | 0.021 |
| NA | 8.907 | 1.049 | 0.006 | 0.002 |
| Bacteroidales_BS11_gut_group_NA | 6.696 | 0.051 | 0.001 | 0.000 |
| Bacteroidales_UCG-001_NA | 3.349 | 0.024 | 0.001 | 0.002 |
| Bacteroidales_S24-7_group_NA | 2.682 | 0.443 | 0.001 | 0.113 |
| Bacteroidales_RF16_group_NA | 1.501 | 0.112 | 0.001 | 0.000 |
| Fibrobacter | 4.627 | 0.007 | 0.000 | 0.016 |
| Lachnospiraceae_NA | 1.687 | 1.087 | 0.961 | 0.057 |
| Lachnospiraceae_XPB1014_group | 0.991 | 0.002 | 0.001 | 0.034 |
| Lachnospiraceae_NK4A136_group | 0.324 | 0.025 | 0.002 | 0.001 |
| Treponema_2 | 1.388 | 0.068 | 0.001 | 0.001 |
| Succiniclasticum | 1.057 | 1.241 | 0.002 | 0.332 |
| Succinivibrionaceae_UCG-001 | 0.455 | 39.047 | 0.232 | 0.000 |
| Succinivibrionaceae_UCG-002 | 0.965 | 0.003 | 0.001 | 0.046 |
| Succinivibrionaceae_NA | 0.099 | 6.378 | 0.123 | 0.036 |
| Christensenellaceae_R-7_group | 1.083 | 0.029 | 0.005 | 0.000 |
| Christensenellaceae_NA | 0.014 | 0.000 | 0.000 | 0.007 |
| Erysipelotrichaceae_UCG-004 | 0.805 | 0.128 | 0.001 | 0.013 |
| SP3-e08 | 0.509 | 0.000 | 0.000 | 0.006 |
| Ruminococcus_1 | 0.326 | 0.079 | 0.001 | 0.001 |
| Ruminococcus_2 | 0.188 | 0.015 | 0.001 | 0.011 |
| Ruminococcaceae_UCG-014 | 0.940 | 0.612 | 0.253 | 0.247 |
| Ruminococcaceae_NA | 0.782 | 0.137 | 0.001 | 0.001 |
| Ruminococcaceae_UCG-010 | 0.606 | 0.002 | 0.001 | 0.001 |
| Ruminococcaceae_UCG-002 | 0.573 | 0.115 | 0.010 | 0.012 |
| Ruminobacter | 0.325 | 0.031 | 0.009 | 0.273 |
| Saccharofermentans | 0.354 | 0.000 | 0.000 | 0.001 |
| Butyrivibrio_2 | 0.331 | 0.027 | 0.001 | 0.000 |
| Pseudobutyrivibrio | 0.043 | 0.003 | 0.000 | 0.000 |
Disclaimer/Publisher’s Note: The statements, opinions and data contained in all publications are solely those of the individual author(s) and contributor(s) and not of MDPI and/or the editor(s). MDPI and/or the editor(s) disclaim responsibility for any injury to people or property resulting from any ideas, methods, instructions or products referred to in the content. |
© 2023 by the authors. Licensee MDPI, Basel, Switzerland. This article is an open access article distributed under the terms and conditions of the Creative Commons Attribution (CC BY) license (http://creativecommons.org/licenses/by/4.0/).
Copyright: This open access article is published under a Creative Commons CC BY 4.0 license, which permit the free download, distribution, and reuse, provided that the author and preprint are cited in any reuse.


