Submitted:
09 March 2026
Posted:
12 March 2026
You are already at the latest version
Abstract
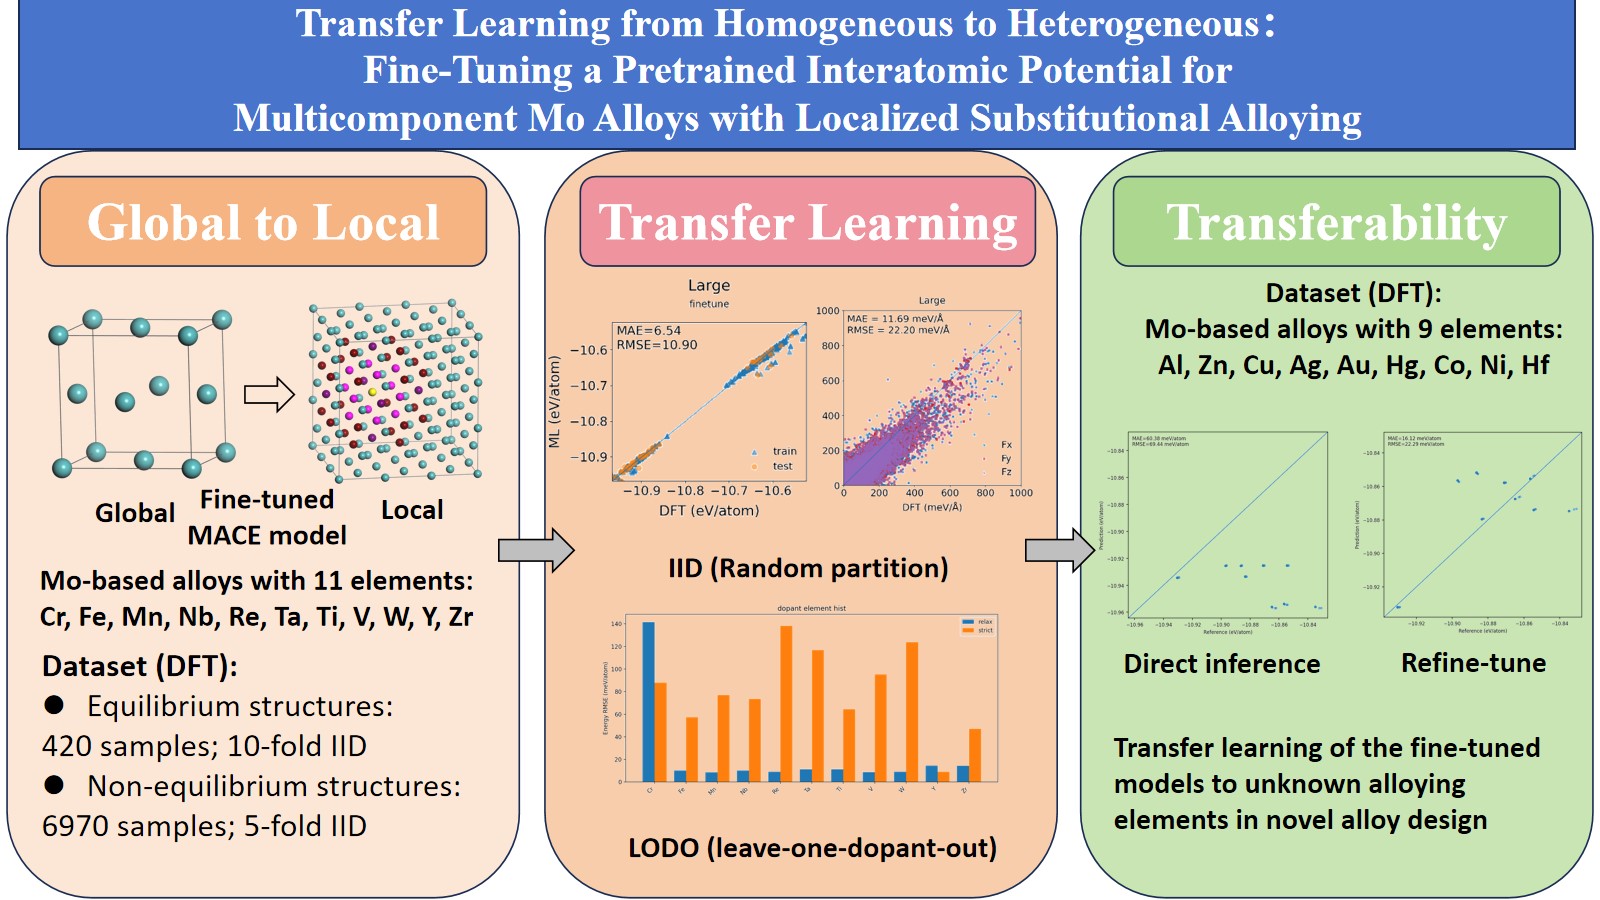
Machine learning interatomic potentials (MLIPs) are typically constructed for homogeneous crystalline systems that exhibit only minimal local deviations from equilibrium configurations. However, substitutional alloying elements in multicomponent engineering alloys are often distributed in a locally heterogeneous form. To address this, we develop a fine tuned MLIP based on the MACE foundation model, specifically tailored for Mo based dilute alloys containing one or two out of 20 substitutional elements: Cr, Fe, Mn, Nb, Re, Ta, Ti, V, W, Y, Zr, Al, Zn, Cu, Ag, Au, Hg, Co, Ni, and Hf. The model is trained on more than 7,000 non equilibrium structures derived from first principles density functional theory (DFT) calculations. The optimized large scale fine tuned model attains state of the art accuracy, with mean absolute error (MAE) and root mean square error (RMSE) of 2.27 meV/atom and 3.79 meV/atom for energy predictions, and 13.83 meV/Å and 24.26 meV/Å for force predictions, respectively. Systematic evaluation of model transferability to unseen alloying elements under different data splitting protocols demonstrates that incorporating even a modest set of new element DFT data during refinement reduces the energy MAE below ~20 meV/atom. The fine tuned models reduce the MAE by approximately 7–10 times compared to models trained from scratch, and by 10–20 times relative to zero shot foundation models. This performance gain remains consistent across varying dataset sizes (equilibrium vs. non equilibrium structures) and model scales. Our work illustrates the efficacy of transfer learning from globally homogeneous systems to locally heterogeneous multi element alloy environments, delivering a robust MLIP tool for the accelerated design of multicomponent alloys.
Keywords:
Machine Learning Interatomic Potentials (MLIPs)
; MACE foundation model
; transfer fine-tuning
; localized substitutional doping
; multicomponent Mo alloy design
1. Introduction
Machine-learning interatomic potentials (MLIPs) are increasingly developed to bridge first-principles accuracy and large-scale simulation efficiency via data-driven implicit energy expressions of a deep learning model[1,2,3]. MLIPs have evolved from descriptor-based and kernel approaches (BPNN, GAP, SOAP, SNAP, MTP, ACE)[4,5,6,7,8,9] to end-to-end graph and equivariant neural networks (SchNet, DimeNet, GemNet, PaiNN, NequIP, MACE)[10,11,12,13,14,15]. State-of-the-art performance of MLIPs is typically driven by large-scale pretraining and reported as low energy/force errors on benchmark datasets[16,17,18,19,20,21,22,23]. Although model capacity and benchmark accuracy have advanced substantially, robustness to distribution shift has not progressed at the same pace. High in-domain accuracy does not necessarily translate into stable extrapolation in task-specific materials settings[24,25,26], which hinders their practical applications in alloy design.
With the emergence of foundation models, pretraining followed by downstream adaptation has become the dominant workflow. Evidence from M3GNet, CHGNet, MACE-MP-0, and MatterSim indicates that universal pretraining can markedly reduce downstream data requirements[16,17,18,19,20,23]. Frozen-transfer and partial fine-tuning studies further report measurable gains in low-data regimes[21,27,28,29]. At the same time, benchmark suites such as OC20/OC22 and Matbench underscore the need for unified OOD evaluation protocols[24,25,26].
However, many existing benchmarks usually involve limited train-test distribution shift, with data dominated by perfect crystals or near-equilibrium globally deformed structures and relatively limited local-environment diversity[30,31,32]. In multicomponent alloy design, e.g., substitutionally doped systems, the local heterogeneous characteristics differs from the globally uniform crystals. Doping simultaneously perturbs elemental composition, site occupancy, and local bonding, causing coupled shifts in both structural and chemical distributions. When held-out dopants are absent from training data, prediction becomes strict out-of-distribution (OOD) extrapolation rather than interpolation. The central question is therefore whether a foundation model pretrained on global crystal data can, after task-specific fine-tuning, deliver stable and reproducible joint energy-force predictions on locally doped systems.
Mo-based alloys are representative materials for extreme-service high-temperature environments because of their high melting point, elevated-temperature strength, and irradiation resistance. Since a large number of alloying elements can be doped into the conventional BCC and hypothetical FCC host lattices, the dopant-composition space expands rapidly, whereas exhaustive enumeration of first-principles density functional theory (DFT) calculations remains computationally expensive for iterative design[33,34,35,36,37]. A systematic assessment of the transfer learning workflow via fine-tuning a pretrained foundation model on locally doped data is therefore of direct scientific and engineering relevance.
This work aims to examine the transferability of pretrained foundation model, e.g., MACE (Message Passing Atomic Cluster Expansion) in substitutional-doping tasks. Under unified data organization and evaluation criteria, we compare zero-shot, scratch, and fine-tune settings to address two questions: (i) whether fine-tuning materially improves predictive fidelity for doped systems, and (ii) whether these gains remain stable under leave-one-dopant-out cross-element evaluation.
To address these questions, we establish a unified validation pipeline on a Mo substitutional-doping dataset in which each structure has both per-atom energy and atomic-force labels. The fine-tuning data are divided into FT-Eq (420 equilibrium/near-equilibrium structures) and FT-NonEq (6970 non-equilibrium structures). Zero-shot, scratch, and fine-tune paradigms are compared under matched training settings. The evaluation includes both interpolation on independent and identically distributed (IID) and dopant-level leave-one-dopant-out (LODO) (Strict and Relaxed) protocols. The energy/force MAE and RMSE are reported consistently to distinguish in-distribution fitting from cross-element extrapolation. We further perform direct inference on elements absent from training to probe practical deployment limits for unseen dopants. This boundary test uses proxy-element mapping and should not be interpreted as strict modeling of true unseen chemical identities.
The contributions in this study are threefold. First, we establish standardized data organization and evaluation protocols for Mo-doping systems, together with a reproducible joint energy-force training workflow. Second, we quantify transfer gains from global crystal pretraining to locally doped-distribution adaptation through direct comparison of zero-shot, scratch, and fine-tune paradigms. Third, we characterize both effective operating regions and failure boundaries of fine-tuning under IID and LODO protocols, providing practical guidance for re-training and rapid calibration on new dopants. Overall, this study demonstrates a transfer learning protocol from global to local systems that provides a generally practical tool for multicomponent alloy design.
2. Methods and Datasets
2.1. Fine-Tuning Dataset of Doped Mo Alloys
Before introducing the task-specific Mo-doping dataset, we briefly summarize the pretraining corpus of the base checkpoint used in this work (MACE-MP-0). The MACE-MP family is pretrained on the MPtrj dataset, which aggregates static calculations and ionic-relaxation trajectories from the Materials Project38. The architecture of MACE models is shown in Text S1 of the Supplementary Materials (SM). In essence, this pretraining distribution is dominated by ideal or slightly distorted crystalline environments whose chemical constituents are uniformly distributed following a global crystal symmetry, whereas our target dataset focuses on substitutionally doped Mo systems with explicit local chemical-disorder and geometrical-distortion effects. This training-data domain gap is exactly why fine-tuning on the heterogenous doped dataset is necessary in this study.
The dataset used in this work was obtained from first-principles (DFT) calculations of substitutionally doped Mo alloys in both BCC and FCC lattice, using GGA-PBE exchange-correlational functional same as that in MACE model construction. Our calculations on the doped Mo alloys take into account the spin polarization that is critical to magnetic elements. The conventional stable structure for Mo is BCC at ambient conditions, while the hypothetical FCC Mo provides more high-energy metal stable structures, especially the closet-packed crystal environment for the dopants, which improves the size and diversity of training data.
As shown in Figure 1 (a) and (b), the local doping environment is defined around a central reference Mo site together with representative neighboring sites (Mo1–Mo3), which are used to construct substitutional configurations in the BCC and FCC host lattices. Following common Mo-based alloy systems, we studied 11 dopant elements at a dilute concentration (0.78-1.85 at%), including Cr, Fe, Mn, Nb, Re, Ta, Ti, V, W, Y, and Zr, to substitute for Mo1-Mo3 sites. The dataset contains single-site and double-site substitution samples with the first, second, and third neighbors, corresponding to one or two alloying elements out of the 11 candidates in a BCC (128 atoms) or FCC (108 atoms) supercell with fixed lattice parameters of the optimized pure Mo.
Let denote the dopant-element set of structure . and 2 represent the single-dopant and double-dopant configurations, respectively. This definition is used consistently for data grouping in IID and LODO protocols. For data management and reproducibility, samples are partitioned by configuration state into FT-Eq (equilibrium/near-equilibrium) and FT-NonEq (equilibrium and non-equilibrium), containing 420 and 6970 structures, respectively. The FT-NonEq dataset contains FT-Eq samples, so the full dataset has 6970 structures where FT-Eq provides near-equilibrium structural information and FT-NonEq expands coverage of perturbed local environments during the geometrical relaxation process.
Each data sample retains complete structure-energy-force information:
where is the atomic coordinate matrix, denotes element identities, is the per-atom energy, is the force label of atom , and is the number of atoms in structure . Energy and force units are standardized as meV/atom and meV/Å, respectively.
All ML model construction were conducted on this unified dataset, excluding the verification datasets of new elements in section 3.3. Data variability is controlled along three dimensions: matrix crystals (BCC/FCC), dopant combination (single/double site), and configuration state (Eq/NonEq).
2.2. Model Training Protocols and Evaluation Metrics
(1) Model settings
To evaluate the interplay between global pretraining priors and local-domain adaptation, we construct three directly comparable settings (zero-shot, scratch, and fine-tune) under unified data protocols and model scales (Table S1 of the SM). The three training paradigms are described as follows. (a) Zero-shot model: direct inference on the target system using a pretrained MACE checkpoint, without parameter updates, to quantify cross-domain transferability. (b) Scratch model: training from random initialization under the same architecture, to characterize achievable performance without pretrained priors. (c) Fine-tuned model: continued optimization from pretrained weights on target-domain data, to quantify error reduction and adaptation gains from transfer learning. The three settings differ only in parameter initialization and whether weights are updated. All the other training and evaluation conditions are identical.
To investigate the data-size effects of the fine-tuning, we further evaluate two fine-tuning data regimes: FT-Eq (equilibrium fine-tuning), using 420 equilibrium/near-equilibrium structures (small dataset); FT-NonEq (non-equilibrium fine-tuning), using 6970 non-equilibrium structures (large dataset). These two settings share the same pretrained initialization and training configuration (optimizer, learning-rate schedule, batch organization, and early-stopping strategy) and differ only in fine-tuning data source and scale. FT-Eq and FT-NonEq are not sample-size matched. Therefore, this comparison is intended for practical performance assessment rather than strict single-factor causal attribution to equilibrium versus non-equilibrium state. Under this unified setup, the FT-Eq versus FT-NonEq comparison addresses two questions: whether small equilibrium datasets provide stable energy calibration, and whether large non-equilibrium datasets improve local potential-energy-surface coverage and overall error profiles. Quantitative comparison results are reported in Section 3.
(2) Data splitting and evaluation protocols
Two data splitting protocols were used in this work: independent and identically distributed (IID) and dopant-level leave-one-dopant-out (LODO). The IID protocol randomly splits all samples into training, validation, and test sets at a (81:9):10 ratio. The random split were independently performed 10 times for the equilibrium data and five times for the non-equilibrium data. This protocol evaluates interpolation performance under matched distributions.
The LODO protocol builds extrapolative tests by grouping data by the type of dopant element. Under LODO, each element fold is trained and tested independently. For any held-out element , we apply two data partition rules: (a) Strict-LODO: if , sample is assigned to the test set. For double-site substitution samples, the presence of at either site is sufficient for test assignment rather than in training dataset, which means the new element for the test was completely unseen in the training. which means the new element for the test was completely unseen in the training. This strategy maximally avoids elemental information leakage and provides stricter transfer assessment. (b) Relaxed-LODO: single-site samples are assigned by ; double-site samples are assigned to test only when both sites satisfy the hold-out rule while the new element appeared in one of the double-sites was partially seen in the training. This protocol is less restrictive and estimates an upper performance bound under partial element co-occurrence.
We report mean and standard deviation across folds to quantify element-wise stability. Model selection is based on validation performance only; the test set is used once for final reporting. For fair comparison, scratch and fine-tune share identical data splits, graph-construction settings, batch organization, optimizer, and learning-rate schedule.
(3) Loss functions and evaluation metrics
Training jointly constrains energy and atomic forces. Let the dataset contain structures, where structure has atoms. Predicted and reference per-atom energies are and ; predicted and reference atomic forces are and . The energy and force terms are
The total loss is defined as
The equal weights were used to calculate the total loss in this work. This setting balances energy calibration and local potential-energy-surface fidelity, mitigating ranking instability and geometric inconsistency that can arise under single-objective optimization. The <MAE> and <RMSE> averaged over the independent split runs were used as evaluation metrics of ML models for both energy and force whose units are meV/atom and meV/Å, respectively.
Let the test set contain structures, with predicted and reference per-atom energies and . The energy metrics are
For force metrics, where structure has atoms and predicted/reference forces are and , we define
For reproducibility, the key implementation settings for training and inference are summarized in Table S1 of the SM.
3. Results and Discussion
In this work the workflow consists of four stages (Figure 2) as follows: (i) Preparation and splitting of BCC/FCC doping datasets; (ii) Construction of three ML models based on pretrained MACE: zero-shot, scratch, and fine-tune models; (iii) Joint energy-force evaluation under IID and LODO data protocols; and (iv) Verification and error analysis for unseen dopant elements. The model performances are compared across the zero-shot, scratch, and fine-tune paradigms under IID and LODO data protocols. The evaluation metrics are energy <MAE>/<RMSE> (meV/atom) and force <MAE>/<RMSE> (meV/Å) averaged over 10 or 5 independent runs. Unless otherwise stated, values are test-set metrics from validation-selected models. The LODO results are also reported as mean and standard deviation across element folds.
3.1. Construction of Fine-Tuned Models with Randomly Partitioned Datasets
The randomly partitioned dataset, following an independent and identically distributed (IID) split, is used to assess model fitting accuracy and numerical stability under matched training and test distributions. In this setting, both training and test samples are drawn randomly from the same underlying data pool, thereby sharing the same statistical distribution. Model performance on the test sets is summarized in Table 1 for three training paradigms—the zero-shot, scratch-trained, and fine-tuned models—evaluated across small, medium, and large parameter scales on the equilibrium structure dataset (Eq, 420 samples). Additional results are provided for the fine-tuned model trained on the non-equilibrium structure dataset (NonEq, 6,970 samples). The small, medium, and large scales correspond to the officially released MACE-MP-0 model variants with trainable parameter counts of 3,847,696, 4,688,656, and 5,725,072, respectively.
On the equilibrium (Eq) structure dataset (Table 1), the fine-tuned model consistently attains substantially lower energy prediction errors across all model parameter scales, with <MAE> ranging from 7.34 to 17.07 meV/atom and <RMSE> from 13.20 to 30.31 meV/atom. In contrast, the model trained from scratch exhibits notably higher errors (<MAE>: 75.04–121.53 meV/atom; <RMSE>: 124.60–153.38 meV/atom), while the zero-shot model yields the largest deviations (<MAE>: 143.93–184.43 meV/atom; <RMSE>: 151.50–200.03 meV/atom). The energy prediction error of the fine-tuned model decreases monotonically as the model parameter size increases. In contrast, neither the scratch-trained model nor the zero-shot model exhibits a consistent scaling trend; this deviation is likely attributable to the limited size of the equilibrium dataset, which may hinder stable convergence and generalization across different model scales.
The fine-tuned model outperforms both the scratch-trained and zero-shot models at every scale examined in energy prediction. Specifically, the scratch-trained model shows energy <MAE> values that are 7.1–10.2 times higher, and <RMSE> values 5.1–10.0 times higher, than those of the fine-tuned model. Similarly, the zero-shot model produces <MAE> and <RMSE> values that are 10.8–19.6 times and 6.6–12.2 times greater, respectively, compared to the fine-tuned model.
On the equilibrium (Eq) structure dataset (Table 1), the fine-tuned model achieves the lowest force prediction errors across all model parameter scales, with <MAE> ranging from 11.00 to 12.98 meV/Å and <RMSE> from 22.25 to 26.32 meV/Å. In comparison, the model trained from scratch exhibits generally higher and more variable errors (<MAE>: 3.57–17.08 meV/Å; <RMSE>: 5.91–31.17 meV/Å), while the zero-shot model yields the largest deviations (<MAE>: 44.55–69.44 meV/Å; <RMSE>: 88.57–146.13 meV/Å). Notably, although the scratch-trained model attains lower force errors in certain cases, it suffers from substantially higher energy errors compared to the fine-tuned model. This discrepancy is likely attributable to convergence issues arising from training on limited equilibrium data across varying model sizes. Across training paradigms, the fine-tuning strategy generally provides the best energy-force balance.
The fine-tuned model delivers generally more consistent and accurate force predictions than both the scratch-trained and zero-shot approaches. Relative to the fine-tuned model, the scratch-trained model shows force <MAE> values that range from 0.3 times lower to 1.3 times higher, and <RMSE> values that are 0.3 times lower to 1.2 times higher. In contrast, the zero-shot model exhibits markedly larger errors, with force <MAE> and <RMSE> values approximately 4.1–5.3 times and 4.0–5.6 times greater, respectively.
Incorporating extensive non-equilibrium structural data (NonEq) substantially enhances the prediction accuracy of the fine-tuned model across all parameter scales. The fine-tuned model trained with non-equilibrium data (FT-NonEq) achieves energy prediction errors in the range of 2.27–5.55 meV/atom (<MAE>) and 3.79–7.47 meV/atom (<RMSE>), and force prediction errors of 13.83–18.28 meV/Å (<MAE>) and 24.26–31.58 meV/Å (<RMSE>). In comparison, the model fine-tuned solely on equilibrium data (FT-Eq) exhibits notably larger energy errors. Compared to the FT-NonEq model, the FT-Eq model shows energy <MAE> and <RMSE> values that are approximately 3.1–3.2 times and 3.5–4.1 times higher, respectively.
However, for force prediction, the FT-Eq model achieves lower errors than the FT-NonEq model, with <MAE> and <RMSE> values ~ 0.7–0.8 and 0.8–0.9 times those of the FT-NonEq model, respectively. Across all model parameter scales, force prediction accuracy on the equilibrium structure dataset (Eq) consistently surpasses that on the non-equilibrium dataset (Non-Eq). Specifically, the force <MAE> values for FT-Eq are 11.00, 11.11, and 12.98 meV/Å at small, medium, and large scales, while the corresponding values for FT-NonEq are 18.28, 15.69, and 13.83 meV/Å. Beyond differences in dataset size, this performance gap likely stems from distinct force-distribution characteristics. The FT-Eq dataset consists predominantly of equilibrium structures, where atomic forces cluster near zero. In contrast, the FT-NonEq dataset includes a broad range of non-equilibrium configurations with more widely distributed non-zero force values. While this makes force prediction more challenging, it also better reflects physically realistic scenarios and enhances the practical utility of the model.
Figure 3 displays parity plots comparing predicted force components in the non-equilibrium structure dataset from the representative fine-tuned models (FT-NonEq) against reference DFT calculations, evaluated across three model parameter scales: Small, Medium, and Large. Each plot shows individual data points for the three Cartesian force components (Fx, Fy, Fz), represented by distinct colors, with a diagonal line indicating perfect agreement. The three force components show comparable levels of accuracy across all scales, with no consistent bias observed toward any particular direction. Across all scales, the model demonstrates strong predictive capability, with the vast majority of data points clustering tightly along the parity line. The overall error metrics (MAE and RMSE) remain relatively stable and decrease with parameter scales, ranging from 11.69–15.20 meV/Å for MAE and 22.20–28.95 meV/Å for RMSE.
The machine learning model exhibits consistent and high-quality force prediction across varying model scales, with the better performance observed at the larger scale as discussed below.
(a) Small scale model: The prediction errors are higher than in the other scales, with MAE at 15.20 meV/Å and RMSE at 28.95 meV/Å. While the scatter is still reasonably contained, a few outliers appear at higher force magnitudes.
(b) Medium scale model: This medium scale model yields the modest overall error, with MAE = 13.11 meV/Å and RMSE = 24.96 meV/Å. The data points are more densely clustered around the parity line, indicating improved model precision compared to the small scale model.
(c) Large scale model: The large scale model leads to the lowest overall error, with MAE = 11.69 meV/Å and RMSE = 22.20 meV/Å. The scatter of points is denser and closer to the the parity line, especially at higher force magnitudes (> 600 meV/Å), suggesting the large parameter scale improves prediction accuracy for extreme force values.
Overall, the combination of large-scale model parameters and non-equilibrium training data yields the best performance, achieved by the FT-NonEq (Large) model. This optimal model attains the lowest errors in this study, with energy prediction <MAE> and <RMSE> of 2.27 meV/atom and 3.79 meV/atom, respectively, and force prediction <MAE> and <RMSE> of 13.83 meV/Å and 24.26 meV/Å, respectively.
Figure 4 compares the energy predictions of three machine learning models at varying parameter scales against DFT reference values for the randomly partitioned test dataset (IID) of equilibrium structures. For each model configuration, the displayed panel corresponds to the fold whose evaluation metrics align most closely with the mean values reported in Table 1. The fine-tuned models at all three scales demonstrate substantially closer agreement with the reference data, as evidenced by their tighter clustering around the y = x line. In contrast, both the scratch-trained and zero-shot models exhibit more pronounced systematic offsets and heavier distribution tails.
As shown in Figure 4 (a)–(c), the fine-tuned model provides reasonably accurate predictions even at the smallest scale, with only slight systematic deviations. These deviations are progressively reduced as the model size increases. In comparison, the scratch-trained model [Figure 4 (d)–(f)] captures the general trend for most data points but produces a notable number of random high-error outliers. These outliers persist across all parameter scales and are not eliminated by increasing model capacity. The zero-shot model [Figure 4 (g)–(i)] displays the most severe systematic bias, which remains largely unchanged even when model size is increased.
3.2. Verification of Fine-Tuned Models with Leave-One-Dopant-Out Partitioned Datasets
The leave-one-dopant-out (LODO) data partition protocol evaluates transfer robustness across held-out dopant elements. Table 2 presents the LODO test results for fine-tuned MACE models (FT-Eq) at a medium scale on a series of Mo-based alloys, evaluated under two data-splitting protocols: strict and relaxed. A clear performance gap is observed between the two protocols. Under the strict protocol, the mean energy MAE is substantially higher (76.98 meV/atom) and exhibits large variability (± 36.05 meV/atom), indicating poor generalization to completely unseen doped alloying elements. The force predictions are also less accurate, with a mean MAE of 41.0 meV/Å. In stark contrast, the relaxed protocol yields a drastic improvement: the mean energy MAE drops to 20.03 meV/atom, and force MAE is more than halved to 18.8 meV/Å. Variability in errors is also significantly reduced.
The Relaxed-LODO mean statistics are strongly affected by the outlier Cr (Energy MAE = 136.15 meV/atom). Excluding the Cr element, we recomputed protocol means. Under the Strict-LODO protocol the averaged Energy RMSE over the remaining elements is 80.23 meV/atom, whereas the Relaxed-LODO mean is 10.69 meV/atom (Table 2). This corresponds to an 86.67% reduction from Strict-LODO to Relaxed-LODO.
Notably, the performance disparity is consistent through most elements except for a few element-dependent cases. For most elements (e.g., Fe, Mn, Nb, Re, Ta, Ti, V, W), the relaxed protocol leads to a massive reduction in energy errors—often by an order of magnitude. Their energy MAE under the strict protocol ranges from ~54 to ~132 meV/atom, but falls to below ~10 meV/atom under the relaxed protocol.
In contrast, for Cr and Y, the relaxed protocol results in comparable or even slightly worse performance compared to the strict protocol, suggesting these elements may possess distinct chemical or structural features that are not well-represented in the training data of the other splits. Based on the LODO test results in Table 2, the elements Cr and Y exhibit a markedly different performance trend compared to the other dopants (Fe, Mn, Nb, Re, Ta, Ti, V, W) when moving from the strict to the relaxed LODO protocol.
For Chromium (Cr), its energy MAE increases from 84.01 meV/atom (strict) to 136.15 meV/atom (relaxed), and force MAE also rises significantly (Table 2). This indicates the model’s performance degrades for Cr when trained on data that includes other, dissimilar dopants. Cr likely has electronic or bonding characteristics (e.g., magnetic behavior, specific d-electron interactions with Mo) that are sufficiently different from the other transition metals in the list. When the model is trained on data containing those other elements (relaxed protocol), the learned representations are not transferable to Cr, leading to poor generalization. The anomalous error observed for Cr under the Relaxed-LODO protocol likely stems from its highly localized and complex magnetic characteristics. Unlike most other transition metal dopants in this study, Cr exhibits strong anti-ferromagnetic coupling in body-centered cubic (BCC) environments, which heavily perturbs the local potential energy surface. Because the MACE architecture relies on spatial message passing without explicit spin-polarization features, the model struggles to interpolate these sharp energetic penalties from partial chemical environments, leading to the severe degradation seen in Table 2.
For Yttrium (Y), while it shows the lowest error under the strict protocol (6.80 meV/atom), its error under the relaxed protocol increases to 10.03 meV/atom (Table 2). Unlike the others, Y’s error does not improve with the more permissive training data; it gets slightly worse. Y is chemically distinct as a larger and more electropositive rare-earth element. Its size, charge, and bonding nature (with possible stronger ionic character) are fundamentally different from the smaller transition metal dopants. While the model can learn a specific mapping for Y alone (strict protocol), incorporating the interaction with the other elements (relaxed protocol) introduces a conflicting signal that degrades the model’s specific performance for Y, though not as catastrophically as for Cr.
In summary, the fine-tuned MACE model demonstrates strong and stable predictive capability under the relaxed LODO protocol whose training data is chemically informative and generalizable successfully to most unseen alloying elements with high accuracy. The strict protocol, however, reveals a significant generalization challenge, highlighting a strong model dependence on the specific dopant seen during training. The exceptional cases (e.g., Cr and Y) under the relaxed protocol appears to be non-transferable as outliers in the chemical/feature space defined by the other dopants in this alloy system, which warrant further investigation into their unique bonding environments or potential data representation gaps.
Figure 5 illustrates the energy prediction error (MAE and RMSE) using the fine-tuned MACE models for various dopant elements in Mo-based alloys under two Leave-One-Dopant-Out (LODO) partitioning protocols: Strict-LODO and Relaxed-LODO.
For the majority of dopant elements — including Fe, Mn, Nb, Re, Ta, Ti, V, and W — the model exhibits markedly improved predictive accuracy under the relaxed LODO protocol compared to the strict LODO protocol. This is reflected in the substantial reduction of MAE and RMSE values, with the “relax” bars being consistently and significantly shorter than the “strict” bars. This suggests that the relaxed data partitioning strategy enhances model generalization for these elements, likely by mitigating overfitting to specific dopant-specific training subsets and leveraging broader structural diversity.
Quantitatively, under the strict protocol, energy RMSE values for these elements range from ~ 57 meV/atom (Fe) to 138 meV/atom (Re). In contrast, under the relaxed protocol, the same elements show RMSE values between 6.46 meV/atom (Re) and 18.28 meV/atom (W), indicating a reduction by roughly one order of magnitude on average. This dramatic improvement underscores the effectiveness of the relaxed protocol in stabilizing predictions for well-behaved dopant systems.
Overall, the chart of Figure 5 reveals a consistent trend across most dopant elements, with notable exceptions that warrant separate discussion below except for Cr and Y discussed earlier.
(i) Niobium (Nb): Exhibits moderate RMSE under the strict protocol (~73.65 meV/atom) but achieves one of the lowest RMSE under the relaxed protocol (~8.56 meV/atom). Its performance improvement is among the most pronounced, suggesting that Nb benefits significantly from the increased data heterogeneity introduced by the relaxed partitioning.
(ii) Rhenium (Re): Despite having the highest RMSE under the strict protocol (~138.02 meV/atom), Re shows the lowest RMSE under the relaxed protocol (~6.46 meV/atom). This exceptional improvement implies that Re’s predictive difficulty under strict conditions stems primarily from limited or biased training representation, which is effectively alleviated in the relaxed setting.
(iii) Tantalum (Ta): Demonstrates a relatively high strict-error (~116.76 meV/atom) but drops sharply to ~8.89 meV/atom under relaxation. The magnitude of improvement is comparable to Re and Nb, indicating that Ta’s model performance is highly sensitive to data partitioning strategy.
(iV) Tungsten (W): Although its strict-error (~123.69 meV/atom) is among the highest, its relaxed-error (~8.01 meV/atom) is among the lowest. W’s behavior mirrors that of Re and Ta, reinforcing the pattern that heavy refractory metals (Re, Ta, W) exhibit high sensitivity to data partitioning, with large gains achievable under relaxed conditions.
The discussion above can be further supported by the energy parity plots in Figure 6 for each held-out element in the equilibrium structure dataset (Eq) predicted by the fine-tuned MACE model (FT-Eq) at a medium scale compared with the DFT references under Strict-LODO and Relaxed-LODO data protocols. It shows that the inclusion of Cr in the relaxed training dataset did not help to improve the prediction performance [Figure 6 (a)], while Y element behaves well in both the strict and relaxed cases [Figure 6 (j)]. The other alloying elements have systematic deviation from the diagonal lines in the strict cases but recover back to the references in the relaxed cases, which indicates the partially seen elements in thetraining period are critical to the good prediction performance.
In summary, excluding the anomalous behavior of Cr and Y, the remaining dopant elements demonstrate a clear and favorable response to the relaxed LODO protocol. Most notably, Re, Ta, and W — despite exhibiting high errors under strict partitioning — achieve state-of-the-art prediction accuracy under relaxation, highlighting the importance of data diversity for modeling these elements. Nb also shows substantial improvement, confirming that the relaxed protocol enhances generalization across a broad range of dopant chemistries. This consistent trend supports the conclusion that relaxed partitioning is a critical strategy for achieving robust and accurate energy predictions in Mo-based alloy systems, particularly for elements that are otherwise poorly represented or inherently complex under strict training conditions.
Overall, both the random partition (IID) and element-wise partition (LODO) results show that the fine-tuned MACE provides practical accuracy for both in-distribution fitting and cross-element transfer. Under IID, absolute errors reach the meV/atom level (Energy MAE: 2.27–17.07 meV/atom). Under LODO, after excluding the Cr element, the mean Energy MAE is 76.27 meV/atom for Strict-LODO and 8.42 meV/atom for Relaxed-LODO. Based on these results, the following application study uses the fine-tuned MACE as the primary model and examines reliability boundaries for new elements against DFT references.
3.3. Transferability of Fine-Tuned Models to Unknown Alloying Elements
To assess the transferability of the fine-tuned models to unknown alloying elements in novel alloy design, this work evaluates nine substitutional elements not present in the original training set: Al, Zn, Cu, Ag, Au, Hg, Co, Ni, and Hf. A total of 79 non-equilibrium structures were generated from single-site substitution systems in a BCC Mo matrix via geometric relaxation. These elements were chosen to extend coverage to a broad range of transition metals with d-orbital electrons, complementing the original training set of 11 alloying elements, and to include the industrially relevant p-block element Al. Model predictions are benchmarked against DFT reference calculations.
First, we examine the capability of the previous fine-tuned MACE model (FT-Eq) at a medium scale to predict directly the unknown doped alloys without changing their architecture and parameters. The fine-tuned MACE model contains embeddings only for the element types observed during training stage of the fine-tuning process and does not provide valid representations for the unseen atomic numbers. Therefore, the unseen elements are mapped to known elements with close atomic numbers, period, or group in the periodic table and their corresponding embeddings are reused as a proxy setting. Concretely, each unseen element is initialized by a proxy embedding from a training-set element. This proxy step is used only for embedding initialization at inference and does not alter the test-set settings. This prediction strategy is essentially a direct inference with proxy initialization via mapping of the known elements, denoted as DIPI. This DIPI approach probes engineering-level applicability under elemental extrapolation but does not constitute strict chemical-identity modeling of truly unseen elements.
Figure 7 (a) presents the prediction results obtained via the direct inference (DIPI) approach. The data points predominantly lie below the y = x line, forming a distinct banded pattern that reflects a systematic underestimation of the new-element samples. The corresponding energy errors remain substantial, with an MAE of 60.38 meV/atom and an RMSE of 69.44 meV/atom. Nevertheless, these errors are notably lower than those of the scratch-trained model (MAE= ~112 meV/atom, RMSE= ~144 meV/atom) and the zero-shot model (MAE= ~184 meV/atom, RMSE= ~200 meV/atom). The observed degradation in accuracy arises primarily from element-identity aliasing induced by the proxy-mapping procedure. Since the model cannot explicitly distinguish the electronic-structure differences associated with actual atomic numbers, it provides only approximate, surrogate responses in chemically similar environments. Consequently, the direct-inference results should be interpreted as a conservative estimate of the current model’s capability rather than a rigorous upper bound for predictions on unseen elements.
Figure 7 (b) shows the predictions from the refine-tuned models. The scatter points lie close to the y = x line, with an MAE of 16.12 meV/atom and an RMSE of 22.29 meV/atom. Although these errors are higher than those of the original fine-tuned model on the equilibrium set (FT-Eq, medium scale: MAE = 8.10 meV/atom, RMSE = 12.45 meV/atom), they represent a 73.3% reduction in MAE and a 67.9% reduction in RMSE compared to the direct-inference approach. This comparison demonstrates that refine-tuning substantially improves reliability for unseen-element prediction, mitigating the strong element-identity aliasing errors inherent in direct proxy-based inference.
Potential improvements for enhancing transferability to unseen elements include: explicitly incorporating new elements during pre-training or fine-tuning, expanding the set of learnable element embeddings, and performing rapid recalibration with a small amount of additional DFT data for the new elements. Here, we adopt an independent and identically distributed (IID) data partition protocol, randomly splitting all samples into training, validation, and test sets in an (81:9):10 ratio. This IID split ensures that all new elements appear in the training data, while the test set contains only the new elements, ~ 50 structures across the nine alloying elements. The random partitioning was repeated independently 10 times, and the previously fine-tuned models were retrained on each split; these updated models are denoted as refine-tuned models. The reported errors are averaged over the 10 independent runs.
4. Conclusions
Machine learning interatomic potentials (MLIPs) are typically developed for globally homogeneous crystal systems that exhibit only minor local distortions around equilibrium positions. In contrast, multicomponent engineering alloys often contain substitutional alloying elements that are distributed non-uniformly within the matrix, resulting in locally heterogeneous chemical short-range order. To address this, we developed a fine-tuned MLIP based on the MACE foundation model, specifically designed for dilute Mo-based alloys doped with 20 substitutional elements: Cr, Fe, Mn, Nb, Re, Ta, Ti, V, W, Y, Zr, Al, Zn, Cu, Ag, Au, Hg, Co, Ni, and Hf. The MLIP model was trained on over 7,000 non-equilibrium structures obtained from first-principles density functional theory (DFT) calculations.
The optimized large-scale fine-tuned model achieves state-of-the-art accuracy, with mean absolute errors (MAE) of 2.27 meV/atom for energy and 13.83 meV/Å for force prediction, and corresponding root-mean-square errors (RMSE) of 3.79 meV/atom and 24.26 meV/Å, respectively. We systematically evaluated the transferability of the fine-tuned models to unseen alloying elements using different data-partition protocols. Validation tests strongly recommend incorporating a limited amount of new-element data to refine the model, which reduces the energy MAE to below approximately 20 meV/atom.
The fine-tuned models outperform scratch-trained models (trained without pretrained weights) by a factor of 7–10 in MAE, and surpass zero-shot foundation models (without fine-tuning) by a factor of 10–20. This substantial improvement is consistently observed across different dataset sizes (equilibrium vs. non-equilibrium structures) and model parameter scales. Our work demonstrates the necessity and effectiveness of transfer learning from globally representative systems to locally ordered alloy environments, offering a practical MLIP tool for the intelligent design of multicomponent alloys.
Supplementary Materials
The following supporting information can be downloaded at the website of this: paper posted on Preprints.org.
CRediT authorship contribution statement
Lixin Fang—Data curation; Formal analysis; Investigation; Methodology; Software; Visualization; Writing—original draft; Liqin Qin—Methodology; Software; Validation; Limin Zhang—Methodology; Software; Validation; Hao Zhou—Methodology; Software; Xudong He—Methodology; Software; Zekun Ren—Conceptualization; Methodology; Software; Formal analysis; Writing—review & editing; Tongyi Zhang—Methodology; Project administration; Supervision; Yi Liu—Conceptualization; Formal analysis; Funding acquisition; Methodology; Project administration; Resources; Supervision; Writing—review & editing.
Acknowledgments
We thank the National Natural Science Foundation of China (No. 52373227) and the National Key R&D Program of China (Nos. 2017YFB0701502 and 2017YFB0702901) for financial supports. This work was also supported by the Shanghai Technical Service Center for Advanced Ceramics Structure Design and Precision Manufacturing (No. 20DZ2294000).
Declaration of Competing Interest
The authors declare that they have no known competing financial interests or personal relationships that could have appeared to influence the work reported in this paper.
Code Availability
Code and training scripts are publicly available at https://github.com/lixin716/Transfer-Learning-from-Global-to-Local-Mo-alloys.
References
- Xu, H.; Cui, T.; Tang, C.; Ma, J.; Zhou, D.; Li, Y.; Gao, X.; Gong, X.; Ouyang, W.; Zhang, S. Evidential Deep Learning for Interatomic Potentials. Nature Communications 2025. [Google Scholar] [CrossRef]
- Yang, Z.; Wang, X.; Li, Y.; Lv, Q.; Chen, C. Y.-C.; Shen, L. Efficient Equivariant Model for Machine Learning Interatomic Potentials. NPJ Computational Materials 2025, 11(1), 49. [Google Scholar] [CrossRef]
- Ran, N.; Yin, L.; Qiu, W.; Liu, J. Recent Advances in Machine Learning Interatomic Potentials for Cross-Scale Computational Simulation of Materials. Sci. China Mater. 2024, 67(4), 1082–1100. [Google Scholar] [CrossRef]
- Behler, J.; Parrinello, M. Generalized Neural-Network Representation of High-Dimensional Potential-Energy Surfaces. Phys. Rev. Lett. 2007, 98(14), 146401. [Google Scholar] [CrossRef]
- Bartók, A. P.; Payne, M. C.; Kondor, R.; Csányi, G. Gaussian Approximation Potentials: The Accuracy of Quantum Mechanics, without the Electrons. Phys. Rev. Lett. 2010, 104(13), 136403. [Google Scholar] [CrossRef]
- Bartók, A. P.; Kondor, R.; Csányi, G. On Representing Chemical Environments. Phys. Rev. B 2013, 87(18), 184115. [Google Scholar] [CrossRef]
- Thompson, A. P.; Swiler, L. P.; Trott, C. R.; Foiles, S. M.; Tucker, G. J. Spectral Neighbor Analysis Method for Automated Generation of Quantum-Accurate Interatomic Potentials. Journal of Computational Physics 2015, 285, 316–330. [Google Scholar] [CrossRef]
- Shapeev, A. V. Moment Tensor Potentials: A Class of Systematically Improvable Interatomic Potentials. Multiscale Model. Simul. 2016, 14(3), 1153–1173. [Google Scholar] [CrossRef]
- Drautz, R. Atomic Cluster Expansion for Accurate and Transferable Interatomic Potentials. Phys. Rev. B 2019, 99(1), 014104. [Google Scholar] [CrossRef]
- Schütt, K.; Kindermans, P.-J.; Sauceda Felix, H. E.; Chmiela, S.; Tkatchenko, A.; Müller, K.-R. Schnet: A Continuous-Filter Convolutional Neural Network for Modeling Quantum Interactions. Advances in neural information processing systems 2017, 30. [Google Scholar]
- Gasteiger, J.; Groß, J.; Günnemann, S. Directional Message Passing for Molecular Graphs. arXiv 2022. [Google Scholar] [CrossRef]
- Gasteiger, J.; Becker, F.; Günnemann, S. Gemnet: Universal Directional Graph Neural Networks for Molecules. Advances in neural information processing systems 2021, 34, 6790–6802. [Google Scholar]
- Schütt, K.; Unke, O.; Gastegger, M. Equivariant Message Passing for the Prediction of Tensorial Properties and Molecular Spectra. In International conference on machine learning; 2021, PMLR; pp. 9377–9388.
- Batzner, S.; Musaelian, A.; Sun, L.; Geiger, M.; Mailoa, J. P.; Kornbluth, M.; Molinari, N.; Smidt, T. E.; Kozinsky, B. E (3)-Equivariant Graph Neural Networks for Data-Efficient and Accurate Interatomic Potentials. Nature communications 2022, 13(1), 2453. [Google Scholar] [CrossRef]
- Batatia, I.; Kovacs, D. P.; Simm, G.; Ortner, C.; Csányi, G. MACE: Higher Order Equivariant Message Passing Neural Networks for Fast and Accurate Force Fields. Advances in neural information processing systems 2022, 35, 11423–11436. [Google Scholar]
- Gasteiger, J.; Shuaibi, M.; Sriram, A.; Günnemann, S.; Ulissi, Z.; Zitnick, C. L.; Das, A. GemNet-OC: Developing Graph Neural Networks for Large and Diverse Molecular Simulation Datasets. arXiv 2022. [Google Scholar] [CrossRef]
- Chen, C.; Ong, S. P. A Universal Graph Deep Learning Interatomic Potential for the Periodic Table. Nature Computational Science 2022, 2(11), 718–728. [Google Scholar] [CrossRef] [PubMed]
- Deng, B.; Zhong, P.; Jun, K.; Riebesell, J.; Han, K.; Bartel, C. J.; Ceder, G. CHGNet as a Pretrained Universal Neural Network Potential for Charge-Informed Atomistic Modelling. Nature Machine Intelligence 2023, 5(9), 1031–1041. [Google Scholar] [CrossRef]
- Batatia, I.; Benner, P.; Chiang, Y.; Elena, A. M.; Kovács, D. P.; Riebesell, J.; Advincula, X. R.; Asta, M.; Avaylon, M.; Baldwin, W. J. A Foundation Model for Atomistic Materials Chemistry. The Journal of chemical physics 2025, 163(18). [Google Scholar] [CrossRef] [PubMed]
- Yang, H.; Hu, C.; Zhou, Y.; Liu, X.; Shi, Y.; Li, J.; Li, G.; Chen, Z.; Chen, S.; Zeni, C. A Deep Learning Atomistic Model Across Elements, Temperatures and Pressures. arXiv 2024, arXiv:2405.04967. [Google Scholar] [CrossRef]
- Ma, J.; Fu, X.; Xie, W.; Hu, P. From Pretrained to Precision: Fine-Tuning Universal Interatomic Potentials for Accurate Catalytic Reaction Simulations. J. Chem. Theory Comput. 2026, 22(4), 1920–1930. [Google Scholar] [CrossRef]
- Zhang, L.; Han, J.; Wang, H.; Car, R.; E, W. Deep Potential Molecular Dynamics: A Scalable Model with the Accuracy of Quantum Mechanics. Phys. Rev. Lett. 2018, 120(14), 143001. [Google Scholar] [CrossRef]
- Musaelian, A.; Batzner, S.; Johansson, A.; Sun, L.; Owen, C. J.; Kornbluth, M.; Kozinsky, B. Learning Local Equivariant Representations for Large-Scale Atomistic Dynamics. Nature Communications 2023, 14(1), 579. [Google Scholar] [CrossRef]
- Chanussot, L.; Das, A.; Goyal, S.; Lavril, T.; Shuaibi, M.; Riviere, M.; Tran, K.; Heras-Domingo, J.; Ho, C.; Hu, W.; Palizhati, A.; Sriram, A.; Wood, B.; Yoon, J.; Parikh, D.; Zitnick, C. L.; Ulissi, Z. Open Catalyst 2020 (OC20) Dataset and Community Challenges. ACS Catal. 2021, 11(10), 6059–6072. [Google Scholar] [CrossRef]
- Tran, R.; Lan, J.; Shuaibi, M.; Wood, B. M.; Goyal, S.; Das, A.; Heras-Domingo, J.; Kolluru, A.; Rizvi, A.; Shoghi, N.; Sriram, A.; Therrien, F.; Abed, J.; Voznyy, O.; Sargent, E. H.; Ulissi, Z.; Zitnick, C. L. The Open Catalyst 2022 (OC22) Dataset and Challenges for Oxide Electrocatalysts. ACS Catal. 2023, 13(5), 3066–3084. [Google Scholar] [CrossRef]
- Kirklin, S.; Saal, J. E.; Meredig, B.; Thompson, A.; Doak, J. W.; Aykol, M.; Rühl, S.; Wolverton, C. The Open Quantum Materials Database (OQMD): Assessing the Accuracy of DFT Formation Energies. npj Computational Materials 2015, 1(1), 1–15. [Google Scholar] [CrossRef]
- Radova, M.; Stark, W. G.; Allen, C. S.; Maurer, R. J.; Bartók, A. P. Fine-Tuning Foundation Models of Materials Interatomic Potentials with Frozen Transfer Learning. npj Computational Materials 2025, 11(1), 237. [Google Scholar] [CrossRef] [PubMed]
- Smith, J. S.; Nebgen, B. T.; Zubatyuk, R.; Lubbers, N.; Devereux, C.; Barros, K.; Tretiak, S.; Isayev, O.; Roitberg, A. E. Approaching Coupled Cluster Accuracy with a General-Purpose Neural Network Potential through Transfer Learning. Nature communications 2019, 10(1), 2903. [Google Scholar] [CrossRef] [PubMed]
- Wu, Z.; Zhou, L.; Hou, P.; Liu, Y.; Wang, R.; Guo, T.; Liu, J.-C. A Machine Learning Interatomic Potential Data Set and Model for Catalysis with Local Fine-Tuning to Chemical Accuracy. JACS Au 2025, 5(12), 6151–6161. [Google Scholar] [CrossRef] [PubMed]
- Li, Y.; Xiao, B.; Tang, Y.; Liu, F.; Wang, X.; Yan, F.; Liu, Y. Center-Environment Feature Model for Machine Learning Study of Spinel Oxides Based on First-Principles Computations. J. Phys. Chem. C 2020, 124(52), 28458–28468. [Google Scholar] [CrossRef]
- Tang, Y.; Xiao, B.; Chen, S.; Qian, Q.; Liu, Y. Predefined Attention-Focused Mechanism Using Center-Environment Features: A Machine Learning Study of Alloying Effects on the Stability of Nb 5 Si 3 Alloys. Digital Discovery 2025, 4(7), 1870–1883. [Google Scholar] [CrossRef]
- Bin, X.; Fu, L. I. U.; Wan, D. U.; Yi-heng, S.; Xue, F. A. N.; Quan, Q.; Yi, L. I. U. Machine Learning with Center-Environment Attention Mechanism for Multi-Component Nb Alloys. Transactions of Nonferrous Metals Society of China 2025, 35(11), 3813–3823. [Google Scholar]
- Ramakrishnan, R.; Dral, P. O.; Rupp, M.; Von Lilienfeld, O. A. Quantum Chemistry Structures and Properties of 134 Kilo Molecules. Scientific data 2014, 1(1), 1–7. [Google Scholar] [CrossRef] [PubMed]
- Jain, A.; Ong, S. P.; Hautier, G.; Chen, W.; Richards, W. D.; Dacek, S.; Cholia, S.; Gunter, D.; Skinner, D.; Ceder, G. Commentary: The Materials Project: A Materials Genome Approach to Accelerating Materials Innovation. APL materials 2013, 1(1). [Google Scholar] [CrossRef]
- Saal, J. E.; Kirklin, S.; Aykol, M.; Meredig, B.; Wolverton, C. Materials Design and Discovery with High-Throughput Density Functional Theory: The Open Quantum Materials Database (OQMD). JOM 2013, 65(11), 1501–1509. [Google Scholar] [CrossRef]
- Tang, Y.; Xiao, B.; Chen, J.; Liu, F.; Du, W.; Guo, J.; Liu, Y.; Liu, Y. Multi-Component Alloying Effects on the Stability and Mechanical Properties of Nb and Nb–Si Alloys: A First-Principles Study. Metall Mater Trans A 2023, 54(2), 450–472. [Google Scholar] [CrossRef]
- Guo, J.; Xiao, B.; Li, Y.; Zhai, D.; Tang, Y.; Du, W.; Liu, Y. Machine Learning Aided First-Principles Studies of Structure Stability of Co3 (Al, X) Doped with Transition Metal Elements. Computational Materials Science 2021, 200, 110787. [Google Scholar] [CrossRef]
- Horton, M. K.; Huck, P.; Yang, R. X.; Munro, J. M.; Dwaraknath, S.; Ganose, A. M.; Kingsbury, R. S.; Wen, M.; Shen, J. X.; Mathis, T. S.; Kaplan, A. D.; Berket, K.; Riebesell, J.; George, J.; Rosen, A. S.; Spotte-Smith, E. W. C.; McDermott, M. J.; Cohen, O. A.; Dunn, A.; Kuner, M. C.; Rignanese, G.-M.; Petretto, G.; Waroquiers, D.; Griffin, S. M.; Neaton, J. B.; Chrzan, D. C.; Asta, M.; Hautier, G.; Cholia, S.; Ceder, G.; Ong, S. P.; Jain, A.; Persson, K. A. Accelerated Data-Driven Materials Science with the Materials Project. Nat. Mater. 2025, 24(10), 1522–1532. [Google Scholar] [CrossRef]
Figure 1.
Representative Mo-host supercells used in this work: (a) BCC 4×4×4 and (b) FCC 3×3×3. Cyan spheres denote host-lattice atoms, and the highlighted sites (Mo, Mo1, Mo2, and Mo3) indicate the central reference position and representative substitutional-doping locations. The supercell edge lengths are 12.65 Å (BCC) and 12.02 Å (FCC), respectively.

Figure 2.
Workflow of fine-tuning the pre-trained MACE model for doped Mo alloys compared with scratch models, followed by the verification on the unknown systems with new elements.
Figure 2.
Workflow of fine-tuning the pre-trained MACE model for doped Mo alloys compared with scratch models, followed by the verification on the unknown systems with new elements.

Figure 3.
Parity plots of atomic forces in the non-equilibrium structure dataset (Non-Eq) predicted by the fine-tuned MACE model (FT-NonEq) versus DFT references for three model sizes: (a) Small, (b) Medium, and (c) Large parameter scales.
Figure 3.
Parity plots of atomic forces in the non-equilibrium structure dataset (Non-Eq) predicted by the fine-tuned MACE model (FT-NonEq) versus DFT references for three model sizes: (a) Small, (b) Medium, and (c) Large parameter scales.

Figure 4.
Energy predicted by ML vs. DFT references for the randomly partitioned test dataset (IID) of equilibrium structures (Eq) using three ML models at different parameter scales: (a)–(c) The fine-tuned models at small, medium, and large parameter scales, respectively; (d)–(f) The scratch models at small, medium, and large parameter scales, respectively; (g)–(i) The zero-shot inference models at small, medium, and large parameter scales, respectively. Each panel is a representative fold whose errors are close to the mean values by comparing predicted and reference energies.

Figure 5.
Energy errors (MAE and RMSE in meV/atom) predicted by the fine-tuned MACE models (FT-Eq) at a medium scale for various dopant elements in Mo-based alloys under two Leave-One-Dopant-Out (LODO) partitioning protocols: “relax” (blue) and “strict” (orange).
Figure 5.
Energy errors (MAE and RMSE in meV/atom) predicted by the fine-tuned MACE models (FT-Eq) at a medium scale for various dopant elements in Mo-based alloys under two Leave-One-Dopant-Out (LODO) partitioning protocols: “relax” (blue) and “strict” (orange).

Figure 6.
Energy parity plots for each new held-out element in the equilibrium structure dataset (Eq) predicted by the fine-tuned MACE model (FT-Eq) at a medium scale versus DFT references under Strict-LODO and Relaxed-LODO data protocols.
Figure 6.
Energy parity plots for each new held-out element in the equilibrium structure dataset (Eq) predicted by the fine-tuned MACE model (FT-Eq) at a medium scale versus DFT references under Strict-LODO and Relaxed-LODO data protocols.

Figure 7.
Energy parity comparison for two new-element evaluation strategies. (a) DIPI (direct inference with proxy initialization) with MAE = 60.38 meV/atom, RMSE = 69.44 meV/atom; (b) Refine-tunned model with MAE = 16.12 meV/atom, RMSE = 22.29 meV/atom.
Figure 7.
Energy parity comparison for two new-element evaluation strategies. (a) DIPI (direct inference with proxy initialization) with MAE = 60.38 meV/atom, RMSE = 69.44 meV/atom; (b) Refine-tunned model with MAE = 16.12 meV/atom, RMSE = 22.29 meV/atom.


Table 1.
Performance metrics, averaged <MAE> and <RMSE> of energies and forces with standard deviation, across the various training paradigms and model scales under the randomly partitioned test dataset (IID).
Table 1.
Performance metrics, averaged <MAE> and <RMSE> of energies and forces with standard deviation, across the various training paradigms and model scales under the randomly partitioned test dataset (IID).
| ML models | Energy <MAE> (meV/atom) |
Energy <RMSE> (meV/atom) |
Force <MAE> (meV/Å) |
Force <RMSE> (meV/Å) |
| FT-Eq (Small) FT-Eq (Medium) FT-Eq (Large) |
17.07 ± 4.74 8.10 ± 1.40 7.34 ± 1.71 |
30.31 ± 11.40 12.45 ± 2.79 13.20 ± 4.02 |
11.00 ± 0.75 11.11 ± 0.72 12.98 ± 1.21 |
22.82 ± 1.69 22.25 ± 1.66 26.32 ± 2.64 |
| FT-NonEq (Small) FT-NonEq (Medium) FT-NonEq (Large) |
5.55 ± 0.14 3.51 ± 0.13 2.27 ± 0.07 |
7.47 ± 0.49 4.95 ± 0.80 3.79 ± 0.89 |
18.28 ± 0.27 15.69 ± 0.18 13.83 ± 0.18 |
31.58 ± 0.75 27.33 ± 0.62 24.26 ± 0.48 |
| Scratch-Eq (Small) Scratch-Eq (Medium) Scratch-Eq (Large) |
75.04 ± 22.02 111.96±11.91 121.53 ± 8.58 |
124.60±28.00 144.37±20.92 153.38±18.81 |
17.08 ± 3.04 11.26 ± 2.46 3.57 ± 1.08 |
31.17 ± 5.58 21.03 ± 4.57 5.91 ± 1.94 |
| Zero-shot-Eq (Small) Zero-shot-Eq(Medium) Zero-shot-Eq (Large) |
159.20 ± 6.90 184.43 ± 7.04 143.93 ± 4.39 |
176.53 ± 4.62 200.03 ± 4.99 151.50 ± 3.35 |
69.44 ± 5.50 50.26 ± 3.46 44.55 ± 3.33 |
146.13 ± 7.86 100.56 ± 4.79 88.57 ± 4.55 |
Table 2.
MAE (meV/atom) and RMSE (meV/Å) results of the Leave-One-Dopant-Out (LODO) test dataset with strict and relaxed partition protocols for each alloying element in Mo-based alloys predicted by the fine-tuned MACE models (FT-Eq) at a medium scale. MeanAll represents the averaged values of energy and force MAE or RMSE across all dopant elements, while MeanNC represents the corresponding averaged values excluding the outlier Cr.
| Element | Strict-LODO | Relaxed-LODO | ||||||
|---|---|---|---|---|---|---|---|---|
| Energy MAE |
Energy RMSE |
Force MAE |
Force RMSE |
Energy MAE |
Energy RMSE |
Force MAE |
Force RMSE |
|
| Fe | 54.16 | 57.20 | 50.3 | 108.8 | 9.31 | 10.13 | 17.8 | 41.9 |
| Mn | 73.71 | 77.06 | 45.5 | 93.4 | 7.48 | 8.44 | 15.3 | 29.6 |
| Nb | 69.64 | 73.65 | 36.2 | 74.4 | 8.56 | 10.22 | 9.0 | 14.8 |
| Re | 132.05 | 138.02 | 40.9 | 69.3 | 6.46 | 9.02 | 12.1 | 23.8 |
| Ta | 112.42 | 116.76 | 28.0 | 60.8 | 8.89 | 11.14 | 11.0 | 19.1 |
| Ti | 61.56 | 64.50 | 31.4 | 69.6 | 7.73 | 11.24 | 10.2 | 19.3 |
| V | 90.18 | 95.19 | 34.6 | 71.8 | 7.45 | 8.76 | 11.8 | 23.6 |
| W | 117.84 | 123.69 | 49.4 | 118.9 | 8.01 | 9.09 | 9.9 | 18.8 |
| Y | 6.80 | 9.15 | 43.7 | 74.8 | 10.03 | 14.54 | 18.5 | 32.4 |
| Zr | 44.37 | 47.09 | 37.1 | 71.2 | 10.28 | 14.33 | 13.9 | 24.3 |
| Cr | 84.01 | 87.88 | 54.1 | 126.8 | 136.15 | 141.50 | 77.4 | 177.2 |
| MeanNC | 76.27 | 80.23 | 39.71 | 81.30 | 8.42 | 10.69 | 12.95 | 24.76 |
| MeanAll Std. | 76.98 ±36.05 | 80.93 ±37.18 | 41.0 ±8.3 | 85.4 ±22.8 | 20.03 ±38.53 | 22.58 ±39.49 | 18.8 ±19.7 | 38.6 ±46.6 |
Disclaimer/Publisher’s Note: The statements, opinions and data contained in all publications are solely those of the individual author(s) and contributor(s) and not of MDPI and/or the editor(s). MDPI and/or the editor(s) disclaim responsibility for any injury to people or property resulting from any ideas, methods, instructions or products referred to in the content. |
© 2026 by the authors. Licensee MDPI, Basel, Switzerland. This article is an open access article distributed under the terms and conditions of the Creative Commons Attribution (CC BY) license (http://creativecommons.org/licenses/by/4.0/).
Copyright: This open access article is published under a Creative Commons CC BY 4.0 license, which permit the free download, distribution, and reuse, provided that the author and preprint are cited in any reuse.


