Submitted:
09 March 2026
Posted:
09 March 2026
You are already at the latest version
Abstract
Blast furnace gas (BFG) must be deeply purified when it is as fuel for combined-cycle power generation. To improve collection efficiency of the fine particulate dust in BFG by wet electrostatic precipitators (WESPs), this study implemented measures such as optimizing nozzle atomization performance and spatial distribution of droplets, along with adding chemical agglomeration agents and surfactants, These approaches pro-moted the chemical agglomeration of fine dust and enhanced dust collection efficiency. The results show that under overlapping spray conditions, the 1/8 solid cone nozzle produced the smallest droplets size with the most uniform spatial distribution, exhib-iting a d50 of 141.17 μm. When this nozzle was used in combination with guar gum (GG) as a chemical agglomerant, the d50 of BFG dust increased from 8.46 μm to 14.75 μm. The synergistic application of 5 mg/m³ sesbania gum (SBG) and 5 mg/m³ oc-tylphenol ethoxylate (OP-10) further increased the dust d50 to 19.08 μm. Using the 1/8 solid cone nozzle and with an XTG concentration of 5 mg/m³, resulted in the highest dust collection efficiency of 96.76%, while the synergistic use of SBG/OP-10 achieved an efficiency of 97.69%. This study elucidates the influence of nozzle atomization charac-teristics and spray liquid type on dust agglomeration and collection efficiency, providing both theoretical and practical foundations for the deep purification of blast furnace gas.
Keywords:
oculomics
; retinal imaging
; systemic biomarkers
; artificial intelligence
; preventive medicine
; precision health
; neurodegeneration
; cardiovascular disease
; tear fluidomics
; healthcare integration
1. Introduction
Steel production plays a pivotal role in global industry, and blast furnace gas (BFG)—a significant by-product generated during the ironmaking process—serves as an important secondary energy source. In 2024, China’s pig iron output reached 851.74 million tons, crude steel output reached 1,005.09 million tons, and the cumulative volume of blast furnace gas produced amounted to 965.5 billion m³, with a BFG utilization rate of 98.88% [1]. The gas discharged from the top of the blast furnace possesses considerable pressure energy, which is typically recovered using a Blast Furnace Top Gas Recovery Turbine Unit (TRT). A gas purification device is installed before the TRT to reduce the dust content in the gas to 3~5 mg/m³. However, dust present in the gas can lead to fouling on TRT blades. Current maintenance relies primarily on regular washing, but damp blades after washing are more prone to re-fouling upon dust exposure. Moreover, frequent shutdowns reduce gas recovery rates and increase maintenance costs. Implementing a wet electrostatic precipitator (WESP) in the BFG recovery process to reduce the dust content in gas entering the TRT to below 0.5 mg/m³ would enable deep purification of the gas and help avoid frequent blade fouling. Nevertheless, due to limitations in particle capture mechanisms, collection efficiency of the WESPs for fine particulate dust in BFG remains relatively low, which has become a major challenge hindering its broader engineering application.
In the wet electrostatic precipitators, the spray system serves as a key component, with the nozzle atomization performance and droplets spatial distribution significantly influencing dust agglomeration and collection efficiency. Chemical agglomeration technology utilizes the adsorption and bridging effects of chemical agglomerants to bind fine dust particles into larger agglomerates, It is widely used in wet electrostatic precipitators to enhance the capture of fine particulate dust. Extensive research on nozzle atomization performance and chemical agglomeration technology has been conducted both domestically and internationally.
In 2002, Liang T et al. [2] aimed to reduce dust concentration in fully mechanized mining faces and conducted a spray dust suppression system study. They found that as pressure increased, droplets diameter continuously decreased, spray velocity rose, and effective spray volume expanded. In 2006, Ma S et al. [3] employed spray systems for dust settlement in underground coal mines, utilizing nozzles with X-shaped swirl blades as the core, which achieved improved atomization effects. In 2010, Cheng W et al. [4] designed a nozzle atomization experimental system using a Winner 313 laser particle size analyzer. They observed that for the same nozzle under different pressures, the variation in droplets size were greater for smaller-diameter nozzles than for larger ones. After applying solid cone nozzles for spraying, dust collection efficiency reached 92.7%. In 2012, Chen Y [5], based on dust generation characteristics at belt conveyor transfer points, studied spray dust suppression and found that for hollow cone nozzles with the same orifice diameter, higher spray pressure resulted in smaller droplets size; under the same pressure, larger orifice diameters led to larger atomized droplets. After using hollow cone nozzles at transfer points, dust concentration decreased from 239.7 mg/m³ to 30.5 mg/m³, achieving a dust suppression efficiency of 87.1%. In 2013, Wu Y [6] compared the atomization performance of solid and hollow cone nozzles and found that droplets sizes from hollow cone nozzles were significantly larger than those from solid cone nozzles. Vallet et al. [7] used a Phase Doppler Particle Analyzer (PDPA) to study the spatial distribution of droplets size and velocity from fan spray nozzles. In 2022, Chen et al. [8] investigated the atomization characteristics of small-angle flat fan nozzles, measuring droplets size in the atomization field using a laser particle size analyzer and calculating droplets uniformity under different parameters. In 2023, Yuan et al. [9] established mathematical models for droplets characteristics at different spatial positions and pressures, studying hollow cone nozzles and concluding that under varying pressure conditions, the median droplets diameter decreased as pressure increased. In 2025, Narendra et al. [10] examined collisions within the interaction zone formed by three hollow cone sprays, determining that collisions led to a significant increase in droplets count and a notable reduction in droplets size.
In the 1990s, Durham et al. [11] experimentally introduced agglomerating agents into an electrostatic precipitator (ESP) and observed both dust and the agglomerating agents deposited on the collection electrodes, which demonstrated that agglomerating agents effectively promoted the capture of dust in flue gas. In 2000, to address issues such as high resistivity of fly ash in precipitators, the U.S. Department of Energy employed novel chemical conditioning agents during the dust removal process; these agents not only reduced resistivity but also increased the internal cohesion of dust, thereby enhancing dust agglomeration and capture [12]. In 2011, Geng J et al. [13] found that adding wetting agents at room temperature and 45°C could effectively reduce the contact angle of fine particles with moisture, improving their wettability, the collection efficiency could exceed 65% when combined with appropriate steam addition. In 2020, Li et al. [14] investigated the agglomeration effect of a three-component agglomerating agent on fine particulate dust, increasing the average particle size from 2.8 μm to over 10.0 μm. In 2021, Gao et al. [15] synergistically combined chemical agglomeration with turbulent mixing to promote the agglomeration of fine particles, significantly enhancing electrostatic precipitation efficiency. Yang Gangzhong et al. [16] applied a novel passivation agglomerating agent in a 300 MW unit, reducing dust concentration of the ESP outlet by 32%. In 2022, Zhang J [17] studied the enhancement effect of sesbania gum (SBG) agglomeration solution on the removal of fine particles and SO₃ acid mist by electrostatic precipitation, achieving collection efficiency of fine particles up to 90.63%. In 2024, Li T et al. [18] implemented chemical agglomeration technology on the electrostatic precipitator which used in a 600 MW coal-fired power plant. it could significantly increase average particle size of the dust in the ESP outlet, while the concentration of large particles substantially decreased. the dust concentration of the wet ESP outlet reduced to 1.09 mg/m³ under the action of the agglomerating agent.
The aforementioned studies indicate that solid cone nozzles offer certain advantages in reducing atomized droplets size and water consumption. Compared to spiral nozzles, solid cone nozzles exhibit lower flow rates, contributing to water conservation; moreover, the median droplets diameter generally decreases with increasing spray pressure. Concurrently, introducing appropriate agglomerating agents into ESP can significantly enhance collection efficiency of the fine particulate matter. These agents promote the agglomeration of fine particles and substantially improve dust collection efficiency by modifying dust surface properties, reducing resistivity, and strengthening interparticle cohesion.
It is evident that existing research on nozzle atomization performance primarily focuses on analyzing the spray characteristics of single nozzles. Regarding chemical agglomeration technology, studies mainly investigate the effects of factors such as the type and concentration of Chemical agglomerating agent on the agglomeration of coal fly ash in ESP. However, there remains a lack of exploration into the influence of droplets spatial distribution and atomization performance affected by chemical agglomerating agent in wet electrostatic precipitators (WESPs), as well as a gap in research concerning the effects of multi-nozzle overlapping and the addition of chemical agglomerating agent on atomization performance. Addressing these gaps, the present study systematically examines the influence of nozzle type and spray overlap on droplets size and spatial distribution, thereby elucidating the underlying mechanisms. Furthermore, it investigates the interplay between chemical agglomerating agent and nozzle atomization performance. By integrating optimized spray performance with the application of chemical agglomerants, it provides crucial technical and theoretical foundations for the efficient capture of fine particulate dust. Ultimately, this approach enhances the collection efficiency of blast furnace dust and contributes to the deep purification for blast furnace gas.
2. Experimental Principles and Apparatus
2.1. Experimental Principles
Electrostatic precipitation is a dust removal technology that separates dust particles from gas by utilizing electric field forces. The process primarily involves several key steps: gas ionization, dust charging, migration of charged particles, dust collection, and cleaning. As illustrated in Figure 1, when dust-laden gas passes through an electrostatic precipitator, it first enters a high-voltage electric field where the discharge electrodes undergo corona discharge, ionizing gas molecules and generating a large number of positive and negative ions. Through this ionization, dust particles capture electrons and become negatively charged. Driven by the electric field force, the negatively charged particles migrate toward the collection electrodes, where they are eventually deposited and captured. The dust accumulated on the collection electrodes is washed away by a water film formed on the plates through sprays from the water injection system, and finally discharged through the ash outlet.
2.2. Experimental Apparatus
2.2.1. Integrated Wet Electrostatic Precipitator Test Platform
The integrated experimental platform for wet electrostatic precipitation employed is illustrated in Figure 2.
It comprises the main equipment unit, low-voltage control system, high-voltage power supply control system, fan system, spray system, and dust feeding system. The wet electrostatic precipitator serves as the core component of the integrated test platform. As shown in Figure 2, dust-laden gas enters the precipitator through the inlet duct on the left. Under the influence of electrostatic forces, the dust is captured on the anode plates. Chemical agglomerating agent are added from the water tank (17) and circulated under pressure by the pump (12) to the nozzles (6). The fine droplets generated by the nozzles become charged in the electric field (2), promoting dust agglomeration. Upon reaching the anode plates, the droplets form a continuous water film that washes the collected dust into the water tank (17). The dust is allowed to settle in the tank for 30 minutes before sampling for particle size and morphological analysis. After the experiment, the circulating water is discharged through the drain pipe (16). The gas purified by the electrostatic precipitator exits through the duct via the induced draft fan (11). Sampling ports (9) and (10) are installed along the duct to collect dust concentrations at the inlet and outlet, respectively, enabling the calculation of dust collection efficiency.
2.3. Detection Instruments and Analysis System
2.3.1. Spray Atomization Test Platform
As shown in Figure 3, the spray atomization experimental platform consists of a water tank (10), a water pump (7), a check valve (8), a flow meter (2), a nozzle (4), and a laser particle size analyzer (5). The pump delivers water from the tank to the nozzle via the pipeline, where it is atomized into a spray. Simultaneously, a laser particle size analyzer is employed to measure the droplets size distribution. The experiment utilizes a DP-02 spray particle size analyzer, which operates based on laser diffraction technology. A laser beam generated by the emitter passes through the spray field, and the droplets diffract the laser light. The intensity of the diffracted light correlates with the droplets size. A detector captures the diffracted light signals and converts them into electrical signals. Through algorithmic analysis of these signals, the droplets size distribution can be calculated.
2.3.2. Fine Particulate Dust Detection Platform
Dust Sampling System
The experiment employed the isokinetic sampling method. As illustrated in Figure 4, the dust sampling system primarily consists of a sampling probe (1), a drying bottle (2), a buffer bottle (3), a vacuum pump (4), and a flow meter (5). A filter membrane or cartridge is installed inside the sampling probe. When gas enters the probe, the entrained dust is captured on the surface of the filter membrane. Driven by the vacuum pump, the gas subsequently passes through the drying bottle and the buffer bottle before entering the flow meter, which displays the sampled gas flow rate. A filter cartridge is installed in the sampling probe when measuring for the inlet, while a filter membrane is used for outlet concentration measurements.
Particle Size Analysis Apparatus
The particle size analysis setup primarily consisted of a BT-9300H laser particle size analyzer and a BT-601 circulating disperser. The operating principle of the laser particle size analyzer is based on illuminating the sample particles with a laser beam. When the light encounters the particles, scattering occurs, with the intensity and angle of the scattered light being related to particle size and distribution. The scattered light is captured by a detector, converted into electrical signals, and subsequently processed by software to display the particle size distribution in both graphical and numerical formats.
2.4. Experimental Reagents

Table 1.
Basic information of chemical agents.
| Species | Name | Type | Characteristics | Manufacturer |
|---|---|---|---|---|
| Chemical Agglomerant | Cationic Polyacrylamide (CPAM) | Cationic Synthetic Organic Polymer Flocculant | White granules, soluble in water at any ratio to form a uniform, transparent solution. | Tianjin Damao Chemical Reagent Factory |
| Anionic Polyacrylamide (APAM) | Anionic Synthetic Organic Polymer Flocculant | White granules, soluble in water at any ratio to form a uniform, transparent solution. | Tianjin Damao Chemical Reagent Factory | |
| Sesbania Gum (SBG) | Anionic Natural Organic Polymer Flocculant | White powder, dispersible in cold water at room temperature to form a highly viscous hydrocolloidal solution. | Xinrui Biotechnology Co., Ltd | |
| Guar Gum (GG) | Non-ionic Natural Organic Polymer Flocculant | Pale yellowish-brown powder, dispersible in hot or cold water to form a viscous solution; viscosity influenced by dissolution time, temperature, and pH. | Beijing Guarun Technology Co., Ltd | |
| Xanthan Gum (XTG) | Anionic Natural Organic Polymer Flocculant | Light yellow powder, disperses and emulsifies in water to form a stable hydrophilic viscous gel. | Tianjin Guangfu Fine Chemical Research Institute | |
| Kaolin | Natural Mineral Coagulant Aid | Solid powder with varied colors and soft luster, exhibiting good water absorption. | Tianjin Zhonglian Chemical Reagent Co., Ltd | |
| Surfactant | Dodecyl Dimethyl Benzyl Ammonium Chloride (DDBAC) | Cationic Surfactant | Pale yellow waxy solid or gelatinous mass, readily soluble in water, slightly soluble in ethanol; aqueous solution is weakly alkaline. | Macklin Biochemical Technology Co., Ltd |
| Octylphenol Ethoxylate (OP-10) | Non-ionic Surfactant | Pale yellow oily liquid, readily soluble in oils and other organic solvents, strongly lipophilic, poorly soluble in water; acts as a lipophilic emulsifier. | Wuxi Yatai United Chemical Co., Ltd | |
| Sodium Dodecyl Benzene Sulfonate (SDBS) | Anionic Surfactant | White or pale yellow powder or flakes, low volatility, readily soluble in water to form a semi-transparent solution; slightly toxic. | Tianjin Guangfu Fine Chemical Research Institute |
3. Results and Analysis
3.1. Particle Size and Morphology Analysis of Blast Furnace Dust
3.1.1. Blast Furnace Dust Particle Size Analysis
The BT-9300H laser particle size analyzer was employed to measure the particle size distribution of blast furnace gas dust. The resulting particle size distribution is plotted in Figure 5.
As shown in the figure, the blast furnace gas dust particles are relatively fine, primarily distributed in the range of 0.1 μm to 35 μm, with a median particle diameter of 3.303 μm. The differential distribution curve exhibits a bimodal pattern, mainly due to the high proportion of sub-micron particles in the dust. Specifically, particles smaller than 0.692 μm account for 10% of the total, those below 3.303 μm constitute 50%, and particles under 11.69 μm represent 90%. Analysis of the particle size distribution reveals that blast furnace dust is characterized by fine particle sizes, a broad distribution range, and a high proportion of ultrafine particles. Notably, particles less than 10 μm make up 87% of the total, while those below 2.5 μm account for 44%, indicating considerable challenges for effective capture.
3.1.2. Blast Furnace Dust Morphology Analysis
Scanning electron microscopy (SEM) was employed to analyze blast furnace dust, with the resulting image presented in Figure 6. The SEM micrograph reveals variations in dust particle sizes, predominantly ranging between 1~10 μm, while some finer particles measure below 1 μm. The particles exhibit irregular morphologies, including angular grains as well as flaky, blocky, or prismatic shapes. Surfaces of certain particles appear rough, displaying distinct fractured planes or layered structures. Agglomeration is evident, with particles adhering to one another to form clusters. Notably, finer particles are observed adhering to larger ones, it is attributable to complex physicochemical interactions within the blast furnace, leading to phenomena such as fragmentation and melting during dust formation.
Energy-dispersive spectroscopy (EDS) analysis indicates that the metallic elements in blast furnace gas dust primarily include Fe, Al, Ga, Na, Mg, and Zn, while the non-metallic elements mainly consist of C, O, F, Si, and S.
3.2. Influence of Nozzle Type and Agglomeration Solution on Spray Performance
3.2.1. Influence of Nozzle Type
Effect of Nozzle Type on Droplets Size
Under a fixed spray water pressure of 0.5 MPa, five nozzle types were selected for experimentation: 1/4 solid cone, 1/8 solid cone, 1/4 hollow cone, 1/8 hollow cone, and 1/4 fan spray nozzles. The droplets size distribution was measured, and the corresponding droplets size histogram is presented in Figure 7(a). In the figure, d₁₀ denotes the droplets diameter below which 10% of the cumulative distribution lies, reflecting the proportion of fine droplets; d₅₀ (median diameter) represents the diameter below which 50% of the cumulative distribution lies, indicating the "average" droplets size of the population; and d₉₀ signifies the diameter below which 90% of the cumulative distribution lies, reflecting the proportion of coarse droplets.
As shown in Figure 7(a), the droplets sizes produced by the 1/4 solid cone nozzle and the 1/8 solid cone nozzle differ significantly from those of the other three nozzle types. Their d₉₀ values are 352.40 μm and 466.43 μm, respectively, which are considerably lower than those of the other nozzles. This indicates that the droplets generated by solid cone nozzles are more uniformly concentrated compared to those from hollow cone and fan spray nozzles. Further comparison of their d₅₀ diameters, it reveals that the d₅₀ of the 1/4 solid cone nozzle is 244.66 μm, smaller than the 255.45 μm of the 1/8 solid cone nozzle. This suggests that the 1/4 solid cone nozzle produces the most concentrated droplets size distribution and the most stable spray performance.
In Figure 7(b) to (f), the light blue curve represents the differential distribution of droplets size, indicating the quantity of droplets within different size intervals. A single narrow peak in the curve suggests uniform atomization by the nozzle. The rose-red curve shows the cumulative distribution of droplets size, reflecting the overall range and uniformity of droplets sizes. The curve exhibits an S-shaped rise, with the steep middle segment representing the main concentration range of droplets sizes. A steeper slope indicates a more concentrated distribution. Figure 7(b) and (c) display differential distribution curves that are essentially unimodal, accompanied by S-shaped cumulative curves without obvious steps during the rising phase. This indicates that both 1/4 and 1/8 solid cone nozzles produce relatively uniform droplets sizes. Notably, in Figure (b), the differential curve shows a narrower and higher peak, and the cumulative curve exhibits a steeper slope in its middle segment. This demonstrates that the 1/4 solid cone nozzle generates droplets with a more concentrated size distribution and more stable atomization performance. This behavior can be attributed to the larger orifice size of the 1/4 solid cone nozzle. Under the same pressure, it delivers a higher liquid flow rate and therefore greater kinetic energy. Consequently, the fluid experiences stronger shear forces at the orifice, promoting more effective breakup of the liquid film into finer droplets. In contrast, the 1/8 solid cone nozzle, with its smaller orifice, operates at a lower flow rate. The higher flow resistance, the higher associated energy losses, they will reduce the shear forces of fluid at the orifice, leading to less efficient atomization and larger droplets sizes.
Figure 7(d), (e), and (f) all exhibit bimodal or multimodal distributions, with peaks observed around 1000 µm. This indicates that the 1/8 hollow cone, 1/4 hollow cone, and 1/4 fan spray nozzles produce non-uniform atomization and larger average droplets sizes. This behavior can be attributed to the operating principles of these nozzle types. Hollow cone nozzles rely on centrifugal forces to swirl the liquid within an internal vortex chamber, forming an annular liquid film. Upon breakup, this thicker film yields larger droplets compared to solid cone nozzles. Similarly, fan spray nozzles produce a flat sheet of liquid through an elliptical or rectangular orifice, which subsequently breaks up at its edges due to aerodynamic resistance. The inherently thicker liquid sheet also results in larger droplets sizes. Furthermore, to achieve adequate coverage and spray volume, hollow cone and fan spray nozzles typically have larger orifice diameters than the solid cone nozzles of equivalent size, contributing further to their tendency to generate coarser droplets.
Effect of Nozzle Type on Spatial Distribution of Droplets
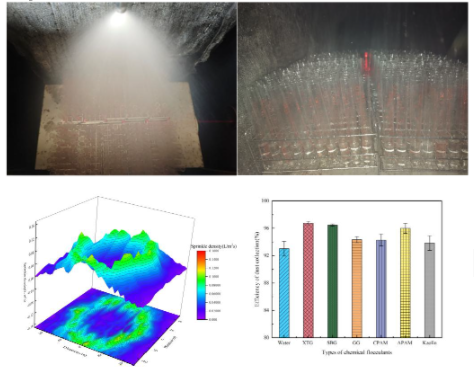
Under identical conditions, the spatial distribution of droplets from the five nozzles described in Section 3.2.1.1 was measured. As shown in Figure 8 and Figure 9, the measurement procedure was as follows: test tubes with a diameter of 5 cm were arranged below the nozzle at a distance of 70 cm. On the plane 70 cm directly below the nozzle, an x-y-z coordinate system was established with the nozzle center as the origin. Using the x and y coordinates to denote position and the z-coordinate to represent spray density, the spray density at each location was calculated by measuring the volume of water collected per unit time in the corresponding test tube. The resulting surface plots are shown in Figure 10. A smaller gradient in spray density indicates a more uniform spatial distribution of droplets. For clarity in visualization, only data within a partial coordinate range are plotted for the 1/4 solid cone nozzle and the 1/4 fan spray nozzle, as their spray coverage is relatively limited.
As shown in Figure 10, the spatial distribution of droplets varies significantly among different nozzle types. In Figures (a) and (b), the hollow cone nozzles exhibit distinctly annular spray patterns. For the 1/8 hollow cone nozzle, droplets are mainly distributed within a ring 50~80 cm from the origin, with a spray density of 0.139–0.062 L/(m²·s). In other regions, the spray density ranges from 0.045 to 0.003 L/(m²·s). The hollow region of the 1/4 hollow cone nozzle is larger than that of the 1/8 hollow cone nozzle. Within 0–80 cm from the origin, the spray density is 0–0.051 L/(m²·s), and the hollow zone appears as a regular circle. Between 80~100 cm, the spray density increases to 0.068–0.133 L/(m²·s). This behavior can be explained by the larger orifice diameter and internal swirl chamber of the 1/4 hollow cone nozzle. As liquid enters the nozzle, it follows a larger radius of motion. According to the angular momentum equation for fluids (Equation 3-1), under the same flow rate, a larger radius of centrifugal motion results in greater angular momentum, leading to a higher exit velocity of the droplets. Consequently, the droplets travel farther, resulting in a larger central hollow region.
The angular momentum equation is given as follows:
T=ρqV(v2 r2 cosθ2-v1 r1 cosθ1),
In the equation: T is angular momentum; ρ represents the liquid density; qV is the flow rate of liquid; r is the radius; v is the absolute fluid velocity of the droplet and θ is the angle between the inflow direction and the circumferential tangent.
As shown in Figure 10(c) and (d), compared with hollow cone nozzles, solid cone nozzles produce a more uniform spatial distribution of droplets, with droplets density gradually decreasing from the center outward. This is attributed to the internal design of solid cone nozzles, which feature tangential grooves or spiral flow-guiding vanes. These structures force the liquid into a vortex flow, preventing the formation of a central low-pressure region within the chamber. Under centrifugal force, the liquid forms a homogeneous solid sheet, distinct from the annular film generated by hollow cone nozzles. As the liquid exits the orifice, it expands into a uniformly thick solid conical sheet. Upon leaving the nozzle, the sheet is subjected to aerodynamic resistance and breaks up evenly from the edges toward the center, resulting in a solid conical spray pattern with full-angle coverage.
Within solid cone nozzles, the nozzle diameter significantly influences the spatial distribution of droplets. As observed in Figure 10(c) and (d), droplets from the 1/4 solid cone nozzle are mainly concentrated within the x-direction range of –20 cm to 20 cm, with a spray density of approximately 0.499–0.193 L/(m²·s). As the distance from the origin increases, the droplets density gradually decreases from about 0.193 L/(m²·s) to around 0.011 L/(m²·s). In contrast, the 1/8 solid cone nozzle produces droplets distributed over a circular area with a radius of approximately 80 cm, exhibiting a wider and more uniform spatial coverage compared to the 1/4 solid cone nozzle. The spray density remains relatively stable, ranging primarily between 0.085 L/(m²·s) and 0.027 L/(m²·s), with minimal fluctuation.
It is inferred that the nozzle diameter directly affects the internal liquid flow rate and velocity. According to the nozzle flow rate calculation formula:
Q=Cd A√(2∆P/ρ),
In the equation: Q is volumetric flow rate of the liquid; Cd is a flow coefficient (dimensionless, typically ranging from 0.6 to 0.9); A is the nozzle outlet cross-sectional area (A=πd2/4, where d is the nozzle diameter.); ∆P is the spray pressure and ρ represents the liquid density.
From Equation (2), it can be seen that the flow rate is directly proportional to the nozzle diameter. A larger nozzle diameter results in a higher internal liquid flow rate; however, due to the larger internal volume, the liquid velocity is comparatively lower. Consequently, droplets emitted from a 1/4 solid cone nozzle have lower kinetic energy and travel a shorter distance horizontally. Under the same spray height, this leads to a more concentrated droplets distribution and a narrower spray angle. Therefore, typical spray angles for 1/4 nozzles range are from 60° to 90°, whereas 1/8 nozzles exhibit spray angles are between 90° and 120°. As illustrated in Figure 3, Figure 4, Figure 5, Figure 6 and Figure 7, there are noticeable difference in the spray angles between these two nozzle types.
As shown in Figure 10(e), the spray from the fan nozzle forms a narrow, elongated strip. Within a horizontal coordinate range of ±20 cm, the spray density lies between 2.86 and 3.57 L/(m²·s). In the regions spanning -60 to -20 cm and 20 to 60 cm horizontally, and within ±10 cm vertically, the spray density ranges from 0.10 to 1.48 L/(m²·s). Outside these areas, the spray density is nearly zero. Consequently, the fan nozzle delivers a high spray volume concentrated in a narrow band, with poor atomization and limited spatial distribution. Therefore, it is suitable for applications requiring directed spray, such as targeted plate cleaning.
Figure 11.
Difference in spray angle between 1/8 solid cone nozzle and 1/4 solid cone nozzle. (a) 1/8 Solid Cone Nozzle. (b) 1/4 Solid Cone Nozzle.
Figure 11.
Difference in spray angle between 1/8 solid cone nozzle and 1/4 solid cone nozzle. (a) 1/8 Solid Cone Nozzle. (b) 1/4 Solid Cone Nozzle.

3.2.2. Effect of Nozzle Overlap on Atomization Performance
Effect of Nozzle Overlap on Droplets Size
The 1/8 hollow cone twin-nozzle, 1/8 solid cone twin-nozzle, and 1/4 solid cone twin-nozzle were selected for droplets size measurement under a water pressure of 0.5 MPa and a nozzle spacing of 70 cm. The results are shown in Figure 12.
As shown in Figure 12(a), the d₁₀ values for the three nozzle types under twin-nozzle overlapping spray are 66.01 μm, 53.16 μm, and 35.23 μm, respectively, while the d₅₀ values are 179.70 μm, 141.17 μm, and 190.00 μm. These are all smaller than the corresponding d₁₀ and d₅₀ values under single-nozzle spraying. The d₉₀ values for the 1/8 hollow cone twin-nozzle and the 1/8 solid cone twin-nozzle are 299.17 μm and 240.20 μm, respectively, which are lower than those of their single-nozzle counterparts. In contrast, the d₉₀ of the 1/4 solid cone twin-nozzle is 404.79 μm, exceeding that of the single-nozzle configuration.
Overall, droplets sizes under overlapping nozzle sprays are reduced compared to single-nozzle spraying. This is attributed to the interaction zone formed between two adjacent sprays. The mutual impingement of the spray plumes leads to secondary atomization (impingement-induced atomization). When liquid streams collide at a certain velocity, they spread radially along the impact plane, forming a thin liquid sheet. Under aerodynamic drag and shear forces, the sheet ruptures into ligaments, which subsequently break up. These ligaments further disintegrate into droplets due to surface tension effects, resulting in a decrease in the average droplets diameter.
In addition, twin-nozzle spraying increases the turbulence intensity of the surrounding air. The highly disturbed airflow significantly enhances secondary breakup of droplets. At higher pressures, fine droplets are more readily fragments by aerodynamic resistance, leading to a decrease in d₁₀. As also observed in Figures 12(b), (c), and (d), the left-hand side of the differential distribution curves exhibits small peaks of varying sizes and shapes, indicating enhanced air disturbance. The increase in the number of small-diameter droplets result in a less uniform droplets size distribution compared to that of single-nozzle spraying.
Effect of Nozzle Overlap on Spatial Distribution of Droplets
Under the same conditions, spray density was measured, with the results presented in Figure 13. The figure indicates that the 1/8 nozzles provide the best spatial distribution in overlapping spray configuration. In the central region between the two nozzles, an area of droplets overlap—referred to as the spray overlap zone—is observed. For solid cone nozzles, this overlap zone is relatively narrow, spanning approximately x = -40 to 40 cm and y = -40 to 15 cm. Within the overlap zone, the maximum spray density reaches 0.150 L/(m²·s), while outside this zone the maximum spray density is 0.105 L/(m²·s) and the minimum is 0.048 L/(m²·s), resulting in a difference of 0.102 L/(m²·s). This difference is higher than the 0.075 L/(m²·s) observed in single-nozzle spraying, indicating reduced uniformity in droplets distribution.
Figure 13.
Spatial distribution of different dual nozzles. (a) 1/8 hollow cone twin-nozzle. (b) 1/8 solid cone twin-nozzle. (c) 1/4 solid cone twin-nozzle.
Figure 13.
Spatial distribution of different dual nozzles. (a) 1/8 hollow cone twin-nozzle. (b) 1/8 solid cone twin-nozzle. (c) 1/4 solid cone twin-nozzle.

The overlap zone of the 1/8 hollow cone twin-nozzle is larger, with a more extensive overlap in the x-direction, spanning approximately x = –25 to 10 cm and y = –40 to 10 cm. Within this zone, the maximum spray density is 0.136 L/(m²·s), while the minimum spray density is 0 L/(m²·s), resulting in a difference of 0.136 L/(m²·s). This indicates that the uniformity of droplets distribution is significantly lower than that of the 1/8 solid cone twin-nozzle.
As shown in Figure 14, for the 1/4 solid cone twin-nozzle with a spacing of 70 cm, no distinct spray overlap zone is observed. The spray pattern is clearly divided into two separate regions, with relatively limited coverage. The maximum spray density is 0.434 L/(m²·s), which is lower than the maximum density of 0.499 L/(m²·s) achieved with a single nozzle. The minimum spray density is 0 L/(m²·s), resulting in a density difference of 0.434 L/(m²·s). Within the central region between the two nozzles, spray density ranges from 0.068 to 0.026 L/(m²·s), indicating that only a small fraction of droplets are dispersed into this area. This behavior can be attributed primarily to the narrower spray angle of the 1/4 solid cone nozzle, which produces a confined spray pattern. Only a minor portion of droplets have sufficient horizontal momentum to travel farther from the orifice. Due to the limited droplets volume, interference between the two sprays remains minimal. Consequently, compared to the 1/8 hollow cone and 1/8 solid cone twin-nozzle configurations, the 1/4 solid cone twin-nozzle exhibits the least change in spatial droplets distribution under overlapping spray conditions.
Figure 14.
Spray diagram of different dual nozzles. (a) 1/8 hollow cone twin-nozzle. (b) 1/8 solid cone twin-nozzle. (c) 1/4 solid cone twin-nozzle.
Figure 14.
Spray diagram of different dual nozzles. (a) 1/8 hollow cone twin-nozzle. (b) 1/8 solid cone twin-nozzle. (c) 1/4 solid cone twin-nozzle.


3.2.3. Effect of Chemical Agglomeration Solution
Effect of Chemical Agglomeration Solution on Droplets Size
Under the conditions of a 1/4 solid cone nozzle and a water pressure of 0.5 MPa, six chemical agglomerants—XTG, SBG, GG, CPAM, APAM, and kaolin—were individually added. The concentration of each chemical agglomerant was varied at 0 mg/m³, 5 mg/m³, 10 mg/m³, and 15 mg/m³. The droplets size distribution was measured for each condition, and a line chart based on the d₅₀ values is presented in Figure 15.
As observed, the d₅₀ exhibits an upward trend with increasing agglomerant concentration. The most pronounced increase occurs with XTG, where the droplets d₅₀ rises from 204.66 µm at 0 mg/m³ to 226.52 µm at 5 mg/m³, further to 238.51 µm at 10 mg/m³, and reaches 246.02 µm at 15 mg/m³. For other agglomerants, the fastest increase in droplets d₅₀ occurs within the concentration range of 0 mg/m³ to 5 mg/m³. Beyond this range, the growth rate of droplets size slows as the agglomerant concentration continues to rise. This behavior can be attributed to the increase in liquid viscosity with higher agglomerant concentration, which makes the liquid film more resistant to breakup into fine droplets. Moreover, chemical agglomerants at elevated concentrations promote the agglomeration of fine droplets more effectively. After initial breakup, these fine droplets tend to coalesce upon collision, forming larger droplets and thereby increasing the overall droplets size.
Figure 15.
Particle size changes of different chemical flocculants at different concentrations.

Using a chemical agglomerant concentration of 5 mg/m³, six different chemical agglomerants were added, and the nozzle droplets size distribution were measured for each case. The resulting particle size distribution plots are shown in Figure 16.
Figure 16.
Particle size distribution of droplets under different chemical flocculants. (a) Particle Size Distribution Histogram. (b) Water. (c) XTG. (d) SBG. (e) GG. (f) CPAM. (g) APAM. (h) Kaolin.
Figure 16.
Particle size distribution of droplets under different chemical flocculants. (a) Particle Size Distribution Histogram. (b) Water. (c) XTG. (d) SBG. (e) GG. (f) CPAM. (g) APAM. (h) Kaolin.


As shown in Figure 16(a), compared with pure water spraying, the addition of chemical agglomerants generally increases the d₉₀ of the sprayed droplets, except for GG. The most significant increases are observed for SBG and APAM, with d₉₀ values reaching 384.97 μm and 383.76 μm, respectively. Figures 16(b) to (h) further illustrate that the differential distribution curves for droplets containing agglomerants are generally broader and lower than those for pure water spraying. Moreover, these curves do not drop to zero at 1000 μm and exhibit some fluctuation in that region, indicating a reduction in the proportion of fine droplets and an increase in the proportion of larger droplets.
It is concluded that the addition of agglomerants increases the liquid surface tension and raises the surface tension coefficient. According to Equation (3), this leads to a decrease in the Weber number, indicating a reduced ratio of inertial forces to surface tension forces, which makes the liquid more resistant to breakup into fine droplets. Concurrently, polymeric agglomerants increase liquid viscosity. A higher-viscosity liquid film requires greater energy to rupture, favoring the formation of coarse droplets. Furthermore, after atomization, droplets moving through the air may collide. Under the agglomerating action of the chemical agents, fine droplets tend to coalesce into larger ones, resulting in an elevated d₉₀. Since the small droplets ejected from the nozzle possess high velocities and the agglomerant concentration is relatively low, the increase in liquid viscosity has only a limited effect, explaining the minimal changes observed in d₁₀ and d₅₀.
We=(ρdv2)/σ,
In the equation: We is the Weber number; ρ represents the liquid density; d is the droplets diameter; v is the characteristic fluid velocity of the droplet and σ is the surface tension coefficient.
Effect of Chemical Agglomeration Solution on Spatial Distribution of Droplets
Under the conditions of a 1/4 solid cone nozzle and a water pressure of 0.5 MPa, three chemical agglomerants—XTG, SBG, and GG—were added individually at a concentration of 5 mg/m³. The spatial distribution of the nozzle-generated droplets was measured, and the results are presented in Figure 17.
Figure 17.
Effect of chemical flocculants on the spatial distribution of droplets. (a) XTG. (b) SBG. (c) GG.
Figure 17.
Effect of chemical flocculants on the spatial distribution of droplets. (a) XTG. (b) SBG. (c) GG.

As shown in the figure, after adding XTG, droplets from the 1/4 solid cone nozzle are mainly distributed within the x-direction range of –25 to 10 cm. The maximum spray density reaches 0.533 L/(m²·s), with values across the measured area ranging from approximately 0.533 to 0.159 L/(m²·s). As the distance from the origin increases, droplets density gradually declines, dropping from about 0.159 L/(m²·s) to around 0.057 L/(m²·s). With SBG addition, the maximum spray density further increases to 0.556 L/(m²·s) compared to XTG, while the main coverage area slightly contracts. Spray density at the periphery decreases, showing an overall trend of concentration toward the spray center. After GG addition, the maximum spray density is 0.499 L/(m²·s), lower than that with XTG and SBG. Moreover, the peripheral spray density is lower than both the XTG case and pure water spraying.
In summary, the addition of chemical agglomerants leads to varying degrees of spray contraction and an increase in peak spray density, with the highest peak observed for SBG, followed by XTG and then GG. This behavior is attributed to the larger droplet sizes and increased mass after agglomerant addition, which enhance gravitational settling and reduce horizontal displacement, thereby concentrating the spray toward the central region.
3.3. Influence of Chemical Agglomerants and Atomization Performance on Dust Agglomeration
3.3.1. Influence of Chemical Agglomerants
Influence of Chemical Agglomerant Type
Six chemical agglomerants—XTG, SBG, GG, CPAM, APAM, and kaolin—were selected, each at a concentration of 5 mg/m³. Electrostatic precipitation experiments were conducted under a working voltage of 45 kV. The dust collected by the electrostatic precipitator was analyzed, and the cumulative particle size distribution curves are plotted in Figure 18.
As shown in Figure 18(a), after spray agglomeration without any agglomerant addition and under the influence of the electric field, the d₁₀ of blast furnace dust increases from 0.692 μm to 2.368 μm, the d₅₀ increases from 3.303 μm to 8.456 μm, and the d₉₀ increases from 11.96 μm to 21.97 μm. This is primarily attributed to the presence of numerous fine droplets in the electric field after spraying. Dust particles in the gas collide with the droplets and adhere to its surfaces due to inertial effects. As more dust particles are captured by the droplets, larger agglomerates form, resulting in an increase in particle size.
After the addition of agglomerants, the particle size of blast furnace dust increased significantly. As shown in Figure 18, the largest median particle size was observed with GG, with d₁₀, d₅₀, and d₉₀ values of 4.560 μm, 14.75 μm, and 62.13 μm, respectively. This was followed by SBG and XTG, with d₁₀ values of 4.662 μm and 4.131 μm, d₅₀ values of 13.57 μm and 12.13 μm, and d₉₀ values of 29.33 μm and 24.87 μm, respectively. The agglomeration effects of CPAM and APAM were slightly weaker, yielding post-agglomeration d₁₀ values of 2.408 μm and 2.476 μm, d₅₀ values of 10.97 μm and 9.802 μm, and d₉₀ values of 26.58 μm and 26.84 μm. The smallest median particle size was obtained with kaolin, with d₁₀, d₅₀, and d₉₀ values of 1.665 μm, 6.970 μm, and 17.74 μm, respectively.
From the differential particle size distribution curve (Figure 18(b)), it was observed that after the addition of agglomerants, the peak corresponding to particles below 1 μm decreased significantly, indicating a substantial reduction in the proportion of fine dust. This demonstrated that the agglomerants effectively promoted the agglomeration of ultrafine dust. The differential distribution curve for dust treated with XTG exhibited the highest peak, with a narrow and tall shape, suggesting a concentrated and uniform particle size distribution after XTG-induced agglomeration. This trend was also reflected in the cumulative particle size distribution curve (Figure 18(c)), where the XTG curve showed the steepest slope during the rising phase, indicating that the dust particle sizes were predominantly concentrated between 5 μm and 45 μm.
It can be concluded that the addition of guar gum (GG) results in the largest increase in dust particle size, while XTG leads to a more uniform particle size distribution after agglomeration. This behavior can be explained by the fact that guar gum (GG) is a natural polysaccharide polymer rich in hydroxyl (-OH) and ether (-O-) groups. When dissolved in water, it forms hydrogen bonds between water molecules and the guar gum chains, creating a viscous solution [19]. Through dipole-dipole interactions, GG adsorbs onto the surface of dust particles, reducing their surface free energy and overcoming inter-particle repulsion, thereby promoting dust agglomeration. Additionally, the electron-donating polar functional groups of the polysaccharide can engage in weak coordination or charge transfer with vacant orbitals of atoms or ions on the dust surface, enhancing adsorption strength. The resulting large agglomerates are also more stable, less prone to breakup due to gas turbulence or collisions inside the precipitator, which explains the larger particle sizes observed after GG-assisted agglomeration.
Sesbania gum (SBG) is a long-chain polymer composed of galactose and mannose, with a backbone of mannose and side chains of galactose, forming a branched "comb-like" structure. Its abundant hydroxyl (-OH) functional groups provide numerous adsorption sites, enabling simultaneous binding to multiple dust particles through hydrogen bonds, van der Waals forces, and other interactions, thereby establishing a "particle-polymer-particle" bridging configuration. The branched structure allows SBG molecules to extend more readily in water and intertwine with each other, forming a three-dimensional network that facilitates the agglomeration of fine dust particles into larger aggregates. As one of the most viscous natural gums known, the high-viscosity medium significantly increases the resistance to particle motion, effectively suppressing the re-dispersion or fragmentation of agglomerated particles due to gas turbulence or mechanical collisions. Moreover, it reduces the relative velocity between particles, prolongs their contact time, and enhances the likelihood of adhesion upon collision.
Xanthan gum (XTG) exhibits unique rheological properties: under static or low-shear conditions, it forms a highly viscous solution, while under high shear, its viscosity drops sharply. This characteristic reduces viscosity during spraying, resulting in uniform droplets sizes and a higher number of droplets, thereby increasing the contact area with dust particles. Once shear forces diminish, the viscosity quickly recovers, enabling rapid capture of fine particulate matter in the flue gas. Simultaneously, as a hydrophilic natural polysaccharide with an inherent anionic structure [20], xanthan gum contains abundant functional groups such as hydroxyl (-OH) and carboxyl (-COOH). These groups can adsorb onto the surfaces of multiple dust particles via van der Waals forces, hydrogen bonding, and other interactions. Its long-chain structure bridges multiple agglomerates, forming larger, networked aggregates. As these networked agglomerates move toward the collection plates of the precipitator, they further capture fine particles suspended in the electric field, progressively increasing the aggregate size.
Influence of Chemical Agglomerant Concentration
Three chemical agglomerants—XTG, SBG, and GG—were selected, and their concentrations were varied at 0 mg/m³, 5 mg/m³, 10 mg/m³, and 15 mg/m³. The collected dust samples were analyzed, and the particle size distribution curves are plotted in Figure 19.
As shown in Figure 19, the differential particle size distribution curves shift to varying degrees toward larger sizes as the agglomerant concentration increases. From Figure (a), it is evident that the d₅₀ of the dust increases with rising agglomerant concentration.
Figure 18.
Particle size distribution of dust at different chemical flocculants concentrations. (a) Line Chart. (b) XTG. (c) SBG. (d) GG.
Figure 18.
Particle size distribution of dust at different chemical flocculants concentrations. (a) Line Chart. (b) XTG. (c) SBG. (d) GG.

Figure (b) indicates that XTG exhibits a notable difference in particle size distribution between concentrations of 5 mg/m³ and those of 10 mg/m³ or 15 mg/m³. At 5 mg/m³, the differential distribution curve shows a single narrow peak within the 1–100 μm range, with the most frequent particle size being 15.32 μm, accounting for 6.55% of the distribution. As the XTG concentration increases, d₁₀, d₅₀, and d₉₀ all rise, and the distribution curve shifts rightward while becoming broader and lower, suggesting that higher XTG concentrations promote the formation of some larger agglomerates. In comparison with Figures (c) and (d), XTG does not produce a secondary peak around 100 μm as observed with SBG and GG, indicating its weaker agglomeration effect on larger particles.
Figure (c) shows that at an SBG concentration of 5 mg/m³, the differential distribution also displays a single narrow peak between 1μm and 100 μm, with the most frequent size at 15.34 μm (6.37%). At 10 mg/m³, the curve becomes trimodal, with peaks at 0.686 μm, 13.76 μm, and 105.2 μm; at 15 mg/m³, peaks appear at 0.686 μm and 18.97 μm. Compared to XTG, SBG at 10 mg/m³ and 15 mg/m³ demonstrates stronger agglomeration effects on larger particles. This is attributed to the formation of long-chain polymers by both XTG and SBG in water, where increasing concentration enhances polymer content and significantly improves agglomeration efficiency.
Figure (d) reveals that at a GG concentration of 5 mg/m³, the differential distribution exhibits three peaks at 0.686 μm, 15.32 μm, and 94.55 μm. As the concentration increases, d₉₀ shifts from 62.13 μm to 42.52 μm and then to 55.80 μm. Thus, GG achieves its best agglomeration effect on larger particles at 5 mg/m³; further increases to 10 and 15 mg/m³ result in a clear decrease in d₉₀ and similar distribution curves, indicating limited improvement in agglomeration. This is because GG primarily functions by forming hydrogen bonds with water molecules, increasing solution viscosity to capture dust. Higher GG concentrations only marginally raise viscosity, leading to limited enhancement in agglomeration performance.
3.3.2. Influence of Surfactants
Influence of Surfactant Type
Three surfactants—DDBAC, OP-10, and SBDS—were selected at a concentration of 5 mg/m³. Dust collection experiments were conducted, and the cumulative particle size distribution curves are presented in Figure 20.
As shown in Figure (a), after the addition of surfactants, the particle sizes of dust increased significantly with DDBAC and OP-10. With DDBAC, the d₁₀, d₅₀, and d₉₀ values were 3.185 μm, 10.21 μm, and 26.54 μm, respectively. With OP-10, these values reached 5.647 μm, 15.81 μm, and 32.63 μm, indicating the most pronounced increase in particle size. In contrast, with SDBS, the d₁₀, d₅₀, and d₉₀ values were 2.318 μm, 8.006 μm, and 22.24 μm, respectively, which are nearly identical to those without surfactant addition (the values were 2.368 μm, 8.456 μm, and 21.97 μm), suggesting a minimal agglomeration effect.
Figure 20.
Particle size distribution of dust under different surfactant. (a) Distribution Histogram. (b) Differential Distribution Plot. (c) Cumulative Distribution Plot.
Figure 20.
Particle size distribution of dust under different surfactant. (a) Distribution Histogram. (b) Differential Distribution Plot. (c) Cumulative Distribution Plot.

As could be seen from the differential distribution plot in Figure (b) and the cumulative distribution plot in Figure (c), after agglomeration with the surfactant OP-10, the differential distribution curve exhibited a single narrow peak within the 1–100 μm range, with the peak located at 17.05 μm. In contrast, within the same range, DDBAC showed a bimodal distribution with peaks at 8.970 μm and 13.76 μm, while SDBS presented a single broad peak at 7.241 μm. Both the uniformity and overall agglomeration effectiveness of the dust treated with DDBAC and SDBS were inferior to those achieved with OP-10.
The underlying reason is that octylphenol ethoxylate (OP-10) consists of a long chain linked by ether bonds [21]. Its hydrophobic moiety is the octylphenol group (C₆H₅O-R), while the hydrophilic part comprises a polyoxyethylene ether chain formed by hydroxyl and ether groups (-(CH₂CH₂O)n-H). A higher degree of ethoxylation increases the number of ether bonds and enhances hydrophilicity [22]. The hydrophobic tail of OP-10 can adsorb onto hydrophobic sites on dust particles via hydrophobic interactions, while the hydrophilic head extends into the aqueous phase. This oriented adsorption significantly reduces the interfacial free energy at the dust-water interface, lowering the energy barrier for dust aggregation in water films or droplets and thereby promoting dust agglomeration.
Moreover, the oxygen atoms in the ether bonds (-O-) possess lone-pair electrons, which can engage in n-σ or n-π weak interactions with the dust particle surfaces, forming weak coordination bonds. The π-electron cloud of the benzene ring may also participate in π-cation or π-dipole interactions with the particle surfaces. These multi-orbital interactions enhance the adsorption strength and coverage of OP-10 on the particle surfaces.
Influence of Surfactant Concentration
The surfactant OP-10 was selected, and its concentration was varied at 0 mg/m³, 5 mg/m³, 10 mg/m³, and 15 mg/m³. Dust samples were collected under each condition, and the particle size distribution curves are presented in Figure 21.
At a concentration of 5 mg/m³, the particle size distribution curve differed significantly from those at 10 mg/m³ and 15 mg/m³. At 5 mg/m³, the peak was narrower and higher, with the most frequent particle size being 17.05 μm, accounting for 6.96% of the distribution. As the agglomerant concentration increased, the addition of OP-10 led to rises in d₁₀, d₅₀, and d₉₀. The distribution curve shifted rightward while becoming broader and lower, indicating that higher OP-10 concentrations promoted the formation of some larger agglomerates.
However, as shown in Figure (b), the rate of increase in dust particle size gradually slowed with rising surfactant concentration. This was primarily because OP-10, as a non-ionic surfactant, relied on the hydration capacity of its hydrophilic head groups to bind a large number of water molecules, forming "liquid bridges" that reduced the surface tension of dust particles and facilitated contact and agglomeration. When the surfactant concentration exceeded a certain level, the molecules tended to form spherical aggregates themselves, which hindered further agglomeration and led to a saturation effect in dust agglomeration efficiency.
Figure 21.
Distribution of dust particle size at different surfactant concentrations. (a) Differential Distribution Plot. (b) Distribution Histogram.
Figure 21.
Distribution of dust particle size at different surfactant concentrations. (a) Differential Distribution Plot. (b) Distribution Histogram.

Influence of Synergistic Effects Between Agglomerants and Surfactants
To investigate the synergistic effects of XTG/OP-10, SBG/OP-10, and GG/OP-10 on dust agglomeration, chemical agents were applied at a concentration of 5 mg/m³. Dust removal experiments were conducted, and the resulting particle size distribution curves are presented in Figure 22.
Figure 22.
Particle size distribution of dust with the synergistic action of chemical flocculants and surfactant. (a) Differential Distribution Plot. (b) Distribution Histogram.
Figure 22.
Particle size distribution of dust with the synergistic action of chemical flocculants and surfactant. (a) Differential Distribution Plot. (b) Distribution Histogram.

Experimental results showed that after synergistic application of XTG and OP-10, the d₁₀, d₅₀, and d₉₀ values were 6.10 μm, 17.08 μm, and 36.63 μm, respectively, which were higher than those achieved with XTG or OP-10 alone. For the SBG/OP-10 combination, the corresponding values were 6.368 μm, 19.08 μm, and 55.8 μm, exceeding not only the results of individual SBG or OP-10 but also those of the XTG/OP-10 system. When GG was used together with OP-10, the d₁₀, d₅₀, and d₉₀ values were 5.481 μm, 16.81 μm, and 41.13 μm. While d₁₀ and d₅₀ were higher than those with GG or OP-10 alone, the d₉₀ was lower than that of GG alone, indicating that the addition of OP-10 reduced GG’s ability to form large agglomerates.
Analysis of particle size fractions after synergistic treatment revealed that for the XTG/OP-10 system, particles with d < 1 μm accounted for 1.34%, those with 1 μm < d < 10 μm accounted for 21.49%, and those with 10 μm < d < 100 μm accounted for 78.51%. For SBG/OP-10, the corresponding fractions were 1.28% (d < 1 μm), 19.58% (1 μm < d < 10 μm), 66.51% (10 μm < d < 100 μm), and 2.63% (d > 100 μm). With GG/OP-10, the fractions were 1.47% (d < 1 μm), 23.84% (1 μm < d < 10 μm), 73.89% (10 μm < d < 100 μm), and 0.80% (d > 100 μm). The SBG/OP-10 combination exhibited the best agglomeration performance, showing the lowest proportion of fine particles and the highest proportion of particles larger than 100 μm.
This is primarily attributed to the addition of OP-10, which reduces the liquid surface tension, resulting in finer spray droplets and a larger specific surface area. This significantly enhances the collision probability and capture efficiency between droplets and fine dust particles. Concurrently, the adsorption of OP-10 effectively improves the wettability of dust surfaces, reduces the contact angle, and facilitates rapid spreading and penetration of droplets. Consequently, dust particle surfaces become thoroughly wetted and "activated," minimizing air barriers and electrostatic repulsion between particles. The active functional groups (such as hydroxyl) on the molecular chains of sesbania gum (SBG) can more readily interact with dust particle surfaces through hydrogen bonding, van der Waals forces, and other interactions, increasing adsorption rate and strength. This synergy enhances bridging efficiency and agglomerate stability. Thus, the combined action of SBG and OP-10 significantly strengthens dust agglomeration.
3.3.3. Influence of Spray Performance
Effect of Nozzle Type
The 1/8 hollow cone nozzle, 1/8 solid cone nozzle, and 1/4 solid cone nozzle were selected. By varying the nozzle type, dust was collected and its particle size was measured. The resulting particle size distribution curves are shown in Figure 23.
Figure 23.
Dust particle size distribution of different nozzle types for spray. (a) Distribution Histogram. (b) 1/8 Hollow Cone Nozzle. (c) 1/8 Solid Cone Nozzle. (d) 1/4 Solid Cone Nozzle.
Figure 23.
Dust particle size distribution of different nozzle types for spray. (a) Distribution Histogram. (b) 1/8 Hollow Cone Nozzle. (c) 1/8 Solid Cone Nozzle. (d) 1/4 Solid Cone Nozzle.

As shown in the figure, after spraying with the 1/8 hollow cone nozzle, 1/8 solid cone nozzle, and 1/4 solid cone nozzle, the d₁₀ of the dust increased from the original 0.692 μm to 2.469 μm, 2.368 μm, and 1.758 μm, respectively. This corresponds to growth rates of 256.8%, 242.2%, and 154.0%. Similarly, the d₅₀ increased from 3.303 μm to 7.556 μm, 8.456 μm, and 8.929 μm, with growth rates of 128.8%, 156.0%, and 170.3%, respectively. The d₉₀ rose from 11.69 μm to 17.28 μm, 21.97 μm, and 26.51 μm, showing growth rates of 47.8%, 87.9%, and 126.8%, respectively.
From the particle size distribution curves, it can be seen that the 1/8 hollow cone nozzle and the 1/8 solid cone nozzle exhibit better agglomeration effects on fine dust particles. The cumulative particle size at 10% distribution (d₁₀) corresponds to 0.235 μm and 0.262 μm, respectively, whereas for the 1/4 solid cone nozzle, the d₁₀ is only 0.100 μm. However, as shown in Figure 3–19, the d₅₀ and d₉₀ values of the 1/4 solid cone nozzle are higher than those of the 1/8 hollow cone and 1/8 solid cone nozzles, indicating the best overall agglomeration performance.
This can be attributed to the larger droplet sizes produced by the 1/4 solid cone nozzle under overlapping spray conditions. The airflow tends to deflect around these larger droplets, allowing fine dust particles—due to their small size—to follow the airflow and bypass the droplets, thereby avoiding capture. In contrast, larger dust particles possess greater mass and inertia. When encountering large droplets, the airflow changes direction, but these particles continue along their original trajectories due to inertia, colliding with and being captured by the droplets. Additionally, the 1/4 solid cone nozzle delivers a higher spray volume, generating a greater number of droplets under the same water pressure, which increases the probability of dust-droplets collisions.
On the other hand, the 1/8 hollow cone and 1/8 solid cone nozzles produce smaller droplets, which are effective at capturing fine dust particles. However, the lower quantity dropletsreduce overall capture efficiency. The 1/8 solid cone nozzle outperforms the 1/8 hollow cone nozzle in agglomeration because it provides a better coverage. A wider spray area increases the possibility of dust-droplets collisions, enhancing water-spray agglomeration efficiency and resulting in superior agglomeration performance.
Effect of Synergistic Interaction Between Spray Liquid and Atomization on Dust Agglomeration
Different types of nozzles were selected, and 5 mg/m³ of SBG/OP-10 was added in each case. Dust removal experiments were conducted, and the resulting particle size distribution curves are presented in Figure 24.
Figure 24.
Dust Particle Size Distribution under the Synergistic Effect of Different Nozzle Types and SBG/OP-10. (a) Distribution Histogram. (b) 1/8 Hollow Cone Nozzle + SBG/OP-10 Synergy. (c) 1/8 Solid Cone Nozzle + SBG/OP-10 Synergy. (d) 1/4 Solid Cone Nozzle + SBG/OP-10 Synergy.
Figure 24.
Dust Particle Size Distribution under the Synergistic Effect of Different Nozzle Types and SBG/OP-10. (a) Distribution Histogram. (b) 1/8 Hollow Cone Nozzle + SBG/OP-10 Synergy. (c) 1/8 Solid Cone Nozzle + SBG/OP-10 Synergy. (d) 1/4 Solid Cone Nozzle + SBG/OP-10 Synergy.


Under different nozzle types with the addition of both chemical agglomerants and surfactants, the 1/8 solid cone nozzle combined with SBG/OP-10 produced agglomerated dust with d₁₀ and d₅₀ values of 5.481 μm and 16.81 μm, respectively. These are higher than those achieved with the 1/8 hollow cone nozzle combined with SBG/OP-10 (d₁₀ = 4.100 μm, d₅₀ = 12.66 μm), and they also exceed the results from the 1/4 solid cone nozzle combined with SBG/OP-10 (d₁₀ = 3.031 μm, d₅₀ = 15.94 μm). Regarding d₉₀, the highest value was 54.45 μm produced by the 1/4 solid cone nozzle combined with SBG/OP-10, secondly it was 41.13 μm produced by the 1/8 solid cone nozzle combined with SBG/OP-10, finally it was 26.74 μm produced by the 1/8 hollow cone nozzle combined with SBG/OP-10.
Analysis suggests that, the viscosity of the spray liquid increases after adding chemical agglomerants and surfactants, which leads to larger droplets sizes and enhances dust agglomeration. Under these conditions, the influence of droplets size on agglomeration effectiveness is diminished. The 1/8 solid cone nozzle provides a more uniform spatial distribution of droplets and broader spray coverage, thereby resulting in superior agglomeration performance.
3.4. Analysis of Dust Collection Efficiency
3.4.1. Effect of Chemical Agglomerants
Effect of Chemical Agglomerant Type
Six chemical agglomerants—XTG, SBG, GG, CPAM, APAM, and kaolin—were added individually at a concentration of 5 mg/m³. The inlet and outlet dust concentrations of the electrostatic precipitator were measured, and the corresponding dust removal efficiencies are presented in Figure 25.
As shown in the figure, the dust collection efficiency increased after the addition of chemical agglomerants compared to the baseline efficiency of 93.02% without agglomerants. The highest efficiency was 96.76% when XTG was added, followed they are 96.47% and 96.00% when SBG and APAM were added respectively. The lowest efficiencies were 94.34%, 94.29%, and 93.84% when GG, CPAM, and kaolin were added respectively.
This variation can be attributed to the fact that chemical agglomerants promotes the fine dust coagulating into larger particles, while also changing the dissociation properties of the spray liquid, thereby affecting the corona discharge characteristics of the wet electrostatic precipitator. Among the six agglomerants, XTG performed the best in the corona discharge experiments, followed were SBG and APAM, and the others were bad. In terms of agglomeration effectiveness, GG showed the strongest performance, followed were SBG and XTG. Although GG produced the largest median particle size (d₅₀), the corona discharge performance is deteriorated in the wet electrostatic precipitator after its using. This resulted in fewer charged particles and reducing dust capture on the collection plates, lowering the collection efficiency ultimately. In contrast, the median dust size was 12.13 μm when XTG was added, it promoted the corona discharge performance and enhanced the collection efficiency under combined effect of multiple factors.
Figure 25.
Effects of different chemical flocculants on dust collection efficiency.

Effect of Chemical Agglomerant Concentration
Two chemical agglomerants, XTG and SBG, were selected in the experiments, and their concentrations were varied at 0 mg/m³, 5 mg/m³, 10 mg/m³, and 15 mg/m³. The inlet and outlet dust concentrations were measured, and the corresponding dust removal efficiencies are plotted in Figure 26.
As shown in the figure, the dust collection efficiency of the wet electrostatic precipitator initially increases and then decreases with agglomerant concentration. At an agglomerant concentration of 5 mg/m³, the removal efficiencies for XTG and SBG increase to 96.76% and 96.47%, respectively. When the concentration is raised to 10 mg/m³, the removal efficiencies decline to 95.99% and 94.94%. At 15 mg/m³, the efficiencies further decrease to 95.10% and 93.54%, respectively. This trend can be explained as follows: the viscosity of the spray liquid increases with the concentration of the chemical agglomerant, Making nozzle atomization performance and corona discharge efficiency worse. Furthermore, the adsorption pointes on dust particle surfaces are limited. Excessive agglomerant concentration gradually reduces the bridging efficiency between particles, leading to a decline in dust collection efficiency.
Figure 26.
Effects of different concentrations of chemical flocculants on dust collection efficiency.
Figure 26.
Effects of different concentrations of chemical flocculants on dust collection efficiency.

3.4.2. Effect of Surfactants
Effect of Surfactant Type
Three surfactants—DDBAC, OP-10, and SBDS—were added individually at a concentration of 5 mg/m³. The inlet and outlet dust concentrations were measured, and the corresponding dust removal efficiencies are presented in Figure 27.
As shown in Figure 27, after adding surfactants, the highest dust collection efficiency was achieved with OP-10, reaching 96.61%, followed by SDBS at 95.14%, while DDBAC performed the worst with an efficiency of only 94.23%. According to Section 3.3.2, the addition of surfactants significantly increased dust particle sizes for DDBAC and OP-10. Specifically, the median particle size (d₅₀) after adding DDBAC was 10.21 μm, while OP-10 resulted in the largest increase of size, its d₅₀ was 15.81 μm. In contrast, SDBS produced a d₅₀ of 8.01 μm. OP-10 demonstrated the best agglomeration effect on fine dust particles and accordingly achieved the highest collection efficiency. Although DDBAC yielded a larger median particle size than SDBS, DDBAC is a cationic surfactant while SDBS is anionic. The superior corona discharge performance of SDBS compared to DDBAC explains its higher dust collection efficiency despite its smaller agglomerated particle size.
Figure 27.
Effects of different surfactants on dust collection efficiency.

Effect of Surfactant Concentration
The surfactant OP-10 was selected, and its concentration was varied at 0 mg/m³, 5 mg/m³, 10 mg/m³, and 15 mg/m³. The inlet and outlet dust concentrations were measured, and the corresponding dust removal efficiencies are plotted in Figure 28.
As shown in the figure, the dust collection efficiency initially increases and then decreases with the surfactant concentration. When the OP-10 concentration is 0 mg/m³, the collection efficiency is 93.27%. When the concentration is 5 mg/m³, it rises to 96.61%. The collection efficiency declines to 95.28% at 10 mg/m³, and further drops to 94.26% at 15 mg/m³. This trend is primarily attributed to the excessive addition of surfactant, which leads to the formation of a large amount of fine foam in the wash water. The foam occupies effective space within the electric field zone in the precipitator, shortens the residence time of dust particles, and simultaneously weakens the corona discharge. This Causes a decrease in corona current, makes the dust charge worse and consequently the collection efficiency decreases.
Figure 28.
Effects of different concentrations of surfactants on dust collection efficiency.

Effect of Synergistic Action Between Agglomerants and Surfactants
To investigate the synergistic effect of chemical agglomerants and surfactants on dust collection efficiency, Adding XTG/OP-10 and SBG/OP-10 which single-component concentrations were 5 mg/m³ to the spray liquids. The inlet and outlet dust concentrations were measured, and the removal efficiencies are presented in Figure 29.
As shown in Figure 29, the highest dust collection efficiency is 97.86% under the synergistic effect of SBG and OP-10. It is 1.39% higher than that of adding SBG alone (96.47%) and 1.25% higher than that of adding OP-10 alone (96.61%). The dust collection efficiency is 97.31% under the synergistic effect of XTG and OP-10, which is 0.55% higher than that of adding XTG alone (96.76%) and 0.70% higher than that of adding OP-10 alone (96.61%).
This difference is primarily attributed to the particle size distribution after synergistic agglomeration. For the SBG/OP-10 system, particles with d < 1 μm account for 1.28%, those with 1 μm < d < 10 μm account for 19.58%, those with 10 μm < d < 100 μm account for 66.51%, and those with d > 100 μm account for 2.63%. This distribution shows the lowest proportion of fine particles and the highest proportion of particles larger than 100 μm, indicating the most effective agglomeration. Additionally, the addition of surfactant enhances dust wettability, making particles more readily captured by water droplets. This results in larger agglomerates which improve the dust chargeability, and the collection efficiency increases.
Figure 29.
Effect of synergistic effect of chemical flocculants and surfactants on dust collection efficiency.
Figure 29.
Effect of synergistic effect of chemical flocculants and surfactants on dust collection efficiency.

3.4.3. Effect of Spray Performance on Dust Collection Efficiency
Three nozzle types—1/8 hollow cone, 1/8 solid cone, and 1/4 solid cone—were selected. Dust inlet and outlet concentrations were measured both with and without chemical additives, and the corresponding dust removal efficiencies were calculated, as shown in Figure 30.
Figure 30.
Effects of different nozzle types on dust collection efficiency.

As shown in the figure, in the absence of chemical additives, the lowest dust collection efficiency is 92.57% by using 1/8 hollow cone nozzle. The collection efficiency is 93.26% by using 1/8 solid cone nozzle, it is higher 0.69% than that of 1/8 hollow cone nozzle. representing an improvement of over the hollow cone nozzle. The highest efficiency is 95.43% by using 1/4 solid cone nozzle, it is 2.86% higher than that of the 1/8 hollow cone nozzle and 2.17% higher than that of 1/8 solid cone nozzle.
The analysis indicates that the droplets sizes produced by nozzle atomization follow the order: 1/8 hollow cone nozzle > 1/8 solid cone nozzle > 1/4 solid cone nozzle. In terms of spatial uniformity, the droplets distribution ranks from most to least uniform as: 1/8 solid cone nozzle, 1/4 solid cone nozzle, 1/8 hollow cone nozzle. Spray volume increases in the sequence: 1/8 hollow cone nozzle < 1/8 solid cone nozzle < 1/4 solid cone nozzle. The 1/4 solid cone nozzle generates smaller droplets and a higher spray volume, resulting in a greater number of droplets. This is not only advantageous to corona discharge but also enhances dust agglomeration, leading to effective dust removal and high efficiency. Conversely, the 1/8 hollow cone nozzle produces larger droplets, a lower spray volume, and an uneven spatial distribution, which result in worse corona discharge. and its dust collection efficiency is the lowest.
After adding SBG/OP-10, the dust removal efficiencies of all three nozzle types increased. The most significant improvement was observed with the 1/8 solid cone nozzle, whose efficiency reached 97.11%, representing an increase of 3.85 percentage points compared to the case without chemical additives, and achieving the highest efficiency among the three. The 1/8 hollow cone nozzle showed an efficiency of 94.88%, a rise of 2.31% from the baseline without chemicals, though it remained the lowest among the three. The smallest improvement was seen with the 1/4 solid cone nozzle, whose efficiency increased by 1.40% to 96.84% compared to the condition without additives.
The analysis suggests that after the addition of chemical agglomerants and surfactants, the dust treated by the 1/8 solid cone nozzle exhibits the largest median particle size, indicating relatively effective dust agglomeration. Simultaneously, with the chemical additives, the 1/8 solid cone nozzle produces relatively fine droplets with a uniform spatial distribution. These combined effects contribute to its high dust collection efficiency.
4. Conclusions
This study established a spray atomization experimental platform to investigate the spray characteristics of five types of nozzles and explore their atomization behavior. Based on the analysis of the microscopic morphology and particle size distribution of blast furnace gas dust, agglomeration experiments and dust collection efficiency tests were conducted in a wet electrostatic precipitator. The research enhanced dust agglomeration performance and collection efficiency, identified optimal operating conditions, and achieved deep purification of blast furnace gas. The specific conclusions are as follows:
- Under single-nozzle spraying conditions at a spray pressure of 0.5 MPa, the smallest droplets size was produced by the 1/4 solid cone nozzle, while the most uniform spatial droplets distribution was achieved with the 1/8 solid cone nozzle. After adding chemical agglomerants, among the six agglomerants tested, SBG resulted in the largest increase in droplets size, whereas GG led to the smallest increase. Under twin-nozzle overlapping conditions, droplets sizes for all three twin-nozzle configurations were smaller than those of single-nozzle spraying. The 1/8 solid cone twin-nozzle produced the finest droplets, while the 1/4 solid cone twin-nozzle exhibited relatively uniform spatial distribution.
- When six chemical agglomerants were added separately to the spray liquid at a concentration of 5 mg/m³, the agglomeration effectiveness ranked from highest to lowest as follows: GG, SBG, XTG, CPAM, APAM, and kaolin. With three surfactants added at 5 mg/m³, OP-10 showed the best agglomeration effect, followed by DDBAC, while SDBS performed the poorest. As the concentration of agglomerants or surfactants increased, the enhancement in agglomeration gradually weakened. The most effective combination was the synergy of SBG and OP-10, which yielded a median particle size of 19.08 μm.
- At the chemical agglomerant concentration of 5 mg/m³, XTG achieved the highest collection efficiency of 96.76%, followed by SBG and APAM, while GG, CPAM, and kaolin showed the lowest efficiencies. Among the three surfactants concentration of 5 mg/m³, OP-10 delivered the highest collection efficiency of 96.61%. Using the 1/4 solid cone nozzle alone resulted in a maximum efficiency of 95.43%. The highest dust collection efficiency was 97.86% under the combined conditions of adding 5 mg/m³ SBG/OP-10 and using 1/8 solid cone nozzle for atomization.
Funding
This research was supported by the Natural Science Foundation of Hebei pvovince, China (E2015203236), This research is supported by Qinhuangdao science and technology research and development program (202003B033).
Institutional Review Board Statement
Not applicable.
Data Availability Statement
Not applicable.
Acknowledgments
The authors are grateful to Hebei Provincial Key Laboratory of Applied Chemistry for providing electron microscopic characterization. The authors thanks Zhu for his help with the experiment.
Conflicts of Interest
The authors declare no conflicts of interest.
Nomenclature
| d | Particle diameter |
| D10 | Diameter when the cumulative distribution of dust is 10% |
| d50 | Diameter when the cumulative distribution of dust is 50% |
| D90 | Diameter when the cumulative distribution of dust is 90% |
References
- China Energy Big Data Report (2025) [R]. China Energy Research Institute, 2025.
- Liang T, Ma S P. Brief Analysis of Nozzle Design for Spray Dust Suppression [J]. Mechanical Management and Development, 2003, (01): 13-14.
- Ma S P, Kou Z M. Design Study of Pressure Atomization Nozzle for Spray Dust Suppression [J]. Mining Machinery, 2006, (01): 67-68+5.
- Cheng W M, Zhou G, Zuo Q M, et al. Experimental Study on the Relationship between Nozzle Spray Pressure and Atomization Particle Size [J]. Journal of China Coal Society, 2010, 35(08): 1308-1313.
- Chen Y X. Spray Dust Suppression Technology Using Tapered Hollow Nozzles at Belt Conveyor Transfer Points [J]. Safety in Coal Mines, 2012, 43(04): 31-33.
- Ding Z J, Wu Y H, Xiao L C. Atomization Characteristics of Water Spray in Electrostatic Precipitators and Its Impact on Dust Removal Performance [J]. Environmental Engineering, 2013, 31(S1): 354-356.Vallet A, Tinet C. Characteristics of droplets from single and twin jet air induction nozzles: A preliminary investigation[J]. Crop Protection, 2013,4863-68.
- Chen C C, Li S, Wu X Y, et al. Analysis of droplets size uniformity and selection of spray parameters based on the biological optimum particle size theory[J]. Environmental research, 2021,204(Pt B):112076-112076. [CrossRef]
- Yuan F X, Gu C C, Yi K C, et al. Atomization Characteristics of a Hollow Cone Nozzle for Air-Assisted Variable-Rate Spraying[J]. Agriculture, 2023,13(10). [CrossRef]
- Narendra D, Varun K, Sivakumar D. High-energy droplets collisions in multi-interacting hollow cone sprays[J]. International Journal of Multiphase Flow. Volume 195, Issue. 2026. PP 105525-105525. [CrossRef]
- Durham M D, Schlager R J, Ebner T G, et al. Method and apparatus for decreased undesired particle emissions in gas streams: US, US5893943 A[P]. 1999.
- Baldrey K E. Advanced flue gas conditioning as a retrofit upgrade to enhance PM collection from coal-fired electric utility boilers [J]. Office of Scientific & Technical Information Technical Reports, 2000.
- Geng J F, Song S J, Bao J J, et al. Promoting removal of fine particulate matter in WFGD system by using wetting agent [J]. CIESC Journal, 2011, 62(04): 1084-1090.Li R, Li C, Zhuang J, et al. Mechanistic Influence of Chemical Agglomeration Agents on Removal of Inhalable Particles from Coal Combustion[J]. ACS omega, 2020,5(40): 25906-25912.
- Shan G, Chun X L. Study on Dust Turbulence-Chemical Agglomeration for Electrostatic Precipitation Technology[J]. E3S Web of Conferences, 2021,245: 3011. [CrossRef]
- Yang G Z, Zhao Y C, Xiong Z, et al. Study on Chemical Agglomeration Enhanced Dust Removal and Synergistic Zero Discharge of Desulfurization Wastewater in a 300 MW Coal-fired Power Plant [J]. Proceedings of the CSEE, 2021, 41(15): 5274-5283.
- Zhang J F. Promotion Effect of Chemical Agglomeration Technology on the Removal of Fine Particulate Matter and SO₃ Acid Mist by Electrostatic Precipitation [D]. Nanchang Hangkong University, 2022.
- Li T Y, Cui X Z, Ma F X, et al. Experimental Study on Enhancing Fine Particulate Matter Removal Based on Chemical Agglomeration Technology [J]. Coal Conversion: 1-12.
- Qin J J, Liu D, Gao X, et al. Study on Rheological Properties of Guar Gum Clean Gel [J]. Journal of Xiangtan University (Natural Science Edition), 2023, 45(03): 66-74.
- Zhu X F, Su X X, Yang X L, et al. Preparation and Application of Sepiolite/Xanthan Gum Composite Flocculant [J]. Applied Chemical Industry, 2009, 38(09): 1241-1244.
- Du X Y, Gao Z L, He L L. Quantifying the effect of non-ionic surfactant alkylphenol ethoxylates on the persistence of thiabendazole on fresh produce surface[J]. Journal of the science of food and agriculture. Volume 104, Issue 5. 2023. PP 2630-2640. [CrossRef]
- Huang H, Zhang L, Ren T. Analysis of Surface Properties of Polyalkylphenol Polyoxyethylene Ether Surfactants [J]. World Pesticides, 2014, 36(02): 50-54.
Figure 1.
Working principle diagram of electrostatic dust removal.

Figure 2.
Wet electrostatic dust removal comprehensive test platform.

Figure 3.
Schematic diagram of the structure of the spray atomization experimental platform.

Figure 4.
Schematic diagram of the dust sampling system.

Figure 5.
Particle size distribution of blast furnace gas dust.

Figure 6.
SEM morphology of blast furnace dust.

Figure 7.
Droplets particle size distribution map of different types of nozzles. (a) Particle Size Distribution Histogram. (b) 1/4 Solid Cone Nozzle. (c) 1/8 Solid Cone Nozzle. (d) 1/4 Hollow Cone Nozzle. (e) 1/8 Hollow Cone Nozzle. (f) 1/4 Fan-type Nozzle.
Figure 7.
Droplets particle size distribution map of different types of nozzles. (a) Particle Size Distribution Histogram. (b) 1/4 Solid Cone Nozzle. (c) 1/8 Solid Cone Nozzle. (d) 1/4 Hollow Cone Nozzle. (e) 1/8 Hollow Cone Nozzle. (f) 1/4 Fan-type Nozzle.

Figure 8.
Measurement process of droplets spatial distribution.

Figure 9.
Schematic diagram of the coordinate system.

Figure 10.
Spatial distribution of droplets from different nozzles. (a) 1/8 Hollow Cone Nozzle. (b) 1/4 Hollow Cone Nozzle. (c) 1/8 Solid Cone Nozzle. (d) 1/4 Solid Cone Nozzle. (e) 1/4 Fan-type Nozzle.
Figure 10.
Spatial distribution of droplets from different nozzles. (a) 1/8 Hollow Cone Nozzle. (b) 1/4 Hollow Cone Nozzle. (c) 1/8 Solid Cone Nozzle. (d) 1/4 Solid Cone Nozzle. (e) 1/4 Fan-type Nozzle.


Figure 12.
Particle size distribution of droplets. (a) Particle Size Distribution Histogram. (b) 1/8 hollow cone twin-nozzle. (c) 1/8 solid cone twin-nozzle. (d) 1/4 solid cone twin-nozzle,.
Figure 12.
Particle size distribution of droplets. (a) Particle Size Distribution Histogram. (b) 1/8 hollow cone twin-nozzle. (c) 1/8 solid cone twin-nozzle. (d) 1/4 solid cone twin-nozzle,.

Figure 18.
Distribution of dust particle size under different chemical flocculants. (a) Distribution Histogram. (b) Differential Distribution Plot. (c) Cumulative Distribution Plot.
Figure 18.
Distribution of dust particle size under different chemical flocculants. (a) Distribution Histogram. (b) Differential Distribution Plot. (c) Cumulative Distribution Plot.

Disclaimer/Publisher’s Note: The statements, opinions and data contained in all publications are solely those of the individual author(s) and contributor(s) and not of MDPI and/or the editor(s). MDPI and/or the editor(s) disclaim responsibility for any injury to people or property resulting from any ideas, methods, instructions or products referred to in the content. |
© 2026 by the authors. Licensee MDPI, Basel, Switzerland. This article is an open access article distributed under the terms and conditions of the Creative Commons Attribution (CC BY) license (http://creativecommons.org/licenses/by/4.0/).
Copyright: This open access article is published under a Creative Commons CC BY 4.0 license, which permit the free download, distribution, and reuse, provided that the author and preprint are cited in any reuse.


