
Submitted:
03 March 2026
Posted:
04 March 2026
You are already at the latest version
Abstract
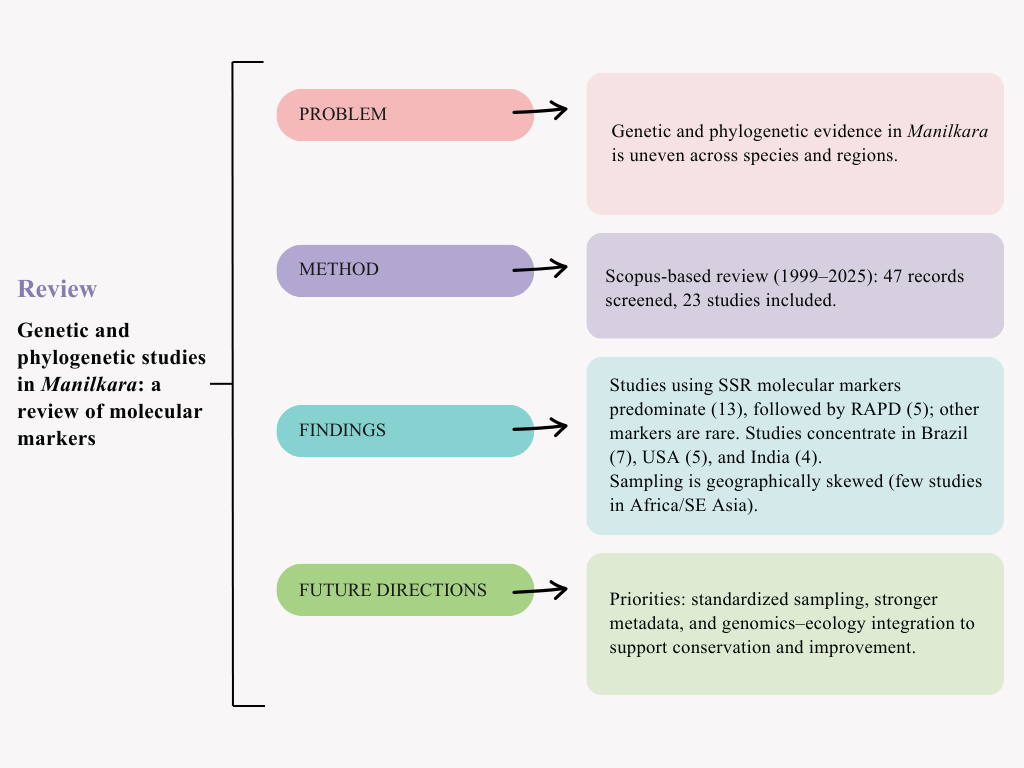
Manilkara (Sapotaceae) includes tropical tree species of high ecological and socio-economic value, yet genetic and phylogenetic evidence remains uneven across taxa and eco-geographic regions. Here, we synthesize studies conducted between 1999 and 2025 which summarize the use of molecular markers to infer genetic diversity, connectivity, population structure, and evolutionary relationships within this genus. The studies are dominated by PCR-based marker systems, including dominant markers (like RAPD and SCoT) and microsatellites from the nuclear genome and plastid genome. Other studies rely on PCR-amplified sequence loci, such as ITS and chloroplast regions, while others use high-throughput technologies, including NGS-assisted SSR development, sequences of complete plastomes, and targeted nuclear sequencing. Overall, studies using SSRs provide the most informative estimates for within-species diversity and fine-scale structure, whereas plastid datasets (cpSSR/cpDNA) mainly support inference on maternal lineages and plastid-based relationships but can be constrained by uniparental inheritance and limited variation, especially under small sampling. Some limitations found include heterogeneous sampling, inconsistency in reporting the methodological parameters, and limited connection with ecological or phenotypic parameters which restricts chances of inferences on demography and adaptation. Based on this review, future research in Manilkara would benefit from setting up a broader taxonomic and geographic coverage, incorporating genome-wide technology where feasible to strengthen conservation management, and breeding opportunities in Manilkara.
Keywords:
genetic diversity
; population structure
; sapotaceae
; technical gaps
; genome
1. Introduction
An ecosystem dominated by species of the Sapotaceae family serves as a reliable indicator of forest quality in tropical regions [1]. Sapotaceae grow slowly and produce high quality timber that is increasingly recognized internationally [2]. Moreover, species of the Sapotaceae family represent key structural elements of Neotropical rainforests, although certain taxa also inhabit seasonally dry environments. The family is characterized by distinctive morphological traits such as the exudation of latex, simple entire leaves, malpighiaceous hairs, and flowers typically grouped in fascicles [3]. Because their flowers and fruits are frequently scarce or located high in the forest canopy, they are often difficult to collect or observe [4,5]. These conditions contribute to the taxonomic complexity of the family. Consequently, Sapotaceae species remain insufficiently investigated from both taxonomic and molecular perspectives across many tropical regions [2].
The pantropical plant family Sapotaceae comprises about 1250 species [6,7], but it is steadily increasing in tropical America [8,9], Africa [10] and the Pacific region [11,12,13,14]. Currently, this family includes 65–70 genera [15]. In Peru, it comprises 10 genera and 90 species, most of which are evergreen trees that produce white latex and have exudations on all parts of the plant [16]. The Manilkara genus currently comprises approximately 102 species found in tropical regions [17]. Nevertheless, although numerous species face severe extinction risks driven by anthropogenic pressures, information regarding their genetic diversity, population structure, and reproductive biology remains scarce [6,18,19].
Tropical forests harbor the highest levels of biodiversity on the planet and include numerous species of the genus Manilkara. Nonetheless, these ecosystems have undergone extensive deforestation and degradation as a result of human activities [20,21]. The escalating demand for timber, energy, food, and agricultural resources to meet human needs has intensified deforestation, leaving much of the remaining flora and fauna confined to small, isolated forest remnants. This ongoing habitat loss has triggered sharp population declines, accelerating global warming and the consequent erosion of biodiversity worldwide [22,23].
The threat extends ranges from the complete disappearance of species to the potential erosion of genetic diversity and the diminished capacity of surviving populations to adapt and recover [24,25]. Deforestation and habitat fragmentation modify landscape structure, biodiversity and natural connectivity [25,26]. These changes can reduce genetic diversity in multiple ways. (i) Direct loss of genetic variation: when habitats shrink or disappear, their populations and unique genetic traits may be lost due to declining numbers. (ii) Isolation of surviving groups: fragmented populations experience limited gene flow, further reducing genetic exchange [27].
Such processes may lead to genetic bottlenecks, intensify random genetic drift, and increase the likelihood of inbreeding depression [25,28]. Reduced seed and pollen dispersal can alter the mating patterns of trees and modify their genetic distribution across landscapes. When habitat fragmentation isolates populations, greater distances between populations increase the likelihood that relatives will interbreed. This increased inbreeding ultimately reduces genetic variation within species [29].
Molecular characterization of forest species serves as a crucial tool for elucidating their genetic diversity, population structure, and evolutionary relationships, all of which are vital for the conservation and sustainable management of their genetic resources. Different molecular tools exist and have historically been applied according to diverse research objectives. Nuclear markers (SSR, RAPD, SNP) have been typically used to assess intraspecific and population-level diversity, while cpDNA and nuclear ITS regions are commonly used for species identification and phylogenetic inference [30,31]. Collectively, these molecular techniques have offered opportunities for investigating, conserving, and managing forest genetic resources. Combining molecular evidence with ecological and biogeographic data can deepen our understanding of species evolution and adaptive responses to environmental change [32].
In this methodological context and because Manilkara studies have applied heterogeneous marker systems this review briefly clarifies the DNA-marker concepts used throughout the synthesis. DNA markers are defined as particular genomic sequences that disclose inheritable genetic variation among individuals or populations. These markers may be located within coding or non-coding regions of the genome and are identified using molecular techniques such as PCR amplification or DNA sequencing, offering indirect insights into genetic diversity and evolutionary relationships [33,34]. They can also be employed to identify polymorphisms among distinct genotypes within a population by examining variations in specific DNA sequences [35,36].
This global framework is particularly relevant, because in Peru, Manilkara bidentata is classified as a threatened species under Supreme Decree No. 043-2006-AG. This status requires the integration of molecular information to answer key questions about genetics, phylogeny, connectivity, and sampling representativeness. This context motivated us to synthesize the diversity of molecular studies conducted worldwide on species of the genus Manilkara. In parallel, in Peru we are developing genomic analyses and a reconstruction of the actual spatial distribution of M. bidentata (Contract N° PE501093163-2024-PROCIENCIA-BM). Overall, our objective is to provide the global academic community dedicated to molecular studies for research on the conservation and improvement of species of the genus Manilkara. To optimize resource allocation, promote the integration of research with policies, support countries in adapting their forest governance strategies, and contribute to the sustainable development of the world's forests.
This review focuses on the application of molecular characterization to elucidate patterns of genetic diversity, population structure, and phylogenetic relationships among species of the genus Manilkara. Specifically, we: (i) identify molecular markers employed in previous studies; (ii) summarize the diversity of Manilkara species investigated and (iii) synthesize methodological gaps and future directions for ensuring the resilience of the species. This manuscript is organized as follows: Section 2 outlines the materials and methods; Section 3 presents the results; Section 4 and Section 5 discuss implications and future directions; Section 6 concludes.
2. Materials and Methods
2.1. Study Design
Because no comprehensive review exists for Manilkara molecular characterization, we conducted an exploratory synthesis. We (i) identify molecular markers used in prior research and (ii) summarize taxonomic, methodological, and geographic coverage. We also (iii) highlight gaps and propose directions for future molecular applications under environmental change.
2.2. Bibliographic Search and Selection of Articles
We searched in Scopus scientific database, using Boolean combinations such as. “Manilkara” AND “Molecular characterization”, “Manilkara” AND “molecular markers”, “Manilkara” AND “genetic diversity”, “Manilkara” AND “population structure”, “Manilkara” AND “genetic”, “Manilkara” AND “phylogeny” OR “phylogenetics”. We screened in four steps. First, elimination of duplicate studies. Second, review of titles and abstracts according to inclusion and exclusion criteria. Third, review of relevant citations in Scopus to identify additional studies. Fourth, we prioritized studies reporting extractable metrics, but we did not exclude studies solely for lacking uniform metrics; instead, such studies were synthesized narratively.
Scopus was selected as the primary source for document retrieval due to its broad coverage of peer-reviewed literature and its standardized indexing and export functionalities, which facilitate a transparent and reproducible screening workflow [37]. The decision to rely on a single database stems from the formatting incompatibilities that often arise when combining datasets from multiple sources [38]. A comparative search conducted in both Scopus and Web of Science (WoS) the two leading academic indexing platforms [39] showed that Scopus contained 53% more records, with 85% of the WoS entries already included in Scopus. Therefore, Scopus was selected as the most suitable database for this research.
The literature search and data collection were carried out until December 31, 2025, the date established as the cutoff date for inclusion of studies in this review.
2.3. Eligibility Criteria
2.3.1. Inclusion Criteria
The studies were selected based on the following criteria. (i) articles that considered species of the genus Manilkara as the object of study; (ii) research that used molecular markers for genetic and phylogenetic characterization. (iii) Studies published in peer-reviewed scientific journals; (iv) Articles in English and (v) research published between 1999 and 2025, to cover the historical development of molecular techniques applied to this genus.
2.3.2. Exclusion Criteria
The following types of studies were excluded. (i) articles that did not use molecular markers for species of the genus Manilkara; (ii) research that did not focus on species of the genus Manilkara and (iii) non-peer-reviewed gray literature (theses, technical reports, posters or conference abstracts).
2.4. Study Selection
A structured search yielded a total of 47 articles (Figure 1). After applying manual screening according to the established inclusion and exclusion criteria, 23 studies were ultimately retained, ensuring a focused and detailed review. All data were sourced exclusively from the Scopus database.
2.5. Data Extraction
From studies that met the inclusion criteria, we extracted: (i) general information (authors, year, title, and journal); (ii) methodological characteristics (molecular marker type(s), sample size, and geographic scope); (iii) main outcomes, including genetic diversity metrics, population structure/differentiation, phylogenetic or evolutionary inferences (when reported), and any evidence of gene flow or introgression (when assessed) and (iv) reported methodological limitations and research gaps. Throughout this review, we use “individuals” for sampled organisms within populations, “accessions” for germplasm entries or other curated sampling units, and “populations” for geographically defined sampling groups as described in the original studies.
3. Results
3.1. Study Characteristics
Among the 23 studies, most were published in Q1–Q2 journals (See Supplementary Table S1), with Wiley, Elsevier, OUP, Springer Nature, and Cambridge among the most frequent publishers.
Supplementary Figure S1 shows temporal trends (1999–2025) in marker use. SSRs dominate from approximately 2005, whereas cpDNA/ITS/RAPD/SCoT appear intermittently.
Of these, seven studies were from Brazil [44,45,46,47,48,49,50], five from the United States [51,52,53,54,55], four from India [56,57,58,59], two of Mexico [60,61], two from Indonesia [62,63], one from Thailand [64], one from China [65] and one from Switzerland [66] (Figure 2).
Likewise, within the studies, Figure 3 indicates a strong dominance of SSR markers (13 studies), used mainly in Brazil (6), followed by the USA (3), India (2), and Mexico (2). RAPD is the second most frequent marker (5 studies), reported primarily in India and Indonesia (2 each) and less often in the USA (1). All other markers are rare: SCoT appears only once (Thailand), while cpDNA/cpSSR and ITS are infrequent and typically reported in combination (China, Brazil, Switzerland, and the USA).
3.2. Synthesis of the Results
The review of the scientific articles showed that markers can be classified into two groups, based on the type of molecular marker used: (i) RAPD, SCoT, nuSSR, and cpSSR markers, for main studies of genetic diversity and population structure and (ii) ITS markers and cpDNA-derived markers used in phylogeny and evolutionary studies of the genus Manilkara. Therefore, we reviewed the studies separately according to the type of molecular approach used.
3.3. Utilization of Molecular Marker Systems
The key features of the studies included in this review are presented in Supplementary Table S2. Five studies used on RAPDs as the markers of choice [51,56,57,62,63]. One study applied SCoT markers [64]. Thirteen studies used SSR markers [44,45,47,48,49,50,53,54,55,58,59,60,61]. One study focused utilized cpSSR markers [46]. One study focused on sequencing cpDNA [65]. One study applied ITS nuclear markers and three more cpDNA-derived markers [52]. Only one study used ITS nuclear markers [66]. In Supplementary Table S2, for the purpose of updating the taxonomic nomenclature of the species under study, we have verified World Flora Online, which was updated in December 2024 [67], and Plants of the World Online [68].
The development of DNA markers may rely on coding or non-coding regions of genes, and depending on the technique used, prior sequence information may or may not be required [36,69]. Researchers continue to develop more reliable and accurate DNA markers, currently applying IRAP, REMAP, RBIP, IPBS, PARMS, CDDP, PBA, TBP, ISAP, S-SAP, ILPs, iSNAP, DALP, PAAP, TRAP, CoRAP, SCoT and DAMD, nuSSR, ISSR, cpSSR, ITS, SNP and DArT [34]. In addition, recent sequencing methods such as Skim sequencing and PacBio HiFi, among others, offer higher resolution for detecting genomic variation and complement marker-based approaches [70,71]. An optimal DNA marker should exhibit key attributes including high polymorphism, clear dominant or co-dominant inheritance, widespread occurrence, stability across environmental and developmental conditions, strong reproducibility, straightforward accessibility, and rapid, cost-effective analysis [72,73].
3.3.1. Random Amplification of Polymorphic DNA (RAPD)
RAPDs represent one of the first-generation DNA markers that were the result of amplifying random DNA regions across various loci using short, arbitrary primers. This markers allowed the detection of polymorphisms in the amplified fragments which are visualized by electrophoresis [36,74]. This technique is straightforward, rapid, and inexpensive, and demonstrated strong efficiency in assessing genetic variation in both wild and cultivated plant species [75]. Some constraints of RAPDs involved the dominant nature of these markers which limited the detection of genotype at individual-levels (because heterozygous and dominant homozygous cannot be differentiated) and it can increase sampling variance and bias in population-structure parameters, reducing the power to detect actual differentiation [76]. Other studies reported lack of reproducibility as RAPD banding patterns may be less reliable due to sensitivity to reaction conditions [34]. Subsequent individual genotyping using codominant or sequence-based markers would better resolve fine-scale structure and clarify potential genotype–phenotype associations. In addition, some studies using composite DNA samples from a given population (DNA bulking) seemed to affect individual resolution and dilute allele-frequency signals in pooled samples, constraining discrimination among germplasm sources [77].
Among the earliest molecular assessments in Manilkara, [51] used RAPD markers from bulked DNA samples to test whether the morphological differentiation observed between forest and swamp populations of M. zapota had a detectable genetic correlation. Across four populations, RAPD data indicated no significant genetic differentiation (χ² = 68.35; P > 0.1), suggesting potential genetic homogeneity at the loci surveyed in the populations and/or a failure of the markers to tag regions associated to local differentiation. In this study, the combination of RAPD and bulking offered rapid, low-cost-effective screening to answer questions about differentiation in populations from different geographic origin.
Building on early findings, [56] combined agro-morphological descriptors with RAPD markers to characterize diversity among 23 M. hexandra accessions from Gujarat and Madhya Pradesh. Fruits of this species have some importance in the region and understanding levels of diversity unlocked opportunities in breeding. The study generated 119 bands (78% polymorphic), with a pairwise similarity ranging from 0.52 to 0.82. The multivariate analysis showed and two main clusters, indicating appreciable diversity within the germplasm assessed. Given the study goal (germplasm screening), RAPD markers provided an informative overview of genetic differentiation.
Also, [57] used 25 RAPD primers to compare species M. hexandra with Averrhoa carambola, generating polymorphic profiles for both species, each one showing different marker profiles which were validated with UPGMA clustering based on a similarity matrix. The authors concluded here that RAPD markers can be more appropriate for identification/authentication and for similarity-based grouping rather than for inferring evolutionary phylogeny, because RAPD is a dominant marker system which prevent of additional inferences on species differentiation [78].
From a methodological standpoint, [62] addressed a practical bottleneck in the study of Manilkara genetics, the lack of DNA quality. At the time of the study, the current methods for DNA isolation could not separate contaminants in Manilkara zapota so that the DNA extracted showed low quality. This group worked on optimizing the CTAB-based DNA extraction from mature M. zapota leaves which were rich in polyphenols, polysaccharides and other secondary metabolites. Presence of those compounds are known to obstruct enzymatic events and negatively impact amplification of DNA. Their protocol named “Modification 5” (adapted from [79]) improved the recovery of DNA and made it suitable for downstream PCR, which is relevant for studies where tissue chemistry can compromise genotyping. Though this was a rather technical effort, the generation of a procedure that showed consistently yield DNA of good quality was important for the research groups doing DNA-based research in Manilkara.
Later, [63] assessed genetic diversity among 26 M. zapota accessions from five districts using RAPD markers. The goal of this project was to determine levels of spatial variation among the five districts assessed. The results showed that accessions tend to cluster by their location of origin. An attempt to test association between markers with fruit shape showed no correlation. This research reported high polymorphism (98.85% across 87 RAPD loci), with slightly more variation within populations (53%) than among populations (47%), and clusters that broadly reflected geographic origin; accessions collected in the Gunungkidul region showed comparatively higher diversity than the other locations, highlighting this as a good candidate area for conservation and selection.
In summary, studies conducted using RAPD markers in Manilkara provided preliminary insights on the levels of genetic variation for populations of Manilkara spp. Most of these studies revealed patterns of genetic variation to detect some genetic differentiation and structure in the populations evaluated. Some inferences were also presented about strategies of conservation and breeding. Some limitations in the studies can be attributed to sampling size and an underestimation of diversity due to the use of dominant markers. But, in the past, RAPD markers were one of the most important genetic markers and many studies relied on their use.
3.3.2. Start Codon-Targeted Polymorphism (SCoT)
SCoT markers target short, conserved regions surrounding the ATG start codon in plant genes [80]. Compared to arbitrary RAPD and ISSR markers, they offer higher reproducibility and efficiency in analyzing genetic diversity and population structure across various plant species [81]. Each SCoT primer consists of 18 nucleotides designed to anneal to the conserved sequence near the start codon, with detection performed through PCR amplification followed by visualization on ethidium bromide stained agarose gels [82]. However, because SCoT profiles are typically scored as dominant (presence/absence bands), a direct estimation of allele frequencies and heterozygosity (Ho/He) is not straightforward without additional assumptions or dedicated estimators [76].
Building upon the methodological advantages, [64] assessed patterns of genetic diversity among 36 accessions in four Manilkara species (Manilkara hexandra, Manilkara kauki, Manilkara littoralis, and Manilkara zapota) in Thailand using 30 SCoT primers. The assay generated 176 bands (57.38% polymorphic), and multivariate analysis allowed to separate these accessions into two main clusters, which were consistent with locality and the morphological features evaluated such as fruit characteristics. This study supported the use of SCoT markers as a effective tool for cultivated-germplasm characterization unlocking possibilities of using them for conservation and breeding. In particular, the author of this research emphasized the advantages of using SCoT markers for effective conservation of germplasm by reducing size of collections (core collections).
3.3.3. Simple Sequence Repeats (SSRs)
Simple Sequence Repeats (SSRs), or microsatellites, are DNA markers composed of short tandemly repeated motifs whose repeat numbers vary among loci [83]. These markers provide several advantages over other molecular systems. They are highly reproducible and do not require ultra-pure DNA templates, making them reliable for genetic analyses. Moreover, SSRs exhibit high polymorphism, enabling the detection of allelic differences even among closely related genotypes [72]. Their co-dominant inheritance facilitates straightforward result interpretation, and their abundance and widespread distribution across eukaryotic genomes further enhance their utility [84].
Simple sequence repeats (SSRs) are codominant and typically highly polymorphic markers that are well suited for estimating genetic diversity and related parameters such as gene flow, parentage, and population structure across species. In Manilkara, [44] developed and characterized 12 microsatellite loci for M. huberi from an enriched genomic library. The loci were highly variable (4-8 alleles per locus) with high expected heterozygosity (He = 0.721-0.862), supporting applications in diversity assessment and sustainable management. The initial characterization relied on a small sample (n = 12), so broader testing across populations and ecological settings would strengthen inference [85]. Expanding on this, [45] applied SSRs to evaluate genetic structure, gene flow, and the mating system of M. huberi. They reported high genetic diversity (He > 0.82), a predominance of allogamy (tm = 0.995), inbreeding (f = 0.175–0.240), and restricted pollen flow (47 m), and recommended collecting seed from at least 175 trees and conserving large continuous areas to maintain variability. Because the study used seven SSR loci, fine-scale estimates would benefit from additional markers and complementary field validation where feasible. From a modeling perspective, [47] modeled how selective logging could affect the genetic diversity and population composition of M. huberi and other Amazonian tree species, using genotype data at microsatellite loci for the simulations. They concluded that current practices are not sustainable for M. huberi, predicting drastic reductions in basal area and loss of alleles under short cycles and low minimum cutting diameters. They therefore recommended species-specific management prescriptions. As a simulation-based study, conclusions depend on assumptions about starting population conditions and disturbance history, so results are best interpreted alongside empirical monitoring.
In a related approach, [60] tested the transferability of M. huberi microsatellites to characterize genetic variation in M. zapota. They detected many alleles but low heterozygosity, highlighting potential genetic erosion and the need to expand sampling for conservation. Only 7 of the 12 loci were useful in M. zapota and null alleles may have influenced estimates; their dendrogram should therefore be viewed as similarity-based clustering rather than a phylogenetic framework.
Complementarily, [48] developed eight polymorphic microsatellites for M. multifida, reporting high allelic diversity and heterozygosity without evidence of null alleles, which supports conservation and genetic management applications. Sampling was restricted to two locations; therefore, broader geographic sampling is advisable before generalizing population-level patterns, as sampling design and geographic coverage strongly influence how well genetic diversity is represented in conservation-oriented inferences [86].
Similarly, by using of microsatellites, [54] assessed genetic variation and structure across five M. zapota populations located in ancient Maya ceremonial centers, home gardens, and clonal cultivars to test whether cultivation reduced diversity. They found substantial variation and low differentiation, with no evidence of reduced diversity associated with management, consistent with strong natural gene flow in dense forests. Comparisons are limited by the absence of fully unmanaged wild populations and potential imbalance among management categories.
Following this, [53] evaluated spatial genetic structure in M. maxima to test whether recent fragmentation reduced genetic variability. They found that fragmentation had not markedly reduced diversity and that gene flow/connectivity among populations remained high. The analysis was based on five SSR loci and low population density in fragmented sites, which can limit resolution for subtle structure. To broaden the range of available markers, [49] developed 17 species-specific SSR markers for M. maxima and analyzed genetic diversity across three natural populations. The loci showed high variability and strong discriminatory capacity, with no indication of substantial null alleles, supporting their use in population genetics and ecological research. The survey covered three sites and did not explicitly evaluate among-population differentiation, so expanded spatial coverage would strengthen inference [87].
In a landscape-level study, [61] used SSRs to analyze genetic diversity and population structure of M. zapota in 15 forest fragments and one continuous forest to evaluate long-term fragmentation. They reported high diversity and low differentiation, with little effect of fragment size or isolation. The analysis relied on three SSR loci and an unreplicated continuous-forest reference, limiting detection of fine-scale structure [88,89]. From a technological standpoint, [55] generated a nuclear SSR resource for M. zapota to support germplasm conservation and population genetics, obtaining 3,870 primer pairs and evaluating 384 loci to identify 47 high-quality polymorphic SSRs. This substantially expands tools for fingerprinting and diversity screening. Sampling per group was small (4-10 accessions) and excluded natural populations, and loci were not coupled to population-structure or trait-based analyses, so downstream validation across wild and managed materials remains important.
Subsequently, [90] compared adults and juveniles of M. multifida in two protected fragments to evaluate intergenerational impacts of fragmentation. They found a marked reduction in heterozygosity and greater genetic structure in juveniles, consistent with reduced gene flow under habitat loss. The study used eight SSR loci and two sites (the Veracel Station (EVC) and the Una Biological Reserve (UBR), and paternity-based inferences may be sensitive to incomplete sampling of reproductive adults.
More recently, [58] developed 30 highly polymorphic SSR markers for M. zapota and analyzed 53 genotypes. They detected high genetic diversity and differentiation, identifying three main groups with strong admixture, providing useful tools for conservation and genetic improvement. Interpretation is bounded by the ex-situ focus and limited phenotypic or environmental data to explain genetic patterns, and technical replication was not clearly specified.
Finally, [59] analyzed 10 genotypes of M. achras (currently M. zapota (L.) P. Royen, according to [68]) using 20 SSRs. They detected 59 alleles and moderate-to-high genetic diversity, with grouping by geographical origin and alleles useful for genetic fingerprinting, supporting varietal identification and breeding. The relatively small sample size may yield imprecise or biased estimates and thus limits broader population-level inference [85]. In addition, the absence of standard diversity and structure metrics further constrains comparability across studies.
3.3.4. Chloroplast Simple Sequence Repeat (cpSSRs) Microsatellites
Microsatellites, also known as SSRs, are dispersed randomly throughout both nuclear and chloroplast genomes in plants. Compared to nuclear genomes, chloroplast genomes tend to have a lower mutation rate, which makes it more challenging to detect significant sequence variation within them [34]. In contrast, cpSSR usually exhibit lower levels of polymorphism than nuSSRs due to the conserved nature of chloroplast genomes. However, they remain valuable for tracing maternal inheritance, seed dispersal, and phylogeographic patterns in plants [91,92]. The non-coding regions of cpDNA - primarily introns and intergenic spacers - evolve at a slow rate and tend to be highly conserved within species. Despite this, they are particularly useful for phylogenetic and phylogeographic research, as they provide insight into maternal inheritance patterns and evolutionary connections among populations or species [93]. Interest in these regions stems from the generally slow evolutionary rate of cpDNA, which limits its variability for population and evolutionary analyses. Moreover, non-coding regions often consist of repetitive DNA sequences arranged in tandem, such as microsatellites [94]. Although cpDNA exhibits low allelic diversity, it remains a valuable tool for reconstructing phylogenetic relationships among closely related taxa and exploring maternal genetic structure [91,92,95]. Overall, cpDNA has proven to be an informative marker system, enabling the generation of robust data for elucidating phylogenetic relationships both within and between species [91,92].
Building on this principle, [46] used cpSSRs together with cpDNA sequences to test for matrilineal spatial genetic structure in M. huberi, that is, patterns expected under limited seed-mediated dispersal. They detected significant spatial structure up to 250 m and identified 15 chloroplast haplotypes, indicating high chloroplast diversity despite modest haplotype richness. The authors interpreted these patterns as consistent with isolation by distance and argued for conserving large, contiguous tracts of primary forest to maintain locally structured maternal lineages. Because the study focused on a single population and only four of nine cpSSR loci were polymorphic, the inferred scale of structure should be viewed as population-specific. Chloroplast inheritance was treated as strictly maternal, although occasional nonmaternal (including paternal) chloroplast inheritance has been reported in some angiosperms [96].
In a complementary approach, [65] assembled and annotated the complete chloroplast genome (159,853 bp; 125 genes) of M. zapota to clarify its phylogenetic placement within Sapotaceae. The plastome provides a genomic resource for comparative studies and, in their cpDNA-based tree, Manilkara clustered with other Ericales lineages, appearing close to Ebenaceae representatives included in the analysis. However, the inference relied on a single accession and plastid-only data, which limits the ability to evaluate intraspecific variation and to detect reticulate processes; plastid and nuclear datasets may also be incongruent due to factors such as hybridization and shared ancestral polymorphism [97]. In addition, the use of neighbor-joining with limited taxon sampling (13 species) constrains phylogenetic resolution; broader sampling and likelihood/Bayesian frameworks, ideally combined with nuclear markers, would strengthen inference.
3.3.5. Internal Transcribed Spacer (ITS)
When it comes to identifying species accurately, ITS markers are essential tools in DNA barcoding. These markers work by targeting the spacer DNA found within the repetitive sequences of ribosomal RNA genes [98]. What makes the ITS region of nuclear ribosomal DNA particularly useful is its interesting dual nature: it shows considerable variation between different species, yet remains relatively stable within any given species. This unique characteristic is precisely why researchers favor these genetic markers when they need to distinguish species from one another [99].
In terms of phylogeny, the genus Manilkara was reconstructed using nuclear and plastid sequences to infer its origin and dispersal. It was determined that, using a relaxed molecular clock calibrated with fossils, Manilkara evolved between 32 and 29 million years ago (Mya) in Africa. This was followed by two dispersal events, to tropical America (26-18 Mya) and tropical Asia (28-15 Mya). Higher rates of diversification were identified in the Neotropical clade, confirming that the pantropical distribution is due to long-distance dispersal events, not continental fragmentation [52].
The Maximum Clade Credibility (MCC) tree obtained from the BEAST analysis (Figure 4) indicates that the subtribe Manilkarinae has an average estimated age of about 32 million years, with a Highest Posterior Density (HPD) interval ranging from 36 to 29 Mya (node K). The genus Manilkara dates to approximately 29 million years ago (HPD 32–28 Mya; node Q), suggesting that both lineages originated during the Oligocene period. Moreover, the findings show that speciation and intercontinental dispersal events within Manilkara took place from the Oligocene through the Miocene, becoming particularly pronounced from the middle to late Miocene.
The maximum clade credibility chronogram derived from the ITS dataset depicts the temporal diversification and continental distribution of Manilkara within the tribe Mimusopeae (Sapotaceae). The genus originated in Africa during the Oligocene (29 Mya) and subsequently dispersed to other tropical regions through long-distance colonization events.
Four principal regional lineages of Manilkara are resolved: (i) African clades (X, V): represent the basal and most ancestral groups, showing diversification from the Oligocene to the Miocene, including both rainforest and dry-adapted taxa; (ii) neotropical clade (S): derived from an African ancestor between 26 and 18 Mya, and later differentiated into South American (U2) and Central American-Caribbean (T) subclades during the Miocene (16-10 Mya); (iii) Asian clade (Y): originated from a single African dispersal between 27 and 19 Mya, with limited subsequent radiation across the Sahul and Sunda shelves and (iv) Madagascar lineages (X3-X4): represent at least two independent colonization events from Africa between 8 and 4 Mya.
Branch colors correspond to continental regions - Africa (yellow), Madagascar (green), Asia (blue), South America (pink), and Central America & Caribbean (orange). The bars at each node represent the 95% Highest Posterior Density (HPD) intervals, which show the estimated range of divergence times. Pie charts represent ancestral-area probabilities at key nodes, and the inset map summarizes the timing and direction of intercontinental dispersal inferred from the chronogram.
Expanding on these phylogenetic efforts, [66] determined the genetic variability and phylogenetic structure of several Amazonian species of Manilkara using ITS and cpDNA sequences. It found relatively limited haplotype diversity and marked genetic differentiation between species and populations. The authors conclude that Manilkara, as currently defined, is not monophyletic, and they recommend a taxonomic revision. Floral evolution provides useful synapomorphies for redefining genera. The effectiveness of phylogenomic in resolving complex relationships in groups with morphological convergence is highlighted.
The phylogenetic analysis of Manilkarinae reveals a clearly defined structure composed of two principal clades (Figure 5). The first clade (PP = 0.99) groups Labramia and Manilkara s.str. as sister lineages, while the second clade (PP = 1.00) includes the three Pacific Manilkara species, which form a distinct lineage, as also reported by [52], sister to the clade that encompasses all Labourdonnaisia and Faucherea species.
The species tree generated with ASTRAL-II, using data from 89 specimens and 787 gene trees reconstructed with RAxML, elucidates the phylogenetic relationships among species of Manilkara and related genera within the tribe Mimusopeae (Sapotaceae). The topology supports four major, well-defined genetic clades that partly correspond to the traditional taxonomic classification.
Within Manilkara, the core lineage (Manilkara s.str.) (orange) forms a strongly supported monophyletic group closely related to the Labourdonnaisia-Faucherea clade (pink), both representing the main diversification centers of the genus across Africa, Madagascar, and the Neotropics. The Labramia clade (dark green) appears as a basal lineage within Mimusopeae, mostly restricted to Madagascar and the Mascarene Islands, confirming its early divergence from Manilkara s.str. In contrast, the Abebaia clade (blue) is recovered as a distinct evolutionary lineage, clearly separated from Manilkara, with affinities to the African - Asian complex.
ASTRAL support values are shown for internal nodes. Because ASTRAL estimates only internal branch lengths, terminal branches are represented with equal length for all taxa. Branch colors correspond to generic circumscription: Labramia (dark green), Manilkara s.str. (orange), Labourdonnaisia + Faucherea (pink), and Abebaia (blue). Regional abbreviations: Afr - Africa; Mad - Madagascar; Msc - Mascarenes; Com - Comoros; Ind - Indonesia; Pac - Pacific Asia; Ame - Americas; RN - Réserves Naturelles; SF - Service Forestier.
4. Discussion
Using an exploratory synthesis, we integrated genetic and phylogenetic evidence for Manilkara from 23 peer-reviewed studies published between 1999 and 2025. Grouping studies by marker system and geographic scope revealed substantial progress in characterizing genetic diversity, population structure, and lineage relationships, but also exposed persistent geographic, methodological, and taxonomic gaps that currently limit conservation inference. In particular, research effort is concentrated in the Americas and Asia, whereas African lineages (despite Africa being inferred as the center of origin for Manilkara) remain markedly underrepresented [52]. This imbalance is consistent with broader constraints in Sapotaceae systematics, including cryptic diversity, morphological complexity, limited high-quality herbarium material, and a shortage of recent integrative taxonomic work [2].
Verification of Manilkara presence records in Global Biodiversity Information Facility [17] revealed a highly uneven spatial distribution of sampling effort and data mobilization, rather than a faithful representation of the genus’s true distribution. This verification produced a dataset of 39,701 records (See Supplementary Figure S2). Accordingly, GBIF occurrence records for Manilkara reflect a biased pattern of data availability, which increases uncertainty when assessing population status, genetic representativeness, and climate-change vulnerability in poorly documented regions. From a conservation perspective, priorities include: (i) targeted surveys and sampling in underrepresented areas where Manilkara is expected to occur; (ii) strengthening inventories and collections with reliable georeferencing and metadata, and (iii) designing genomic sampling campaigns that maximize spatial and environmental coverage, avoiding inference of “absences” from data gaps.
Across species, comparisons between phenotypic differentiation and genetic structure suggest that morphology does not always track neutral genetic variation. Forest versus swamp populations of M. zapota show pronounced phenotypic differences, yet RAPD and SSR data indicate low to moderate genetic differentiation [51,60,61], implying that environmentally induced plasticity may contribute strongly to observed morphological divergence. By contrast, M. huberi shows high heterozygosity and maintained reproductive performance under selective logging, consistent with demographic stability and sustained gene flow buffering genetic erosion [45,47]. Intermediate diversity has been reported for Atlantic Forest endemics (e.g., M. multifida and M. maxima), where restricted dispersal and fragmentation can constrain connectivity, particularly if pollen-mediated gene flow is reduced. For several Asian taxa (e.g., M. hexandra and M. littoralis), the evidence base remains comparatively weak because studies have relied largely on dominant PCR-based markers with limited allelic resolution. Collectively, these patterns motivate integrative designs that combine genome-wide data with standardized morphometrics and eco-physiological measurements to distinguish adaptive divergence from plastic responses across Manilkara.
Taxonomic coverage is itself a major limitation. The literature is dominated by a small subset of commercially important or accessible species (notably M. huberi, M. zapota, and M. multifida), whereas many wild or poorly known taxa remain genetically uncharacterized [2,100,101]. This restricts phylogenetic completeness and undermines the identification of evolutionarily significant units (ESUs) that could guide conservation prioritization [102]. Addressing this gap requires deliberate sampling strategies that target underrepresented regions and lineages (especially African taxa) and that link vouchers, geo-referenced metadata, and open sequence resources to reduce downstream uncertainty.
Methodological heterogeneity further limits comparability across studies. Variation in DNA extraction protocols, locus choice, marker system, diversity metrics, and sampling design impedes cross-study synthesis and can bias conclusions about diversity, structure, and connectivity. The predominance of neutral markers (e.g., SSR, RAPD) has been valuable for first-pass characterization but is limited for testing hypotheses about selection, functional variation, and climate-related adaptation [32,100,103,104].
A cross-cutting limitation is the weak integration of genetic evidence with ecological and landscape information, which restricts inference about how environmental gradients, fragmentation, and land-use history shape genetic variability [105,106,107]. Only a small subset of studies explicitly incorporates fragmentation context, mating systems, or pollen and seed dispersal processes, despite their centrality for interpreting diversity and connectivity in tree populations. In M. zapota, for example, SSR-based studies illustrate how conclusions regarding fragmentation effects or potential domestication signals can shift with sampling design and marker resolution [54,61], consistent with general expectations about fragmentation-driven genetic responses in plants [108].
In the context of accelerating climate change and biodiversity loss [104,109], future research should prioritize coordinated, question-driven sampling that quantifies intraspecific diversity and phenotypic plasticity across environmental gradients, while expanding geographic and taxonomic coverage. Combining nuclear and plastid evidence (e.g., ITS, cpDNA, and additional nuclear loci) with ecological and morphological datasets should improve phylogenetic resolution and clarify evolutionary relationships. Establishing systematic collections, seed banks, and germplasm repositories spanning Neotropical, African, and Asian regions will provide the baseline required for comparative and conservation genomics and for subsequent breeding-oriented applications [106,110,111,112].
Recent phylogenetic work underscores that taxonomic instability in Manilkara is closely tied to morphological homogeneity, the scarcity of diagnostic characters, and long-standing controversies in species delimitation [66]. Across Manilkarinae, revisions of generic boundaries and the adoption of phylogenomic datasets have become increasingly necessary because trees inferred from few loci often lack resolution and may not capture complex evolutionary histories [66,113,114]. Although ITS-based analyses (especially when interpreted alongside plastid and additional nuclear loci) have improved biogeographic and phylogenetic inference, restricted taxon sampling and continued reliance on single or few loci still constrain robust evolutionary interpretation, particularly when morphological evidence is not explicitly integrated [2,66].
5. Future Directions
In Manilkara, evidence has been dominated by marker-based studies, while the adoption of genomic approaches is relatively recent. However, in trees and plants, genomic and multi-omic approaches allow genomic variation to be linked to stress response mechanisms and traits associated with biological fitness [61,104,109,115]. Integrative frameworks that combine genomic datasets with transcriptomic, epigenomic, or metabolomic layers can accelerate the identification of putatively functional variants and improve inference in non-model tropical tree genomes [104,116]. Moreover, if reticulate processes such as hybridization or introgression contribute to gene-tree discordance, low-locus approaches can be misleading, reinforcing the need for multilocus and genome-scale strategies [117,118]. Future work that couples phylogenomic inference with explicit tests of discordance will be essential to resolve intrageneric relationships and clarify the roles of speciation and adaptation in this tropical lineage [119,120,121].
Reduced-representation and target-capture genotyping (GBS/GBTS) can support population-scale inference in non-model trees, once taxonomy, vouchered collections, and geographically balanced sampling are secured [104]. Genomic selection and genomic prediction are increasingly operational in forest trees, but their gains depend on training-population design, cost–benefit planning, and multi-site validation—not “plug and play” deployment [122,123].
CRISPR/Cas has strong proof-of-concept in woody species, yet for largely wild Manilkara it is best framed short-term as functional validation, given regeneration bottlenecks and lengthy field testing [124,125]. Therefore, near-term priorities are foundational: reference resources, standardized marker panels, harmonized phenotyping, and ethical/benefit-sharing safeguards that enable reproducible, scalable datasets for downstream modeling [126]. AI-assisted phenotyping can be realistic via UAV/ground imagery, but only when models are trained on quality-controlled data and externally validated across environments and seasons [127].
Multi-omics and microbiome studies can clarify stress mechanisms, yet their immediate value depends on replication, experimental controls, and hypothesis-driven designs rather than broad exploratory profiling [104,116].
In light of new trends, where the deployment of genetically improved material is contemplated, decisions should be evaluated within ecological and socioeconomic frameworks, including regulation and public acceptance of genetically modified or genome-edited trees [109,128,129]. Risk assessments should explicitly consider gene escape and containment feasibility [130], alongside context-dependent benefits for restoration, carbon sequestration, and sustainable agroforestry [131]. As genotyping costs continue to fall, integrating genome-wide marker systems (e.g., GBS, skim sequencing, and long-read approaches) with predictive breeding and multi-omics will be increasingly important for next-generation forest tree improvement. But only when clear research questions, appropriate sampling designs, and reproducible data standards with open repositories are in place [123,132,133,134,135].
6. Conclusions
This review of 23 peer-reviewed studies (1999–2025) shows that molecular research in Manilkara has advanced from early PCR-based markers to microsatellites and, more recently, plastome and nuclear sequencing, but evidence is still insufficient to fully characterize genetic representativeness and evolutionary relationships across the genus.
Research remains strongly biased toward a few economically important and accessible species, leaving most Manilkara taxa genetically unassessed and limiting the delineation of conservation-relevant units, particularly in underrepresented African lineages.
Cross-study synthesis is constrained by methodological heterogeneity (sampling design, marker choice, and inconsistent reporting of quality control and core statistics), which reduces comparability and helps explain divergent diversity estimates for the same species.
Future work should prioritize broader, well-documented sampling (voucher specimens, coordinates, metadata), standardized reporting, and combined nuclear–plastid evidence to improve inference on lineage history, connectivity, and population structure.
Where feasible, genome-wide SNP datasets and targeted sequencing, supported by automated pipelines and machine-learning tools for quality control and genotype–environment analyses, should complement legacy markers to strengthen demographic and conservation inference.
Integrating genomics with ecological and landscape data, enhanced by remote sensing and AI-based spatial modeling, will improve the identification of conservation units and support effective restoration, long-term persistence, and sustainable use of Manilkara.
Supplementary Materials
The following supporting information can be downloaded at the website of this paper posted on Preprints.org, Figure S1: Time trend in the use of molecular markers in studies on species of the genus Manilkara (1999-2025); Figure S2: Heat map showing the frequency of location records for species of the genus Manilkara by country; Table S1: Number of studies published by journal, quartile and publisher; Table S2: Summary of the 23 studies analyzed with respect to the molecular characterization of the genus Manilkara; Table S3: List of Manilkara species included in phylogenetic analyses, with origin and continental distribution; Table S4: Taxa of the genus Manilkara evaluated in phylogenetic reconstruction and their biogeographic provenance.
Author Contributions
Einstein Bravo: Conceptualization, Data curation, Investigation, Writing – original draft, Writing – review & editing. Alfonso H. del Río: Data curation, Investigation, Writing – review & editing. Héctor V. Vásquez: Validation, Resources, Visualization, Writing – review & editing. Einstein Sánchez: Data curation, Validation, Visualization, Writing – review & editing. Omer Cruz: Data curation, Formal analysis, Validation, Resources, Visualization, Writing – review & editing. Eli Pariente: Visualization, Writing – review & editing. Rosalynn Rivera: Conceptualization, Validation, Visualization, Writing – review & editing. Carlos I. Arbizu: Conceptualization, Visualization, Writing – review & editing.
Funding
This research was funded by the National Council for Science, Technology and Technological Innovation (CONCYTEC) and the National Program for Scientific Research and Advanced Studies (PROCIENCIA), under call E077-2023-01-BM “Scholarships for Doctoral Programs in Interinstitutional Alliances”, grant PE501093163-2024, and under call E033-2023-01-BM “Interinstitutional Alliances for Doctoral Programs”, grant PE501084305-2023.
Data Availability Statement
The original data presented in the study are openly available in: Scopus (https://www.scopus.com).
Acknowledgments
The authors would like to thank the Doctoral Program in Sciences for Sustainable Development of the Universidad Nacional Toribio Rodríguez de Mendoza de Amazonas. Also, we thank the Consejo Nacional de Ciencia, Tecnología e Innovación Tecnológica (CONCYTEC) and the Programa Nacional de Investigación Científica y Estudios Avanzados (PROCIENCIA), within the framework of the Call E033-2023-01-BM “Interinstitutional Alliances for Doctoral Programs,” under grant number (PE501084305-2023).
Conflicts of Interest
The authors declare no conflicts of interest.
Abbreviations
The following abbreviations are used in this manuscript:
| AI | Artificial Intelligence |
| ASTRAL-II | Accurate Species TRee ALgorithm, version II |
| BEAST | Bayesian Evolutionary Analysis Sampling Trees |
| bp | base pairs |
| cpDNA | chloroplast DNA |
| cpSSR | chloroplast Simple Sequence Repeats |
| CRISPR/Cas | Clustered Regularly Interspaced Short Palindromic Repeats / CRISPR-associated (Cas) |
| CTAB | cetyltrimethylammonium bromide |
| DArT | Diversity Arrays Technology |
| DNA | deoxyribonucleic acid |
| ESU | Evolutionarily Significant Unit(s) |
| GBIF | Global Biodiversity Information Facility |
| GBS | Genotyping-by-Sequencing |
| GBTS | Genotyping-by-Target Sequencing |
| He | expected heterozygosity |
| HiFi | High-Fidelity (long-read sequencing) |
| Ho | observed heterozygosity |
| HPD | Highest Posterior Density |
| iPBS | inter-Primer Binding Site |
| IRAP | Inter-Retrotransposon Amplified Polymorphism |
| ISSR | Inter-Simple Sequence Repeat |
| ITS | Internal Transcribed Spacer |
| MCC | Maximum Clade Credibility |
| Mya | Million years ago |
| NGS | Next-Generation Sequencing |
| nuSSR | nuclear Simple Sequence Repeats |
| PARMS | Penta-primer Amplification Refractory Mutation System |
| PCR | Polymerase Chain Reaction |
| PRISMA | Preferred Reporting Items for Systematic Reviews and Meta-Analyses |
| RAPD | Random Amplified Polymorphic DNA |
| RAxML | Randomized Axelerated Maximum Likelihood |
| RBIP | Retrotransposon-Based Insertion Polymorphism |
| REMAP | Retrotransposon-Microsatellite Amplified Polymorphism |
| SCoT | Start Codon-Targeted (polymorphism) |
| SNP | Single Nucleotide Polymorphism |
| SSR | Simple Sequence Repeats |
| UAV | Unmanned Aerial Vehicle |
| UPGMA | Unweighted Pair Group Method with Arithmetic Mean |
| WoS | Web of Science |
References
- Gautier, L. Sapotáceas. En: Goodman, JP, Bensted, SM (Ed.). La Historia Natural de Madagascar; The University of Chicago Press: Chicago., 2003. [Google Scholar]
- Christe, C.; Boluda, C.G.; Koubínová, D.; Gautier, L.; Naciri, Y. New Genetic Markers for Sapotaceae Phylogenomics: More than 600 Nuclear Genes Applicable from Family to Population Levels. Molecular Phylogenetics and Evolution 2021, 160, 107123. [Google Scholar] [CrossRef] [PubMed]
- De Faria, A.D.; Pirani, J.R.; Ribeiro, J.E.L.D.S.; Nylinder, S.; Terra-Araujo, M.H.; Vieira, P.P.; Swenson, U. Towards a Natural Classification of Sapotaceae Subfamily Chrysophylloideae in the Neotropics. Botanical Journal of the Linnean Society 2017, 185, 27–55. [Google Scholar] [CrossRef]
- Swenson, U.; Anderberg, A.A. Phylogeny, Character Evolution, and Classification of Sapotaceae (Ericales). Cladistics 2005, 21, 101–130. [Google Scholar] [CrossRef]
- Kümpers, B.M.C.; Richardson, J.E.; Anderberg, A.A.; Wilkie, P.; Ronse De Craene, L.P. The Significance of Meristic Changes in the Flowers of Sapotaceae. Botanical Journal of the Linnean Society 2016, 180, 161–192. [Google Scholar] [CrossRef]
- Pennington, T.D. The Genera of Sapotaceae; New York Botanical Garden e Kew.: United Kingdom, 1991; ISBN 0-947643-34-6. [Google Scholar]
- Govaerts, R.; Frodin, D.G.; Pennington, T.D. World Checklist and Bibliography of Sapotaceae; Royal Botanic Gardens, 2001; ISBN 978-1-900347-94-5. [Google Scholar]
- Pennington, T. Flora Da Reserva Ducke, Amazonas, Brasil: Sapotaceae; Rodriguésia., 2006; Vol. 57. [Google Scholar]
- Pennington, T. Flora of Ecuador 80. 152. Sapotaceae; Department of Plant and Environmental Sciences, Göteborg University.: Gothenburg, 2007. [Google Scholar]
- Gautier, L.; Lachenaud, O.; van der Burgt, X.; Kenfack, D. Five New Species of Englerophytum K. Krause (Sapotaceae) from Central Africa; Candollea., 2016; Vol. 71. [Google Scholar]
- Swenson, U.; Munzinger, J.; Bartish, I. Molecular Phylogeny of Planchonella (Sapotaceae) and Eight New Species from New Caledonia; Taxon., 2007; Vol. 56. [Google Scholar]
- Munzinger, J.; Swenson, U. Three New Species of Planchonella Pierre (Sapotaceae) with a Dichotomous and Online Key to the Genus in New Caledonia. Adansonia, séries 3; 2009; Vol. 31. [Google Scholar]
- Swenson, U.; Munzinger, J. Revision of Pichonia (Sapotaceae) in New Caledonia; Australian Systematic Botany . 2012; Vol. 25. [Google Scholar]
- Swenson, U.; Munzinger, J. Five New Species and a Systematic Synopsis of Pycnandra (Sapotaceae), the Largest Endemic Genus in New Caledonia; Australian Systematic Botany.; 2016; Vol. 29;.
- Swenson, U.; Lowry, P.P., II; Cronholm, B.; Nylinder, S. Resolving the Relationships of the Enigmatic Sapotaceae Genera Beauvisagea and Boerlagella, and the Position of Planchonella Suboppositifolia. TAXON 2020, 69, 998–1015. [Google Scholar] [CrossRef]
- Gentry, A.H. A Field Guide to the Families and Genera of Woody Plants of Northeast South America; Conservation International.: Washington, D.C., 1993. [Google Scholar]
- GBIF.org Global Biodiversity Information Facility. Available online. (accessed on 24 February 2026). [CrossRef]
- Pennington, T.D. Sapotaceae . In Nuevo Catálogo de La Flora Vascular de Venezuela (Hokche, 0., P. Berry & O. Huber, Eds.); Dr. Tobías Lasser; Fundación Instituto Botánico de Venezuela: Caracas, 2008. [Google Scholar]
- Pennington, T.D. Flora Neotropica Monograph 52 Sapotaceae; New York Botanical Garden for the Organization for Flora Neotropica: New York, USA, 1990; ISBN 978-0-89327-344-6. [Google Scholar]
- Dirzo, R.; Raven, P.H. Global State of Biodiversity and Loss. Annual Review of Environment and Resources 2003, 28, 137–167. [Google Scholar] [CrossRef]
- Phillips, H.R.P.; Newbold, T.; Purvis, A. Land-Use Effects on Local Biodiversity in Tropical Forests Vary between Continents. Biodivers Conserv 2017, 26, 2251–2270. [Google Scholar] [CrossRef]
- Laurance, W.F.; Sayer, J.; Cassman, K.G. Agricultural Expansion and Its Impacts on Tropical Nature. Trends in Ecology & Evolution 2014, 29, 107–116. [Google Scholar] [CrossRef] [PubMed]
- Betts, M.G.; Wolf, C.; Pfeifer, M.; Banks-Leite, C.; Arroyo-Rodríguez, V.; Ribeiro, D.B.; Barlow, J.; Eigenbrod, F.; Faria, D.; Fletcher, R.J.; et al. Extinction Filters Mediate the Global Effects of Habitat Fragmentation on Animals. Science 2019, 366, 1236–1239. [Google Scholar] [CrossRef] [PubMed]
- Pither, R.; Shore, J.S.; Kellman, M. Genetic Diversity of the Tropical Tree Terminalia Amazonia (Combretaceae) in Naturally Fragmented Populations. Heredity 2003, 91, 307–313. [Google Scholar] [CrossRef]
- Choi, Y.; Ha, Y.-H.; Choi, J. Genetic Diversity Assessment of a Plant for Forest Restoration on the Korean Peninsula: A Case Study of Lespedeza Cuneata G. Don (Fabaceae). Journal of Asia-Pacific Biodiversity 2024, 17, 35–42. [Google Scholar] [CrossRef]
- Taylor, P.D.; Fahrig, L.; Henein, K.; Merriam, G. Connectivity Is a Vital Element of Landscape Structure. Oikos 1993, 68, 571–573. [Google Scholar] [CrossRef]
- White, G.M.; Boshier, D.H.; Powell, W. Increased Pollen Flow Counteracts Fragmentation in a Tropical Dry Forest: An Example from Swietenia Humilis Zuccarini. Proceedings of the National Academy of Sciences 2002, 99, 2038–2042. [Google Scholar] [CrossRef]
- Young, A.; Boyle, T.; Brown, T. The Population Genetic Consequences of Habitat Fragmentation for Plants. Trends in Ecology & Evolution 1996, 11, 413–418. [Google Scholar] [CrossRef] [PubMed]
- Carvalho, C. da S.; Ballesteros-Mejia, L.; Ribeiro, M.C.; Côrtes, M.C.; Santos, A.S.; Collevatti, R.G. Climatic Stability and Contemporary Human Impacts Affect the Genetic Diversity and Conservation Status of a Tropical Palm in the Atlantic Forest of Brazil. Conserv Genet 2017, 18, 467–478. [Google Scholar] [CrossRef]
- Hollingsworth, P.M.; Graham, S.W.; Little, D.P. Choosing and Using a Plant DNA Barcode. PLOS ONE 2011, 6, e19254. [Google Scholar] [CrossRef] [PubMed]
- Avise, J.C. Molecular Markers, Natural History and Evolution; Springer Science & Business Media, 2012; ISBN 978-1-4615-2381-9. [Google Scholar]
- Kremer, A.; Ronce, O.; Robledo-Arnuncio, J.J.; Guillaume, F.; Bohrer, G.; Nathan, R.; Bridle, J.R.; Gomulkiewicz, R.; Klein, E.K.; Ritland, K.; et al. Long-Distance Gene Flow and Adaptation of Forest Trees to Rapid Climate Change. Ecology Letters 2012, 15, 378–392. [Google Scholar] [CrossRef]
- Nilkanta, H.; Amom, T.; Tikendra, L.; Rahaman, H.; Nongdam, P. ISSR Marker Based Population Genetic Study of Melocanna Baccifera (Roxb.) Kurz: A Commercially Important Bamboo of Manipur, North-East India. Scientifica 2017, 2017, 3757238. [Google Scholar] [CrossRef] [PubMed]
- Amiteye, S. Basic Concepts and Methodologies of DNA Marker Systems in Plant Molecular Breeding. Heliyon 2021, 7. [Google Scholar] [CrossRef]
- Amom, T.; Tikendra, L.; Rahaman, H.; Potshangbam, A.; Nongdam, P. Evaluation of Genetic Relationship between 15 Bamboo Species of North-East India Based on ISSR Marker Analysis. Mol Biol Res Commun 2018, 7, 7–15. [Google Scholar] [CrossRef]
- Bidyananda, N.; Jamir, I.; Nowakowska, K.; Varte, V.; Vendrame, W.A.; Devi, R.S.; Nongdam, P. Plant Genetic Diversity Studies: Insights from DNA Marker Analyses. International Journal of Plant Biology 2024, 15, 607–640. [Google Scholar] [CrossRef]
- Burnham, J.F. Scopus Database: A Review. Biomedical Digital Libraries 2006, 3, 1. [Google Scholar] [CrossRef]
- Scott, D.J.; Broyd, T.; Ma, L. Exploratory Literature Review of Blockchain in the Construction Industry. Automation in Construction 2021, 132, 103914. [Google Scholar] [CrossRef]
- Chadegani, A.A.; Salehi, H.; Yunus, M.M.; Farhadi, H.; Fooladi, M.; Farhadi, M.; Ebrahim, N.A. A Comparison between Two Main Academic Literature Collections: Web of Science and Scopus Databases. Asian Social Science 2013, 9, p18. [Google Scholar] [CrossRef]
- Haddaway, N.R.; Page, M.J.; Pritchard, C.C.; McGuinness, L.A. PRISMA2020: An R Package and Shiny App for Producing PRISMA 2020-Compliant Flow Diagrams, with Interactivity for Optimised Digital Transparency and Open Synthesis. Campbell Systematic Reviews 2022, 18, e1230. [Google Scholar] [CrossRef] [PubMed]
- Sosa, C.C.; Arenas, C.; García-Merchán, V.H. Human Population Density Influences Genetic Diversity of Two Rattus Species Worldwide: A Macrogenetic Approach. Genes 2023, 14, 1442. [Google Scholar] [CrossRef]
- Sembada, A.A.; Faizal, A.; Sulistyawati, E. Photosynthesis Efficiency as Key Factor in Decision-Making for Forest Design and Redesign: A Systematic Literature Review. Ecological Frontiers 2024, 44, 1128–1139. [Google Scholar] [CrossRef]
- Kassaye, M.; Emiru, E.; Derebe, Y.; Tsega, A. Carbon Stock Dynamics in Ethiopian Forests; a Systematic Review for Sustainable Forest Management towards Climate Change Mitigation. Trees, Forests and People 2025, 20, 100841. [Google Scholar] [CrossRef]
- Azevedo, V.C.R.; Vinson, C.C.; Ciampi, A.Y. Twelve Microsatellite Loci in Manilkara Huberi (Ducke) Standl (Sapotaceae), an Amazonian Timber Species. Molecular Ecology Notes 2005, 5, 13–15. [Google Scholar] [CrossRef]
- Azevedo, V.C.R.; Kanashiro, M.; Ciampi, A.Y.; Grattapaglia, D. Genetic Structure and Mating System of Manilkara Huberi (Ducke) A. Chev., a Heavily Logged Amazonian Timber Species. Journal of Heredity 2007, 98, 646–654. [Google Scholar] [CrossRef]
- Azevedo, V.C.R.; Kanashiro, M.; Grattapaglia, D.; Ciampi, A.Y. CpDNA Variability in Manilkara Huberi, a Species under Sustainable Management in the Brazilian Amazon. Pesquisa Agropecuaria Brasileira 2008, 43, 859–867. [Google Scholar] [CrossRef]
- Sebbenn, A.M.; Degen, B.; Azevedo, V.C.R.; Silva, M.B.; de Lacerda, A.E.B.; Ciampi, A.Y.; Kanashiro, M.; Carneiro, F. da S.; Thompson, I.; Loveless, M.D. Modelling the Long-Term Impacts of Selective Logging on Genetic Diversity and Demographic Structure of Four Tropical Tree Species in the Amazon Forest. Forest Ecology and Management 2008, 254, 335–349. [Google Scholar] [CrossRef]
- Moraes, R.C.S.; Vivas, C.V.; Oliveira, F.A.; Menezes, I.P.P.; van den Berg, C.; Gaiotto, F.A. Microsatellite Markers for an Endemic Atlantic Forest Tree, Manilkara Multifida (Sapotaceae). AoB PLANTS 2013, 5, plt006. [Google Scholar] [CrossRef]
- Silva-Junior, J.A.; de Souza França, D.; Moraes, R.C.S.; Gaiotto, F.A. Development of Microsatellite Markers for Manilkara Maxima T.D. Penn. (Sapotaceae) and Their Use in Conservation Genetics. Mol Biol Rep 2016, 43, 451–455. [Google Scholar] [CrossRef] [PubMed]
- Waqar, Z.; Moraes, R.C.S.; Benchimol, M.; Morante-Filho, J.C.; Mariano-Neto, E.; Gaiotto, F.A. Gene Flow and Genetic Structure Reveal Reduced Diversity between Generations of a Tropical Tree, Manilkara Multifida Penn., in Atlantic Forest Fragments. Genes 2021, 12, 2025. [Google Scholar] [CrossRef]
- Heaton, H.J.; Whitkus, R.; Gómez-Pompa, A. Extreme Ecological and Phenotypic Differences in the Tropical Tree Chicozapote (Manilkara Zapota (L.) P. Royen) Are Not Matched by Genetic Divergence: A Random Amplified Polymorphic DNA (RAPD) Analysis. Molecular Ecology 1999, 8, 627–632. [Google Scholar] [CrossRef]
- Armstrong, K.E.; Stone, G.N.; Nicholls, J.A.; Valderrama, E.; Anderberg, A.A.; Smedmark, J.; Gautier, L.; Naciri, Y.; Milne, R.; Richardson, J.E. Patterns of Diversification amongst Tropical Regions Compared: A Case Study in Sapotaceae. Front. Genet. 2014, 5. [Google Scholar] [CrossRef]
- Ganzhorn, S.M.; Thomas, W.W.; Gaiotto, F.A.; Lewis, J.D. Spatial Genetic Structure of Manilkara Maxima (Sapotaceae), a Tree Species from the Brazilian Atlantic Forest. Journal of Tropical Ecology 2015, 31, 437–447. [Google Scholar] [CrossRef]
- Thompson, K.M.; Culley, T.M.; Zumberger, A.M.; Lentz, D.L. Genetic Variation and Structure in the Neotropical Tree, Manilkara Zapota (L) P. Royen (Sapotaceae) Used by the Ancient Maya. Tree Genetics & Genomes 2015, 11, 40. [Google Scholar] [CrossRef]
- Arias, R.S.; Ballard, L.L.; Duke, M.V.; Simpson, S.A.; Liu, X.F.; Orner, V.A.; Sobolev, V.S.; Scheffler, B.E.; Martinez-Castillo, J. Development of Nuclear Microsatellite Markers to Facilitate Germplasm Conservation and Population Genetics Studies of Five Groups of Tropical Perennial Plants with Edible Fruits and Shoots: Rambutan (Nephelium Lappaceum L.), Sapodilla (Manilkara Zapota (L.) P. Royen), Lychee (Litchi Chinensis Sonn.), Mangosteen (Garcinia Mangostana Linn. and Garcinia Cochinchinensis (Lour.) Choisy) and Bamboo (Bambusa Vulgaris Schrad. Ex J.C. Wendl and Guadua Angustifolia Kunth). Genet Resour Crop Evol 2020, 67, 1715–1731. [Google Scholar] [CrossRef]
- Malik, S.K.; Kumar, S.; Choudhary, R.; Kole, P.R.; Chaudhury, R.; Bhat, K.V. Assessment of Genetic Diversity in Khirni [Manilkara Hexandra (Roxb.) Dubard]: An Important Underutilized Fruit Species of India Using Random Amplified Polymorphic DNA Markers. Indian Journal of Horticulture 2013, 70, 18–25. [Google Scholar]
- Goraniya, S.; Tusamda, N.; Shirolkar, A.R.; Rao, G.; Murthy, S.N.; Pawar, S.D. Molecular Analysis of Manilkara Hexandra Roxb. and Averrhoa Carambola Using RAPD Markers Helps to Understand Genetic Variations. International Journal of Pharmacy and Pharmaceutical Sciences 2013, 5, 626–628. [Google Scholar]
- Sathanandam, P.N.; Patil, P.; Rekha, A.; Muthuvel, I.; Patel, A.R.; Boggala, R.B.; Shirol, A.M.; Ravishankar, K.V. Development and Characterization of Microsatellite Markers, Genetic Diversity and Population Structure Analysis in Sapota (Manilkara Zapota (L.) P. Royen). Genet Resour Crop Evol 2022, 69, 2787–2801. [Google Scholar] [CrossRef]
- Rathva, H.; Pandey, A.K.; Suthar, K.; Suthar, H.; Chakote, A.; Singh, D.; Ahlawat, T.; Parmar, V.; Dhiman, V.K.; Pandey, H.; et al. Genetic Relatedness Analysis in Sapota Using SSR Markers. Ecological Genetics and Genomics 2024, 31, 100234. [Google Scholar] [CrossRef]
- González-Hernández, D.; García-Pérez, E.; Guntin-Marey, P. Genetic Characterization of Manilkara Zapota from Veracruz, Mexico, with SSR Markers. Agrociencia 2012, 46, 663–675. [Google Scholar]
- Martínez-Natarén, D.A.; Parra-Tabla, V.; Munguía-Rosas, M.A. Genetic diversity and structure of the tree Manilkara zapota in a naturally fragmented tropical forest. Journal of Tropical Ecology 2017, 33, 285–294. [Google Scholar] [CrossRef]
- Sari, V.K.; Murti, R.H. AN EFFECTIVE METHOD FOR DNA EXTRACTION OF MATURE LEAF OF SAPODILLA (Manilkara Zapota (L.) van Royen). AGRIVITA Journal of Agricultural Science 2015, 37, 18–23. [Google Scholar] [CrossRef]
- Sari, V.K.; Wulandari, R.A.; Murti, R.H. Study on Diversity of Sapodilla (Manilkara Zapota) by Molecular Marker in the Special Region of Yogyakarta. AGRIVITA Journal of Agricultural Science 2018, 40, 295–303. [Google Scholar] [CrossRef]
- Vanijajiva, O. Start Codon Targeted (SCoT) Polymorphism Reveals Genetic Diversity of Manilkara in Thailand. Biodiversitas Journal of Biological Diversity 2020, 21. [Google Scholar] [CrossRef]
- Liu, J.; Ren, S.-N.; Li, K.-X.; Xu, T.; Niu, Y.-F.; Shi, C. The Complete Chloroplast Genome Sequence of Manilkara Zapota (Linn.) van Royen. Mitochondrial DNA Part B 2019, 4, 2127–2128. [Google Scholar] [CrossRef]
- Randriarisoa, A.; Naciri, Y.; Armstrong, K.; Boluda, C.G.; Dafreville, S.; Pouchon, C.; Gautier, L. One in, One out: Generic Circumscription within Subtribe Manilkarinae (Sapotaceae). TAXON 2023, 72, 98–125. [Google Scholar] [CrossRef]
- WFO World Flora Online. Available online: https://www.worldfloraonline.org/ (accessed on 12 August 2025).
- POWO Plants of the World Online. Available online: https://powo.science.kew.org/ (accessed on 9 July 2025).
- Nadeem, M.A.; Nawaz, M.A.; Shahid, M.Q.; Doğan, Y.; Comertpay, G.; Yıldız, M.; Hatipoğlu, R.; Ahmad, F.; Alsaleh, A.; Labhane, N.; et al. DNA Molecular Markers in Plant Breeding: Current Status and Recent Advancements in Genomic Selection and Genome Editing. Biotechnology & Biotechnological Equipment 2018, 32, 261–285. [Google Scholar] [CrossRef]
- Wang, H.; Bernardo, A.; St. Amand, P.; Bai, G.; Bowden, R.L.; Guttieri, M.J.; Jordan, K.W. Skim Exome Capture Genotyping in Wheat. The Plant Genome 2023, 16, e20381. [Google Scholar] [CrossRef]
- Wang, B. 王博; Jia, P. 贾鹏; Gao, S. 高胜寒; Zhao, H. 赵焕焕; Zheng, G. 郑高洋; Xu, L. 许林峰; Ye, K. 叶凯. Long and Accurate: How HiFi Sequencing Is Transforming Genomics. genom. proteom. bioinform. 2025, 23, qzaf003. [Google Scholar] [CrossRef]
- Amom, T.; Nongdam, P. The Use of Molecular Marker Methods in Plants: A Review. Int. J. Curr. Res. Rev. 2017, 9. [Google Scholar] [CrossRef]
- Hasan, N.; Choudhary, S.; Naaz, N.; Sharma, N.; Laskar, R.A. Recent Advancements in Molecular Marker-Assisted Selection and Applications in Plant Breeding Programmes. Journal of Genetic Engineering and Biotechnology 2021, 19, 128. [Google Scholar] [CrossRef] [PubMed]
- Williams, J.G.K.; Kubelik, A.R.; Livak, K.J.; Rafalski, J.A.; Tingey, S.V. DNA Polymorphisms Amplified by Arbitrary Primers Are Useful as Genetic Markers. Nucleic Acids Research 1990, 18, 6531–6535. [Google Scholar] [CrossRef] [PubMed]
- Mendonça, E.G.; de Souza, A.M.; Vieira, F. de A.; Estopa, R.A.; Reis, C.A.F.; Carvalho, D. de Using Random Amplified Polymorphic DNA to Assess Genetic Diversity and Structure of Natural Calophyllum Brasiliense (Clusiaceae) Populations in Riparian Forests. International Journal of Forestry Research 2014, 2014, 305286. [Google Scholar] [CrossRef]
- Lynch, M.; Milligan, B.G. Analysis of Population Genetic Structure with RAPD Markers. Molecular Ecology 1994, 3, 91–99. [Google Scholar] [CrossRef]
- Reyes-Valdés, M.H.; Santacruz-Varela, A.; Martínez, O.; Simpson, J.; Hayano-Kanashiro, C.; Cortés-Romero, C. Analysis and Optimization of Bulk DNA Sampling with Binary Scoring for Germplasm Characterization. PLOS ONE 2013, 8, e79936. [Google Scholar] [CrossRef]
- Sun, L.; Lai, M.; Ghouri, F.; Nawaz, M.A.; Ali, F.; Baloch, F.S.; Nadeem, M.A.; Aasim, M.; Shahid, M.Q. Modern Plant Breeding Techniques in Crop Improvement and Genetic Diversity: From Molecular Markers and Gene Editing to Artificial Intelligence—A Critical Review. Plants 2024, 13, 2676. [Google Scholar] [CrossRef] [PubMed]
- Doyle, J.J.; Doyle, J.L. Isolation of Plant DNA from Fresh Tissue; Focus., 1990; Vol. 12. [Google Scholar]
- Collard, B.C.Y.; Mackill, D.J. Start Codon Targeted (SCoT) Polymorphism: A Simple, Novel DNA Marker Technique for Generating Gene-Targeted Markers in Plants. Plant Mol Biol Rep 2009, 27, 86–93. [Google Scholar] [CrossRef]
- Amom, T.; Tikendra, L.; Apana, N.; Goutam, M.; Sonia, P.; Koijam, A.S.; Potshangbam, A.M.; Rahaman, H.; Nongdam, P. Efficiency of RAPD, ISSR, iPBS, SCoT and Phytochemical Markers in the Genetic Relationship Study of Five Native and Economical Important Bamboos of North-East India. Phytochemistry 2020, 174, 112330. [Google Scholar] [CrossRef]
- Panchariya, D.C.; Dutta, P.; Ananya; Mishra, A.; Chawade, A.; Nayee, N.; Azam, S.; Gandham, R.K.; Majumdar, S.; Kushwaha, S.K. Genetic Marker: A Genome Mapping Tool to Decode Genetic Diversity of Livestock Animals. Front Genet 2024, 15, 1463474. [Google Scholar] [CrossRef]
- Coutinho, J.P.; Carvalho, A.; Martín, A.; Lima-Brito, J. Molecular Characterization of Fagaceae Species Using Inter-Primer Binding Site (iPBS) Markers. Mol Biol Rep 2018, 45, 133–142. [Google Scholar] [CrossRef]
- Tautz, D. Hypervariability of Simple Sequences as a General Source for Polymorphic DNA Markers. Nucleic Acids Research 1989, 17, 6463–6471. [Google Scholar] [CrossRef]
- Scaketti, M.; Sujii, P.S.; Alves-Pereira, A.; Schwarcz, K.D.; Francisconi, A.F.; Moro, M.S.; Martins, K.K.M.; Jesus, T.A. de; Souza, G.B.F. de; Zucchi, M.I. Sample Size Impact (SaSii): An R script for estimating optimal sample sizes in population genetics and population genomics studies. PLOS ONE 2025, 20, e0316634. [CrossRef]
- Rosenberger, K.; Schumacher, E.; Brown, A.; Hoban, S. Proportional Sampling Strategy Often Captures More Genetic Diversity When Population Sizes Vary. Biological Conservation 2021, 261, 109261. [Google Scholar] [CrossRef]
- Wang, Y.; Ding, C.; Hermoso, V.; Ji, S.; Du, T.; Chen, J.; Ding, L.; Tao, J. Using Marxan to Optimize the Geographical and Environmental Representativeness of Biodiversity Sampling Sites. Biological Conservation 2024, 294, 110591. [Google Scholar] [CrossRef]
- Wang, H.; Yang, B.; Wang, H.; Xiao, H. Impact of Different Numbers of Microsatellite Markers on Population Genetic Results Using SLAF-Seq Data for Rhododendron Species. Sci Rep 2021, 11, 8597. [Google Scholar] [CrossRef] [PubMed]
- Alves, S.I.A.; Dantas, C.W.D.; Macedo, D.B.; Ramos, R.T.J. What Are Microsatellites and How to Choose the Best Tool: A User-Friendly Review of SSR and 74 SSR Mining Tools. Front. Genet. 2024, 15. [Google Scholar] [CrossRef] [PubMed]
- Waqar, Z.; Moraes, R.C.S.; Benchimol, M.; Morante-Filho, J.C.; Mariano-Neto, E.; Gaiotto, F.A. Gene Flow and Genetic Structure Reveal Reduced Diversity between Generations of a Tropical Tree, Manilkara Multifida Penn., in Atlantic Forest Fragments. Genes 2021, 12, 2025. [Google Scholar] [CrossRef] [PubMed]
- Moore, M.J.; Soltis, P.S.; Bell, C.D.; Burleigh, J.G.; Soltis, D.E. Phylogenetic Analysis of 83 Plastid Genes Further Resolves the Early Diversification of Eudicots. Proceedings of the National Academy of Sciences 2010, 107, 4623–4628. [Google Scholar] [CrossRef]
- Drew, B.T.; Ruhfel, B.R.; Smith, S.A.; Moore, M.J.; Briggs, B.G.; Gitzendanner, M.A.; Soltis, P.S.; Soltis, D.E. Another Look at the Root of the Angiosperms Reveals a Familiar Tale. Syst Biol 2014, 63, 368–382. [Google Scholar] [CrossRef]
- Shaw, J.; Lickey, E.B.; Schilling, E.E.; Small, R.L. Comparison of Whole Chloroplast Genome Sequences to Choose Noncoding Regions for Phylogenetic Studies in Angiosperms: The Tortoise and the Hare III. American Journal of Botany 2007, 94, 275–288. [Google Scholar] [CrossRef]
- Dong, Y.; Yao, H.; Lin, Z.; Zhang, L.; Bao, Z. Characterization of 62 Polymorphic EST-SSR Markers in the Blood Clam (Tegillarca Granosa) and Their Cross-Amplification in Scapharca Subcrenata. Conservation Genet Resour 2012, 4, 991–997. [Google Scholar] [CrossRef]
- Haasl, R.J.; Payseur, B.A. Multi-Locus Inference of Population Structure: A Comparison between Single Nucleotide Polymorphisms and Microsatellites. Heredity 2011, 106, 158–171. [Google Scholar] [CrossRef]
- McCauley, D.E.; Sundby, A.K.; Bailey, M.F.; Welch, M.E. Inheritance of Chloroplast DNA Is Not Strictly Maternal in Silene Vulgaris (Caryophyllaceae): Evidence from Experimental Crosses and Natural Populations. American Journal of Botany 2007, 94, 1333–1337. [Google Scholar] [CrossRef]
- López-Alvarado, J.; Sáez, L.; Filigheddu, R.; Garcia-Jacas, N.; Susanna, A. The Limitations of Molecular Markers in Phylogenetic Reconstruction: The Case of Centaurea Sect. Phrygia (Compositae). TAXON 2014, 63, 1079–1091. [Google Scholar] [CrossRef]
- Chen, S.; Yao, H.; Han, J.; Liu, C.; Song, J.; Shi, L.; Zhu, Y.; Ma, X.; Gao, T.; Pang, X.; et al. Validation of the ITS2 Region as a Novel DNA Barcode for Identifying Medicinal Plant Species. PLOS ONE 2010, 5, e8613. [Google Scholar] [CrossRef] [PubMed]
- Cheng, T.; Xu, C.; Lei, L.; Li, C.; Zhang, Y.; Zhou, S. Barcoding the Kingdom Plantae: New PCR Primers for ITS Regions of Plants with Improved Universality and Specificity. Molecular Ecology Resources 2016, 16, 138–149. [Google Scholar] [CrossRef]
- Wei, X.; Jiang, M. Meta-Analysis of Genetic Representativeness of Plant Populations under Ex Situ Conservation in Contrast to Wild Source Populations. Conservation Biology 2021, 35, 12–23. [Google Scholar] [CrossRef]
- Phang, A.; Niissalo, M.A.; Herrera-Alsina, L.; Pezzini, F.F.; Hollands, R.; Burslem, D.F.R.P.; Ruhsam, M.; Middleton, D.J.; Wilkie, P.; Khew, G.S. Novel Phylogenomic and Biogeographic Insights into Palaquium and Tribe Isonandreae (Sapotaceae). Molecular Phylogenetics and Evolution 2025, 212, 108403. [Google Scholar] [CrossRef] [PubMed]
- Hoelzel, A.R. Where to Now with the Evolutionarily Significant Unit? Trends in Ecology & Evolution 2023, 38, 1134–1142. [Google Scholar] [CrossRef] [PubMed]
- Savolainen, O.; Lascoux, M.; Merilä, J. Ecological Genomics of Local Adaptation. Nat Rev Genet 2013, 14, 807–820. [Google Scholar] [CrossRef] [PubMed]
- Feng, J.; Dan, X.; Cui, Y.; Gong, Y.; Peng, M.; Sang, Y.; Ingvarsson, P.K.; Wang, J. Integrating Evolutionary Genomics of Forest Trees to Inform Future Tree Breeding amid Rapid Climate Change. Plant Communications 2024, 5, 101044. [Google Scholar] [CrossRef]
- Dauphin, B.; Rellstab, C.; Wüest, R.O.; Karger, D.N.; Holderegger, R.; Gugerli, F.; Manel, S. Re-Thinking the Environment in Landscape Genomics. Trends in Ecology & Evolution 2023, 38, 261–274. [Google Scholar] [CrossRef]
- Aitken, S.N.; Jordan, R.; Tumas, H.R. Conserving Evolutionary Potential: Combining Landscape Genomics with Established Methods to Inform Plant Conservation. Annual Review of Plant Biology 2024, 75, 707–736. [Google Scholar] [CrossRef]
- Chambers, E.A.; Bishop, A.P.; Wang, I.J. Individual-based Landscape Genomics for Conservation: An Analysis Pipeline. Mol Ecol Resour 2025, 25, e13884. [Google Scholar] [CrossRef]
- Aguilar, R.; Quesada, M.; Ashworth, L.; Herrerias-Diego, Y.; Lobo, J. Genetic Consequences of Habitat Fragmentation in Plant Populations: Susceptible Signals in Plant Traits and Methodological Approaches. Molecular Ecology 2008, 17, 5177–5188. [Google Scholar] [CrossRef]
- Li, C.; Li, B.; Zhao, W.; Jiang, J.; Tang, J. Forest Tree Breeding under the Global Environmental Change: Challenges and Opportunities. Trees, Forests and People 2025, 20, 100867. [Google Scholar] [CrossRef]
- Chung, M.Y.; Merilä, J.; Li, J.; Mao, K.; López-Pujol, J.; Tsumura, Y.; Chung, M.G. Neutral and Adaptive Genetic Diversity in Plants: An Overview. Front. Ecol. Evol. 2023, 11. [Google Scholar] [CrossRef]
- Heuertz, M.; Carvalho, S.B.; Galindo, J.; Rinkevich, B.; Robakowski, P.; Aavik, T.; Altinok, I.; Barth, J.M.I.; Cotrim, H.; Goessen, R.; et al. The Application Gap: Genomics for Biodiversity and Ecosystem Service Management. Biological Conservation 2023, 278, 109883. [Google Scholar] [CrossRef]
- Alseekh, S.; Klemmer, A.; Yan, J.; Guo, T.; Fernie, A.R. Embracing Plant Plasticity or Robustness as a Means of Ensuring Food Security. Nat Commun 2025, 16, 461. [Google Scholar] [CrossRef] [PubMed]
- Swenson, U.; Lepschi, B.; Lowry, P.P., II; Terra-Araujo, M.H.; Santos, K.; Nylinder, S.; Alves-Araújo, A. Reassessment of Generic Boundaries in Neotropical Chrysophylloideae (Sapotaceae): Eleven Reinstated Genera and Narrowed Circumscriptions of Chrysophyllum and Pouteria. TAXON 2023, 72, 307–359. [Google Scholar] [CrossRef]
- Beckers, V.; Jepma, P.J.; Kokshoorn, S.; Wilkie, P.; Hendriks, K.; Smets, E.; Lens, F. Wood Anatomy Helps Solve Challenging Taxonomic Relationships in the Tropical Sapotaceae. 2025. [Google Scholar] [CrossRef]
- Ijaz, S.; Iqbal, J.; Abbasi, B.A.; Yaseen, T.; Rehman, S.; Kazi, M.; Ansari, L.; Mahmood, T. Role of OMICS-Based Technologies in Plant Sciences. In OMICs-based Techniques for Global Food Security; 2024; pp. 45–66.
- Naidoo, S.; Slippers, B.; Plett, J.M.; Coles, D.; Oates, C.N. The Road to Resistance in Forest Trees. Front. Plant Sci. 2019, 10. [Google Scholar] [CrossRef]
- Hibbins, M.S.; Hahn, M.W. Phylogenomic Approaches to Detecting and Characterizing Introgression. Genetics 2022, 220, iyab173. [Google Scholar] [CrossRef]
- Bjornson, S.; Verbruggen, H.; Upham, N.S.; Steenwyk, J.L. Reticulate Evolution: Detection and Utility in the Phylogenomics Era. Mol Phylogenet Evol 2024, 201, 108197. [Google Scholar] [CrossRef]
- Bock, D.G.; Cai, Z.; Elphinstone, C.; González-Segovia, E.; Hirabayashi, K.; Huang, K.; Keais, G.L.; Kim, A.; Owens, G.L.; Rieseberg, L.H. Genomics of Plant Speciation. Plant Comm 2023, 4. [Google Scholar] [CrossRef]
- Olivares, I.; Tusso, S.; José Sanín, M.; de La Harpe, M.; Loiseau, O.; Rolland, J.; Salamin, N.; Kessler, M.; Shimizu, K.K.; Paris, M. Hyper-Cryptic Radiation of a Tropical Montane Plant Lineage. Molecular Phylogenetics and Evolution 2024, 190, 107954. [Google Scholar] [CrossRef]
- Pezzini, F.F.; Ferrari, G.; Forrest, L.L.; Hart, M.L.; Nishii, K.; Kidner, C.A. Target Capture and Genome Skimming for Plant Diversity Studies. Appl Plant Sci 2023, 11, e11537. [Google Scholar] [CrossRef]
- Lebedev, V.G.; Lebedeva, T.N.; Chernodubov, A.I.; Shestibratov, K.A. Genomic Selection for Forest Tree Improvement: Methods, Achievements and Perspectives. Forests 2020, 11, 1190. [Google Scholar] [CrossRef]
- Grattapaglia, D. Twelve Years into Genomic Selection in Forest Trees: Climbing the Slope of Enlightenment of Marker Assisted Tree Breeding. Forests 2022, 13, 1554. [Google Scholar] [CrossRef]
- Cao, H.X.; Vu, G.T.H.; Gailing, O. From Genome Sequencing to CRISPR-Based Genome Editing for Climate-Resilient Forest Trees. International Journal of Molecular Sciences 2022, 23, 966. [Google Scholar] [CrossRef]
- Cardi, T.; Murovec, J.; Bakhsh, A.; Boniecka, J.; Bruegmann, T.; Bull, S.E.; Eeckhaut, T.; Fladung, M.; Galovic, V.; Linkiewicz, A.; et al. CRISPR/Cas-Mediated Plant Genome Editing: Outstanding Challenges a Decade after Implementation. Trends in Plant Science 2023, 28, 1144–1165. [Google Scholar] [CrossRef] [PubMed]
- El-Kassaby, Y.A.; Cappa, E.P.; Chen, C.; Ratcliffe, B.; Porth, I.M. Efficient Genomics-Based ‘End-to-End’ Selective Tree Breeding Framework. Heredity 2024, 132, 98–105. [Google Scholar] [CrossRef]
- Xu, R.; Li, C. A Review of High-Throughput Field Phenotyping Systems: Focusing on Ground Robots. Plant Phenomics 2022, 2022. [CrossRef]
- Koch, M.; DeMond, J.; Pence, M.G.; Schaefer, E.A.; Rudgers, G. One Risk Assessment for Genetically Modified Plants. Front. Bioeng. Biotechnol. 2025, 13. [Google Scholar] [CrossRef]
- Spök, A.; Sprink, T.; Allan, A.C.; Yamaguchi, T.; Dayé, C. Towards Social Acceptability of Genome-Edited Plants in Industrialised Countries? Emerging Evidence from Europe, United States, Canada, Australia, New Zealand, and Japan. Front Genome Ed 2022, 4, 899331. [Google Scholar] [CrossRef]
- Caradus, J.R. Is Co-Existence and/or Containment of Genetically Modified Plants Possible, and Is It Important? New Zealand Journal of Agricultural Research 2025, 68, 1329–1380. [Google Scholar] [CrossRef]
- Islam, K.K.; Saifullah, M.; Mahboob, M.G.; Jewel, K.N.-E.-A.; Ashraf, S.M.K.; Hyakumura, K. Restoring Soil Fertility, Productivity and Biodiversity through Participatory Agroforestry: Evidence from Madhupur Sal Forest, Bangladesh. Land 2024, 13, 326. [Google Scholar] [CrossRef]
- Xu, Y.; Zhang, X.; Li, H.; Zheng, H.; Zhang, J.; Olsen, M.S.; Varshney, R.K.; Prasanna, B.M.; Qian, Q. Smart Breeding Driven by Big Data, Artificial Intelligence, and Integrated Genomic-Enviromic Prediction. Mol. Plant 2022, 15, 1664–1695. [Google Scholar] [CrossRef] [PubMed]
- Duarte, D.; Jurcic, E.J.; Dutour, J.; Villalba, P.V.; Centurión, C.; Grattapaglia, D.; Cappa, E.P. Genomic Selection in Forest Trees Comes to Life: Unraveling Its Potential in an Advanced Four-Generation Eucalyptus Grandis Population. Front. Plant Sci. 2024, 15. [Google Scholar] [CrossRef] [PubMed]
- Mora-Poblete, F.; Mieres-Castro, D.; do Amaral Júnior, A.T.; Balach, M.; Maldonado, C. Integrating Deep Learning for Phenomic and Genomic Predictive Modeling of Eucalyptus Trees. Industrial Crops and Products 2024, 220, 119151. [Google Scholar] [CrossRef]
- Sthapit, S.R.; Crain, J.; Larson, S.; Anderson, J.A.; Bajgain, P.; DeHaan, L.R.; Poland, J. A Low-coverage Skim-sequencing and Imputation Pipeline for Genomic Selection. Plant Genome 2025, 18, e70139. [Google Scholar] [CrossRef]
Figure 1.
PRISMA-style flow diagram illustrating the steps followed in the search, selection, and screening of studies included in this exploratory review. Adapted from [40].
Figure 1.
PRISMA-style flow diagram illustrating the steps followed in the search, selection, and screening of studies included in this exploratory review. Adapted from [40].

Figure 2.
Heat map showing the frequency of scientific output on molecular markers in species of the genus Manilkara by country.
Figure 2.
Heat map showing the frequency of scientific output on molecular markers in species of the genus Manilkara by country.

Figure 3.
Frequency of molecular marker use by country in studies of species within the genus Manilkara.
Figure 3.
Frequency of molecular marker use by country in studies of species within the genus Manilkara.

Figure 4.
Time-calibrated phylogeny and biogeographic structure of Manilkara and related genera (ITS dataset). Figure reproduced from [52]. Frontiers in Genetics, 5:362. Licensed under CC BY 4.0.
Figure 4.
Time-calibrated phylogeny and biogeographic structure of Manilkara and related genera (ITS dataset). Figure reproduced from [52]. Frontiers in Genetics, 5:362. Licensed under CC BY 4.0.

Figure 5.
Species tree reconstruction of Manilkara and related genera inferred from ASTRAL-II. Figure reproduced from [66]. Taxon, 72(6):1404-1428. Licensed under CC BY 4.0.
Figure 5.
Species tree reconstruction of Manilkara and related genera inferred from ASTRAL-II. Figure reproduced from [66]. Taxon, 72(6):1404-1428. Licensed under CC BY 4.0.

Disclaimer/Publisher’s Note: The statements, opinions and data contained in all publications are solely those of the individual author(s) and contributor(s) and not of MDPI and/or the editor(s). MDPI and/or the editor(s) disclaim responsibility for any injury to people or property resulting from any ideas, methods, instructions or products referred to in the content. |
© 2026 by the authors. Licensee MDPI, Basel, Switzerland. This article is an open access article distributed under the terms and conditions of the Creative Commons Attribution (CC BY) license (http://creativecommons.org/licenses/by/4.0/).
Copyright: This open access article is published under a Creative Commons CC BY 4.0 license, which permit the free download, distribution, and reuse, provided that the author and preprint are cited in any reuse.


