Submitted:
27 February 2026
Posted:
02 March 2026
You are already at the latest version
Abstract
A vertiport is a key supporting infrastructure for providing takeoff and landing facilities for aircraft within the rapidly growing Advanced Air Mobility (AAM) ecosystem, particularly in urban areas or Urban Air Mobility (UAM) which faces significant challenges such as dense urban obstacles and limited available space, urging improvement in the vertiport space usage. The configuration variation on a two-pad vertiport is modeled and simulated using AnyLogic Discrete Event Simulation (DES), varying number of stands, operational concepts, and aircraft turnaround times, while considering Linear and Satellite topology to analyze their influence on the vertiport output capacity. The results indicate that each configuration responds differently with turnaround time variation, showing delays and capacity reduction for shorter time. Increasing number of stands provides a significant capacity benefit for longer turnaround times across all simulated configurations, with capacity gains ranging from 100–120%. Overall, the linear–independent vertiport achieves the highest total capacity of 163 and 229 aircraft for the 4 and 6 stand variants, respectively, while the satellite vertiport attains the highest total capacity of 266 and 299 aircraft for the 8 and 10 stand variants. However, considering urban space usage, the satellite vertiport benefits in lower stands number while linear vertiport benefits in higher stands number.
Keywords:
UAM
; vertiport topology
; vertiport operational concept
; vertiport capacity
1. Introduction
Advanced Air Mobility (AAM) is a term encompassing transportation systems designed to move passengers, goods, or cargo between two locations using aircraft equipped with emerging technologies, particularly electric propulsion systems. In general, AAM is categorized into three segments: Urban Air Mobility (UAM), Regional Air Mobility (RAM), and Low Altitude Mobility (LAM) [1]. Numerous studies describe AAM as a transportation mode utilizing small electric aerial vehicles capable of carrying passengers or cargo between urban and regional areas [2]. Urban Air Mobility (UAM), as the urban subset of AAM, typically employs electric vertical takeoff and landing aircraft (eVTOL) to transport passengers and goods within and between cities [3]. The UAM operational concept holds significant potential to complement existing helicopter operations by providing environmentally friendly, small-scale passenger and cargo transport in densely populated areas, generating lower levels of noise and air pollution.
A vertiport constitutes a critical supporting infrastructure within the AAM ecosystem, enabling eVTOL aircraft to conduct takeoff, landing, loading, and unloading operations [4]. With the rapid growth of the UAM sector, supported by research indicating increasing future interest in eVTOL aircraft [3], a substantial rise in eVTOL operations within urban areas is highly anticipated. This trend will consequently increase takeoff and landing activities at vertiport. However, significant challenges arise in the development and operation of vertiport in urban environments, particularly due to limited ground space availability and the presence of surrounding high-rise structures that constrain its expansion. Therefore, a comprehensive study examining the relationship between vertiport capacity and its spatial configuration is essential.
1.1. Vertiport Topology and Operational Concept
Previous studies have extensively examined the influence of design and configuration on vertiport capacity. Based on research done by Vascik & Hansman, sensitivity analysis indicates that the stand-to-pad ratio within a vertiport constitutes a critical design parameter, with an optimal ratio emerging under specific operational conditions to maximize vertiport capacity. Also, the implementation of staging stands can generate a positive impact on vertiport capacity [5]. Zelinski conducted analysis to evaluate the operational efficiency of a vertiport design consisting of four TLOF pads and three configuration types (perimeter, central, disconnected) by incorporating wind limitation constraints aligning with vertiport operational safety requirements, showing that perimeter configuration with interconnected pads and stands exceeds other configurations capacity in the variation of operational condition [6]. Analysis of vertiport capacity using simulation based on AnyLogic was done by Zhang, evaluating differences between independent operation and segregated operation mode by progressively increasing the number of aircraft approaches per hour to determine the maximum vertiport capacity, with central topology demonstrating the highest capacity while under the independent operational concept [7].
Rimjha and Trani analyzed the capacity and delay status of vertiports and the utilization rate of pads by constructing an airport operation logic [8], resulting in 90% of arrivals and 85% of departures needed repositioning to alternative vertiports within the case study area to enable the system to accommodate overall demand. A study conducted by Wille [9] employed a Discrete Event Simulation (DES) approach to analyze vertiport capacity across three different basic topologies (linear, satellite, pier) by incorporating variations in operational parameters, particularly the number of operations per hour and increasing number of stands. The results show that satellite topology yields higher capacity with the same number of stands. Qarni [10] investigated the relationship between vertiport configuration and capacity, focusing on the basic design with increasing stand numbers to see the maximum number of accommodated aircraft within the UAM operational framework using a Discrete Event Simulation (DES). The study incorporated more complex operational elements, including the influence of terminal facilities on overall system performance, with results indicated that for single pad vertiport with more than five stands, pad utilization exceeded 90%, leading to bottleneck effects at the pad level.
1.2. Vertiport Design Guidelines and Regulatory Framework
Prototype Technical Specifications for the Design of VFR Vertiports for Operation with Manned VTOL-Capable Aircraft Certified in the Enhanced Category (PTS-VPT-DSN) is a document published by the European Union Aviation Safety Agency (EASA) in March 2022 which serves as non-regulatory technical guidance for the design of vertiports intended for visual flight rules (VFR) operations [11]. The guidance outlines objectives, applicability, characteristics, and locational requirements related to vertiport constraints and infrastructure attributes.
To date, no internationally applicable regulation governing vertiport design standards has been issued by the International Civil Aviation Organization (ICAO). Consequently, the EASA PTS-VPT-DSN represents the first comprehensive technical specification dedicated to vertiport design, while several aviation authorities worldwide have begun formulating national guidance and recommendations based on the EASA framework. In designing a vertiport, several critical parameters must be considered [11], including:
- The largest aircraft dimension.
- Maximum Take-Off Mass (MTOM).
- The most critical obstacle clearance criteria.
The dimensions and load-bearing capacity of key physical vertiport elements, namely the Final Approach and Take-Off Area (FATO), Touchdown and Lift-Off Area (TLOF), and Safety Area (SA) must be sufficient to support operations of the largest aircraft intended to operate at the vertiport. In determining these dimensions, EASA implements the concept of the aircraft reference dimension (D), defined as the diameter of the smallest circle capable of enclosing the horizontal projection of the VTOL aircraft in its takeoff and landing configuration [11]. The physical dimensions of vertiport elements are then established based on this “D” value to ensure operational safety.
1.3. Summary and Contributions
Based on the previous studies, it can be concluded that vertiport capacity is strongly influenced by its key infrastructure attributes, particularly the configuration. These studies have modeled vertiport operations using various approaches, including Discrete Event Simulation (DES), indicating consistent results that an increase in the number of stands is directly proportional to an increase in vertiport capacity. In addition, some research has also evaluated different vertiport operational modes to examine their impact on system capacity. The varying configurations have been tested under different operational concepts, such as independent and segregated operations, yielding varied performance outcomes depending on the design and operational assumptions.
However, no prior research has clearly examined the interaction between pads on multi pads vertiport, and their influence on capacity under different operational concepts involving uncertainty in the turnaround stand (i.e., stochastic or variable parameters of turnaround). Also, no previous study takes into consideration existing vertiport design regulations or guidance in developing the topologies or layouts, regarding interaction of multi pads and multi stands vertiport. Therefore, this research aims to contribute as follows:
- Based on basic topology design, two topologies are proposed, named linear topology and satellite topology, and modeled with two-pad vertiports while aligning with the existing EASA design guidance.
- Based on two-pad operational concept, the topologies are simulated with independent and segregated operations.
- Each topology is simulated under varying parameters; number of stands, increasing turnaround time, while incorporating stochasticity for the turnaround time to assess their combined impact on vertiport capacity and to identify the configuration that achieves the highest capacity within a given operational timeframe.
2. Approach Methods
This paper adopts a quantitative approach employing Discrete Event Simulation (DES) modeling based on AnyLogic to evaluate the operational performance of two-pad vertiports with various configurations. The two-pad vertiport layout design was developed based on the guidelines defined in the EASA PTS-VPT-DSN and generated using MATLAB (R2023a) for the corresponding geometric parameters of the layout. Figure 1 displays the first step used in this paper to develop and analyzed the two-pad vertiport layout using MATLAB.
Four stand-number variations were simulated for each configuration examined in this study, namely 4, 6, 8, and 10 stands, to assess the effect of stand increase on the capacity of a two-pad vertiport. Based on the reference aircraft taxi speeds and average passenger walking speeds, variations in aircraft taxi time and passenger embarkation time were determined. These parameters were subsequently used as input variables in the DES model developed using AnyLogic.
2.1. Reference Aircraft
A VTOL-capable aircraft is one that can take off and land vertically [12]. Some of these aircraft also possess the capability to perform conventional takeoff and landing operations like conventional takeoff and landing (CTOL) aircraft. With the advancement of Advanced Air Mobility (AAM), driven by progress in battery technology and electric propulsion systems, a new class of aircraft has emerged featuring fully electric propulsion systems as their primary energy source, commonly referred to as electric Vertical Take-Off and Landing (eVTOL) aircraft. These next-generation aircraft are expected to offer enhanced safety levels, reduced noise emissions, and lower operational and maintenance costs compared to conventional VTOL aircraft such as helicopters [3]. According to the review and comparative analysis conducted by Garrow on various studies concerning the development of Urban Air Mobility (UAM), eVTOL aircraft can be classified into four categories based on their propulsion system design, as follows:
- Vectored Thrust/Tilted Wing: using one or several thrusters for lift and cruise operation with ability to change propulsive direction for each operational need.
- Lift and cruise: using dedicated thruster for each lift or cruise operation.
- Wingless Multicopter: symmetrical configuration of several thrusters used for both lift and cruise operation.
- Rotorcraft: eVTOL with shape like helicopter or autogiro, with big rotor for lift and additional thruster for cruise operation.
Each eVTOL aircraft developed by global manufacturers possesses distinct design characteristics, configurations, and operational attributes. Table 1 presents adapted characteristic data for selected eVTOL aircraft [5] where aircraft dimensions are particularly significant, as they are directly related to the dimensional requirements of the supporting takeoff and landing infrastructure, namely the vertiport.
Table 1 shows that the Carter Air Taxi represents the already in operation eVTOL aircraft with the largest maximum dimension of up to 13.72 meters. This aircraft will be considered as reference aircraft for the design of vertiport pads and stands in this study.
2.2. Vertiport Attributes and Dimension
A vertiport is a dedicated facility designed to support eVTOL aircraft operations within the Advanced Air Mobility (AAM) ecosystem, encompassing takeoff and landing activities, passenger embarkation and disembarkation, as well as supporting services such as energy recharging, inspection, and maintenance where applicable [4]. In general, vertiport design attributes closely resemble those of a heliport, as both are intended to provide a standardized and safe operational area for VTOL-capable aircraft during takeoff and landing. These attributes include the Final Approach and Take-Off Area (FATO), the Touchdown and Lift-Off Area (TLOF), and the Safety Area (SA), which are dimensioned according to the characteristics of the aircraft intended to operate at the facility. Collectively, these three elements are commonly referred to as the pad of the vertiport.
The EASA PTS-VPT-DSN serves as the primary reference for the development of the vertiport design in this paper. Based on the design guidelines, a set of vertiport design parameters was identified, including the dimensions of key physical attributes such as the pad components (TLOF, FATO, and Safety Area), stands, and taxiways. The vertiport attributes based on EASA PTS-VPT-DSN are as follows:
Final Approach and Take-Off Area (FATO) is an obstacle-free area of sufficient dimensions to ensure that the entire eVTOL aircraft remains within prescribed safety limits during the final phase of approach and takeoff. Each vertiport must be provided with at least one FATO, which may be either a physical (paved) surface or an imaginary defined area. The minimum separation distance between two FATOs should be 60 meters [11].
The Take-off and Climb and Approach Surfaces are imaginary obstacle limitation surfaces established around the vertiport pad to ensure that eVTOL aircraft remain clear of obstacles during the climb and approach phases, with a minimum angular separation of 135 degrees and an optimal separation of 180 degrees. These surfaces should not extend over apron areas, stands, or other pads [11].
Safety Area (SA) is an obstacle-free area extending outward from the perimeter of the FATO, intended to accommodate deviations resulting from maneuvering errors or takeoff and landing operations under adverse weather conditions.
Taxiway is a designated ground movement path used by eVTOL aircraft to maneuver within the vertiport surface area. Aircraft stand is a designated area where eVTOL aircraft safely conduct passenger or cargo embarkation and disembarkation, as well as receive ground services before and after flight operations. These attributes of vertiports are shown in Figure 2.
2.3. Vertiport Attributes Dimension
The reference eVTOL aircraft, Carter Air Taxi, was used as the reference aircraft for the vertiport attributes design with (D) of 13.72 meters, conservatively rounded up to 14 meters for the geometric design process simplification, shown in Table 2.
2.4. Vertiport Design
The two-pad vertiport design was developed using MATLAB (R2023a). Two layout topologies were modeled: a linear topology (with a pier-type taxiway configuration) and a satellite topology, to examine the characteristics of each configuration under variations in turnaround time (TAT). For each topology, the number of stands was incrementally increased in multiples of two; 4, 6, 8, and 10 stands, to evaluate changes in vertiport performance characteristics. Based on the generated layouts, spatial distances between pads, stands, and the passenger terminal were obtained. These distances were used to calculate aircraft taxi times and passenger walking times from the terminal to the assigned aircraft prior to push-out for departure. The design process was conducted according to the following principles:
2.4.1. Linear Topology
The input variable in the MATLAB model is the number of stands in the vertiport design, defined as n.
n = number of stands in vertiport,
Pad-i position in vertiport is predetermined to be in the same coordinate of x = 0, and separated vertically within y coordinates as:
Stand-j position is determined in the coordinate x and y as:
2.4.2. Satellite Topology
Pad-i position in vertiport is determined to be in the same coordinate of x = 0, and separated vertically within y coordinates as:
The indicates the most upright coordinate of stand between the pads. Stand-j position is determined in the coordinate x and y as:
in which shows the angle of stand-j and pad-i alignment to the horizontal axis, and shows the angle separation between stands:
The equations ensure that each stand is positioned symmetrically and evenly distributed on both sides of the centerline connecting the two pads, with dimensions and placement consistent to the EASA vertiport design guidelines.
3. Design Results and Simulation Setup
Figure 3 and Figure 4 illustrates the visualization of the two-pad vertiport designed using the previously described equations in MATLAB (R2023a).
The X symbol in the two-pad vertiport geometry indicates the location of the passenger terminal, placed homogenously on the right-hand side of every vertiport configuration for this study’s comparison simplicity, even though in reality passenger terminal could be anywhere feasible within the vertiport perimeter. The pad is equipped with dedicated empty areas positioned on the left and right for the purpose of takeoff and landing surface. In the linear stand configuration, a longitudinal taxi-route connects Pad 1 and Pad 2. In contrast, the satellite configuration does not include a connecting taxiway between the two pads. One of the key parameters in vertiport design is the total area (footprint) of the facility, as presented in Table 3.
3.1. Vertiport Operational Concept
The operational concept describes how a vertiport is expected to function in accommodating eVTOL takeoff and landing demand within the AAM ecosystem while also serving as ground infrastructure to provide services such as charging and maintenance. It also functions as a passenger facility for embarkation and disembarkation. In this study, two operational scenarios were evaluated: independent and segregated operations.
Independent operation in this study is where all pads in a vertiport can be operated independently for both take-off and landing operation depending on the operational needs of aircraft at that certain time. Segregated operation, however, requires dedicated operation for each pad, either for takeoff or landing operation only. Simulation is later used to show how variations in the operational concept influence capacity. The segregated scenario was applied only to the linear configuration as this concept requires both pads to be connected by a taxiway. Figure 5 shows simplified flow of vertiport operation, where the aircraft land, moving in to stands on the taxiway, performs turnaround process in the stands, then followed by passenger embarkation. To perform departure the aircraft then taxi out to the available pad and then take off from assigned departure pad.
3.2. Passenger Movement in Embarkation
Figure 6 illustrates the visualization of passenger movement within the vertiport under the linear and satellite configurations with four stands.
Passenger movement is represented by green arrows, originating from point X (the passenger terminal) and directed toward each stand. The passenger walking paths are designed to avoid crossing other stands wherever possible. Utilizing an average passenger walking speed of 264 ft/min (1.342 m/s) [13] the walking distance and corresponding travel time were calculated based on the vertiport geometry. The same procedure was applied to vertiport layouts with a greater number of stands. Table 4 and Table 5 present the calculated passenger walking distances and travel times for each vertiport configuration evaluated in this study.
3.3. Aircraft Gorund Movement in Taxi Operation
Figure 7 illustrates the visualization of passenger movement within the vertiport under the linear and satellite configurations with four stands.
As shown in Figure 7, aircraft taxi-in movements are represented by green arrows, originating from the pad toward the assigned stand. In the linear configuration, either pad has access to all available stands. In contrast, in the satellite configuration, aircraft operating from a given pad can only access the stands located on the same side of that pad. Tabel 6 and 7 gives calculated taxi distance and time to Pad 1, with taxi speed of 1.8 m/s [9].
Figure 7 also shows that the distance between Pad 2 and stands is the opposite to Pad 1 as shown in Table 6 for linear topology, while for satellite topology the distance between Pad 2 and stands is the same as between Pad 1 and stands. This also corresponds to the time needed for aircraft movement.

Table 7.
Taxi time from Pad 1 to stands.
| Number of Stand | Time from Pad 1 to Linear Stand- (seconds) | |||||||||
| 1 | 2 | 3 | 4 | 5 | 6 | 7 | 8 | 9 | 10 | |
| 4 | 29.2 | 29.2 | 44.7 | 44.7 | - | - | - | - | - | - |
| 6 | 29.2 | 29.2 | 44.7 | 44.7 | 60.3 | 60.3 | - | - | - | - |
| 8 | 29.2 | 29.2 | 44.7 | 44.7 | 60.3 | 60.3 | 75.8 | 75.8 | - | - |
| 10 | 29.2 | 29.2 | 44.7 | 44.7 | 60.3 | 60.3 | 75.8 | 75.8 | 91.4 | 91.4 |
| Number of Stand | Time from Pad 1 to Satellite Stand- (seconds) | |||||||||
| 1 | 2 | 3 | 4 | 5 | 6 | 7 | 8 | 9 | 10 | |
| 4 | 17.4 | 17.4 | - | - | - | - | - | - | - | - |
| 6 | 19.1 | 26.1 | 19.1 | - | - | - | - | - | - | - |
| 8 | 22 | 30.1 | 30.1 | 22 | - | - | - | - | - | - |
| 10 | 25.6 | 33.2 | 35.9 | 33.2 | 25.6 | - | - | - | - | - |
3.4. Vertiport DES using AnyLogic
Taxi time and passenger embarkation time were used as input parameters in the simulation model developed in AnyLogic. Each vertiport configuration was tested under different operational scenarios, including independent and segregated concepts, as well as deterministic turnaround time (TAT) variations ranging from 5 to 30 minutes in 5-minute increments. The simulations generated quantitative performance metrics, including vertiport capacity, pad and stand utilization, and queue lengths under each scenario. In addition, each configuration was evaluated using stochastic TAT variations to better represent real operational conditions and to assess the impact of random turnaround times on vertiport capacity, as shown in Figure 8.
3.4.1. Operational Simulation Algorithm
The vertiport simulation algorithm was structured to realistically represent actual operational conditions, clearly modeling the interactions among aircraft, passengers, pads, stands, and taxiways. Aircraft arrive at predefined intervals and request landing clearance. Landing is permitted only if both a pad and a stand are available; otherwise, the aircraft enters a holding queue. After a one-minute landing process (assigned to Pad 1 or Pad 2), the aircraft is allocated to the nearest available stand and performs taxi-in. At the stand, turnaround activities, including passenger disembarkation, servicing, cleaning, and embarkation, are completed before the aircraft requests departure. During departure sequencing, pad allocation prioritizes landing aircraft when a landing queue exists and stands remain available; otherwise, departing aircraft taxi to an available pad and complete a one-minute takeoff process, with departures recorded through the Aircraft Takeoff counter to determine vertiport capacity over the simulation period. Figure 9 shows the algorithm diagram of one aircraft operating in the vertiport.
By modelling the operation as shown in Figure 9, the aircraft will only land if there is pad and stand available and will only take off if there is pad available and there is no landing queue or when the stand is full, to ensure usage of every stand. To make sure smooth aircraft movement on the ground (while taxiing) and avoid incursion between aircraft, specific rules and hold blocking are applied in the models simulated in this study depending on the topology and operational concept of the vertiport.
3.4.2. AnyLogic DES Model for Linear – Segregated Configuration
In this study, for segregated operation the Pad 1 is dedicated as landing pad and Pas 2 is dedicated as takeoff pad. With linear topology, the shared taxiway and the assignment of each pad to a dedicated operation type require the following conditions to be satisfied before a landing can be performed on Pad 1:
- Pad 1 is unoccupied (variable: pad1 == 0)
- At least one stand is available (variable: stand1+stand2+ … < totalstand)
Stand allocation is performed if the following condition is satisfied:
- At least one stand is available (variable: stand1+stand2+ … < totalstand)
- No aircraft occupying taxiway body (variable: taxi == 0)
After the aircraft finished time-based event of turnaround process and embarkation process, departure is performed as condition-based event with conditions to be satisfied:
- Pad 2 is available (variable: pad2 == 0)
- No aircraft occupying taxiway body (variable: taxi == 0)
- No empty stand while aircraft queue exists (variable: queue > 0 and stand1+stand2+ …< totalstand)
3.4.3. AnyLogic DES Model for Linear – Independent Configuration
The model for independent operation is like the segregated operation hence same topology; however, the pads are available for both landing and takeoff operation. Both pads are also connected to each stand. Therefore, different sets of rules are applied in the model to ensure no incursion exists in the aircraft ground movement during taxi operation. For the landing decision, these rules applied:
- If Pad 1 is available, aircraft should land in Pad 1.
- If Pad 1 is occupied and Pad 2 is available, aircraft should land in Pad 2.
- If both pads are occupied, aircraft perform hold maneuver until any pad is available.
Landing can be performed as condition-based event after the perquisites are satisfied:
- Any of the pads are available for landing (variable: pad1 == 0 or pad2 == 0)
- No movement of aircraft in taxi close to assigned landing pad (variable: taxi1 == 0 or taxi2 == 0)
- At least one stand is available (variable: stand1+stand2+ … < totalstand)
Each pad is connected to all stands. After completing ground operations and becoming ready for departure, an aircraft may take off from either Pad 1 or Pad 2, depending on pad availability at that time. A condition-based hold block is used to check pad availability prior to departure, while a selector block determines which pad is assigned for takeoff. During taxi-out, the aircraft movement updates the taxiway variable (taxi1 == 1 or taxi2 == 1), indicating occupancy of the respective taxiway segment depending on the assigned takeoff pad.
3.4.4. AnyLogic DES Model for Satellite Configuration
The model for satellite configuration is different from that of linear topology, as each pad in satellite topology only has access to nearby stand adjacent to the pad for the lack of taxiway. After landing on a given pad, the aircraft can only access and be allocated to the stands located on the same side of that pad, consistent with the aircraft movement layout shown in Figure 7. Similarly, during departure, the aircraft must take off from the same pad, as there is no taxiway connecting between the two pads. Landing as condition-based event is performed after these conditions are satisfied for Pad 1:
- Pad 1 is available and no movement on ground from or toward it (variable: taxi1 == 0)
- There is at least one empty stand on the side of Pad 1 (variable: standside1 < 0.5*totalstand)
Similar conditions are applied with the landing operation for Pad 2. Accordingly, aircraft movement to and from the stand updates the corresponding taxiway state variable (taxi1 == 1 or taxi2 == 1) based on the pad used for taxi-in and taxi-out operations. The two taxiways are modeled as independent resources, with no interaction between them. Aircraft departure operations can only be performed from the pad located closest to the aircraft’s assigned stand. A condition-based hold block is used to determine whether the aircraft is cleared for takeoff, subject to the following conditions for Pad 1 or Pad 2:
- Pad 1 is available and no movement on taxiway adjacent to Pad 1 (variable: pad1 == 0 and taxi1 == 0), then aircraft from adjacent stands can take off to Pad 1.
- Pad 2 is available and no movement on taxiway adjacent to Pad 2 (variable: pad2 == 0 and taxi2 == 0), then aircraft from adjacent stands can take off to Pad 2.
3.5. Simulation Parameter
The vertiport was modeled using a FIFO (First-In, First-Out) logic for each predefined configuration to ensure that no operational overlap occurred in the use of critical vertiport attributes, such as pads, stands, and taxiways. After constructing the block-diagram model in AnyLogic, simulations were executed under several parameter variations.
Firstly, the initial simulations were conducted under deterministic conditions, where turnaround time (TAT) is constant for every aircraft. Table 8 contains the operation parameter of the vertiport. Prior to varying TAT, arrival interval variations were first tested to identify the most critical arrival interval for the two-pad vertiport. Using this critical arrival interval, TAT variations were then applied to each simulation model.
Secondly, stochastic simulations were conducted to evaluate the impact of uncertain and variable aircraft turnaround times on vertiport capacity, providing a more realistic representation of expected operational conditions. The stochastic modeling was implemented in AnyLogic by introducing randomness into the turnaround time parameters of every aircraft for every run of every simulation model. Random variation was applied to the TAT values using a triangular distribution, as illustrated in Figure 10.
In this study, randomness of ± 5 minutes is given to each variation of turnaround time (TAT) of each aircraft operation simulated within the AnyLogic as a representation of real-world aircraft operation where each operating aircraft may not have identical TAT as it is highly influenced by airline plan and policies, routes being served, or other technical or business decisions different for each aircraft. The simulation was iterated 100 times for every model and average data of each model is analyzed and compared to its deterministic TAT result.
4. Simulation Results and Discussion
The simulation was conducted over a 120-minute period for three vertiport models based on configuration and operational concept: Linear–Segregated, Linear–Independent, and Satellite. For each configuration, the number of stands was varied to examine the effect of number of stands on vertiport capacity. Turnaround time (TAT) was also varied to evaluate model performance under different operational durations. Vertiport performance was primarily assessed through capacity, defined as the number of aircraft served and departed within a given time horizon. Additional performance indicators included queue length, total pad utilization, total stand utilization, and the capacity-to-footprint ratio to evaluate spatial efficiency. To approximate real-world operating conditions, stochastic simulations were also performed by introducing randomness into the turnaround time.
4.1. Model Verification
Verification of aircraft operations within the vertiport simulation was first conducted to ensure that the implemented model accurately followed the operational algorithm previously defined. To support this process, data from 10 agents representing aircraft were recorded across each operational phase for every model, including landing, taxi-in, turnaround, taxi-out, and take-off. Figure 11 shows visualization of recorded data in 1-minute interarrival time and a 5-minute turnaround time for 10 aircraft within the linear-segregated vertiport configuration.
The horizontal axis represents time in minutes, while the vertical axis indicates the operational status of each aircraft. Horizontal lines show each aircraft’s process durations, and vertical transitions indicate aircraft movement between operational phases. From the recorded data, the 10 sampled aircraft land on Pad 1, taxi in sequentially to the available stands, complete their turnaround process, and then taxi out. Departures occur sequentially from Pad 2. The duration of each phase was cross-checked against the model algorithm and designed parameters. Based on this verification process, all simulation models are confirmed to operate in accordance with the predefined vertiport operational algorithm.
4.2. Interarrival Time Variation
To determine the arrival interval as the initial input parameter, simulations were conducted using varying arrival intervals. The objective was to identify the interval that would generate queues across all vertiport configurations, thereby serving as the operational limiting parameter for a two-pad vertiport. By establishing this critical arrival interval, each of the vertiport configurations tested could demonstrate its maximum capacity at a given turnaround time. The simulation was performed using the largest vertiport model: Linear configuration with 10 stands, and the shortest turnaround time of 5 minutes, shown in Figure 12.
It can be observed that a 1-minute arrival interval results in 50 aircraft served under the segregated operational concept and 73 aircraft under the independent concept. At this interval, landing queues reach 60 aircraft in the segregated configuration and 38 aircraft in the independent configuration. When the arrival interval is increased to 2 minutes, the queue is reduced to 3 aircraft in the segregated concept and is eliminated in the independent concept. In general, increasing the arrival interval leads to a decrease in capacity, except for the linear–segregated configuration between the 1- and 2-minute intervals. In this case, capacity increases from 50 aircraft at a 1-minute interval to 52 aircraft at a 2-minute interval. To investigate this phenomenon, detailed data collection and stand-level observations were conducted during the simulation process, shown in Figure 13.
At a 1-minute arrival interval, no aircraft departed from stands 1–4, whereas at a 2-minute interval, no aircraft departed from stands 5–6. The utilization graph shows that at the 1-minute interval, stands 1–4 was heavily occupied (96–99% utilization), while at the 2-minute interval, stands 5–6 recorded 0% utilization. This indicates that at the 1-minute arrival interval, stands 1–4 was occupied by aircraft unable to perform taxi-out due to tightly sequenced aircraft movements. Based on the vertiport layout, stands 1–4 are located farthest from pad 2 (used for departures), giving them the lowest departure priority; with a 5-minute TAT, these stands did not receive departure opportunities. In contrast, at the 2-minute arrival interval, stands 5–10 showed zero throughput and 0% utilization, indicating that they were not used and that capacity was constrained by the operational concept and arrival interval rather than stand availability.
Three queues were observed due to taxiway entry and exit conflicts, since in the linear–segregated configuration the taxiway is restricted to one aircraft at a time to prevent incursion. From a 3-minute arrival interval onward, no queues were observed in either operational concept, indicating that arrival interval becomes the dominant capacity constraint. Therefore, the critical limiting parameter for subsequent simulations was determined to be a 1-minute arrival interval, as this condition consistently generates queues across all vertiport configurations and reveals maximum capacity behavior.
4.3. Vertiport Capacity on Stand and Turnaround Time Variation
The results of the vertiport simulations with a 1-minute arrival interval and deterministic turnaround times are presented in Figure 14, Figure 15 and Figure 16. Three vertiport models were simulated: a linear configuration with a segregated operating concept, a linear configuration with an independent operating concept, and a satellite configuration. For each model, the number of stands was varied to evaluate its impact on vertiport performance, using indicators such as vertiport capacity, landing queue length, pad utilization percentage, and stand utilization percentage. Simulations were conducted with turnaround times of 5, 10, 15, 20, 25, and 30 minutes to assess the performance of each configuration under different operating conditions, with a total simulation duration of 120 minutes.
For all configurations with a 5-minute turnaround time, the vertiport with 6 stands produced the highest capacity. The linear–segregated configuration achieved a maximum capacity of 73 aircraft, while both the linear–independent and satellite configurations reached a maximum of 77 aircraft. For the linear–segregated and satellite configurations, the lowest capacity was observed in the 4-stand layout.
A different trend appears in the linear–segregated configuration, where the lowest capacity occurs in the 10-stand layout. With a 5-minute turnaround time, aircraft movements become highly compressed. Due to departure priority being assigned to stands closest to the pad, several distant stands are unable to perform taxi-out operations, reflected in increased average stand utilization. The most significant impact is observed in the linear–segregated configuration, with a capacity reduction of up to 31.5% in the 10-stand variant, driven by limited departure flexibility since take-offs are restricted to Pad 2. The simulation shows that increasing the number of stands under short turnaround times does not increase capacity; instead, it reduces it due to longer aircraft and passenger movement distances.
At a 10-minute turnaround time, the linear–independent and satellite configurations achieve their highest capacity with 10 stands, while the linear–segregated configuration performs best with 8 stands. The linear–segregated configuration yields 58 aircraft, the linear–independent 67 aircraft, and the satellite configuration 69 aircraft. In the linear–segregated 10-stand case, delays at distant stands remain evident due to queuing on the shared taxiway, indicated by decreased pad utilization and increased average stand utilization compared to the 8-stand variant.
For turnaround times between 15 and 30 minutes, increasing the number of stands consistently increases maximum capacity, indicating that stand availability becomes the primary limiting factor under longer turnaround conditions. This is supported by lower average pad utilization relative to stand utilization. Adding stands results in capacity increases of up to 120% in the 10-stand variant compared to the 4-stand layout. However, increasing turnaround time from 15 to 30 minutes reduces maximum capacity across all configurations with the same number of stands. The observed capacity reductions range from 6–28% for linear–segregated, 9–22% for linear–independent, and 11–28% for satellite configurations, depending on the stand variant.
The vertiport simulations evaluate performance primarily in terms of capacity, supported by additional indicators including aircraft queue length, pad utilization, and stand utilization. Two vertiport topologies were assessed: linear and satellite. The linear topology was examined under two operational concepts: segregated and independent. In the linear configuration, each pad has access to all stands, while the independent concept allows simultaneous landing and take-off operations on both pads. Comparative analysis was conducted to assess the overall performance of each configuration, as shown in Figure 17.
The linear–independent configuration performs best at 4 stands (163 aircraft served) and 6 stands (229 aircraft served) and consistently produces the lowest total landing queues across all stand variations. The satellite configuration outperforms the others at higher stand counts, achieving 266 aircraft at 8 stands and 298 aircraft at 10 stands. In contrast, the linear–segregated configuration yields the lowest total throughput for every stand variation.
Pad utilization is also highest in the linear–independent configuration across all cases. This confirms that operational flexibility where each pad can independently accommodate both landings and departures, and all stands are connected to both pads directly enhances capacity. Conversely, in the linear–segregated configuration, shared taxiway constraints and departure prioritization lead to stand access delays, and under short turnaround times, some stands are unable to perform taxi-out operations. As a result, the linear–segregated configuration consistently produces lower capacity than the linear–independent configuration for all stand scenarios, as shown in Table 9.
This finding is further supported by the larger landing queues observed in the linear–segregated configuration. Dedicating one pad exclusively to either landing or departure reduces operational flexibility and leads to lower overall effectiveness compared with the independent concept, where each pad can accommodate both operations depending on real-time demand. This limitation becomes more pronounced at higher stand counts, where flexibility is critical to maintaining throughput. For the satellite configuration, the 4-stand variant performs worst among all models, serving only 158 aircraft. This is attributable to its layout, in which each pad is connected only to its adjacent stands, limiting cross-accessibility. However, performance improves substantially as the number of stands increases.
At higher stand counts, the satellite layout benefits from more favorable spatial relationships among pads, stands, and the terminal, resulting in shorter aircraft taxi distances and reduced passenger walking times compared with the linear configuration. These geometric efficiencies positively affect capacity. Therefore, the simulation results indicate that the satellite configuration becomes increasingly advantageous as number of stands increase.
4.4. Vertiport Capacity on Stochastic Turnaround Time
Stochastic variability was introduced to the turnaround time (TAT) using a triangular distribution of ±5 minutes around each deterministically simulated TAT value. The arrival interval was fixed at 1 minute to represent the critical demand condition, while stand capacity was varied across 4, 6, 8, and 10 stands to evaluate its impact under stochastic operations. The results are shown in Figure 18, Figure 19 and Figure 20.
The introduction of stochastic variability in turnaround time produced results consistent with those obtained under deterministic TAT assumptions, both with respect to the effect of increasing the number of stands and the effect of longer turnaround times. For all configurations, increasing the turnaround time results in a reduction in maximum vertiport capacity. However, within the turnaround time range of 15 to 30 minutes, increasing the number of stands leads to an increase in maximum vertiport capacity.
Under a stochastic turnaround time (TAT) of 5 minutes, all configurations and stand variants experienced a reduction in capacity due to randomness. The maximum capacity was achieved by the linear–independent configuration (74 aircraft) and the satellite configuration (75 aircraft), both with 8 stands, while the linear–segregated configuration reached a maximum of 69 aircraft with 6 stands. At a stochastic TAT of 10 minutes, similar delays were observed in the linear–segregated configuration, particularly in the 10-stand variant, which exhibited a capacity decline; this effect was not observed in the linear–independent or satellite configurations.
For stochastic TATs ranging from 15 to 30 minutes, a substantial performance degradation was observed across all stand variants, characterized by increased landing queues, reduced pad utilization, and higher stand utilization. Overall, the stochastic results are consistent with the deterministic findings: increasing TAT reduces capacity within a fixed operating period, while increasing the number of stands enhances capacity at a given TAT. The aggregate performance results under stochastic turnaround conditions are presented in Figure 21.
For the 4-stand configuration, the linear–independent vertiport demonstrates the highest performance, serving 163 aircraft, followed closely by the linear–segregated configuration with 159 aircraft and the satellite configuration with 157 aircraft. With 6 stands, the linear–independent configuration again achieves the highest capacity (225 aircraft served), outperforming the satellite configuration (221 aircraft) and the linear–segregated configuration (215 aircraft). This result is consistent with the queue length and pad utilization metrics, where the linear–independent configuration exhibits the shortest total queues and the highest pad utilization among all configurations. A different trend emerges for the 8-stand variant, where the satellite configuration slightly outperforms the linear–independent configuration (267 vs. 265 aircraft served). Although the satellite configuration does not yield the lowest queue length, its spatial arrangement of pads and stands appears to enhance aircraft and passenger movement efficiency within the vertiport.
For the 10-stand configuration, the satellite layout achieves the highest overall capacity (296 aircraft), followed by the linear–independent configuration (292 aircraft). In contrast, the linear–segregated configuration performs substantially worse (248 aircraft), primarily due to limited operational flexibility in taxiway usage and constrained landing and take-off allocation.
Table 9.
Comparison between operational concepts.
| Configuration | Vertiport Capacity (aircraft) | |||
| Deterministic TAT | 4 Stands | 6 Stands | 8 Stands | 10 Stands |
| Linear-Segregated | 160 | 221 | 242 | 249 |
| Linear-Independent | 163 | 229 | 265 | 297 |
| Satellite | 158 | 225 | 266 | 298 |
| Stochastic TAT | 4 Stands | 6 Stands | 8 Stands | 10 Stands |
| Linear-Segregated | 159 | 215 | 244 | 248 |
| Linear-Independent | 163 | 225 | 265 | 292 |
| Satellite | 157 | 221 | 267 | 296 |
| Capacity Change | 4 Stands | 6 Stands | 8 Stands | 10 Stands |
| Linear-Segregated | - 0.6% | -2.7% | 0.8% | -0.4% |
| Linear-Independent | 0% | -1.7% | 0% | -1.7% |
| Satellite | -0.6% | -1.8% | 0.4% | -0.7% |
Table 9 presents a comparison of vertiport capacity under deterministic and stochastic turnaround time (TAT). Across most configurations and stand variants, the introduction of stochasticity in TAT results in a slight reduction in capacity. The largest decline (2.7%) occurs in the linear–segregated configuration with 6 stands, indicating lower robustness to turnaround time variability. In contrast, the linear–independent configuration demonstrates greater resilience to stochastic effects, attributable to its operational flexibility in pad allocation. An exception is observed in the 8-stand configuration, where stochastic TAT produces comparable or marginally improved performance. Capacity increases of 0.8% for the linear–segregated configuration and 0.4% for the satellite configuration are observed, suggesting that moderate variability may, in certain layouts, reduce operational blocking and improve flow efficiency.
4.5. Footprint Considerations on Vertiport Capacity
Vertiport footprint is a critical parameter in comparing alternative topologies, particularly given that vertiports are expected to be deployed in densely built urban environments with significant structural constraints. Accordingly, this study evaluates the ratio of total vertiport area to the number of aircraft served for each configuration and operational concept, as presented in Figure 22. This metric provides an indication of spatial efficiency alongside operational performance.
For the 4-stand configuration, the satellite topology yields the smallest area per aircraft served, at 39.9 m² per aircraft, outperforming both the linear–segregated and linear–independent configurations. This indicates that the satellite stand arrangement is spatially more efficient than the linear layout, which requires an interconnecting taxiway between pads. For the 6-stand configuration, the satellite vertiport again demonstrates the highest spatial efficiency, with the smallest area per aircraft served at 45.5 m² per aircraft, outperforming both the linear–segregated and linear–independent configurations.
For the 8-stand configuration, the linear–independent layout achieves the smallest area per aircraft served which is 48.8 m² per aircraft, making it the most space-efficient option at this scale. In contrast, the spatial efficiency of the satellite topology decreases for 6 and 8 stands due to safety constraints: stands must be positioned farther from the pads to comply with EASA requirements, including dual approach and departure surfaces separated by 180° and restrictions against placing stands beneath these protected surfaces.
For the 10-stand configuration the satellite topology requires 62.8 m² per aircraft served, substantially larger than the linear–independent layout at 50.8 m² per aircraft. This indicates that at a 1-minute arrival interval and a stand-to-pad ratio greater than 3, the satellite configuration is less space-efficient than the linear–independent topology. For 10 stands, the linear–segregated layout is also more space-efficient than the satellite configuration, suggesting that linear topologies are preferable at higher stand numbers. However, within the linear layouts, the segregated concept consistently requires a larger area per aircraft served than the independent concept, consistent with earlier capacity results showing lower maximum throughput. The limited pad flexibility in the segregated concept leads to operational delays at several stands, reducing overall efficiency.
5. Conclusions
The simulation results demonstrate that vertiport performance is strongly influenced by the number of stands, layout, and turnaround time (TAT). At short TAT (5 minutes), aircraft movements become highly congested, causing taxi-out delays and rendering additional stands ineffective; maximum capacity reached 77 aircraft for the linear–independent and satellite configurations (6 stands). As TAT increases, capacity decreases across all layouts (6–28% reduction between 15–30 minutes), whereas increasing the number of stands significantly improves capacity at longer TAT, with gains of up to 100–120% from 4 to 10 stands.
Across all stand variations, the linear–independent concept consistently outperforms the linear–segregated configuration, with capacity advantages ranging from 1.9% (4 stands) to 19.3% (10 stands). This confirms the operational benefit of allowing both pads to handle arrivals and departures flexibly, particularly under dense traffic (1-minute arrival interval). Stochastic TAT simulations show trends consistent with deterministic results: longer TAT reduces capacity, additional stands increase capacity, and overall capacity slightly declines under stochastic conditions, with the largest drop (2.7%) observed in the linear–segregated configuration (6 stands).
When spatial efficiency is considered, the optimal configuration depends on stand number. The satellite layout performs best at 4 and 6 stands, while the linear–independent layout becomes superior at 8 and 10 stands, demonstrating up to 22% better performance than other configurations at 10 stands. Without considering footprint, linear–independent yields the highest capacity at 4 and 6 stands (163 and 229 aircraft), whereas the satellite configuration performs best at 8 and 10 stands (266 and 299 aircraft).
This study developed a two-pad vertiport operational model using a Discrete Event Simulation (DES) approach to represent aircraft movements from landing through turnaround to takeoff, enabling evaluation of the relationships among design variables (number of pads and stands), operational parameters (arrival interval and turnaround time), throughput capacity, and queue formation. The FIFO-based control logic implemented in AnyLogic, including fixed pad and stand allocation priorities, revealed operational limitations under short arrival intervals and stochastic turnaround conditions, particularly in shared taxiway scenarios. Results indicate the need for future research focusing on analytical modeling of capacity and design correlations, optimization through priority-based control strategies, incorporation of diversion procedures to manage excessive queues, and extension toward multi-vertiport network modeling within an integrated AAM ecosystem.
References
- Patterson, M. P. Advanced Air Mobility (AAM): An Overview and Brief History. In Proceedings of the Transportation of Engineering and Safety Conference, Online, United States, 8-10 December 2021. [Google Scholar]
- Garrow, L.A. A Proposed Taxonomy for Advanced Air Mobility. AIAA AVIATION 2022 Forum, Chicago, IL & Virtual, 2022; American Institute of Aeronautics and Astronautics. [Google Scholar] [CrossRef]
- Garrow, L.A.; German, B.J.; Caroline, L.E. Urban air mobility: A comprehensive review and comparative analysis with autonomous and electric ground transportation for informing future research. Transport Research Part C: Emerging Technologies 2021, 132(1). [Google Scholar] [CrossRef]
- Boeing – Wisk Aero. Concept of Operations for Uncrewed Urban Air Mobility., 1st ed; The Boeing Company: Seattle, United States, 2023. [Google Scholar]
- Vascik, P. D.; Hansman, R. J. Development of vertiport capacity envelopes and analysis of their sensitivity to topological and operational factors. AIAA SciTech 2019 Forum, Chicago, IL & Virtual, 2019; American Institute of Aeronautics and Astronautics. [Google Scholar] [CrossRef]
- Zelinksi, S. Operational Analysis of Vertiport Surface Topology. IEEE 39th Digital Avionics Systems Conference (DASC), San Antonio, Texas, United States, 11 – 15 October 2020; pp. 1–10. [Google Scholar]
- Zhang, H.; Li, J.; Fei, Y.; Deng, C.; Yi, J. Capacity Assessment and Analysis of Vertiports Based on Simulation. Sustainability 2023, 15(18), 13377. [Google Scholar] [CrossRef]
- Rimjha, M.; Trani, A.; Tech, V. Urban Air Mobility: Factors Affecting Vertiport Capacity. Integrated Communications Navigation and Surveillance Conference (ICNS), Dulles, VA, USA, 2021; pp. 1–14. [Google Scholar] [CrossRef]
- Wille, E. Comparing The Capacity of Different Vertiport Topologies Using Discrete Event Simulation. 34th ICAS Congress, 2024; International Council of Aeronautical Sciences: Florence, Italy. [Google Scholar]
- Qarni, R. Analysis Of Configuration On Vertiport Capacity Using Discrete Event Simulation Approach Bandung Institute of Technology. Master’s Thesis, Bandung, Indonesia, 15 August 2025. [Google Scholar]
- European Union Aviation Safety Agency. Prototype Technical Specifications for the Design of VFR Vertiports for Operation with Manned VTOL-Capable Aircraft Certified in the Enhanced Category (PTS-VPT-DSN); European Union Aviation Safety Agency: Cologne, Germany, March 2022. [Google Scholar]
- European Union Aviation Safety Agency. Special Condition for small-category VTOL-capable aircraft Issue 2 (SC-VTOL-02); European Union Aviation Safety Agency: Cologne, Germany, June 2024; p. 12. [Google Scholar]
- Young, S. B. Evaluation of Pedestrian Walking Speeds in Airport Terminals. Transportation Research Record: Journal of the Transportation Research Board. 1999, 1674(1), 20–26. [Google Scholar] [CrossRef]
Figure 1.
Two-pad vertiport design workflow.
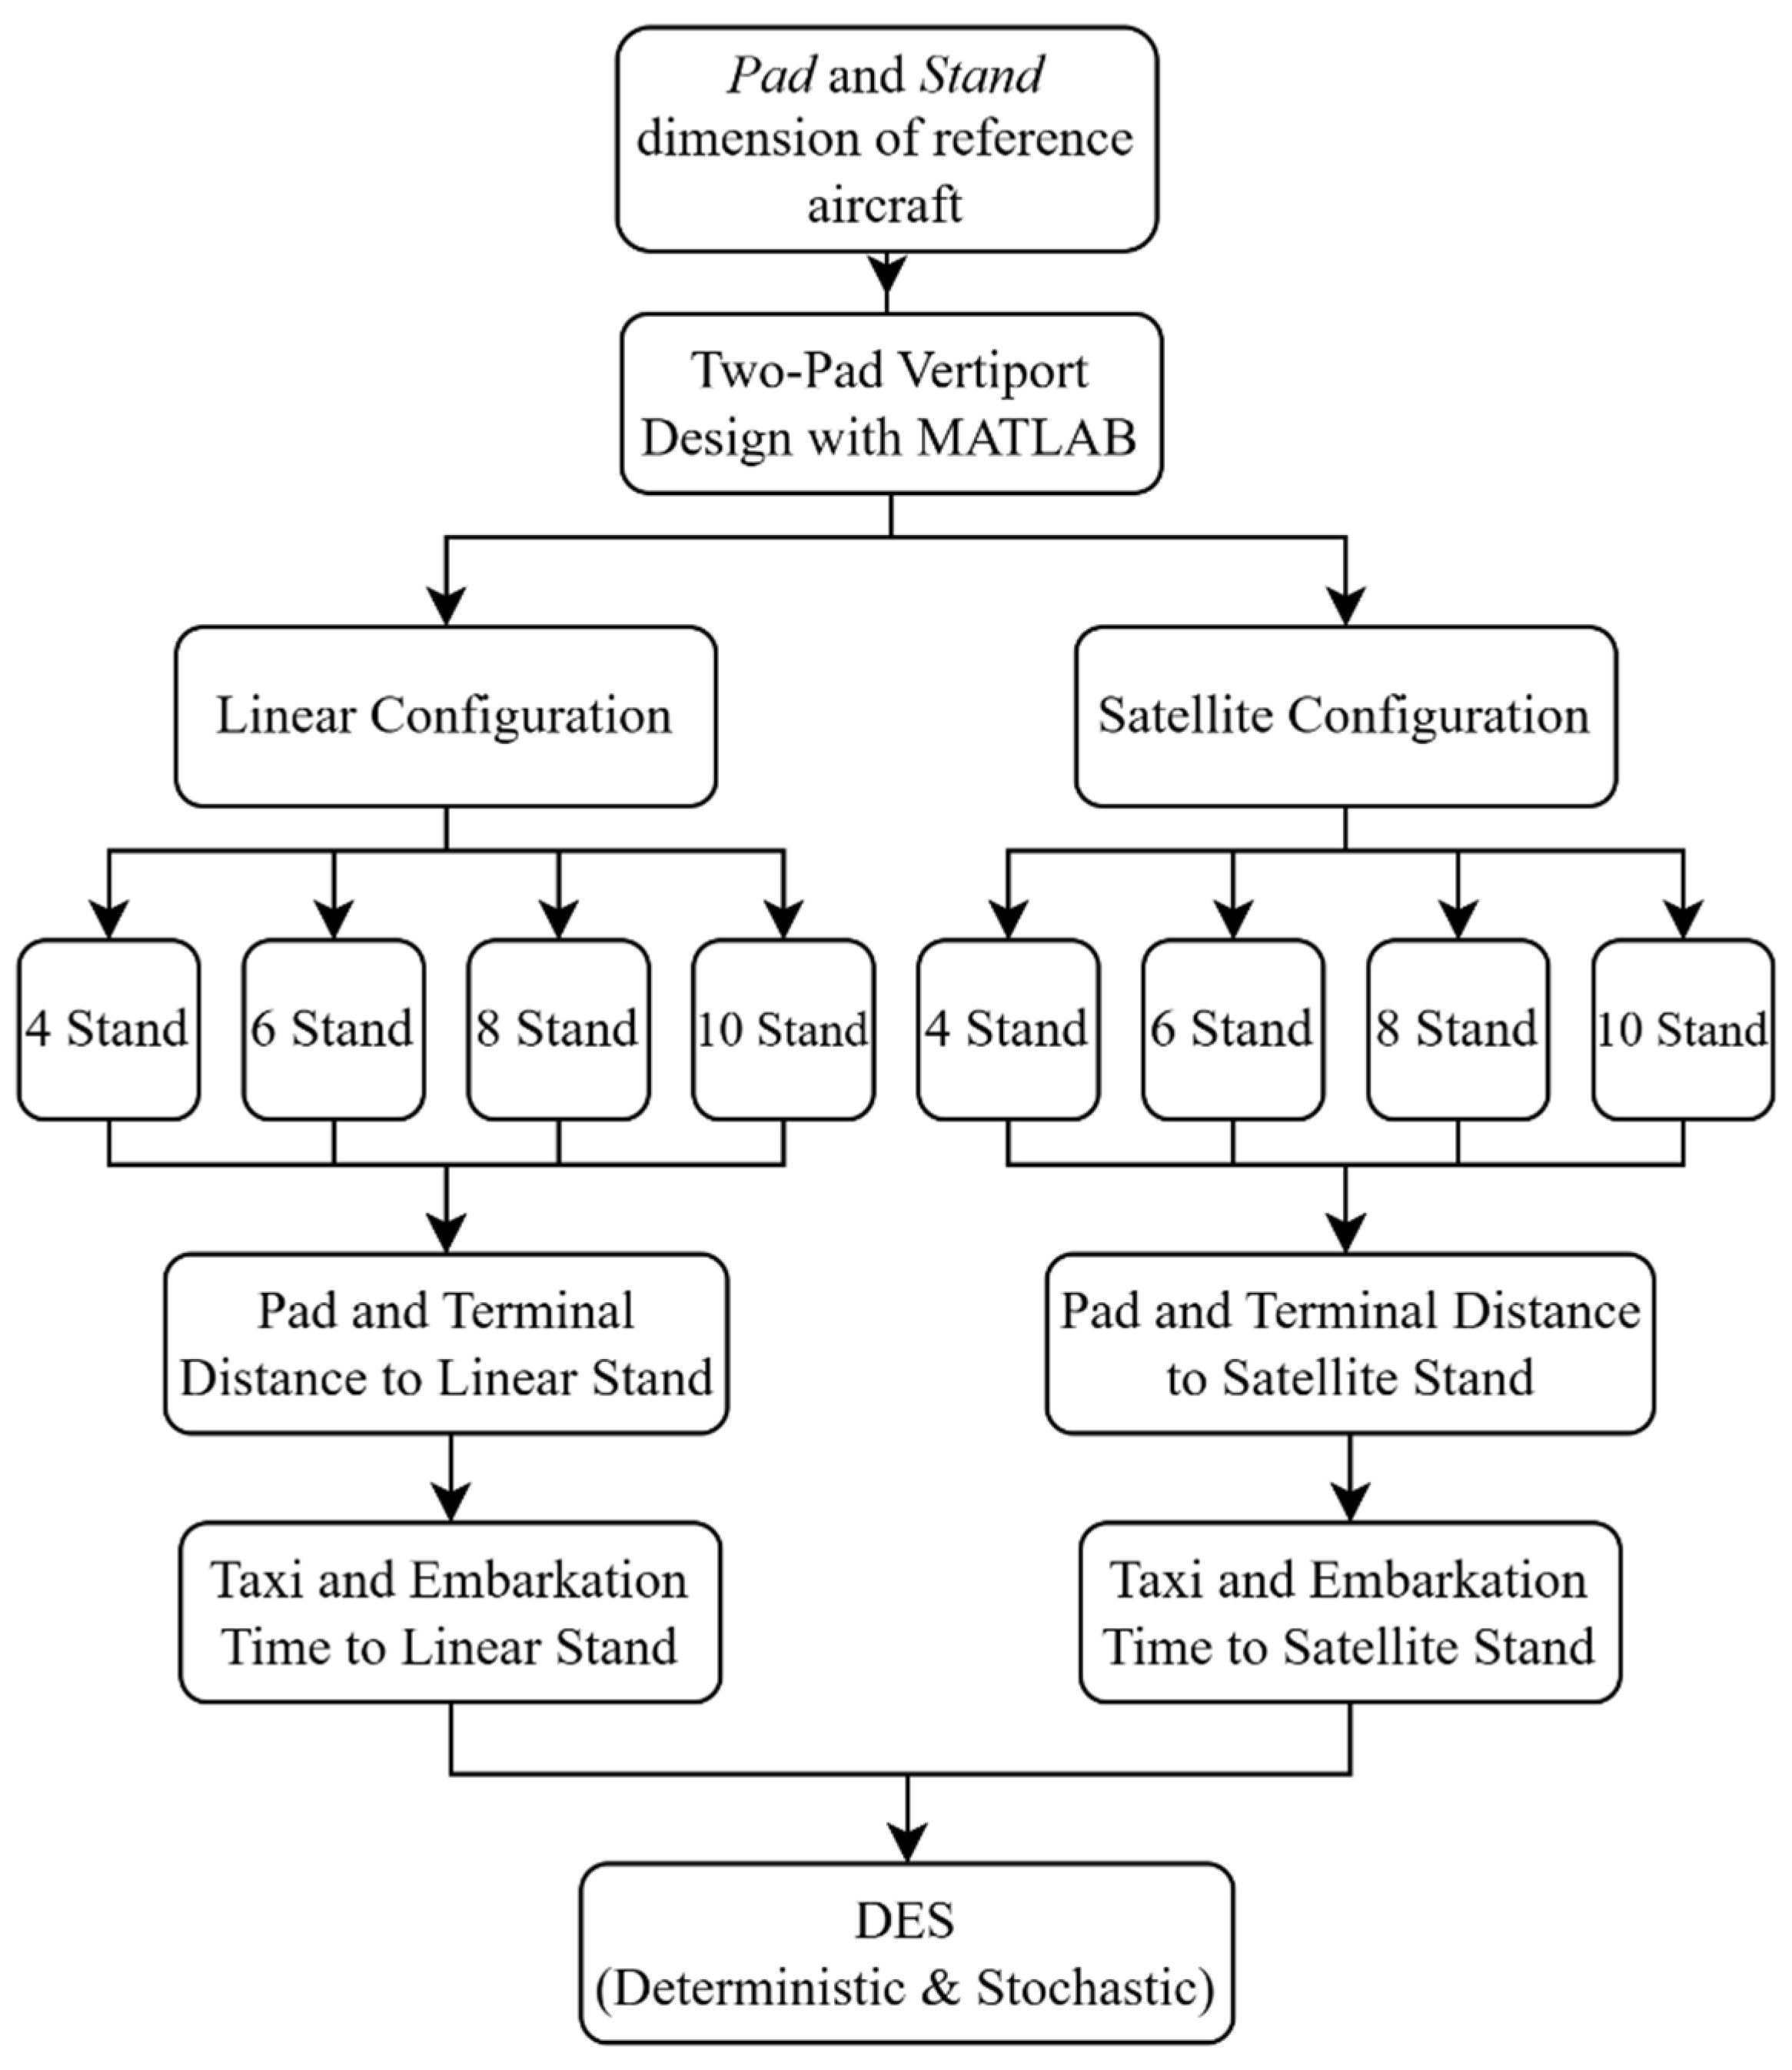
Figure 2.
Vertiport attributes [11].
Figure 2.
Vertiport attributes [11].
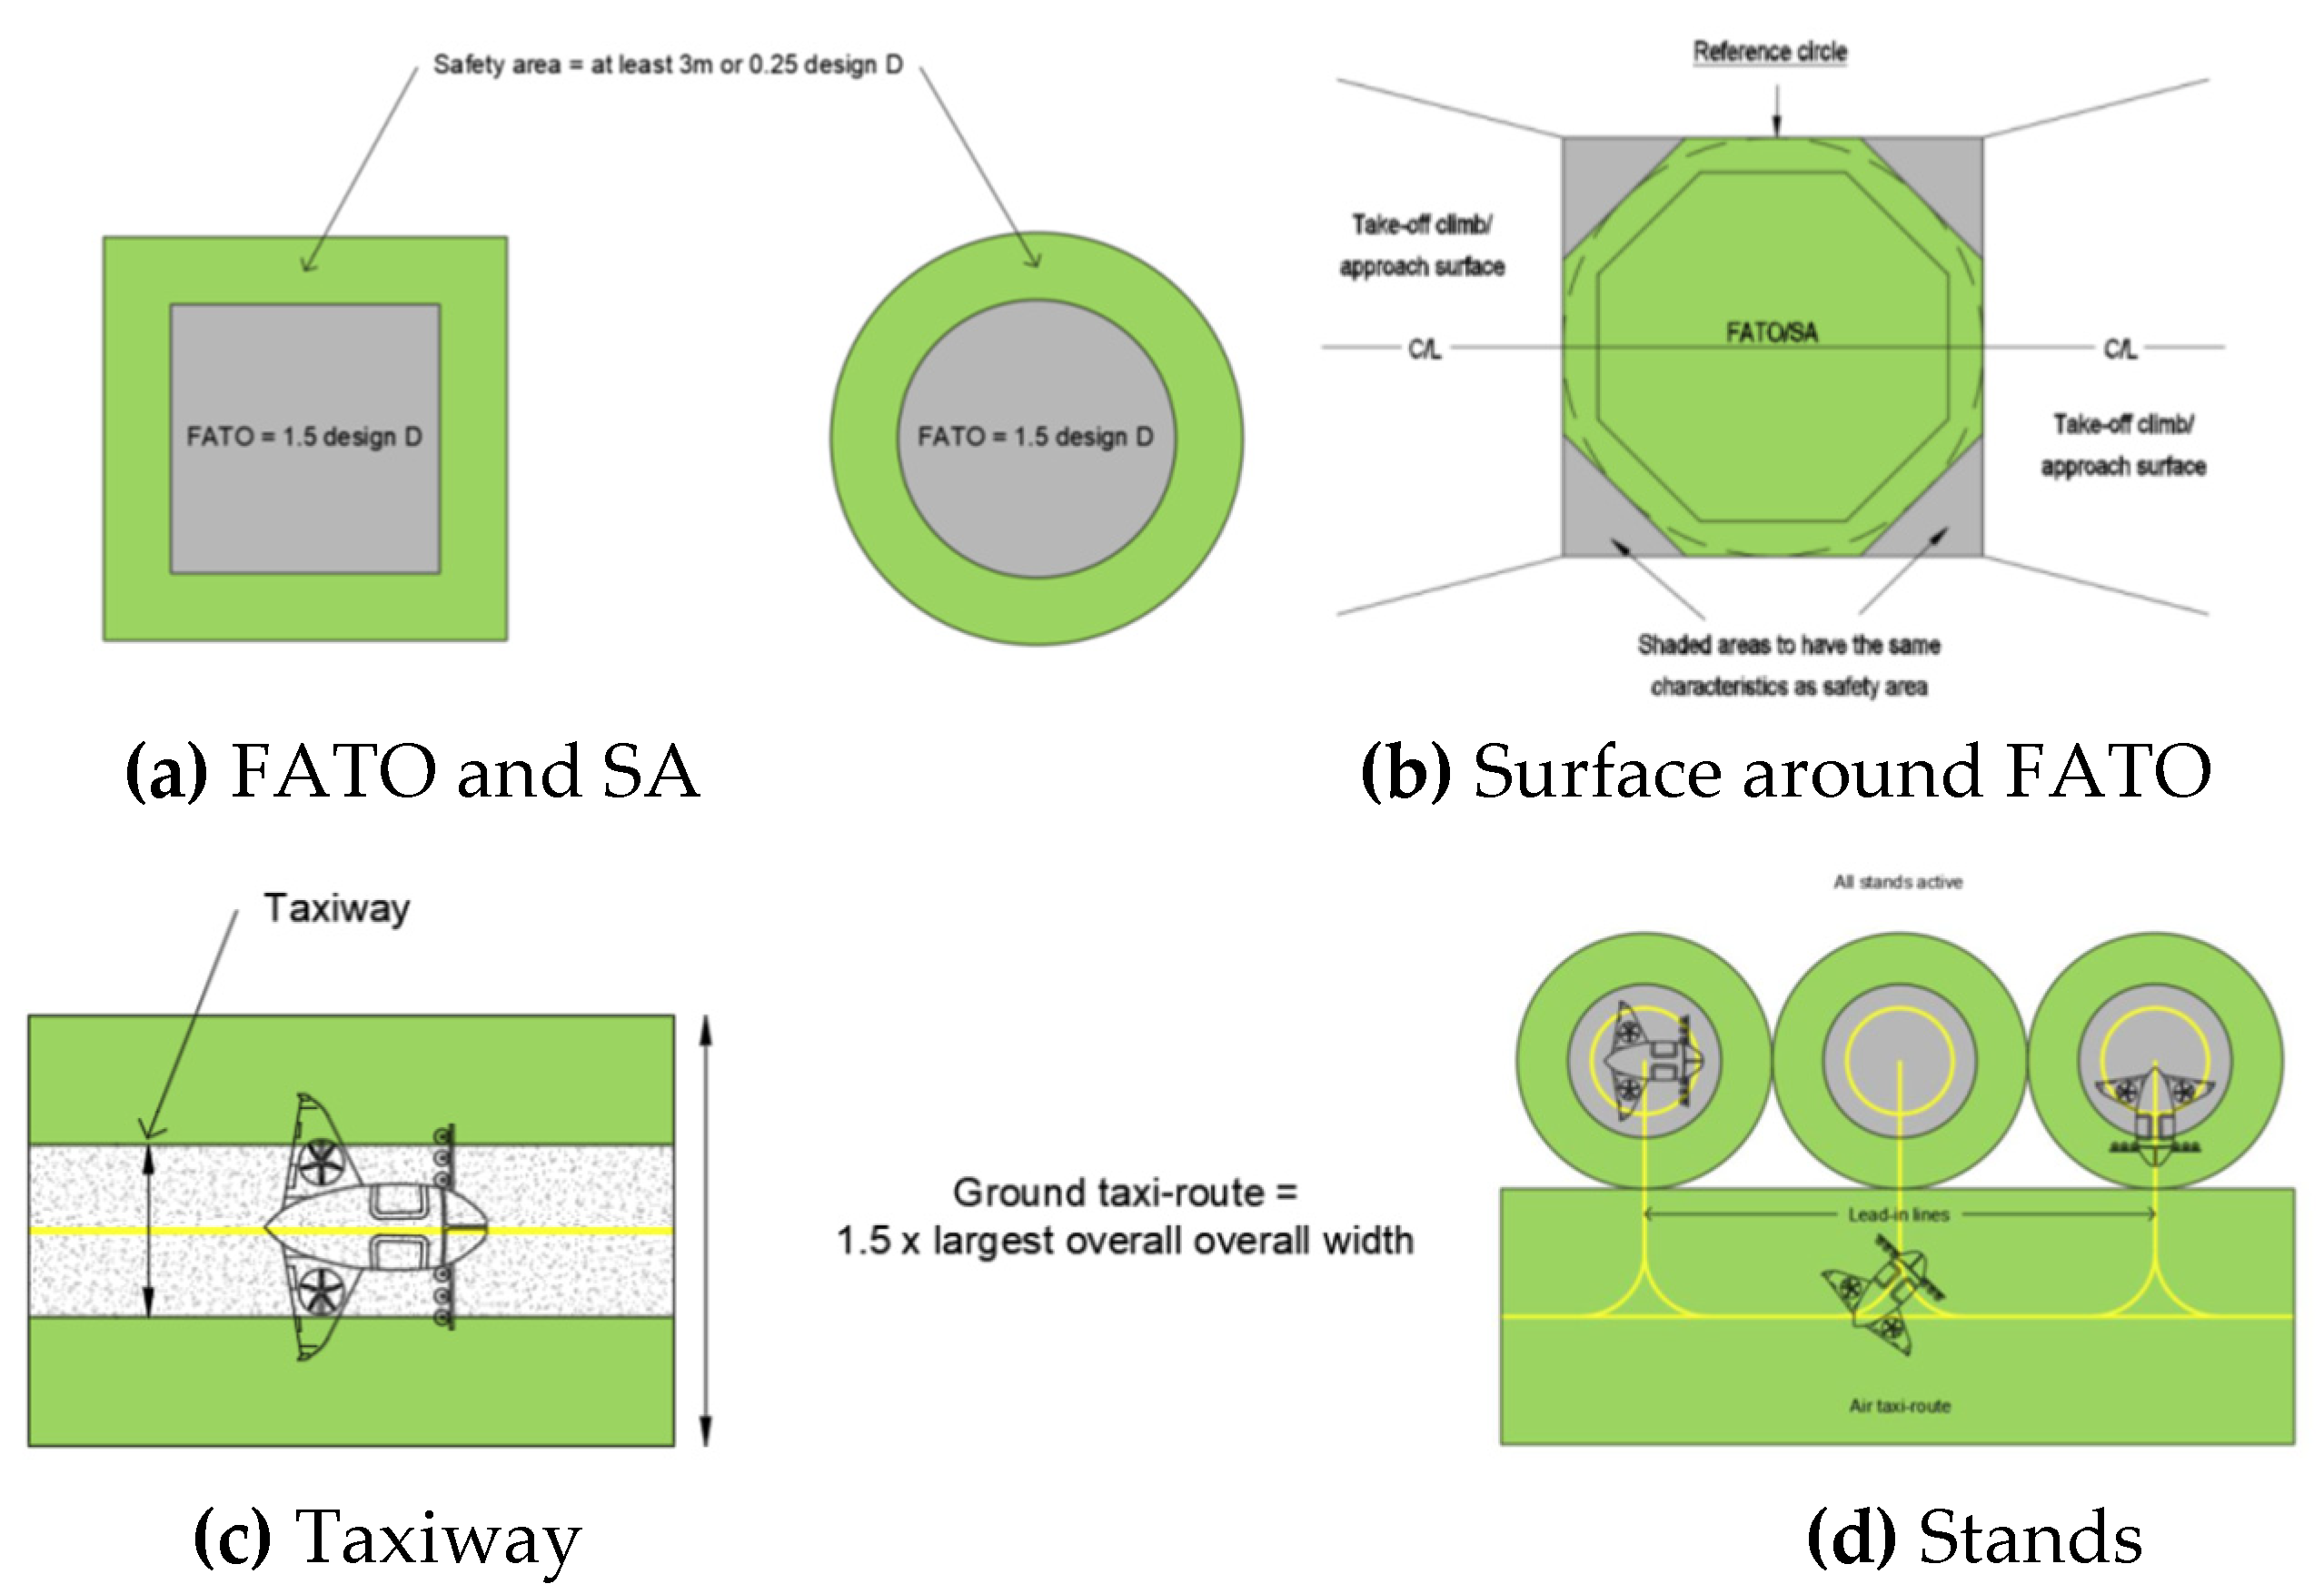
Figure 3.
Linear vertiport design with increasing number of pads.
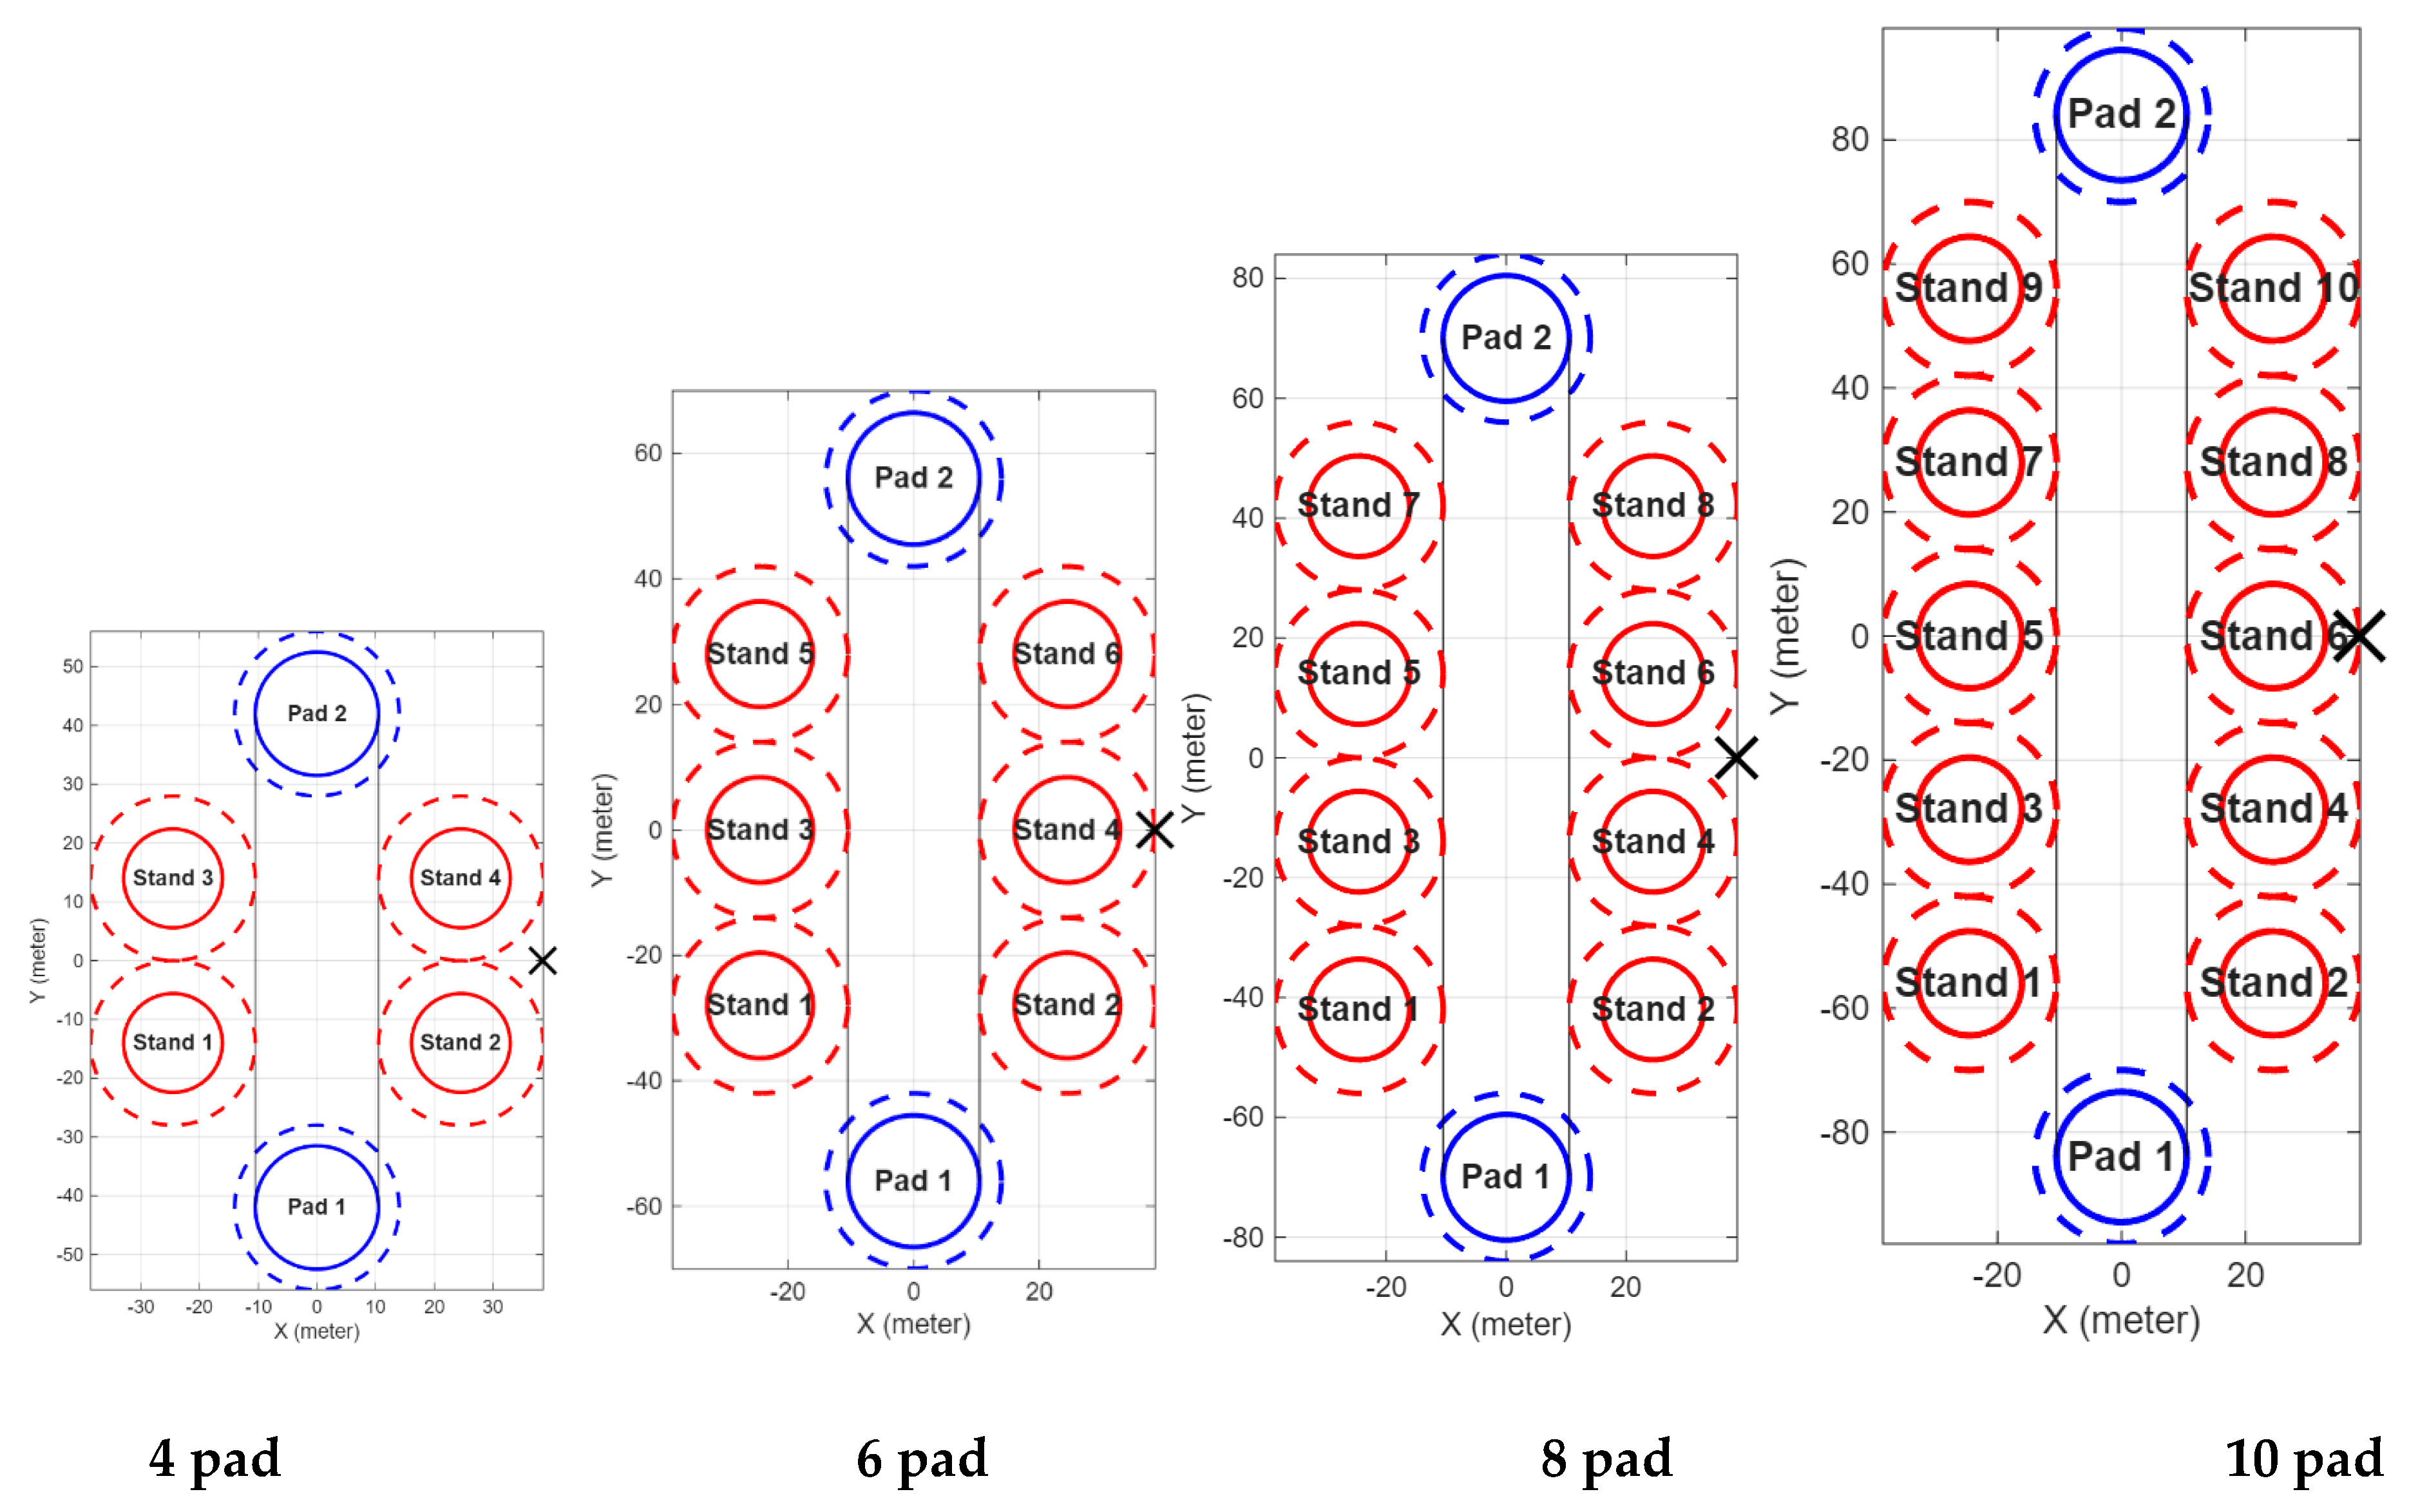
Figure 4.
Satellite vertiport design with increasing number of pads.
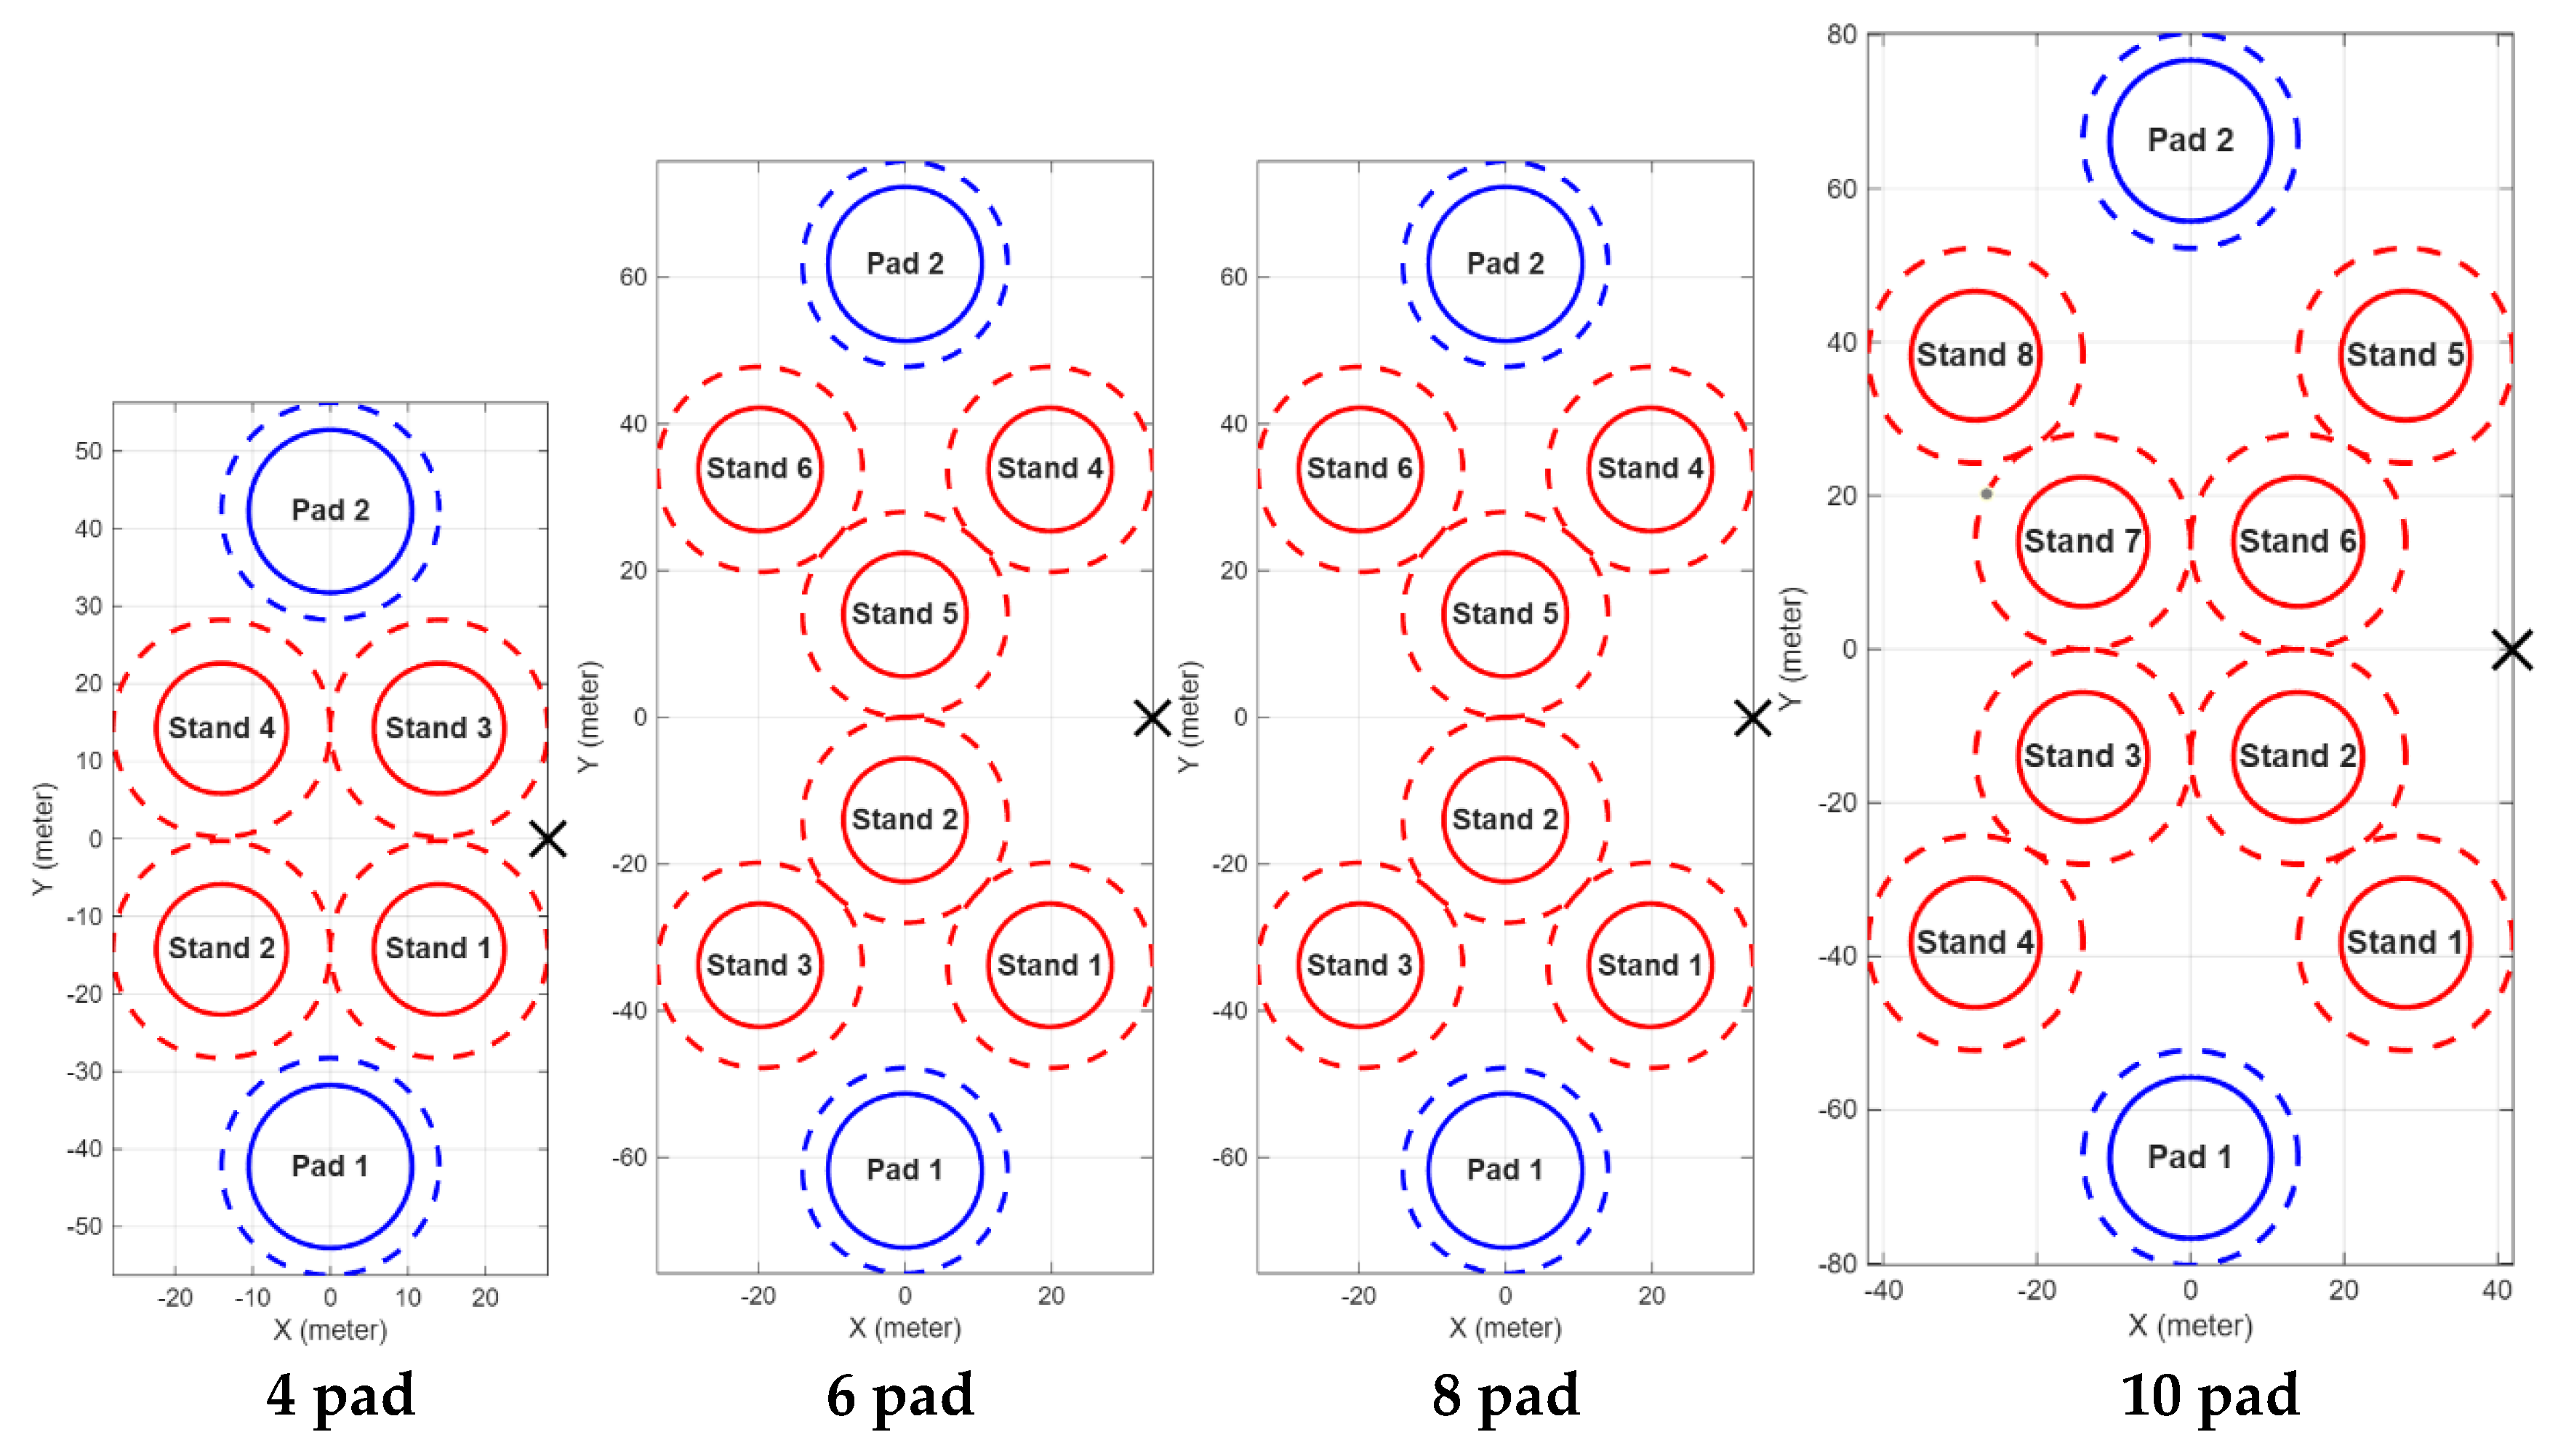
Figure 5.
Operation of vertiport, simplified for one aircraft.
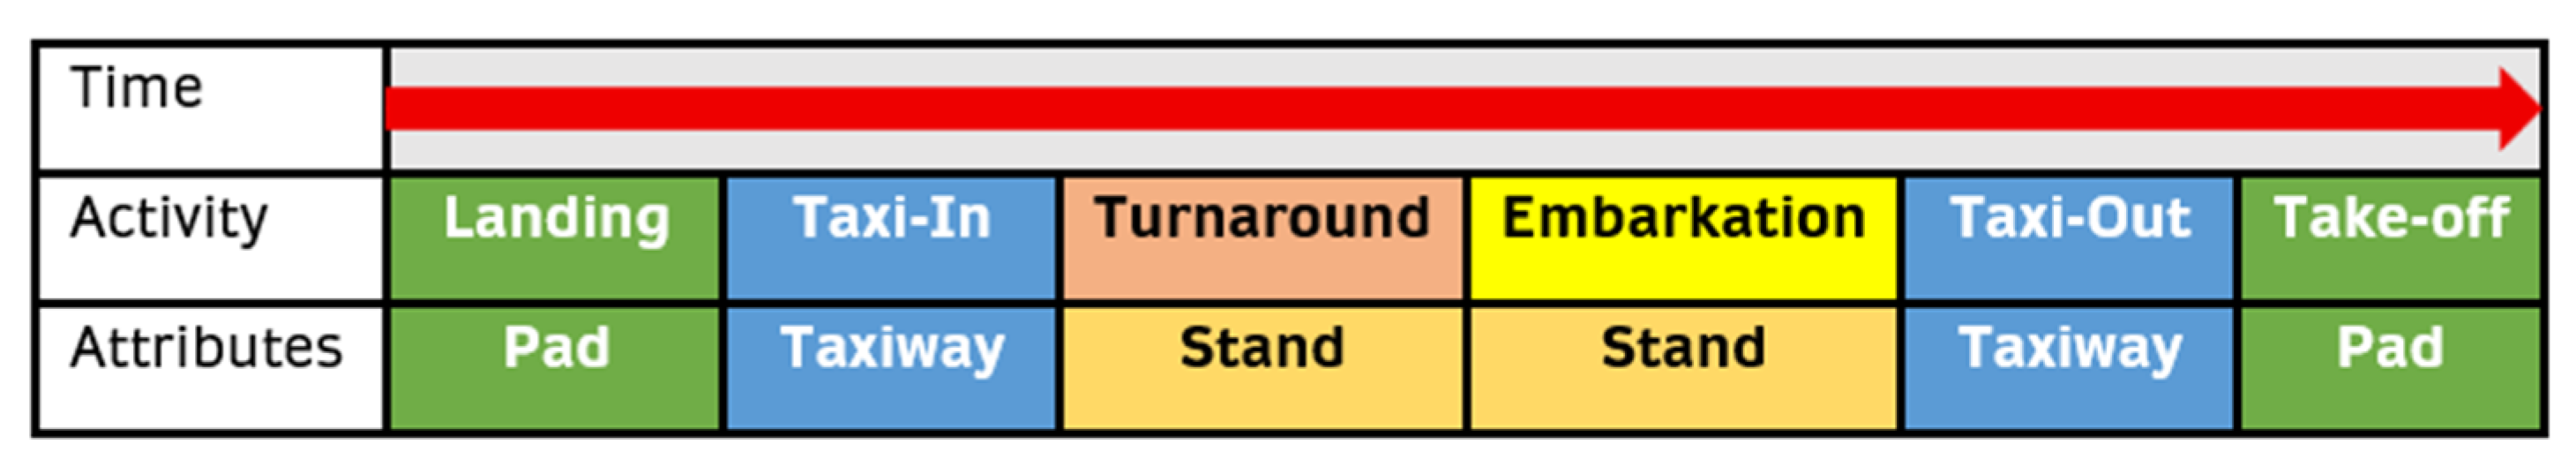
Figure 6.
Passenger movement from X (terminal) to each stand.
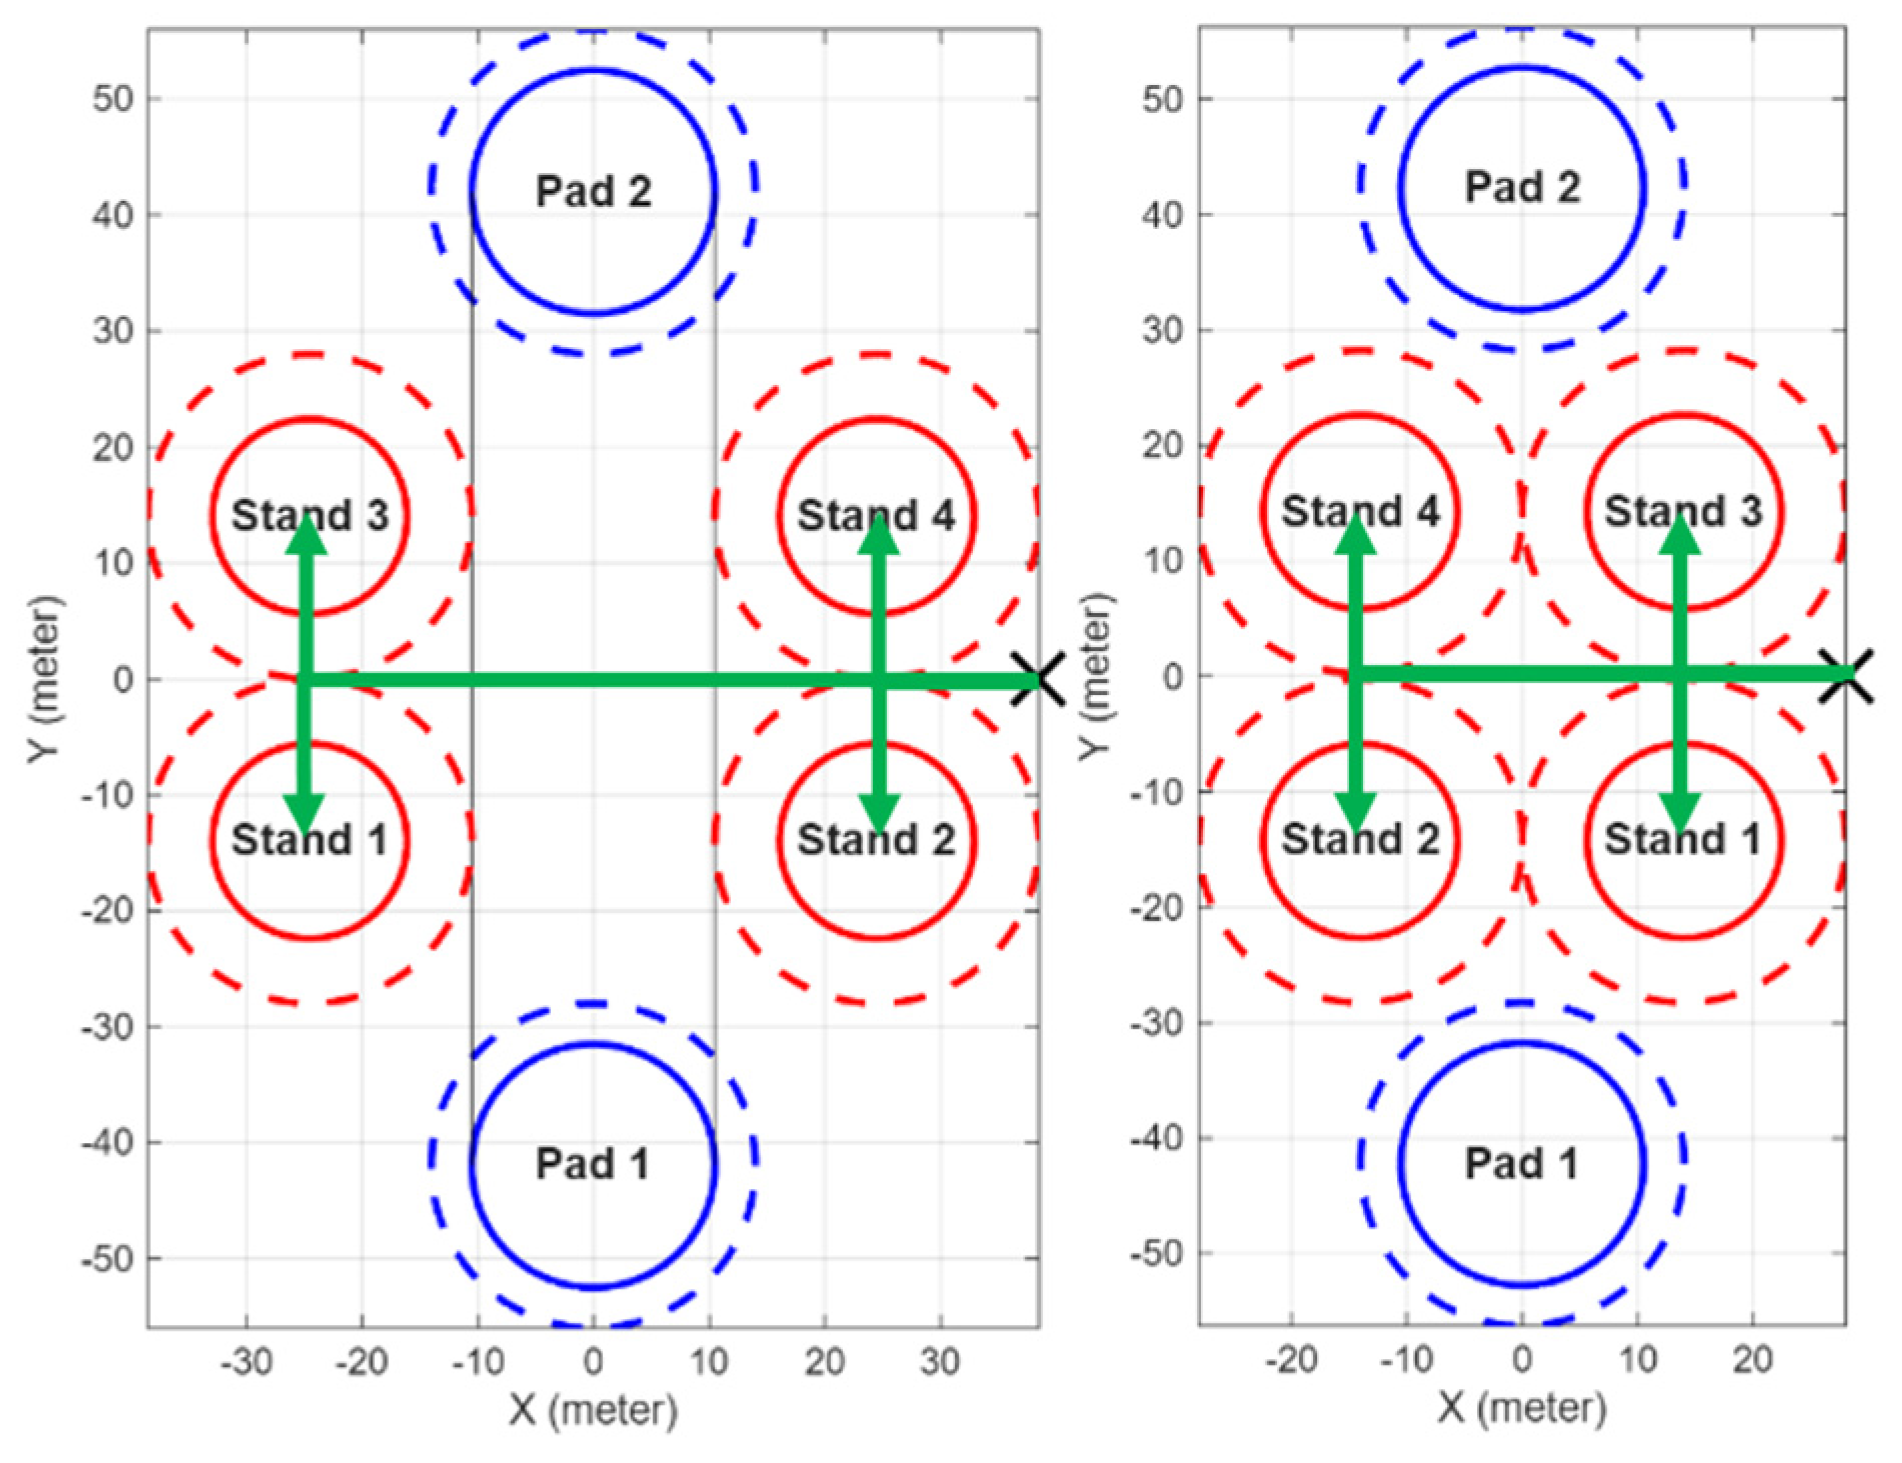
Figure 7.
Aircraft taxi movement from pad to assigned stand.
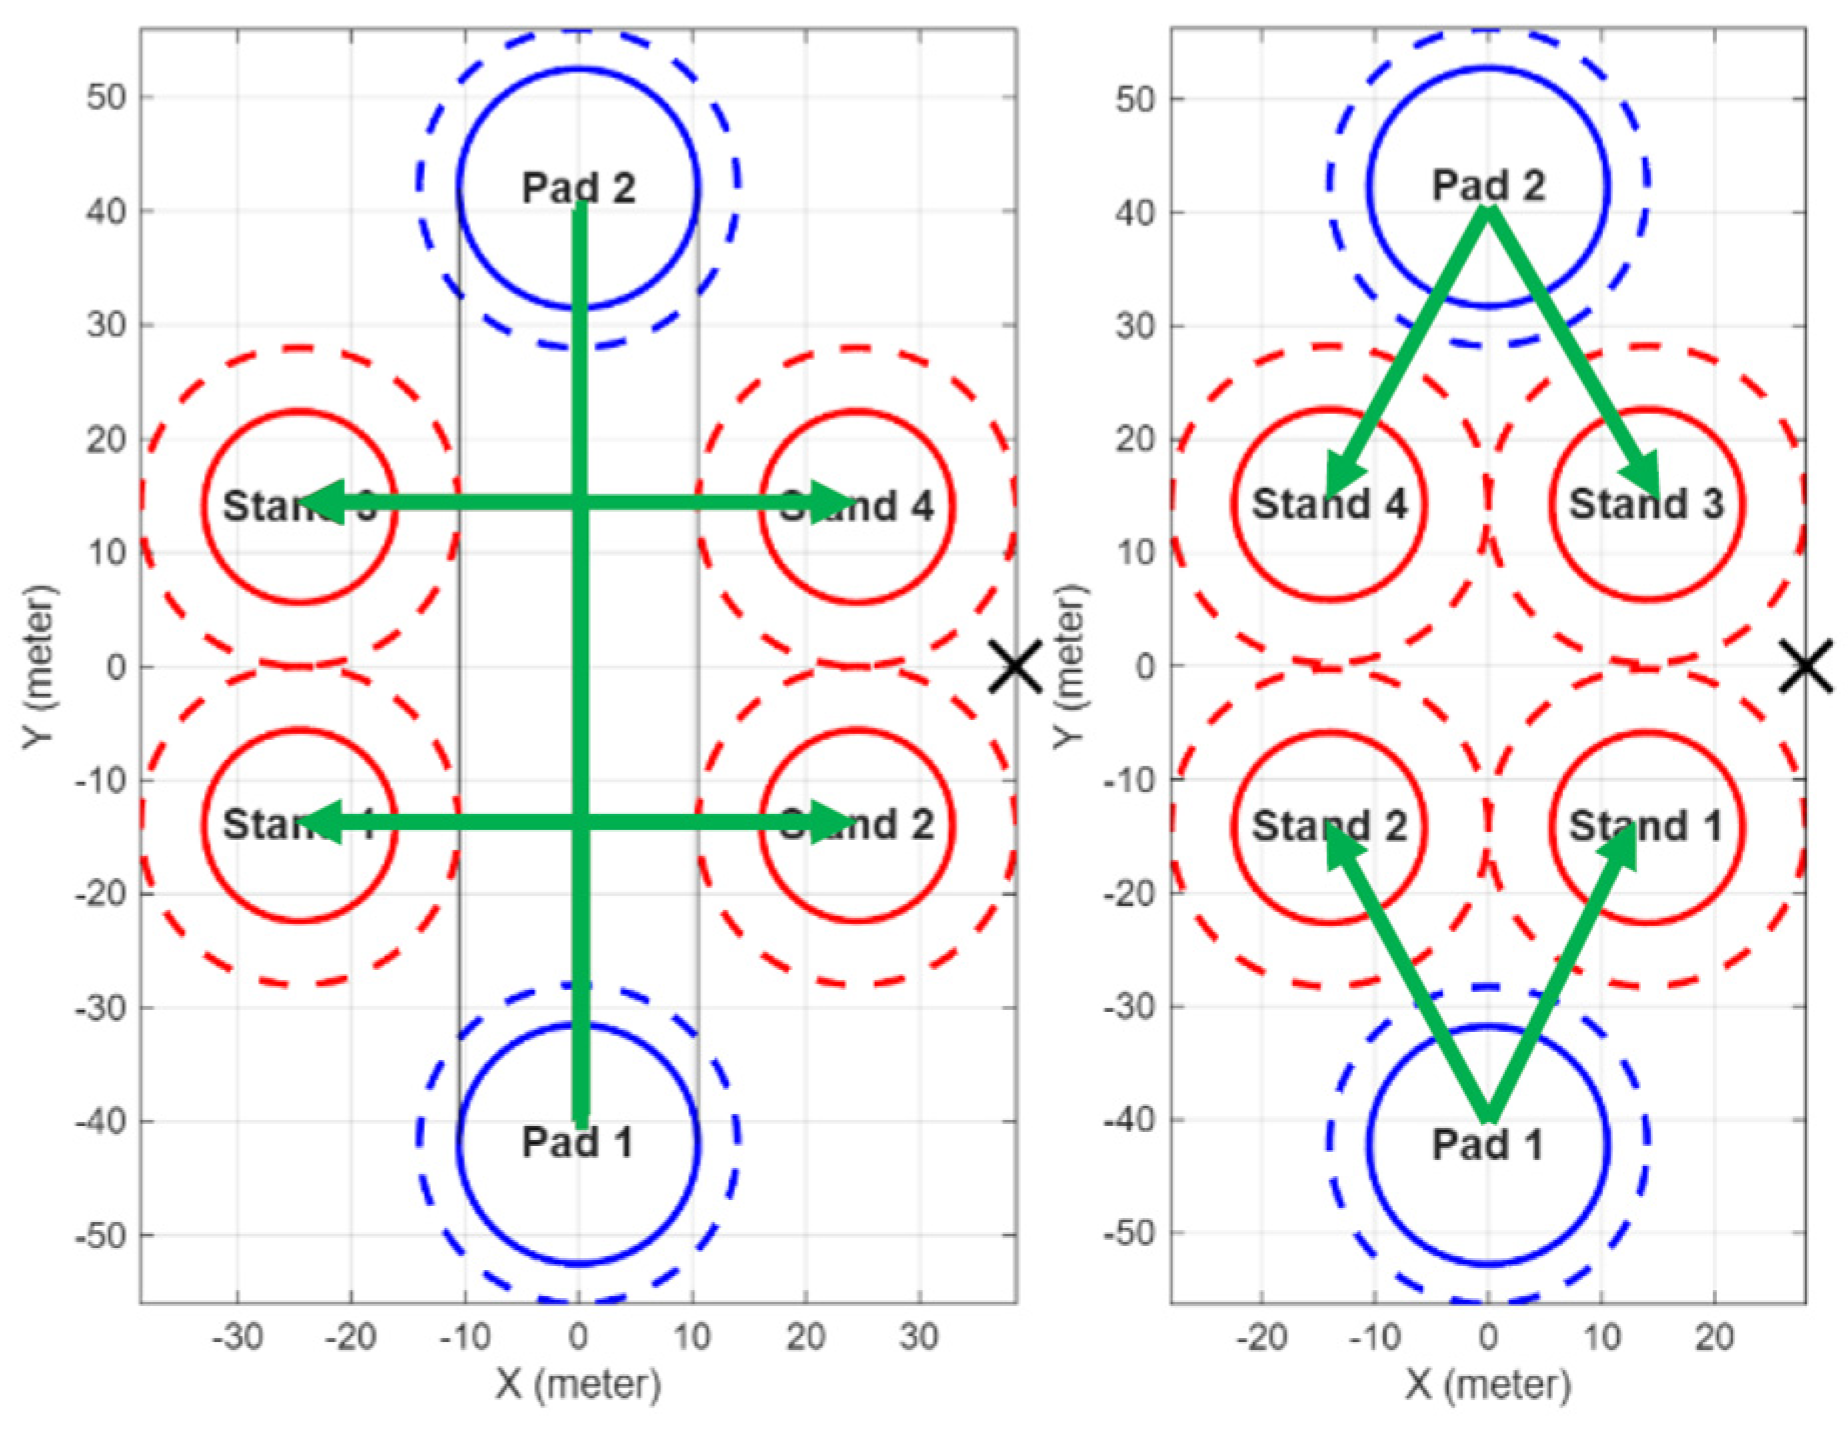
Figure 8.
Simulation workflow of vertiport.
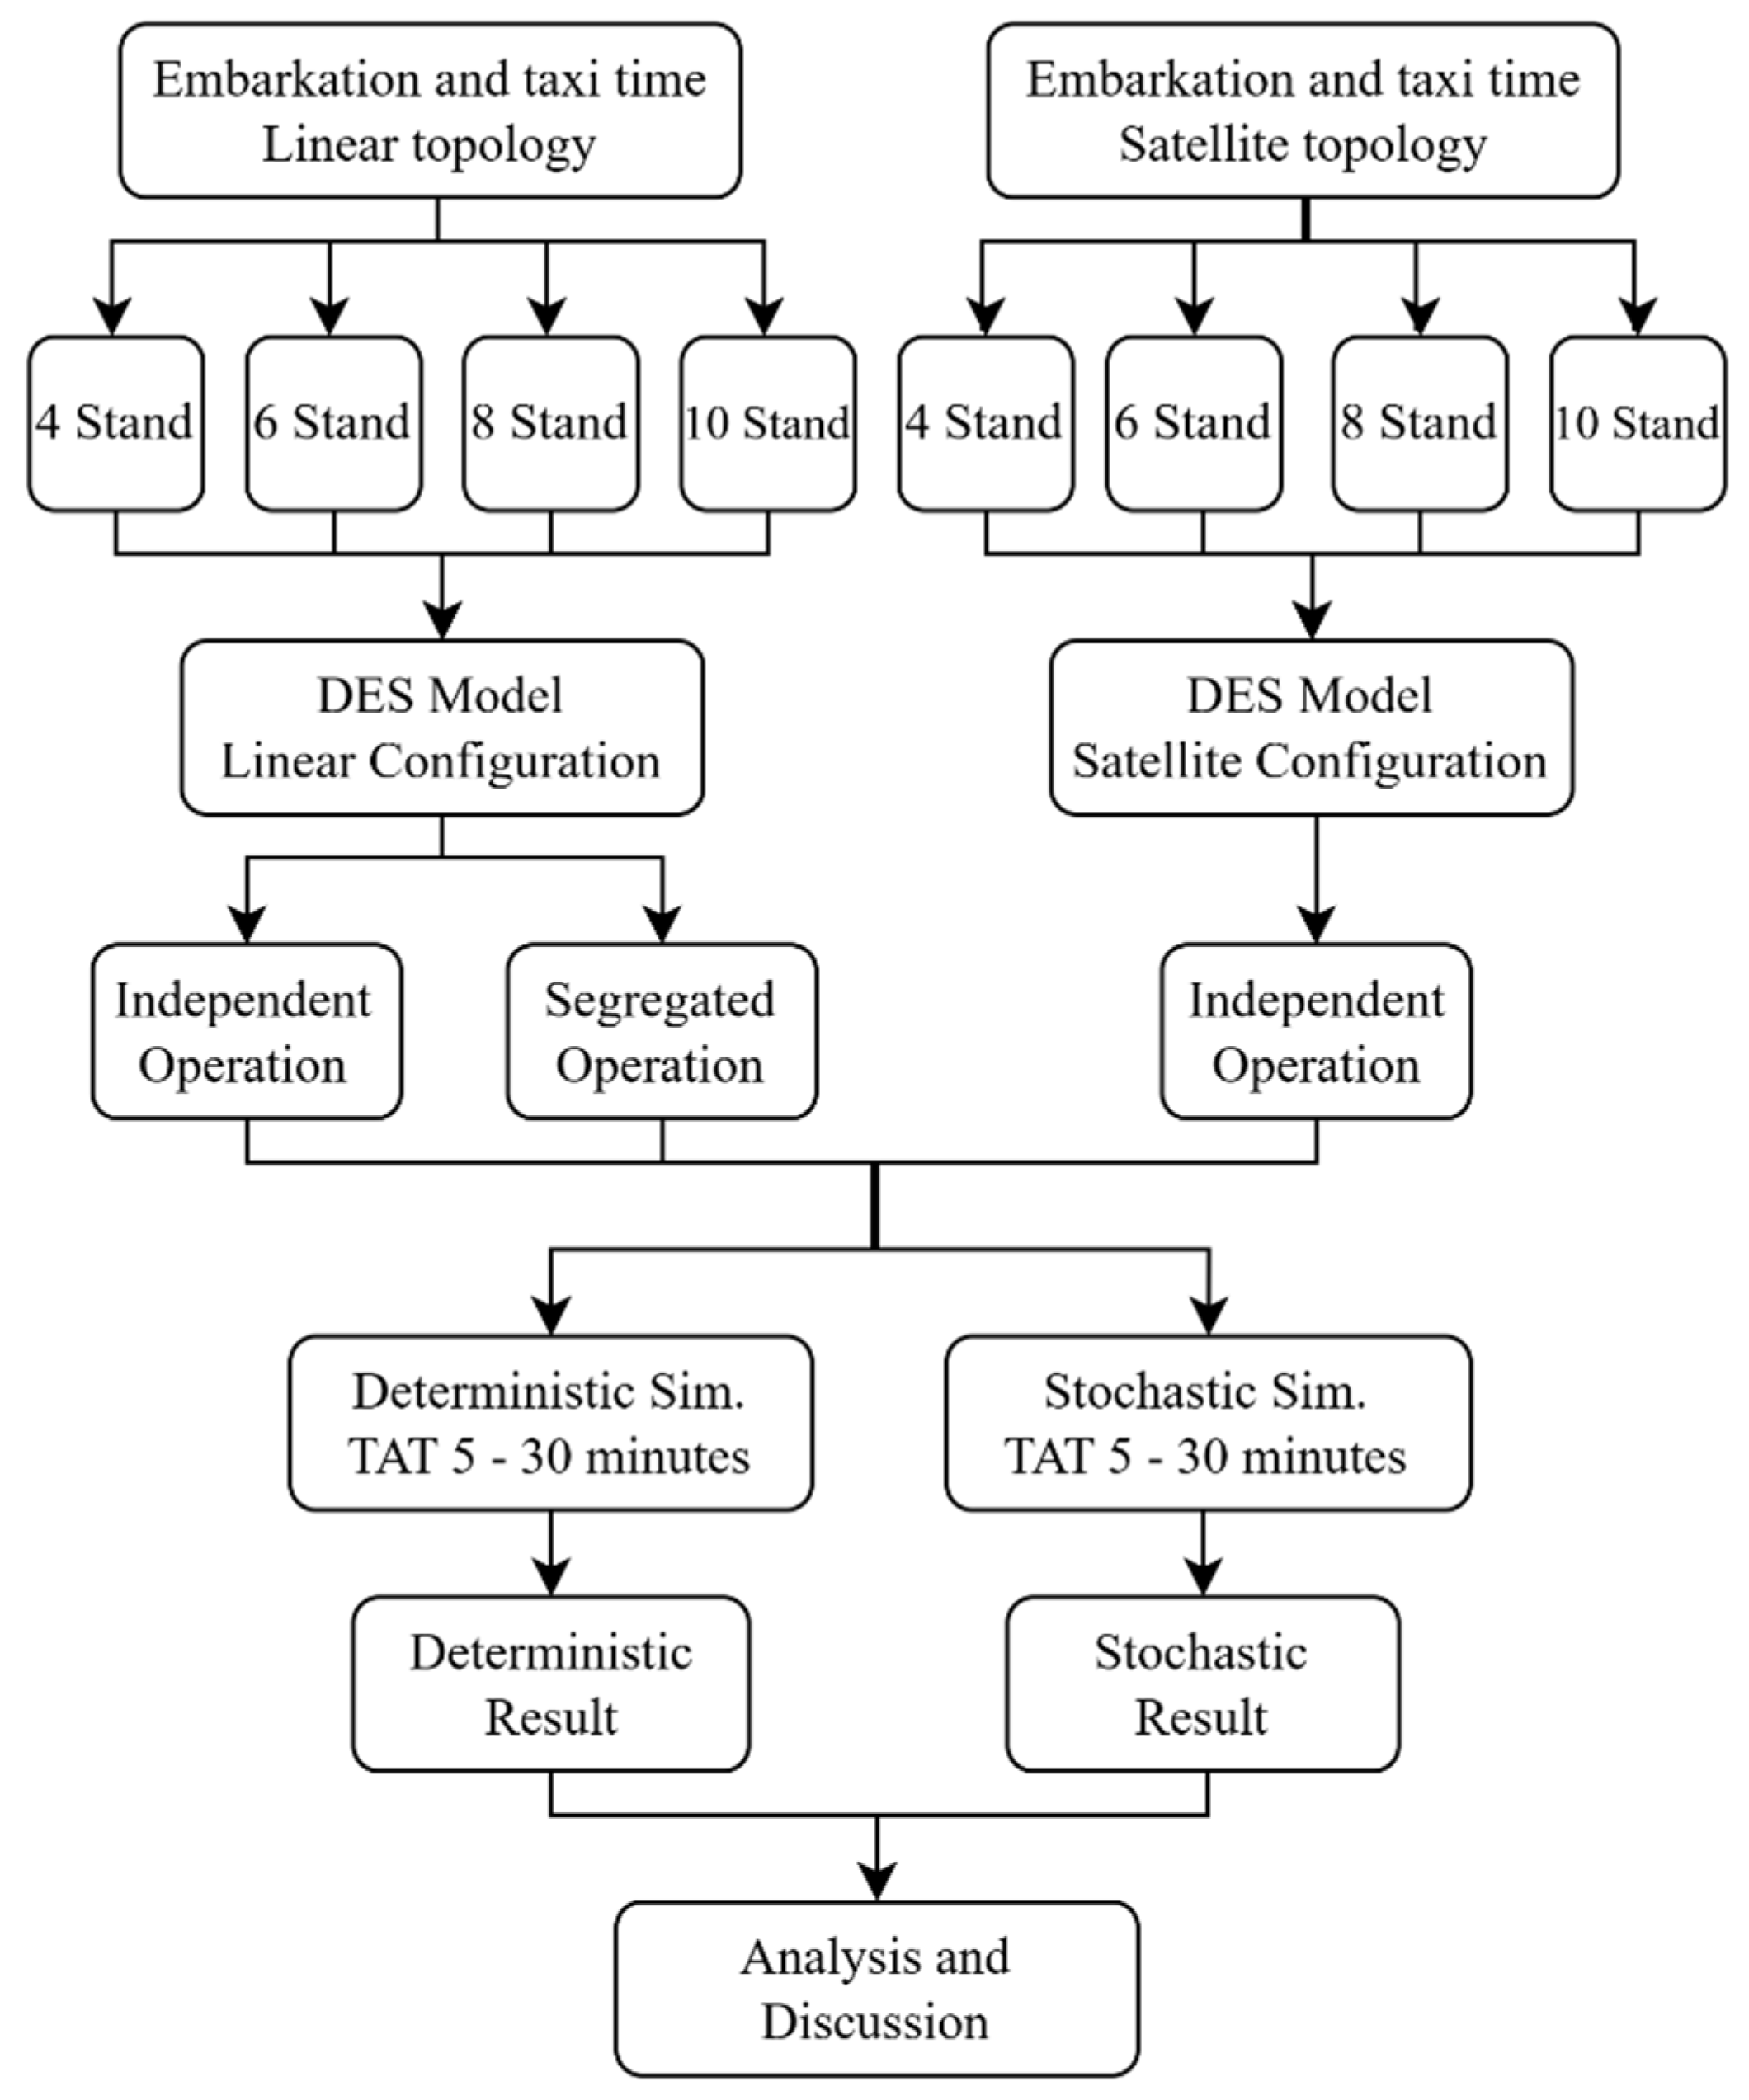
Figure 9.
Algorithm of vertiport operation model.
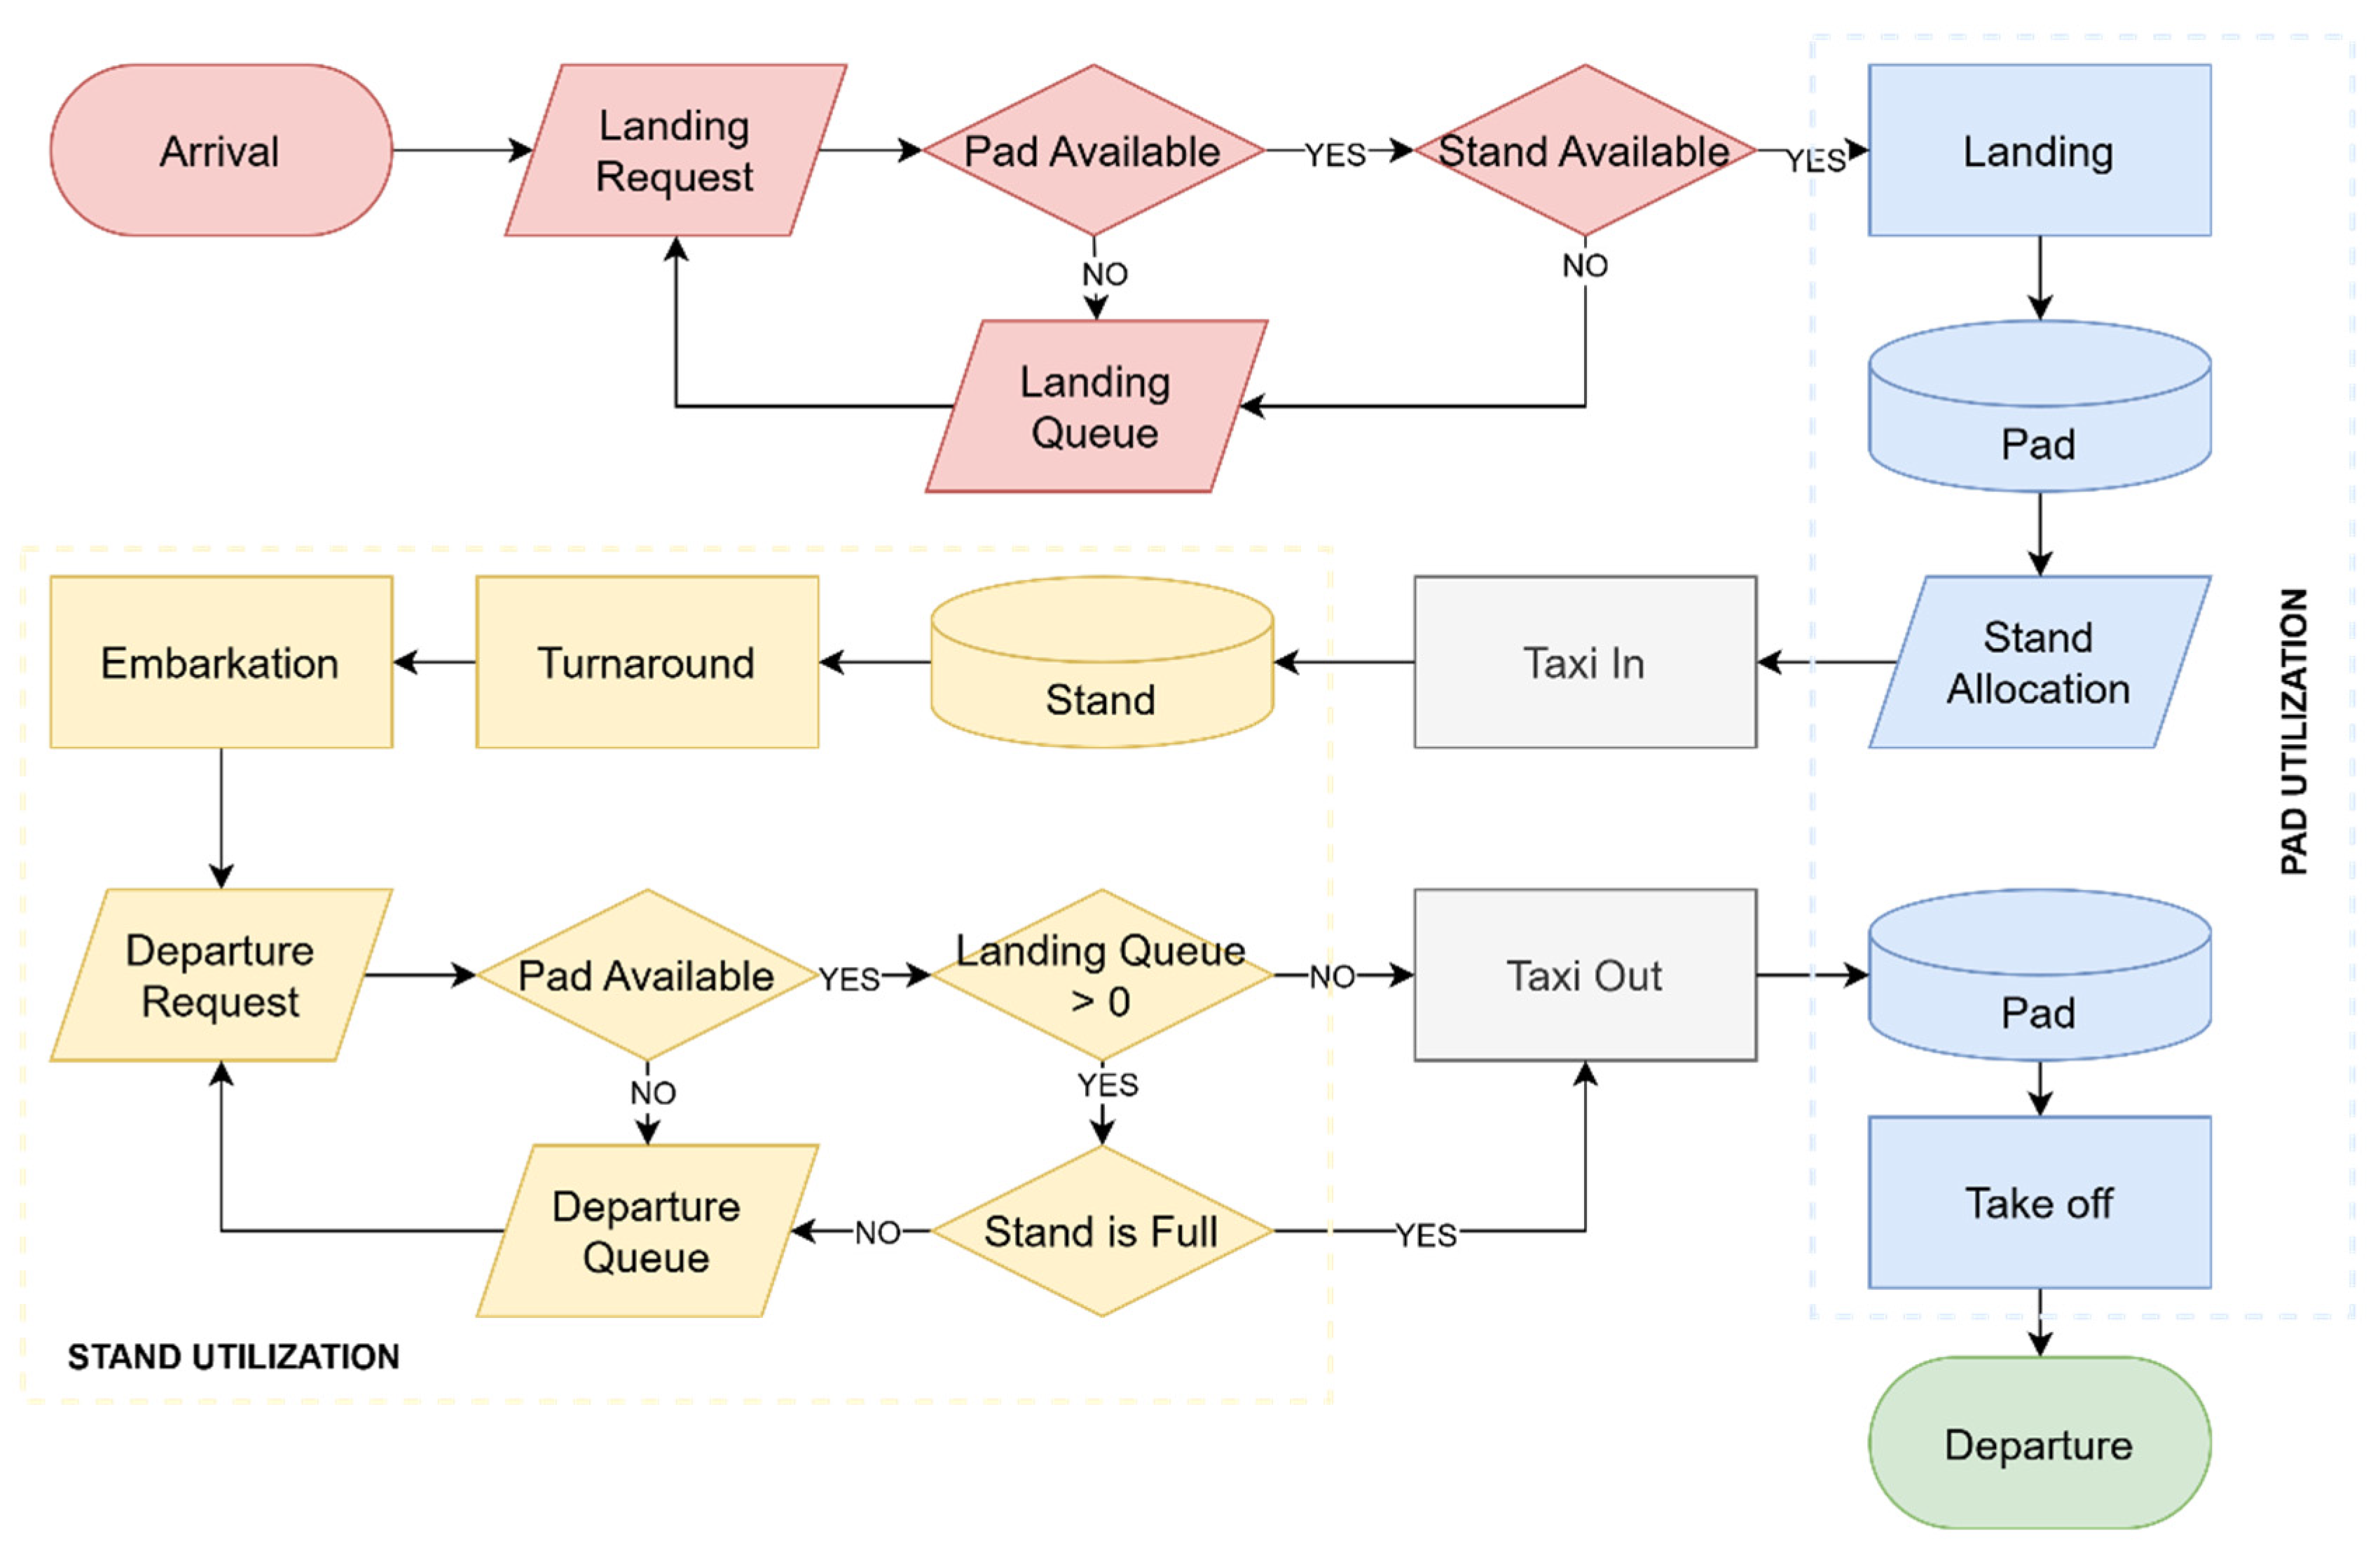
Figure 10.
Triangular distribution of turnaround time.
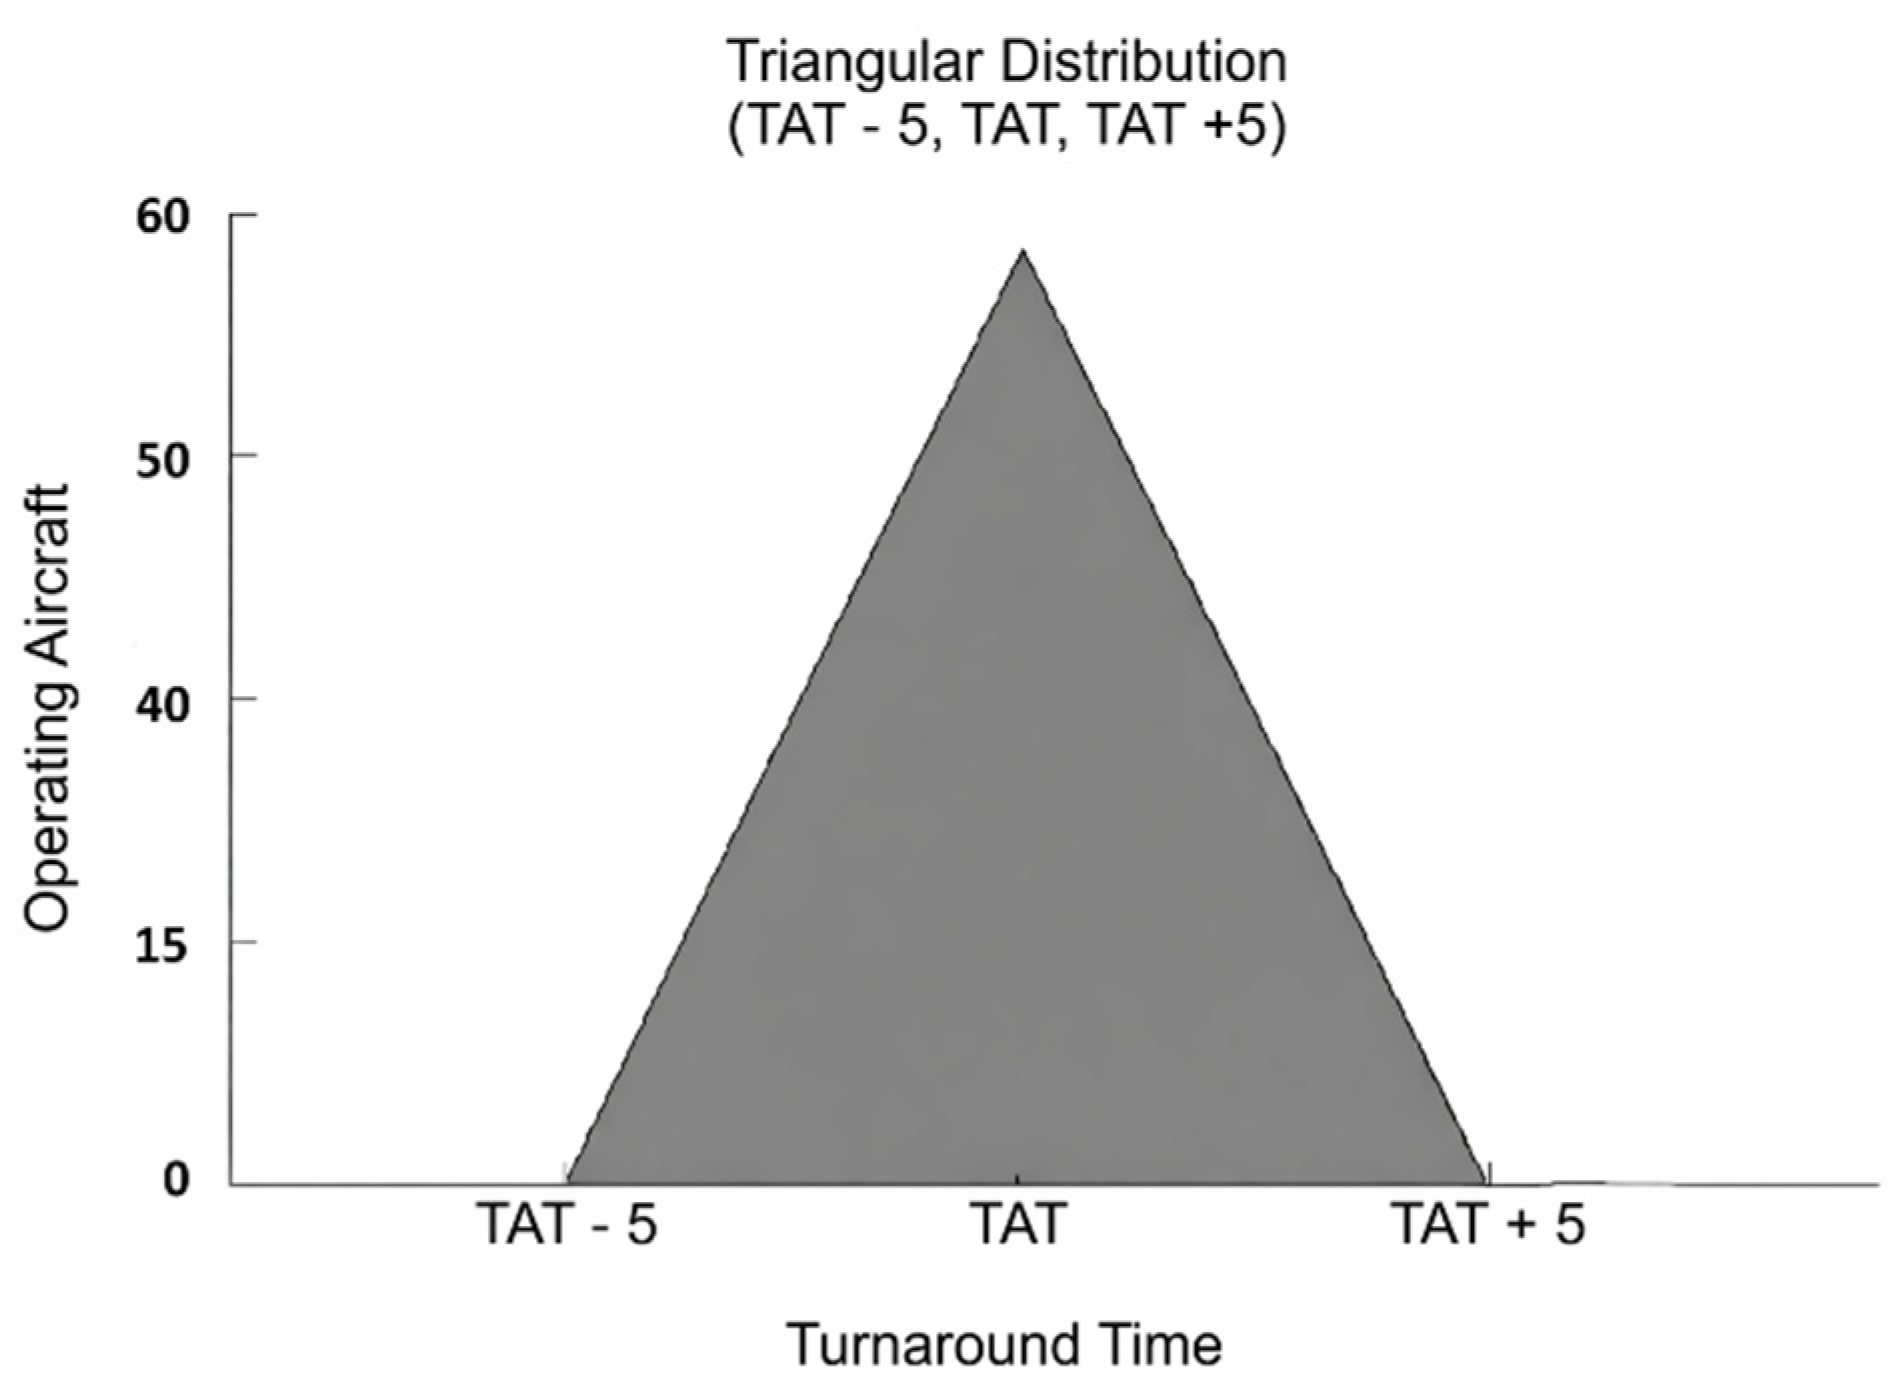
Figure 11.
Timestamp of 10 aircraft operating in Linear-Segregated vertiport.
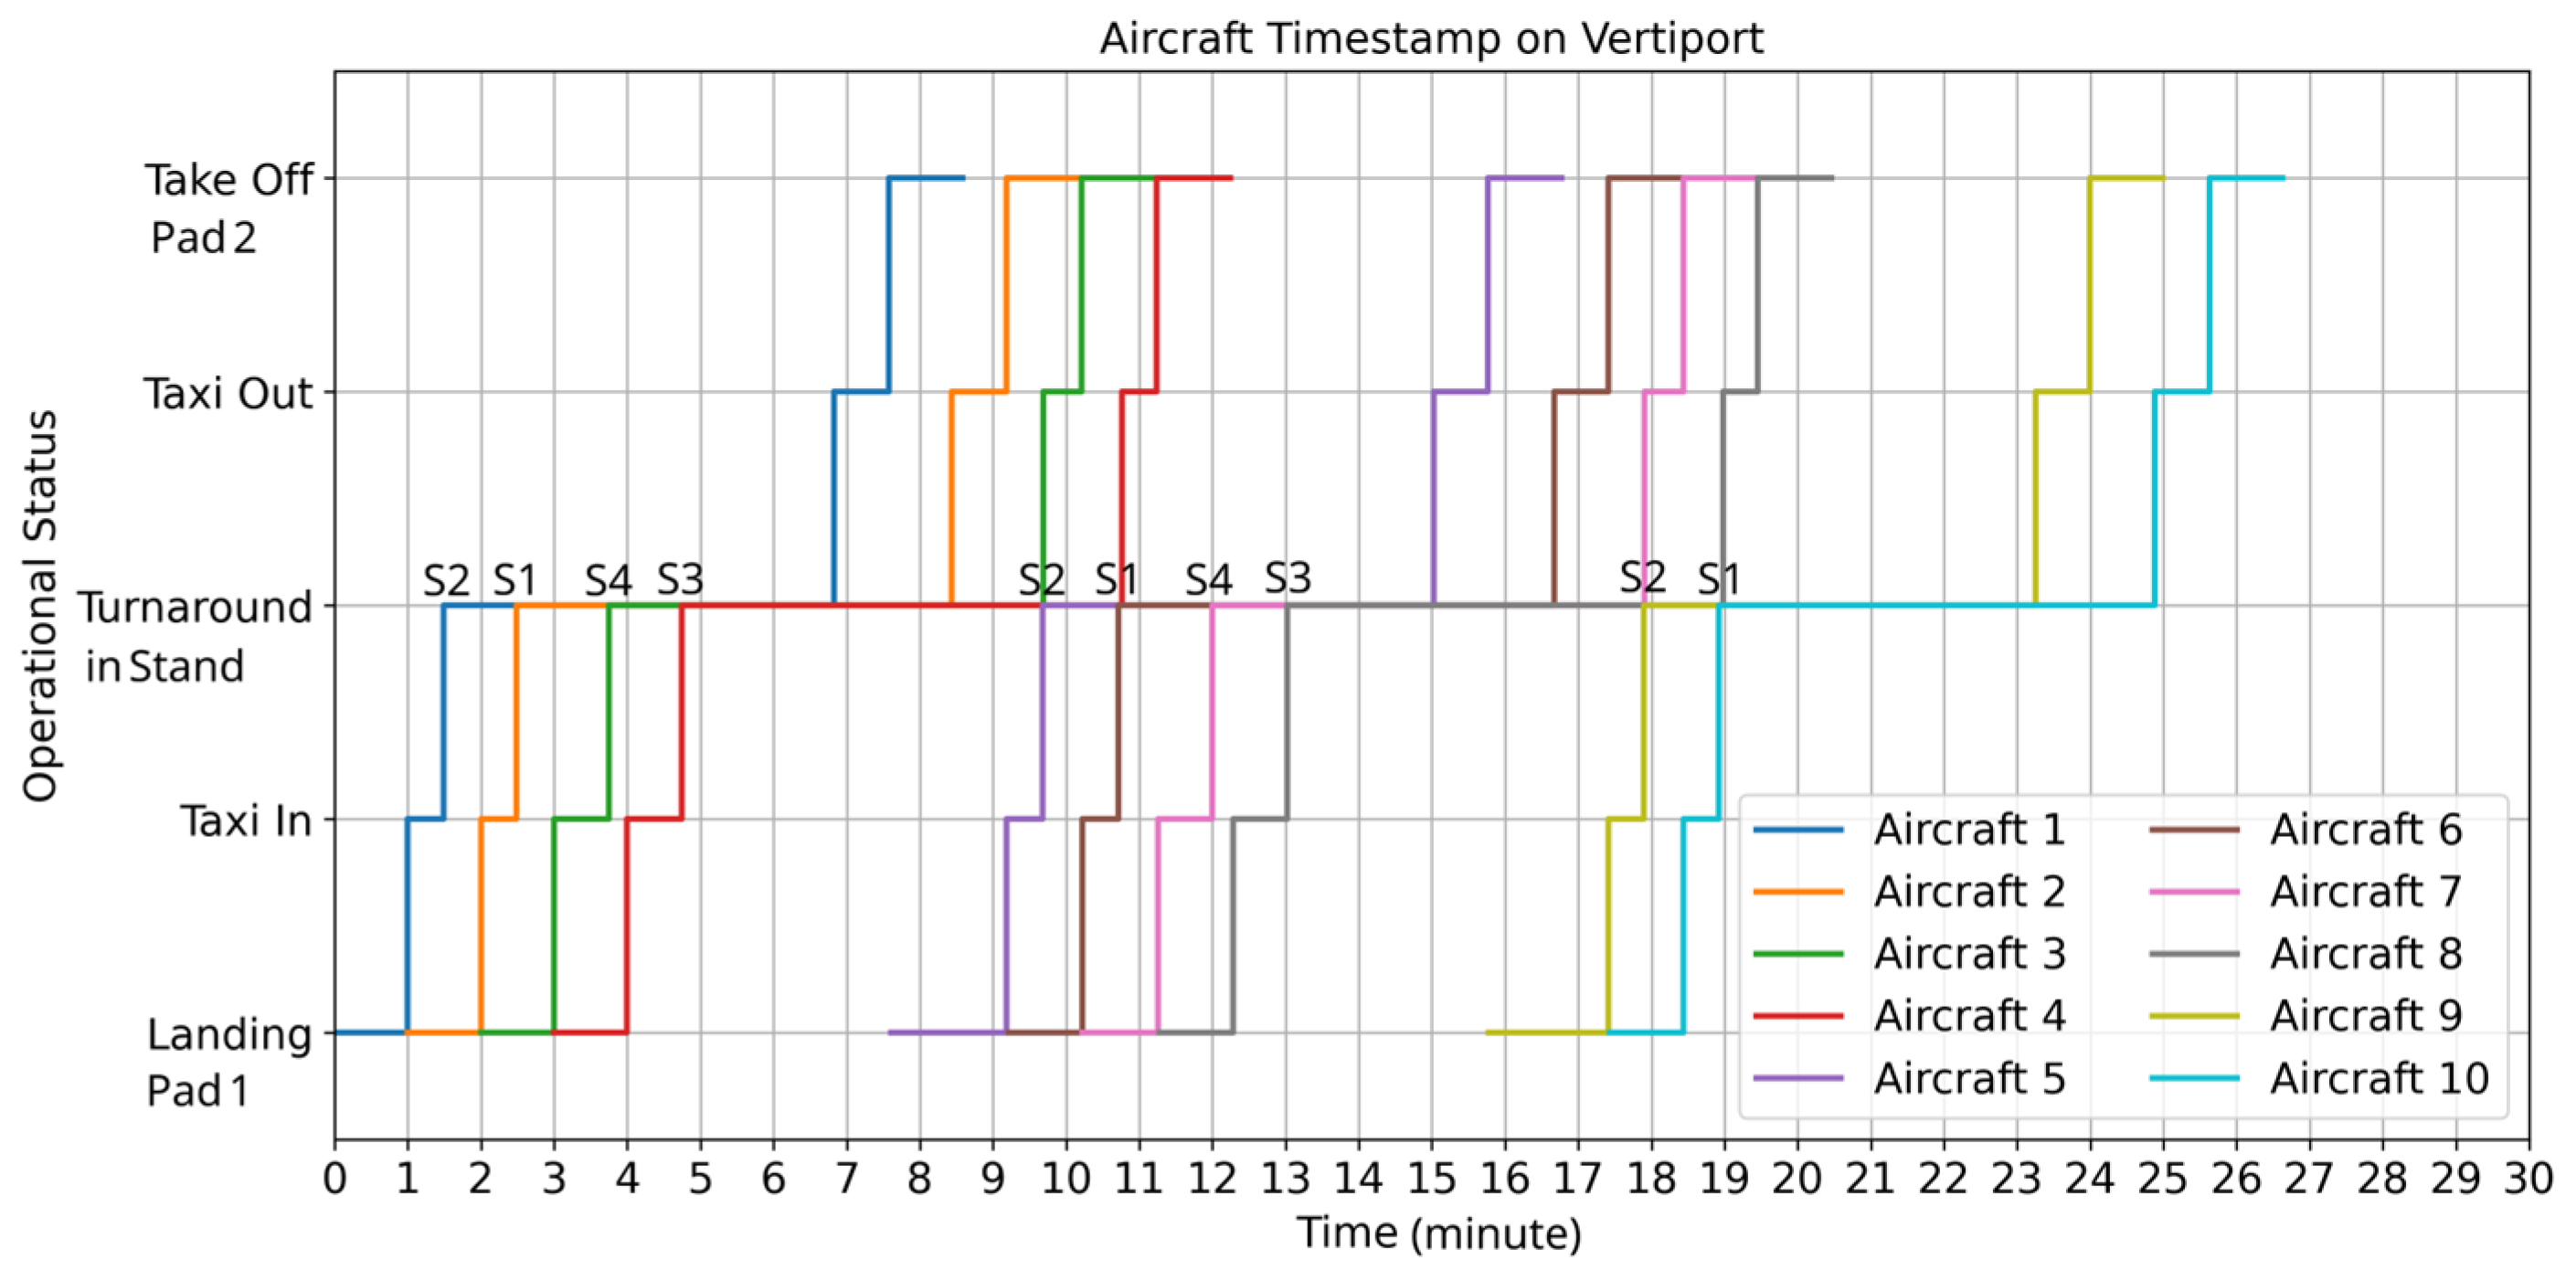
Figure 12.
Timestamp of 10 aircraft operating in Linear-Segregated vertiport, 10 stands.
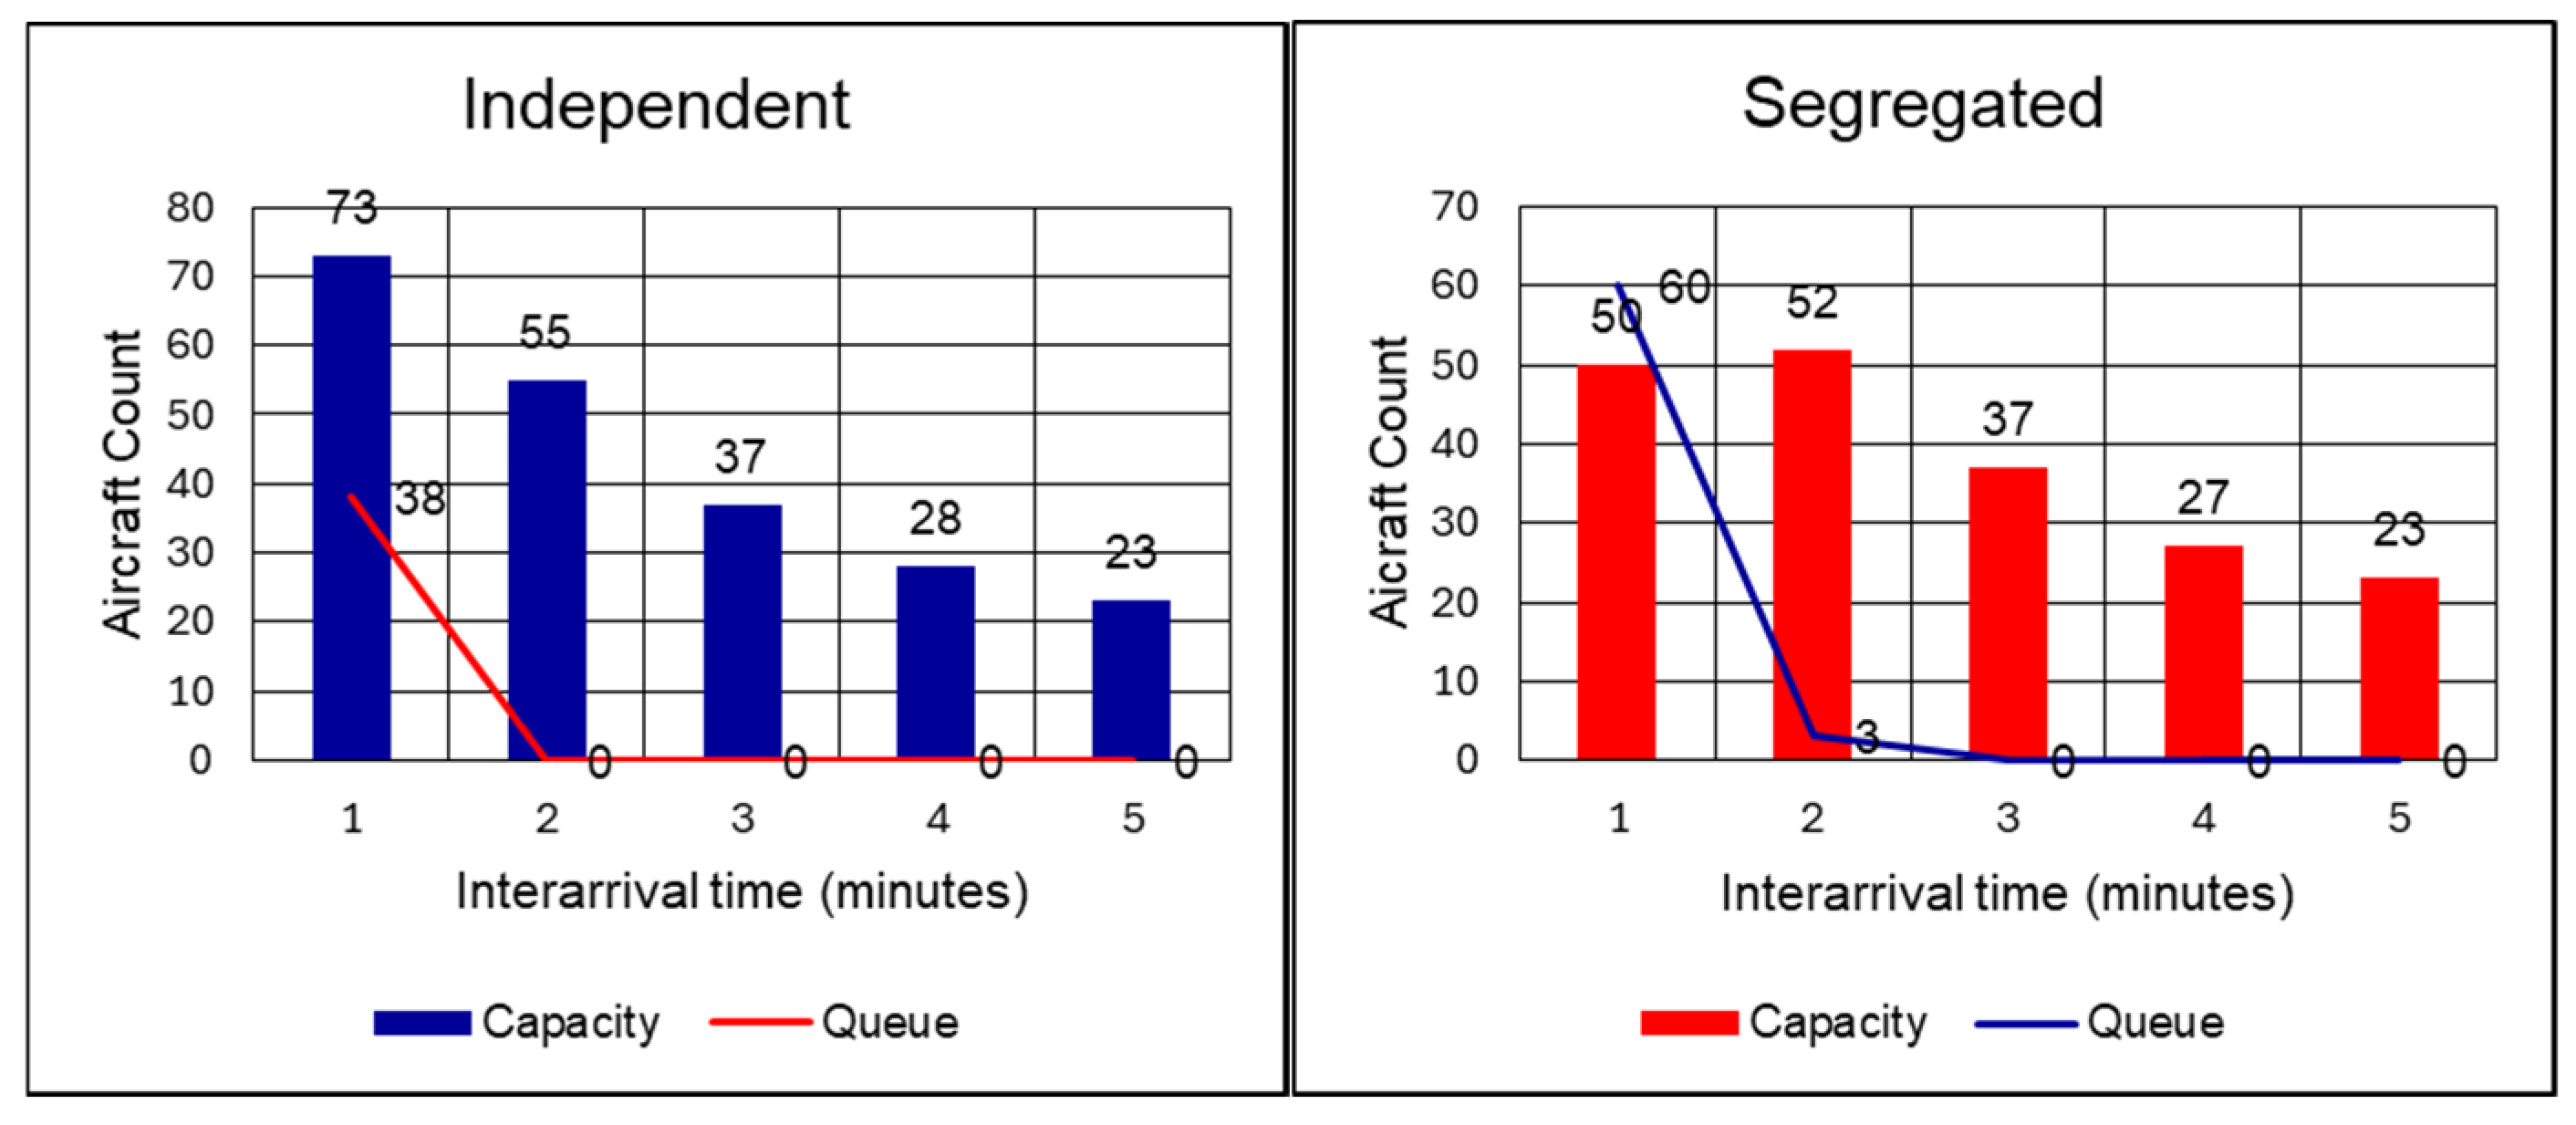
Figure 13.
Throughput and utilization percentage of every stand, interarrival of 1 minute and 2 minutes of linear-segregated vertiport with 10 stands.
Figure 13.
Throughput and utilization percentage of every stand, interarrival of 1 minute and 2 minutes of linear-segregated vertiport with 10 stands.
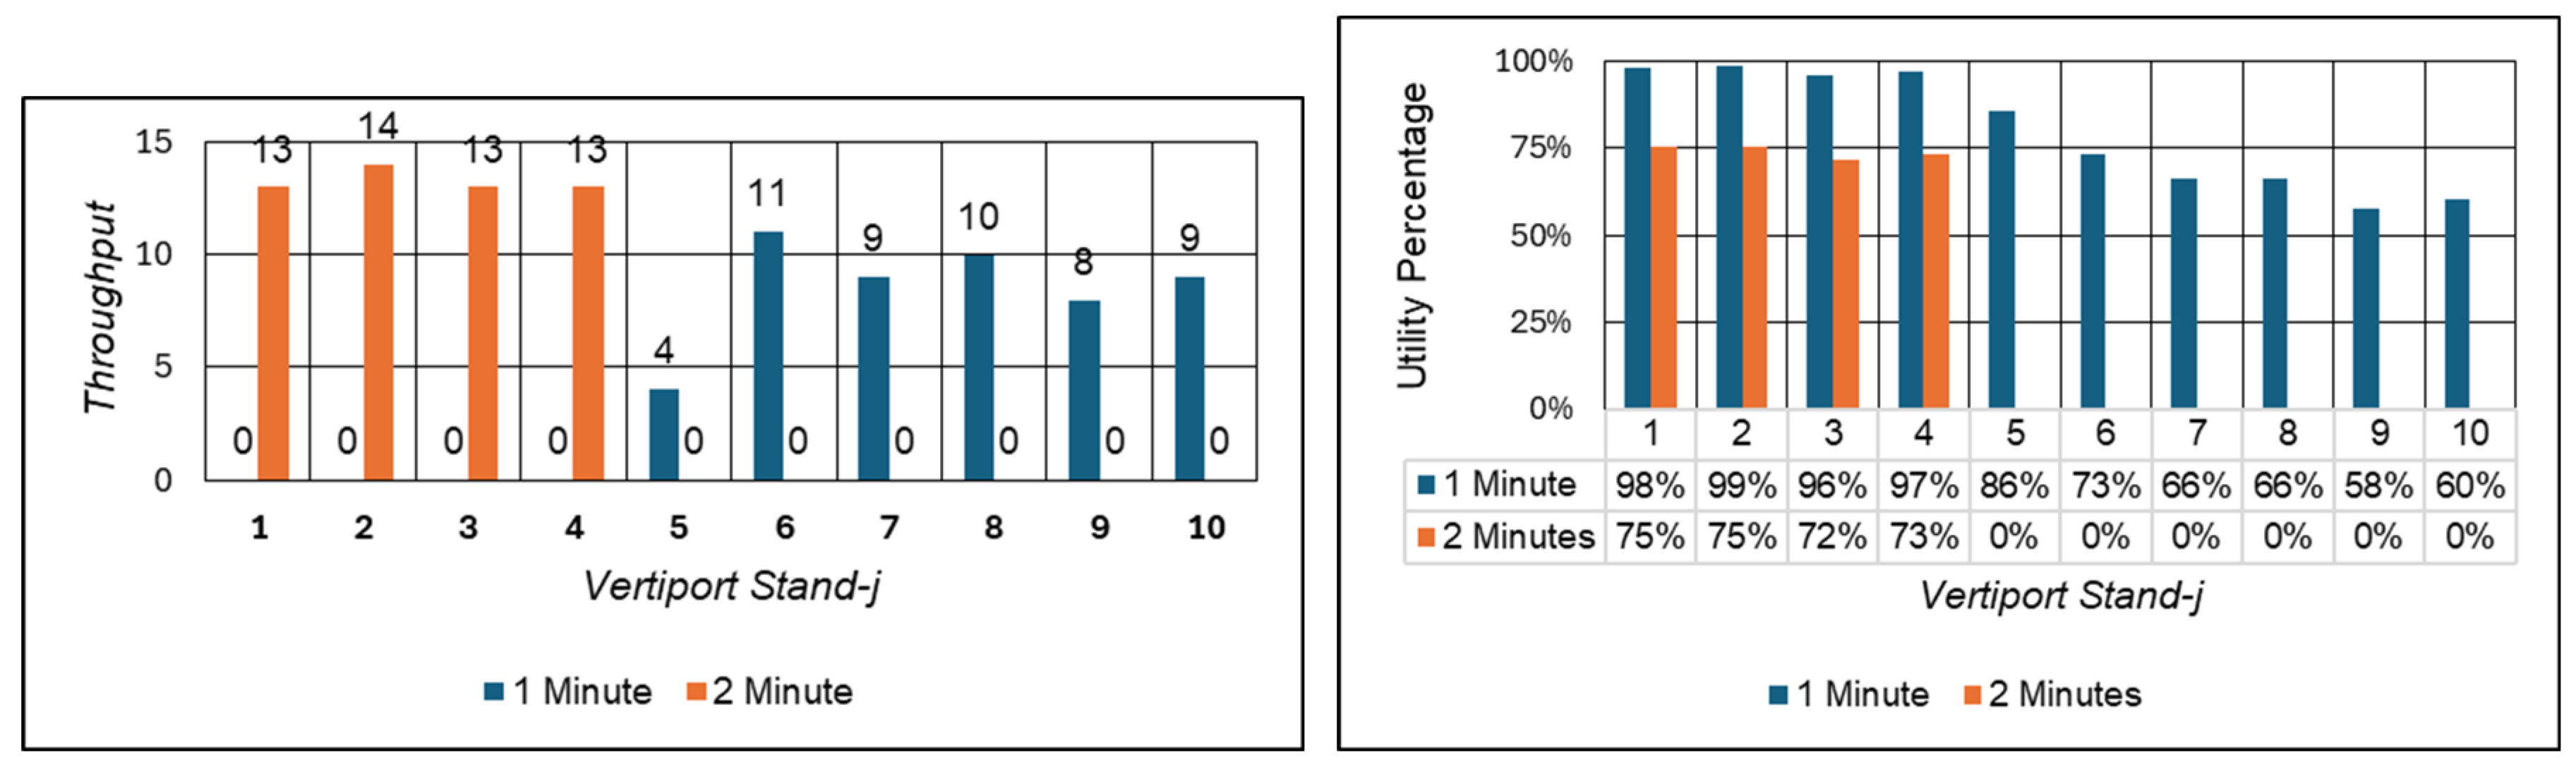
Figure 14.
Simulation results of Linear-Segregated vertiport.
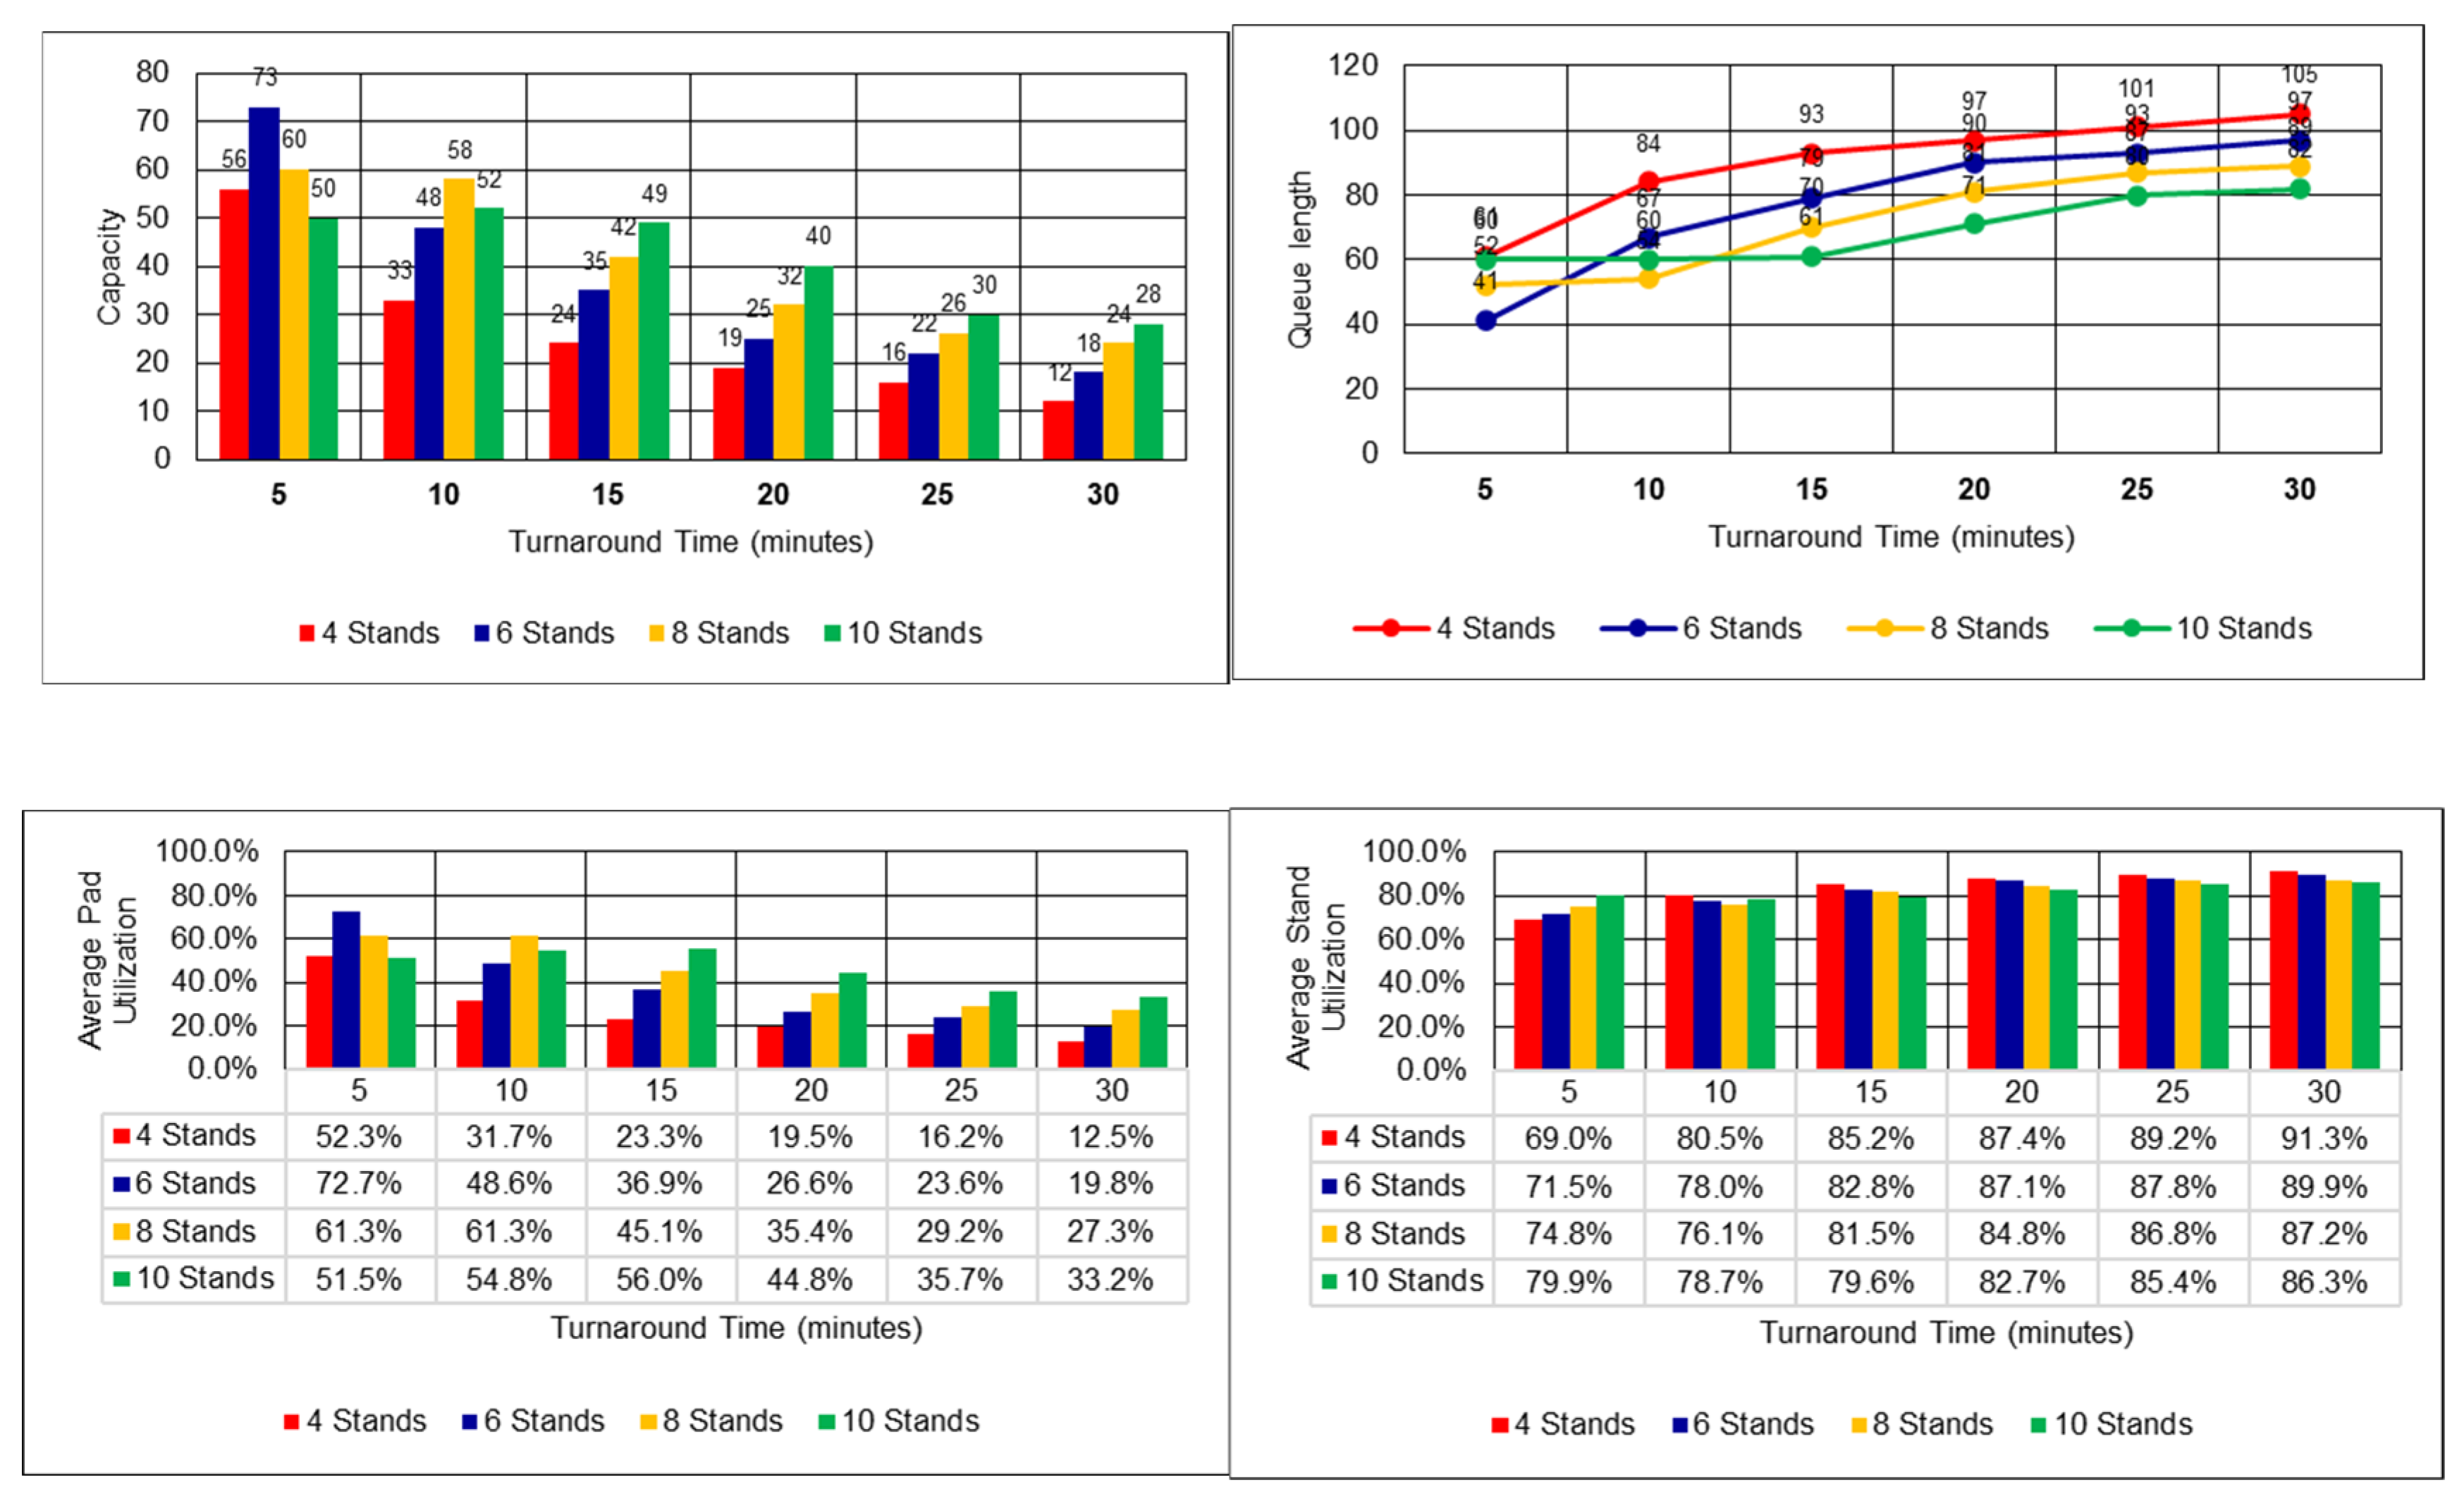
Figure 15.
Simulation results of Linear-Independent vertiport.
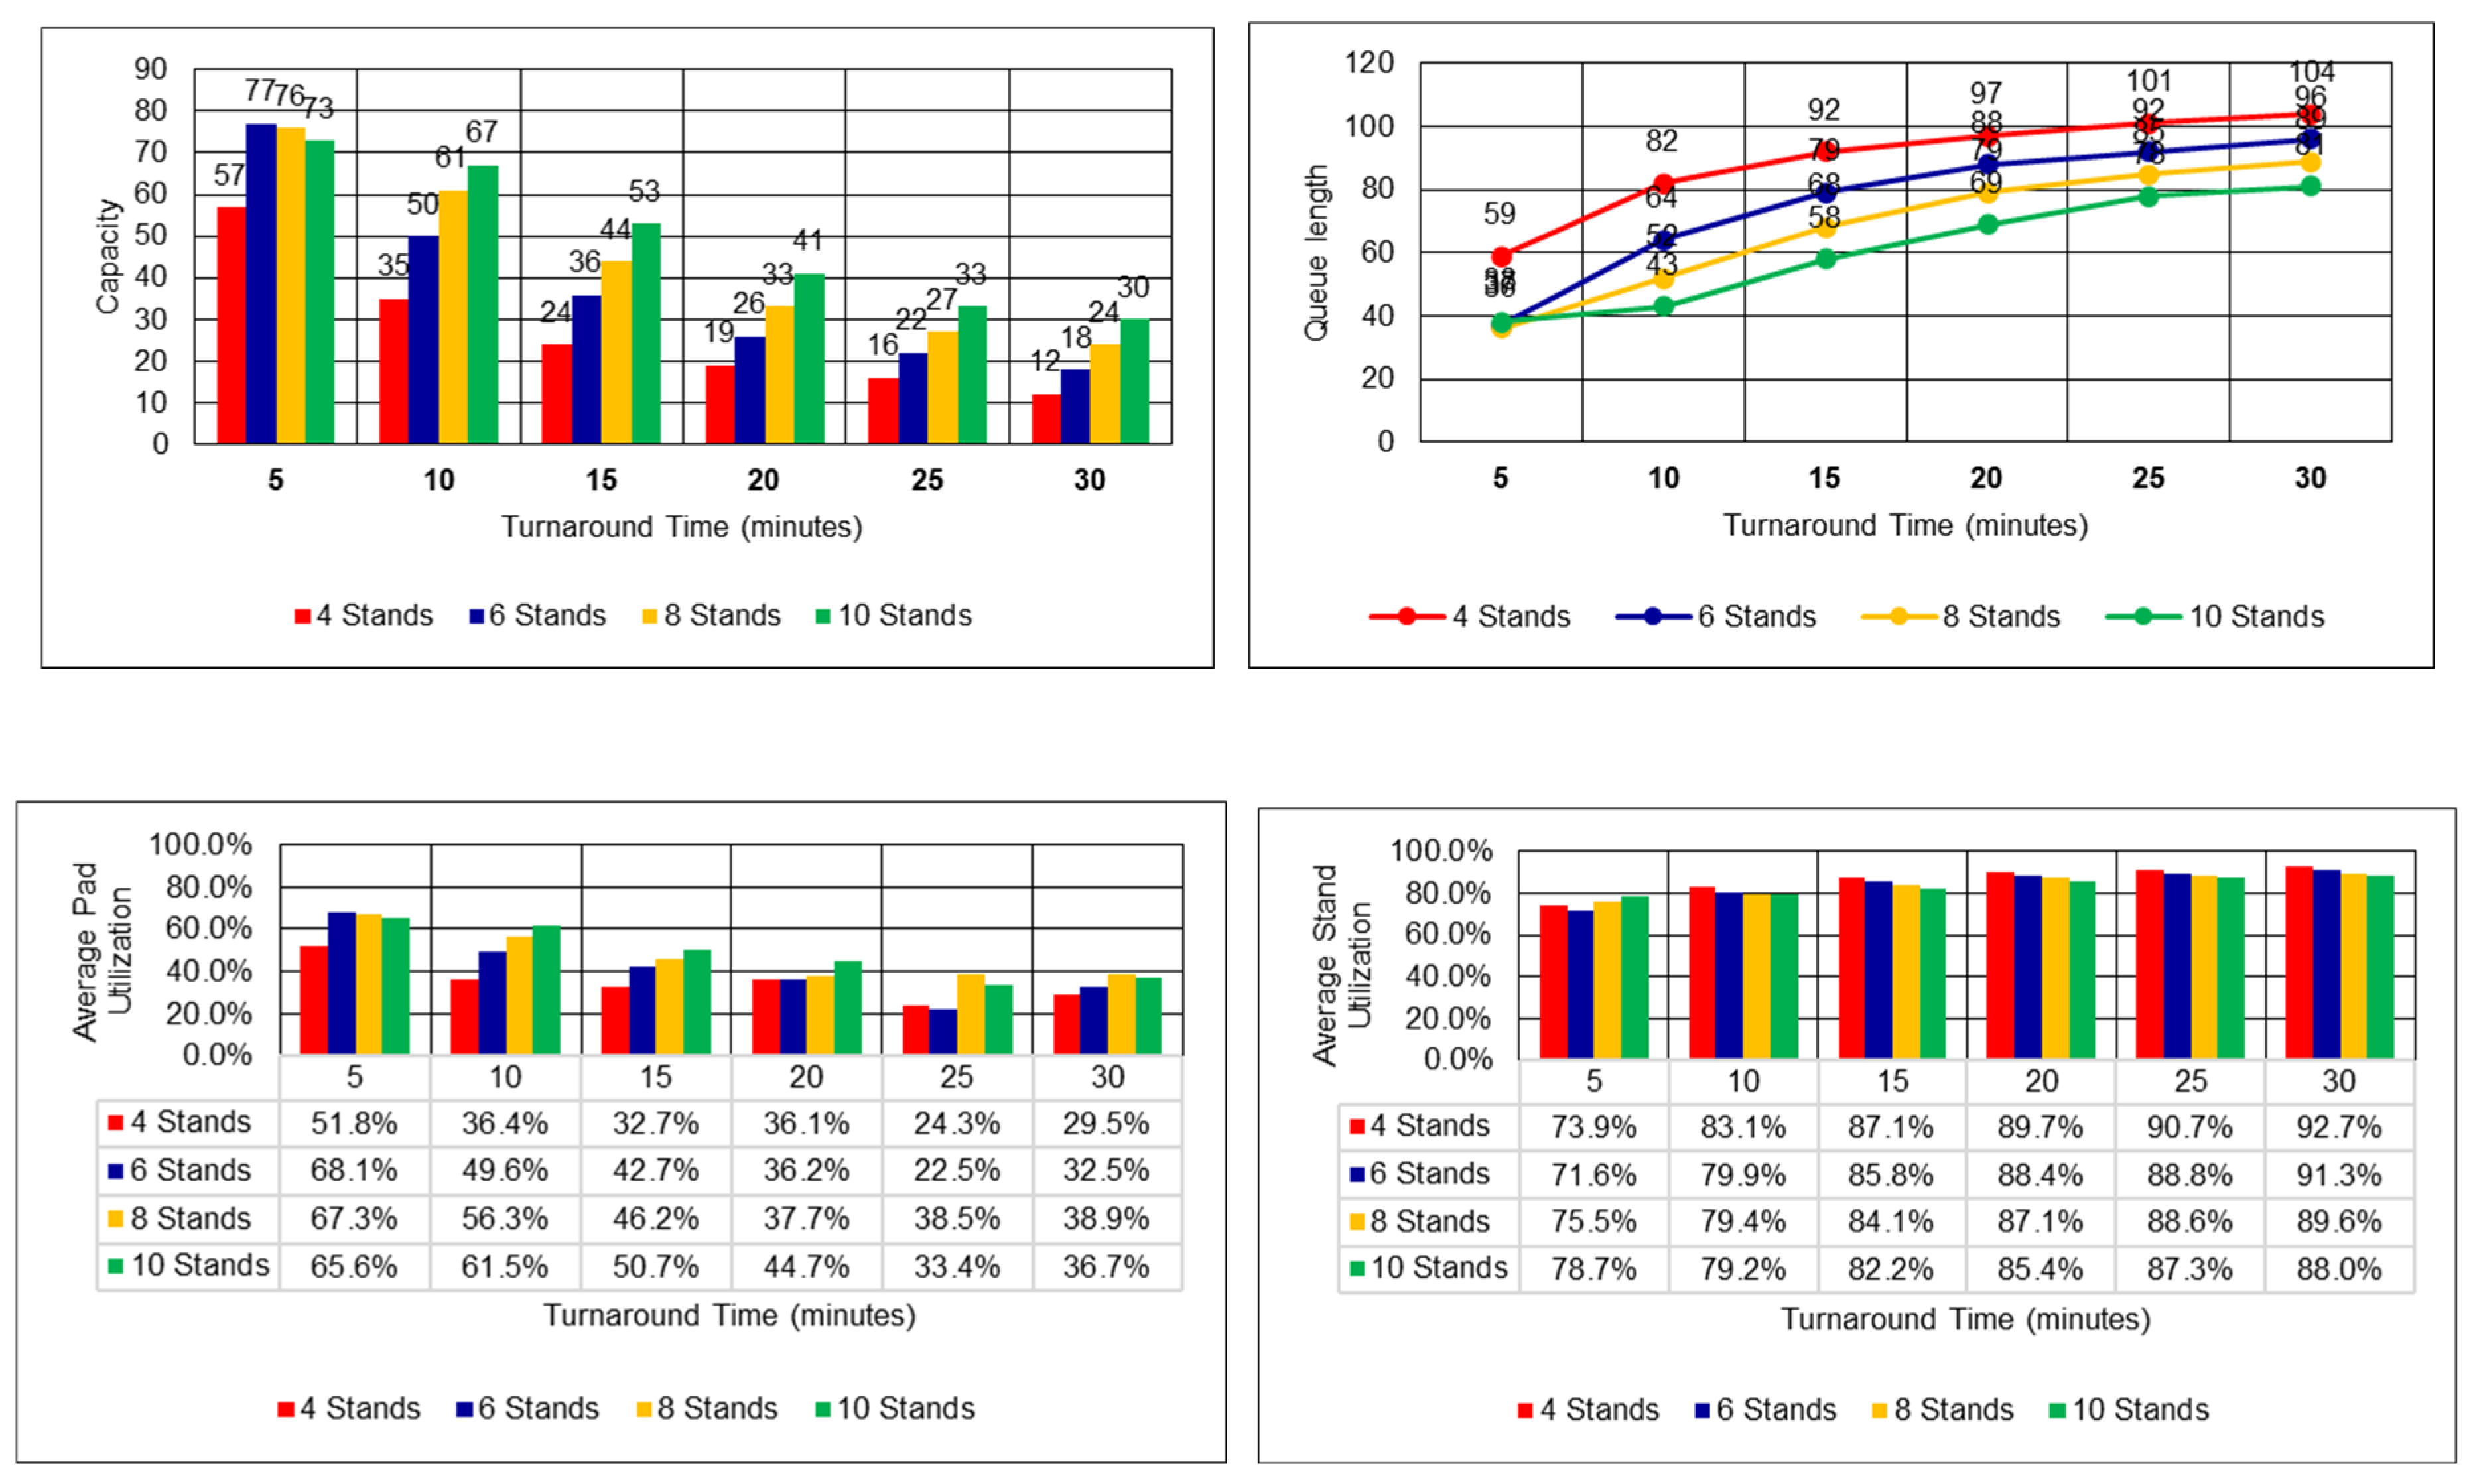
Figure 16.
Simulation results of Satellite vertiport.
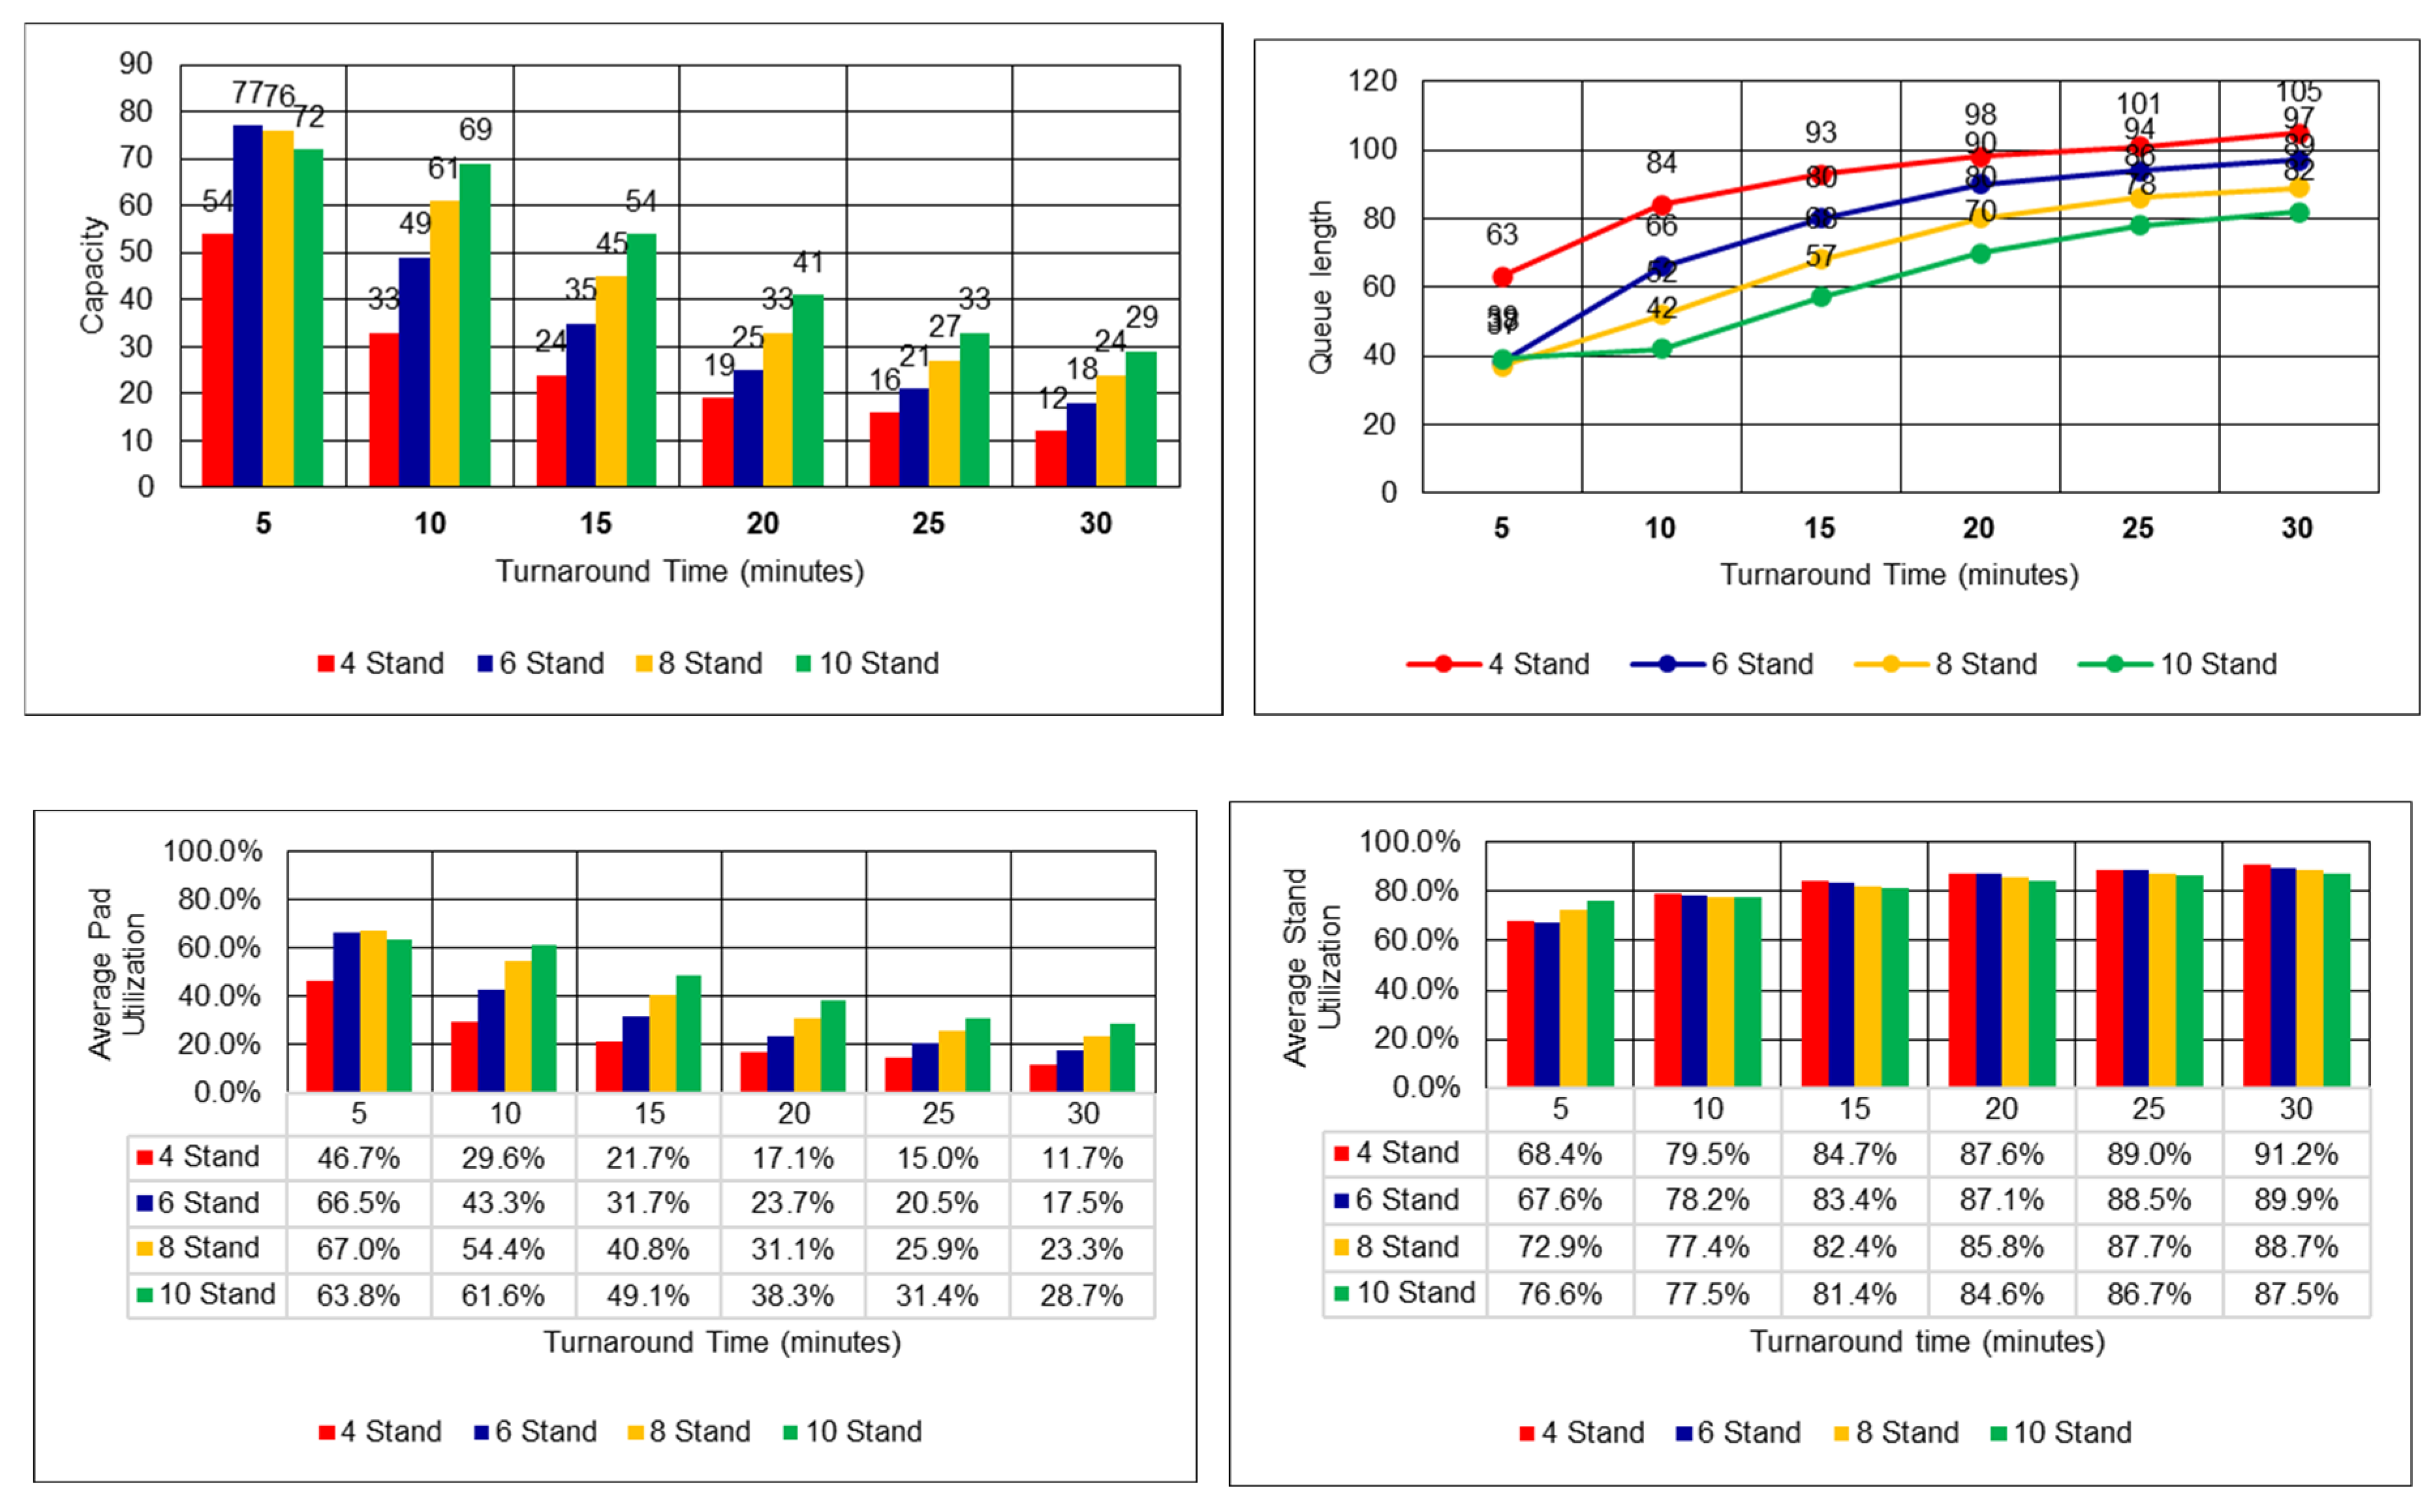
Figure 17.
Total performance comparison of vertiport configurations in all TAT.
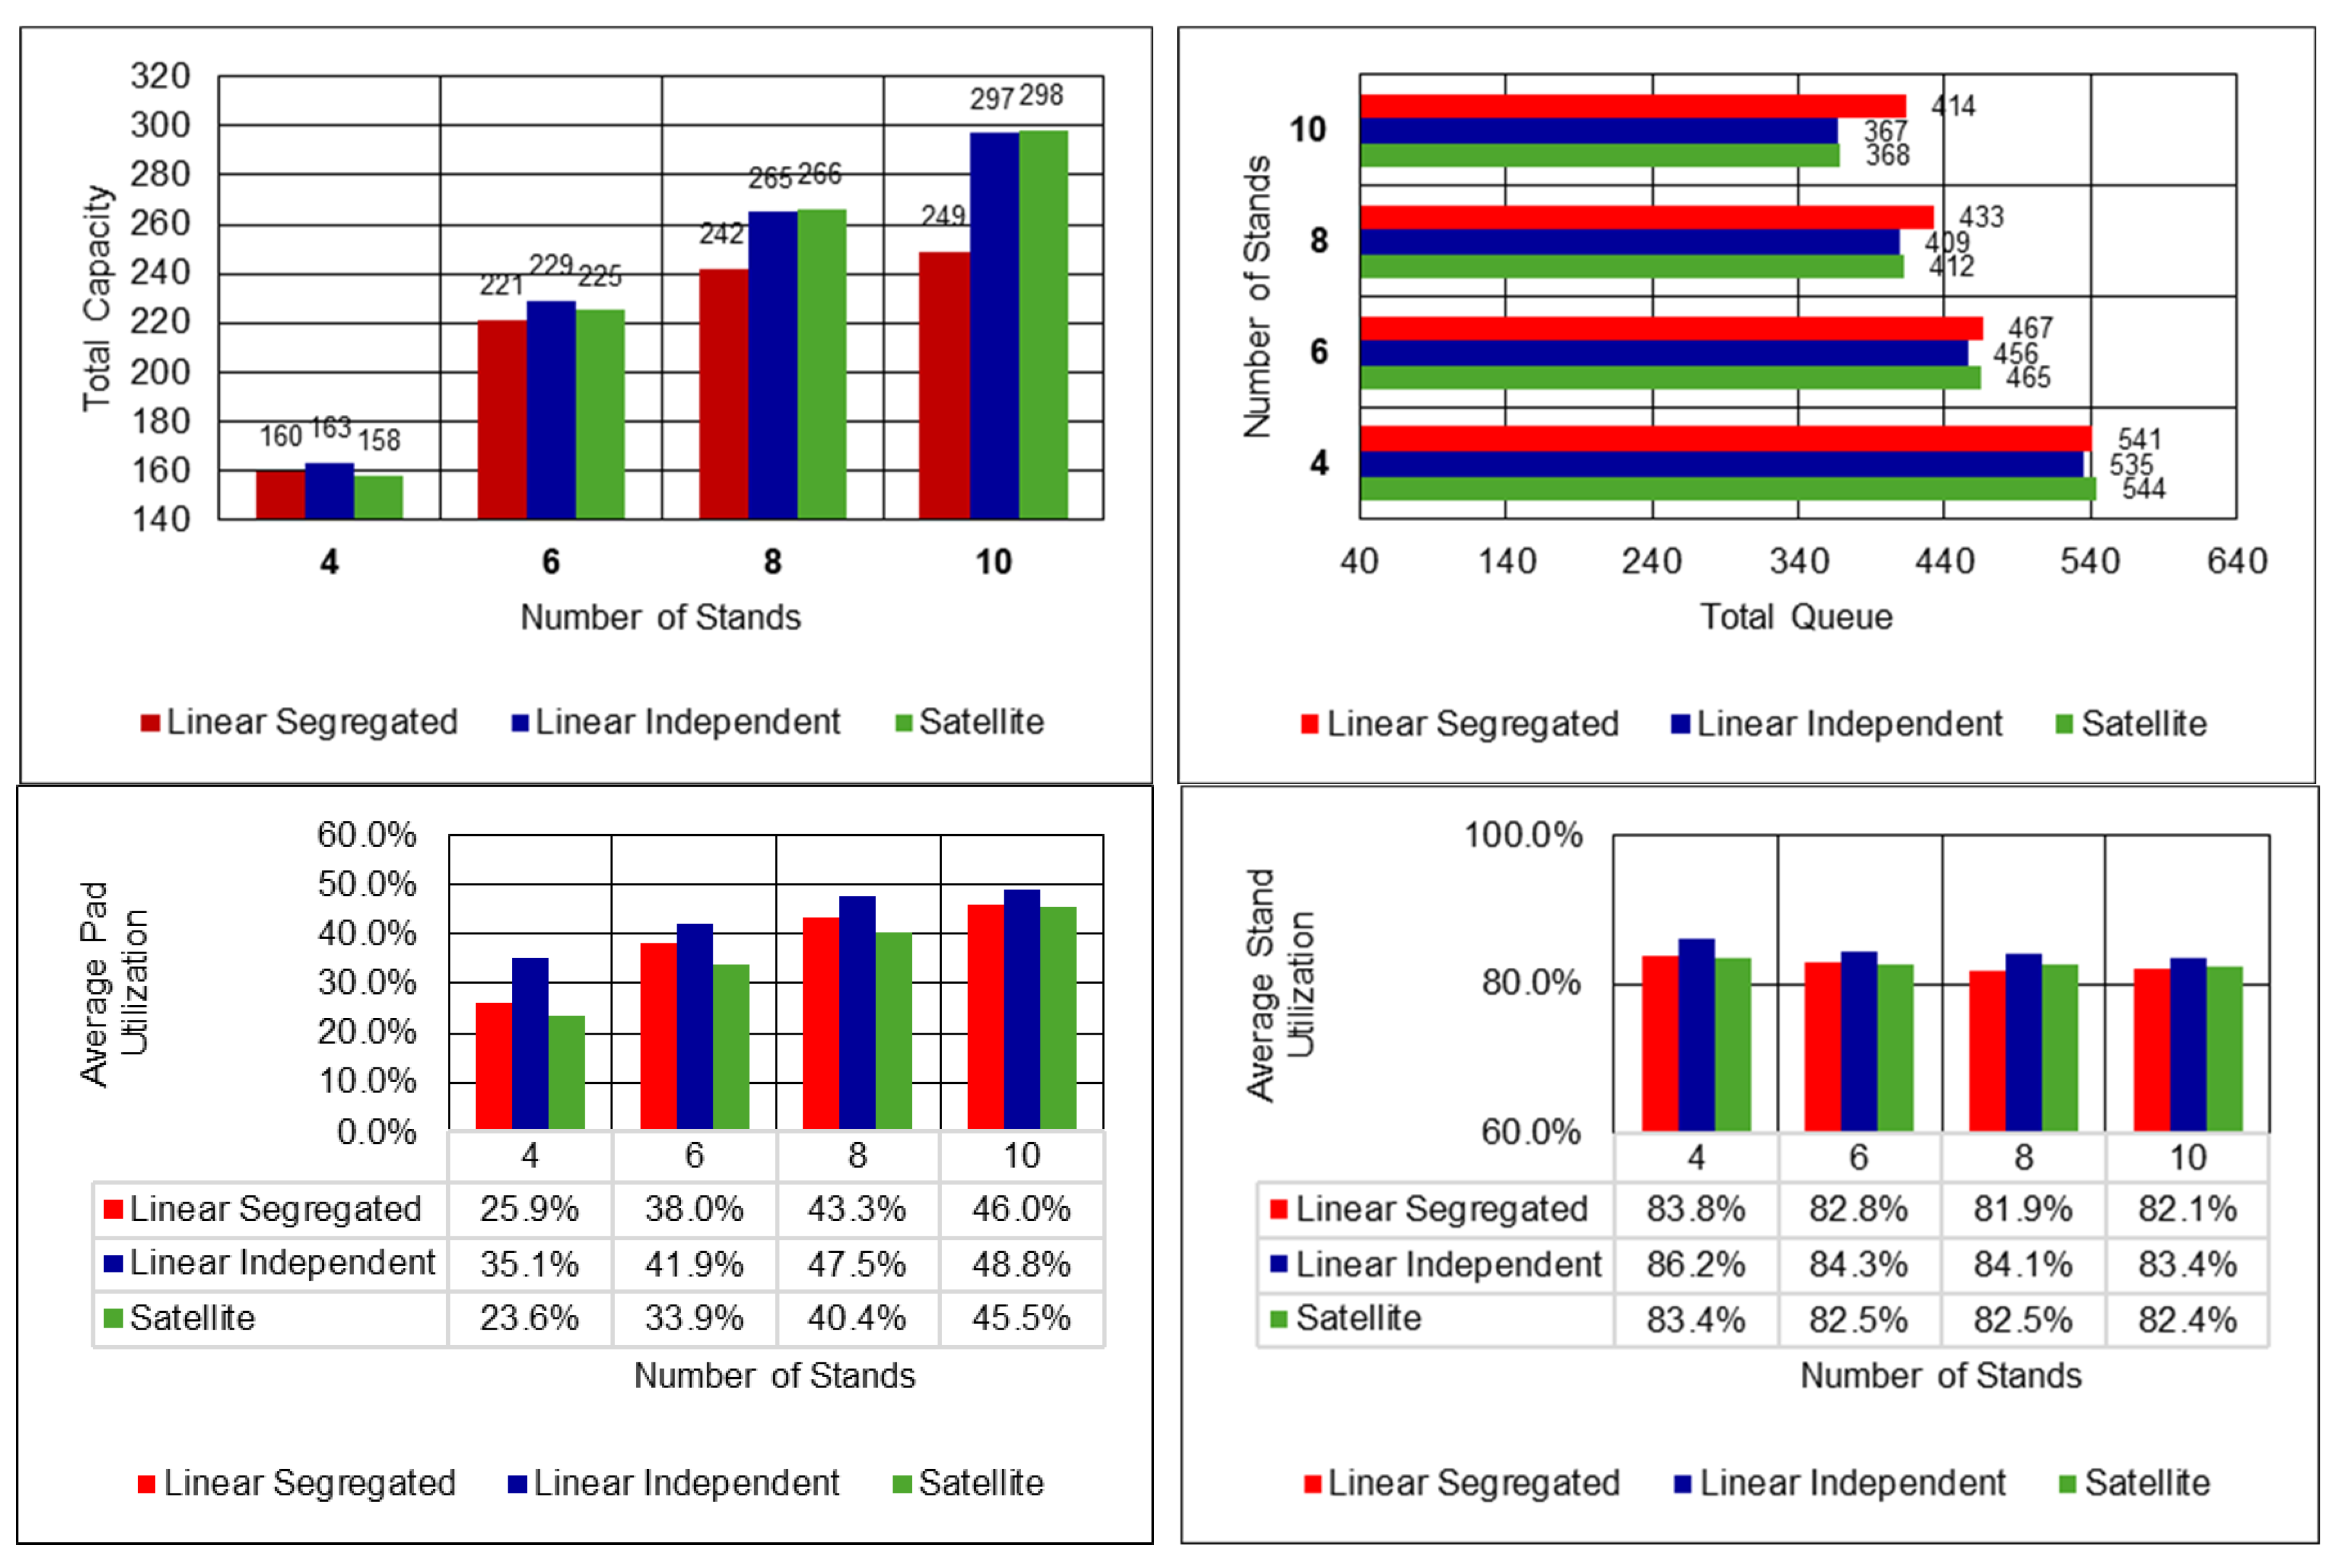
Figure 18.
Simulation results of Linear-Segregated vertiport under Stochastic TAT.
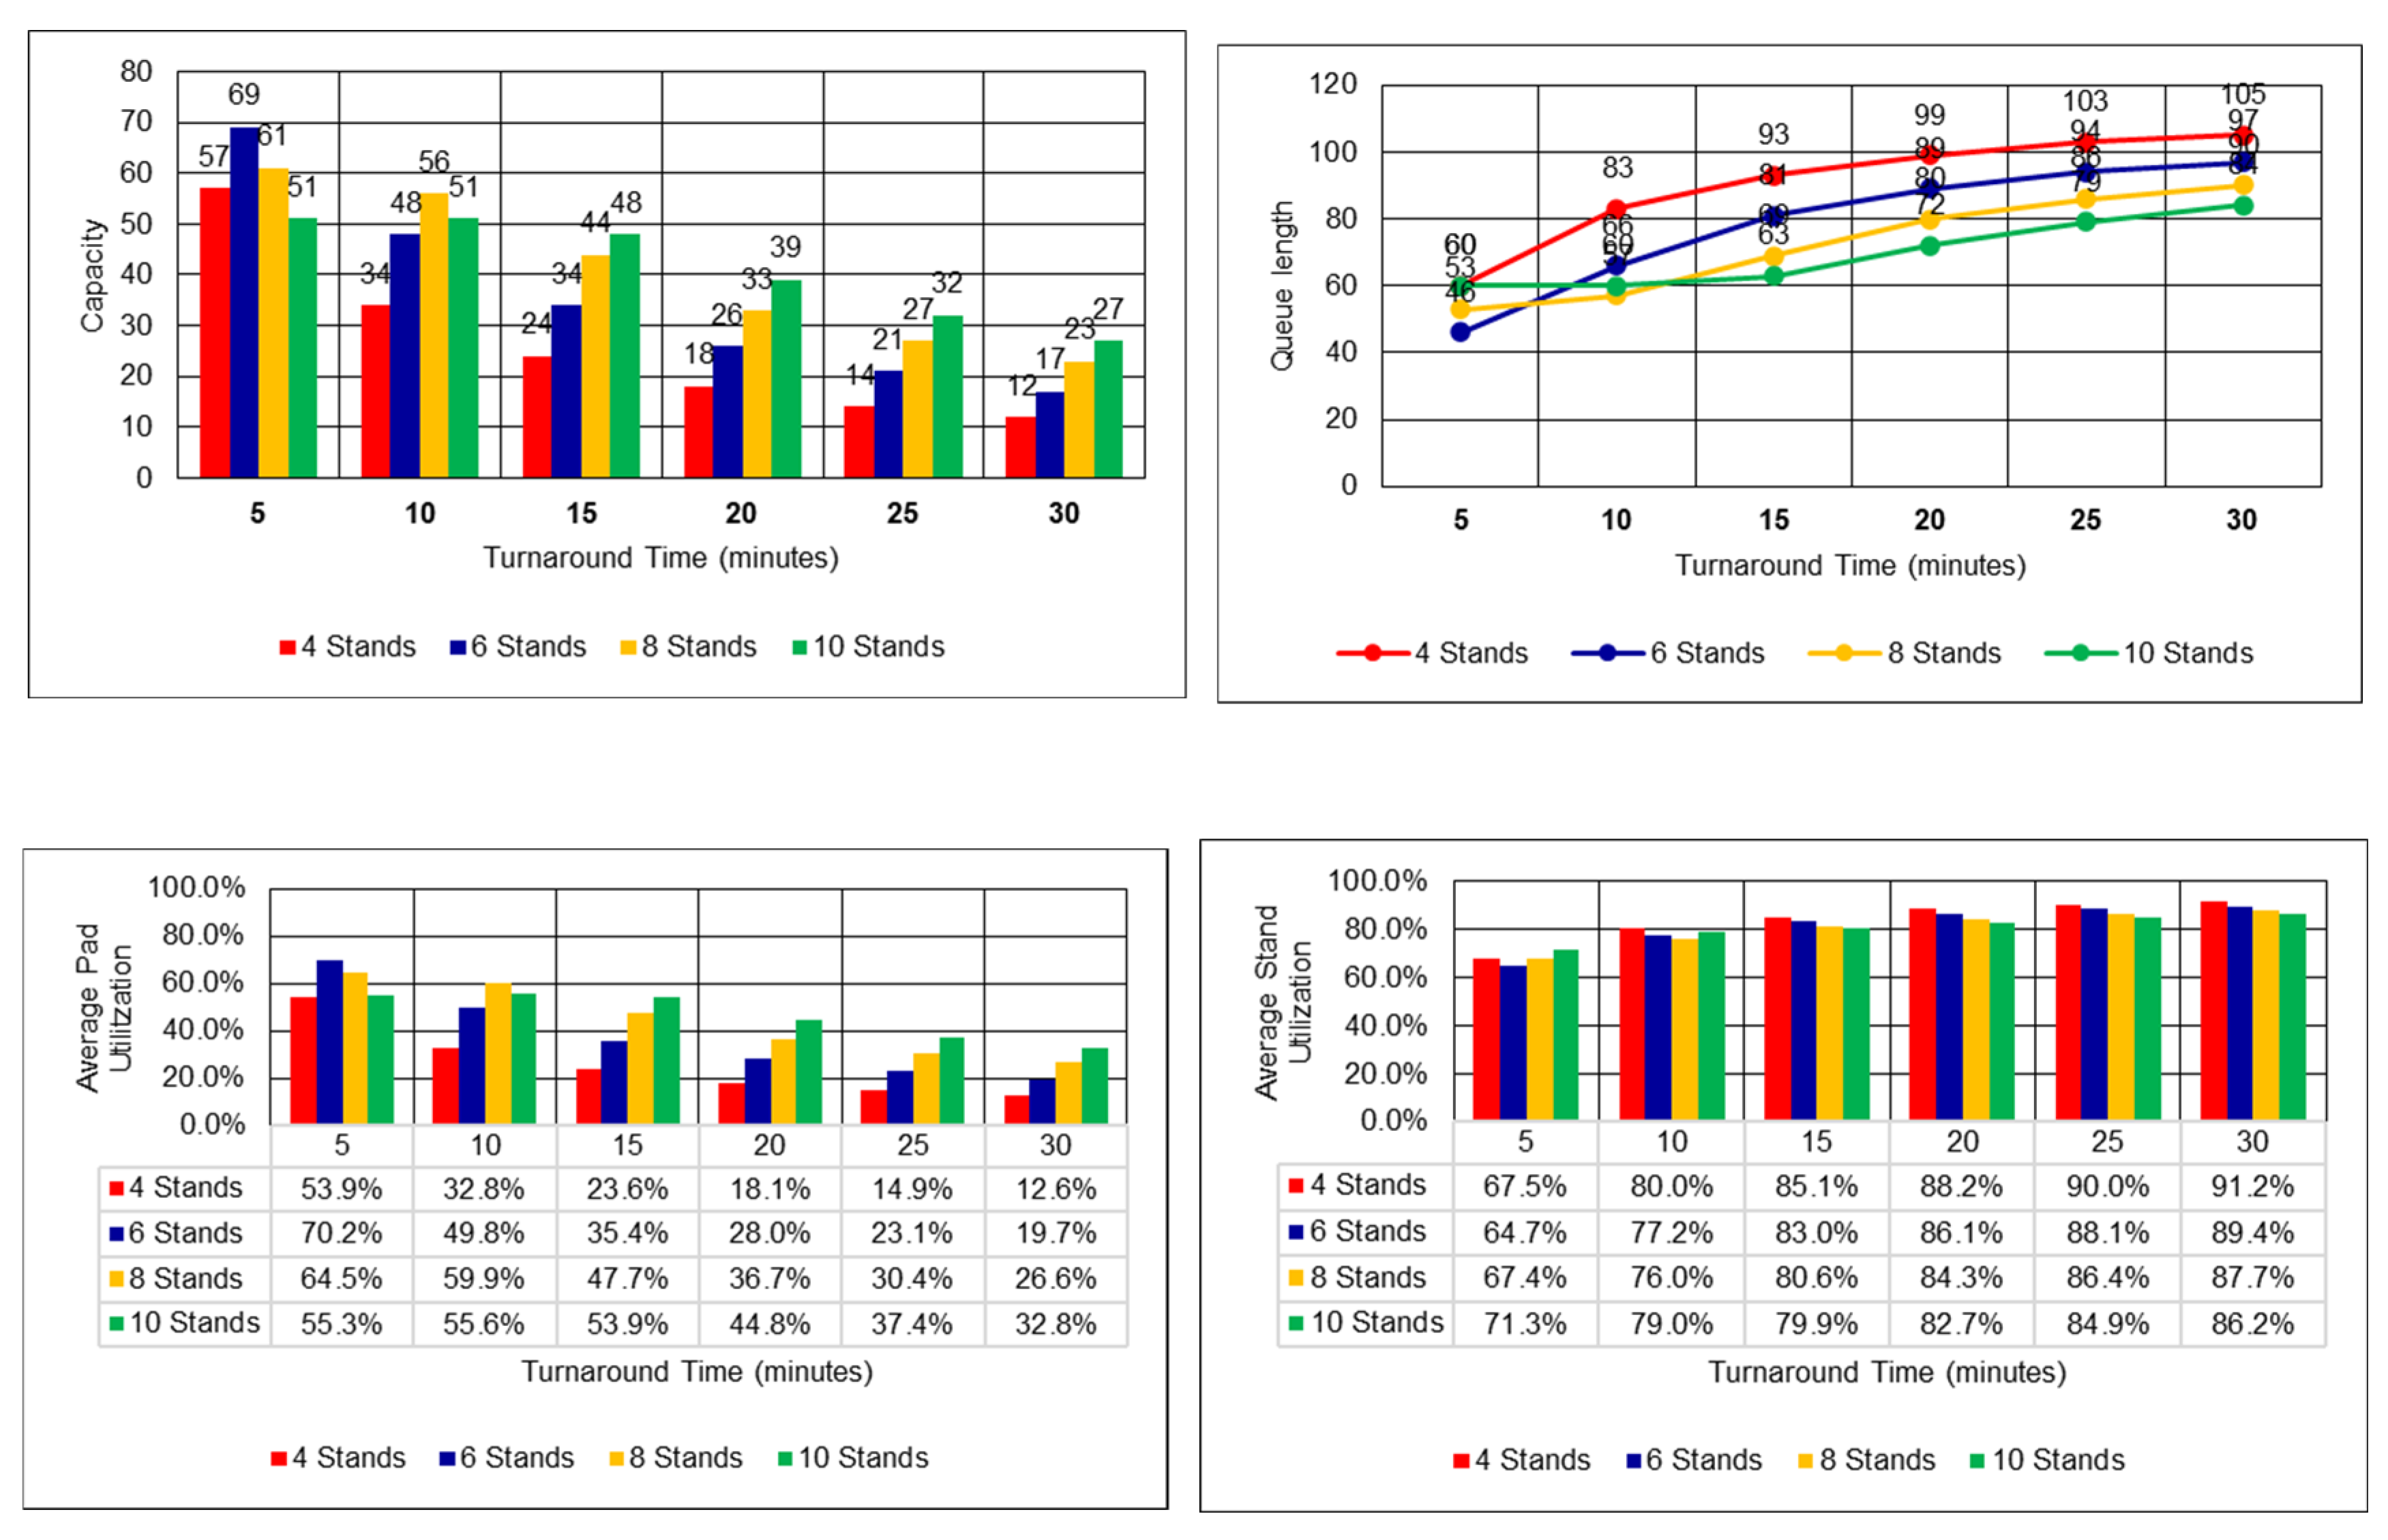
Figure 19.
Simulation results of Linear-Independent vertiport under Stochastic TAT.
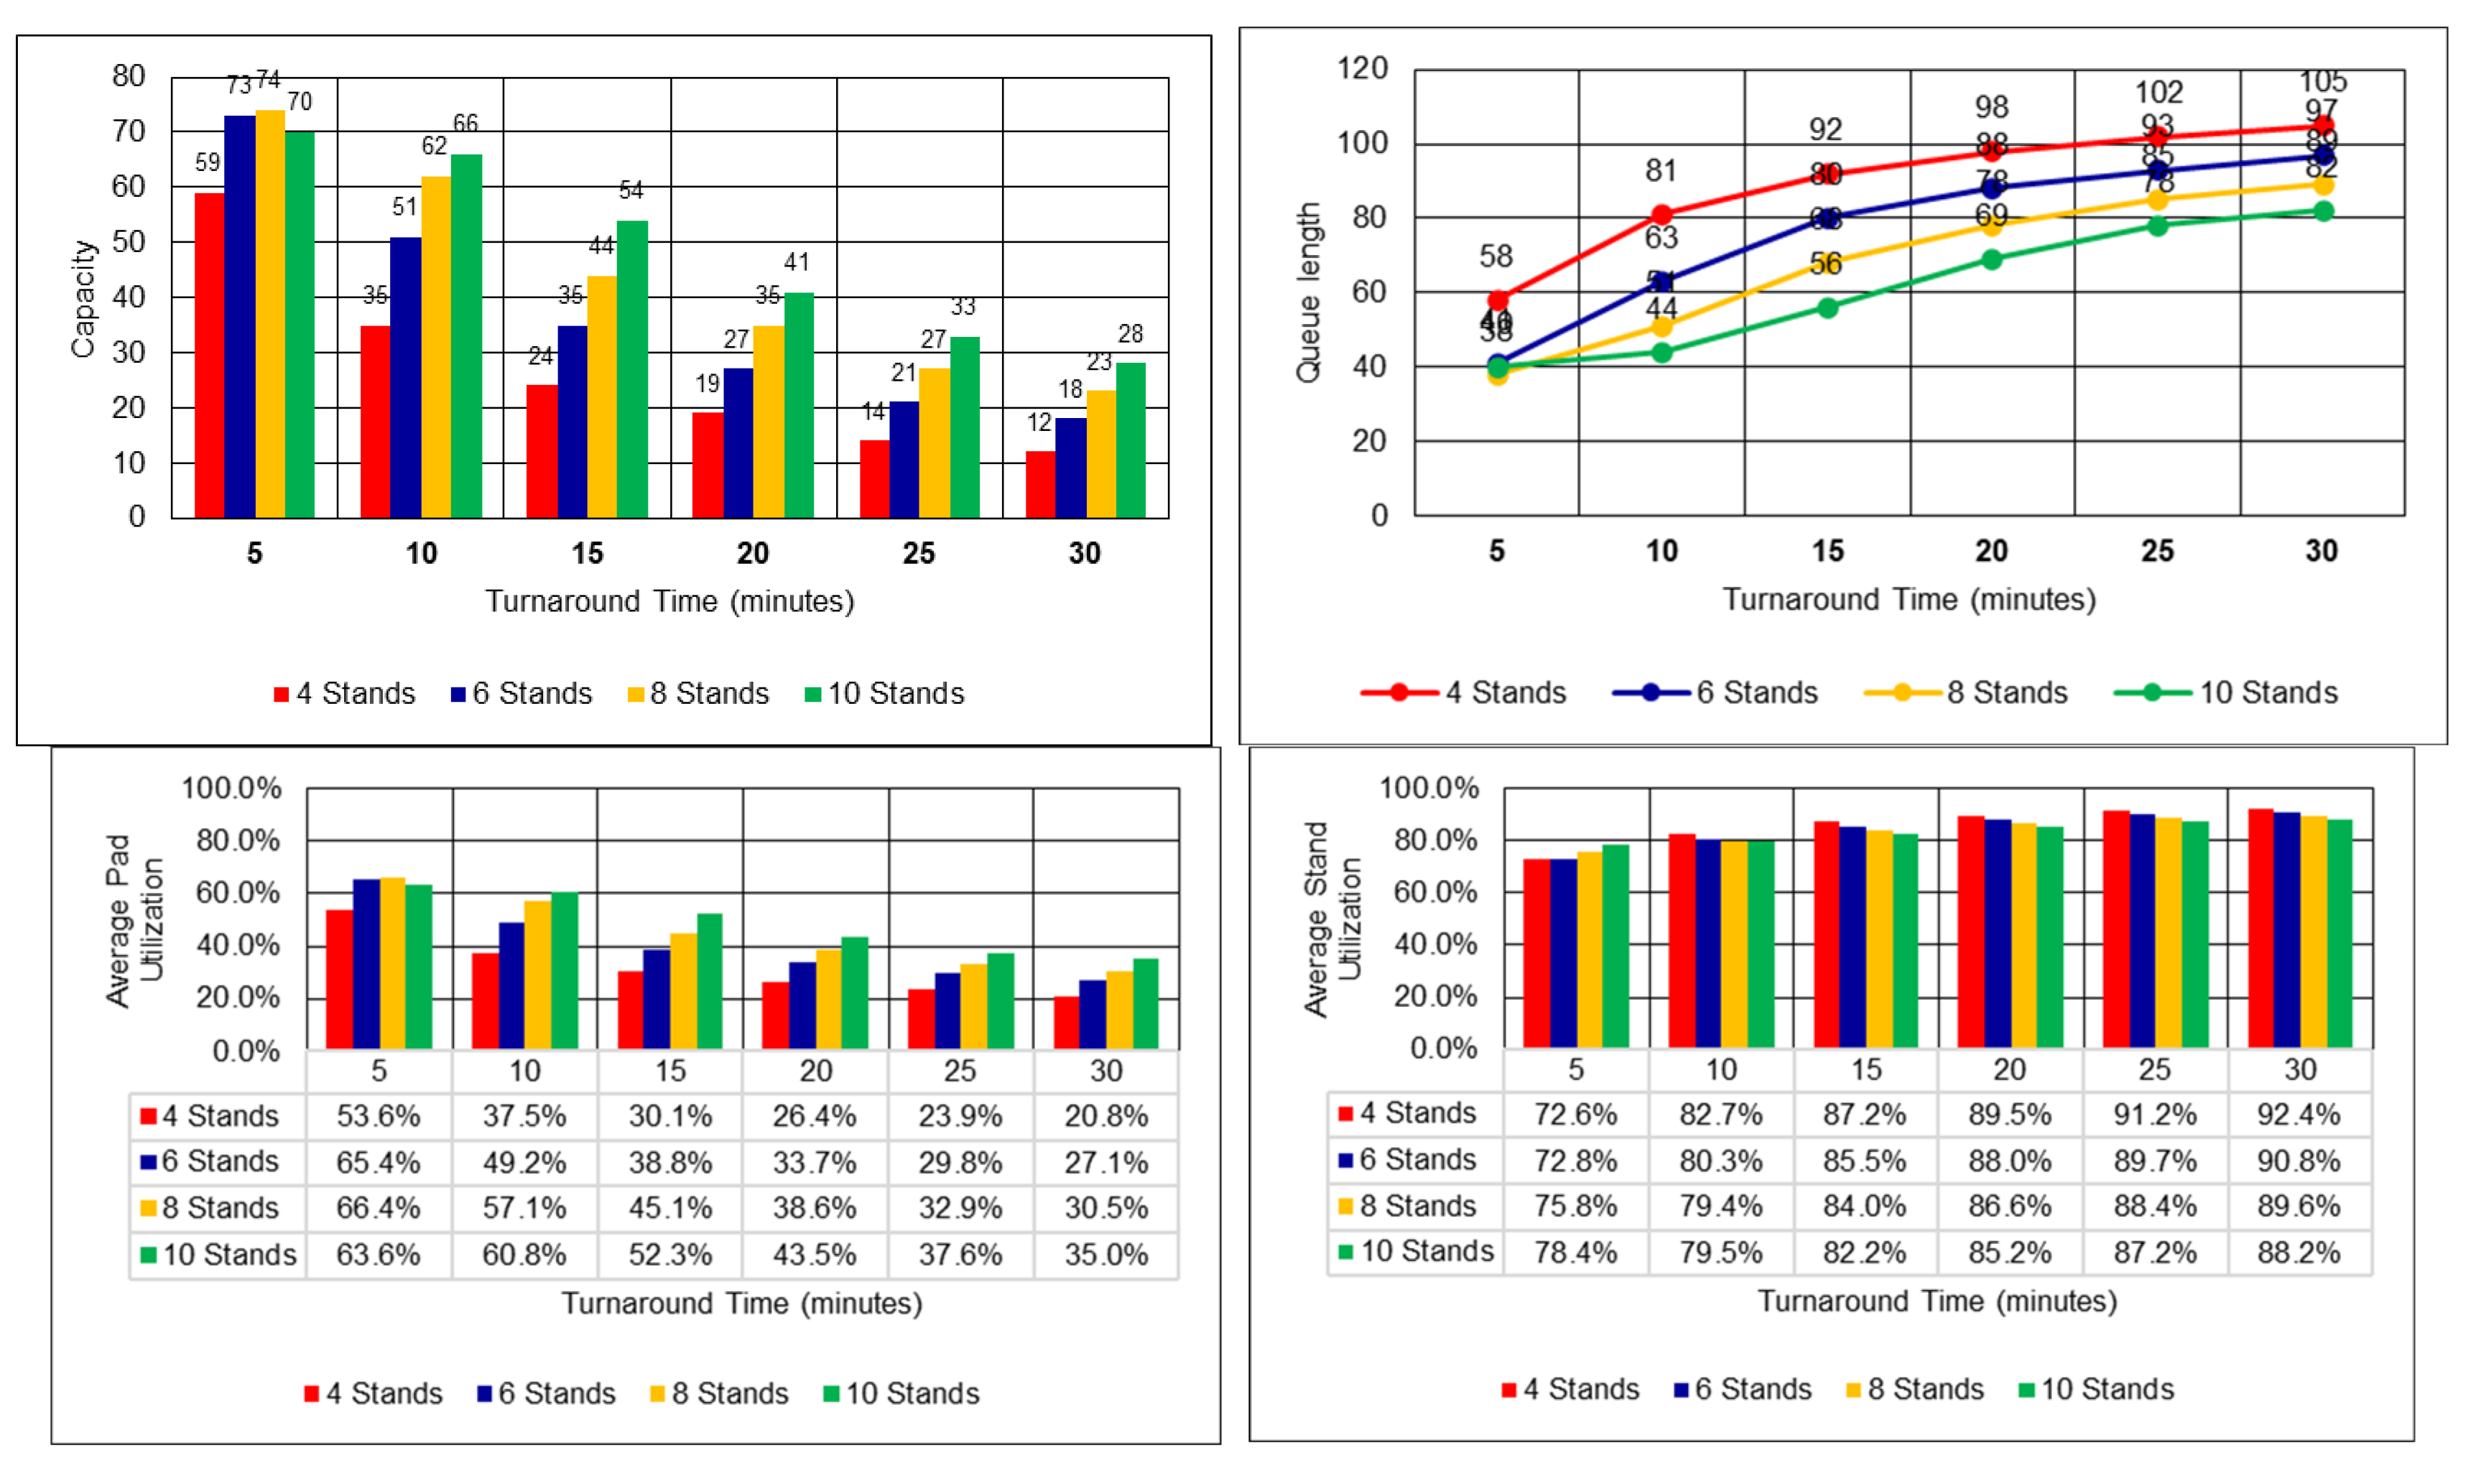
Figure 20.
Simulation results of Linear-Independent vertiport under Stochastic TAT.
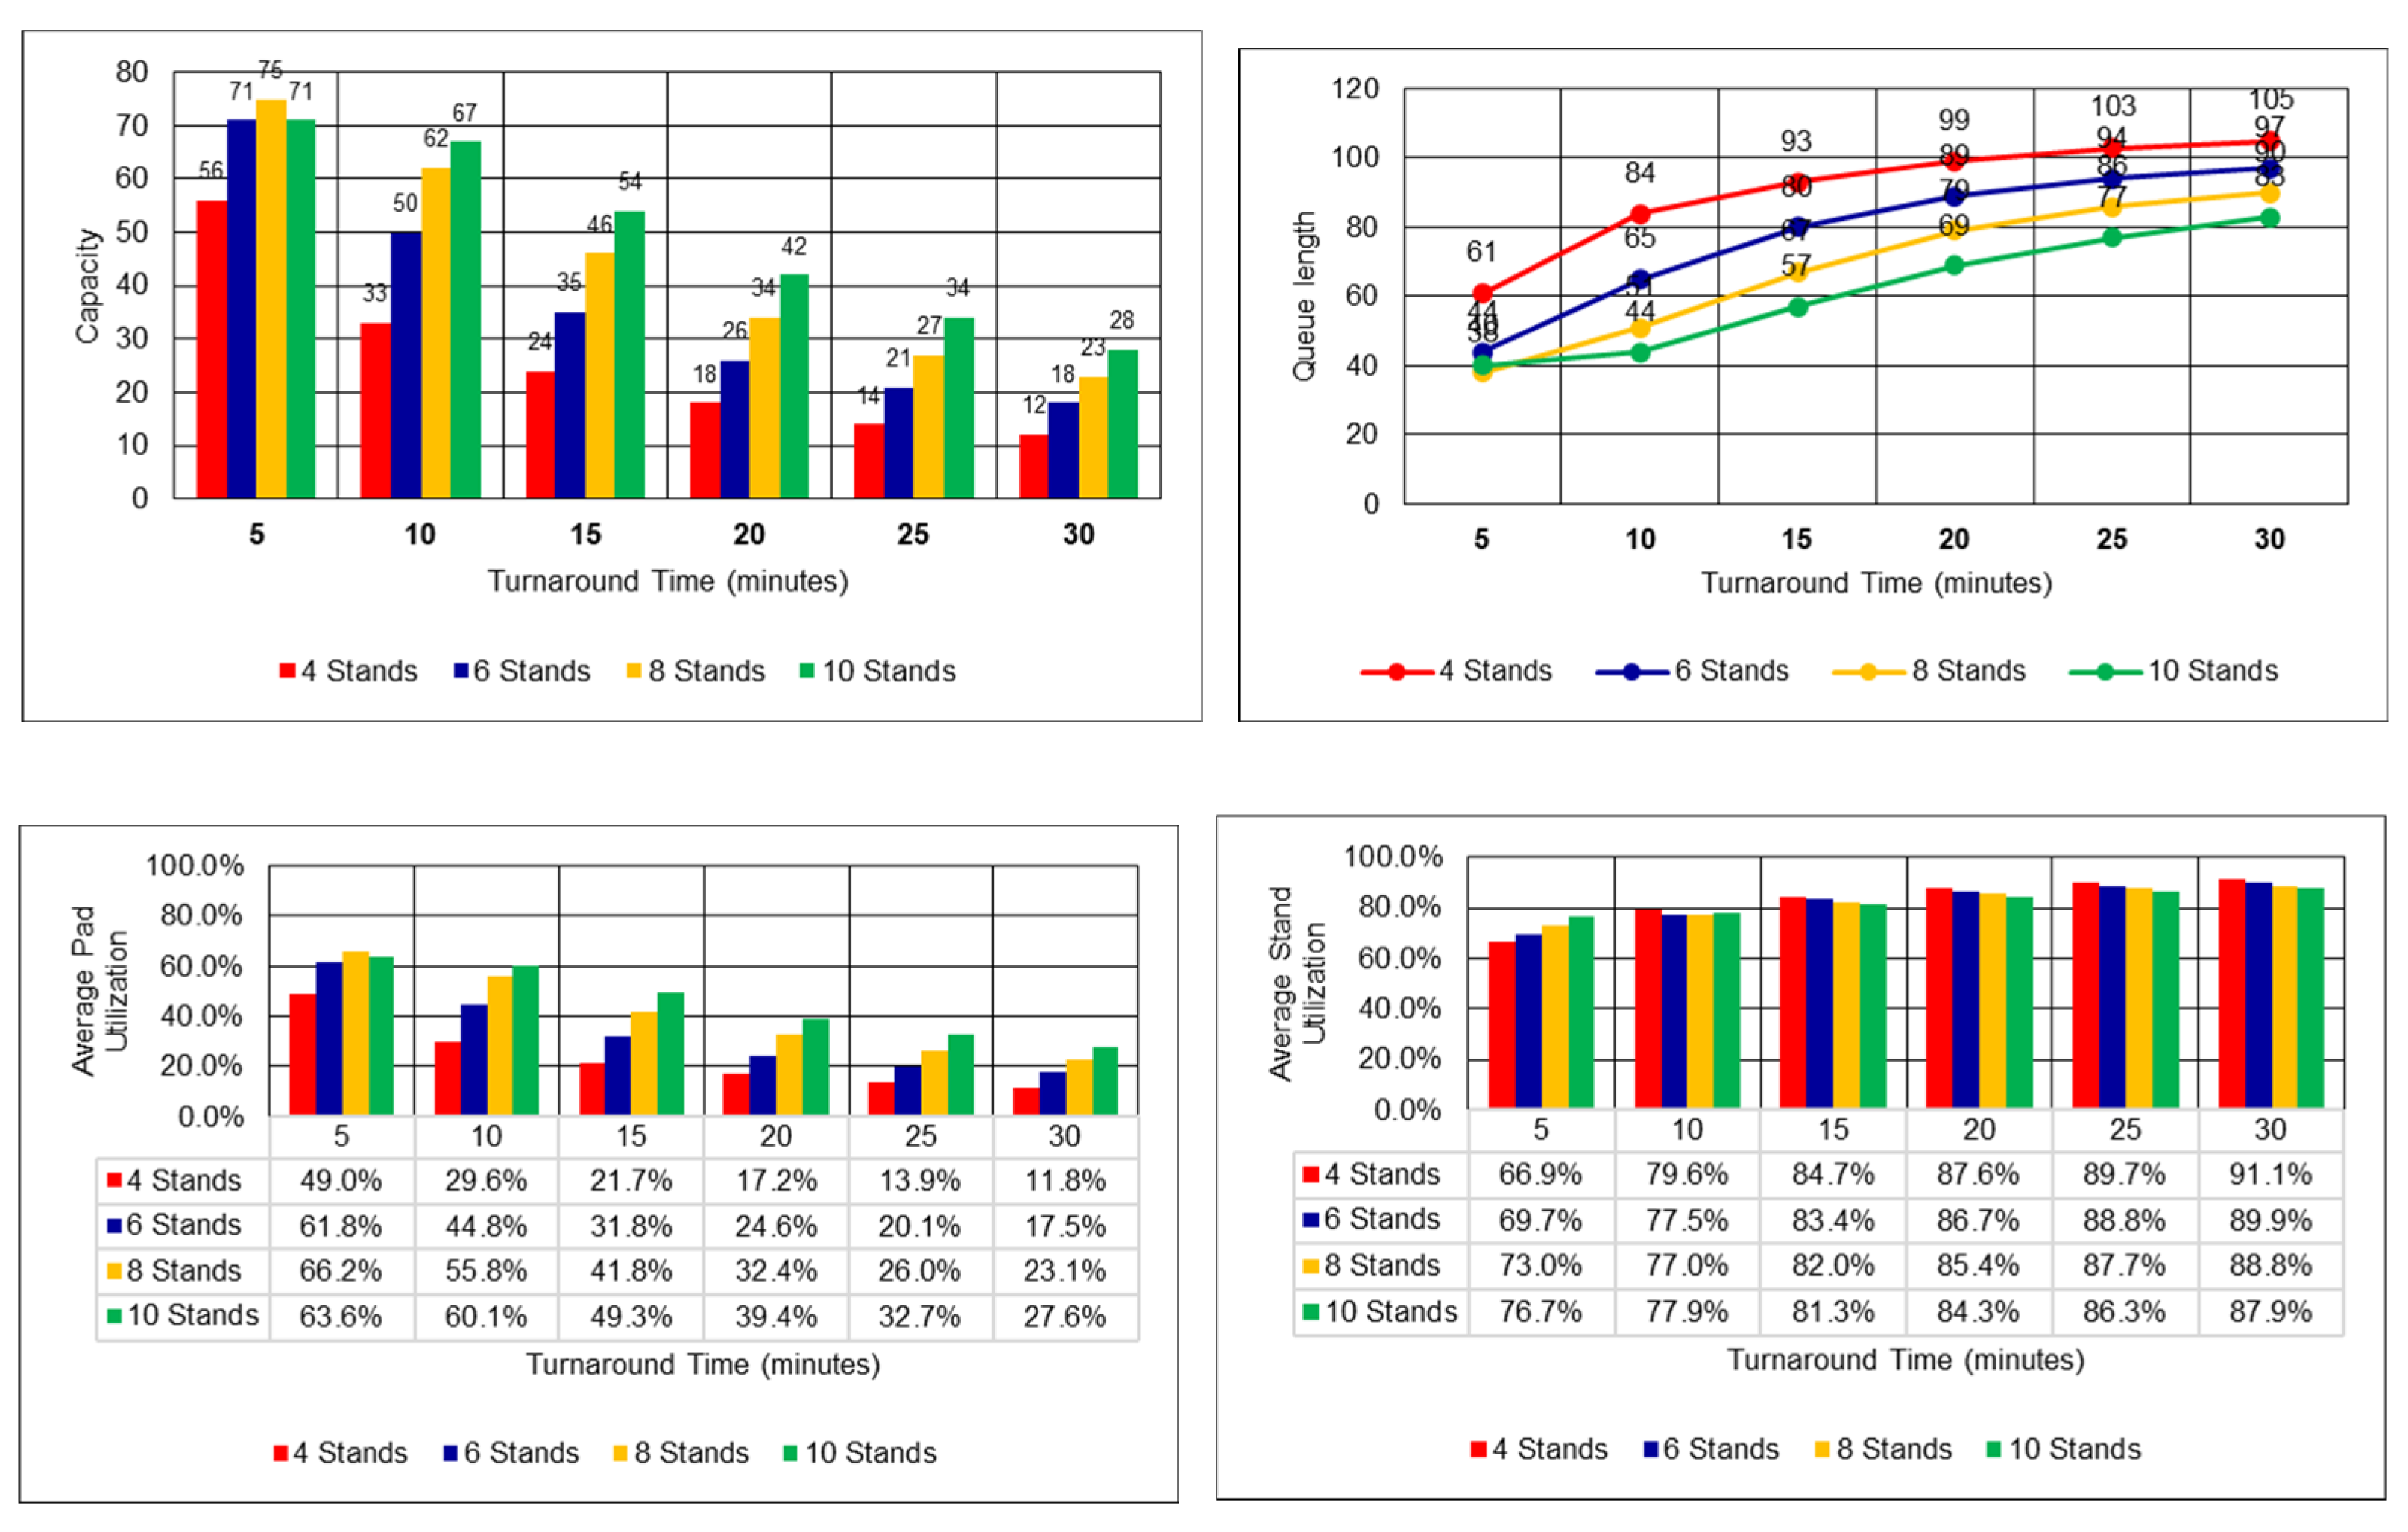
Figure 21.
Total performance comparison of vertiport configurations, stochastic TAT.
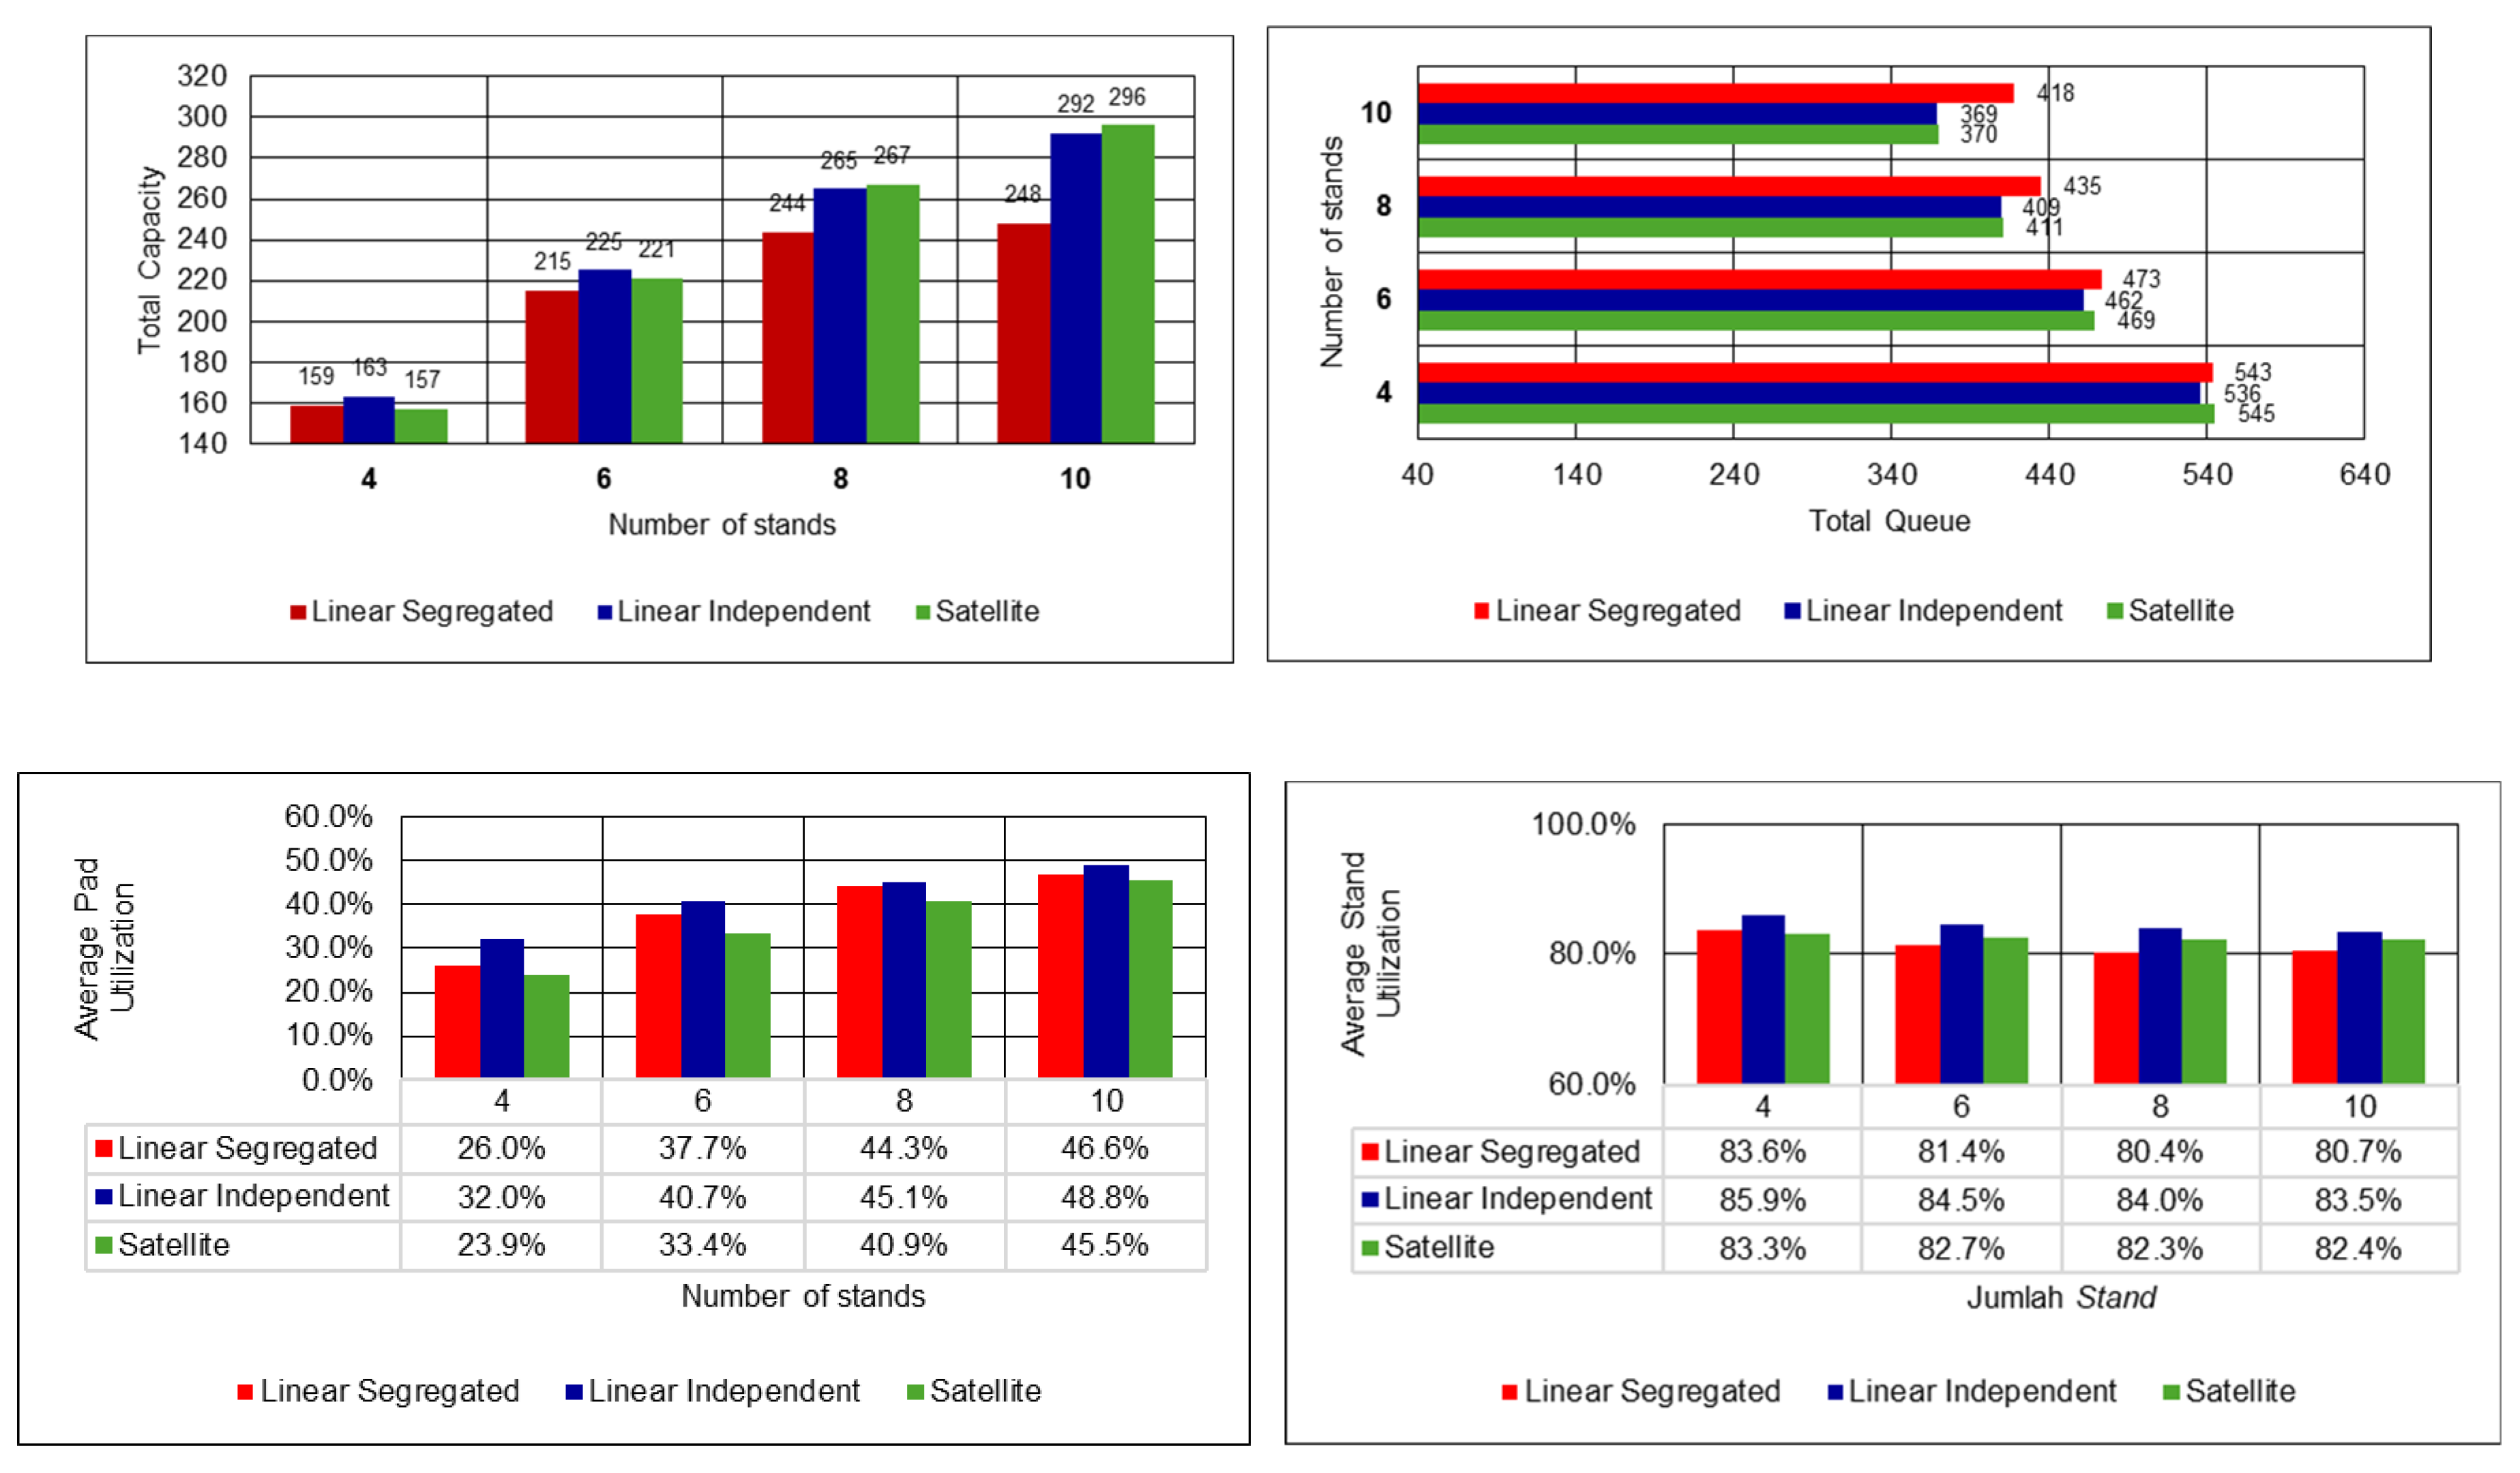
Figure 22.
Total performance comparison of vertiport configurations, stochastic TAT.
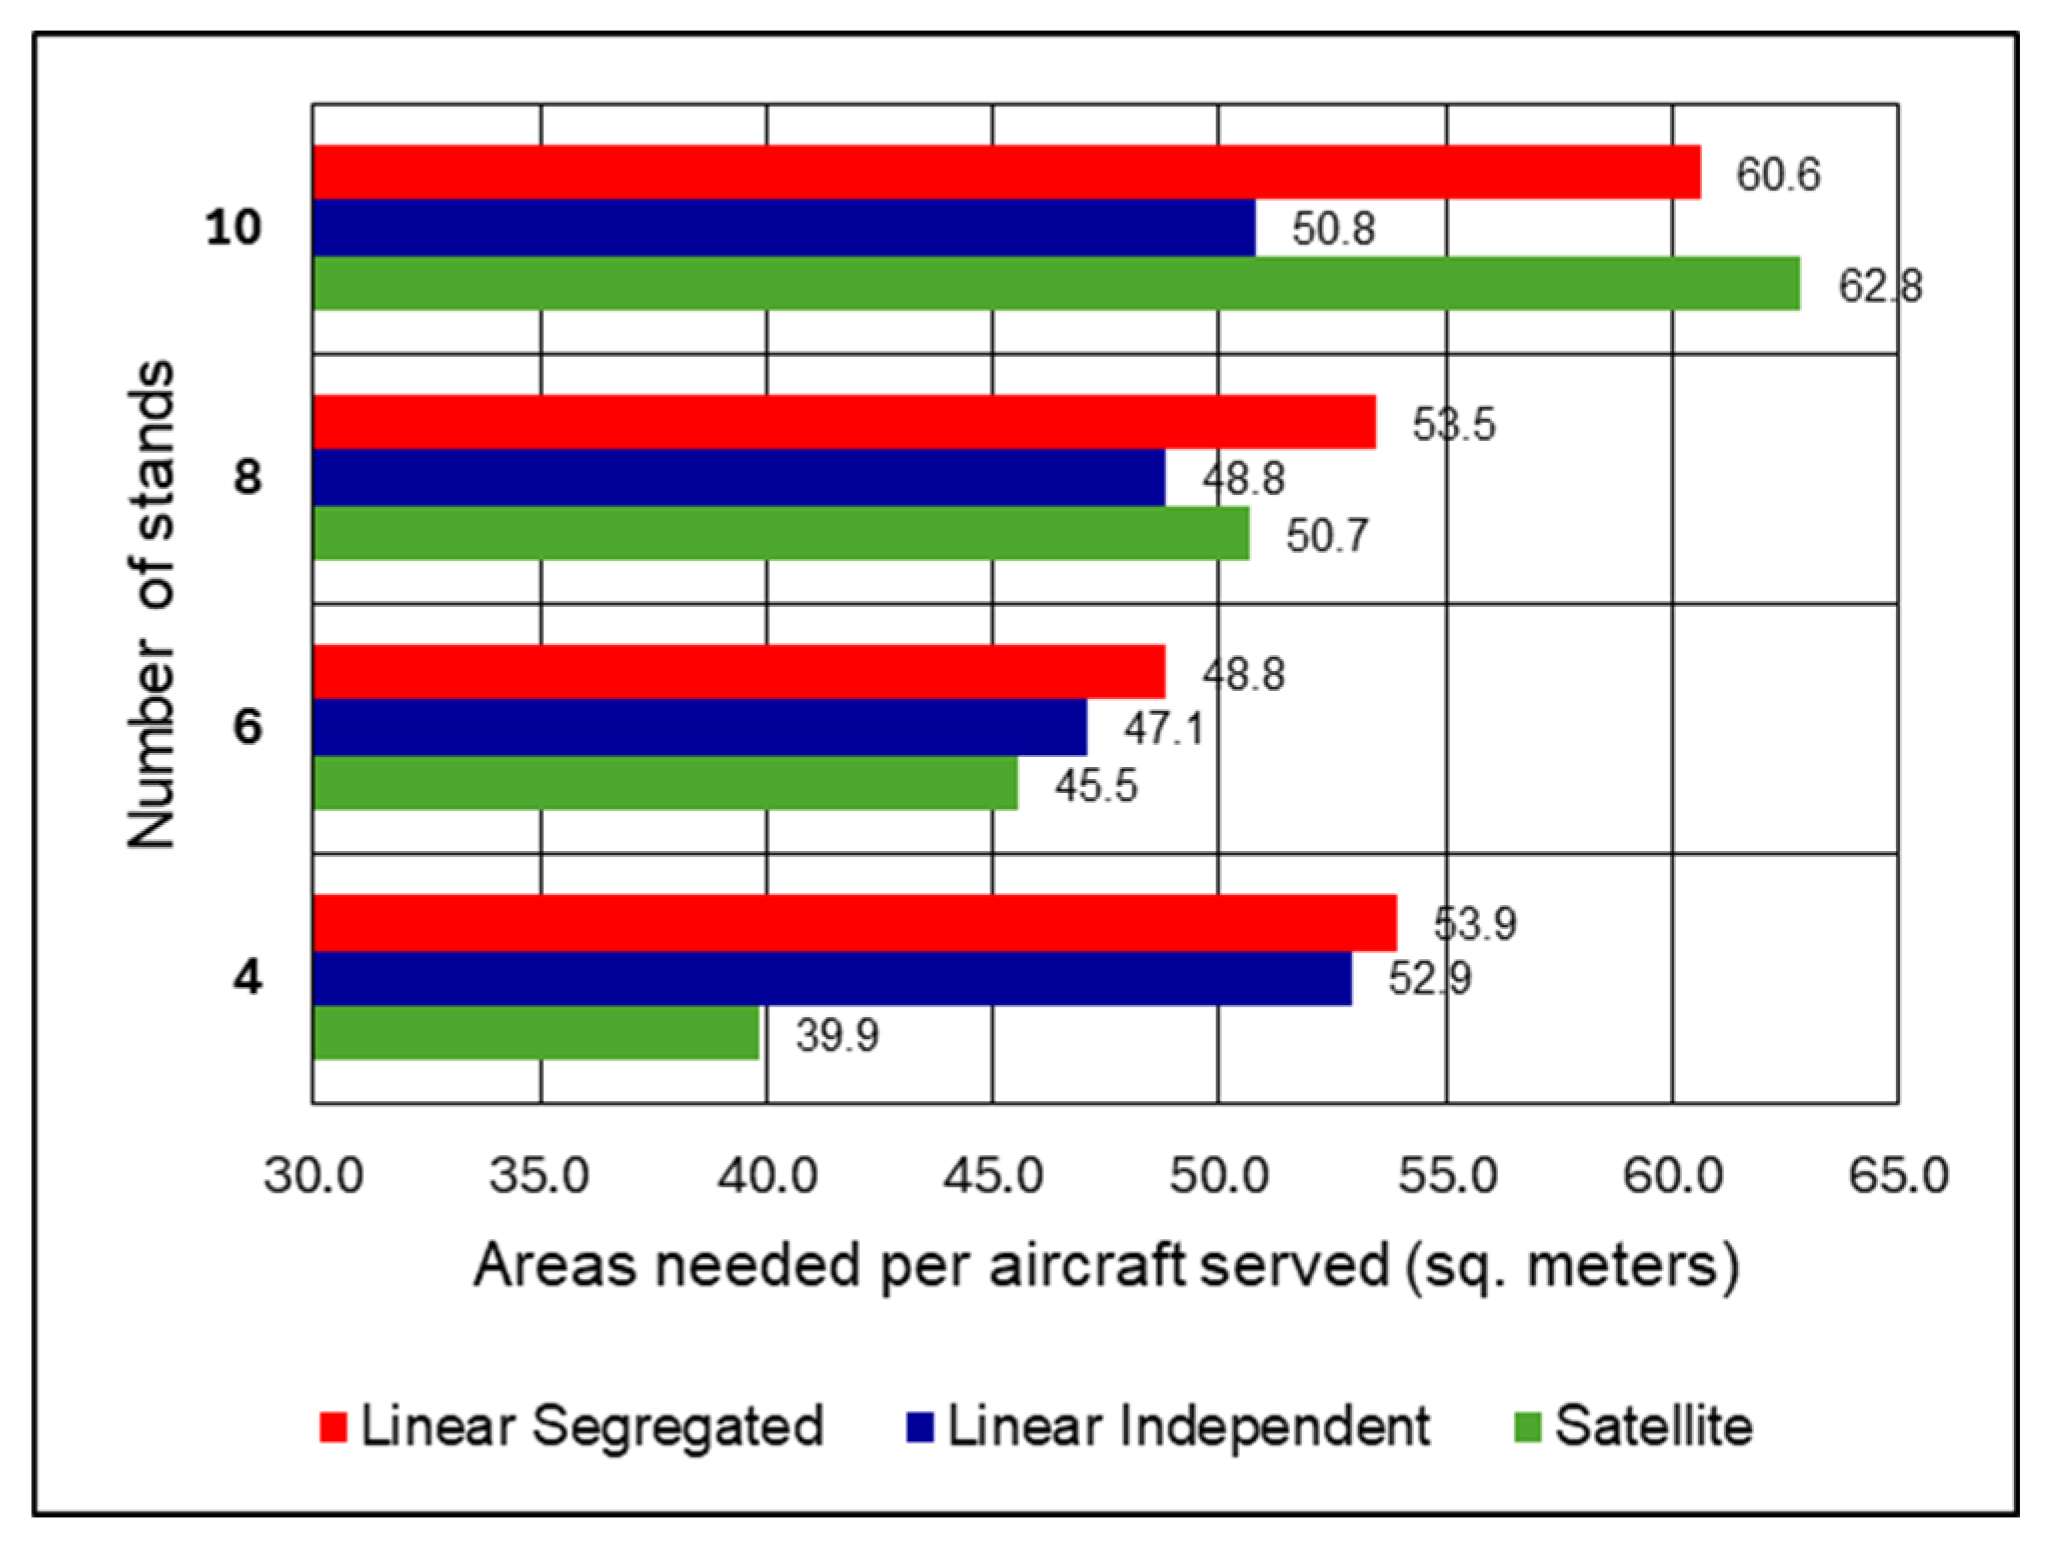
Table 1.
Dimensions of eVTOL aircraft already in operation [5], adapted.
Table 1.
Dimensions of eVTOL aircraft already in operation [5], adapted.
| Aircraft Name | Pax | Configuration | Tip-to-tip Span (m) |
Width (m) | Maximum Dimension (m) |
|---|---|---|---|---|---|
| A3 Vahana Beta | 2 | Tilted wing | 8.68 | 6.28 | 8.68 |
| AirspaceX MoBi | 4 | Tilted wing | 12.19 | 12.19 | 12.19 |
| Carter Air Taxi | 6 | Compound rotorcraft |
13.72 | 13.72 | 13.72 |
| Joby S4 | 4 | Tilted wing | 13.11 | 10.67 | 13.11 |
| Aurora | 2 | Lift and cruise | 8.90 | 7.98 | 8.90 |
| Kitty Hawk Cobra | 2 | Lift and cruise | 10.2 | 10.67 | 10.67 |
| Volocopter 2X | 2 | Multicopter | 9.75 | 9.14 | 9.75 |
| Ehang EH216 | 2 | Multicopter | 5.64 | 5.64 | 5.64 |
Table 2.
Vertiport design dimensions based on EASA PTS-VPT-DSN.
| Attributes | Dimension Specification | Resulted Dimension |
|---|---|---|
| TLOF diameter (DTLOF) | 1D | 14 m |
| FATO diameter (DFATO) | 1.5D | 21 m |
| Safety Area (SA) | 3 m or 0.25D | 3.5 m |
| Pad total dimension (DPad) |
2 D | 28 m |
| Stand | 1.2D | 16.8 m |
| Stand Protection Area | 0.4D | 5.6 m |
| Stand total dimension (DStand) | 2D | 28 m |
| Taxi-route dimension | 1.5D | 21 m |
Table 3.
Vertiport total footprint.
| Configuration | Linear topology (m2) | Satellite topology (m2) |
|---|---|---|
| 4 stands | 8624 | 6300 |
| 6 stands | 10780 | 10248 |
| 8 stands | 12935 | 13480 |
| 10 stands | 15092 | 18729 |
Table 4.
Terminal and stand distances.
| Number of Stand | Distance from Terminal to Linear Stand- (meter) | |||||||||
|---|---|---|---|---|---|---|---|---|---|---|
| 1 | 2 | 3 | 4 | 5 | 6 | 7 | 8 | 9 | 10 | |
| 4 | 77 | 28 | 77 | 28 | - | - | - | - | - | - |
| 6 | 91 | 42 | 63 | 14 | 91 | 42 | - | - | - | - |
| 8 | 105 | 56 | 77 | 28 | 77 | 28 | 105 | 56 | - | - |
| 10 | 119 | 70 | 91 | 42 | 63 | 14 | 91 | 42 | 119 | 70 |
| Number of Stand | Distance from Terminal to Satellite Stand- (meter) | |||||||||
| 1 | 2 | 3 | 4 | 5 | 6 | 7 | 8 | 9 | 10 | |
| 4 | 28.3 | 56.3 | 28.3 | 58.3 | - | - | - | - | - | - |
| 6 | 47.8 | 47.8 | 87.4 | 47.8 | 47.8 | 87.4 | - | - | - | - |
| 8 | 52.2 | 42 | 70 | 108.2 | 52.2 | 42 | 70 | 108.2 | - | - |
| 10 | 64.6 | 49.4 | 64.6 | 101.2 | 137.8 | 64.6 | 49.4 | 64.6 | 101.2 | 137.8 |
Table 5.
Passenger embarkation time.
| Number of Stand | Time from Terminal to Linear Stand- (seconds) | |||||||||
| 1 | 2 | 3 | 4 | 5 | 6 | 7 | 8 | 9 | 10 | |
| 4 | 57.38 | 20.86 | 57.38 | 20.86 | - | - | - | - | - | - |
| 6 | 67.8 | 31.3 | 46.9 | 10.4 | 67.8 | 31.3 | - | - | - | - |
| 8 | 78.2 | 41.7 | 57.4 | 20.9 | 57.4 | 20.9 | 78.2 | 41.7 | - | - |
| 10 | 88.7 | 52.2 | 67.8 | 31.3 | 46.9 | 10.4 | 67.8 | 31.3 | 88.7 | 52.2 |
| Number of Stand | Time from Terminal to Satellite Stand- (seconds) | |||||||||
| 1 | 2 | 3 | 4 | 5 | 6 | 7 | 8 | 9 | 10 | |
| 4 | 21.1 | 41.9 | 21.1 | 41.9 | - | - | - | - | - | - |
| 6 | 35.6 | 35.6 | 65.1 | 35.6 | 35.6 | 65.1 | - | - | - | - |
| 8 | 38.9 | 31.3 | 52.2 | 80.7 | 38.9 | 31.3 | 52.2 | 80.7 | - | - |
| 10 | 48.1 | 36.8 | 48.1 | 75.4 | 102.6 | 48.1 | 36.8 | 48.1 | 75.4 | 102.6 |
Table 6.
Distance from Pad 1 to stands.
| Number of Stand | Distance from Pad 1 to Linear Stand- (meter) | |||||||||
| 1 | 2 | 3 | 4 | 5 | 6 | 7 | 8 | 9 | 10 | |
| 4 | 52.5 | 52.5 | 80.5 | 80.5 | - | - | - | - | - | - |
| 6 | 52.5 | 52.5 | 80.5 | 80.5 | 108.5 | 108.5 | - | - | - | - |
| 8 | 52.5 | 52.5 | 80.5 | 80.5 | 108.5 | 108.5 | 136.5 | 136.5 | - | - |
| 10 | 52.5 | 52.5 | 80.5 | 80.5 | 108.5 | 108.5 | 136.5 | 136.5 | 164.5 | 164.5 |
| Number of Stand | Distance from Pad 1 to Satellite Stand- (meter) | |||||||||
| 1 | 2 | 3 | 4 | 5 | 6 | 7 | 8 | 9 | 10 | |
| 4 | 31.3 | 31.3 | - | - | - | - | - | - | - | - |
| 6 | 34.3 | 47.7 | 34.3 | - | - | - | - | - | - | - |
| 8 | 39.6 | 54.1 | 54.1 | 39.6 | - | - | - | - | - | - |
| 10 | 46.1 | 59.8 | 64.6 | 59.8 | 46.1 | - | - | - | - | - |
Table 8.
Operation parameters of vertiport simulations.
| Parameters | Value |
| Number of stands variation | 4, 6, 8, 10 |
| Turnaround time variation | 5, 10, 15, 20, 25, 30 minutes |
| Embarkation time | Table 5 |
| Ground taxi movement time | Table 7 |
| Landing time | 1 minute |
| Takeoff time | 1 minute |
| Simulation total time | 120 minutes |
Table 9.
Comparison between operational concepts.
| Configuration | Vertiport Capacity (aircraft) | |||
| 4 Stands | 6 Stands | 8 Stands | 10 Stands | |
| Linear-Segregated | 160 | 221 | 242 | 249 |
| Linear-Independent | 161 | 229 | 265 | 297 |
| Differences | 1.9% | 3.9% | 9.5% | 19.3% |
Disclaimer/Publisher’s Note: The statements, opinions and data contained in all publications are solely those of the individual author(s) and contributor(s) and not of MDPI and/or the editor(s). MDPI and/or the editor(s) disclaim responsibility for any injury to people or property resulting from any ideas, methods, instructions or products referred to in the content. |
© 2026 by the authors. Licensee MDPI, Basel, Switzerland. This article is an open access article distributed under the terms and conditions of the Creative Commons Attribution (CC BY) license (http://creativecommons.org/licenses/by/4.0/).
Copyright: This open access article is published under a Creative Commons CC BY 4.0 license, which permit the free download, distribution, and reuse, provided that the author and preprint are cited in any reuse.


