
Submitted:
25 February 2026
Posted:
28 February 2026
You are already at the latest version
Abstract
Early and recent studies have demonstrated that exposure to moonlight influences the entire life cycle of plants from seed germination to vegetative growth and reproduction. Exposure to moonlight was found to induce genome reorganization in plants and significant changes in gene expression, protein, and metabolite profiles. However, the specific factors that facilitate moonlight perception are unknown. To uncover the photoreceptors responsible for moonlight perception, we analyzed Arabidopsis phototropin mutants (phot1, phot2, and phot1phot2) as well as the phytochrome mutants phyA and phyB for their response to full moonlight (FML). De-etiolation assays revealed that plants do perceive and respond to FML within 5 h of exposure. Thus, among the photoreceptor mutants analyzed, only phot1 and phot1phot2 were impaired in apical hook opening and cotyledon unfolding under FML. Interestingly, under high light intensity, all examined mutants have undergone proper de-etiolation. Further analysis showed that phot1 as well as phyB mutants were impaired in response to moonlight, displaying no changes in nuclear size and in protein profiles following exposure to FML and were comparable to plants exposed to dark. The FML (5 h exposure) did not induce the formation of fewer, large nuclear photobodies as occurred following 5 h exposure to growth room light. Our findings highlighted phot1 and phyB as photoreceptors necessary for plants to perceive and respond to FML. It is proposed that the initial perception of moonlight is facilitated by the blue light receptor phot1 and is subsequently interpreted into a functional state by the R/FR receptor phyB.
Keywords:
moonlight perception
; de etiolation
; photomorphogenesis
; photoreceptors
; phototropin 1
; phytochrome B
; nuclear morphology
; proteome analysis
; nuclear photobodies
; Arabidopsis thaliana
1. Introduction
The moon orbits around Earth in about 29.5 days. This period is known as the lunar cycle (also called the synodic cycle), which consists of four primary phases: the new moon, first quarter, full moon, and last quarter. The moon reflects sunlight at an essentially similar spectrum but at a very low intensity of about 0.32 lux (eq. to 0.0059 μmol m-2 s-1; Kyba et al. 2017), which is significantly lower than sunlight intensity (~2000 μmol m-2 s-1) and below the minimal intensity required for photosynthesis (0.1 μmol m-2 s-1; Raven and Cockell 2006). In addition to its low intensity, moonlight exhibits notable spectral differences compared to sunlight; the red to far-red (R:FR) ratio of sunlight during the day exceeds 1.2, whereas the R:FR ratio of moonlight falls between 0.18 and 0.22 (Breitler et al. 2020). Notably, the distinctive characteristics of moonlight reminiscent of the drop-down in light intensity and R:FR ratio when plants shade each other (Smith, 1982; Smith 2000).
Traditional lunar farming constitutes a unique agricultural approach where planting, harvesting, and other agronomical activities are coordinated with the phases of the moon with the aim to improve crop growth and enhance yields (Zürcher 2011; Sivasankari and Thimmaiah 2021). Yet, this agricultural approach is often regarded as a myth, but recent studies have begun to uncover the molecular basis for plant response to moonlight and the moon’s impact on plant cell biology (Zurcher 2011; Sannidhi et al. 2026). In Coffea arabica, Breitler et al. (2020) presented strong evidence of transcriptional variation in response to full moonlight (FML), noting significant changes in the expression of clock genes, stress-response genes, and notably, the photoreceptor phot1. Additionally, Singiri et al. (2023) showed that the moonlight induces notable changes in the genome organization of tobacco and mustard plants, accompanied by alterations in DNA methylation and histone modifications, alongside changes in protein and metabolite profiles. Recently, experiments carried out on etiolated seedlings of Arabidopsis have shown that the opening of the apical hook and the unfolding of cotyledons take place after 5 h of exposure to FML, similar to their response to 5 h of light in a growth room (~150 μmol m-2 s-1) (Singiri et al. 2025). This indicates that, despite the moonlight’s low intensity, it is recognized as a signal by as yet unknown photoreceptors that triggers a noticeable response in the plants.
Five photoreceptor classes have been characterized. The phytochrome group consists of five members in Arabidopsis designated phyA, phyB, phyC, phyD, and phyE, which perceive red/far-red lights (Quail 2002). The cryptochrome group consists of three members, CRY1, CRY2, and CRY3 (Huq et al. 2024) and the phototropin group has two members, phot1 and phot2 (Sakai et al. 2001; Christie et al. 2015). Both the CRY and the phot groups perceive blue light (Paik and Huq 2019). In addition, there are three members of the LOV-containing F-box protein group [e.g., ZEITLUPE (ZTL), FLAVIN-BINDING, KELCH REPEAT, F-BOX 1 (FKF1), and LOV KELCH PROTEIN 2 (LKP2)] absorbing blue/UV-A light (320–500 nm) and a single photoreceptor, UVR8, which perceives UV-B light (280–320 nm) (reviewed in Paik and Huq 2019). Studies in Coffee arabica and Arabidopsis showed that phot1 is upregulated following exposure to FML (Breitler et al. 2020; Singiri et al. 2025), while in tobacco plants phyB and phot2-like proteins were upregulated (Singiri et al. 2023).
Here, we aimed to identify the photoreceptors responsible for moonlight perception and response by plants, focusing on phototropins (phot1 and phot2) and phytochromes (phyA and phyB). Using their corresponding mutants, we identified phot1 and phyB as the main photoreceptors enabling plants to sense and respond to the moonlight.
2. Results
2.1. FML-Induced Deetiolation Is Impaired in Phot1 and Phot1phot2 Mutants
We first examined the capacity of Arabidopsis plants to respond to the FML by analyzing etiolated seedlings for apical hook opening and cotyledon unfolding. These are characteristic responses of etiolated dicotyledonous seedlings stimulated within a few hours following exposure to white, fluorescent light (Liscum and Hangarter 1993). To assess the role played by phototropins in apical hook opening and cotyledon unfolding, we examined the response of etiolated seedlings of WT gl-1, phot1, phot2, and phot1phot2 double mutant to 5 h exposure to FML in comparison to dark and growth room (GR) light (light). Results showed (Figure 1A) that unlike WT gl-1 and the phot2 mutant, the phot1 and phot1phot2 mutants were impaired in cotyledon unfolding and apical hook opening following exposure to FML (Figure 1A). However, their reaction to GR light was indistinguishable from that of WT plants (Figure 1A), indicating that under conditions of high light intensity, phot1 is not required for de-etiolation consistent with previous reports.
2.2. Plant Response to FML Requires Phot1: Genome Organization
It has been shown previously that the size of nuclei derived from plants transitioning from dark to light or from plants exposed to FML is increased significantly, which might reflect genome reorganization accompanied by chromatin decondensation (Bourbousse et al. 2015; Singiri et al. 2023). To identify the photoreceptors acting in moonlight perception, we examined changes in nuclear size following exposure to FML. Hence, 4-week-old seedlings of WT gl-1 and the phot mutant lines—phot1, phot2, and the phot1 phot2 double mutant—were subjected to dark or FML for 5 h; leaves were collected, fixed in acetic acid/ethanol, nuclei were prepared, stained with DAPI, and inspected and measured under a confocal microscope. Results showed (Figure 1B) that exposure to FML induces a significant increase in the nuclear size of WT gl-1 and the phot2 mutant but not in the phot1 or phot1phot2 double mutant, suggesting that phot1 might be the principal blue light receptor for moonlight perception. Interestingly, closer analysis of the results revealed that phot mutants display a notable increase in nuclear size, regardless of treatment, as compared to WT, which appeared to be an inherent feature of these mutants. Particularly, the double phot1phot2 mutant displayed a 1.89-fold increase in nuclear diameter, a phenomenon, which has not been described previously for phot mutants, and will not be discussed further.
2.3. phot1 Is Required for Perception and Plant Response to Moonlight: Proteome Analysis
A comprehensive proteomic analysis was conducted to further explore the molecular responses of wild-type (WT gl-1) and phot1phot2 mutant plants under full moonlight (FML) and dark conditions. Leaves from 4-week-old WT gl-1 and phot1phot2 mutant plants were harvested after 5 hours of FML or dark exposure, and proteins were extracted for proteomic profiling via mass spectrometry using the label-free quantification (LFQ) method.
In total, 2510 and 2569 proteins catalogued as expressed in WT gl- 1 and pho1phot2 mutant, respectively, based on their presence in at least two replicates of one treatment group (Supplementary Tables S1, S2).
The PCA score plots revealed distinct clustering according to treatments in the WT gl-1 plants (Figure 2A), but not in the phot1phot2 mutant (Figure 2B). This is reflected in the volcano plots demonstrating the differentially expressed proteins (DEPs) in WT gl-1 (Figure 2E) and no DEPs in the phot1phot2 mutant (Figure 2F). Using a cut-off of fold change FC > 1.5 and p-value < 0.05, a total of 50 proteins were identified as differentially expressed in WT gl-1 plants (Supplementary Table S3), whereas no significant differential expression was detected in the phot1phot2 dm. Gene Ontology (GO) enrichment showed that in WT gl-1 plants, under FML exposure, significant upregulation was observed in proteins associated with various biological processes (BP), molecular functions (MF), and cellular components (CC). Within the BP category, upregulated proteins were particularly enriched in response to stimulus/stress, such as Cu-Zn superoxide dismutase 1 (Figure 3A). In the MF category, there was a notable enrichment of proteins involved in binding activities, including protein binding and ion binding (Figure S2A). Interestingly, categorization for CC highlighted the vacuole as a prominent subcategory, with a substantial number of vacuolar-associated proteins showing upregulation under FML exposure (Supplementary Table S3 and Supplementary Figure S2C).
Conversely, downregulation was observed across multiple processes in WT gl-1 plants under FML exposure. In the BP category, terms associated with metabolic functions, such as metabolic processes, carbohydrate derivative metabolic processes, and organic acid biosynthetic processes, showed notable downregulation (Figure 3B). In MF, sub-categories like oxidoreductase activity, catalytic activity, and small molecule binding were downregulated (Figure S2B), and for CC, chloroplast stroma and plastid-associated proteins were prominent among downregulated proteins (Supplementary Table S3, Figure S2D).
To further explore the individual contributions of phot1 and phot2, proteomic analyses were performed on phot1 and phot2 mutant plants after 5 h exposure to FML or dark. We identified 2132 and 2075 proteins catalogued as expressed in phot1 and phot2, respectively (Supplementary Tables S4, S5). The PCA plot for the phot2 mutant showed separation between FML and dark (supplementary Figure 2C) similar to WT gl-1, while the PCA plot for the phot1 mutant showed no distinct separation (Figure 2D), reflecting an absence of molecular adjustments in response to FML exposure. Further statistical analysis revealed 416 proteins as differentially expressed with a cutoff FC>1.5 and p-value < 0.05 in phot2, while none were identified as differentially expressed in phot1. Out of the DEPs, 252 were upregulated and 164 were downregulated in phot2 upon exposure to FML vs. darkness (Supplementary Table S6). Volcano plots demonstrate the DEPs in phot2 (Figure 2G) and the phot1 mutant (Figure 2H).
In phot2 under FML exposure, GO enrichment analysis showed upregulation in the BP category similarly to WT gl-1, highlighting specifically the terms “response to abiotic and biotic stimulus” and, to a lesser extent, also photosynthesis-related proteins, including proton transport and electron transport chain (Figure 3C).
Within the MF category (Figure S3A), there was significant upregulation of proteins associated with binding activity and catalytic activity, including oxidoreductase activity and mRNA and protein binding. This is consistent with WT gl-1 plants, which also showed enrichment in binding-related functions, particularly for proteins involved in signaling and environmental interactions. For the CC category (Figure S3C), enriched terms included chloroplast thylakoid membrane, photosynthetic membrane, vacuole, chloroplast stroma, and plastid envelope. Notably, both WT gl-1 and phot2 exhibited a prominent presence of vacuolar-associated proteins (Supplementary Figure S2C and Figure S3C).
Downregulated proteins in the BP category in phot2 included (Figure 3D) terms related to carbohydrate metabolic processes, amino acid biosynthetic processes, and response to chemical stimulus, paralleling the downregulation in WT gl-1 plants, which also showed reductions in metabolic activities. In the MF category (Figure S3B), downregulated proteins were associated with catalytic activity and binding activity, while within the CC category (Figure S3D), downregulated terms included cytoplasm, anatomical structure and plastid (Supplementary Table S6), indicating decreased activity in these compartments under FML conditions.
2.4. Phytochrome B Is Required for Plant Response to Moonlight
PhyB plays a major role in sensing both low light intensity and reduction in the R:FR ratio (both are characteristics of the moonlight), which commonly occur when plants are exposed to shade, triggering shade avoidance (Trupkin et al. 2014; Ballaré and Pierik 2017). This function of phyB prompted us to investigate the role played by phytochromes in response to moonlight. Accordingly, we analyzed the deetiolation capacity of the phyA and phyB mutants following exposure to FML and to growth room light as compared to dark. Results showed (Figure 4A) that like WT plants (see also Singiri et al. 2025), both phyA and phyB etiolated seedlings essentially responded to FML and to GR light by opening the apical hook and unfolding cotyledons implying that phyA and phyB are not involved in the initial moonlight perception.
Analysis of nuclear size showed (Figure 4B) that exposure to FML induces a significant increase in the nuclear size in phyA mutant similarly to WT gl-1, but not in the phyB mutant, implying that phyB might be involved in inducing nuclear reorganization following exposure to FML.
2.5. PhyB Is Required for Plant Response to Moonlight: Proteome Analysis
We conducted proteome analysis to examine the response of phyA and phyB mutants to FML. After filtering out potential contaminants, reverse-only identified by site, as well as filtering for proteins expressed in at least two replicates of at least one treatment group, 2,867 expressed proteins were documented (Supplementary Table S7). Principal component analysis (PCA) separated the proteins according to treatments in phyA, while in the phyB mutant, dark and FML were clustered together (Figure 5A). This is reflected in the volcano plots (Figures 5B and 5C), showing that phyA but not phyB responded to FML by changing their protein profiles. Among the 230 differentially expressed proteins (FC>/<2; p<0.05) between FML and dark-treated phyA mutant plants, 89 and 141 proteins were upregulated and downregulated, respectively (Supplementary Table S8). Only one protein in the phyB mutant exhibited a reduction of more than twofold in response to FML compared to dark conditions (Supplementary Table S9), indicating that, at the protein level, the phyB mutant perceives FML as equivalent to dark.
Similarly to WT gl-1 plants (Figure 3; Singiri et al. 2025), categorization for the biological process of DEPs highlighted response to stimulus as the major subcategory upregulated following exposure of the phyA mutant to FML (Figure 5D, 5E). Within the molecular function category, the phyA mutant displayed a significant upregulation of proteins associated with small molecule/ion binding activity (Figure S4A) and downregulation of nucleic acid binding activity (Figure S4B). Interestingly, in the WT gl-1 and the phot2 mutant, the categorization for MP revealed an opposite trend, highlighting an upregulation of mRNA and protein binding activity (Figures S2A, S3A), alongside a downregulation of small molecule/ion binding activity (Figures S2B, S3B).
2.6. Growth Room Light but not FML Triggers the Accumulation of phyB-GFP in Large Nuclear Photobodies
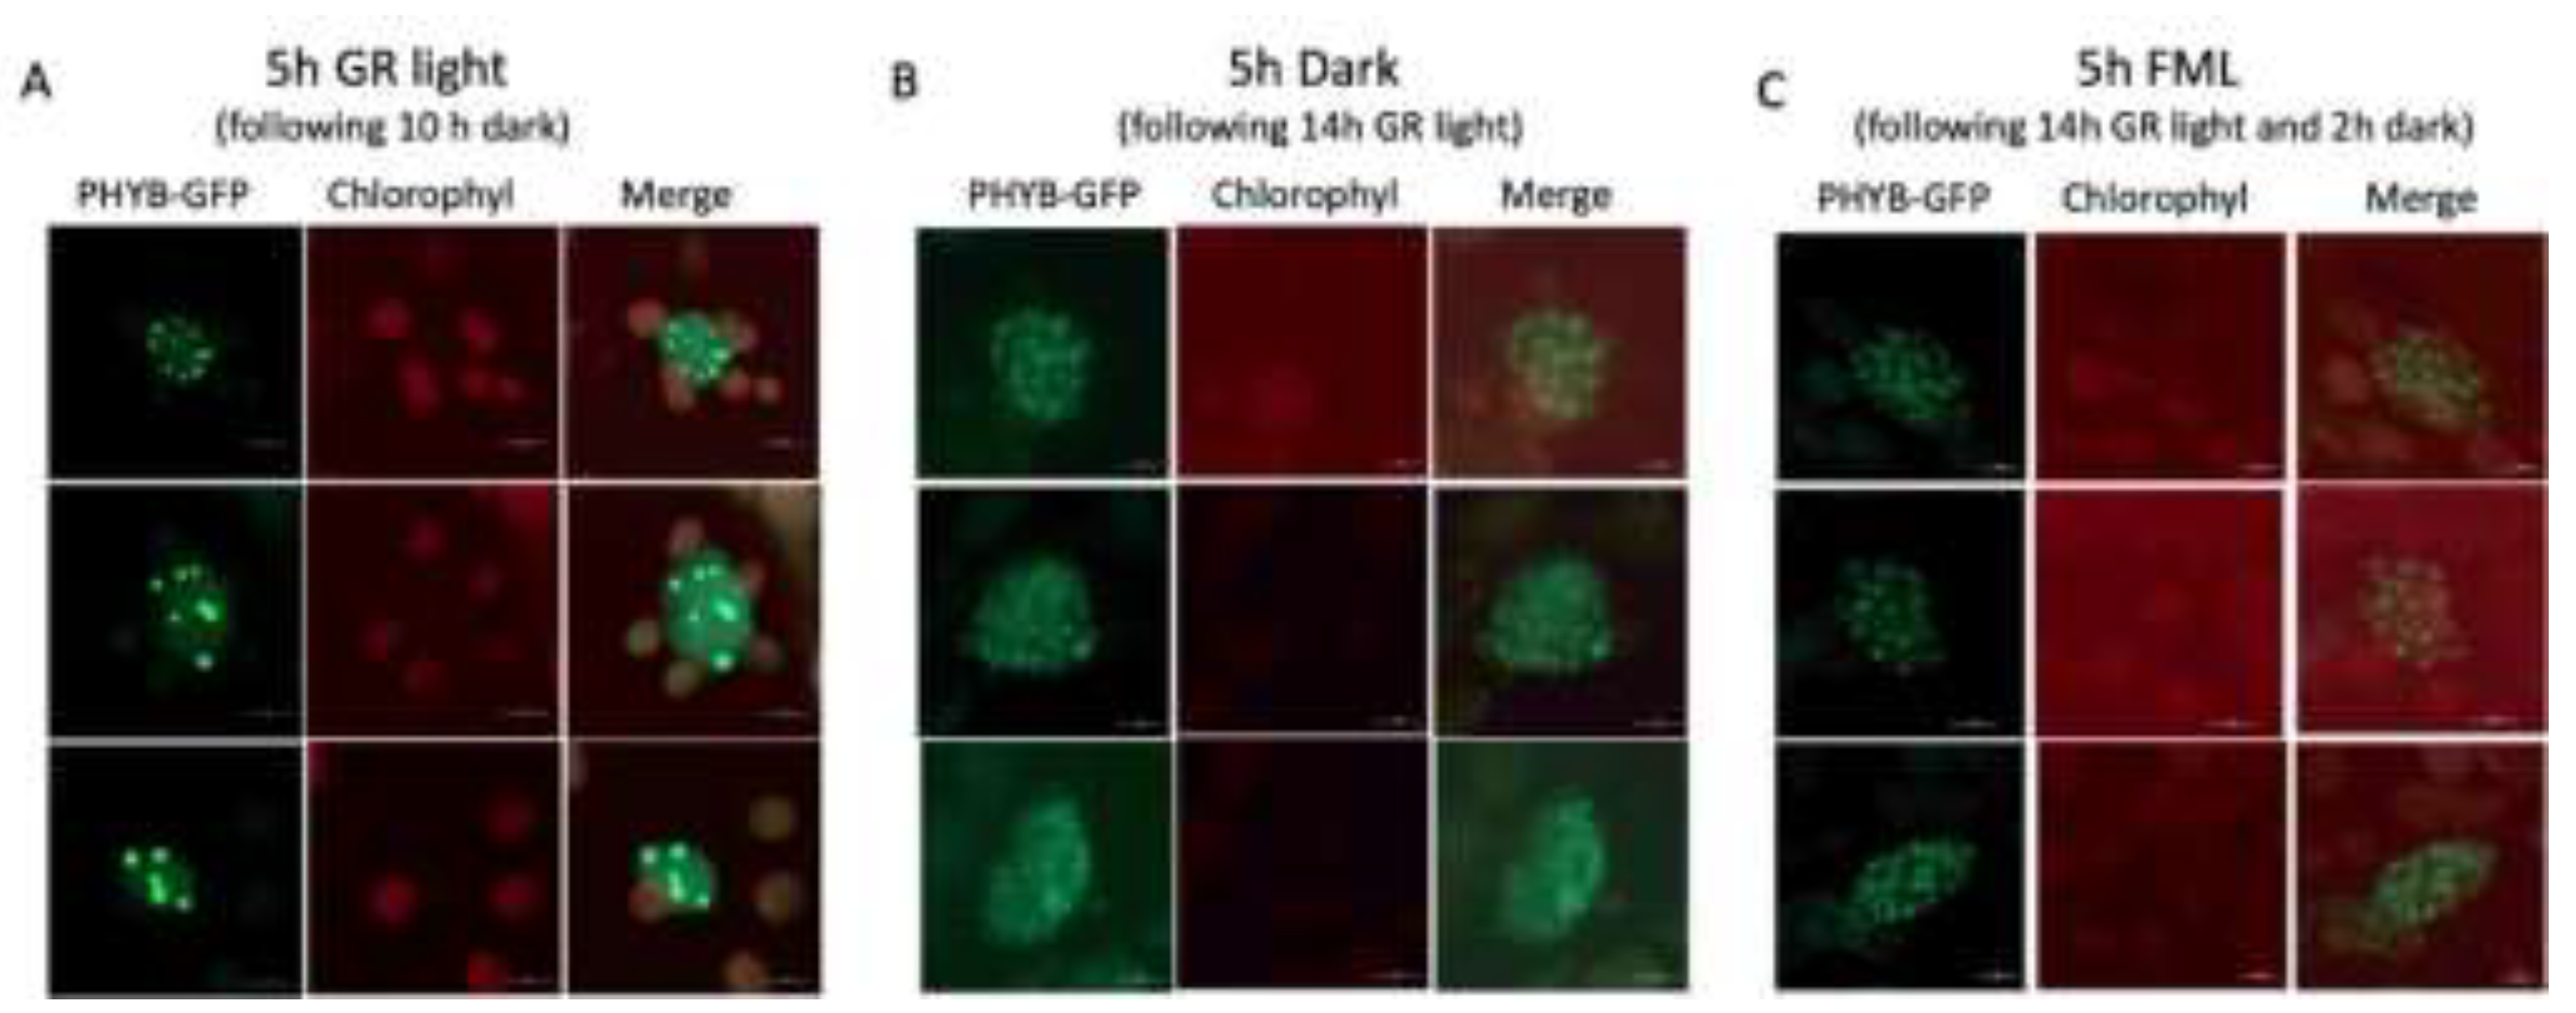
It has been previously shown that phyB photobodies undergo two major transitions: the first occurs after 12 h in darkness, where large-sized photobodies disassemble into many small photobodies, while the second occurs after 18 h of exposure to darkness, whereby PBs are completely lost and phyB shows even distribution in the nucleus (Van Buskirk et al. 2014). We wanted to examine the capacity of the FML to induce the formation of large phyB-GFP PBs. To achieve this, plants expressing phyB-GFP (Medzihradszky et al. 2013) were either subjected to 10 hours of darkness followed by 5 h of GR light (~155 μmol m⁻² s⁻¹; R:FR=10.5, Supplementary Figure S1 ), or they were exposed to 5 h of darkness or to 2 h darkness followed by 5 h of FML after being subjected to 14 hours of GR light and inspection under a confocal microscope. The results showed that after a 5-hour exposure to GR light, the plants exhibited a reduced number of large and highly fluorescent PBs within the nucleus (Figure 6A). Following a subsequent 5-hour period of darkness, these large PBs were broken down into numerous small, somewhat dispersed, and faintly fluorescing PBs (Figure 6B), as previously documented (Van Buskirk et al. 2014). Following exposure to FML, the appearance of nuclear PBs was not changed and was similar to those displayed by plants under 5 h of dark, yet they kept their structure, showing no dispersion (Figure 6C). During this period, we could not detect phyB-GFP signal outside the nucleus.
3. Discussion
The influence of the moon on living organisms is often emphasized through its physical characteristics related to gravitational and electromagnetic effects. Recent studies have highlighted moonlight as a signaling entity that provokes stress-like responses characterized by changes in genome organization and gene expression (Breitler et al. 2020; Singiri et al. 2023; Priyanka et al. 2025; Singiri et al. 2025). Although the moon reflects the sunlight at a very low intensity, this light is sufficient to induce biological reactions in plants, demonstrated here by its capacity to bring about photomorphogenic responses in etiolated Arabidopsis seedlings, that is, apical hook opening and cotyledon unfolding. We showed by using phototropin and phytochrome mutants that phot1 and phyB are probably the major receptors required for moonlight perception and response by plants.
Phototropins are plant-specific blue light receptors implicated in phototropism, chloroplast movement, leaf expansion, and stomatal opening (Christie et al. 2018). These processes contribute to optimization of photosynthesis by enhancing efficient capture of light energy, reducing photodamage, and facilitating the acquisition of CO₂. Both phot1 and phot2 have distinct roles in light perception, with phot1 particularly responding to low blue light intensity, while phot2 is less sensitive to low light and operates under a relatively high blue light intensity (Takemiya et al. 2005; Harada et al. 2003). Our data are consistent with the roles of phototropins, showing that deetiolation under FML (~0.0055 μmol m⁻² s⁻¹) was impaired in the absence of a functional phot1 but not in the absence of phot2. Interestingly, under conditions of high light intensity, deetiolation occurs effectively even in the absence of phot1. This indicates that other photoreceptors, most likely phot2, function under high light to facilitate deetiolation in the absence of phot1 (Takemiya et al. 2005).
Consistent with previous reports (Breitler et al. 2020; Singiri et al. 2023; Singiri et al. 2025), the response of WT and mutant plants (phyA, phot2) to FML highlighted the upregulation of proteins responding to stimulus, further supporting the notion that the moonlight is perceived by plants as a stress signal. If FML is perceived by plants as a stress signal, what is then the actual stress imposed by the light of the full moon? Obviously, the moon reflects the sunlight at extremely low intensity, which is far below the intensity required to drive photosynthesis. Furthermore, although the moon reflects sunlight essentially at a comparable spectrum, there exist spectral differences between moonlight and sunlight, as the red to far-red (R:FR) ratio of sunlight exceeds 1.2, while the R:FR ratio of moonlight varies from 0.18 to 0.22 (Breitler et al. 2020). This R:FR ratio of the moonlight is reminiscent of the low R:FR ratio when plants are grown under the canopy of other plants and exposed to shade (Courbier and Pierik 2019). Indeed, shade can trigger stress response associated with ethylene biosynthesis, acceleretaed senescence as well as increase in reactive oxygen species and nitric oxide (Deng et al. 2024; Iglesias et al. 2024). The reduction in the R:FR ratio is sensed by phyB, which plays a major role in triggering shade avoidance (Ballaré and Pierik 2017). Thus, similarly to the effect of shade, the low R:FR ratio of the FML might be interpreted as a shade stress that induces stress response, which is accompanied by upregulation of stress-related proteins.
Consistent with previous reports, the phyB-GFP is clustered in fewer, large nuclear PBs when plants are exposed to high GR light (~155 μmol m-2 s-1) for 5 h. These PBs are broken into many small, dispersed PBs in the dark, which are retained in the nucleus, at least after 5 h in the dark. Exposure to FML did not induce the formation of large, fewer PBs, but the many small PBs remain structurally defined and are not dispersed as they are under dark conditions. It seems that the FML slows down the dispersion of the small PBs that would otherwise take place under dark conditions. Previous reports demonstrated that under high red light intensity, which promotes conversion to Pfr, phyB is localized to fewer nuclear PBs, while under darkness or a low R:FR ratio, phyB is found in many smaller nuclear photobodies or dispersed in the nucleoplasm (Chen et al. 2003). Also, reducing irradiance while maintaining the R:FR ratio resulted in the formation of small nuclear bodies that contain phyB, suggesting that phyB can sense and respond to both low light intensity and low R:FR ratio (Trupkin et al. 2014). Despite the conversion to the Pr form occurring in darkness or under FML, we were unable to observe phyB-GFP outside the nucleus.
Taken together, these results indicate that the initial perception of moonlight is mediated by the blue light receptor phot1 and is subsequently interpreted into a functional response by the R/FR receptor phyB. The spectral characteristics of full moonlight, namely its low intensity and low R:FR ratio, could be interpreted by plants as a shade-like signal, which is accompanied by the induction of stress-associated genes. Under such conditions, phyB is expected to accumulate predominantly in the Pr form, resulting in alterations to its nuclear organization from fewer, large photobodies to a larger number of smaller photobodies, where it may exert specific nuclear functions. In line with this view, overexpression of Pr-phyB has been shown to suppress photomorphogenesis under far-red light, at least in part through stabilization of the CONSTITUTIVE PHOTOMORPHOGENIC1–SUPPRESSOR OF PHYA-105 (COP1–SPA1) E3 ubiquitin ligase in the nucleus (Zheng et al. 2013); the COP1-SPA1 E3 ligase ubiquitinates light-responsive transcription factors and directs them for degradation (Ponnu 2020).
4. Materials and Methods
4.1. Plant Growth and Exposure to FML
The Arabidopsis WT gl-1 and the phot mutant lines phot1 (Huala et al. 1997), phot2 (Kagawa et al. 2001), and phot1-phot2 dm (Kinoshita et al. 2001) were obtained from John M. Christie’s lab. Phytochrome mutants and overexpression lines phyA-201 (Kirchenbauer et al. 2016), phyB-9 & phyB-GFP (Medzihradszky et al. 2013), and seeds were obtained from Ferenc Nagy. Seeds were sown in pots containing standard gardening soil composed of peat and perlite (2:1 ratio) and grown in a growth room under 65-70% humidity, 24 °C±1 °C temperature, and 14/10 h (day/night) photoperiod conditions. The sunligth and growth room light intensity and spectral measurements shown in Figure S1 (supplementary figures) were taken by a Li-Cor LI-180 Spectrometer (LICORbio, Lincoln, NE, USA). Seedlings at the four-leaf stage were exposed for 5 h to FML and dark; dark-treated plants were kept next to the FML-exposed plants by covering them with black cloth. The seedlings of phototropin mutants were exposed to FML during June 2023, whereas those of phytochrome mutants were exposed during August 2023. Seedlings were collected and frozen immediately in liquid nitrogen and kept at -80 °C, or fixed in acetic acid/ethanol (1:3 v/v) and stored at -20 °C, until further use.
4.2. Response of Etiolated Seedlings to FML
Arabidopsis thaliana WT, phot, and phy mutant seeds were surface sterilized with 70% EtOH for 2 min followed by 50% bleach for 5-10 min. Seeds were washed with sterile H₂O and planted in Petri dishes containing MS growth medium (Murashige and Skoog, 1962) and 0.8% agar. Seeds were incubated for 2 to 3 days at 4 °C, then exposed to red light for 1 h to induce uniform germination (Liscum and Hangarter 1992). The seedlings were incubated in the dark at 23-25 °C for 4 days to produce etiolated seedlings. Seedlings were exposed to FML or to growth room light for 5 h, and cotyledon unfolding and apical hook opening were analyzed.
4.3. Nuclei Isolation and Confocal Microscope Inspection
Nuclei were prepared from fixed leaf samples of WT and mutants essentially as described by Saxena et al. (1985). Briefly, leaves were chopped using a razor blade until we got the homogenate in nuclei isolation buffer (NIB) (10 mM MES-KOH, pH 5.5, 0.2 M sucrose, 2.5 mM EDTA, 2.5 mM dithiothreitol, 0.1 mM spermine, 10 mM NaCl, 10 mM KCl, 0.15% Triton X-100). The homogenate is gently stirred for 45 min at 4ºC and filtered through 100 μm nylon mesh followed by 30 μm nylon mesh. The filtered extract is centrifuged for 8 min at 2000 RPM at 4ºC. The pellet is gently washed to remove the upper chloroplast layer, nuclei pellets are recovered, and later nuclei are washed twice with NIB buffer. Nuclei are fixed in ethanol:acetic acid (3:1 v/v) and stored at -20ºC until further used. Nuclei are stained for 10 min with 10 μg/ml diamidino-phenyl-indole (DAPI), washed twice with 2× SSC (300 mM NaCl, 30 mM Na-citrate, pH 7.0), and mounted in Vectashield (Vector Laboratories, Burlingame, CA, USA). Nuclei size measurements are done using a confocal microscope (Zeiss LSM 900), and the data is processed using Excel software (Microsoft, Redmond, WA, USA).
4.4. Proteome Analysis
For proteomic analysis, 4 replicates of 10 mg of ground leaves derived from 5 h dark and 5 h FML-treated plants were placed in 2 mL tubes and incubated with 100 µl of NETN buffer (100 mM NaCl, 1 mM EDTA, 20 mM Tris, pH 8.0, and 0.5% NP-40) at 4ºC for 6 h with gentle rotation, then centrifuged at 4ºC at high speed for 10 min. 50 µl of supernatants are collected and stored at -20ºC until used for comparative, quantitative proteome analysis. Proteome analysis was performed by the proteomic services of the Smoler Protein Research Centre at the Technion, Haifa, Israel, using LC-MS/MS on LTQ Orbitrap (ThermoFisher Scientific, Waltham, MA, USA). Protein identification and quantification were done by using MaxQuant, using Arabidopsis thaliana proteins from UniProt as a reference. Quantification and normalization were performed using the LFQ method and subsequent bioinformatics analysis by using Perseus software (Tyanova et al., 2016). Proteins marked as “contaminant” and “only identified by site” were filtered out. In an additional step, only proteins in which at least one of the groups has at least 2 non-zero replicates, proteins having at least 2 peptides, and a peptide sequence coverage of more than 20% were retained. A protein is considered differentially expressed if it has a nominal p-value < 0.05 and an absolute fold change > 1.5.
4.5. Nuclear Size Measurements
Nuclei were inspected under a confocal microscope (Zeiss LSM 900) and nuclear size measurements were performed on images processed using ZEN Blue Software (Zeiss). The processed images were analyzed for nuclear size, and the measurements were exported to Microsoft Excel for further statistical analysis. The student’s t-test was applied to compare the nuclear sizes between different experimental conditions, with statistical significance set at p < 0.05. Average nuclear sizes were calculated and reported alongside standard deviations to summarize the data.
4.6. Gene Ontology (GO) Analysis
GO analysis was conducted to explore the biological processes, molecular functions, and cellular components enriched in the proteomic data. GO terms were identified using the gProfiler online tool (https://biit.cs.ut.ee/gprofiler/gost) and the Bingo plugin in Cytoscape (Maere et al. 2005). Bar plots representing the enrichment of GO terms were essentially generated using R software, employing the ggplot2 package for visual representation of the results.
Supplementary Materials
The following supporting information can be downloaded at the website of this paper posted on Preprints.org.
Data Availability Statement
The original contributions presented in this study are included in the article/supplementary material. Further inquiries can be directed to the corresponding author.
References
- Ballaré, CL; Pierik, R. The shade-avoidance syndrome: multiple signals and ecological consequences. Plant Cell Environ. 2017, 40, 2530–2543. [Google Scholar] [CrossRef] [PubMed]
- Bourbousse, C; Mestiri, I; Zabulon, G; Bourge, M; Formiggini, F; Koini, MA; Brown, SC; Fransz, P; Bowler, C; Barneche, F. Light signaling controls nuclear architecture reorganization during seedling establishment. Proc Natl Acad Sci U S A 2015, 112(21), E2836–E2844. [Google Scholar] [CrossRef] [PubMed]
- Breitler, JC; Djerrab, D; Leran, S; Toniutti, L; Guittin, C; Severac, D; Pratlong, M; Dereeper, A; Etienne, H; Bertrand, B. Full moonlight-induced circadian clock entrainment in Coffea arabica. BMC Plant Biol. 2020, 20(1), 24. [Google Scholar] [CrossRef] [PubMed]
- Chen, M; Schwab, R; Chory, J. Characterization of the requirements for localization of phytochrome B to nuclear bodies. Proc Natl Acad Sci USA 2003, 100, 14493–14498. [Google Scholar] [CrossRef]
- Christie, JM; Blackwood, L; Petersen, J; Sullivan, S. Plant flavoprotein photoreceptors. Plant Cell Physiol. 2015, 56(3), 401–413. [Google Scholar] [CrossRef]
- Christie, JM; Suetsugu, N; Sullivan, S; Wada, M. Shining light on the function of NPH3/RPT2-like proteins in phototropin signaling. Plant Physiol. 2018, 176(2), 1015–1024. [Google Scholar] [CrossRef]
- Courbier, S; Pierik, R. Canopy light quality modulates stress responses in plants. iScience 2019, 22, 441–452. [Google Scholar] [CrossRef]
- Deng, J; Huang, X; Chen, J; Vanholme, B; Guo, J; He, Y; Qin, W; Zhang, J; Yang, W; Liu, J. Shade stress triggers ethylene biosynthesis to accelerate soybean senescence and impede nitrogen remobilization. Plant Physiol Biochem. 2024, 210, 108658. [Google Scholar] [CrossRef]
- Harada, A; Sakai, T; Okada, K. Phot1 and phot2 mediate blue light-induced transient increases in cytosolic Ca2+ differently in Arabidopsis leaves. Proc Natl Acad Sci U S A 2003, 100(14), 8583–8588. [Google Scholar] [CrossRef]
- Huala, E; Oeller, PW; Liscum, E; Han, IS; Larsen, E; Briggs, WR. Arabidopsis NPH1: a protein kinase with a putative redox-sensing domain. Science 1997, 278(5346), 2120–2123. [Google Scholar] [CrossRef]
- Huq, E; Lin, C; Quail, PH. Light signaling in plants-a selective history. Plant Physiol. 2024, 195(1), 213–231. [Google Scholar] [CrossRef] [PubMed]
- Iglesias, MJ; Costigliolo Rojas, C; Bianchimano, L; Legris, M; Schön, J; Gergoff Grozeff, GE; Bartoli, CG; Blázquez, MA; Alabadí, D; Zurbriggen, MD; Casal, JJ. Shade-induced ROS/NO reinforce COP1-mediated diffuse cell growth. Proc Natl Acad Sci U S A 2024, 121(42), e2320187121. [Google Scholar] [CrossRef] [PubMed]
- Kagawa, T; Sakai, T; Suetsugu, N; Oikawa, K; Ishiguro, S; Kato, T; Tabata, S; Okada, K; Wada, M. Arabidopsis NPL1: a phototropin homolog controlling the chloroplast high-light avoidance response. Science 2001, 291(5511), 2138–2141. [Google Scholar] [CrossRef] [PubMed]
- Kinoshita, T; Doi, M; Suetsugu, N; Kagawa, T; Wada, M; Shimazaki, K. Phot1 and phot2 mediate blue light regulation of stomatal opening. Nature 2001, 414(6864), 656–660. [Google Scholar] [CrossRef]
- Kirchenbauer, D; Viczián, A; Ádám, É; Hegedűs, Z; Klose, C; Leppert, M; Hiltbrunner, A; Kircher, S; Schäfer, E; Nagy, F. Characterization of photomorphogenic responses and signaling cascades controlled by phytochrome-A expressed in different tissues. New Phytol. 2016, 211(2), 584–598. [Google Scholar] [CrossRef]
- Kyba, CCM; Mohar, A; Posch, T. How bright is moonlight? Astron Geophys. 2017, 58, 1.31–1.32. [Google Scholar] [CrossRef]
- Liscum, E; Hangarter, RP. Arabidopsis Mutants Lacking Blue Light-Dependent Inhibition of Hypocotyl Elongation. Plant Cell. 1991, 3(7), 685–694. [Google Scholar] [CrossRef]
- Maere, S; Heymans, K; Kuiper, M. BiNGO: a Cytoscape plugin to assess overrepresentation of gene ontology categories in biological networks. Bioinformatics 2005, 21(16), 3448–3449. [Google Scholar] [CrossRef]
- Medzihradszky, M; Bindics, J; Ádám, É; Viczián, A; Klement, É; Lorrain, S; Gyula, P; Mérai, Z; Fankhauser, C; Medzihradszky, KF; Kunkel, T; Schäfer, E; Nagy, F. Phosphorylation of phytochrome B inhibits light-induced signaling via accelerated dark reversion in Arabidopsis. Plant Cell. 2013, 25(2), 535–44. [Google Scholar] [CrossRef]
- Murashige, T; Skoog, F. A revised medium for rapid growth and bio assays with tobacco tissue cultures. Plant Physiol. 1962, 15, 473–497. [Google Scholar] [CrossRef]
- Paik, I; Huq, E. Plant photoreceptors: Multi-functional sensory proteins and their signaling networks. Semin Cell Dev Biol. 2019, 92, 114–121. [Google Scholar] [CrossRef]
- Ponnu, J. Molecular mechanisms suppressing COP1/SPA E3 ubiquitin ligase activity in blue light. Physiol Plant. 2020, 169(3), 418–429. [Google Scholar] [CrossRef] [PubMed]
- Priyanka, G; Singiri, JR; Novoplansky, N; Grafi, G. Short Exposure to Full Moonlight Has a Long-Term Impact on Brassica juncea Cell Activity and Growth. Plant Cell Environ. 2025, 48(5), 3038–3051. [Google Scholar] [CrossRef] [PubMed]
- Quail, PH. Phytochrome photosensory signalling networks. Nat Rev Mol Cell Biol. 2002, 3(2), 85–93. [Google Scholar] [CrossRef] [PubMed]
- Raven, JA; Cockell, CS. Influence on photosynthesis of starlight, moonlight, planetlight, and light pollution (reflections on photosynthetically active radiation in the universe). Astrobiology 2006, 6(4), 668–675. [Google Scholar] [CrossRef]
- Sakai, T; Kagawa, T; Kasahara, M; Swartz, TE; Christie, JM; Briggs, WR; Wada, M; Okada, K. Arabidopsis nph1 and npl1: blue light receptors that mediate both phototropism and chloroplast relocation. Proc Natl Acad Sci U S A 2001, 98(12), 6969–6974. [Google Scholar] [CrossRef]
- Sannidhi, S; Priyanka, G; Singiri, JR; Novoplansky, N; Grafi, G. Plants and the moonlight: A controversial subject revisited. Plant Sci. 2026:362, 112841. [Google Scholar] [CrossRef]
- Saxena, PK; Fowke, LC; King, J. An efficient procedure for isolation of nuclei from plant protoplasts. Protoplasma 1985, 128, 184–189. [Google Scholar] [CrossRef]
- Singiri, JR; Priyanka, G; Trishla, VS; Adler-Agmon, Z; Grafi, G. Moonlight is perceived as a signal promoting genome reorganization, changes in protein and metabolite profiles and plant growth. Plants 2023, 12(5), 1121. [Google Scholar] [CrossRef]
- Singiri, JR; Yarra, NK; Sannidhi, S; Priyanka, G; Swetha, B; Novoplansky, N; Adler-Agmon, Z; Grafi, G. Plant responses to full moonlight requires the SUVH4 HMTase which may target active genes via interaction with the splicing factor SAP18. Plant Sci. 2026:362, 112814. [Google Scholar] [CrossRef]
- Sivasankari, J; Thimmaiah, A. Lunar rhythms in agriculture - review on scientific perspectives. Int J Altern Complement Med. 2021, 14, 81–85. [Google Scholar] [CrossRef]
- Smith, H. Light quality, photoperception, and plant strategy. Annual Review of Plant Physiology 1982, 33, 481–518. [Google Scholar] [CrossRef]
- Smith, H. Phytochromes and light signal perception by plants—an emerging synthesis. Nature 2000, 407, 585–591. [Google Scholar] [CrossRef] [PubMed]
- Takemiya, A; Inoue, S; Doi, M; Kinoshita, T; Shimazaki, K. Phototropins promote plant growth in response to blue light in low light environments. Plant Cell. 2005, 17(4), 1120–1127. [Google Scholar] [CrossRef] [PubMed]
- Trupkin, SA; Legris, M; Buchovsky, AS; Tolava Rivero, MB; Casal, JJ. Phytochrome B nuclear bodies respond to the low red to far-red ratio and to the reduced irradiance of canopy shade in Arabidopsis. Plant Physiol. 2014, 165(4), 1698–1708. [Google Scholar] [CrossRef] [PubMed]
- Tyanova, S; Temu, T; Sinitcyn, P; Carlson, A; Hein, MY; Geiger, T; Mann, M; Cox, J. The Perseus computational platform for comprehensive analysis of (prote)omics data. Nat Methods 2016, 13(9), 731–740. [Google Scholar] [CrossRef]
- Van Buskirk, EK; Reddy, AK; Nagatani, A; Chen, M. Photobody localization of phytochrome B is tightly correlated with prolonged and light-dependent inhibition of hypocotyl elongation in the dark. Plant Physiol. 2014, 165(2), 595–607. [Google Scholar] [CrossRef]
- Zheng, X; Wu, S; Zhai, H; Zhou, P; Song, M; Su, L; Xi, Y; Li, Z; Cai, Y; Meng, F; Yang, L; Wang, H; Yang, J. Arabidopsis phytochrome B promotes SPA1 nuclear accumulation to repress photomorphogenesis under far-red light. Plant Cell. 2013, 25(1), 115–33. [Google Scholar] [CrossRef]
- Zurcher, E. Plants and the moon - traditions and phenomena. HerbalEGram 2011, 8, 1–14. [Google Scholar] [CrossRef]
Figure 1.
phot1 is required for the de-etiolation response under FML. (A) The response of WT gl-1, phot1, phot2, and phot1phot2 etiolated seedlings to FML and growth room light (Light) as compared to dark. The percentage of cotyledon unfolding, and the degree of hook opening are shown to the right. Bars represent the standard deviation. Different letters indicate statistically significant differences between treatments (p < 0.05; unpaired t test, GraphPad). (B) No change in nuclear size in phot1 and phot1phot2 mutants. Leaves of the indicated Arabidopsis WT gl-1 and phototropin mutants exposed to dark, or to FML for 5h were fixed in acetic acid:ethanol (1:3), nuclei were prepared, stained with DAPI and visualized under a confocal microscope. Boxplots representing nuclear diameter (n=50) in the different lines following exposure to FML. p value of differences between dark and FML treatments is indicated for each line.
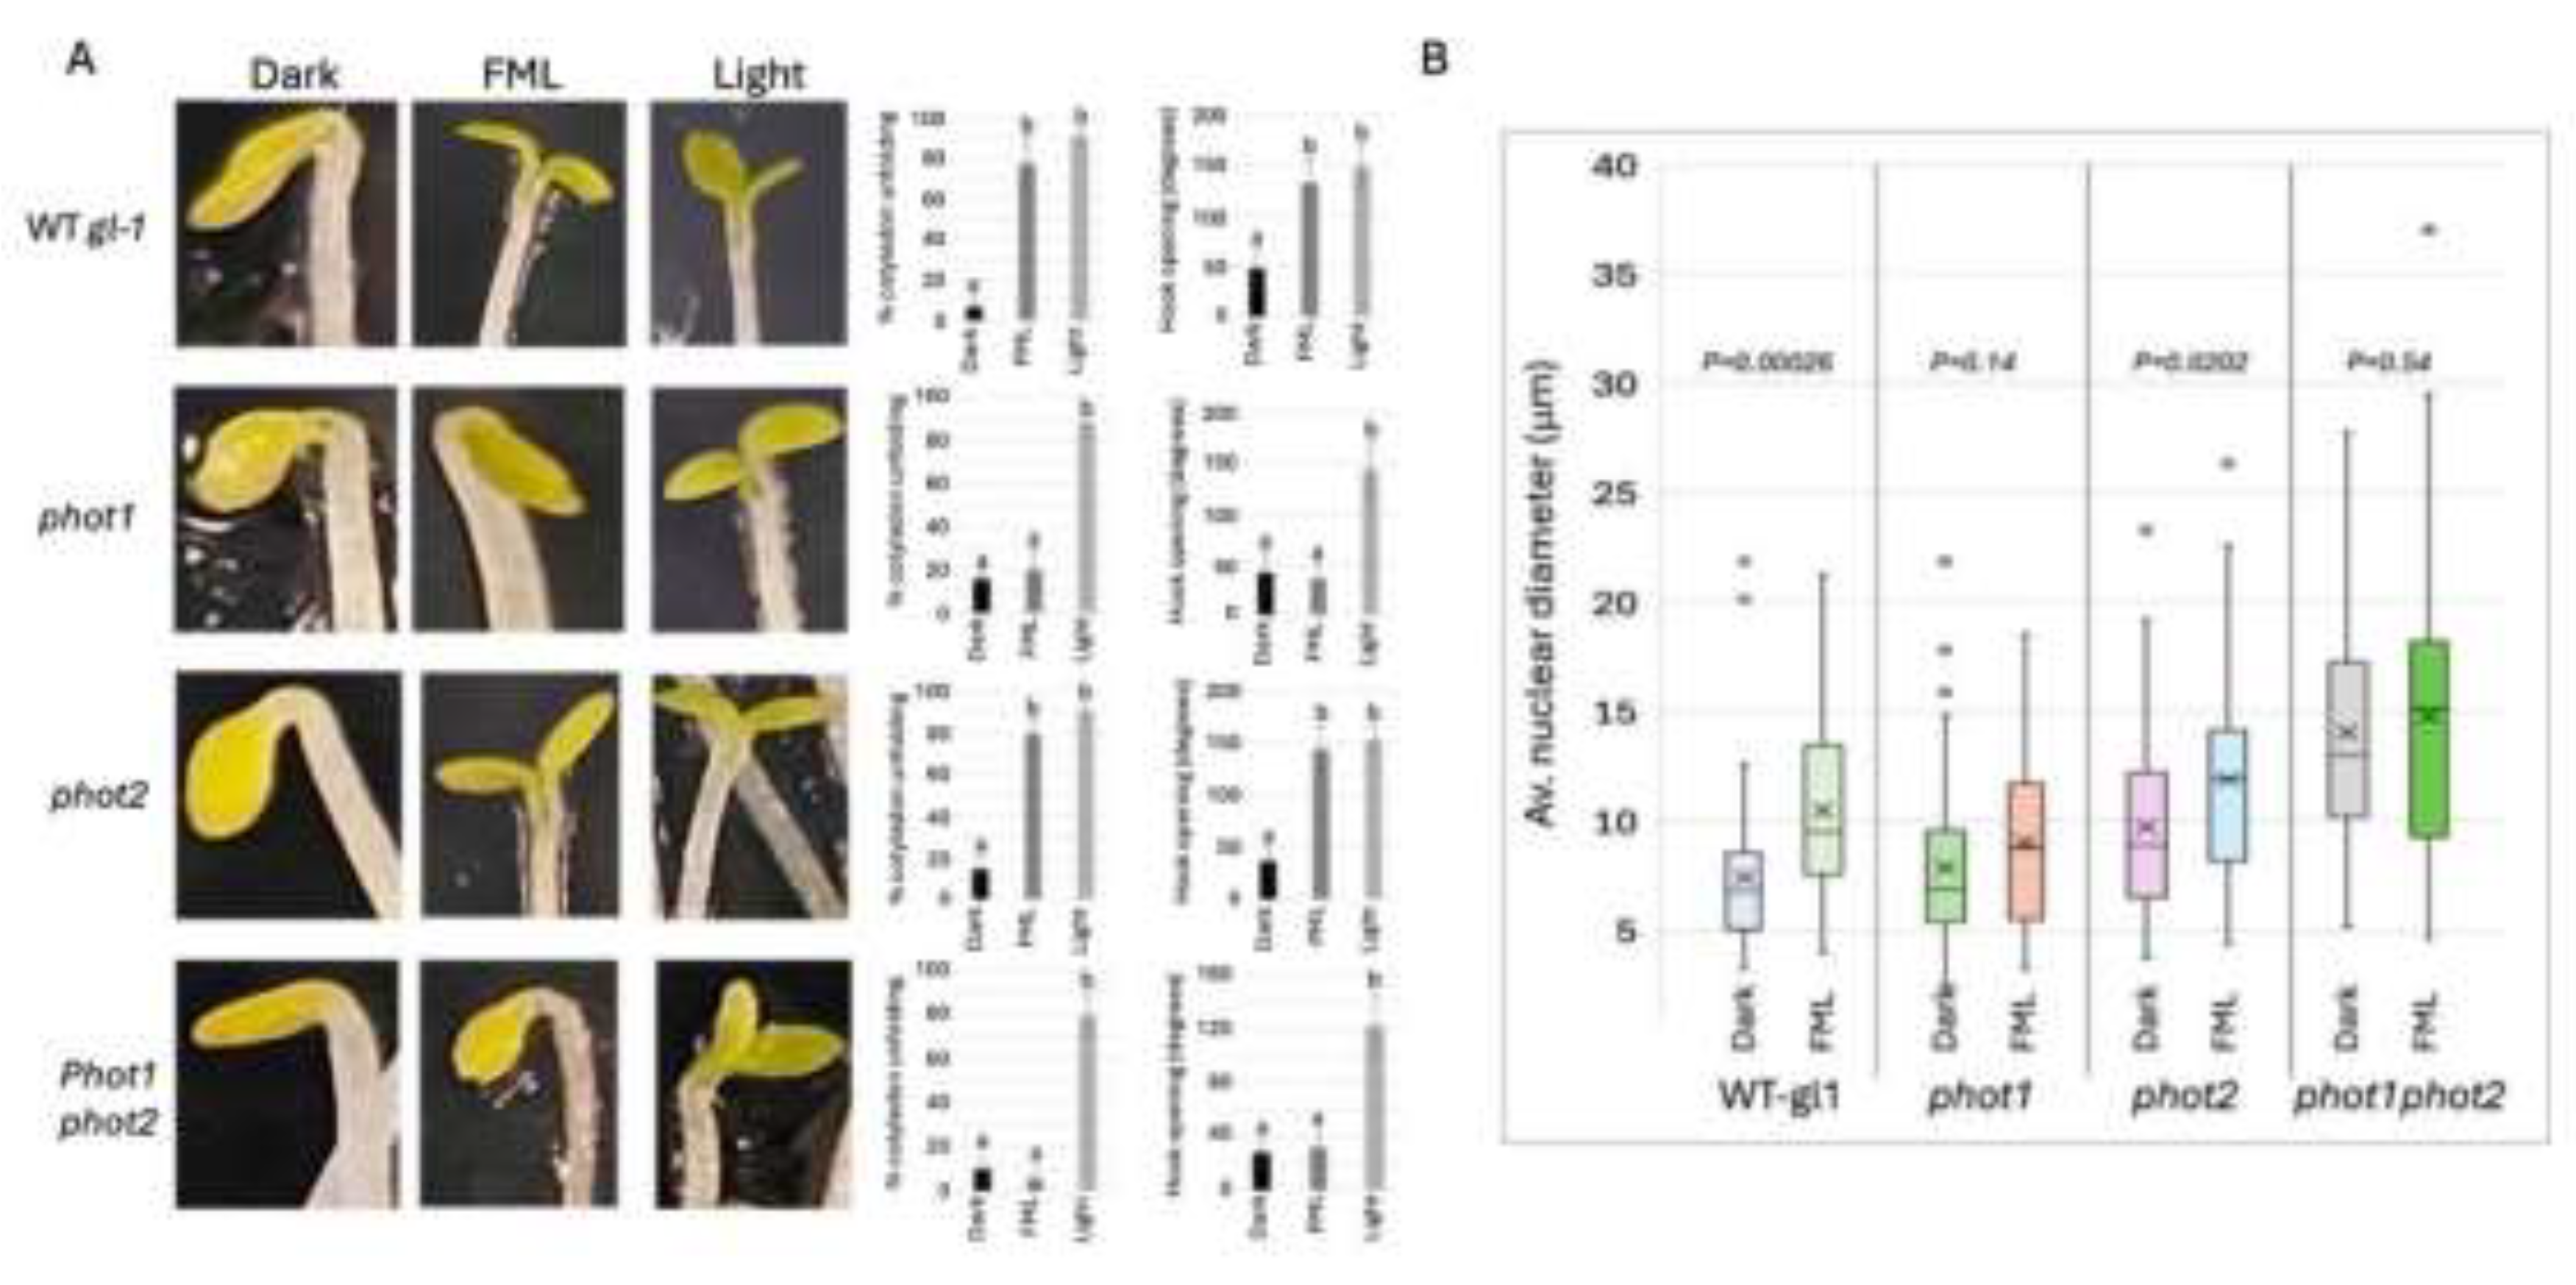
Figure 2.
PCA Score plots of expressed proteins in dark and FML treated plants of wild type (WT gl-1) (A), phot1phot2dm (B), phot2 (C), and phot 1 (D). Volcano plots demonstrating the fold change of proteins in FML vs. dark treated WT gl-1 (E), phot1phot2 mutant (F), phot2 (G) and phot1 mutant (H). Red and blue dots indicate upregulated and downregulated proteins, respectively, while gray dots indicate no change (FC>1.5; p<0.05).
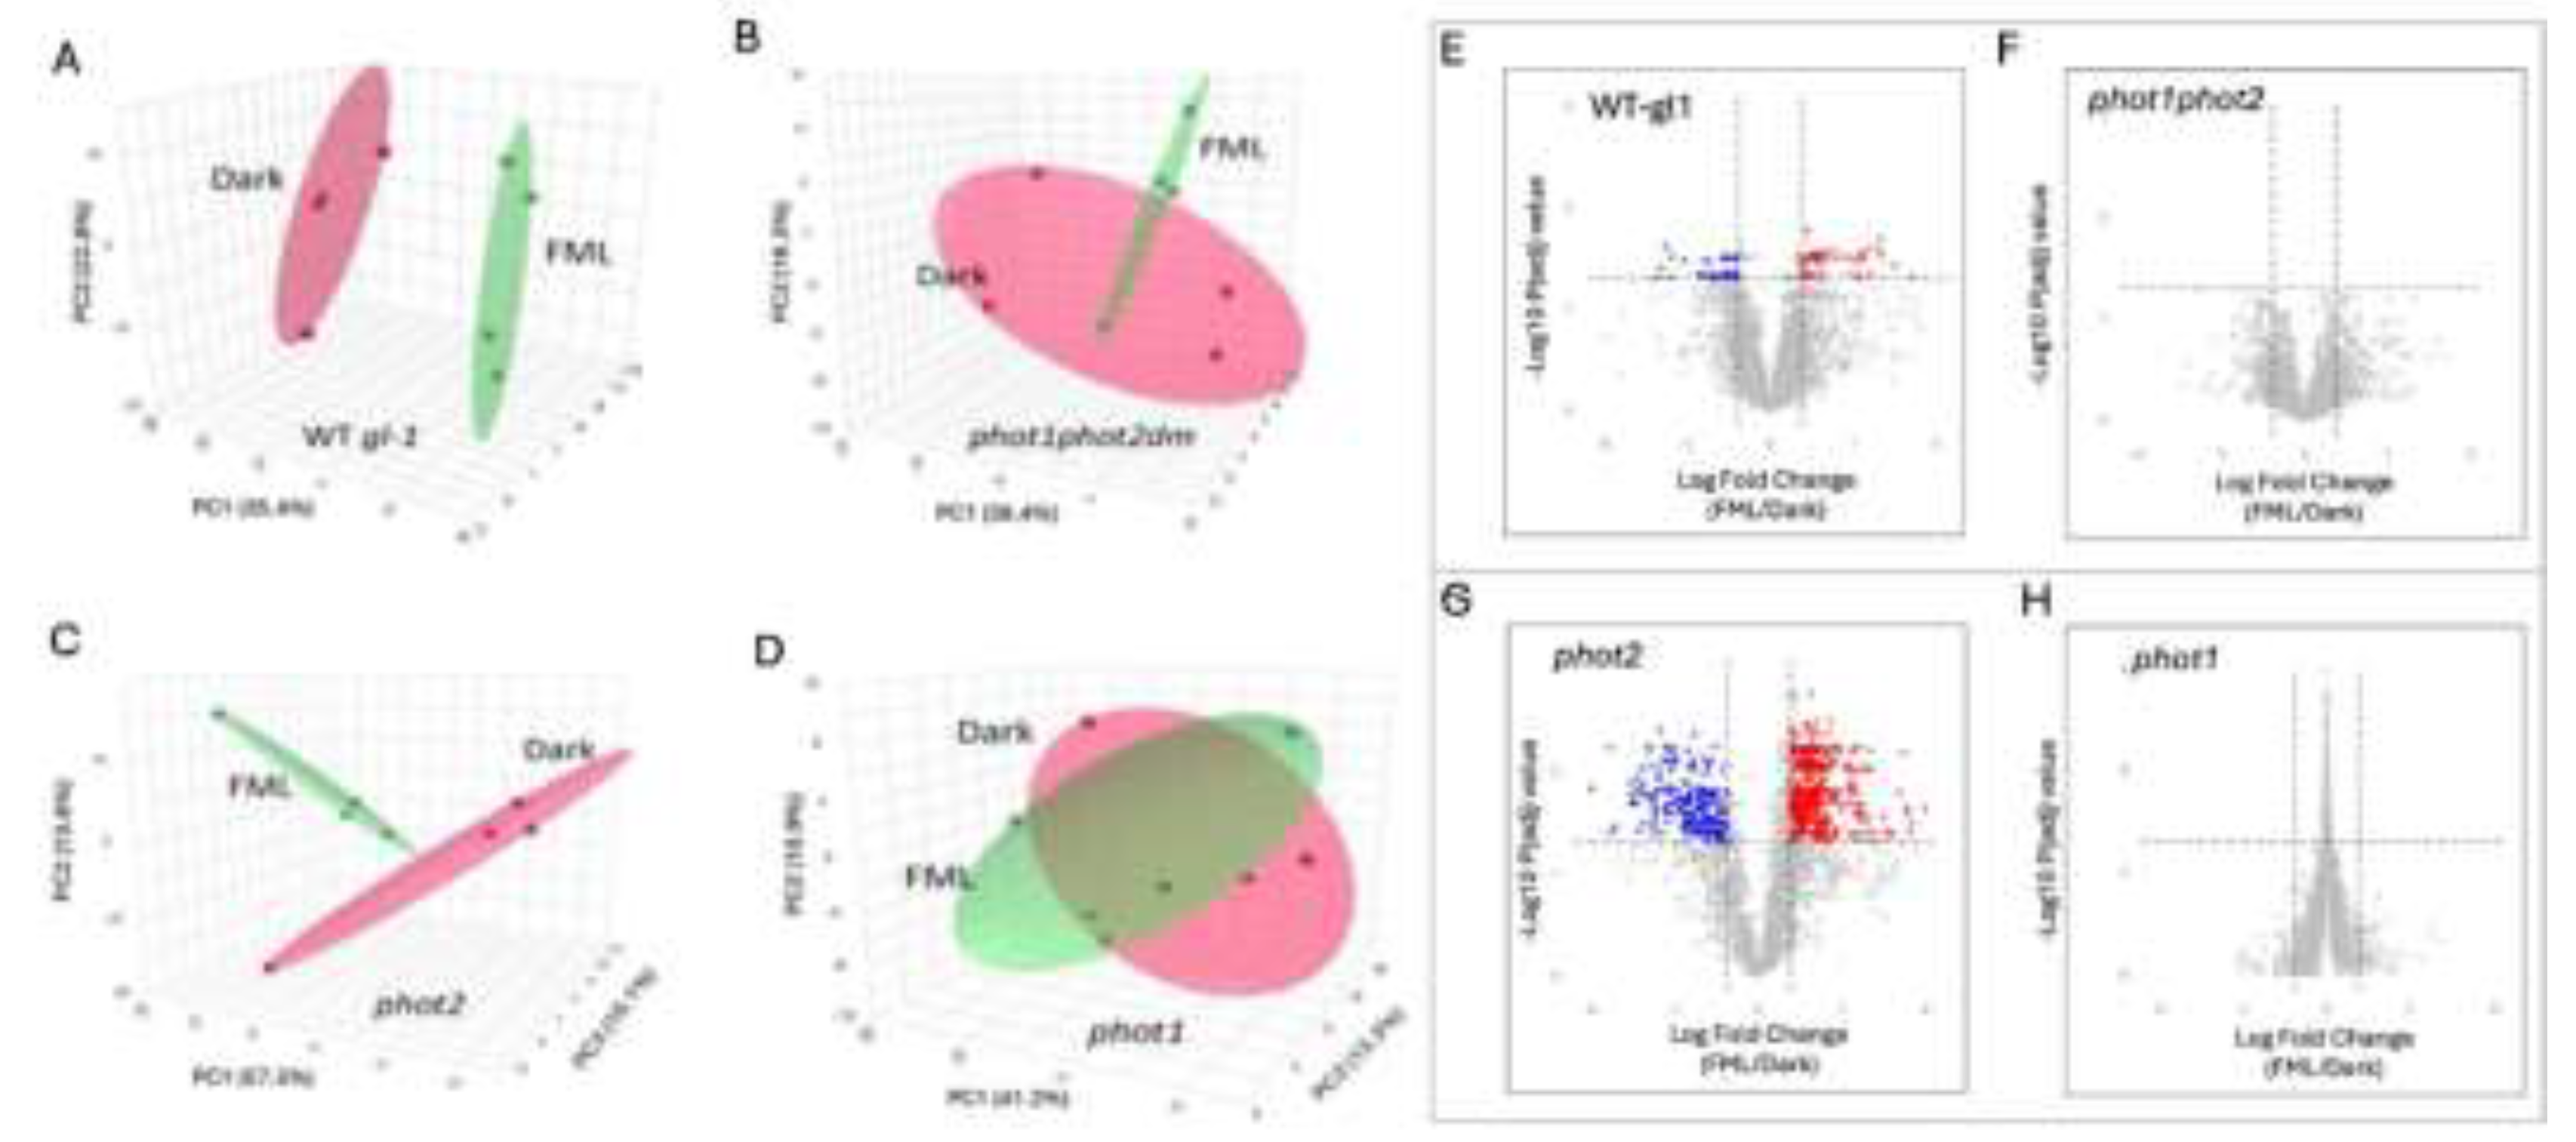
Figure 3.
Categorization and Bar Chart representation of Gene Ontology Term Enrichment. Biological process category of upregulated (A, C) and down-regulated (B, D) proteins in WT gl-1 and phot2 plants following exposure to FML as compared to dark. The Y-axis indicates the count of proteins associated with the term, while the X-axis lists the GO terms. Bars are color-coded according to the category of enriched term, as indicated in the respective legends.
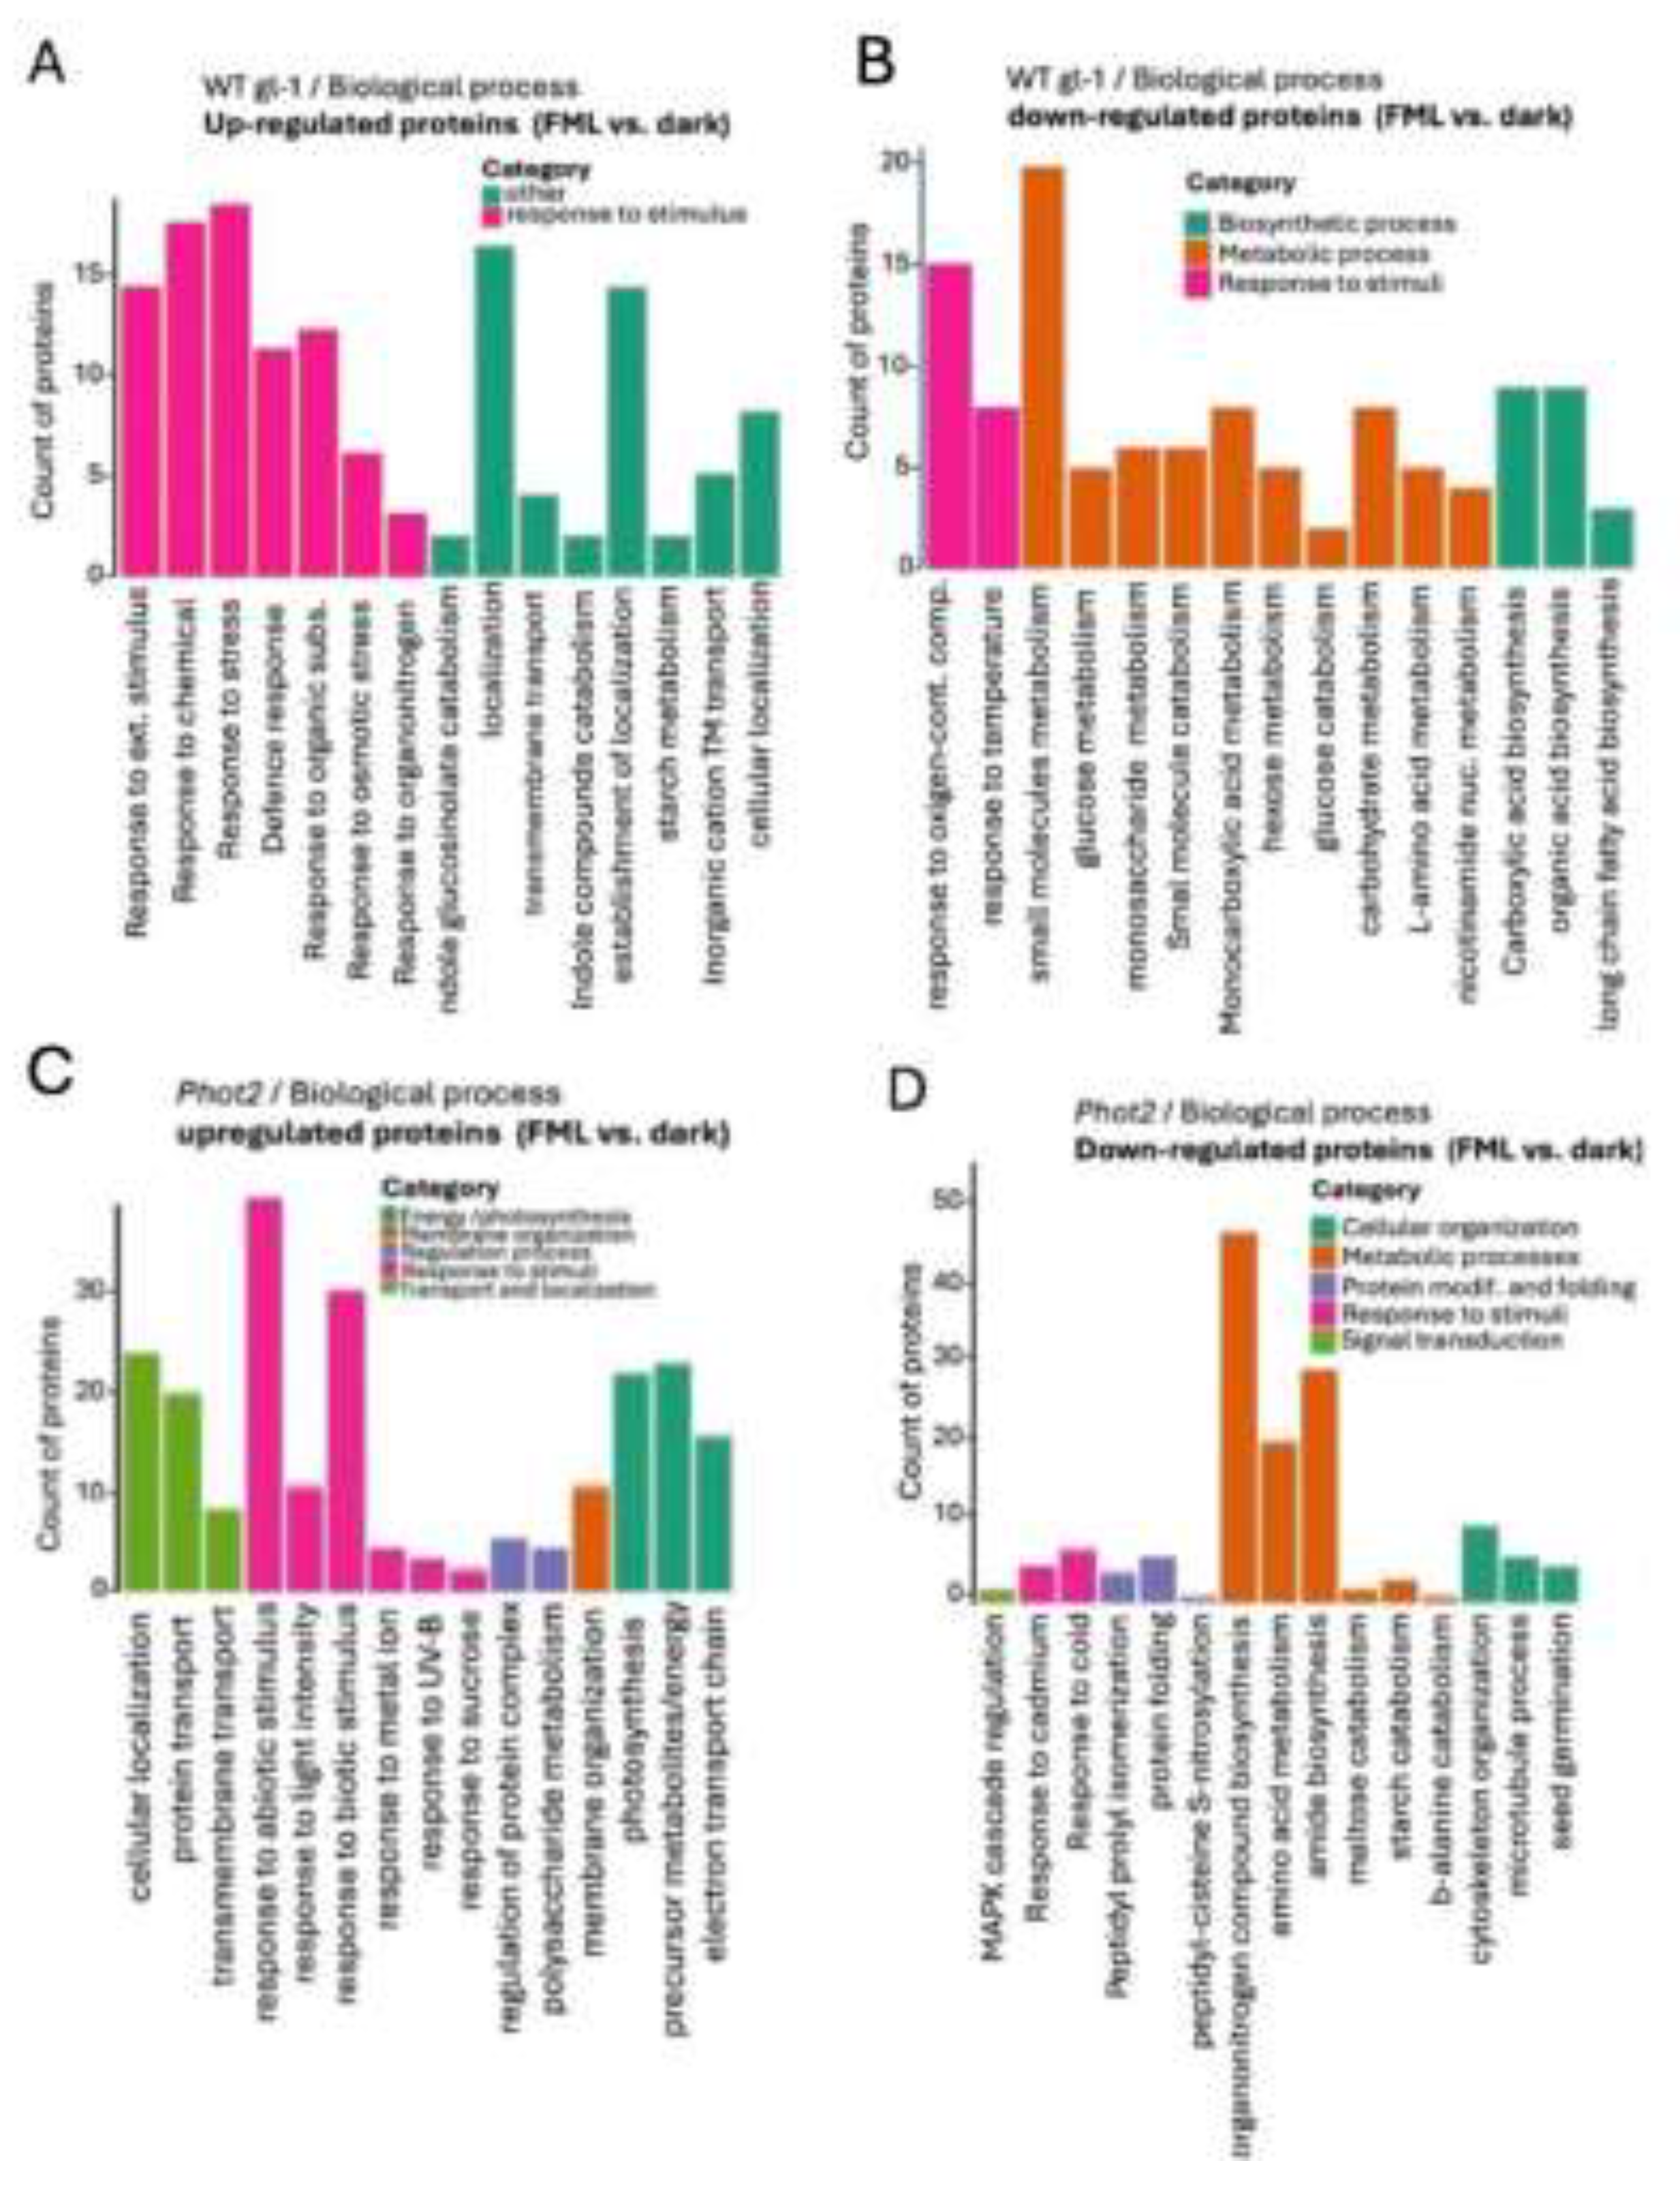
Figure 4.
Deetiolation of phyA and phyB mutants. (A) The response of phyA and phyB etiolated seedlings to FML and growth room light (Light) as compared to dark. The percentage of cotyledon unfolding, and the degree of hook opening are shown to the right. Bars represent the standard deviation. Different letters indicate statistically significant differences between treatments. (B) Boxplots representing average nuclear diameter (n=50) in phyA and phyB mutants following exposure to dark, FML and light. Statistical analysis of the differences in nuclear diameter between treatments was performed by student’s unpaired t-test (p<0.05, GraphPad software).
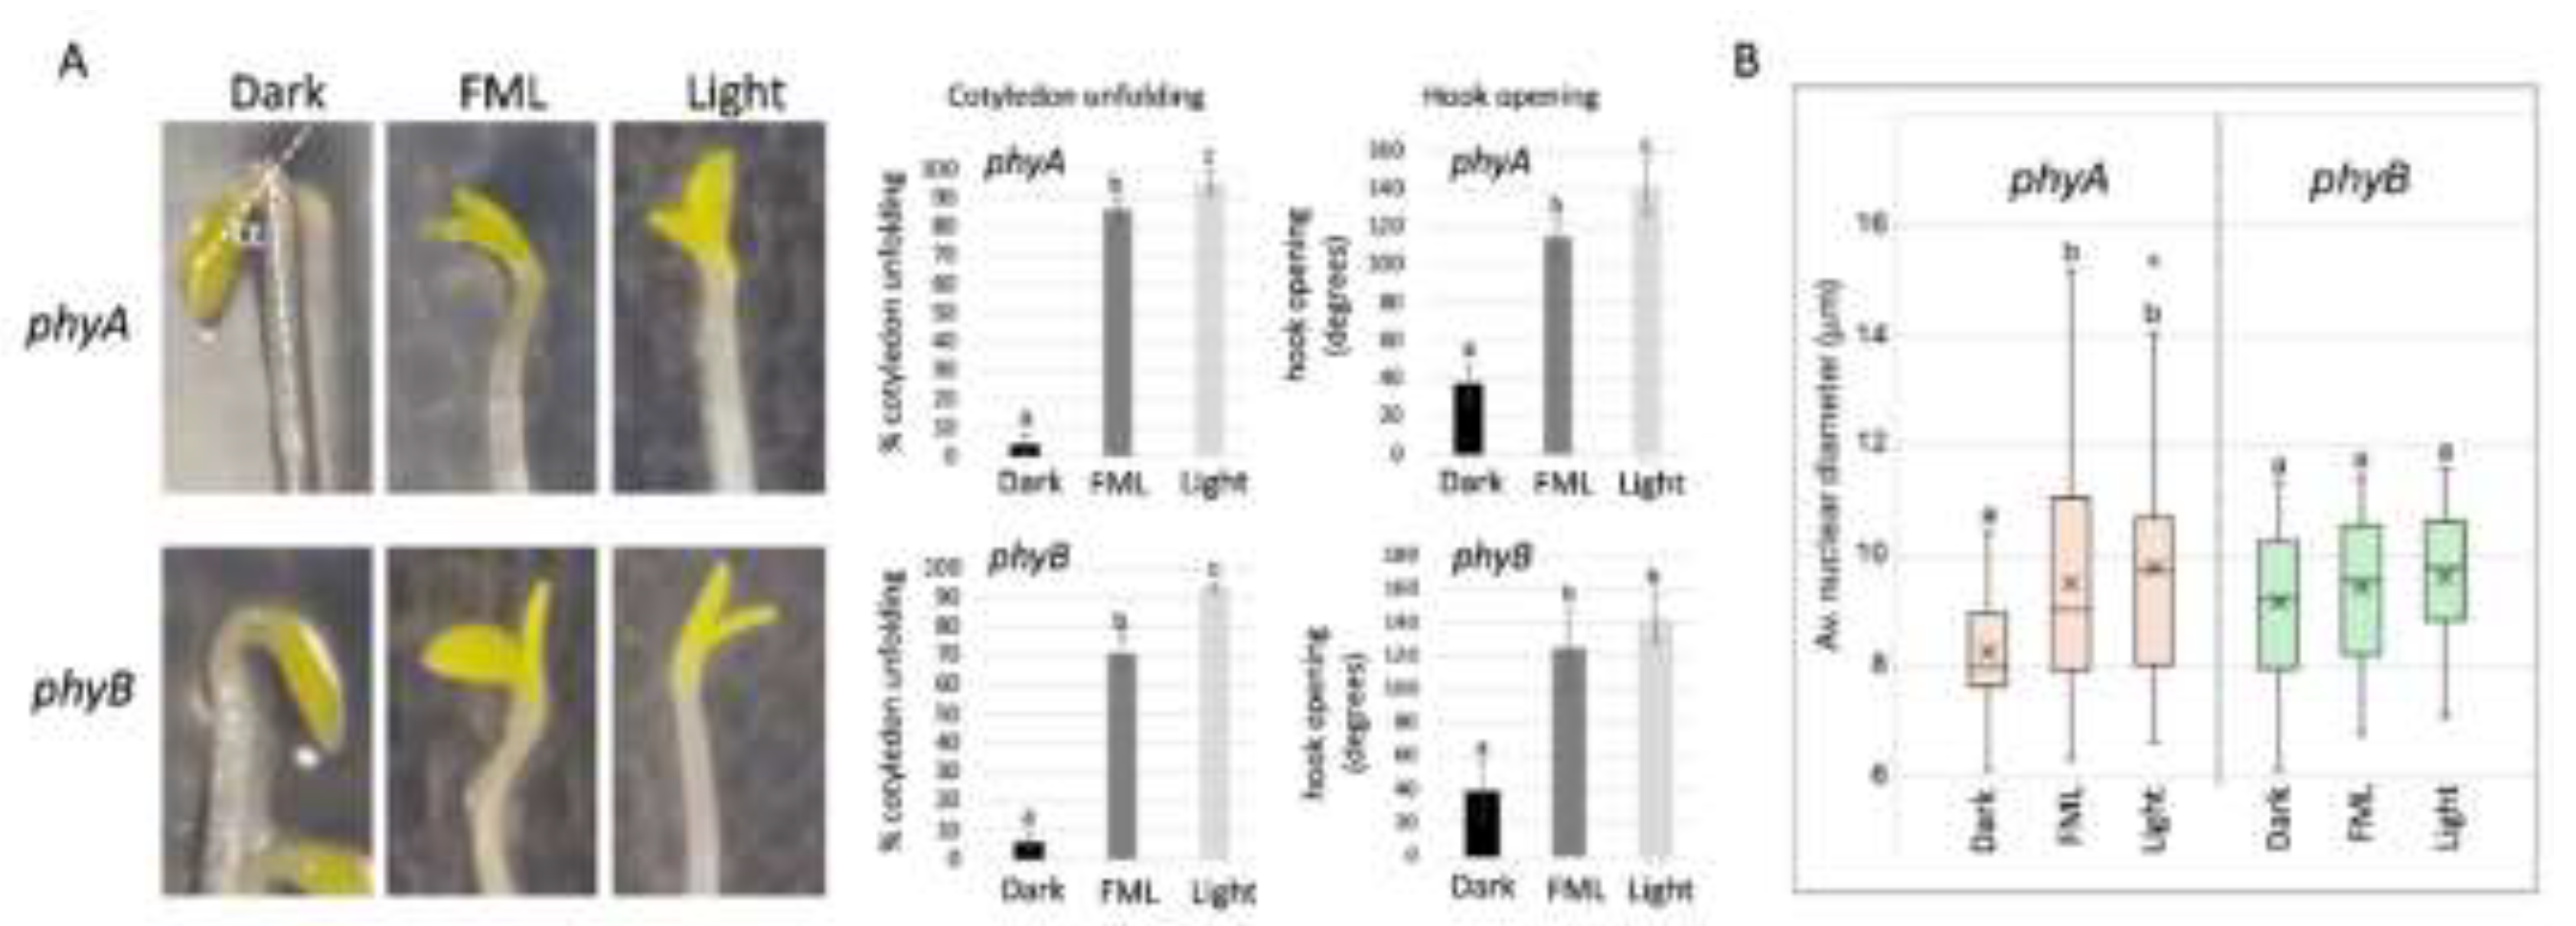
Figure 5.
PhyB is required for plant response to FML. (A) PCA Score plots of expressed proteins in dark and FML treated phyA and phyB mutant plants. (B, C) Volcano plots demonstrating the fold change of proteins in FML vs. dark in phyA (B), and phyB (C). Red and blue dots indicate upregulated and downregulated proteins, respectively, while gray dots indicate no change (FC>1.5; p<0.05). (D, E) Categorization for biological process of upregulated (D) and down-regulated (E) proteins under FML versus dark in phyA mutant plants. Note the upregulation of large number of stress responsive proteins under FML.
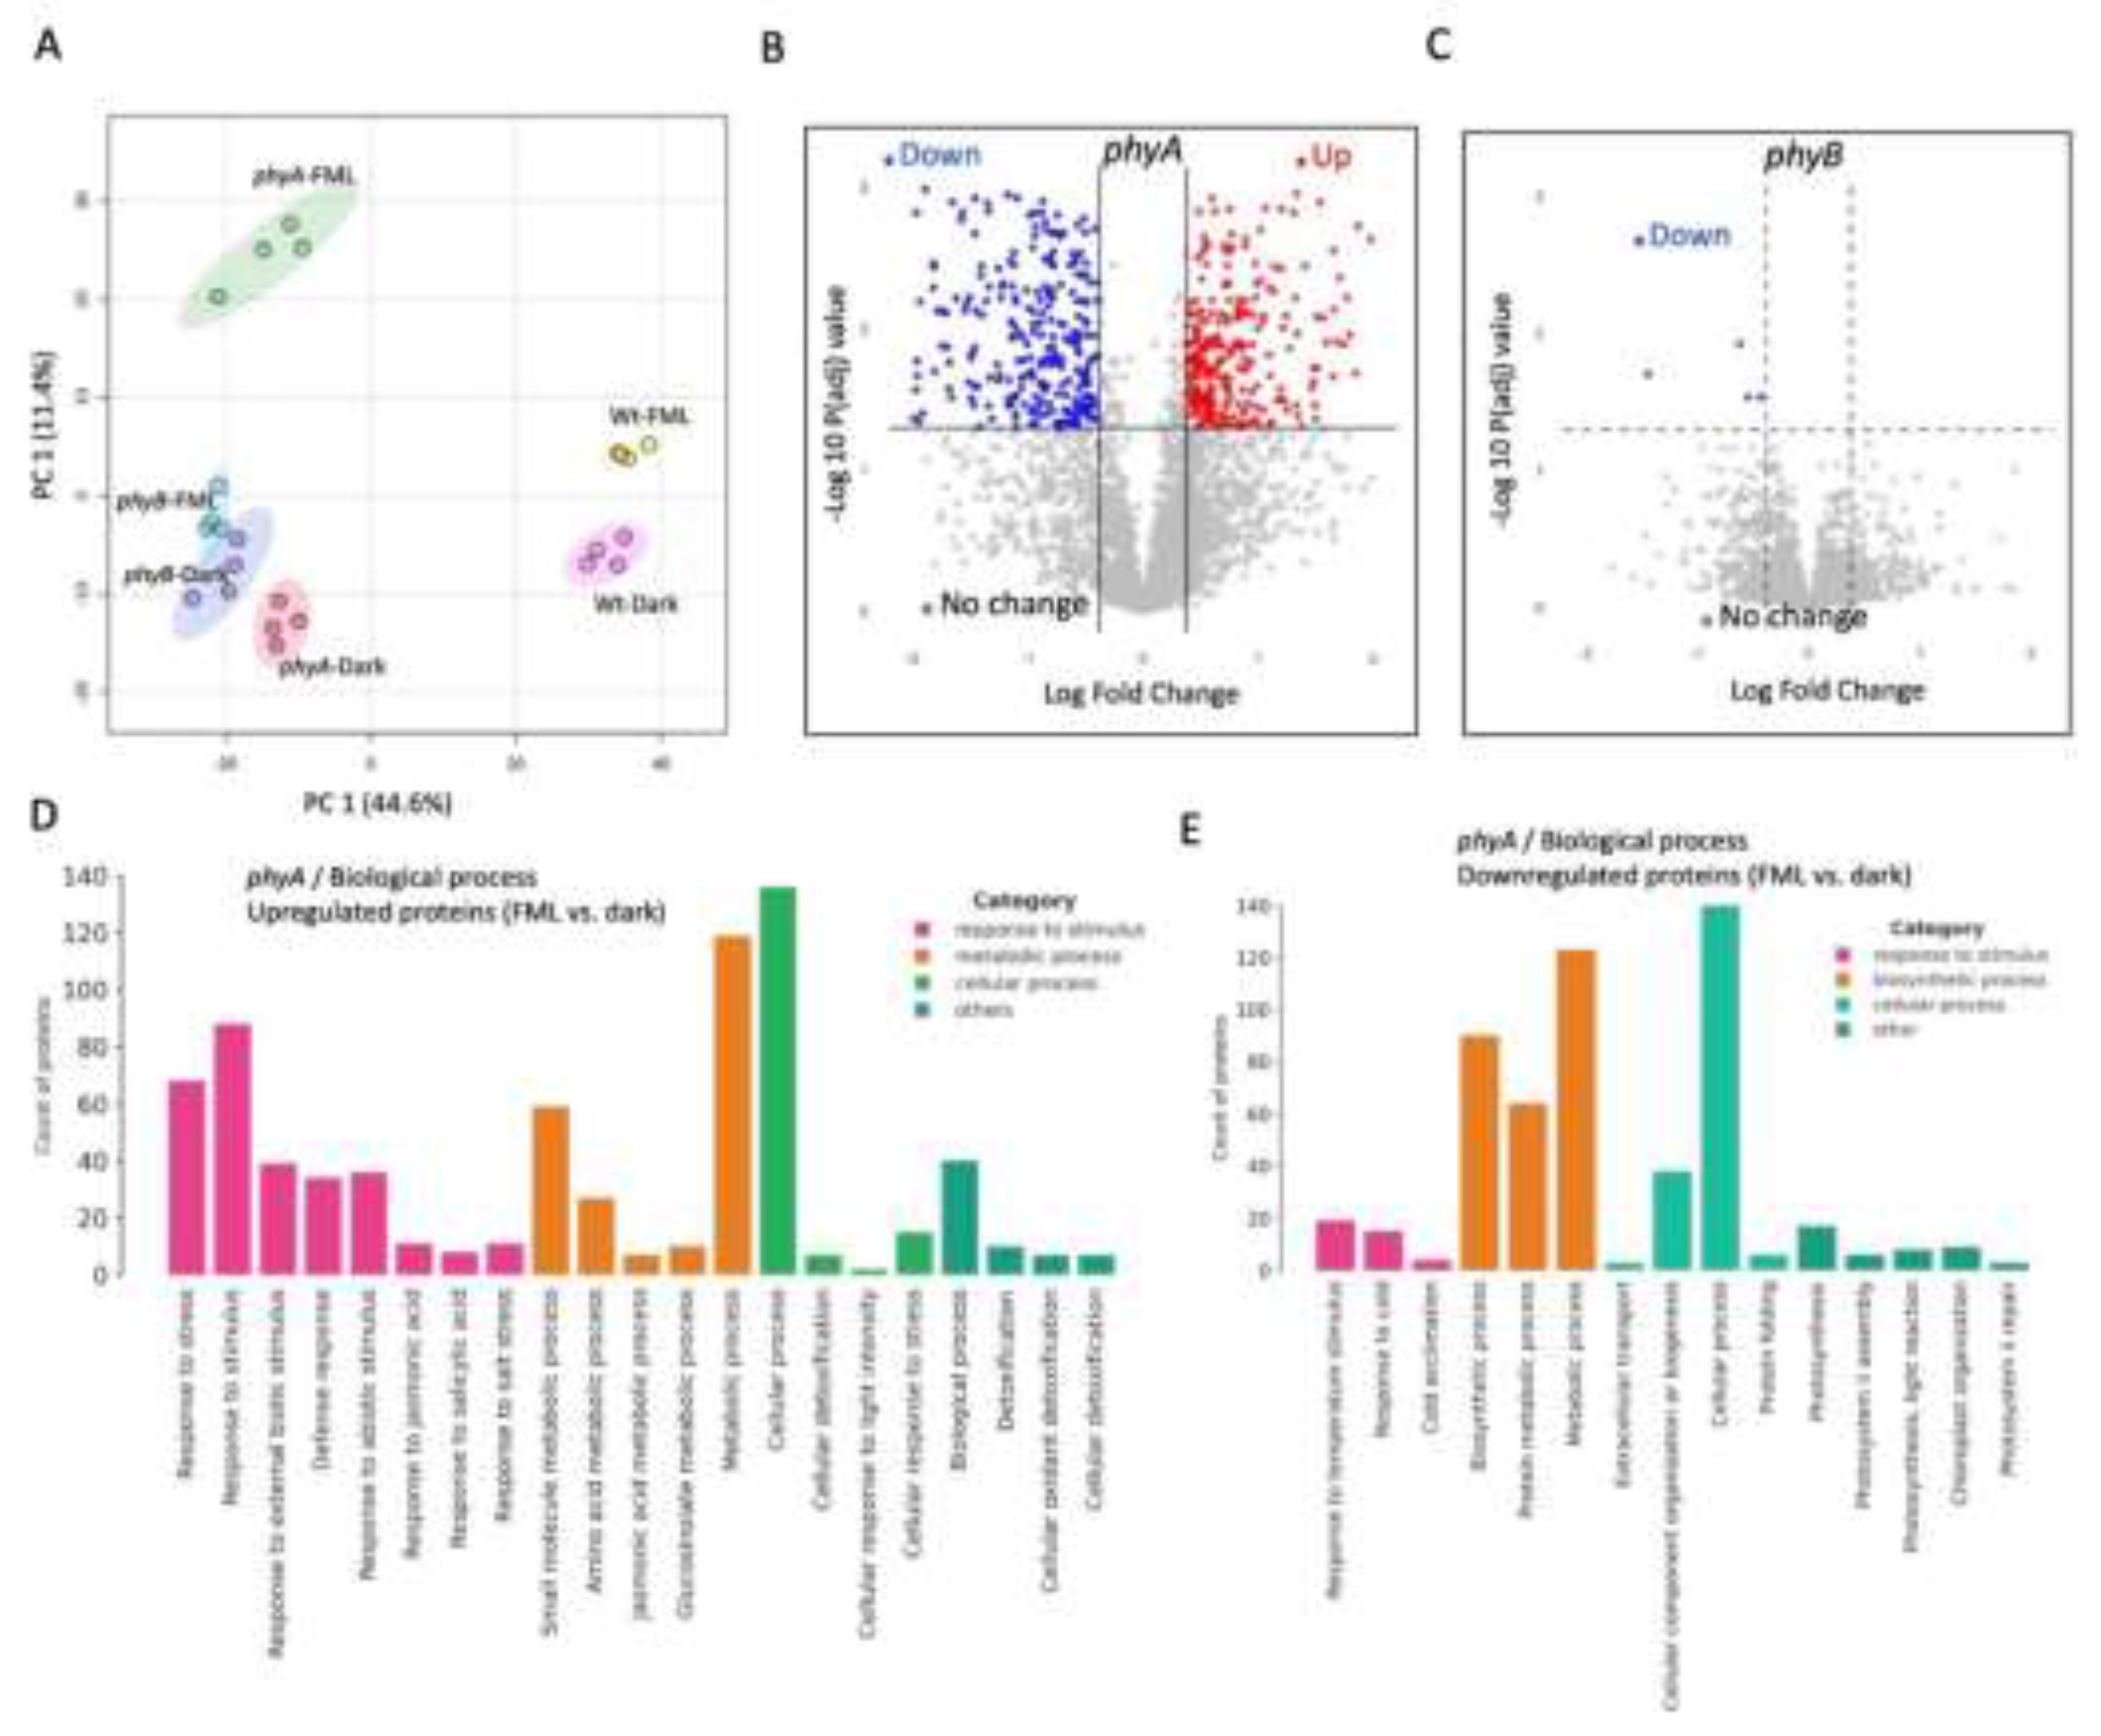
Figure 6.
PhyB-GFP large photobodies (PBs) disassemble in the dark and are not recovered following exposure to FML. (A) Following 10 h in dark phyB-GFP expressing plants were subjected to GR light for 5 h. Representative confocal images are shown where phyB-GFP is assembled into fewer large, intensely fluorescing PBs. (B) Following 14 h in light, plants were subjected to 5 h of darkness, demonstrating disassembly of large PBs into small, dispersed, and faintly fluorescing PBs. (C) Exposure to 5h FML, following 14 h GR light and 2 h dark.
Disclaimer/Publisher’s Note: The statements, opinions and data contained in all publications are solely those of the individual author(s) and contributor(s) and not of MDPI and/or the editor(s). MDPI and/or the editor(s) disclaim responsibility for any injury to people or property resulting from any ideas, methods, instructions or products referred to in the content. |
© 2026 by the authors. Licensee MDPI, Basel, Switzerland. This article is an open access article distributed under the terms and conditions of the Creative Commons Attribution (CC BY) license (http://creativecommons.org/licenses/by/4.0/).
Copyright: This open access article is published under a Creative Commons CC BY 4.0 license, which permit the free download, distribution, and reuse, provided that the author and preprint are cited in any reuse.


