
Submitted:
17 February 2026
Posted:
27 February 2026
You are already at the latest version
Abstract
One of the gaps in green building research in Euro-Mediterranean countries is the assessment of Leadership in Energy and Environmental Design (LEED)-certified projects in the context of the LEED rating system’s ongoing transition from a prescriptive to a performance-based approach. This study evaluates LEED certification strategies by analyzing the causal relationships between five independent LEED performance indicators and the overall LEED score for LEED for Existing Office Buildings version 4.1 (LEED-EB v4.1) gold-certified office projects in Sweden, Italy, Israel, Spain, Germany, and Ireland using simple linear regression. Linear regression showed that each of the six above-mentioned countries demonstrated a unique LEED certification strategy for LEED-EB v4.1 gold-certified office projects. Linear regression revealed, for the first time in the literature, that the causal relationship between the independent indicator “energy” and the dependent indicator overall LEED score was statistically insignificant (R2 = 0.04 and p = 0.359; R2 = 0.13 and p = 0.112, respectively) in LEED-EB v4.1 gold-certified office projects in Germany and Ireland. However, in Sweden, Italy, Israel and Spain, this relationship was statistically significant (R2 = 0.38, 0.46, 0.53 and 0.40 at p < 0.001 in all cases, respectively).
Keywords:
LEED-EB v4.1
; Sweden
; Italy
; Israel
; Spain
; Germany
; Ireland
1. Introduction
1.1. Impact of the Building Sector on Environmental Damage in European Union and Mediterranean Countries
In the European Union (EU), buildings are the largest contributor to environmental pressure, accounting for more than 30% of its total environmental footprint. They are responsible for 42% of the EU’s annual energy consumption and 35% of its annual greenhouse gas emissions, underlining their critical role in climate change [1]. Renovating existing office spaces in the EU rather than building new ones is critical to reducing energy consumption and ensuring a healthy, comfortable and productive indoor climate. Approximately 85% of EU buildings were built before 2000 and 75% have poor energy performance; upgrading this existing stock is essential to reducing the 40% of total EU energy consumption attributed to buildings [2]. As of 2021, the construction industry in Israel accounts for approximately 56% of electricity consumption and approximately 33% of total greenhouse gas emissions [3]. One way to reduce the environmental impact of this sector is to make them more environmentally friendly by retrofitting existing buildings using the Leadership in Energy and Environmental Design (LEED) green building rating system [4]. Gluszak et al. recently demonstrated that the LEED system has become widespread in Europe [5].
1.2. The Evolution of LEED
The LEED system has evolved from version (v) 1.0 to v5 through v2.0, v2.2, v3, v4, and v4.1 [6,7]. LEED 2.0 and later versions provide four certification levels: certified, silver, gold, and platinum. According to LEED v3 2009 and later, certified, silver, gold, and platinum certifications require an overall LEED score of 40-49, 50-59, 60-79, and 80 points or higher, respectively. Currently, LEED v4.1 is the latest version that contains the required sample size to obtain reliable statistical inferences when performing simple linear regression.
Table 1 shows that the LEED system is undergoing significant evolution, moving away from the “prescriptive–descriptive” approach toward a “performance-oriented” approach. The aim of this shift is to ensure that buildings actually perform as designed, particularly in terms of carbon reduction, energy efficiency and productivity.
1.3. LEED Categories and Their Characteristics
Table 2 presents the LEED categories and their characteristics. LEED 2009 v3 and LEED v4/v4.1 share a common foundational structure of credit categories, although more stringent requirements, a greater focus on integrative processes, and a new location-based category were introduced in v4/v4.1. The key differences between LEED 2009 v3 and LEED v4/4.1 in terms of categories are as follows: Location and Transportation was added in LEED v4/v4.1 as a dedicated category (previously part of Sustainable Sites) and the Integrative Process category was introduced to encourage early-stage collaboration [14].
1.4. Characteristics of Key LEED Systems
Between 2000 and 2009, four key environmental rating systems were developed for the LEED: New Construction (LEED-NC), Core and Shell (LEED-C-and-S), Commercial Interiors (LEED-CI), and Existing Buildings (LEED-EB). LEED-NC is designed for new buildings and major renovations [15] and LEED-CI is used for tenant improvements and refurbishments that do not involve the building’s shell or structure [15], while LEED-C-and-S is used for the design and construction of the building’s envelope, structure, and major mechanical, electrical, and plumbing systems, but not the interior fit-out [15]. Finally, LEED-EB focuses on ongoing building operations without any major refurbishments [16]. Originally designed as a program for following up LEED-NC-rated buildings, LEED-EB has become a stand-alone system for owners of existing buildings who wish to obtain eco-certification [17,18].
The author of the present study focused on LEED-EB v4.1 as it places increased emphasis on the performance of existing buildings, recognizing the urgent need to retrofit the vast number of older buildings worldwide, which consume far more energy than modern structures [19].
1.5. LEED v4.1 for Existing Buildings
Table 3 and Table 4 list five performance-based indicators and ten prescriptive indicators, respectively. Pushkar showed that for every office project that achieved LEED-EB v4.1 gold certification, the percentage of binary performance indicators achieved was less than 1% [20]. Therefore, these ten binary prescriptive indicators were excluded from statistical analysis. It should be noted that the maximum number of points for the LEED-EB v4.1 system is 100.
1.6. Research Gap
To examine the relationship between independent LEED categories (parts) and the dependent overall LEED score (whole), most studies have used simple linear correlation [e.g., 21-24], and a few studies have used simple linear regression [e.g., 25,26]. However, all these studies were conducted on LEED-certified buildings in the United States, and the four LEED certification levels, namely certified, silver, gold, and platinum, were combined into one group before correlation analysis or linear regression was conducted [21,22,23,24,25]. Most studies using simple correlation or linear regression were conducted on LEED-NC v3/v4-certified projects [21,22,23,24], and only two studies focused on LEED v4.1 for Healthcare (LEEDE-HC)- and on LEED-EB-certified projects [26,27].
Below are three studies that were taken as the closest analogues to the current study.
- Puskar compared LEED-EB v4.1 gold-certified office projects in six countries in the Euro-Mediterranean region and showed that each of these six countries has a unique LEED certification strategy [20]. Therefore, studying LEED certification strategies in different countries is a pressing issue.
- Pushkar investigated the relationship between the built environment and the LT category in a LEED-EB v4-certified office project in the United States and showed that each LEED certification level—namely certified, silver, gold, and platinum—featured a unique certification strategy [28]. Therefore, studying LEED certification strategies at different levels is a pressing issue.
- Pushkar used simple linear regression to examine the causal relationship between individual LEED performance indicators and the overall LEED score and identified a unique certification strategy for LEED-EB v4.1 gold-certified office projects in the United States [27]. Therefore, studying LEED certification strategies in Euro-Mediterranean countries using simple linear regression is a relevant issue.
1.7. Objective, Novelty and Contribution
The objective of this paper is to examine different LEED certification strategies using simple linear regression between independent LEED performance indicators and the dependent overall LEED score for LEED-EB v4.1 gold-certified office projects in selected European and Mediterranean countries.
The novelty of this study is that each of the six countries exhibits a unique LEED certification strategy, as revealed by simple linear regression analysis. Meanwhile, its practical contribution is that this knowledge will help LEED professionals perform better in these countries.
2. Literature Review
In this section, a statistical analysis of the causal relationship between independent individual LEED categories (i.e., part of the whole) and the dependent overall LEED score (i.e., the whole) is presented. Subsection 2.1 summarizes the results of calculations of the coefficients of determination (R2) for the above relationship. In the literature, if the results of a linear relationship between two variables were presented as a Pearson correlation coefficient (r), they were transformed into R2 values. In subsection 2.2, the results of the analysis of the following simple linear regression variables are summarized: the intercept (b0), the slope (b1), and R2. In quantitative assessments of causal relationships, special attention was paid to critical analysis of the study design.
2.1. Analysis of the Relationship Between Independent LEED Category and Dependent Overall LEED Score in Terms of R2
Table 5 shows the relationship between independent LEED categories and dependent overall LEED scores in terms of R2. The EA category exhibits the strongest relationship with the overall LEED score (0.27 ≤ R2 ≤ 0.63), while the WE and MR categories exhibit the weakest relationship with the overall LEED score (0.04 ≤ R2 ≤ 0.15) and the following categories exhibit an intermediate relationship with the overall LEED score (0.08 ≤ R2 ≤ 0.21): LT, SS, IEQ, and RP. The analyzed studies [21,22,23,24,25] have at least three common features: (i) the relationship between individual LEED categories and the overall LEED score is statistically significant (p < 0.001), (ii) the analysis of this relationship was conducted on LEED-certified projects in the United States, and (iii) the four LEED certification levels (certified, silver, gold, and platinum), which are four independent groups each with its own unique LEED certification strategy, were combined into one group, which was analyzed using significance tests.
2.2. Analysis of the Relationship Between Independent LEED Category and Dependent Overall LEED Score in Terms of Simple Linear Regression
Before interpreting the LEED results presented in Table 6, it is necessary to clarify LEED terminology. LEED-NC v4.1 features the EA and MR categories as in v3 and 4, while LEED-EB v4.1 features the “energy” and “waste” performance indicators. In this case, the term “energy” is analogous to the term “EA category”, and the term “waste” is analogous to the term “MR category”.
Table 6 shows that the group of LEED gold-certified projects significantly outperformed the combined group of LEED-certified projects, which included four certification levels (certified, silver, gold, and platinum), with regard to linear regression parameters: b0, b1, and R2. In both cases [26,27], the relationship between the independent individual LEED-HC v4.1 categories or LEED-EB v4.1 performance indicators and the dependent overall LEED score was statistically significant (p ≤ 0.025).

Table 6.
A summary of the intercept (b0), slope (b1), and coefficient of determination (R2). A simple linear regression between dependent overall LEED scores and independent LEED performance indicators.
Table 6.
A summary of the intercept (b0), slope (b1), and coefficient of determination (R2). A simple linear regression between dependent overall LEED scores and independent LEED performance indicators.
| LEED | Dependent variable | Independent variable | Regression variable | Ref. | ||
| b0 | b1 | R2 | ||||
| LEED-HC v4.1-certified projects in the United States | Overall LEED | EA | 8.89 | 0.16 | 0.36 | [26] |
| LEED-EB v4.1 gold-certified office projects in New York City | Energy | 48.13 | 0.78 | 0.47 | [27] | |
| LEED-EB v4.1 gold-certified office projects in Washington, D.C. | 44.96 | 0.96 | 0.68 | |||
| LEED-HC v4.1-certified projects in the United States | MR | 6.78 | 0.04 | 0.11 | [26] | |
| LEED-EB v4.1 gold-certified office projects in New York City | Waste | 54.94 | 1.72 | 0.19 | [27] | |
| LEED-EB v4.1 gold-certified office projects in Washington, D.C. | 53.46 | 1.97 | 0.42 | |||
3. Materials and Methods
3.1. Study Design and Data Collection
The following conditions were considered when developing the study: LEED-certified projects must belong to the same region (e.g., Euro-Mediterranean), LEED system (e.g., LEED-EB), version (e.g., v4.1), certification level (e.g., gold), and building type (e.g., office). Office building projects that received LEED-EB v4.1 gold certification differed only by country and not by region [20].
To justify the minimum sample size when using simple linear regression to analyze environmental performance indicators in LEED-EB v4.1-certified projects, the author of this study has suggested that LEED data could be considered as part of an environmental field study [29]. Therefore, according to generally accepted recommendations for the use of simple linear regression in ecological field studies, the minimum sample size (n) is n = 15–20 [30]. For this study, the minimum sample size was n = 20.
Table 7 lists six countries in the Euro-Mediterranean region, and as of 7 January 2026, at least 20 LEED-EB v4.1 gold-certified office projects in each country were identified from two comprehensive databases [31,32]. In a previous study, six of the twenty Euro-Mediterranean countries, namely Sweden, Italy, Israel, Spain, Germany and Ireland, were selected based on the number of LEED-certified projects required to draw reliable statistical conclusions. This study is a continuation of this previous study [20].
3.2. Statistical Analysis of Linear Regression
The following variables were used to interpret the results of simple linear regression: p-value, b0, b1, and R2. If the relationship between the dependent variable and one independent variable was statistically significant (p ≤ 0.05), then the values of b0, b1 and R2 were used to interpret the linear regression. If the relationship between the dependent variable and one independent variable was statistically insignificant (p > 0.05), then the values of b0, b1 and R2 were not used to interpret the linear regression. In all cases, a two-tailed p-value was used. MATLAB 2024a was used to process data from LEED-certified projects [33].
4. Results
4.1. Sweden
Figure 1 and Table 8 show that in Sweden, the indicators “water”, “energy”, “waste” and “IEQ” show a positive and statistically significant causal relationship with “overall LEED”, while the “transportation” indicator is not correlated with “overall LEED”. Linear regression showed that each additional point in the “water”, “energy”, “waste”, and “IEQ” indicators contributes approximately 1.07, 1.04, 0.98, and 1.19 points to the “overall LEED” score, respectively. According to the R2 value, 29%, 38%, 13%, and 26% of the variance in the “water”, “energy”, “waste”, and “IEQ” variables is predicted by the “overall LEED” variable in the model, respectively.
4.2. Italy
Figure 2 and Table 9 show that, in Italy, the “transportation”, “energy”, and “IEQ” indicators show a positive and statistically significant causal relationship with “overall LEED”, while the indicators “water” and “waste” are not correlated with the “overall LEED”. Linear regression showed that each additional point in the “transportation”, “energy”, and “IEQ” indicators contributes approximately 1.40, 0.97, and 0.89 points to the “overall LEED” score, respectively. According to the R2 value, 17%, 46%, and 24% of the variance in the “transportation”, “energy”, and “IEQ” variables is predicted by the overall LEED variable in the model, respectively.
4.3. Israel
Figure 3 and Table 10 show that, in Israel, the “water”, “energy”, and “waste” indicators show a positive and statistically significant causal relationship with “overall LEED”, while the “transportation” and “IEQ” indicators are not correlated with the “overall LEED”. Linear regression showed that each additional point in the “water”, “energy”, and “waste” indicators contributes approximately 1.06, 0.90, and 2.66 points to the “overall LEED” score, respectively. According to the R2 value, 28%, 53%, and 56% of the variance in the “water”, “energy”, and “waste” variables is predicted by the overall LEED variable in the model, respectively.
4.4. Spain
Figure 4 and Table 11 show that, in Spain, the “transportation”, “water”, and “energy” indicators show a positive and statistically significant causal relationship with “overall LEED”, while the “waste” and “IEQ” indicators are not correlated with the “overall LEED”. Linear regression showed that each additional point in the “transportation”, “water”, and “energy” indicators contributes approximately 1.22, 0.60, and 0.76 points to the “overall LEED” score, respectively. According to the R2 value, 20%, 16%, and 40% of the variance in the “transportation”, “water”, and “energy” variables is predicted by the overall LEED variable in the model, respectively.
4.5. Germany
Figure 5 and Table 12 show that, in Germany, the “water”, “waste”, and “IEQ” indicators show a positive and statistically significant causal relationship with “overall LEED”, while the “transportation” and “energy” indicators are not correlated with the “overall LEED”. Linear regression showed that each additional point in the “water”, “waste”, and “IEQ” indicators contributes approximately 1.29, 2.11, and 0.67 points to the “overall LEED” score, respectively. According to the R2 value, 35%, 39%, and 27% of the variance in the “water”, “waste”, and “IEQ” variables is predicted by the overall LEED variable in the model, respectively.
4.6. Ireland
Figure 6 and Table 13 show that, in Ireland, the “waste” and “IEQ” indicators show a positive and statistically significant causal relationship with “overall LEED”, while the “transportation”, “energy”, and “water” indicators are not correlated with the “overall LEED”. Linear regression showed that each additional point in the “waste” and “IEQ” indicators contributes approximately 3.43 and 0.90 points to the “overall LEED” score, respectively. According to the R2 value, 42% and 47% of the variance in the “waste” and “IEQ” variables is predicted by the overall LEED variable in the model, respectively.
The key components of variation and the regression coefficients from the statistically significant linear regression results are presented in the ANOVA (Analysis of Variance) regression tables and regression coefficient tables, respectively (Appendix A, Table A1, Table A2, Table A3, Table A4, Table A5, Table A6, Table A7, Table A8, Table A9, Table A10, Table A11, Table A12, Table A13, Table A14, Table A15, Table A16, Table A17, Table A18, Table A19, Table A20, Table A21, Table A22, Table A23, Table A24, Table A25, Table A26, Table A27, Table A28, Table A29, Table A30, Table A31, Table A32, Table A33, Table A34, Table A35 and Table A36). Statistically insignificant linear regression results were not included in these tables.
5. Discussion
5.1. LEED Certification Strategy in Euro-Mediterranean Countries
Table 14 shows that each of six countries has a unique LEED certification strategy. In Sweden, for LEED-EB v4.1 gold-certified office projects, there was a statistically significant causal relationship between four of the five performance indicators and the overall LEED score. In Italy, Israel, Spain, and Germany, for the same office projects, there was a statistically significant causal relationship between three of the five performance indicators and the overall LEED score. Finally, in Ireland, there was a statistically significant causal relationship between two of the five performance indicators and the overall LEED score for LEED-EB v4.1 gold-certified office projects. It can be hypothesized that the wider range of causal relationships between independent LEED performance indicators and the resulting overall LEED score is associated with the greater diversity of LEED certification strategies [27]. Although the number of causal pairs is the same for Italy, Israel, Spain, and Germany (three pairs in each country), they each have unique sets of pairs. Thus, this comparison showed that LEED certification strategies in Euro-Mediterranean countries differ significantly from those in cities in the United States [27].
Table 14 also shows that statistically significant differences are observed in the causal relationship between the transportation indicator and the overall LEED score in two countries, namely Italy and Spain, while this difference is not statistically significant in four countries. The relationship between the “water” indicator and the “overall LEED” score showed statistically significant differences in four countries, namely Sweden, Israel, Spain and Germany, while no statistically significant differences were found in two countries, namely Italy and Ireland. There were statistically significant differences in the relationship between the “energy” indicator and the “overall LEED” score in four countries, namely Sweden, Italy, Israel, and Spain, while these differences were not statistically significant in two countries, namely Germany and Ireland. The relationship between the “waste” indicator and the “overall LEED” score showed statistically significant differences in four countries, namely Sweden, Israel, Germany, and Ireland, while no statistically significant differences were found in two countries, namely Italy and Spain. Finally, the relationship between the “IEQ” indicator and the “overall LEED” score exhibited statistically significant differences in four countries, namely Sweden, Italy, Germany, and Ireland, while no statistically significant differences were found in two countries, namely Israel and Spain.
5.2. Comparison of the b0, b1, and R2 Values with Literature Data
Table 15 presents simple linear regression variables from recent and current studies on LEED-EB v4.1 gold-certified office projects. A recent study analyzed LEED-EB v4.1 gold-certified office projects in two US cities: New York City and Washington, D.C. This study found that statistically significant relationships were observed in only two out of five independent LEED performance indicators and the dependent overall LEED score, namely “energy” and “waste” [27]. In the current study, two of the six countries, namely Sweden and Israel, exhibited a similar pattern: the “energy” and “waste” indicators exhibited a statistically significant relationship with the overall LEED score. Comparative analysis of regression coefficients showed that only Washington, D.C. and Israel had similar regression coefficients.
6. Conclusions
The objective of this study was to evaluate LEED certification strategies by analyzing the causal relationships between five independent LEED performance indicators and the dependent overall LEED score using simple linear regression. The following conclusions were drawn:
- Each of the six countries analyzed, namely Sweden, Italy, Israel, Spain, Germany and Ireland, demonstrated a unique LEED certification strategy for LEED-EB v4.1 gold-certified office projects.
- This is the first case in the literature where the causal relationship between “energy” and “overall LEED” in LEED-EB v4.1 gold-certified office projects in Germany and Ireland was found to be statistically insignificant (R2 = 0.04 and p = 0.359; R2 = 0.13 and p = 0.112, respectively).
- In contrast, in Sweden, Italy, Israel and Spain, the causal relationship between “energy” and “overall LEED” was statistically significant (R2 = 0.38, 0.46, 0.53 and 0.40 at p < 0.001 in all cases, respectively).
7. Limitations and Future Research Directions
This study describes different LEED certification strategies in Euro-Mediterranean countries without taking into account external factors. Future research should examine the causal relationships among green building policies [34], climate zones [35], urban planning [36] and individual LEED performance indicators in each Euro-Mediterranean country.
Appendix A
Table A1.
ANOVA table. Simple linear regression analysis between “water” and “overall LEED” for LEED-EB v4.1 gold-certified projects in Sweden.
Table A1.
ANOVA table. Simple linear regression analysis between “water” and “overall LEED” for LEED-EB v4.1 gold-certified projects in Sweden.
| Source | Sum of squares | Degrees of freedom | Mean square | F-statistic | p-Value |
| Regression | 242.5835 | 1 | 242.5835 | 22.8675 | 0.00001 |
| Error | 583.4516 | 55 | 10.6082 | ||
| Total | 826.0351 | 56 |
Table A2.
Regression table. Simple linear regression analysis between “water” and “overall LEED’ for LEED-EB v4.1 gold-certified projects in Sweden.
Table A2.
Regression table. Simple linear regression analysis between “water” and “overall LEED’ for LEED-EB v4.1 gold-certified projects in Sweden.
| Term | Coefficient | Standard error | T-Statistic | p-Value | R2-Value |
| Intercept (b0) | 54.1245 | 2.4736 | 21.8808 | <0.00001 | |
| Χ (Scope b1) | 1.0725 | 0.2243 | 4.7820 | 0.00001 | 0.2937 |
Table A3.
ANOVA table. Simple linear regression analysis between “energy” and “overall LEED” for LEED-EB v4.1 gold-certified projects in Sweden.
Table A3.
ANOVA table. Simple linear regression analysis between “energy” and “overall LEED” for LEED-EB v4.1 gold-certified projects in Sweden.
| Source | Sum of squares | Degrees of freedom | Mean square | F-statistic | p-Value |
| Regression | 316.2903 | 1 | 316.2903 | 34.1268 | <0.00001 |
| Error | 509.7448 | 55 | 9.2681 | ||
| Total | 826.0351 | 56 |
Table A4.
Regression table. Simple linear regression analysis between “energy” and “overall LEED” for LEED-EB v4.1 gold-certified projects in Sweden.
Table A4.
Regression table. Simple linear regression analysis between “energy” and “overall LEED” for LEED-EB v4.1 gold-certified projects in Sweden.
| Term | Coefficient | Standard error | T-Statistic | p-Value | R2-Value |
| Intercept (b0) | 40.5647 | 4.3338 | 9.3602 | <0.00001 | |
| Χ (Scope b1) | 1.0367 | 0.1775 | 5.8418 | <0.00001 | 0.3829 |
Table A5.
ANOVA table. Simple linear regression analysis between “waste” and “overall LEED” for LEED-EB v4.1 gold-certified projects in Sweden.
Table A5.
ANOVA table. Simple linear regression analysis between “waste” and “overall LEED” for LEED-EB v4.1 gold-certified projects in Sweden.
| Source | Sum of squares | Degrees of freedom | Mean square | F-statistic | p-Value |
| Regression | 105.2509 | 1 | 105.2509 | 8.0312 | 0.00642 |
| Error | 720.7842 | 55 | 13.1052 | ||
| Total | 826.0351 | 56 |
Table A6.
Regression table. Simple linear regression analysis between “waste” and “overall LEED” for LEED-EB v4.1 gold-certified projects in Sweden.
Table A6.
Regression table. Simple linear regression analysis between “waste” and “overall LEED” for LEED-EB v4.1 gold-certified projects in Sweden.
| Term | Coefficient | Standard error | T-Statistic | p-Value | R2-Value |
| Intercept (b0) | 60.0808 | 2.0646 | 29.1000 | <0.00001 | |
| Χ (Scope b1) | 0.9771 | 0.3448 | 2.8339 | 0.00642 | 0.1274 |
Table A7.
ANOVA table. Simple linear regression analysis between “IEQ” and “overall LEED” for LEED-EB v4.1 gold-certified projects in Sweden.
Table A7.
ANOVA table. Simple linear regression analysis between “IEQ” and “overall LEED” for LEED-EB v4.1 gold-certified projects in Sweden.
| Source | Sum of squares | Degrees of freedom | Mean square | F-statistic | p-Value |
| Regression | 214.5548 | 1 | 214.5548 | 19.2983 | 0.00005 |
| Error | 611.4802 | 55 | 11.1178 | ||
| Total | 826.0351 | 56 |
Table A8.
Regression table. Simple linear regression analysis between “IEQ” and “overall LEED” for LEED-EB v4.1 gold-certified projects in Sweden.
Table A8.
Regression table. Simple linear regression analysis between “IEQ” and “overall LEED” for LEED-EB v4.1 gold-certified projects in Sweden.
| Term | Coefficient | Standard error | T-Statistic | p-Value | R2-Value |
| Intercept (b0) | 50.8219 | 3.4317 | 14.8095 | <0.00001 | |
| Χ (Scope b1) | 1.1885 | 0.2705 | 4.3930 | 0.00005 | 0.2597 |
Table A9.
ANOVA table. Simple linear regression analysis between “transportation” and “overall LEED” for LEED-EB v4.1 gold-certified projects in Italy.
Table A9.
ANOVA table. Simple linear regression analysis between “transportation” and “overall LEED” for LEED-EB v4.1 gold-certified projects in Italy.
| Source | Sum of squares | Degrees of freedom | Mean square | F-statistic | p-Value |
| Regression | 118.7602 | 1 | 118.7602 | 5.4933 | 0.02701 |
| Error | 562.0969 | 26 | 21.6191 | ||
| Total | 680.8571 | 27 |
Table A10.
Regression table. Simple linear regression analysis between “transportation” and “overall LEED” for LEED-EB v4.1 gold-certified projects in Italy.
Table A10.
Regression table. Simple linear regression analysis between “transportation” and “overall LEED” for LEED-EB v4.1 gold-certified projects in Italy.
| Term | Coefficient | Standard error | T-Statistic | p-Value | R2-Value |
| Intercept (b0) | 52.5071 | 6.8497 | 7.6656 | <0.00001 | |
| Χ (Scope b1) | 1.4019 | 0.5981 | 2.3438 | 0.02701 | 0.1744 |
Table A11.
ANOVA table. Simple linear regression analysis between “energy” and “overall LEED” for LEED-EB v4.1 gold-certified projects in Italy.
Table A11.
ANOVA table. Simple linear regression analysis between “energy” and “overall LEED” for LEED-EB v4.1 gold-certified projects in Italy.
| Source | Sum of squares | Degrees of freedom | Mean square | F-statistic | p-Value |
| Regression | 314.2291 | 1 | 314.2291 | 22.2841 | 0.00007 |
| Error | 366.6280 | 26 | 14.1011 | ||
| Total | 680.8571 | 27 |
Table A12.
Regression table. Simple linear regression analysis between “energy” and “overall LEED” for LEED-EB v4.1 gold-certified projects in Italy.
Table A12.
Regression table. Simple linear regression analysis between “energy” and “overall LEED” for LEED-EB v4.1 gold-certified projects in Italy.
| Term | Coefficient | Standard error | T-Statistic | p-Value | R2-Value |
| Intercept (b0) | 44.2250 | 5.1761 | 8.5441 | <0.00001 | |
| Χ (Scope b1) | 0.9737 | 0.2063 | 4.7206 | 0.00007 | 0.4615 |
Table A13.
ANOVA table. Simple linear regression analysis between “IEQ” and “overall LEED” for LEED-EB v4.1 gold-certified projects in Italy.
Table A13.
ANOVA table. Simple linear regression analysis between “IEQ” and “overall LEED” for LEED-EB v4.1 gold-certified projects in Italy.
| Source | Sum of squares | Degrees of freedom | Mean square | F-statistic | p-Value |
| Regression | 161.3265 | 1 | 161.3265 | 8.0736 | 0.00862 |
| Error | 519.5306 | 26 | 19.9819 | ||
| Total | 680.8571 | 27 |
Table A14.
Regression table. Simple linear regression analysis between “IEQ” and “overall LEED” for LEED-EB v4.1 gold-certified projects in Italy.
Table A14.
Regression table. Simple linear regression analysis between “IEQ” and “overall LEED” for LEED-EB v4.1 gold-certified projects in Italy.
| Term | Coefficient | Standard error | T-Statistic | p-Value | R2-Value |
| Intercept (b0) | 55.9042 | 4.4880 | 12.4563 | <0.00001 | |
| Χ (Scope b1) | 0.8878 | 0.3125 | 2.8414 | 0.00862 | 0.2369 |
Table A15.
ANOVA table. Simple linear regression analysis between “water” and “overall LEED” for LEED-EB v4.1 gold-certified projects in Israel.
Table A15.
ANOVA table. Simple linear regression analysis between “water” and “overall LEED” for LEED-EB v4.1 gold-certified projects in Israel.
| Source | Sum of squares | Degrees of freedom | Mean square | F-statistic | p-Value |
| Regression | 107.5147 | 1 | 107.5147 | 8.4644 | 0.00813 |
| Error | 279.4436 | 22 | 12.7020 | ||
| Total | 386.9583 | 23 |
Table A16.
Regression table. Simple linear regression analysis between “water” and “overall LEED” for LEED-EB v4.1 gold-certified projects in Israel.
Table A16.
Regression table. Simple linear regression analysis between “water” and “overall LEED” for LEED-EB v4.1 gold-certified projects in Israel.
| Term | Coefficient | Standard error | T-Statistic | p-Value | R2-Value |
| Intercept (b0) | 54.9614 | 3.6245 | 15.1640 | <0.00001 | |
| Χ (Scope b1) | 1.0641 | 0.3657 | 2.9094 | 0.00813 | 0.2778 |
Table A17.
ANOVA table. Simple linear regression analysis between “energy” and “overall LEED” for LEED-EB v4.1 gold-certified projects in Israel.
Table A17.
ANOVA table. Simple linear regression analysis between “energy” and “overall LEED” for LEED-EB v4.1 gold-certified projects in Israel.
| Source | Sum of squares | Degrees of freedom | Mean square | F-statistic | p-Value |
| Regression | 205.4260 | 1 | 205.4260 | 24.8957 | 0.00005 |
| Error | 181.5323 | 22 | 8.2515 | ||
| Total | 386.9583 | 23 |
Table A18.
Regression table. Simple linear regression analysis between “energy” and “overall LEED” for LEED-EB v4.1 gold-certified projects in Israel.
Table A18.
Regression table. Simple linear regression analysis between “energy” and “overall LEED” for LEED-EB v4.1 gold-certified projects in Israel.
| Term | Coefficient | Standard error | T-Statistic | p-Value | R2-Value |
| Intercept (b0) | 45.6736 | 3.9753 | 11.4893 | <0.00001 | |
| Χ (Scope b1) | 0.9020 | 0.1808 | 4.9896 | 0.00005 | 0.5309 |
Table A19.
ANOVA table. Simple linear regression analysis between “waste” and “overall LEED” for LEED-EB v4.1 gold-certified projects in Israel.
Table A19.
ANOVA table. Simple linear regression analysis between “waste” and “overall LEED” for LEED-EB v4.1 gold-certified projects in Israel.
| Source | Sum of squares | Degrees of freedom | Mean square | F-statistic | p-Value |
| Regression | 216.4447 | 1 | 216.4447 | 27.9261 | 0.00003 |
| Error | 170.5137 | 22 | 7.7506 | ||
| Total | 386.9583 | 23 |
Table A20.
Regression table. Simple linear regression analysis between “waste” and “overall LEED” for LEED-EB v4.1 gold-certified projects in Israel.
Table A20.
Regression table. Simple linear regression analysis between “waste” and “overall LEED” for LEED-EB v4.1 gold-certified projects in Israel.
| Term | Coefficient | Standard error | T-Statistic | p-Value | R2-Value |
| Intercept (b0) | 51.3060 | 2.7069 | 18.9541 | <0.00001 | |
| Χ (Scope b1) | 2.6639 | 0.5041 | 5.2845 | 0.00003 | 0.5593 |
Table A21.
ANOVA table. Simple linear regression analysis between “transportation” and “overall LEED” for LEED-EB v4.1 gold-certified projects in Spain.
Table A21.
ANOVA table. Simple linear regression analysis between “transportation” and “overall LEED” for LEED-EB v4.1 gold-certified projects in Spain.
| Source | Sum of squares | Degrees of freedom | Mean square | F-statistic | p-Value |
| Regression | 99.4154 | 1 | 99.4154 | 8.3409 | 0.00679 |
| Error | 393.3275 | 33 | 11.9190 | ||
| Total | 492.7429 | 34 |
Table A22.
Regression table. Simple linear regression analysis between “transportation” and “overall LEED” for LEED-EB v4.1 gold-certified projects in Spain.
Table A22.
Regression table. Simple linear regression analysis between “transportation” and “overall LEED” for LEED-EB v4.1 gold-certified projects in Spain.
| Term | Coefficient | Standard error | T-Statistic | p-Value | R2-Value |
| Intercept (b0) | 56.0330 | 4.9007 | 11.4337 | <0.00001 | |
| Χ (Scope b1) | 1.2205 | 0.4226 | 2.8881 | 0.00679 | 0.2018 |
Table A23.
ANOVA table. Simple linear regression analysis between “water” and “overall LEED” for LEED-EB v4.1 gold-certified projects in Spain.
Table A23.
ANOVA table. Simple linear regression analysis between “water” and “overall LEED” for LEED-EB v4.1 gold-certified projects in Spain.
| Source | Sum of squares | Degrees of freedom | Mean square | F-statistic | p-Value |
| Regression | 78.0785 | 1 | 78.0785 | 6.2137 | 0.01787 |
| Error | 414.6644 | 33 | 12.5656 | ||
| Total | 492.7429 | 34 |
Table A24.
Regression table. Simple linear regression analysis between “water” and “overall LEED” for LEED-EB v4.1 gold-certified projects in Spain.
Table A24.
Regression table. Simple linear regression analysis between “water” and “overall LEED” for LEED-EB v4.1 gold-certified projects in Spain.
| Term | Coefficient | Standard error | T-Statistic | p-Value | R2-Value |
| Intercept (b0) | 63.9098 | 2.5490 | 25.0726 | <0.00001 | |
| Χ (Scope b1) | 0.6038 | 0.2422 | 2.4927 | 0.01787 | 0.1585 |
Table A25.
ANOVA table. Simple linear regression analysis between “energy” and “overall LEED” for LEED-EB v4.1 gold-certified projects in Spain.
Table A25.
ANOVA table. Simple linear regression analysis between “energy” and “overall LEED” for LEED-EB v4.1 gold-certified projects in Spain.
| Source | Sum of squares | Degrees of freedom | Mean square | F-statistic | p-Value |
| Regression | 196.3220 | 1 | 196.3220 | 21.8562 | 0.00005 |
| Error | 296.4209 | 33 | 8.9825 | ||
| Total | 492.7429 | 34 |
Table A26.
Regression table. Simple linear regression analysis between “energy” and “overall LEED” for LEED-EB v4.1 gold-certified projects in Spain.
Table A26.
Regression table. Simple linear regression analysis between “energy” and “overall LEED” for LEED-EB v4.1 gold-certified projects in Spain.
| Term | Coefficient | Standard error | T-Statistic | p-Value | R2-Value |
| Intercept (b0) | 51.0415 | 4.1050 | 12.4341 | <0.00001 | |
| Χ (Scope b1) | 0.7566 | 0.1618 | 4.6751 | 0.00005 | 0.3984 |
Table A27.
ANOVA table. Simple linear regression analysis between “water” and “overall LEED” for LEED-EB v4.1 gold-certified projects in Germany.
Table A27.
ANOVA table. Simple linear regression analysis between “water” and “overall LEED” for LEED-EB v4.1 gold-certified projects in Germany.
| Source | Sum of squares | Degrees of freedom | Mean square | F-statistic | p-Value |
| Regression | 149.5111 | 1 | 149.5111 | 11.6438 | 0.00250 |
| Error | 282.4889 | 22 | 12.8404 | ||
| Total | 432.0000 | 23 |
Table A28.
Regression table. Simple linear regression analysis between “water” and “overall LEED” for LEED-EB v4.1 gold-certified projects in Germany.
Table A28.
Regression table. Simple linear regression analysis between “water” and “overall LEED” for LEED-EB v4.1 gold-certified projects in Germany.
| Term | Coefficient | Standard error | T-Statistic | p-Value | R2-Value |
| Intercept (b0) | 55.1778 | 4.4049 | 12.5264 | <0.00001 | |
| Χ (Scope b1) | 1.2889 | 0.3777 | 3.4123 | 0.00250 | 0.3461 |
Table A29.
ANOVA table. Simple linear regression analysis between “waste” and “overall LEED” for LEED-EB v4.1 gold-certified projects in Germany.
Table A29.
ANOVA table. Simple linear regression analysis between “waste” and “overall LEED” for LEED-EB v4.1 gold-certified projects in Germany.
| Source | Sum of squares | Degrees of freedom | Mean square | F-statistic | p-Value |
| Regression | 169.1630 | 1 | 169.1630 | 14.1593 | 0.00107 |
| Error | 262.8370 | 22 | 11.9471 | ||
| Total | 432.0000 | 23 |
Table A30.
Regression table. Simple linear regression analysis between “waste” and “overall LEED” for LEED-EB v4.1 gold-certified projects in Germany.
Table A30.
Regression table. Simple linear regression analysis between “waste” and “overall LEED” for LEED-EB v4.1 gold-certified projects in Germany.
| Term | Coefficient | Standard error | T-Statistic | p-Value | R2-Value |
| Intercept (b0) | 58.5463 | 3.1246 | 18.7374 | <0.00001 | |
| Χ (Scope b1) | 2.1145 | 0.5619 | 3.7629 | 0.00107 | 0.3916 |
Table A31.
ANOVA table. Simple linear regression analysis between “IEQ” and “overall LEED” for LEED-EB v4.1 gold-certified projects in Germany.
Table A31.
ANOVA table. Simple linear regression analysis between “IEQ” and “overall LEED” for LEED-EB v4.1 gold-certified projects in Germany.
| Source | Sum of squares | Degrees of freedom | Mean square | F-statistic | p-Value |
| Regression | 116.7455 | 1 | 116.7455 | 8.1471 | 0.00922 |
| Error | 315.2545 | 22 | 14.3297 | ||
| Total | 432.0000 | 23 |
Table A32.
Regression table. Simple linear regression analysis between “IEQ” and “overall LEED” for LEED-EB v4.1 gold-certified projects in Germany.
Table A32.
Regression table. Simple linear regression analysis between “IEQ” and “overall LEED” for LEED-EB v4.1 gold-certified projects in Germany.
| Term | Coefficient | Standard error | T-Statistic | p-Value | R2-Value |
| Intercept (b0) | 61.1658 | 3.1900 | 19.1740 | <0.00001 | |
| Χ (Scope b1) | 0.6710 | 0.2351 | 2.8543 | 0.00922 | 0.2702 |
Table A33.
ANOVA table. Simple linear regression analysis between “waste” and “overall LEED” for LEED-EB v4.1 gold-certified projects in Ireland.
Table A33.
ANOVA table. Simple linear regression analysis between “waste” and “overall LEED” for LEED-EB v4.1 gold-certified projects in Ireland.
| Source | Sum of squares | Degrees of freedom | Mean square | F-statistic | p-Value |
| Regression | 103.6409 | 1 | 103.6409 | 13.2393 | 0.00188 |
| Error | 140.9091 | 18 | 7.8283 | ||
| Total | 244.5500 | 19 |
Table A34.
Regression table. Simple linear regression analysis between “waste” and “overall LEED” for LEED-EB v4.1 gold-certified projects in Ireland.
Table A34.
Regression table. Simple linear regression analysis between “waste” and “overall LEED” for LEED-EB v4.1 gold-certified projects in Ireland.
| Term | Coefficient | Standard error | T-Statistic | p-Value | R2-Value |
| Intercept (b0) | 47.3864 | 6.0686 | 7.8084 | <0.00001 | |
| Χ (Scope b1) | 3.4318 | 0.9432 | 3.6386 | 0.00188 | 0.4238 |
Table A35.
ANOVA table. Simple linear regression analysis between “IEQ” and “overall LEED” for LEED-EB v4.1 gold-certified projects in Ireland.
Table A35.
ANOVA table. Simple linear regression analysis between “IEQ” and “overall LEED” for LEED-EB v4.1 gold-certified projects in Ireland.
| Source | Sum of squares | Degrees of freedom | Mean square | F-statistic | p-Value |
| Regression | 115.0927 | 1 | 115.0927 | 16.0027 | 0.00084 |
| Error | 129.4573 | 18 | 7.1921 | ||
| Total | 244.5500 | 19 |
Table A36.
Regression table. Simple linear regression analysis between “IEQ” and “overall LEED” for LEED-EB v4.1 gold-certified projects in Ireland.
Table A36.
Regression table. Simple linear regression analysis between “IEQ” and “overall LEED” for LEED-EB v4.1 gold-certified projects in Ireland.
| Term | Coefficient | Standard error | T-Statistic | p-Value | R2-Value |
| Intercept (b0) | 56.4223 | 3.2868 | 17.1662 | <0.00001 | |
| Χ (Scope b1) | 0.8978 | 0.2244 | 4.0003 | 0.00084 | 0.4706 |
References
- European Environment Agency Addressing the environmental and climate footprint of buildings 2024, 84 p. SBN 978-92-9480-677-2 Available online: chrome-extension://efaidnbmnnnibpcajpcglclefindmkaj/https://www.eea.europa.eu/en/analysis/publications/addressing-the-environmental-and-climate-footprint-of-buildings/addressing-the-environmental-and-climate-footprint-of-buildings/@@download/file (accessed on 26 January 2026).
- European Environment Agency. Building Renovation: Where Circular Economy and Climate Meet. EEA Briefing. Jul 2022. Available online: https://www.eea.europa.eu/publications/building-renovation-where-circular-economy (accessed on 26 January 2026).
- Grossman, G. Shapira N. Energy Forum 53: Green Building in Israel. May 2023. Available online: chrome-extension://efaidnbmnnnibpcajpcglclefindmkaj/https://www.neaman.org.il/wp-content/uploads/2023/05/English-Abstract_Energy-Forum-53-Green-Building-in-Israel.pdf (accessed on 26 January 2026).
- The History and Evolution of LEED: From Inception to LEED v5. Available online: https://loopico.ca/the-history-and-evolution-of-leed-from-inception-to-leed-v5/#:~:text=From%20its%20modest%20beginnings%20in,performance%20accountability%2C%20and%20environmental%20justice. (accessed on 26 January 2026).
- Gluszak, M.; Malkowska, A.; Marona, B. Green Building Adoption on Office Markets in Europe: An Empirical Investigation into LEED Certification. Energies 2021, 14, 1971. [CrossRef]
- Ade, R.; Rehm, M. The unwritten history of green building rating tools: A personal view from some of the ‘founding fathers’. Build. Res. Inf. 2020, 48, 1–17. [CrossRef]
- Madson, K.; Franz, B.; Leicht, R.; Nelson, J. Evaluating the Sustainability of New Construction Projects over Time by Examining the Evolution of the LEED Rating System. Sustainability 2022, 14, 15422. [CrossRef]
- LEED 2.0 Green Building Rating System™ Available online: https://www1.swarthmore.edu/NatSci/sciproject/LEED.html#:~:text=In%20the%20process%20of%20refining,of%20the%20credit%20being%20addressed (accessed on 26 January 2026).
- Wu, P.; Song, Y.; Shou, W.; Chi, H.; Chong, H.Y.; Sutrisna, M. A comprehensive analysis of the credits obtained by LEED 2009 certified green buildings. Renew. Sustain. Energy Rev. 2017, 68, 370–379. [CrossRef]
- Tsirovasilis, E.; Katafygiotou, M.; Psathiti, C. Comparative Assessment of LEED, BREEAM, and WELL: Advancing Sustainable Built Environments. Energies 2025, 18, 4322. [CrossRef]
- USGBC. LEED v4 for Building Design and Construction. Updated July 25, 2019. Available online: chrome-extension://efaidnbmnnnibpcajpcglclefindmkaj/https://www.usgbc.org/sites/default/files/LEED%20v4%20BDC_07.25.19_current.pdf (accessed on 3 February 2026).
- LEED-EB v4.1. Operation and Maintenance. 2018. Available online: https://dcqpo543i2ro6.cloudfront.net/sites/default/files/file_downloads/LEED%20v4.1%20O%2BM%20Guide.pdf (accessed on 3 February 2026).
- LEED v5: A Paradigm Shift in Sustainability and Redefining Green Building Standards. Available online: https://www.leedtricks.com/blogs/leed-v5-a-paradigm-shift-in-sustainability-and-redefining-green-building-standards#:~:text=What%20is%20LEED%20v5%20and,%2C%20equitable%2C%20and%20efficient%20future (accessed on 26 January 2026).
- Understanding The Changes LEED 2009 To LEED v4.1. Available online: https://www.scribd.com/document/693783637/Understanding-the-changes-LEED-2009-to-LEED-v4-1 (accessed on 26 January 2026).
- Lee, W.L. A comprehensive review of metrics of building environmental assessment schemes. Energy Build. 2013, 62, 403–413. [CrossRef]
- Sun, X.; Gou, Z.; Lu, Y.; Tao, Y. Strengths and Weaknesses of Existing Building Green Retrofits: Case Study of a LEED EBOM Gold Project. Energies 2018, 11, 1936. [CrossRef]
- Fuerst, F. Building momentum: An analysis of investment trends in LEED and energy star-certified properties. J. Retail Leis. Prop. 2009, 8, 285–297. [CrossRef]
- Pushkar, S. Leadership in Energy and Environmental Design for LEED Version 4 (LEED-EB v4) Gold Certification Strategies for Existing Buildings in the United States: A Case Study. Buildings 2025, 15, 1080. [CrossRef]
- LEED-EB v4.1. Operation and Maintenance. 2018. Available online: https://dcqpo543i2ro6.cloudfront.net/sites/default/files/file_downloads/LEED%20v4.1%20O%2BM%20Guide.pdf (accessed on 26 January 2026).
- Pushkar, S. Leadership in Energy and Environmental Design for Existing Buildings Version 4.1 (LEED-EB v4.1) Gold-Certified Office Space Projects in European and Mediterranean Countries: A Pairwise Comparative Analysis. Buildings 2025, 15, 2972. [CrossRef]
- Goodarzi, M.; Shayesteh, A.; Attallah, S. Assessing the Consistency Between the Expected and Actual Influence of LEED-NC Credit Categories on the Sustainability Score. In Proceedings of the 59th Annual Associated Schools of Construction International Conference, Liverpool, UK, 3–5 April 2023; pp. 614–622.
- Goodarzi, M.; Garshasby, M Assessing LEED Credit Weighting: A Dual Perspective on Sustainable Construction and Educational Implications. In Proceedings of the 2024 ASEE Annual Conference & Exposition, Portland, OR, USA, 23–26 June 2024; pp. 1–12.
- Goodarzi, M.; Garshasby, M. Identifying the Leading Credit Categories in Determining the Overall LEED NC Score of Multifamily Residential Projects. In Proceedings of the 60th Annual Meeting of the Associated Schools of Construction International Conference, Auburn, AL, USA, 3–5 April 2024; Volume 5, pp. 387–395.
- Ahmad, T.; Shoaib, M.; Abdul Kadar, R. LEED v4 Adoption Patterns and Regional Variations Across US-Based Projects. Sustainability 2025, 17, 7403. [CrossRef]
- Goodarzi, M.; Naseri, S.; Garshasby, M.; Tafazzoli, M. A Data-Driven Study of Regional Priority Credits and Their Impact on LEED Certification in Multifamily Residential Projects. In Proceedings of the 61st Annual ASC International Conference, Calgary, AB, Canada, 22 April 2025; Volume 6, pp. 371–380.
- Parekh, R. Trends and challenges in LEED v4.1 certification: A comprehensive analysis of U.S. hospital scores in 2024. World J. Adv. Eng. Technol. Sci. 2024, 12, 726–740. [CrossRef]
- Pushkar, S. Assessing the Performance of Green Office Buildings in Major US Cities. Buildings 2026, 16, 158. [CrossRef]
- Pushkar, S. LEED-EB v4-certified projects and the built environment in the U.S.A. J. Green Build, 2026; in press.
- Xu, J.; Cheng, M.; Sun, A. Assessing sustainable practices in architecture: A data-driven analysis of LEED certification adoption and impact in top firms from 2000 to 2023. Front. Archit. Res. 2025, 14, 784–796. [CrossRef]
- Gotelli, N.J.; Ellinson, A.M. A Primer of Ecological Statistics, 2nd ed.; Sinauer Associates: Sunderland, MA, USA, 2004; ISBN 9781605350646.
- USGBC Projects Site. Available online: https://www.usgbc.org/projects (accessed on 7 January 2025).
- GBIG Green Building Data. Available online: http://www.gbig.org (accessed on 7 January 2026).
- MATLAB and Statistics Toolbox Release, 2024a; The Math Works, Inc.: Natick, MA, USA, 2024.
- Demirtas, E.; Ayas Onol, T. The Politics of Green Buildings: Neoliberal Environmental Governance and LEED’s Uneven Geography in Istanbul. Buildings 2026, 16, 363. [CrossRef]
- Goodarzi, M.; Goodarzi, A.N.; Naseri, S.; Parsaee, M.; Abazari, T. Assessing Climate Sensitivity of LEED Credit Performance in U.S. Hotel Buildings: A Hierarchical Regression and Machine Learning Verification Approach. Buildings 2025, 15, 4382. [CrossRef]
- Elldér, E. Built environment and the evolution of the “15-minute city”: A 25-year longitudinal study of 200 Swedish cities. Cities 2024, 149, 104942. [CrossRef]
Figure 1.
The sample linear regression between five LEED individual performance indicators and overall LEED points in LEED-EB v4.1 gold-certified office projects in Sweden.
Figure 1.
The sample linear regression between five LEED individual performance indicators and overall LEED points in LEED-EB v4.1 gold-certified office projects in Sweden.
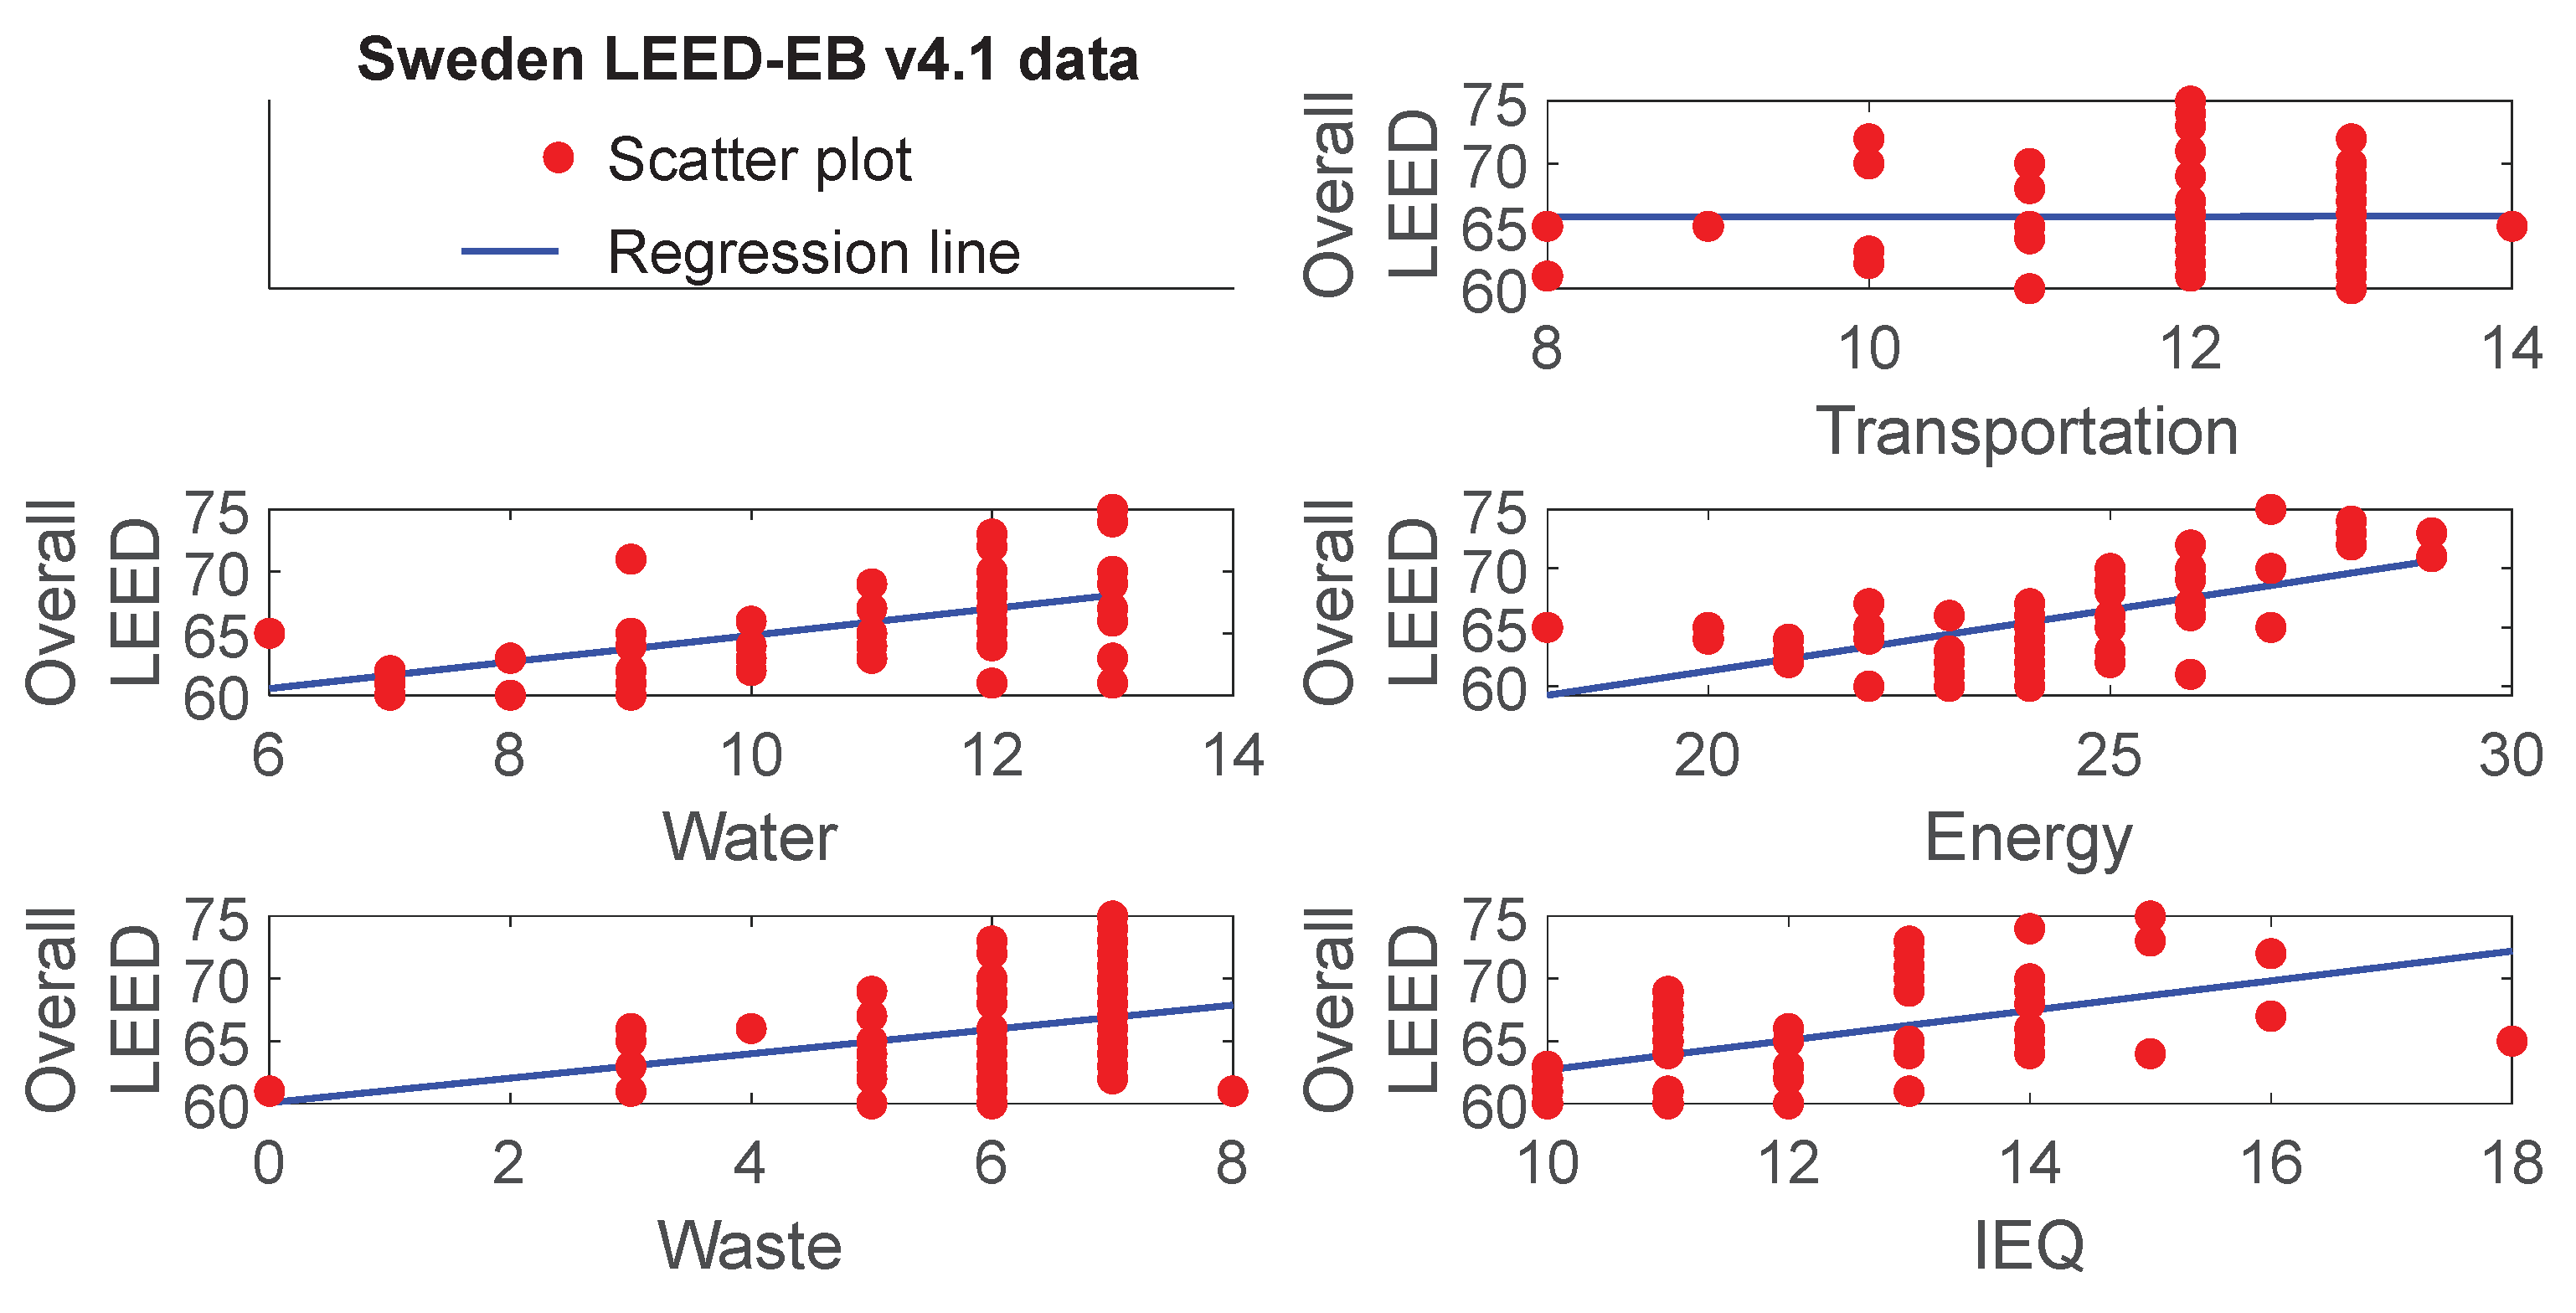
Figure 2.
The sample linear regression between five LEED individual performance indicators and overall LEED points in LEED-EB v4.1 gold-certified office projects in Italy.
Figure 2.
The sample linear regression between five LEED individual performance indicators and overall LEED points in LEED-EB v4.1 gold-certified office projects in Italy.
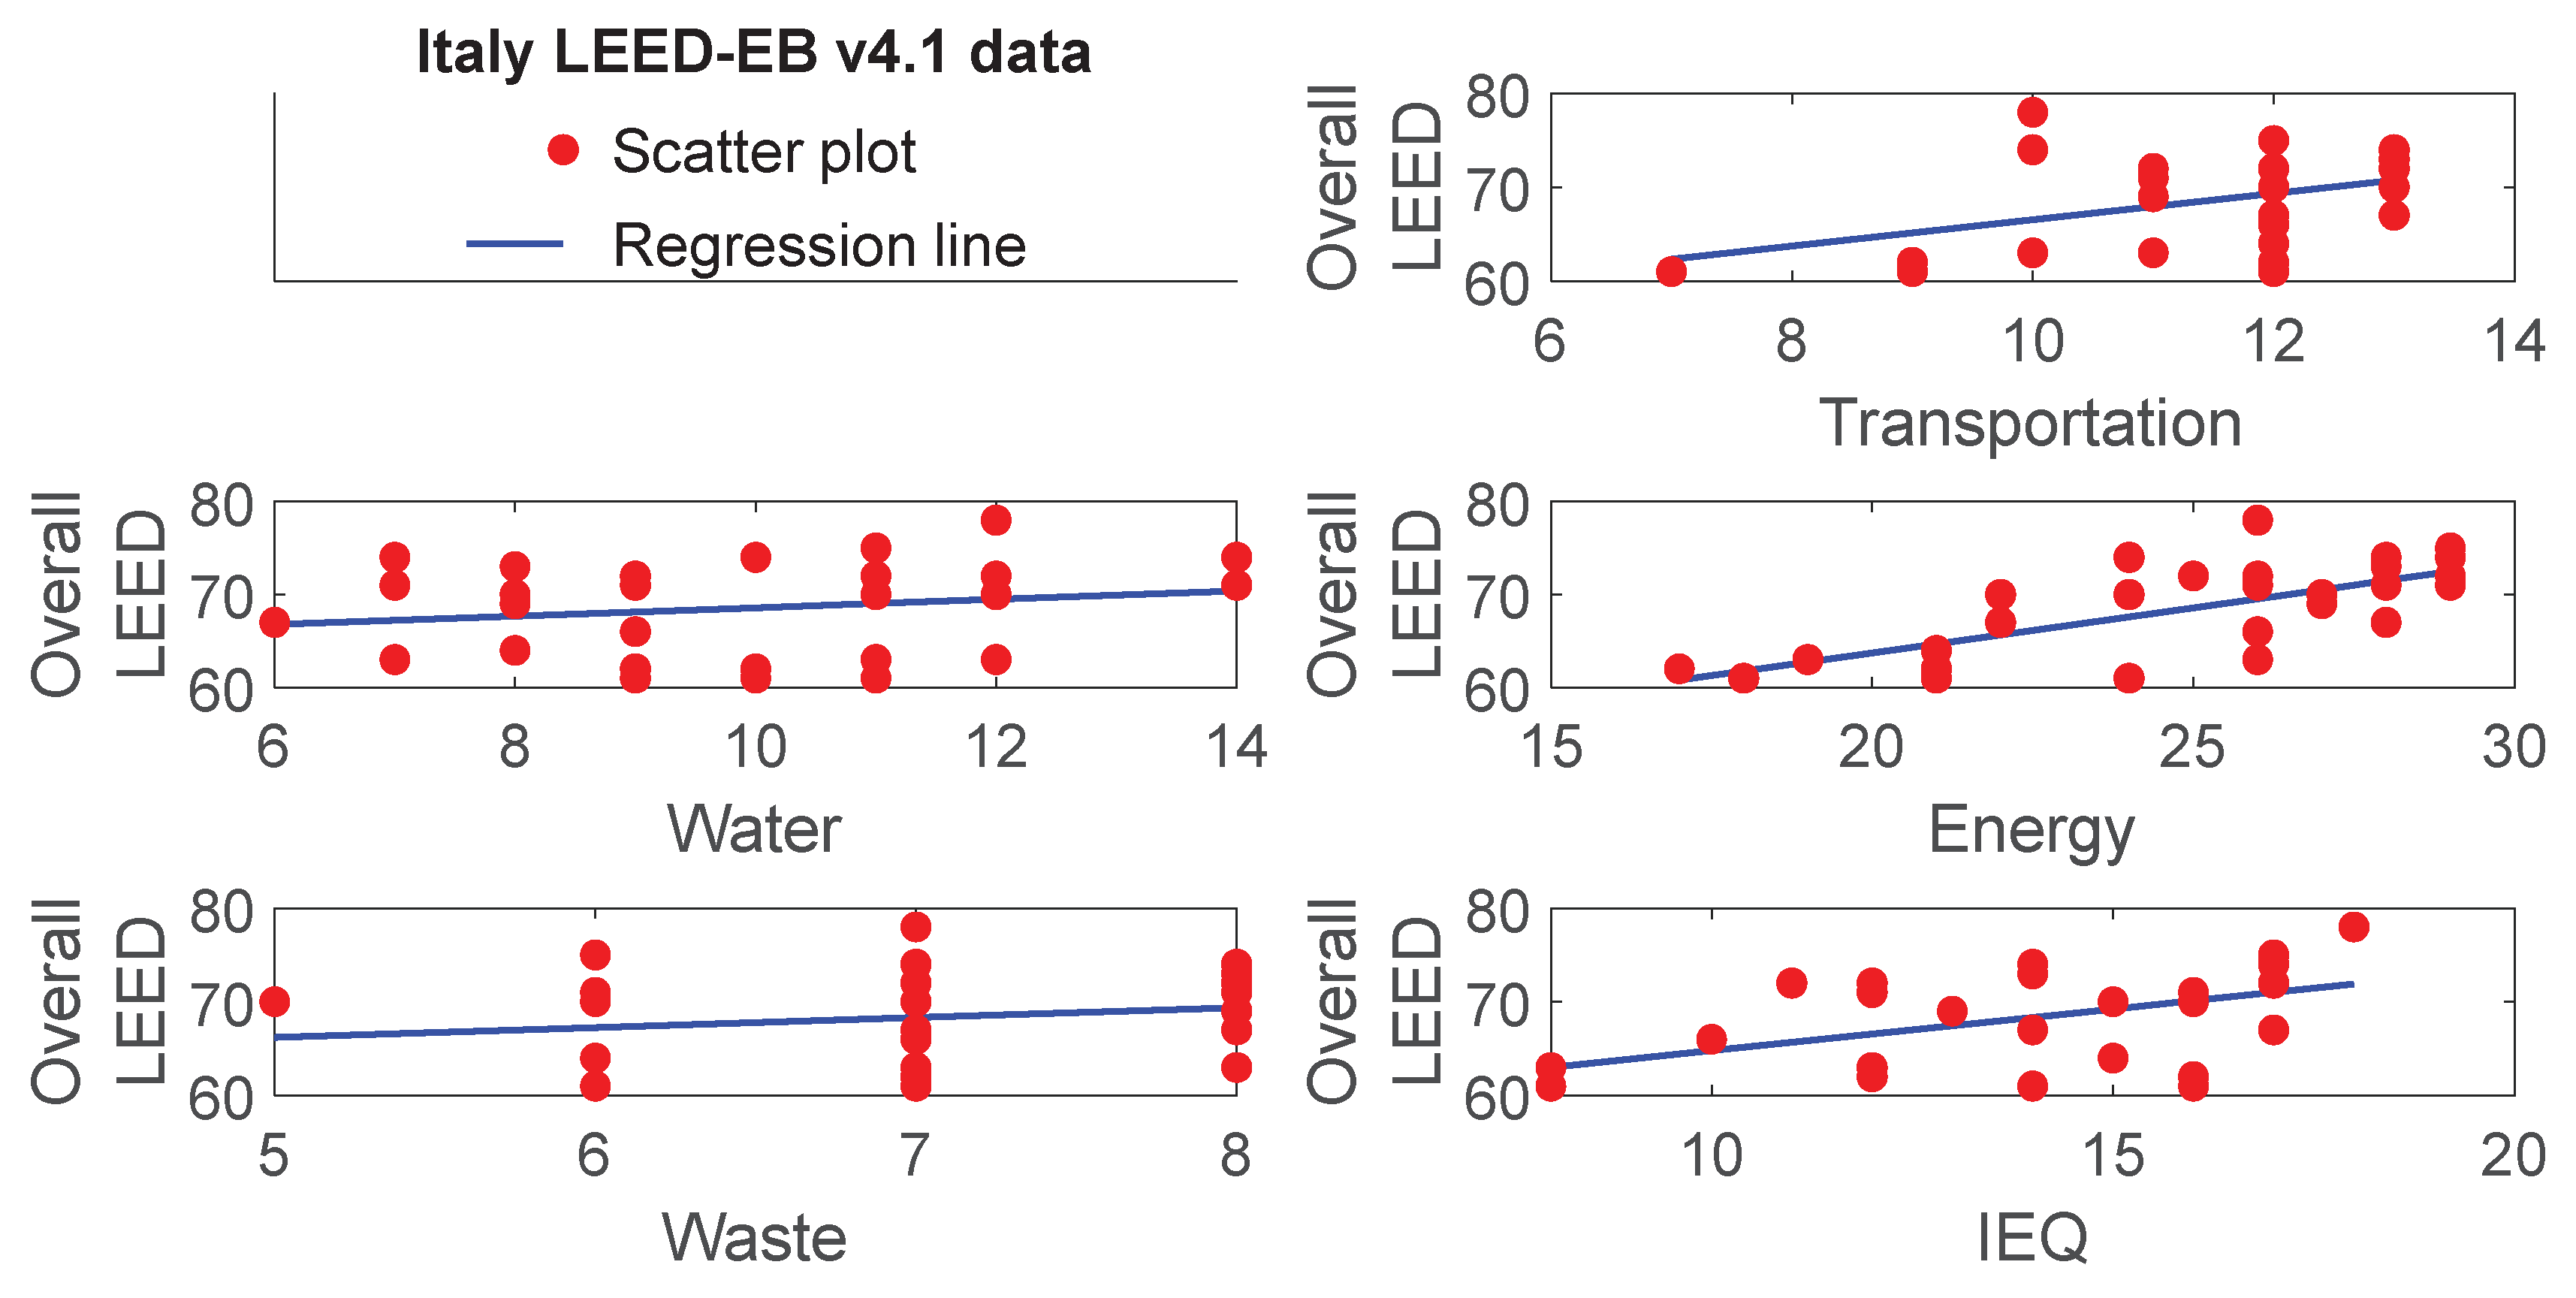
Figure 3.
The sample linear regression between five LEED individual performance indicators and overall LEED points in LEED-EB v4.1 gold-certified office projects in Israel.
Figure 3.
The sample linear regression between five LEED individual performance indicators and overall LEED points in LEED-EB v4.1 gold-certified office projects in Israel.
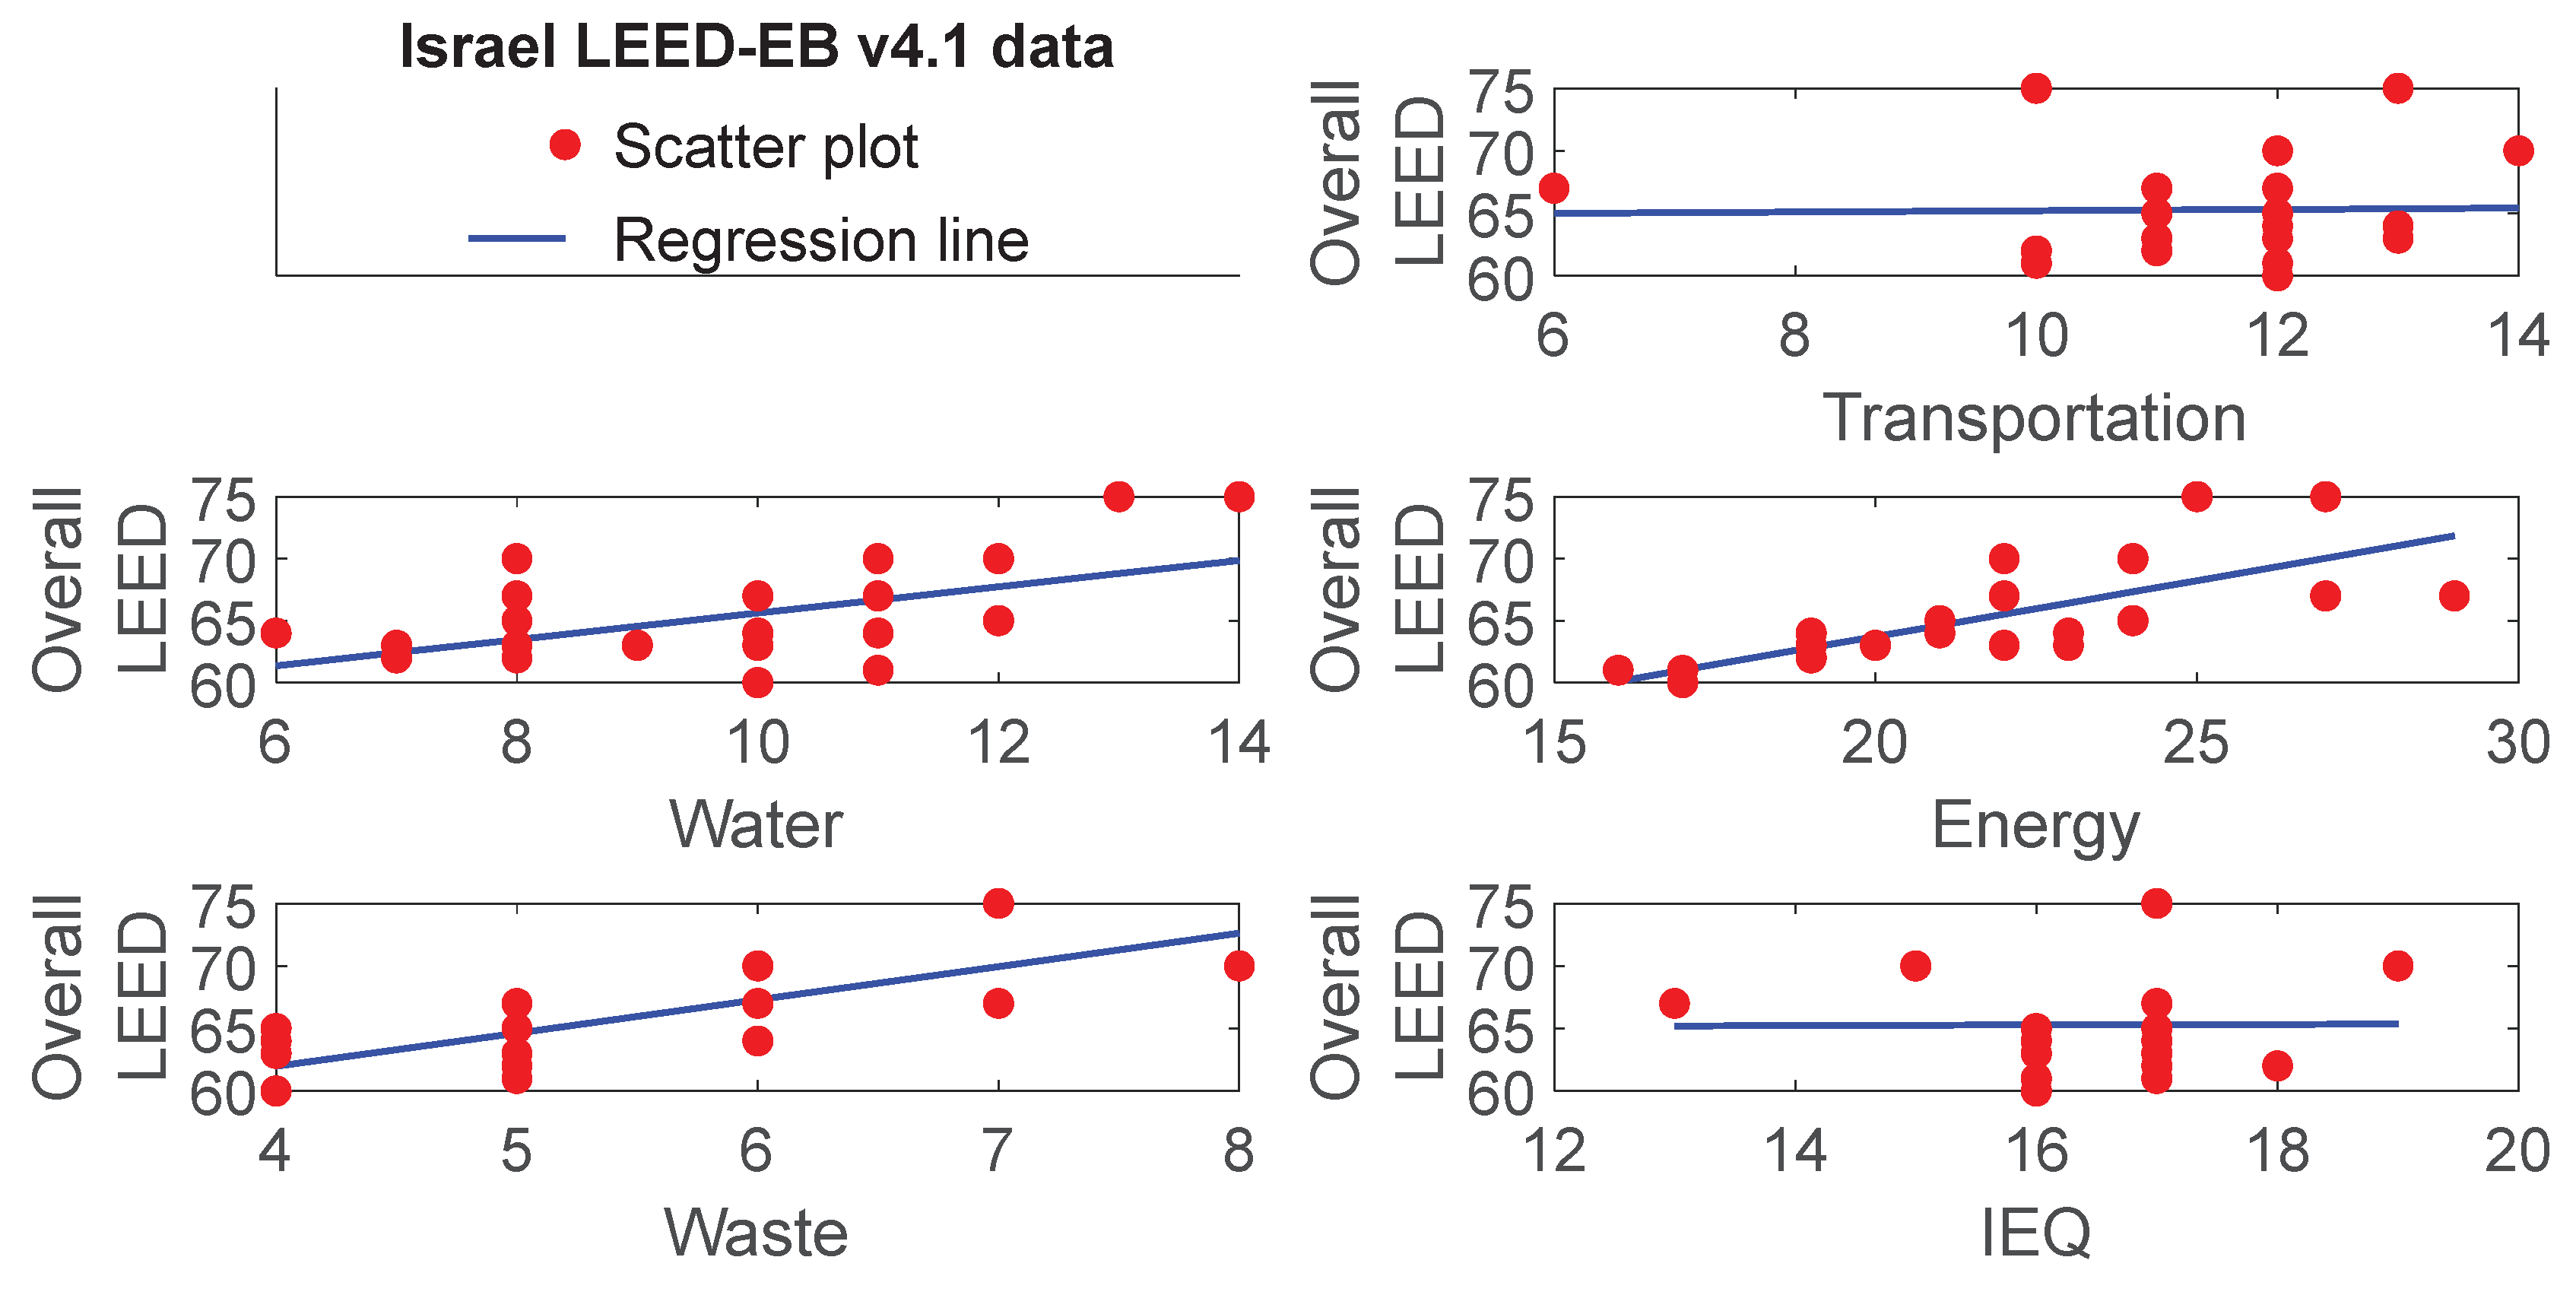
Figure 4.
The sample linear regression between five LEED individual performance indicators and overall LEED points in LEED-EB v4.1 gold-certified office projects in Spain.
Figure 4.
The sample linear regression between five LEED individual performance indicators and overall LEED points in LEED-EB v4.1 gold-certified office projects in Spain.
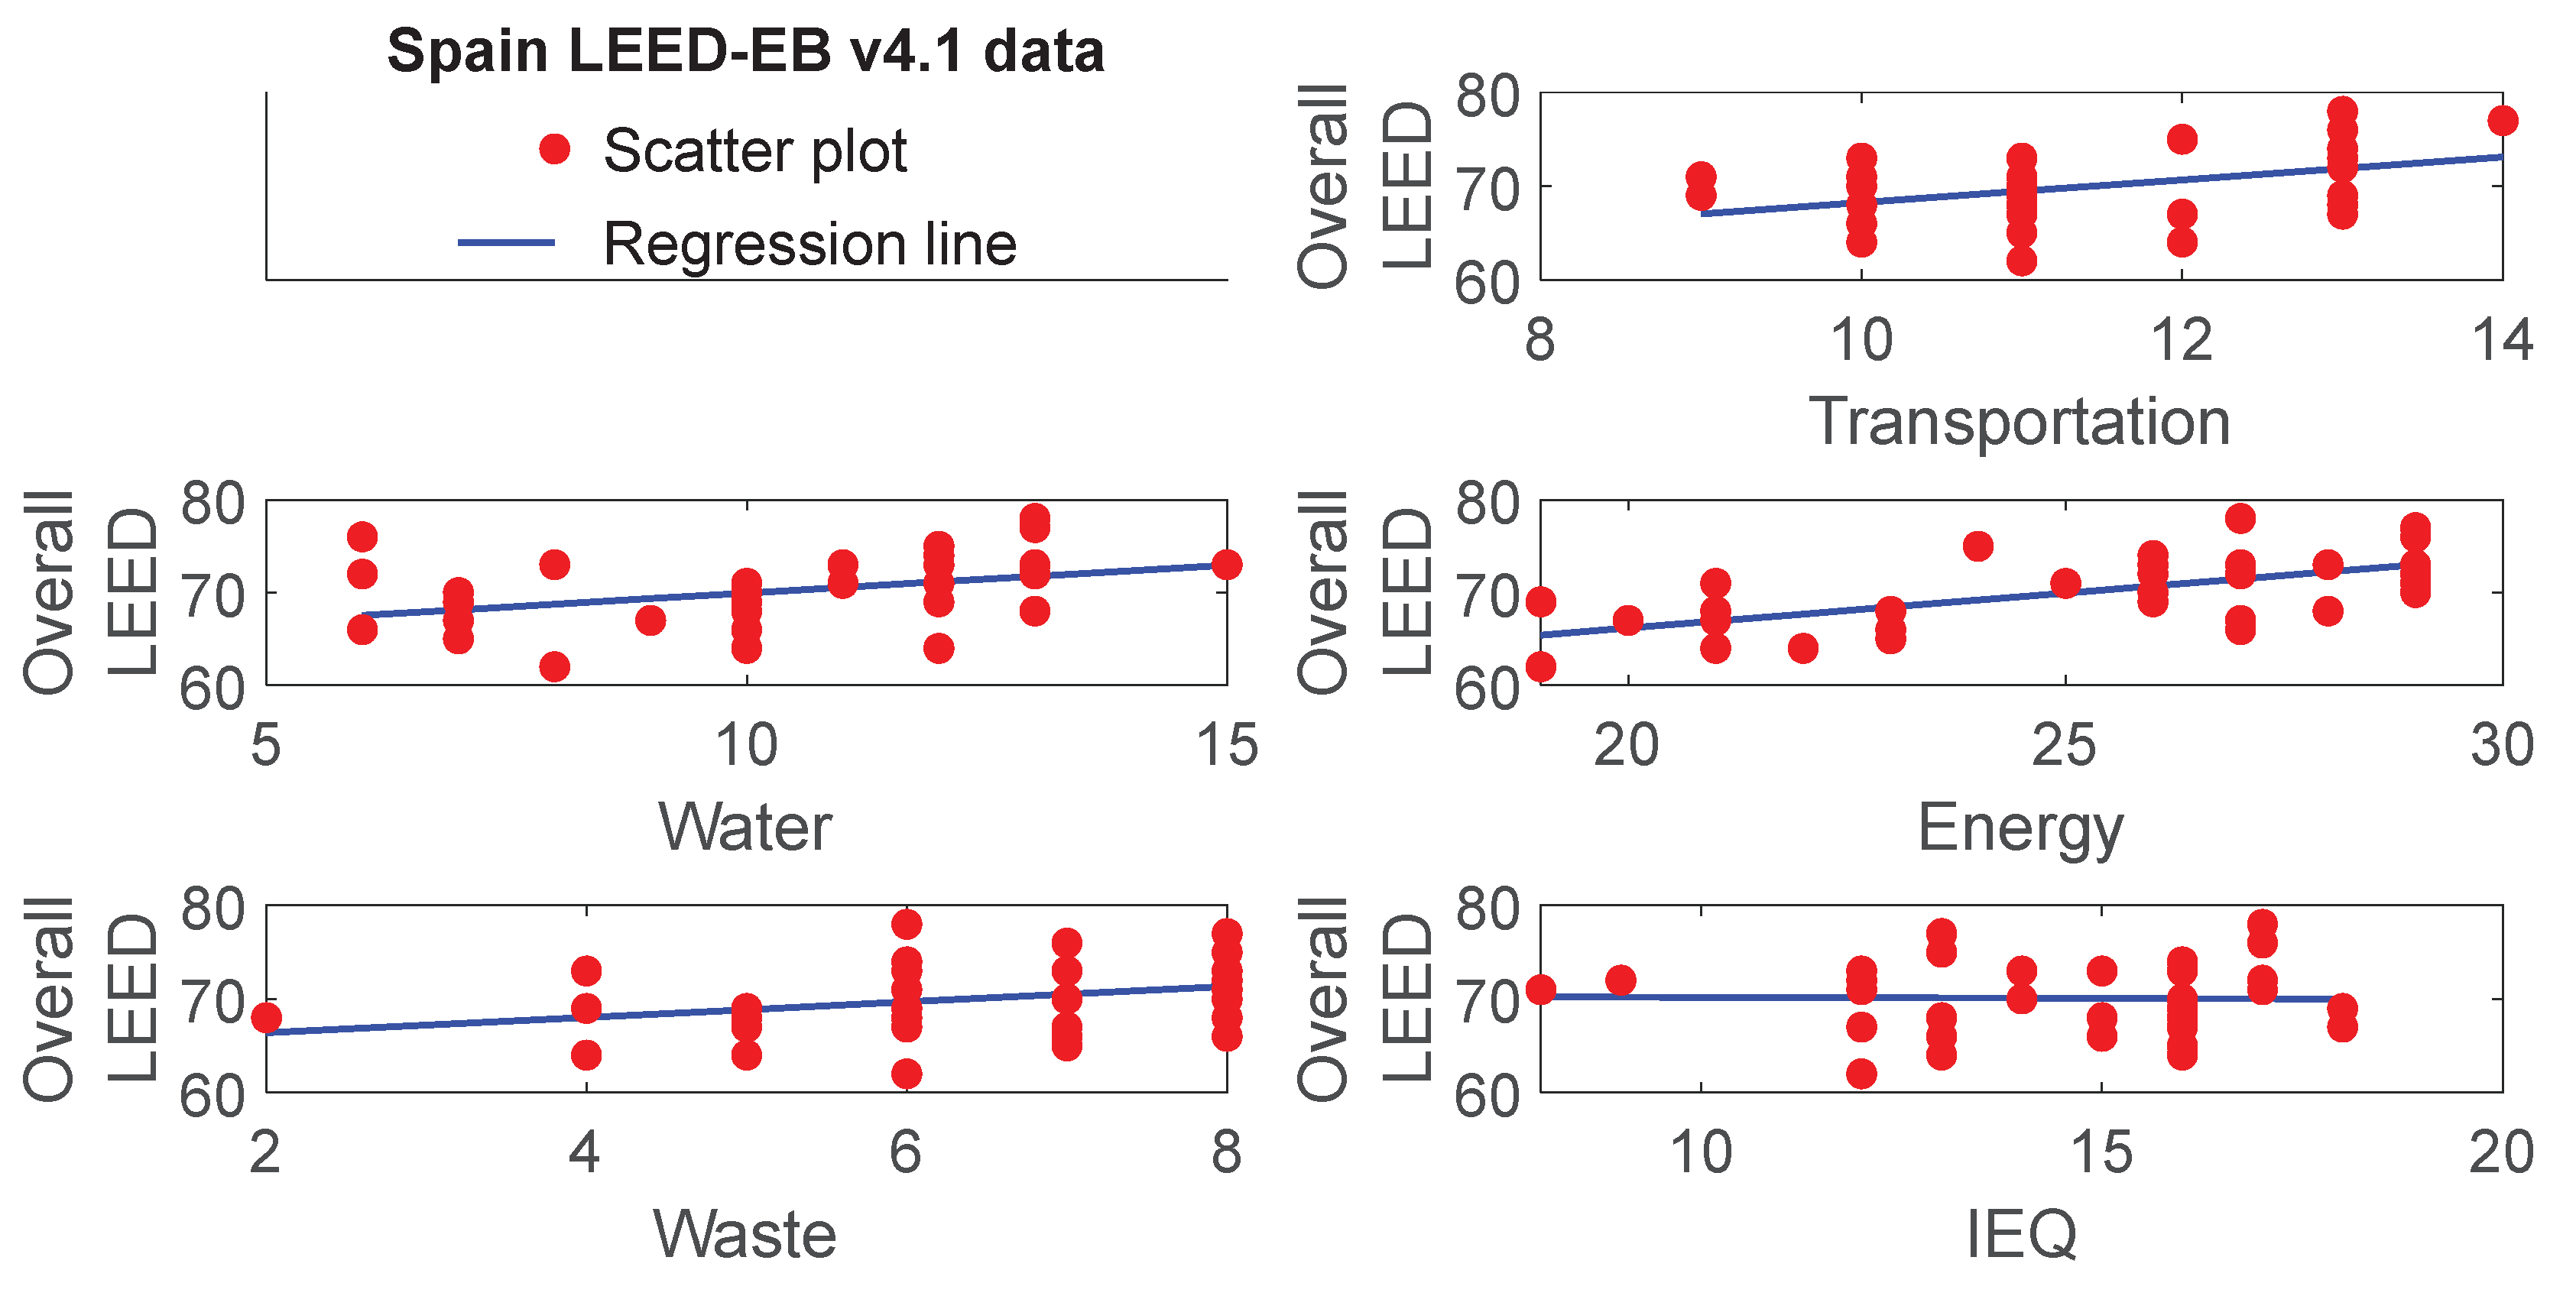
Figure 5.
The sample linear regression between five LEED individual performance indicators and overall LEED points in LEED-EB v4.1 gold-certified office projects in Germany.
Figure 5.
The sample linear regression between five LEED individual performance indicators and overall LEED points in LEED-EB v4.1 gold-certified office projects in Germany.
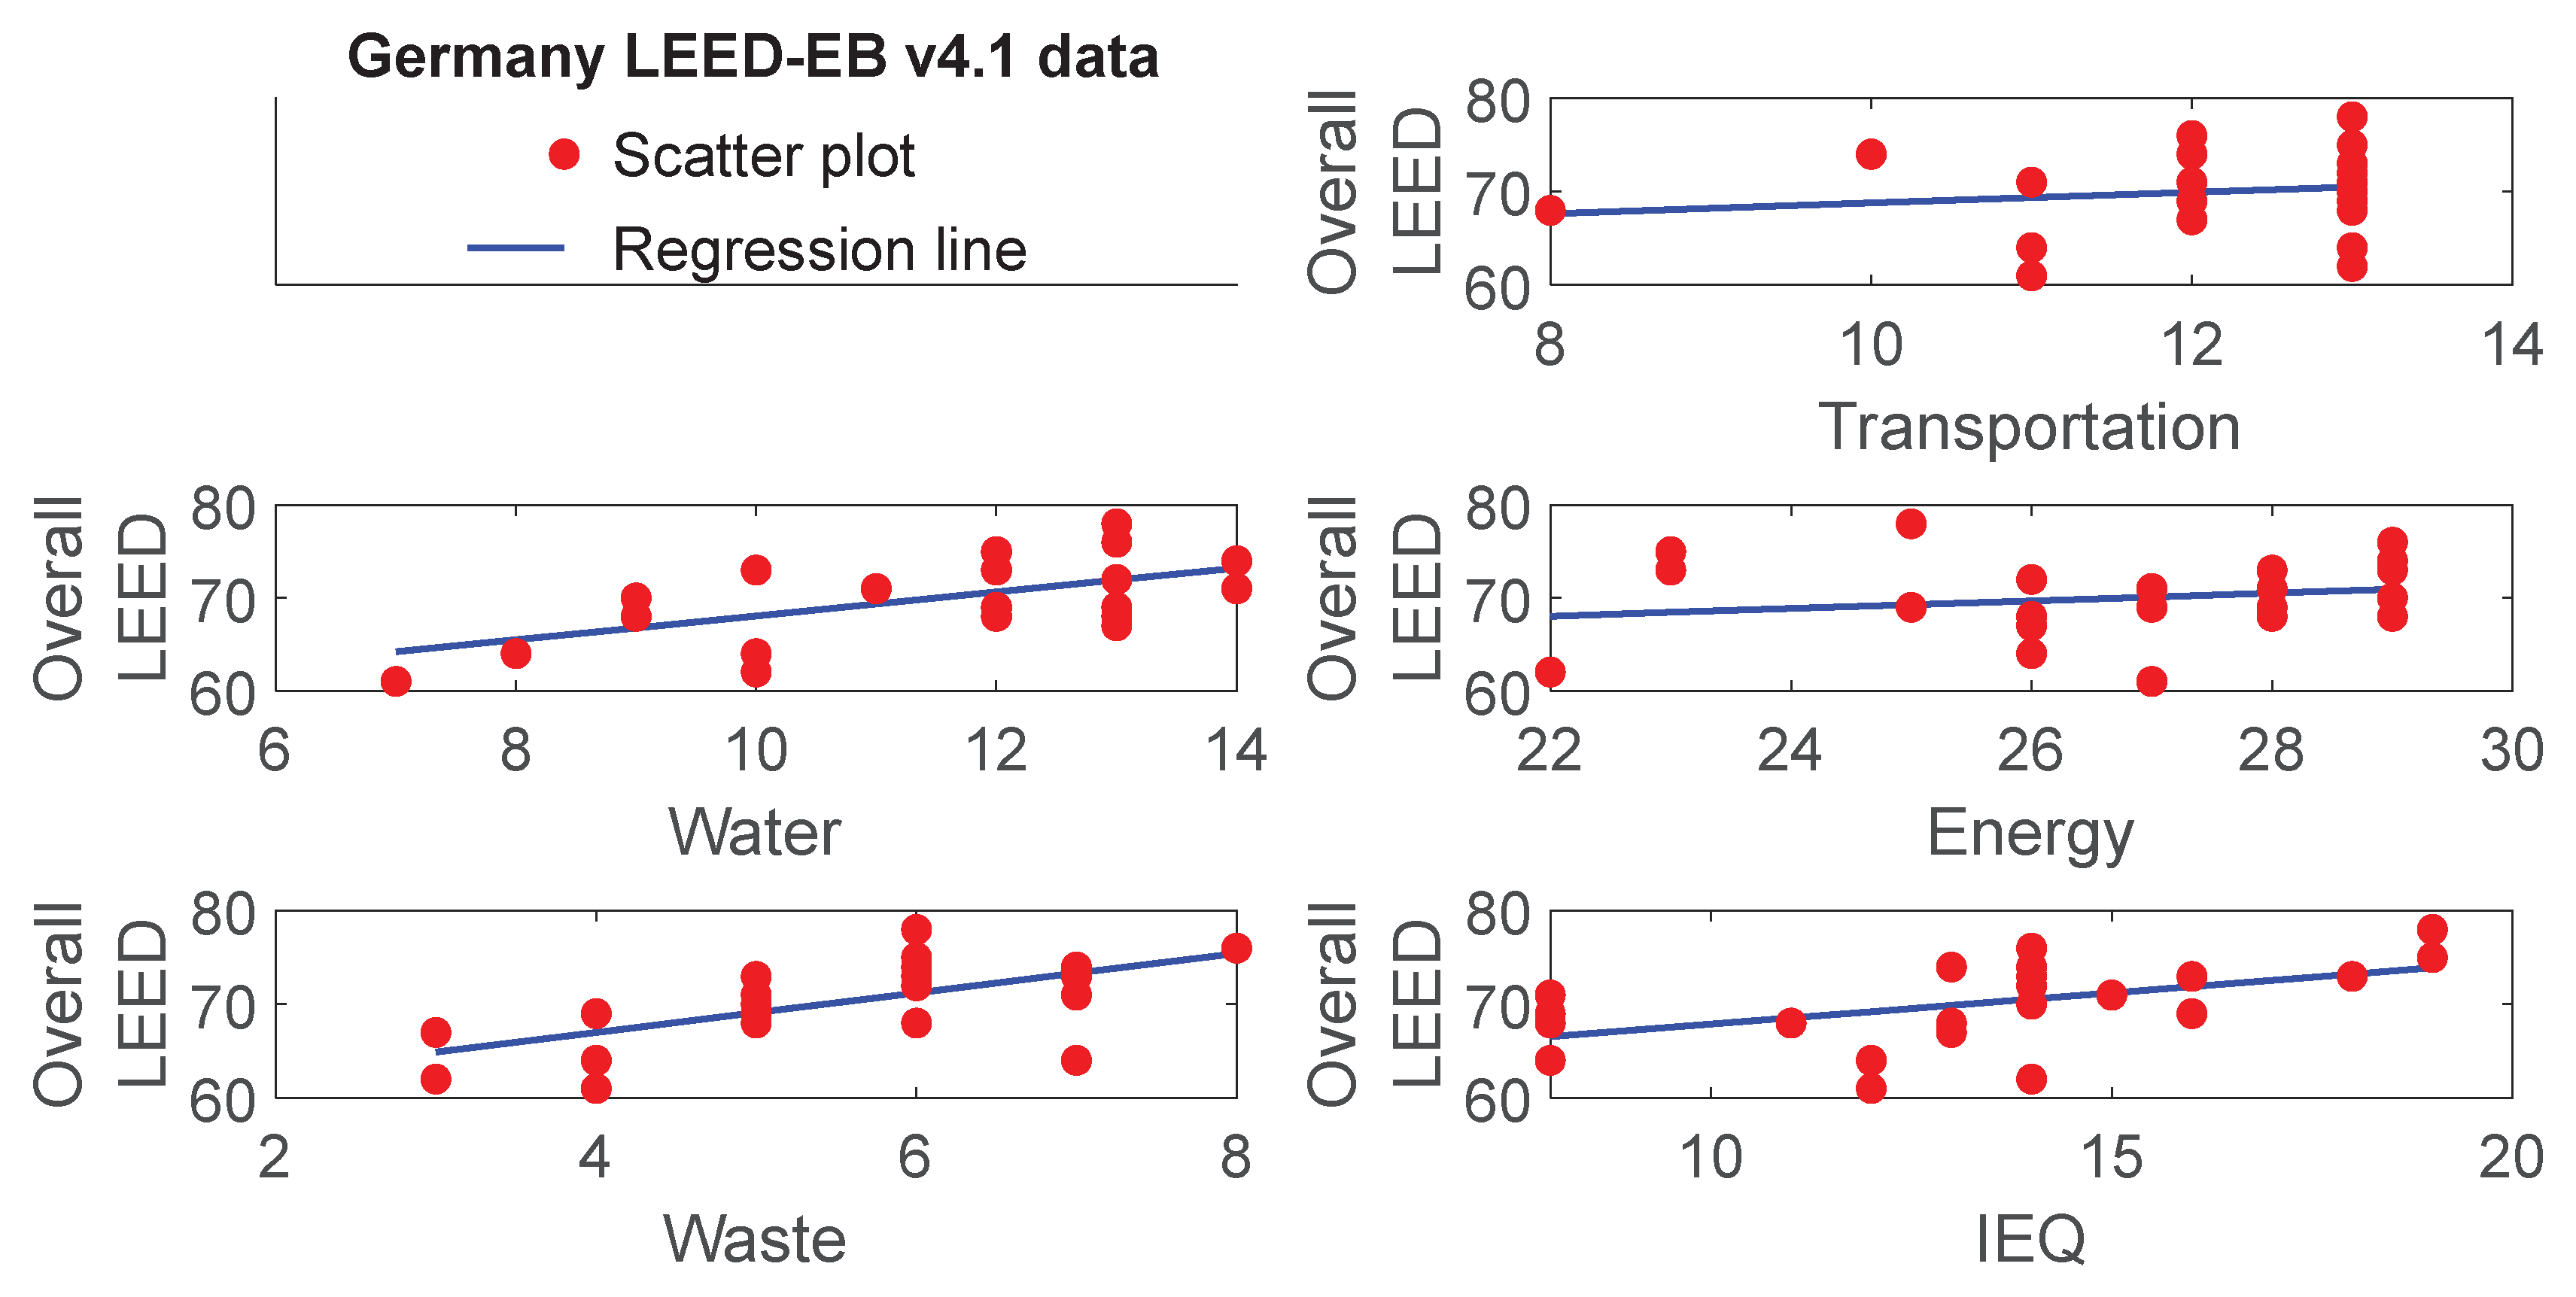
Figure 6.
The sample linear regression between five LEED individual performance indicators and overall LEED points in LEED-EB v4.1 gold-certified office projects in Ireland.
Figure 6.
The sample linear regression between five LEED individual performance indicators and overall LEED points in LEED-EB v4.1 gold-certified office projects in Ireland.
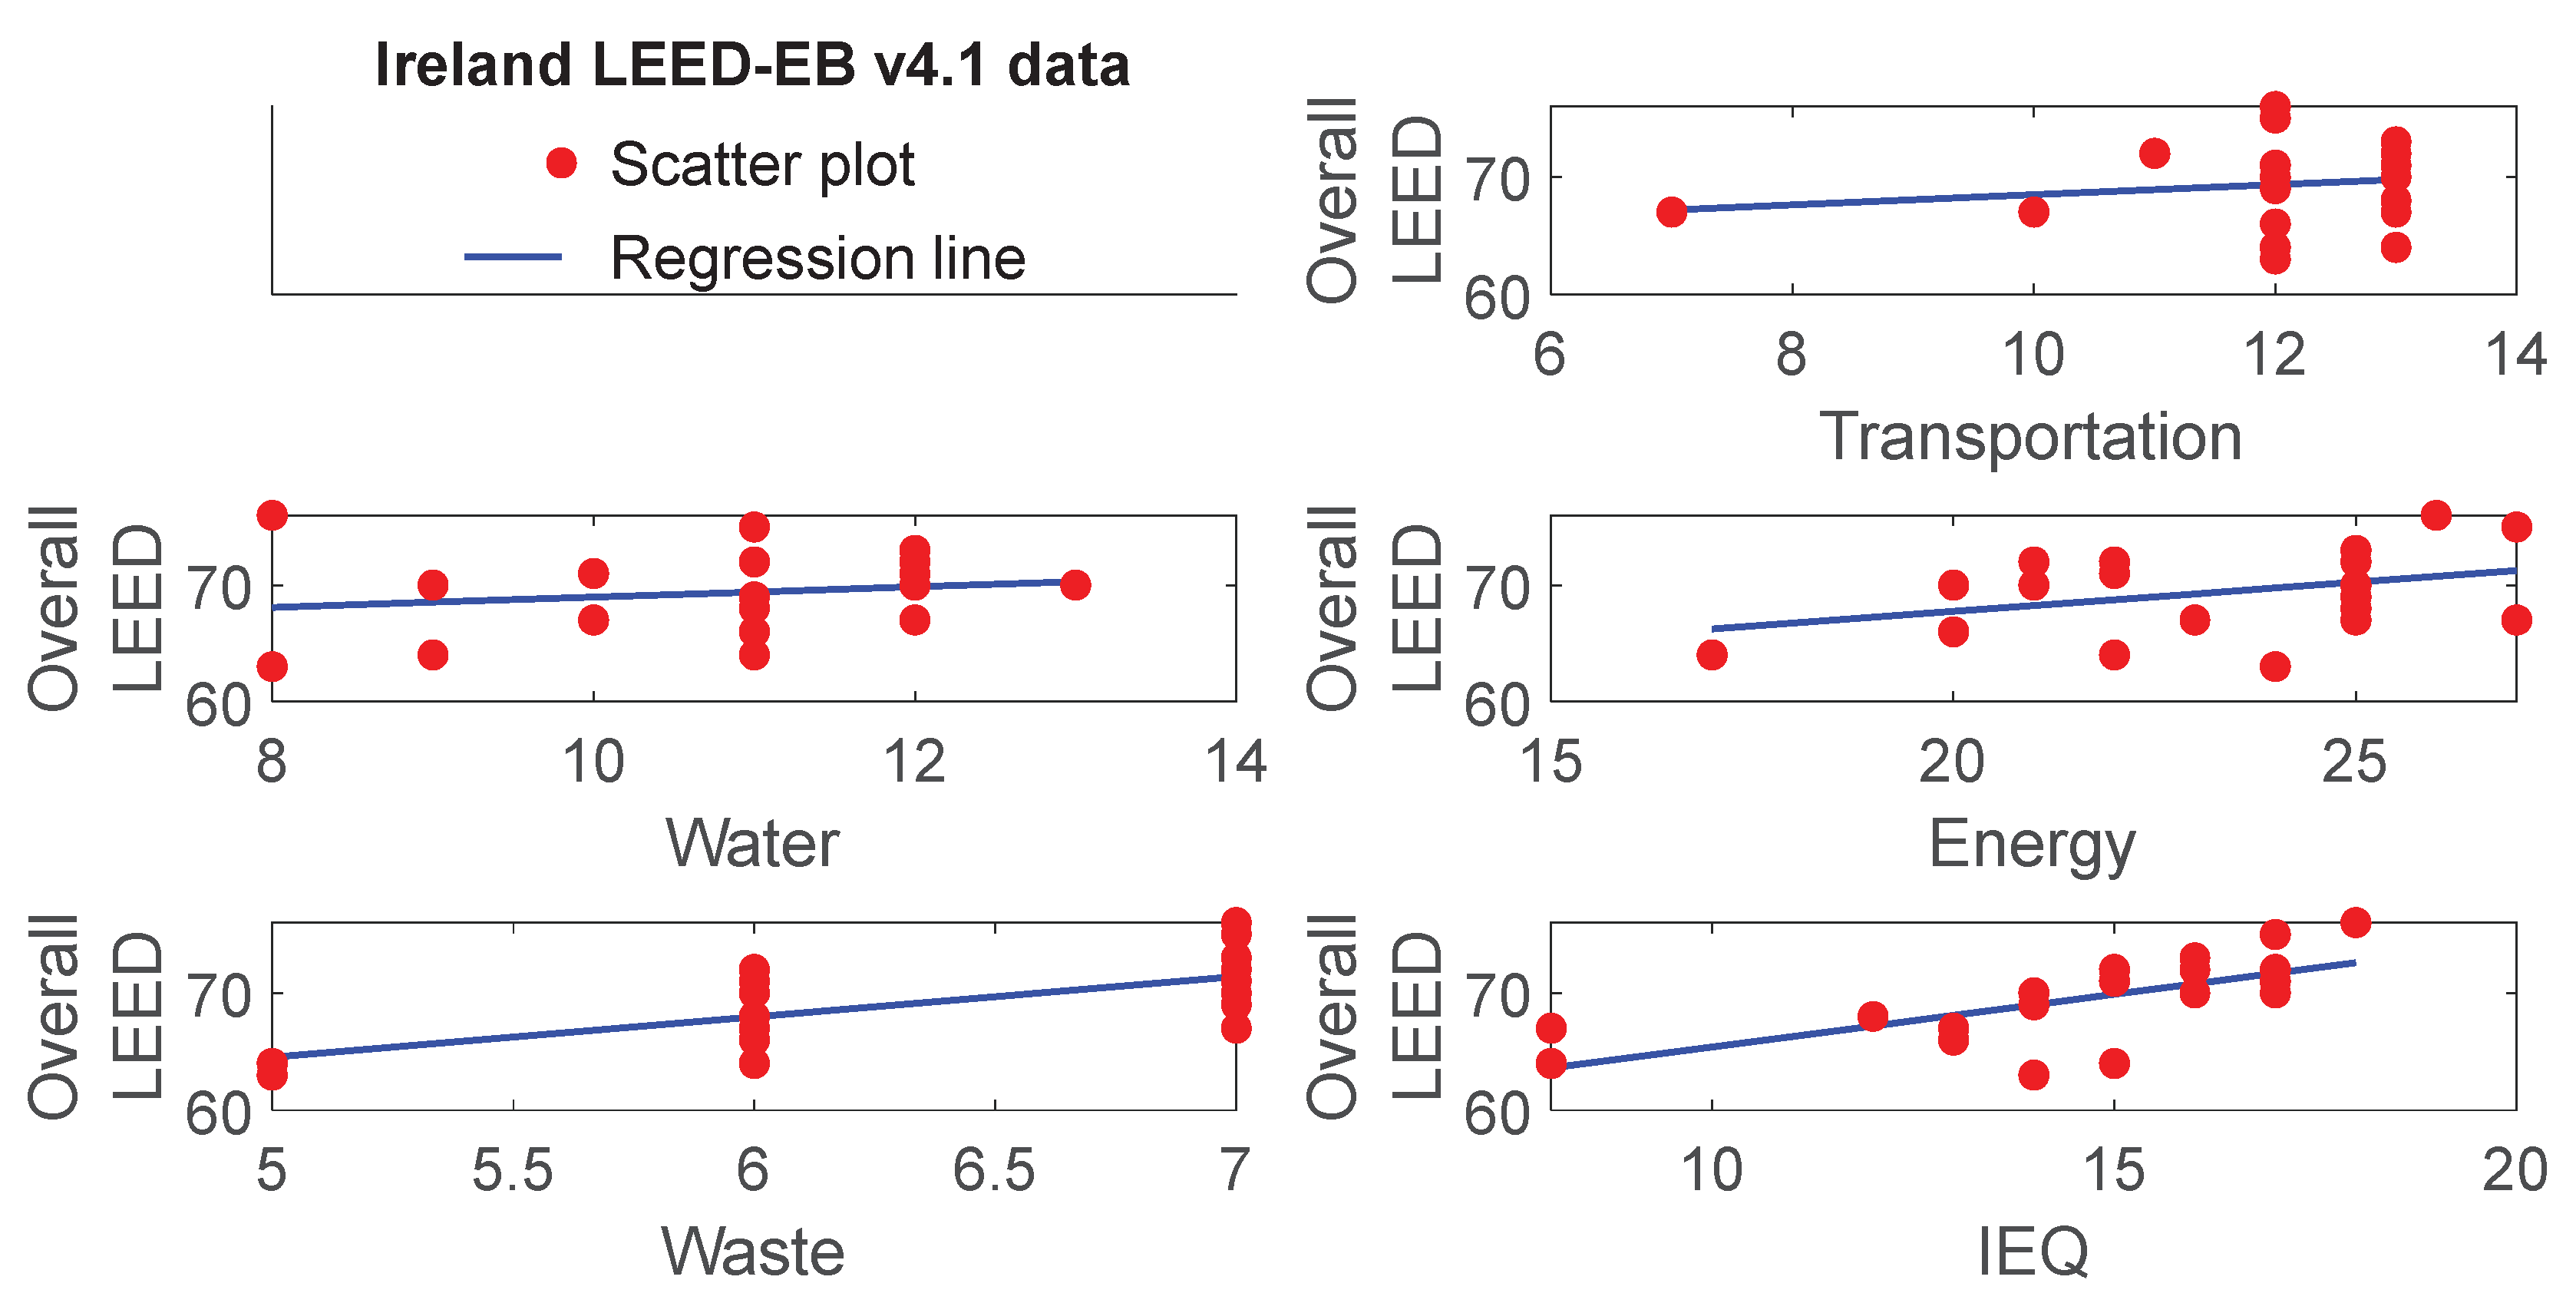
Table 1.
The transition from a prescriptive to a performance-based approach in the various versions of LEED (v1 to v5).
Table 1.
The transition from a prescriptive to a performance-based approach in the various versions of LEED (v1 to v5).
| Version | Year | Features |
| LEED Pilot/v1.0 | 1998 | Early versions of LEED (v1.0 and to a large extent v2.0) relied heavily on a prescriptive or prescriptive–descriptive approach [8]. |
| LEED v2.0 | 2000 | |
| LEED v3 | 2009 | LEED 2009 v3 moved to a more quantitative, energy-efficiency-focused approach, but the system still relied heavily on prescribed compliance paths [9,10]. |
| LEED v4 | 2013 | LEED v4 moved away from purely prescriptive requirements toward a performance-based approach [11]. |
| LEED v4.1 | 2019 | LEED v4.1 takes a more performance-based approach than LEED v4, shifting from a heavy reliance on prescriptive, design-phase documentation to data-driven, operational, and actual performance metrics [12]. |
| LEED v5 | 2025 | LEED v5 represents a significant shift from a prescriptive approach to a performance-based approach [13]. |
Table 2.
LEED 2009 v3 and v4/4.1 categories.
| Category | Features |
| Integrative Process (IP) | Encourages early analysis of energy, water, and site systems. |
| Location and Transportation (LT) | Encourages compact development, alternative transportation, and building on infill sites. |
| Sustainable Sites (SS) | Focuses on site management, environmental impact, and reducing pollution during construction. |
| Water Efficiency (WE) | Covers indoor and outdoor water consumption reduction and efficient management. |
| Energy and Atmosphere (EA) | The highest-weighted category, focusing on building energy performance, renewable energy, and refrigerant management. |
| Materials and Resources (MR) | Addresses waste reduction, sustainable material selection, and life-cycle impacts. |
| Indoor Environmental Quality (IEQ) | Focuses on improving indoor air quality, lighting, and thermal comfort for occupants. |
| Innovation in Design (ID) | Rewards projects for innovative design strategies not covered by other categories. |
| Regional Priority (RP) | Addresses specific environmental issues relevant to the project’s location. |
Table 3.
LEED-EB v4.1: five interval performance-based indicators.
| Performance indicator | Max points | Category |
| Transportation | 14 | Location and transportation category (LT) |
| Water | 15 | Water efficiency (WE) |
| Energy | 33 | Energy and atmosphere (EA) |
| Waste | 8 | Materials and resources (MR) |
| IEQ | 20 | Indoor environmental quality (IEQ) |
| Total | 90 |
Table 4.
LEED-EB v4.1: ten binary prescriptive indicators.
| Prescriptive indicator | Max points | Category |
| Rainwater management | 1 | Sustainable Sites (SS) |
| Heat island reduction | 1 | |
| Light pollution reduction | 1 | |
| Site management | 1 | |
| Enhanced refrigerant management | 1 | Energy and Atmosphere (EA) |
| Grid harmonization | 1 | |
| Purchasing | 1 | Materials and Resources (MR) |
| Green cleaning | 1 | Indoor Environmental Quality (IEQ) |
| Integrated pest management | 1 | |
| Innovation | 1 | Innovation (IN) |
| Total | 10 |
Table 5.
A summary of R2 values. A simple linear correlation between independent LEED category points and dependent total LEED points. Post-publication analysis.
Table 5.
A summary of R2 values. A simple linear correlation between independent LEED category points and dependent total LEED points. Post-publication analysis.
| LEED-certified projects | Sample size | Independent LEED category | |||||||
| LT | SS | WE | EA | MR | IEQ | RP | Ref. | ||
| versus dependent overall LEED score | |||||||||
| LEED-NC v3-certified university residence halls | 87 | – | 0.21 | 0.08 | 0.63 | 0.12 | 0.07 | – | [21] |
| LEED-NC v3-certified multifamily residential projects | 802 | – | 0.16 | 0.05 | 0.46 | 0.05 | 0.07 | – | [22] |
| LEED-NC v4-certified multifamily residential projects | 75 | 0.18 | 0.08 | 0.06 | 0.27 | 0.04 | 0.18 | – | [23] |
| LEED-NC v4-certified projects cover all building types | 1252 | 0.12 | 0.13 | 0.09 | 0.38 | 0.15 | 0.14 | 0.16 | [24] |
| LEED-NC v3-certified multifamily residential projects | 878 | – | – | – | – | – | – | 0.15 | [25] |
Table 7.
The distribution of LEED-EB v4.1-certified office projects across the four LEED certification levels in six countries in the Euro-Mediterranean region.
Table 7.
The distribution of LEED-EB v4.1-certified office projects across the four LEED certification levels in six countries in the Euro-Mediterranean region.
| Country | Certified | Silver | Gold | Platinum |
| Sweden | 0 | 9 | 57 | 0 |
| Italy | 0 | 0 | 28 | 2 |
| Israel | 0 | 0 | 24 | 1 |
| Spain | 0 | 2 | 35 | 11 |
| Germany | 0 | 0 | 24 | 3 |
| Ireland | 0 | 0 | 20 | 0 |
Table 8.
Linear regression analyses between each of the five “individual LEED” indicators and “overall LEED” for LEED-EB v4.1 gold-certified office projects in Sweden.
Table 8.
Linear regression analyses between each of the five “individual LEED” indicators and “overall LEED” for LEED-EB v4.1 gold-certified office projects in Sweden.
| Country | Variable | Simple linear regression | |||||
| Independent | Dependent | r | p-Value | b0 | b1 | R2-Value | |
| Sweden | Transport | Overall LEED | 0.00 | 0.973 | 66 | 0.01 | 0.00 |
| Water | 0.54 | <0.001 | 54 | 1.07 | 0.29 | ||
| Energy | 0.62 | <0.001 | 41 | 1.04 | 0.38 | ||
| Waste | 0.36 | 0.006 | 60 | 0.98 | 0.13 | ||
| IEQ | 0.51 | <0.001 | 51 | 1.19 | 0.26 | ||
Table 9.
Linear regression analyses between each of the five “individual LEED” indicators and “overall LEED” for LEED-EB v4.1 gold-certified office projects in Italy.
Table 9.
Linear regression analyses between each of the five “individual LEED” indicators and “overall LEED” for LEED-EB v4.1 gold-certified office projects in Italy.
| Country | Variable | Simple linear regression | |||||
| Independent | Dependent | r | p-Value | b0 | b1 | R2-Value | |
| Italy | Transport | Overall LEED | 0.42 | 0.027 | 53 | 1.40 | 0.17 |
| Water | 0.20 | 0.313 | 64 | 0.45 | 0.04 | ||
| Energy | 0.68 | <0.001 | 44 | 0.97 | 0.46 | ||
| Waste | 0.17 | 0.374 | 61 | 1.06 | 0.03 | ||
| IEQ | 0.49 | 0.009 | 56 | 0.89 | 0.24 | ||
Table 10.
Linear regression analyses between each of the five “individual LEED” indicators and “overall LEED” for LEED-EB v4.1 gold-certified office projects in Israel.
Table 10.
Linear regression analyses between each of the five “individual LEED” indicators and “overall LEED” for LEED-EB v4.1 gold-certified office projects in Israel.
| Country | Variable | Simple linear regression | |||||
| Independent | Dependent | r | p-Value | b0 | b1 | R2-Value | |
| Israel | Transport | Overall LEED | 0.02 | 0.927 | 65 | 0.05 | 0.00 |
| Water | 0.53 | 0.008 | 55 | 1.06 | 0.28 | ||
| Energy | 0.73 | <0.001 | 46 | 0.90 | 0.53 | ||
| Waste | 0.75 | <0.001 | 51 | 2.66 | 0.56 | ||
| IEQ | 0.01 | 0.973 | 65 | 0.03 | 0.00 | ||
Table 11.
Linear regression analyses between each of the five “individual LEED” indicators and “overall LEED” for LEED-EB v4.1 gold-certified office projects in Spain.
Table 11.
Linear regression analyses between each of the five “individual LEED” indicators and “overall LEED” for LEED-EB v4.1 gold-certified office projects in Spain.
| Country | Variable | Simple linear regression | |||||
| Independent | Dependent | r | p-Value | b0 | b1 | R2-Value | |
| Spain | Transport | Overall LEED | 0.45 | 0.007 | 56 | 1.22 | 0.20 |
| Water | 0.40 | 0.018 | 64 | 0.60 | 0.16 | ||
| Energy | 0.63 | <0.001 | 51 | 0.76 | 0.40 | ||
| Waste | 0.33 | 0.055 | 65 | 0.82 | 0.11 | ||
| IEQ | -0.01 | 0.935 | 70 | -0.02 | 0.00 | ||
Table 12.
Linear regression analyses between each of the five “individual LEED” indicators and “overall LEED” for LEED-EB v4.1 gold-certified office projects in Germany.
Table 12.
Linear regression analyses between each of the five “individual LEED” indicators and “overall LEED” for LEED-EB v4.1 gold-certified office projects in Germany.
| Country | Variable | Simple linear regression | |||||
| Independent | Dependent | r | p-Value | b0 | b1 | R2-Value | |
| Germany | Transport | Overall LEED | 0.16 | 0.450 | 63 | 0.57 | 0.03 |
| Water | 0.59 | 0.003 | 55 | 1.29 | 0.35 | ||
| Energy | 0.20 | 0.359 | 59 | 0.41 | 0.04 | ||
| Waste | 0.63 | 0.001 | 59 | 2.11 | 0.39 | ||
| IEQ | 0.52 | 0.009 | 61 | 0.67 | 0.27 | ||
Table 13.
Linear regression analyses between each of the five “individual LEED” indicators and “overall LEED” for LEED-EB v4.1 gold-certified office projects in Ireland.
Table 13.
Linear regression analyses between each of the five “individual LEED” indicators and “overall LEED” for LEED-EB v4.1 gold-certified office projects in Ireland.
| Country | Variable | Simple linear regression | |||||
| Independent | Dependent | r | p-Value | b0 | b1 | R2-Value | |
| Ireland | Transport | Overall LEED | 0.17 | 0.472 | 64 | 0.43 | 0.03 |
| Water | 0.18 | 0.459 | 65 | 0.44 | 0.03 | ||
| Energy | 0.37 | 0.112 | 58 | 0.50 | 0.13 | ||
| Waste | 0.65 | 0.002 | 47 | 3.43 | 0.42 | ||
| IEQ | 0.69 | 0.001 | 56 | 0.90 | 0.47 | ||
Table 14.
Generalized causal relationships between independent LEED indicators and dependent overall LEED score in LEED-EB v4.1 gold-certified office projects in countries of the Euro-Mediterranean region. The Sig value indicates a statistically significant difference (p ≤ 0.05), and the NS value indicates a statistically insignificant difference (p > 0.05).
| EED-EB v4.1 performance indicators that have a causal relationship with the overall LEED score | ||||||
| Country | Transportation | Water | Energy | Waste | IEQ | Number of statistically significant events |
| Sweden | NS | Sig | Sig | Sig | Sig | 4 |
| Italy | Sig | NS | Sig | NS | Sig | 3 |
| Israel | NS | Sig | Sig | Sig | NS | 3 |
| Spain | Sig | Sig | Sig | NS | NS | 3 |
| Germany | NS | Sig | NS | Sig | Sig | 3 |
| Ireland | NS | NS | NS | Sig | Sig | 2 |
| Number of statistically significant events | 2 | 4 | 4 | 4 | 4 | |
| Number of statistically insignificant events | 4 | 2 | 2 | 2 | 2 | |
Table 15.
A summary of the intercept (b0), slope (b1), and coefficient of determination (R2) for simple linear regression between independent LEED performance indicators and dependent overall LEED scores.
Table 15.
A summary of the intercept (b0), slope (b1), and coefficient of determination (R2) for simple linear regression between independent LEED performance indicators and dependent overall LEED scores.
| City/Country | Variable | Regression variable | Reference | |||
| Dependent | Independent | b0 | b1 | R2 | ||
| New York City | Overall LEED | Energy | 48.13 | 0.78 | 0.47 | [27] |
| Waste | 54.94 | 1.72 | 0.19 | |||
| Washington, D.C. | Overall LEED | Energy | 44.96 | 0.96 | 0.68 | |
| Waste | 53.46 | 1.96 | 0.42 | |||
| Sweden | Overall LEED | Energy | 40.56 | 1.04 | 0.38 | Current study |
| Waste | 60.08 | 0.98 | 0.13 | |||
| Israel | Overall LEED | Energy | 45.67 | 0.90 | 0.53 | |
| Waste | 51.31 | 2.66 | 0.56 | |||
Disclaimer/Publisher’s Note: The statements, opinions and data contained in all publications are solely those of the individual author(s) and contributor(s) and not of MDPI and/or the editor(s). MDPI and/or the editor(s) disclaim responsibility for any injury to people or property resulting from any ideas, methods, instructions or products referred to in the content. |
© 2026 by the authors. Licensee MDPI, Basel, Switzerland. This article is an open access article distributed under the terms and conditions of the Creative Commons Attribution (CC BY) license (http://creativecommons.org/licenses/by/4.0/).
Copyright: This open access article is published under a Creative Commons CC BY 4.0 license, which permit the free download, distribution, and reuse, provided that the author and preprint are cited in any reuse.


