
Submitted:
14 February 2026
Posted:
27 February 2026
You are already at the latest version
Abstract
Autism spectrum disorder (ASD) is commonly diagnosed after the optimal window for early neuroplasticity, despite validated behavioural instruments. These tools remain vulnerable to rater bias, sex differences and service delays, motivating interest in molecular biomarkers. This narrative review synthesises transcriptomic evidence across brain, blood and saliva in ASD, mapping convergent synaptic, immune and mitochondrial axes, contrasting bulk, single-nucleus and long-read RNA-seq technologies, and summarising the diagnostic performance of existing blood and salivary panels in children. We integrate these data with behavioural scales, Standards for Reporting of Diagnostic Accuracy (STARD)-based reporting requirements and ethical, regulatory and economic considerations for clinical implementation. Current panels show promising but preliminary accuracy and should be viewed as adjuncts to behavioural assessment; rigorous multicentre, prospective validation is required before routine use.
Keywords:
autism spectrum disorder
; transcriptomics
; RNA sequencing
; biomarkers
; early diagnosis
Introduction
Autism spectrum disorder (ASD) is a heterogeneous neurodevelopmental condition characterized by persistent differences in social communication and interaction alongside restricted, repetitive patterns of behavior, interests, or sensory features (American Psychiatric Association, 2013; Lord et al., 2020). As a rule, symptoms manifest in early childhood and persist throughout life (Lord et al., 2020). According to the CDC, the prevalence of ASD among 8-year-olds in the United States is approximately 1:36 (2.8%), with boys diagnosed 3-4 times more often than girls (Maenner et al., 2023).
Despite the availability of validated diagnostic tools (ADOS-2, M-CHAT-R/F, CARS-2), most children are diagnosed between 3 and 5 years of age. This situation leads to a narrowing of the window for early intervention during the period of maximum neuroplasticity, while Pierce et al. (2019) showed that the diagnosis of ASD can be stably established as early as about 14 months, which justifies the need for the earliest possible screening route (Pierce et al., 2019, Zwaigenbaum et al., 2015, Ji et al., 2023, Maenner et al., 2023). In addition, the difficulty of diagnosis in girls is associated with a less pronounced clinical picture and “camouflage” strategies, which increase the risks of late or missed diagnosis (Lockwood Estrin et al., 2021).
Against this background, there is increasing interest in molecular diagnostic approaches. For example, in patients with ASD, post-mortem examination of the cerebral cortex reproducibly reveals broad transcriptomic shifts that affect neuronal, synaptic, and immune pathways. However, most of these data were obtained from adolescents and adults, and it remains unclear how early these signatures may occur and whether they are suitable for presymptomatic screening in infants (Gandal et al., 2022). To overcome this limitation, researchers are increasingly using RNA-seq, which provides quantitative assessment of coding and non-coding transcripts, alternative splicing events, and isoform diversity with nucleotide resolution (Wang, Gerstein & Snyder, 2009).
In studies of child-accessible materials (blood, saliva), results with applied potential have been obtained. In blood, using RNA-seq and machine learning (ML) methods, ASD vs. NT classification accuracy on the order of 82% was demonstrated (Voinsky et al., 2023). In previous work by this group, coordinated shifts in the expression of BATF2 and LY6E (up) and ISG15 and MT2A (down) were described, indicating consistency with the immune-inflammatory hypothesis (Voinsky et al., 2022). In discordant sibling pairs of children with ASD, differential expression of immune genes was noted (including EGR1, IGKV3D-15) and co-expression modules (Tomaiuolo et al., 2023). Peripheral blood analysis in children with ASD revealed immune dysregulation and disturbances of transcriptional control (Tomaiuolo et al., 2023), while integrated data also indicate mitochondrial and inflammatory shifts affecting both blood and brain (He et al., 2019). In large cohorts, it was shown that transcriptomic differences largely reflect shifts in blood cellular composition, with a decrease in the proportion of NK cells (according to CIBERSORT and xCell), which is confirmed by WGCNA modules. In addition, it was noted that NMUR1, HMGB3, and PTPRN2 remain candidates at a liberal screening threshold (FDR < 0.25). Accounting for cellular-composition deconvolution, however, requires strict thresholds and independent replication (Filosi et al., 2020). From this it can be concluded that, taken together, these results support the idea of an auxiliary role for transcriptomics in early diagnosis, subject to external validation.
At present, transcriptomic biomarkers, especially blood RNA panels, lack proven diagnostic utility for individual-level clinical decisions and should be considered adjuncts to behavioral assessment rather than replacements. Most published panels remain at a proof-of-concept stage and require independent, prospective external validation before clinical use. This position is consistent with consortium statements and systematic reviews highlighting the research-stage nature of ASD biomarkers (McPartland et al., 2020, Frye et al., 2019).
Pathogenetic Axes and Transcriptomics
To better understand transcriptomic changes in ASD, three key pathogenetic axes were examined: synaptic dysfunction, immune-inflammatory activation, and disorders of transcriptional control and mitochondrial metabolism. These trends reflect the most reproducible molecular signatures identified by analysis of brain and peripheral tissues using RNA-seq.
Molecular Context: Synaptic Dysfunction (Transcriptomic Correlates)
Synaptic dysfunction is one of the most reproducible findings in ASD. SHANK3 (postsynaptic density scaffold) and NLGN3 (postsynaptic adhesion) interact transsynaptically with presynaptic NRXN1, providing synapse organization (Bourgeron, 2015). In the postmortem cortex, ASD consistently shows a decrease in synaptic gene expression along with activation of immune-microglial programs (Parikshak et al., 2016, Voineagu et al., 2011). Integration of transcriptomics and morphometry showed that genes associated with cortical thickness differences (ΔCT) in children with ASD are enriched for the “synaptic transmission” pathway and significantly overlap with the transcriptionally reduced (downregulated) gene set described in the postmortem cortex in ASD, the corresponding genes are generally overexpressed in the associative cortex (Romero-Garcia et al., 2019). Given the central role of SHANK3 in organizing the postsynaptic density, targeted therapeutic approaches (gene therapy/enhancement of SHANK3 expression, modification of downstream pathways) are being discussed, however, their clinical effectiveness requires further validation in independent cohorts and controlled trials (Li et al., 2024).
Immune and Inflammatory Mechanisms: Transcriptomic Data of Peripheral Blood.
The paired design of discordant siblings (n = 27 pairs) revealed an increase in EGR1 and IGKV3D-15 (both padj = 0.037). WGCNA identified 18 modules, of which one “midnight blue” was reduced in ASD (p = 0.035), and its eigengene yielded a AUC= 0.62. The hub gene of the module is RACK1, encoding a signaling adaptor protein involved in the regulation of innate immune responses and neuronal development. These results are consistent with the concept of immune transcriptional dysregulation in children with ASD (Tomaiuolo et al., 2023).
In silico analysis of six GEO datasets using CIBERSORT showed a myeloid shift in children with ASD: increased monocytes (including ncMonocytes), increased M0, and decreased M2 macrophages. Among 15 hub genes, PSMC4, ALAS2, LILRB1, and CD69 were identified, and moderate diagnostic efficacy (ROC = 0.633/0.651 in the training set and 0.677/0.625 in the validation set) was shown for PSMC4 and ALAS2, while expression of LILRB1 and CD69 increased with the severity of ASD (mild/medium/high groups). In an independent cohort (30 ASD / 30 control), flow cytometry confirmed an increase in the proportion of monocytes and ncMonocytes (Li et al., 2023). In adults with ASD, RNA-seq and WGCNA revealed a module enriched for the NK signaling pathway, and qPCR/replication validation confirmed changes in MAFB (↑), RPSAP58 (↓), and GZMK (Horiuchi et al., 2021).
Transcriptional Control and Mitochondrial Disorders in ASD.
Thousands of differentially expressed genes have been detected based on cortex-wide RNA-seq, as well as larger effects at the isoform level, indicating a significant contribution of alternative splicing, along with co-expression modules enriched for ASD genetic risk (Gandal et al., 2022). In the postmortem cortex, the level of mitochondrial transcripts is reduced and closely correlates with a decrease in synaptic genes, indicating coordinated transcriptional dysregulation of mitochondrial and synaptic processes in the ASD cortex (Schwede et al., 2018). Some regional data show decreases in MTX2, SLC25A27, and NEFL in the anterior cingulate gyrus, motor cortex, and thalamus (Anitha et al., 2012), however, the authors note that the results could not withstand strict correction for multiple testing and require independent replication. Outside transcriptomics, respiratory chain disorders (mainly complex I deficiency) are regularly detected, in total, signs of mitochondrial dysfunction were noted in 11 out of 13 (≈85%) brain studies, indicating the stability and potential clinical significance of these findings despite limitations of small samples and methodological heterogeneity (Rossignol and Frye, 2014).
Transcriptomics.
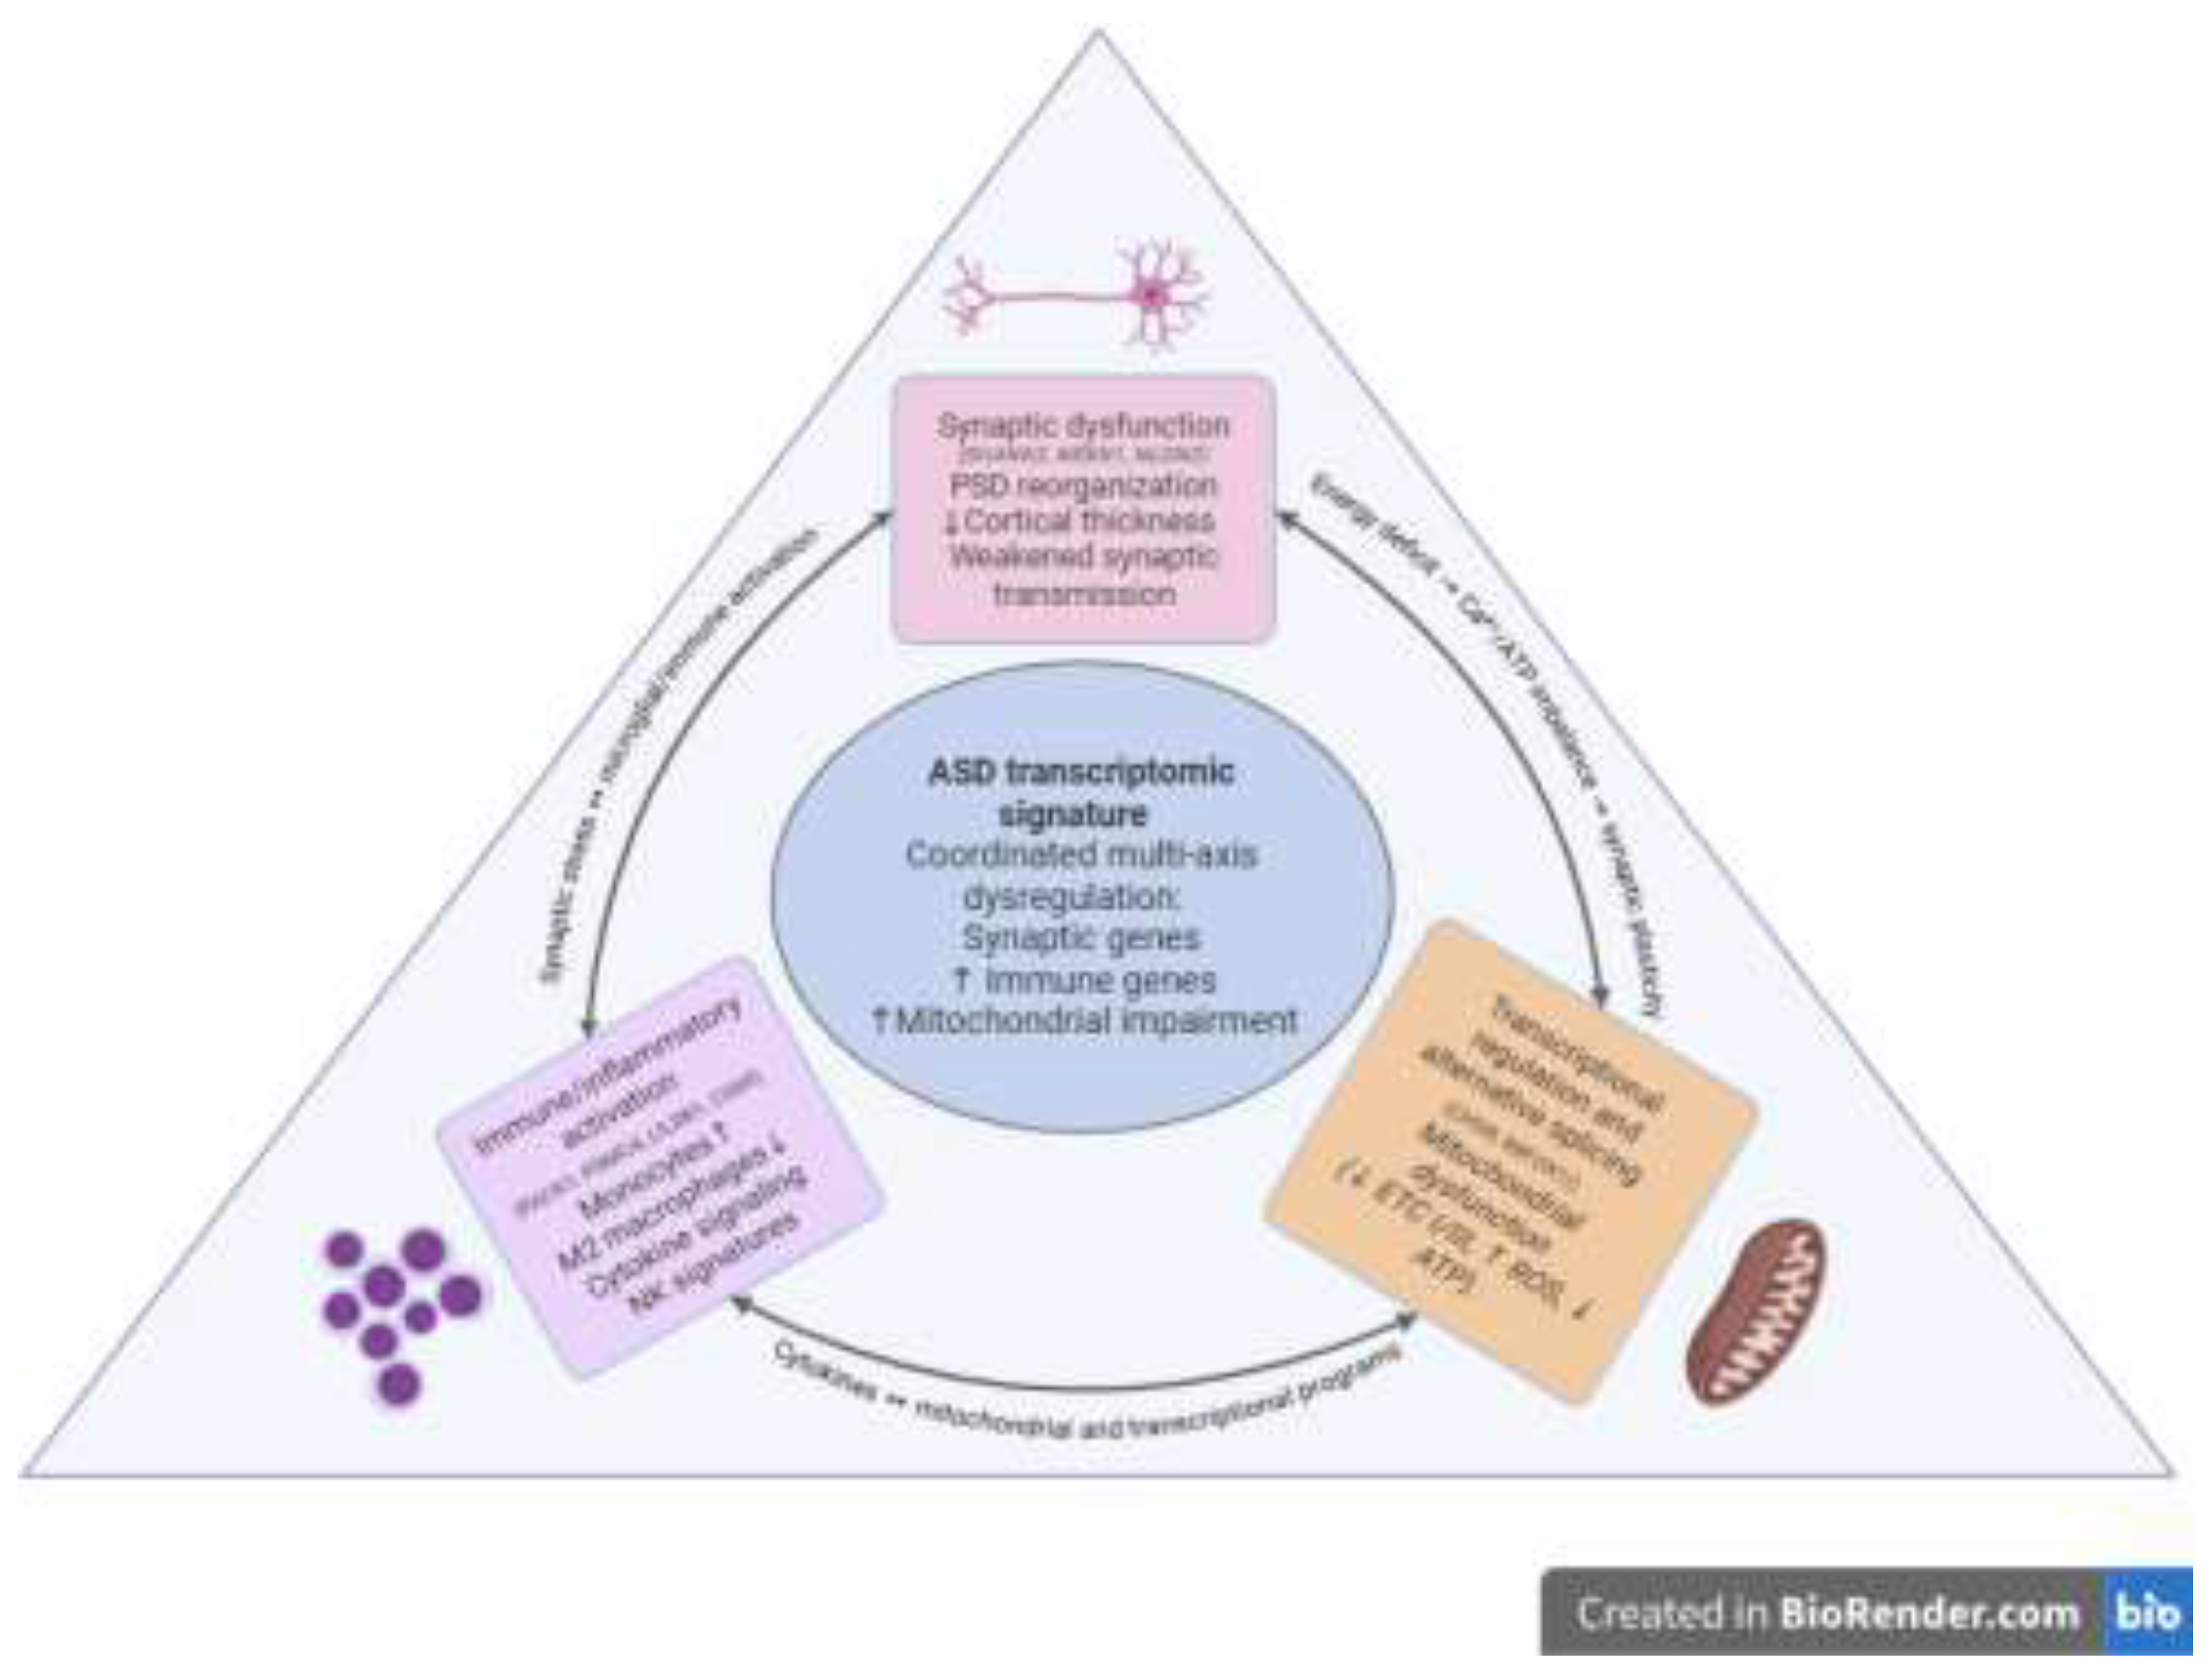
Convergent data show consistent dysregulation of the three axes in ASD-synaptic, immune, and mitochondrial-rather than isolated changes. In the postmortem cortex, a decrease in mitochondrial transcripts strongly and positively correlates with a decrease in synaptic pathways, indicating coordinated transcriptional dysregulation of “energy-synapse” (Schwede et al., 2018). Peripheral transcriptomics showed an increase in monocyte-myeloid signals, an increase in monocytes, a simultaneous decrease in M2 macrophages, and a connection with activated dendritic cells and hub genes, predictors demonstrate ROC performance with independent validation (Li et al., 2023). The synthesis of axes and their interactions is shown in Figure 1.
Modern Behavioural Diagnostic Tools for ASD and Their Limitations.
For clinical research verification, ADOS-2 (Autism Diagnostic Observation Schedule, 2nd edition) and ADI-R (Autism Diagnostic Interview-Revised) are most often used. Meta-analyses report high accuracy rates (sensitivity 0.89-0.92 and specificity 0.81-0.85 for ADOS-2 and sensitivity ≈0.75 and specificity ≈0.82 for ADI-R) (Lebersfeld et al., 2021), and their combined use increases diagnostic consistency (0.70-0.98 and 0.80-0.96) (Yu et al., 2023). At an early age (16-30 months), primary screening is usually performed using M-CHAT-R/F: sensitivity/specificity of 0.83/0.94 according to a meta-analysis of 50 studies, with high accuracy confirmed in a prospective cohort of >16,000 children (0.833/0.992) and in an independent meta-analysis (0.78/0.98) (Wieckowski et al., 2023, Robins et al., 2014, Santos et al., 2024). CARS/CARS-2 is often used for clinical stratification, according to studies with a low risk of systematic error in meta-analysis, sensitivity varies from 0.71-0.86 and specificity from 0.75-0.79 (Moon et al., 2019). CARS-2ST demonstrates high discrimination (AUC up to 0.977) and optimal thresholds of 30 (autism) and 28.5 (autism spectrum) relative to ADOS-2 (Ji et al., 2023). At the same time, ADOS-2/ADI-R remain resource-intensive (cost, duration, certification requirement), whereas M-CHAT-R/F is intended for screening (16-30 months) and not for final diagnosis. The full numbers and designs are shown in Table 1.
Figure 1.
The diagram summarizes the three interrelated axes, showing: 1) co-reduction of synaptic and mitochondrial transcripts in the cortex (Schwede et al., 2018), 2) immune activation of blood (↑ monocytes, ↓ M2 macrophages activated by DC) and signatures of PSMC4/ALAS2/LILRB1/CD69 hub genes with moderate ROC metrics and flow-cytometry validation (Li et al., 2023), 3) reduced “midnight blue” WGCNA module (82 genes, AUC = 0.62) with the RACK1 hub gene (Tomaiuolo et al., 2023).
As shown in Table 1, the diagnostic accuracy of behavioral tools varies substantially across scales and conditions of use (Lebersfeld et al., 2021, Wieckowski et al., 2023, Moon et al., 2019). Results are influenced by context and bias: in adults with psychotic symptoms, a high proportion of false-positive results has been described for ADOS-2, reducing specificity (Maddox et al., 2017), whereas for M-CHAT-R/F, performance depends on the child’s age and tends to be higher closer to 30 months (Yuen et al., 2018, Wieckowski et al., 2023).
Diagnosis in girls and women may be more difficult due to a behavioral presentation that is less noticeable on ADOS-2 (lower scores on social communication and total scores) and due to masking/camouflaging of autistic signs described in the literature (Hull et al., 2020, Pearson & Rose, 2021, Rea et al., 2023). The cross-cultural comparability of CARS is limited: measurement invariance was not confirmed across all items when comparing six countries (India, Jamaica, Mexico, Spain, Turkey, USA) (Stevanovic et al., 2021). Collectively, these arguments favor supplementing behavioral screening and clinical scales with objective biomarkers, including transcriptomic approaches.
Definition of Transcriptomics and RNA-Seq Technologies
Transcriptomics examines the totality of cellular/tissue RNA transcripts (the transcriptome) to assess the dynamics of transcript/isoform gene expression in normal and pathological conditions. The core technology is RNA-seq, which provides quantitative measurement of coding and non-coding RNAs and enables detection of alternative splicing events and isoform diversity with sufficient depth and appropriate library design/algorithms (Conesa et al., 2016).
With the development of sequencing technologies, three complementary directions of transcriptome analysis have emerged. Classical bulk RNA-seq evaluates average expression in mixed cell populations and remains a reliable tool for studying tissue-specific expression patterns. In studies of the postmortem cerebral cortex in ASD, this method has revealed co-regulated synaptic and immune signatures, as well as disruptions of alternative splicing (Parikshak et al., 2016). The main limitation of the approach is the inability to account for cellular heterogeneity.
The limitation of bulk RNA-seq in accounting for cellular heterogeneity is addressed by single-nucleus RNA sequencing (snRNA-seq), which provides cell-type-specific resolution. In samples of the cerebral cortex from individuals with ASD, snRNA-seq revealed expression changes specific to individual cell types, with predominant involvement of upper-layer excitatory neurons and microglia, gene dysregulation in cortico-cortical projection neurons correlated with clinical severity. The study was performed on nuclei isolated from snap-frozen PFC and ACC tissue (Velmeshev et al., 2019). Despite its high information content, sc/snRNA-seq is characterized by substantial technical and financial costs, as well as increased requirements for sample quality and biosafety.
An additional area is long-read RNA-seq (PacBio and Oxford Nanopore), which captures full-length transcripts and identifies novel isoforms. The accuracy of isoform identification increases with longer and more accurate reads, by contrast, high throughput is crucial for quantifying expression. Despite these advantages, quantification with long reads remains challenging due to throughput limitations and read error rates, and the consistency of results across tools is only moderate (Pardo-Palacios et al., 2024).
Collectively, these approaches are complementary: bulk RNA-seq identifies tissue-specific expression patterns, sc/snRNA-seq reveals the cellular architecture of transcriptomic changes, and long-read RNA-seq provides structural accuracy of the isoform landscape. The choice of technology is determined by the objectives of the study-from screening and mechanistic analysis to isoform mapping-and depends on the type of biological material (blood, brain, organoids) and the characteristics of the study cohort.
The Use of RNA-Seq in ASD Research
Today, RNA-seq is a core tool for both postmortem cerebral cortex and accessible biomaterials (blood, saliva), enabling the identification of reproducible molecular signatures, while its applied diagnostic role remains auxiliary and requires independent clinical validation. In the cerebral cortex, reproducible observations include decreased expression of synaptic genes, evidence of impaired alternative splicing, and attenuation of normal cortical expression patterning alongside activation of glial immune programs (Parikshak et al., 2016, Gandal et al., 2022). Single-cell/single-nucleus approaches have clarified cell-type-specific shifts, including in upper-layer pyramidal neurons, selected interneuron subtypes, astrocytes, and microglia (Velmeshev et al., 2019).
In non-invasive saliva sampling in children, a panel of 32 small-RNA features-11 miRNAs, 8 piRNAs, 1 snoRNA, and 12 microbial taxa (microbiota RNA signatures)-was validated with an AUC of 0.88, sensitivity of 82%, and specificity of 88% on an independent test set. The authors position it as an adjunct after behavioral screening (e.g., M-CHAT-R) or as objective support for diagnosis (Hicks et al., 2018). Peripheral blood in a “discordant siblings, matched by sex and age” design (n = 27 pairs) demonstrated immune DE genes EGR1 and IGKV3D-15 (both padj = 0.037, ↑ in ASD) and a decrease in a co-expression module associated with transcriptional control (WGCNA, p = 0.035), for which the eigengene ROC yielded an AUC of 0.62, collectively, these data support immune and transcriptional dysregulation in ASD (Tomaiuolo et al., 2023). In silico analysis (CIBERSORT, LASSO) revealed shifts in the immune-cell landscape-monocytes, M2 macrophages, and activated dendritic cells-in children, as well as resting/activated NK signatures in adults. Clinical validation by flow cytometry confirmed an increase in monocytes, including non-classical monocytes (ncMonocytes), in children with ASD (n = 60). Of the 15 hub genes, PSMC4 and ALAS2 showed moderate diagnostic information (ROC), whereas LILRB1 and CD69 were associated with ASD severity stratification, correlating with activated DCs and monocytes (Li et al., 2023). Dysregulation of innate and adaptive immunity has also been shown in adults: the key WGCNA module is enriched for NK-cell signaling and indicates reduced NK activity. Some transcripts were confirmed using RT-qPCR, and MAFB, RPSAP58, and GZMK were replicated (Horiuchi et al., 2021).
Collectively, RNA-seq data from brain tissues are consistent with a model of synaptic dysfunction on a background of immune activation (Parikshak et al., 2016, Gandal et al., 2022), whereas blood and saliva provide noninvasive signatures with auxiliary potential for diagnosis and stratification (Hicks et al., 2018, Tomaiuolo et al., 2023, Li et al., 2023, Horiuchi et al., 2021). These approaches are not intended to replace behavioral tools for primary screening and clinical diagnosis (Santos et al., 2024), therefore, multicenter prospective studies and standardization of thresholds/procedures are needed before clinical translation of specific panels.
Comparison of Transcriptomic Methods for Pediatric Diagnosis of ASD.
The choice of platform is determined by the task (screening, validation, stratification), the type of biomaterial, and the required resolution. Bulk RNA-seq provides a robust assessment of differential expression and enriched pathways in blood or tissue but lacks cellular resolution. sc/snRNA-seq provides cell-type-specific signatures and can be integrated with bulk to attribute signal sources. High cost and complexity have so far limited routine use in pediatrics. Long-read RNA-seq delineates the isoform landscape and is well suited as a targeted follow-up to short-read findings. Separately, the salivary small-RNA panel demonstrated an AUC of 0.88 in children and is considered an additional step after behavioral screening rather than an independent population-level test. Summary selection criteria are given in Table 2.
Review of Transcriptomic Markers of ASD
It is important to emphasize that no single marker is diagnostic on its own. Clinical relevance arises only as part of combined panels and when findings are consistent with behavioral tools.
Synaptic Genes
GRIN1 (NR1). In the postmortem cortex in ASD, A2BP1-dependent alternative splicing events were detected in the context of reduced RBFOX1/A2BP1. GRIN1 is among the top differential-splicing (DS) targets, RT-PCR confirmed ~85% of the tested A2BP1 targets, and DS-gene enrichment includes synapse/synaptogenesis categories (Voineagu et al., 2011).
CAMK2G. In the same study, CAMK2G ranks among the top A2BP1-dependent DS events and maps to the neural module M12, functional enrichment of DS genes includes synapse/synaptogenesis (Voineagu et al., 2011).
NRCAM. Listed among the top predicted A2BP1-dependent events, the authors emphasize its synaptogenesis-related role in the context of ASD (Voineagu et al., 2011).
SHANK3. Multiple transcripts/isoforms with distinct domain architectures have been described in humans (Wang et al., 2014). Region-specific differences in the representation of SHANK3 transcripts/isoforms have been reported in postmortem cortex in ASD (Lu et al., 2024). These transcriptomic observations expand the functional context of SHANK3 in ASD but do not, by themselves, establish causal relationships.
ANK2. In PsychENCODE data, isoform-level effects are most pronounced and partly disease-specific: for ANK2, differential transcript usage (DTU, FDR < 0.05) shows ANK2-006 associated with SCZ and ANK2-013 with ASD. The isoforms belong to different co-expression modules (astrocytic geneM3/isoM1 vs neuronal isoM18) and differ in domain composition. At the network level, co-expression associations between ANK2 and NRCAM are described, for ASD-related ANK2-013, additional associations with SCN4B and TAF9 are noted. These relationships reflect co-expression/network convergence rather than confirmed physical protein-protein interactions (PPIs) in vivo (Gandal et al., 2018).
Immune and Inflammatory Markers
IL-6, TNF-α. A review summarizes evidence of elevated IL-6 and TNF-α levels in plasma and postmortem brain tissue of individuals with ASD, supporting a hypothesis of neuroinflammatory dysregulation, however, effects are heterogeneous and non-specific to ASD (matrices/designs differ). These are considered contextual corroboration rather than diagnostic markers (Erbescu et al., 2022).
NMUR1, HMGB3, PTPRN2. Expression changes in peripheral blood of children with ASD persist after adjusting for cellular composition and are not limited to shifts in immune-cell proportions (FDR < 0.25), indicating a molecular signal not fully explained by compositional changes. A decrease in the NK signature was also noted (Filosi et al., 2020).
Regulators of Transcription and Splicing
RBFOX1 (A2BP1). In vivo knockdown of Rbfox1-iso1 in mouse cortex by in utero electroporation causes defects in radial migration and terminal translocation, as well as reduced axonal elongation and dendritic arborization. Electrophysiology showed changes in membrane and synaptic properties, including a decreased NMDA/AMPA ratio, supporting the pathophysiological relevance of RBFOX1 to HPP/ASD (Hamada et al., 2016).
POU3F2. A candidate key transcriptional regulator of the ASD gene network: integrative analyses (TWAS/TITANS, fetal-brain Hi-C, spatiotemporal expression, TFBS-LDSC) showed enrichment of targets with ASD genes and LoF-DNMs, the TFBS contribution to heritability was estimated as h2 ≈ 11.7%, with marginal significance (p ≈ 0.054). These data support a regulatory role but require further validation (Huang et al., 2021).
Behavioral and Neuromodulatory Axes (Preclinical Data)
Egr1, Foxp1, Homer1a, Oxt, Oxtr. This transcript set forms a panel by which the authors successfully stratified four mouse models of ASD. The panel reflects socio-behavioural shifts (linked to social-interaction metrics) and hormonal regulation via the oxytocin system (Oxt/Oxtr) (Gora et al., 2024).
Thus, the listed genes provide a basis for multifactorial panels and molecular stratification. Their greatest applied value is in non-invasive matrices (blood, saliva) and in combination with early-detection clinical scales, additional information is provided in Table 3.
Existing Panels for the Diagnosis of ASD
Caution on performance estimates. Reported AUC/accuracy values for transcriptomic panels are frequently optimized via internal cross-validation, without nested CV or truly external test cohorts, performance is commonly overestimated. Accordingly, metrics should be interpreted as preliminary until replicated in independent multicentre samples (Varma & Simon, 2006).
Early Works.
One of the first examples was a panel of 48 mRNAs in PBMCs in infants and preschoolers: the authors derived a signature on half of the cohort and achieved high accuracy on the held-out half using an SVM classifier. The study demonstrated technical feasibility and emphasized the need for multicenter replication and external validation (Glatt et al., 2012).
Salivary Small-RNA Panel/Test.
The most well-developed noninvasive approach-the salivary RNA panel-was validated in a multicenter study in children aged 19-83 months (n = 456, training set n = 372, independent test set n = 84) and, on the test set, showed AUC = 0.88, sensitivity = 82%, and specificity = 88% (41/50 ASD, 18/21 TD, 12/13 DD). The final model comprised 32 features (11 miRNAs, 8 piRNAs, 1 snoRNA, and 12 taxa of the salivary microbiota) and was trained using a radial-kernel SVM. The authors emphasize that such a test should be considered an adjunct to behavioral screening in children with positive M-CHAT-R/F rather than a substitute for behavioral tools (Hicks et al., 2018, Robins et al., 2014).
This multicenter study did not include a prospective population-based assessment at the primary-care level. The authors also note that reliance on microbial indicators requires accounting for diet and geography, as well as further cross-site validation, before broad generalizability can be claimed. Collectively, this panel demonstrates high applied potential as a second step after behavioral screening in pediatric cohorts, however, multicenter prospective studies, site/platform reproducibility, and standardization of thresholds/procedures are required before widespread clinical use (Hicks et al., 2018, Robins et al., 2014).
Peripheral Blood-Based Panels.
Voinsky et al. developed an ML panel based on whole-blood mRNA expression in children (two cohorts: Israel and the USA, n = 99: 73 ASD, 26 NT), measured by RT-qPCR (2^−ΔCt) for 10 genes selected from a previous RNA-seq study of the same samples. Two random-forest configurations (predictor set #3: MT2A, ISG15, FBXO6, SERPING1, BATF2, and #5: BATF2, ISG15, SERPING1, LY6E, EFHC2) achieved accuracy = 82.18% (AUC ≈ 0.82 and 0.77, respectively) under LOOCV, AUC variability was estimated using stratified k-fold validation. The authors stress that this is a proof-of-concept requiring independent external validation on large multicenter cohorts (Voinsky et al., 2023).
Given this, careful assessment and correction for cellular mixture are essential in blood-based transcriptomic studies. Bulk blood RNA profiles are sensitive to variation in leukocyte composition, failing to model cellular mixture reduces signal-to-noise and biases effect sizes. Authors should, first, estimate cell-type proportions with a validated deconvolution approach used in ASD studies, second, report reference matrices and key parameters, and third, provide a sensitivity analysis “with vs. without” correction to show the robustness of markers and classifiers. Where immune-cell shifts are part of the biology (e.g., NK/monocyte signatures), interpretation must distinguish cell-composition effects from per-cell expression changes(Filosi et al., 2020, Sosina et al., 2021)..
This work builds on a prior whole-blood RNA-seq study by the same group: elevated BATF2 and LY6E and decreased ISG15 and MT2A were identified in the Israeli discovery cohort (8 ASD vs 9 NT) and replicated in the combined Israeli-American sample (RT-qPCR, 73 ASD, 26 NT). The profile was interpreted as reflecting pro-inflammatory phenotypes of innate immunity in ASD (Voinsky et al., 2022).
Blood-transcriptome panels for ASD remain limited by small sample sizes, and their metrics are often overestimated due to cross-validation (CV) tuning, therefore, nested CV or external validation is needed (Varma & Simon, 2006). Profiles are highly sensitive to pre-analytics and batch effects, as well as to mixture driven by variation in blood cellular composition, explicit assessment and correction are necessary (Filosi et al., 2020).
Cumulative data indicate that specific salivary small-RNA panels have already undergone separate multicenter validation and are positioned as adjuncts to behavioral screening (Hicks et al., 2018), whereas blood RNA panels remain predominantly at the research stage (Voinsky et al., 2022, 2023). For clinical translation, independent prospective (preferably multicenter) studies are advisable, and key STARD 2015 items should be followed for reporting (Bossuyt et al., 2015, Cohen et al., 2016). For reproducibility and portability, harmonization of pre-analytics and analytical pipelines is required, including monitoring of batch effects (Sprang et al., 2022) and accounting/deconvolution of blood cellular composition (Sosina et al., 2021).
Ethics and Clinical Translation of Transcriptome Tests in ASD
Community consent and participation.
Validation of RNA panels should use accessible materials and informed-consent procedures adapted for autistic children and adults, and for people with intellectual disabilities: short, understandable texts (plain language), structured presentation with visual cues/icons, and the option to use preferred communication methods, including augmentative and alternative communication (AAC). Consent should be considered an ongoing process, with respect for expressed consent or dissent. The development of materials and procedures should take place in partnership with the community (in formulating questions, study design, interpretation, and communication of results). These practical recommendations are summarized by Beck et al. (2025).
Data protection and access control.
Transcriptomic data are considered personal data when they can directly or indirectly identify a person, fully anonymous datasets are not subject to European data-protection regulations. Work with such data should be lawful, fair, and transparent, have clearly defined purposes, be limited to what is necessary, be stored no longer than necessary, and ensure security, with full accountability for compliance with these principles. For scientific research, reuse and longer storage are permitted subject to “appropriate safeguards”-primarily minimization and pseudonymization-along with other technical and organizational measures. In practice, this implies controlled access under predefined rules (eligibility criteria, access agreements), with transaction logging and regular auditing to ensure the required level of protection (European Union, 2016).
Minimizing harm.
According to ABC-CT and a systematic review, current ASD biomarkers-including transcriptomic ones-remain research-based and lack proven diagnostic utility, any such results should be interpreted only as an adjunct to clinical/behavioral assessment. Their performance characteristics remain preliminary and require extensive external validation before being used for individual decisions (McPartland et al., 2020, Frye et al., 2019).
Economics of implementation.
Evidence from pediatric genomic testing shows that obtaining a molecular diagnosis does not guarantee cost reductions for the healthcare system, observed effects vary across settings and along the care pathway. Therefore, scaling should be based on cost-effectiveness assessment and evidence of clinical benefit, rather than expectations of savings, the same fundamental requirements should be considered when evaluating transcriptome panels (Weymann et al., 2024).
Conclusion
Summary Assessment of Potential.
Modern transcriptomic approaches-from bulk RNA-seq to snRNA-seq and targeted panels-consistently reveal convergent signatures in ASD: decreased neuronal-synaptic transcripts alongside activation of immune-glial programs in cortex, cell-type-specific shifts are refined at the single-nucleus level. In accessible pediatric matrices (saliva, blood), reproducible signals are detected, supporting transcriptomics as a molecular adjunct to behavioral tools for early assessment, however, the temporal dynamics of signature emergence relative to clinical manifestation remain insufficiently defined and require prospective evaluation (Parikshak et al., 2016, Velmeshev et al., 2019, Hicks et al., 2018, Tomaiuolo et al., 2023).
Balance of Strengths and Limitations.
Strengths include noninvasive matrices (saliva/blood) and the ability to capture molecular patterns missed by behavioral assessment, a representative example is the validated salivary small-RNA panel in children (test set: AUROC ≈ 0.88, sensitivity ≈ 82%, specificity ≈ 88%), which the authors position specifically as an adjunct to behavioral screening. Limitations include cost and technical complexity, inter-laboratory reproducibility, sensitivity to pre-analytics and variation in blood cellular composition, as well as limited specificity of some immune markers and generalizability across centers/populations (Hicks et al., 2018, Sprang et al., 2022, Sosina et al., 2021, Frye et al., 2019).
Prospects and Prerequisites for Translation.
Translation of transcriptomic biomarkers from research to clinical use will require demonstration of transportable accuracy in multicentre, preferably prospective, cohorts under harmonised conditions. Pre-analytics must be standardised with respect to matrix and tube type, stabilisation procedure and time-to-stabilisation, temperature and logistics, as well as RNA integrity, haemolysis, storage and transport documentation. On the analytical side, studies should predefine and report the sequencing or profiling platform and library strategy, target read depth or coverage, alignment and annotation versions, normalisation procedures, and explicit monitoring and correction of batch effects, together with assessment and deconvolution of blood cellular composition where relevant. Only biomarkers that retain performance under such conditions, and demonstrate independent external validation together with evidence of clinical utility, can be considered for implementation (Cohen et al., 2016, Sprang et al., 2022, Sosina et al., 2021). At present, consortium efforts indicate that ASD biomarkers, including transcriptomic panels, remain candidates requiring further qualification before routine use in individual-level decision making (McPartland et al., 2020).
STARD 2015 Mapping for Transcriptomic Diagnostic Studies.
In line with STARD 2015, transcriptomic diagnostic studies should report several key items: a clear description of the index test (the transcriptomic panel, including features, platform, analytical pipeline and versioning), the reference standard (behavioural or clinical diagnosis, and its timing relative to the index test), prespecified thresholds or decision rules, avoiding data-driven thresholding on test folds, details of blinding procedures for index-test analysts and the independence of training and test data, handling of indeterminate results and missing data, a participant flow diagram together with the rationale for sample size, and results of external validation, ideally in multicentre and, where feasible, prospective cohorts (Bossuyt et al., 2015, Cohen et al., 2016). Adherence to these items is necessary to allow a robust judgement of transportable accuracy before considering clinical translation.
Funding
This research received no specific grant from any funding agency, commercial or not-for-profit sectors.
Ethical approval
This article is a narrative review and does not involve human participants, personal data, or new experimental procedures. Ethical approval was therefore not required.
Informed consent
Not applicable.
Acknowledgments
The author thanks Professor Roy D. Sleator (Department of Biological Sciences, Munster Technological University, Cork, Ireland) for his supervision and insightful comments on earlier drafts of this manuscript.
Conflicts of Interest
The author declares no conflicts of interest.
Declaration: of generative AI and AI-assisted technologies in the manuscript preparation process
During the preparation of this manuscript, the author used ChatGPT (version 5.2, «thinking» model) solely for language-related assistance, including grammatically accurate translation, lexical refinement, and adaptation of the text to academic English. All translated and edited text was carefully reviewed and verified by the author and was confirmed to be fully consistent with the original content and the research conducted by the author. The study design, data analysis, interpretation of results, and all scientific conclusions were performed independently by the author, who takes full responsibility for the content of the published article.
References
- American Psychiatric Association (2013) Diagnostic and statistical manual of mental disorders (5th ed.). Washington, DC: American Psychiatric Association. [CrossRef]
- Maenner, M.J., Shaw, K.A., Bakian, A.V., Bilder, D.A., Durkin, M.S., Esler, A., et al. (2023) ‘Prevalence and characteristics of autism spectrum disorder among children aged 8 years-Autism and Developmental Disabilities Monitoring Network, 11 sites, United States, 2020’, MMWR Surveillance Summaries, 72(2), pp. 1-14. [CrossRef]
- Zwaigenbaum, L., Bauman, M.L., Choueiri, R., Kasari, C., Carter, A., Granpeesheh, D., et al. (2015) ‘Early intervention for children with autism spectrum disorder under 3 years of age: recommendations for practice and research’, Pediatrics, 136(Suppl 1), pp. S60-S81. [CrossRef]
- Ji, S.-I., Park, H., Yoon, S.A. and Hong, S.-B. (2023) ‘A validation study of the CARS-2 compared with the ADOS-2 in the diagnosis of autism spectrum disorder: suggestion for cutoff scores’, Journal of the Korean Academy of Child and Adolescent Psychiatry, 34(1), pp. 45-50. [CrossRef]
- Pierce, K., Gazestani, V.H., Bacon, E., Barnes, C.C., Cha, D., Nalabolu, S., et al. (2019) ‘Evaluation of the diagnostic stability of the early autism spectrum disorder phenotype in the general population starting at 12 months’, JAMA Pediatrics, 173(6), pp. 578-587. [CrossRef]
- Lockwood Estrin, G., Milner, V., Spain, D., Happé, F. and Colvert, E. (2021) ‘Barriers to autism spectrum disorder diagnosis for young women and girls: a systematic review’, Review Journal of Autism and Developmental Disorders, 8(4), pp. 454-470. [CrossRef]
- Gandal, M.J., Haney, J.R., Wamsley, B., Yap, C.X., Parhami, S., Eilbott, J., et al. (2022) ‘Broad transcriptomic dysregulation occurs across the cerebral cortex in ASD’, Nature, 611(7936), pp. 532-539. [CrossRef]
- Gandal, M.J., Zhang, P., Hadjimichael, E., Walker, R.L., Chen, C., Liu, S. PsychENCODE Consortium, (2018) ‘Transcriptome-wide isoform-level dysregulation in ASD, schizophrenia, and bipolar disorder’, Science, 362(6420), eaat8127. [CrossRef]
- Wang, Z., Gerstein, M. and Snyder, M. (2009) ‘RNA-Seq: a revolutionary tool for transcriptomics’, Nature Reviews Genetics, 10(1), pp. 57-63. [CrossRef]
- Voinsky, I., Fridland, O.Y., Aran, A., Frye, R.E. and Gurwitz, D. (2023) ‘Machine learning-based blood RNA signature for diagnosis of autism spectrum disorder’, International Journal of Molecular Sciences, 24(3), 2082. [CrossRef]
- Voinsky, I., Zoabi, Y., Shomron, N., Harel, M., Cassuto, H., Tam, J., Rose, S., Scheck, A.C., Karim, M.A., Frye, R.E., Aran, A. and Gurwitz, D. (2022) ‘Blood RNA sequencing indicates upregulated BATF2 and LY6E and downregulated ISG15 and MT2A expression in children with autism spectrum disorder’, International Journal of Molecular Sciences, 23(17), 9843. [CrossRef]
- He, Y., Zhou, Y., Ma, W., et al. (2019) ‘An integrated transcriptomic analysis of autism spectrum disorder’, Scientific Reports, 9, 11818. [CrossRef]
- Tomaiuolo, P., Piras, I.S., Sain, S.B., et al. (2023) ‘RNA sequencing of blood from sex- and age-matched discordant siblings supports immune and transcriptional dysregulation in autism spectrum disorder’, Scientific Reports, 13, 807. [CrossRef]
- Filosi, M., Kam-Thong, T., Essioux, L., et al., on behalf of the Italian Autism Network (Domenici, E.) (2020) ‘Transcriptome signatures from discordant sibling pairs reveal changes in peripheral blood immune cell composition in autism spectrum disorder’, Translational Psychiatry, 10, 106. [CrossRef]
- Bourgeron, T. (2015) ‘From the genetic architecture to synaptic plasticity in autism spectrum disorder’, Nature Reviews Neuroscience, 16(9), 551-563. [CrossRef]
- Parikshak, N.N., et al. (2016) ‘Genome-wide changes in lncRNA, splicing, and regional gene expression patterns in autism’, Nature, 540, 423-427. [CrossRef]
- Voineagu, I., et al. (2011) ‘Transcriptomic analysis of autistic brain reveals convergent molecular pathology’, Nature, 474, 380-384. [CrossRef]
- Romero-Garcia, R., et al. (2019) ‘Synaptic and transcriptionally downregulated genes are associated with cortical thickness differences in autism’, Molecular Psychiatry, 24(7), 1053-1064. [CrossRef]
- Li, X. (2024) ‘Unravelling the role of SHANK3 mutations in targeted therapies for autism spectrum disorders’, Discover Psychology, 4, 110. [CrossRef]
- Schwede, M., Nagpal, S., Gandal, M.J., Parikshak, N.N., Mirnics, K., Geschwind, D.H. and Morrow, E.M. (2018) ‘Strong correlation of downregulated genes related to synaptic transmission and mitochondria in post-mortem autism cerebral cortex’, Journal of Neurodevelopmental Disorders, 10(1), 19. [CrossRef]
- Li, H., Xu, Y., Li, W., Zhang, L., Zhang, X., Li, B., Chen, Y., Wang, X. and Zhu, C. (2023) ‘Novel insights into the immune cell landscape and gene signatures in autism spectrum disorder by bioinformatics and clinical analysis’, Frontiers in Immunology, 13, 1082950. [CrossRef]
- Horiuchi, F., Yoshino, Y., Kumon, H., Hosokawa, R., Nakachi, K., Kawabe, K., Iga, J.-I. & Ueno, S.-I. (2021). Identification of aberrant innate and adaptive immunity based on changes in global gene expression in the blood of adults with autism spectrum disorder. Journal of Neuroinflammation, 18, 102. [CrossRef]
- Wang, X., Xu, Q., Bey, A.L., Lee, Y. and Jiang, Y.-H. (2014) ‘Transcriptional and functional complexity of Shank3 provides a molecular framework to understand the phenotypic heterogeneity of SHANK3 causing autism and Shank3 mutant mice’, Molecular Autism, 5, 30. [CrossRef]
- Anitha, A., Nakamura, K., Thanseem, I., Matsuzaki, H., Miyachi, T., Yamada, K., (2012). Brain region-specific altered expression and association of mitochondria-related genes in autism. Molecular Autism, 3, 12. [CrossRef]
- Rossignol, D.A. & Frye, R.E. (2014). Evidence linking oxidative stress, mitochondrial dysfunction and inflammation in the brain of individuals with autism. Frontiers in Physiology, 5, 150. [CrossRef]
- Lebersfeld, J.B., Swanson, M., Clesi, C.D. & O’Kelley, S.E. (2021). Systematic review and meta-analysis of the clinical utility of the ADOS-2 and the ADI-R in diagnosing autism spectrum disorders in children. Journal of Autism and Developmental Disorders, 51(11), 4101-4114. [CrossRef]
- Yu, Y., Ozonoff, S. & Miller, M. (2023). Assessment of autism spectrum disorder. Assessment, 31(1), 24-41. [CrossRef]
- Wieckowski, A.T., Williams, L.N., Rando, J., Lyall, K. & Robins, D.L. (2023). Sensitivity and specificity of the Modified Checklist for Autism in Toddlers: A systematic review and meta-analysis. JAMA Pediatrics, 177(4), 373-383. [CrossRef]
- Robins, D.L., Casagrande, K., Barton, M., Chen, C.M.A., Dumont-Mathieu, T. & Fein, D. (2014). Validation of the Modified Checklist for Autism in Toddlers, Revised with Follow-up (M-CHAT-R/F). Pediatrics, 133(1), 37-45. [CrossRef]
- Moon, S.J., Hwang, J.S., Shin, A.L., Kim, J.Y., Bae, S.M., Sheehy-Knight, J. & Kim, J.W. (2019). Accuracy of the Childhood Autism Rating Scale: A systematic review and meta-analysis. Developmental Medicine & Child Neurology, 61(9), 1030-1038. [CrossRef]
- Santos, C.L.D., Barreto, I.I., Floriano, I., Tristão, L.S., Silvinato, A. & Bernardo, W.M. (2024). Screening and diagnostic tools for autism spectrum disorder: Systematic review and meta-analysis. Clinics, 79, 100323. [CrossRef]
- Yuen, T., Penner, M., Carter, M.T., Szatmari, P. & Ungar, W.J. (2018). Assessing the accuracy of the Modified Checklist for Autism in Toddlers: A systematic review and meta-analysis. Developmental Medicine & Child Neurology, 60(11), 1093-1100. [CrossRef]
- Maddox, B.B., Brodkin, E.S., Calkins, M.E., Shea, K., Mullan, K., Hostager, J., Mandell, D.S. & Miller, J.S. (2017). The accuracy of the ADOS-2 in identifying autism among adults with complex psychiatric conditions. Journal of Autism and Developmental Disorders, 47(9), 2703-2709. [CrossRef]
- Conesa, A., Madrigal, P., Tarazona, S., Gómez-Cabrero, D., Cervera, A., McPherson, A., (2016) ‘A survey of best practices for RNA-seq data analysis’, Genome Biology, 17, 13. [CrossRef]
- Rea, H.M., Øien, R.A., Shic, F., Webb, S.J. and Ratto, A.B. (2023) ‘Sex differences on the ADOS-2’, Journal of Autism and Developmental Disorders, 53(7), 2878-2890. [CrossRef]
- Hull, L., Petrides, K.V. and Mandy, W. (2020) ‘The female autism phenotype and camouflaging: a narrative review’, Review Journal of Autism and Developmental Disorders, 7, 306-321. [CrossRef]
- Pearson, A. and Rose, K. (2021) ‘A conceptual analysis of autistic masking: understanding the narrative of stigma and the illusion of choice’, Autism in Adulthood, 3(1), 21-29. [CrossRef]
- Stevanovic, D., et al. (2021) ‘Measurement invariance of the Childhood Autism Rating Scale across six countries: India, Jamaica, Mexico, Spain, Turkey and USA’, Autism Research. [CrossRef]
- Velmeshev, D., et al. (2019) ‘Single-nucleus RNA-seq identifies molecular changes in autism’, Science, 364(6436), 685-689. [CrossRef]
- Pardo-Palacios, F.J., Wang, D., Reese, F., Diekhans, M., Carbonell-Sala, S., Williams, B., et al. (2024) ‘Systematic assessment of long-read RNA-seq methods for transcript identification and quantification’, Nature Methods, 21(7), 1349-1363. [CrossRef]
- Lim, E.T., Chan, Y., Dawes, P., Guo, X., Erdin, S., Tai, D.J.C., et al. (2022) ‘Orgo-Seq integrates single-cell and bulk transcriptomic data to identify cell type-specific driver genes associated with autism spectrum disorder’, Nature Communications, 13, 3243. [CrossRef]
- Lu, X., Ni, P., Suarez-Meade, P., Ma, Y., Forrest, E.N., Wang, G., Wang, Y., Quiñones-Hinojosa, A., Gerstein, M. & Jiang, Y.-H. (2024) Transcriptional determinism and stochasticity contribute to the complexity of autism-associated SHANK family genes. Cell Reports, 43(7), 114376. [CrossRef]
- Erbescu, A., Papuc, S.M., Budisteanu, M., Arghir, A. & Neagu, M. (2022) Re-emerging concepts of immune dysregulation in autism spectrum disorders. Frontiers in Psychiatry, 13, 1006612. [CrossRef]
- Hamada, N., Ito, H., Nishijo, T., Iwamoto, I., Morishita, R., Tabata, H., Momiyama, T. & Nagata, K.-I. (2016) Essential role of the nuclear isoform of RBFOX1, a candidate gene for autism spectrum disorders, in brain development. Scientific Reports, 6, 30805. [CrossRef]
- Huang, K., Wu, Y., Shin, J., Zheng, Y., Siahpirani, A.F., Lin, Y., Ni, Z., Chen, J., You, J., Keleş, S., Wang, D., Roy, S. & Lu, Q. (2021) Transcriptome-wide transmission disequilibrium analysis identifies novel risk genes for autism spectrum disorder. PLOS Genetics, 17(2), e1009309. [CrossRef]
- Gora, C., Dudas, A., Vaugrente, O., Drobecq, L., Pecnard, E., Lefort, G. & Pellissier, L.P. (2024) Deciphering autism heterogeneity: A molecular stratification approach in four mouse models. Translational Psychiatry, 14, 416. [CrossRef]
- Hicks, S.D., Rajan, A.T., Wagner, K.E., Barns, S., Carpenter, R.L. & Middleton, F.A. (2018) Validation of a salivary RNA test for childhood autism spectrum disorder. Frontiers in Genetics, 9, 534. [CrossRef]
- Glatt, S.J., Tsuang, M.T., Winn, M., Chandler, S.D., Collins, M., Lopez, L., Weinfeld, M., Carter, C., Schork, N., Pierce, K. & Courchesne, E. (2012) Blood-based gene expression signatures of infants and toddlers with autism. Journal of the American Academy of Child & Adolescent Psychiatry, 51(9), 934-944.e2. [CrossRef]
- Varma, S. & Simon, R. (2006) Bias in error estimation when using cross-validation for model selection. BMC Bioinformatics, 7, 91. [CrossRef]
- Cohen, J.F., Korevaar, D.A., Altman, D.G., Bruns, D.E., Gatsonis, C.A., Hooft, L., et al. (2016) STARD 2015 guidelines for reporting diagnostic accuracy studies: Explanation and elaboration. BMJ Open, 6(11), e012799. [CrossRef]
- Sprang, M., Andrade-Navarro, M.A. & Fontaine, J.-F. (2022) Batch effect detection and correction in RNA-seq data using machine-learning-based automated assessment of quality. BMC Bioinformatics, 23(Suppl 6), 279. [CrossRef]
- Sosina, O.A., Tran, M.N., Maynard, K.R., Tao, R., Taub, M.A., Martinowich, K., Semick, S.A., et al. (2021) Strategies for cellular deconvolution in human brain RNA sequencing data [version 1, peer review: 1 approved, 1 approved with reservations]. F1000Research, 10, 750. [CrossRef]
- European Union. (2016) Regulation (EU) 2016/679 (General Data Protection Regulation). Official Journal of the European Union, L119, 1-88 (04 May 2016). Available at: https://eur-lex.europa.eu/legal-content/EN/TXT/PDF/?uri=CELEX:32016R0679 (esp. Art. 5, Art. 89).
- McPartland, J.C., Bernier, R.A., Jeste, S.S., Dawson, G., Nelson, C.A., Chawarska, K., … ABC-CT Consortium. (2020) The Autism Biomarkers Consortium for Clinical Trials (ABC-CT): Scientific context, study design, and progress toward biomarker qualification. Frontiers in Integrative Neuroscience, 14, 16. [CrossRef]
- Frye, R.E., Vassall, S., Kaur, G., Lewis, C., Karim, M. & Rossignol, D. (2019) Emerging biomarkers in autism spectrum disorder: A systematic review. Annals of Translational Medicine, 7(23), 792. [CrossRef]
- Weymann, D., Buckell, J., Fahr, P., Loewen, R., Ehman, M., Pollard, S., et al. (2024) Health care costs after genome-wide sequencing for children with rare diseases in England and Canada. JAMA Network Open, 7(7), e2420842. [CrossRef]
- Beck, K.B., MacKenzie, K.T., Kirby, A.V., McDonald, K., Moura, I., Breitenfeldt, K., et al., WIRE Consortium. (2025) Guidelines for the creation of accessible consent materials and procedures: Lessons from research with autistic people and people with intellectual disability. Autism in Adulthood (advance online publication). [CrossRef]
- Ament, I.H., DeBruyne, N., Wang, F. & Lin, L. (2025) Long-read RNA sequencing: A transformative technology for exploring transcriptome complexity in human diseases. Molecular Therapy, 33(3), 883-894. [CrossRef]
- Bossuyt PMM, Reitsma JB, Bruns DE, Gatsonis CA, Glasziou PP, Irwig L, et al. (2015) STARD 2015: An updated list of essential items for reporting diagnostic accuracy studies. BMJ 351: h5527. [CrossRef]

Table 1.
Diagnostic accuracy of behavioral instruments for ASD (data from meta-analyses and validation studies).
Table 1.
Diagnostic accuracy of behavioral instruments for ASD (data from meta-analyses and validation studies).
| Instrument | Sample / design | Sensitivity | Specificity | Source |
| ADOS-2 | Systematic review and HSROC meta-analysis, 22 studies | 0.89-0.92 | 0.81-0.85 | Lebersfeld et al., 2021 |
| ADI-R | Systematic review and meta-analysis | ~0.75 | ~0.82 | Lebersfeld et al., 2021 |
| ADOS-2 + ADI-R (combined) | Clinical studies (ranges reported from clinical series, not a meta-analysis) | 0.70-0.98 | 0.80-0.96 | Lebersfeld et al., 2021 |
| M-CHAT-R/F | Systematic review and meta-analysis: 50 studies (51 samples) | 0.83 (95% CI: 0.77-0.88) | 0.94 (95% CI: 0.89-0.97) | Wieckowski et al., 2023 |
| M-CHAT-R/F (two-step protocol) | Prospective study, >16,000 children (16-30 months) | 0.833 (95% CI: 0.73-0.93) | 0.992 (95% CI: 0.98-0.99) | Robins et al., 2014 |
| M-CHAT-R/F (independent meta-analysis) | Independent systematic review | 0.78 (95% CI: 57-91%) | 0.98 (95% CI: 88-100%) | Santos et al., 2024 |
| CARS / CARS-2 | Systematic review (n = 4,433) | 0.71-0.86 | 0.75-0.79 | Moon et al., 2019 |
| CARS-2ST (validation) | 237 children, 2-12 years, ROC analysis relative to ADOS-2 | Optimal cut-offs: 30 (autism), 28.5 (ASD) | Sensitivity: 98.9% (Autism, 30.25), 94.9% (Autism + ASD, 28.25) Specificity: 86.1% (Autism, 30.25), 100% (Autism + ASD, 28.25). |
Ji et al., 2023 |
Note: Sensitivity and specificity estimates are derived from different samples and methodologies, which limits their direct comparison. ADOS-2 and ADI-R demonstrate high accuracy in research settings, but performance may decrease in routine clinical practice. For M-CHAT-R/F, the use of a two-step screening protocol with a follow-up interview substantially affects performance.
Table 2.
Comparison of transcriptomic technologies for the diagnosis of ASD in children.
| Method | Material | Cell res. | Cost | Complexity | Pediatric suitability | Primary use case | Notes / Key sources |
|---|---|---|---|---|---|---|---|
| Bulk RNA-seq | B/T | - | ↑ | ↑ | ✓ | DE genes, pathway enrichment | Requires cell-composition adjustment*, classic overview: Wang, Gerstein & Snyder (2009). |
| sc/snRNA-seq | T/Org | ++ | ↑↑ | ↑↑ | △ | Cell-type attribution, signatures | Sensitive to tissue/nuclei quality, Velmeshev et al. (2019) (ASD cortex). Integration with bulk**. |
| Long-read RNA-seq (PacBio/ONT) | B/T | + | ↑↑ | ↑ | △ | Isoforms, complex splicing | Most suitable as targeted post hoc after short-read***, Pardo-Palacios et al. (2024), Ament et al. (2025). |
| Saliva small RNAs | S | - | - | - | ✓ | Add-on after behavioral screening | 32-feature small-RNA panel, AUC ≈ 0.88 in children, Hicks et al. (2018). See M-CHAT-R/F: Robins et al. (2014). |
Legend. Material: B = blood, T = tissue, S = saliva, Org = cerebral organoids. Cell res.: cell-type resolution (- / + / ++). Cost/Complexity: relative burden (↑ / ↑↑). Pediatric suitability: (✓ suitable, △ limited/conditional).* Deconvolution or covariate regression (e.g., leukocyte fractions). ** Bulk-single-cell integration (including Org-Seq) to prioritize cell-type drivers: Lim et al. (2022). *** Lower depth and inter-platform variability, recommended after short-read gene prioritization.
Table 3.
Axes and candidate transcriptomic markers in ASD: study context, methods, key effects, metrics, and sources.
Table 3.
Axes and candidate transcriptomic markers in ASD: study context, methods, key effects, metrics, and sources.
| Axis | Marker / panel | Context / level | Method | Key effect | Metric | Source |
|---|---|---|---|---|---|---|
| Transcriptomics / splicing (RBFOX1/A2BP1) | GRIN1 (NR1) | Postmortem cortex (frontal/temporal), H | RNA-seq, A2BP1 motif/positional-rule search, RT-PCR validation | Among top A2BP1-dependent DS events, annotated as synaptogenesis-related protein | A2BP1 motifs: p = 1.09×10⁻⁷, RT-PCR: ≈85% of targets confirmed (incl. GRIN1) | Voineagu et al., 2011 |
| Transcriptomics / splicing (RBFOX1/A2BP1) | CAMK2G (CaMKIIγ) | Postmortem cortex, H | RNA-seq, A2BP1 motif analysis, RT-PCR | Among top predicted A2BP1-dependent DS events, maps to neural module M12 | A2BP1 motifs: p = 1.09×10⁻⁷, RT-PCR: ≈85% of targets confirmed | Voineagu et al., 2011 |
| Transcriptomics / splicing (RBFOX1/A2BP1) | NRCAM | Postmortem cortex, H | RNA-seq, A2BP1 motif analysis, RT-PCR | Among top predicted A2BP1-dependent DS events, synaptogenesis-related protein | A2BP1 motifs: p = 1.09×10⁻⁷, RT-PCR: ≈85% of targets confirmed | Voineagu et al., 2011 |
| Transcriptomics / splicing (DTU) | ANK2 (isoform ANK2-013) | Postnatal frontal/temporal cortex, H (PsychENCODE) | Bulk RNA-seq, DTU (isoform level), co-expression & disease-specific PPI | ANK2-013 ↑ in ASD (DTU FDR < 0.05), co-expression network links with NRCAM, SCN4B, TAF9 | DTU FDR < 0.05 | Gandal et al., 2018 |
| Synapse | SHANK3 | Postmortem cortex, H | cDNA-capture + long-read RNA-seq | Region-specific differences of SHANK3 transcripts in ASD cortex | NR | Lu et al., 2024 |
| Immune-glial | IL-6, TNF-α | Plasma, postmortem cortex, H | Evidence synthesis (ELISA/IHC/expression studies) | Neuroinflammatory activation | NR | Erbescu et al., 2022 |
| Immune-glial / peripheral immunity | NMUR1, HMGB3, PTPRN2 | Peripheral blood, children, M | RNA-seq + xCell/CIBERSORT, WGCNA | ↓ NK signature, markers persist after adjusting for cell composition, some signals at trend level | FDR < 0.25 | Filosi et al., 2020 |
| Transcriptomics / splicing | RBFOX1 (nuclear isoform, iso1) | Preclinical-mouse, P | In utero shRNA knockdown, time-lapse migration, morphometry | Defects in radial migration and terminal translocation, ↓ axonal growth and dendritic arborization | NR | Hamada et al., 2016 |
| Transcriptional regulation | POU3F2 | Brain-integrative, H | TWAS/TITANS + fetal Hi-C + spatiotemporal expression + TFBS-LDSC | “Master regulator” targets enriched for ASD genes and LoF-DNMs, TFBS explain part of ASD heritability | TFBS h² = 11.7% (5.3×, p = 0.054), ASD-target enrichment 2.1-2.68× (p ≤ 0.012) | Huang et al., 2021 |
| Neuromodulation / behavior | Egr1, Foxp1, Homer1a, Oxt, Oxtr | Preclinical-mouse (4 ASD models), P | RT-qPCR, modular stratification, correlation with behavioral metrics | Expression panel separating models along socio-behavioral and neuroendocrine (OXT-system) axes | NR | Gora et al., 2024 |
Abbreviations. H = human, M = pediatric (children), P = preclinical (mouse). DS = differential splicing, DTU = differential transcript usage, WGCNA = weighted gene co-expression network analysis, PPI = protein-protein interaction, NR = not reported.
Disclaimer/Publisher’s Note: The statements, opinions and data contained in all publications are solely those of the individual author(s) and contributor(s) and not of MDPI and/or the editor(s). MDPI and/or the editor(s) disclaim responsibility for any injury to people or property resulting from any ideas, methods, instructions or products referred to in the content. |
© 2026 by the authors. Licensee MDPI, Basel, Switzerland. This article is an open access article distributed under the terms and conditions of the Creative Commons Attribution (CC BY) license (http://creativecommons.org/licenses/by/4.0/).
Copyright: This open access article is published under a Creative Commons CC BY 4.0 license, which permit the free download, distribution, and reuse, provided that the author and preprint are cited in any reuse.


