
Submitted:
23 February 2026
Posted:
26 February 2026
You are already at the latest version
Abstract
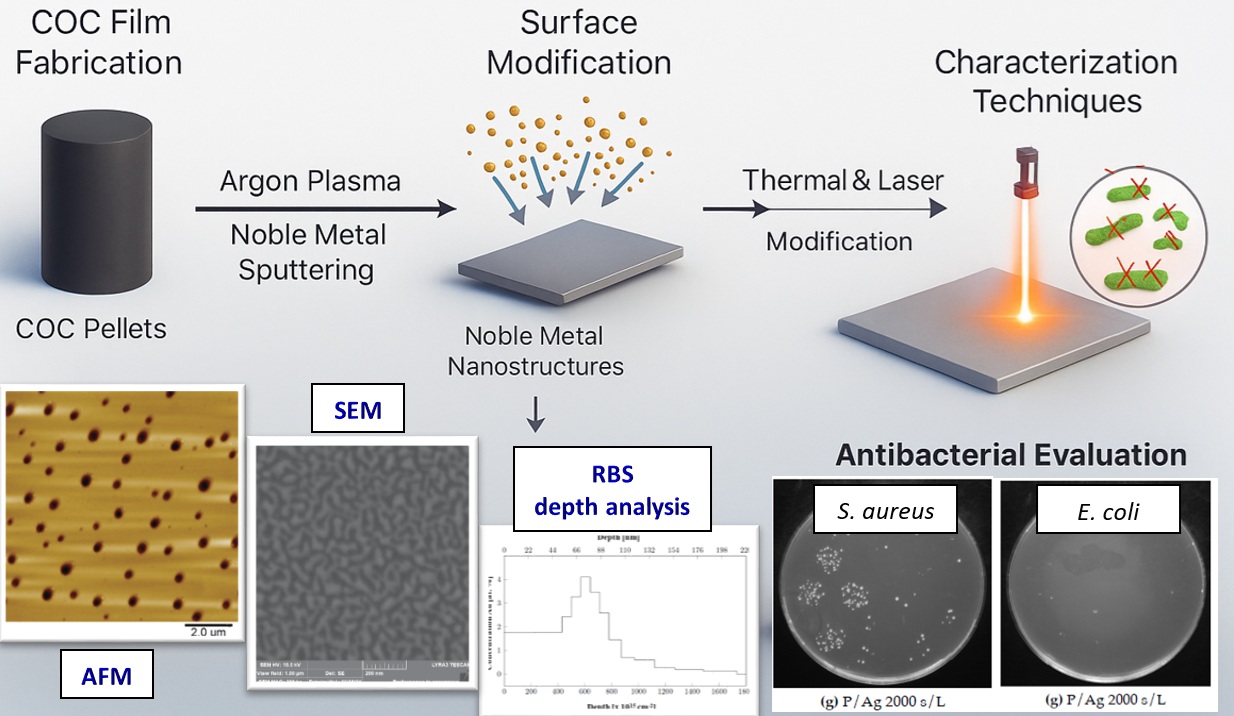
The work is aimed on the application of the solvent casting method of cyclic olefin co-polymer TOPAS® for the preparation of thin films. Noble metal nanostructures deposited on cyclic olefin copolymer (COC) substrates offer a versatile platform for advanced appli-cations due to their unique optical, catalytic, and biocompatible properties. The integra-tion of nanostructures with COC combines excellent chemical resistance, optical trans-parency, and ease of microfabrication with the plasmonic and catalytic functionality of noble metals. Such hybrid systems are promising for use in biosensing, photonic devices, and surface-enhanced spectroscopies. The COC films have been modified by argon plas-ma and subsequently sputtered with noble metals. After thermal and laser modification, Au films show antibacterial properties against gram-negative Escherichia coli and Ag layers act bactericidally for both gram-negative Escherichia coli and gram-positive Staph-ylococcus aureus. Samples were examined by AFM, DSC, RBS, SEM and TGA during preparation and their roughness and water wettability was determined. The results point to a functional modification of the pharmaceutical packaging material used so far, which in connection with the expanding resistance of bacteria to antibiotic treatment is a prom-ising path for material development.
Keywords:
polymer
; cyclic olefin
; composites
; surface morphology
; nanostructure
; antibacterial properties
1. Introduction
Cyclic olefin copolymer, abbreviated COC, refers to a polymer based on two monomers: 2-norbornene and ethene, also ethylene). This composition applies to the TOPAS® polymer (abbreviation for thermoplastic amorphous polymer [1]). A different selection of monomers for copolymerization is provided by COC, which is based on ethene and tetracyclododecene [2]. A third category within the group of cyclic olefin polymers (COP) is the preparation by metathesis polymerization of various cyclic monomers followed by hydrogenation. This is used in the production of polymers sold under the ARTON brand by Japan Synthetic Rubber and also under the trade names Zeonex and Zeonor by ZEON Corporation [2]. The synthesis of cyclic olefin copolymers (COC) and polymers (COP) is carried out from the starting monomers norborene or tetracyclododecene, in the case of copolymerization with ethylene the output product is COC, in contrast, the synthesis of COP is based on homopolymerization. For the preparation of homopolymers, the polymerization is carried out from a cyclic monomer without other starting materials by the ring opening polymerization (ROP) mechanism, as indicated [3]. Although COC is an advanced material in terms of chemical resistance, transparency, etc., it is not resistant to UV radiation and cannot be used outdoors without the addition of stabilizers that absorb UV radiation and prevent degradation of the polymer matrix [3]. M. Gutiérrez-Villarreal et al. [4] studied the degradation of extruded 25 μm films of COC of both types (norbornene and tetracyclododecene) under 340 nm UV radiation in an accelerated climate chamber. An indisputable advantage of cyclic olefin copolymer is the greater number of applicable sterilization options [3]. Cyclic olefin copolymers are characterized by a higher glass transition temperature compared to pure olefin polymers. Structural differences between ethylene units and norbornene/tetracyclododecene causes, in addition to an increased glass transition point, the preservation of the amorphous state of the solid polymer. The change in structure also causes low thermal expansion, low moisture absorption, high visible and UV light transmittance, and low birefringence [1].
The most common applications of COC include microfluidics, packaging, electronics and optics. Microfluidics is a field working with fluids on a micro-scale in the range of tens of micrometers and represents the potential for miniaturization of the fields of chemistry, biology, physics and medicine [5]. Preparation channels and microfluidic “apparatus” from polymer materials can be carried out by the following processes [6]. Bischoff et al. [7] prepared a 200 μm deep microstructure on COC polymer from 1.5 mm thick COC TOPAS® 6017S films using overlapping discharges of a femtosecond 353 nm laser and at the same time showed the effect of beam focusing, where a defocused laser produces a rough structure on the mixer surface from powers of 4 J cm−2 compared to a focused beam. Guan et al. [8] investigated the differences in the application of PMMA and COC type TOPAS in the injection molding production of micropillar arrays with a diameter of 250 μm and a height of 600 μm for microfluidic applications and proved that COC has better flow properties compared to commonly used PMMA, thus better replicating the mold nanostructure. The advantageous chemical resistance of cyclic copolymers is used in the preparation of electro technical components such as single-layer transistors from the compound MoS2 [9]. 5 nm thin films of COC were applied to the layers of silicon dioxide, which reduce the density of electron traps by a factor of 5. These are the places that, by capturing flowing electrons, cause unreliability and errors in calculations when using silicon integrated circuits and latency in signal detection [9]. In the packaging industry, an important property of COC, low moisture permeability, comes into application. M. Cutroneo et al. [10] investigated 10 μm COC films with laser-deposited 100 nm aluminium layers for packaging differentiation and a slight reduction in light transmittance to ensure a longer shelf life of food [10]. The disadvantage of using COC in packaging is its non-biodegradable nature and non-renewable raw material, which are in great demand today. Alternatives remain polylactic acid, polyhydroxyalkanoates, polybutylene succinate and polycaprolactone [11].
Cyclic olefin copolymers also find application in the field of capacitor dielectrics, for example in hybrid vehicles. Z. Bao et al. [12] described the exceptional dielectric properties of COC films exposed to UV radiation in electrical capacitor applications under cyclic loading at 150 °C. Significant results with an energy charge density of 3.34 J cm−3 at a high voltage were explained by the formation of carbonyl groups during the degradation of the TOPAS® 6017-S copolymer matrix and the simultaneous crosslinking of the copolymer chains. The equilibrium and maximum value of crosslinking are also described when exposed to UV radiation for 10 minutes; with longer exposure, the material is significantly degraded and the strength decreases [12]. COC is used as the primary packaging for drugs in the pharmaceutical industry. Drug preparations in disposable prefilled syringes made of COC are described, highlighting the properties of high optical transparency and surface barrier properties comparable to glass, which as a packaging material in the field of prefilled syringes plays a major role [13]. COC is also used in the plastic part of blister packs. Compared to the frequently used polyvinyl chloride (PVC), COC is a good alternative with better optical properties, where, in contrast to PVC, it does not lose its colour over time and at the same time has 10 times better barrier properties against moisture [14]. There were published several approaches how to influence the surface morphology and chemistry by either plasma activation techniques [15,16], carbon based modification [17,18,19], laser treatment [20,21,22] or grafting of biologically active substances [23,24].
However, so far none of these approaches have been used for any interaction with cyclic olefin copolymers (COC), also their cytocompatibility or antibacterial properties induced by above introduced surface modification techniques have not been published so far, to our best knowledge. Some of the recently published papers were aimed on the modification with plasma techniques, or with sputtering of thin metal nanolayers, but with no subsequent treatment. We have aimed on the preparation of thin COC topas films, while subsequently were these film treated by plasma and deposited with thin silver and gold nanolayers. For the increase of the homogeneity and formation of COC-noble metal bilayer were have applied heat treatment to selected metallized samples. The detailed analysis of the physico chemical properties was realized. Finally, the selected structures were used for antibacterial testing against G- and G+ bacteria.
2. Results and Discussion
2.1. Thickness and Homogeneity of COC Films
Using gravimetry, the statistics of the real thickness of the films were determined on 20 randomly selected samples of pristine COC film from a series of “100 μm” thickness. The measurements gave an average film thickness of 86 μm. This thickness was used in the series of next experiments, and revealed the most optimal mechanic properties. Films prepared by the solvent casting method often have a surface structured with randomly placed “nanoholes”, which correspond to traces of escaping solvent nanobubbles, as shown in Figure 1 (a) plasma-modified COC film and Figure 1 (b) film after plasma modification and Ag deposition. These surface imperfections are present on pristine film, plasma-exposed film and film with deposited metal layers.
2.2. Thickness of Deposited Layers
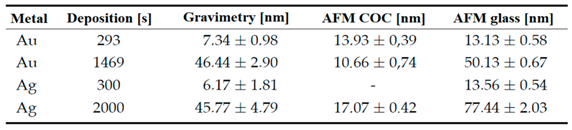
Among the parameters investigated for the prepared metal layers on copolymer films was the thickness of the deposited layer. The deposition times for the gold layers were based on a previously performed analysis of the sputtering rate on glass surfaces with the same current of 20 mA. The sputtering times for the silver layers were determined by comparing the parameters of the calibration curves of gold and silver with the aim of creating similarly high layers. The layer thicknesses were then determined simultaneously gravimetrically and by AFM analysis, including a comparison of the thicknesses of the deposited layers of noble metals on the glass substrate. Further we will mark samples in the work are marked with the deposition time, e.g. the sample P/Au 293 s/T was plasma modified, then the Au layer was deposited for 293 s and then thermally stressed.
Determination of the layer height using AFM (deposition through a mask and detection of the deposited metal-polymer interface) on COC shows a lower thickness on longer deposited Au and Ag samples compared to gravimetric analysis. We did not expect that, and therefore we have realized elemental analysis based on Rutherford backscattering spectroscopy. We wanted to determine, if there is a possibility of incorporation of noble metal atoms into the COC foil. This phenomenon have been confirmed, thus the thickness difference between nanolayer and glass can be contributed to the sputtering process, where the particles penetrate into the volume. This is an important result, even was not anticipated or planned in our research. Similar differences were observed e. g. for deposition of noble metals onto perfluorinated substrates between pristine and plasma modified [25]. However, this incorporation into the bulk directly, for energies significantly lower than usually used for ion implantation [26] surprised us, but the results RBS analysis in Figure 2 on a COC foil with Au deposited for 219 s showed the clear depth profile of the deposited layer, where the implantation of Au particles under the foil surface occurs with a maximum at a depth of 70 nm. Due to this, the measurable COC-metal interface is evidently lower. The sputtering results in enhanced sub-surface layer, where maximum of noble metal concentration is achieved not on the very surface, but in the depth approximately 70 nm. The deposited noble metal layers were also analyzed by EDS analysis. The results presented in Table 1 show higher noble metal contents in samples with longer deposition times of 1469 s for Au particles and 2000 s for Ag particles. The EDS method confirmed the presence of residual Cl resulting from the implemented solvent casting method.
2.3. Wettability
In the literature, S. Roy et al. [27] describes the continuous effect of the change in surface wettability after plasma modification of COC films. According to his results, within a few days after modification, the initial effect of the reaction of the formed radicals on and below the film surface with oxygen in the atmosphere takes effect and at the same time the formed polar groups are gradually rotated into the bulk of the materials and thus their effect on the wettability of the material is lost [27]. Contact angle measurements were performed for samples before thermal stress, because as is evident from the literature, the contact angle is time-varying after plasma modification or subsequent thermal stress [15,16]. Measurements immediately after modification show that the cyclic olefin copolymer after plasma modification at 8 W for 240 s increases the hydrophilicity of its surface with a resulting contact angle of 20.6 ± 2.2° compared to the primarily aged pristine COC film with a contact angle of 82.3 ± 3.9° in Figure 3.
This is due to the reorganization of the surface bonds of the copolymer that occurs during the plasma modification, mainly due to the increase in the content of radicals on the surface and the subsequent formation of e.g. carbonyl or carboxyl groups. The incorporation of oxygen atoms into the plasma modified surface, as described by F. Dawaymeh et al. [28], takes place. The increase in hydrophilicity is caused by the direct reaction of radicals from the surface of the material with residual air during the plasma modification and at the same time directly after the modification. Another possible effect that was not studied here is the continued increase in the oxygen content on the surface for 30 days due to the presence of radicals on the surface and in the subsurface layers of the COC, as described by S. Roy et al. [27].
A change in wettability is observable on the samples, with the minimum being reached by the samples after plasma modification, where the contact angle was measured immediately after exposure to argon plasma with a power of 8 W for 240 s. In the case of gold and silver layers, the surface achieves a lower wettability than the plasma-modified polymer, but higher than the pristine foil. After thermal stress, as can be seen in Figure 3, the contact angle is comparable to the pristine foil for all samples, except for the gold layer deposited for 1469 s. During thermal stress, the effect of polar groups on the polymer surface decreases, which is more pronounced only for the gold layer deposited for 293 s, and at the same time, the organization of metal particles on the foil surface changes. After exposure of the samples to a laser discharge with an energy of 250 mJ cm−2, the dispersion of the contact angle values increased in the case of samples with a deposited Au layer, with a slight decrease in the value to 72.4 ± 12.4°, while in the case of the silver layer, the contact angle increased to 108.0 ± 3.1º after laser modification.
2.4. Surface Morphology
All stages of preparation of deposited noble metal layers on cyclic olefin copolymer films were studied by atomic force microscopy, but firstly we analyzed plasma treated COC samples. A significantly altered surface morphology induced by plasma modification is visible. The COC surface after exposure to 8 W argon plasma for 240 s shows a rough structure of sharp peaks with a surface roughness higher than that of the original film, namely Ra = 0.80 nm compared to the pristine film with Ra = 0.24 nm, as shown in Figure 4.
In comparison with the literature, where S. Roy et al. [71] worked with COC type TOPAS® 6015 in argon plasma of higher than power 100 W. The roughness achieved in this work is Ra 5.8 nm after exposure to 8 W for 240 s when measured on AFM images with an area of 10 x 10 μm2. The differences result in a significant dependence of the surface roughness on the performance of the plasma modification. This is due to the nature of both processes, where the surface roughness depends on the energy required to change the arrangement of bonds on the polymer surface, while the polarity of the surface depends on the available oxygen and at the same time the amount of radicals, whose reaction with air (oxygen) subsequently creates polar groups.
Gold Layer
After sputtering gold layers onto the plasma-modified surface, an increase in the surface roughness value Ra = nm was observed. In the case of a gold layer deposited for 293 s, the increase in roughness from plasma-treated COC at Ra = 0.80 nm is initially moderate to Ra = 1.26 nm as illustrated in the graph in Figure 7. After thermal stress at 100 °C for 100 min, the increase is significant to Ra = 2.69 nm. Gold layers deposited for 1469 s are subject to a smaller degree of roughness change under thermal stress as illustrated in Figure 5. A plasma-modified foil with a roughness of Ra = 0.80 nm after deposition of the gold layer has a comparable Ra = 0.81 nm. Thermal modification increases the roughness to Ra = 1.68 nm, while modification with a KrF 250 mJ cm−2 laser beam has a significant impact on the growth of the roughness, which increases to Ra = 8.02 nm.
The difference caused by thermal stress of the film with the deposited layer is visible in the AFM images in Figure 6, where nanostructures induced by plasma modification are visible on the film before stressing, and Au nanopattern is visible after Au deposition, the globular shape of the structures is better visible in the 3D inset. The effect of changing the morphology of the gold surface after thermal stress on another substrate, glass plates, was studied by A. Schaub et al. [29] who described an increase in surface roughness accompanied by the formation of a globular structure for different thicknesses of gold layers, where the most pronounced increase is shown by an 18 nm layer of gold particles. The change in morphology is explained by local melting of gold nanoparticles. F. Font and T. G. Myers [30] describe a theory explaining experimental data illustrating a decrease in the melting temperature of gold nanoparticles as a function of their diameter. The described data show a decrease in temperature to 300 K at a gold nanoparticle size of 1 nm [30]. This theory would be applicable in the case that the morphology of the gold layer on the surface of the foils is formed by aggregates of gold nanoparticles, while diffusion on the copolymer surface is realized, facilitating the conglomeration of particles.
COC deposited with a thicker Au layer (1469 s) also changes the surface morphology after thermal stress: thermal modification increases the diameter of clusters with a lower degree of fragmentation as shown in Figure 7 and in Figure 8 for 293 s. The results clearly show the influence of the Au layer thickness on its roughness. On layers deposited for 293 s, the clusters are initially separated, and with a longer deposition time, greater interconnection occurs, which reduces the fragmentation of the layer. For a description Au layer deposition and nucleation process, it is worth mentioning the study by M. Schwartzkopf et al. [31] describing the influence of the deposition rate on its parameters, however, in this work, the deposition rate is the same for all layer thicknesses and the formation of a continuous layer should therefore occur after similar deposition time. A change in surface morphology also occurs when the Au nanolayer (1469 s) on the COC is exposed to a KrF laser beam with a KrF energy of 250 mJ cm−2, as shown in Figure 7. This exposure leads to an increase in surface roughness to Ra = 8.02 nm.
Nanoclusters on the surface exhibit a more spherical character and lower size dispersion compared to a thermally stressed layer of the same thickness. This is due to higher energies in the form of local temperature at the moment of laser beam incidence, which allows changes in the organization of nanoclusters. A change in surface chemistry upon exposure to a high-energy beam may also have an effect, which affects the affinity of Au for the COC surface. In contrast, thermal modification has less potential to change the organization and chemistry of the surface. The phenomenon of the formation of more spherical clusters [32] of larger size after exposure to an excimer laser is similar to the experiments of D. Q. Yang et al. [33], which directly described the increase in size and decrease in its dispersion in gold nanoparticles on the surface of silicon substrates after exposure to an excimer laser. In our system, the resulting morphology is undoubtedly influenced by the polymer used, as well as the fact that even by simple deposition, Au atoms are incorporated into the polymer volume, as was found by the RBS method, the results introduced in Figure 2. The aforementioned study [33] also classifies the character of nanoparticles depending on the accumulated energy as the sum of individual pulses of a 248 nm laser with an energy of 20 mJ cm−2, demonstrating the dependence on the available energy.
Silver Layer
Deposition of silver layers from R = 6.8 nm of the layer deposited for 300 s to Ra = 4.1 nm at 2000 s deposition. During thermal stress, similarly to gold layers, the surface roughness increases (in Figure 9 and Figure 10) by changing the arrangement of nanoclusters into units of larger surface cross-section, as can be seen in Figure 10. In terms of shape changes, thermal stress leads to the formation of globular structures in the order of tens of nm, thus highlighting the nanostructure present after metal deposition.
In the case of silver layers deposited for 2000 s, the effect of agglomeration of Ag nanoparticles into larger clusters after thermal stress is again visible, the roughness increased from Ra = 4.13 nm to Ra = 7.27 nm. The key role in the change in surface morphology is played by the increased diffusivity of nanoparticles into the polymer surface. In the case of energy supply by exposure to a KrF laser beam with an energy of 250 mJ cm−2, there is a significant increase in the surface roughness Ra = 17.80 nm accompanied by a change in the shape of the particles into segmented globular agglomerates.
2.5. Antibacterial Properties
Antibacterial tests against G+ and G- bacteria were performed on the prepared samples after plasma, thermal or laser modification. The results after 2 hours of cultivation did not indicate any significant effect. In comparison with the preparation of silver layers on the surface of polydimethylsiloxane (PDMS), where antibacterial activity of silver layers prepared without subsequent thermal stress occurred after 1 hour of cultivation, the layers on COC are probably subject to a lower release rate indicating a higher integration of silver particles into the surface and volume of the copolymer, as shown by RBS analysis.
After one day of cultivation, silver layers of all thicknesses exhibit significant antibacterial properties with a decrease in the number of colony forming units (CFU) from 425 ± 15 in the control, respectively 575 ± 80 pristine COC to 0 in the case of Escherichia coli, see Figure 11. In the case of Staphylococcus aureus, significant antibacterial activity is also demonstrated with a decrease in CFU from 674 ± 47 control, respectively 575 ± 80 pristine COC to values below 100 CFU, see Figure 11.
The different modes of synthesizing silver nanoparticles (AgNPs) from their elemental state to particle format and their mechanism of action against multidrug-resistant and biofilm-forming bacterial pathogens was presented by Galdiero et al. [36], various studies have demonstrated that the AgNPs cause oxidative stress, protein dysfunction, membrane disruption, and DNA damage in bacteria, ultimately leading to bacterial death. Differences in chemical composition and stress behavior between COC and PDMS may explain the negligible difference in thermal and laser stress on the antibacterial properties of the surfaces. The increase in surface roughness after exposure to argon plasma to Ra = 2.20 nm contributes to the increase in antibacterial properties of samples without deposited metals compared to the pristine COC film with a surface roughness of Ra = 0.24 nm. In the case of E. coli, the decrease in CFU after cultivation is 269 ± 45 (Figure 11), in Staphylococcus aureus 206 ± 122 CFU (Figure 12).
In contrast, gold surface have had minimal effect on the activity of the gram-positive bacterium Staphylococcus aureus with comparable potency as pristine foils. The difference in potency of Au and Ag particles arises from the differences in the structure of the cell wall of G+ and G- bacteria, where a thinner layer of peptidoglycans makes gram-negative bacteria less resistant, and from a different mechanism of action of Au and Ag nanoparticles [37,38]. Images of Petri dishes with cultured inoculum drops after incubation with samples are in Figure 13 and Figure 14.
3. Materials and Methods
3.1. Materials and Modification
The cycloolefin copolymer TOPAS® 5013L-10 was used, supplied in the form of granules by TOPAS® Advanced Polymers GmbH, Raunheim, Germany. The COC produced by TOPAS® is of the ethylene-norbornene type (CAS 26007-43-2). Chloroform stabilized with amylene p.a. (CAS 67-66-3) from Penta s.r.o., Prague, Czech Republic was used for layer casting. Layer preparations using toluene p.a. were also carried out from material from Penta.
3.2. Solvent Casting
In the sample preparation process, the parameters for the “optimal” (homogeneous and uniform) foil casting were first investigated. Round Petri dishes with an inner diameter of 9 cm and an area of 63.6 cm2 were used as molds. From the determination of the density of the COC copolymer of 1.020 g cm−3 [39] and the target layer thickness, the required granulate weight for dissolution was calculated according to equation involving COC granulate weight, Petri dish diameter, layer thickness and COC density. The weight distribution of the delivered TOPAS® 5013L-10 granules is shown in Figure 15. The measurement was carried out on a random sample of 100 granules gravimetrically.
After weighing the batches, a 150 ml Erlenmeyer flask with a magnetic stirrer and 10 ml chloroform was prepared on a magnetic stirrer. COC granules were transferred to the chloroform through a funnel, the funnel was replaced with a stopper and the contents were stirred for 2 hours at a speed of 700 rpm at laboratory temperature. For the last 10 minutes of stirring, the speed was reduced to 100 rpm to stop the mixing of bubbles into the solution and at the same time to allow the bubbles already mixed in to leave the solution. This step is very important, because the viscosity of the copolymer solution after pouring with the mixed bubbles prevents their release.
The Petri dish into which one batch of copolymer was transferred was firstly cleaned with chloroform and a paper towel to prevent contamination of the bottom layer. No release agent was applied to the surface of the glass dish. The polymer films adhere well to the glass, are poured without forming irregularities, and after sufficient hardening, they can be easily separated from the Petri dish with tweezers. After pouring, the solvent was evaporated on a flat laboratory table at room temperature and normal humidity. Since moisture absorption is not known for the COC copolymer and the main influence on the material properties is the residual chloroform content, the humidity was not monitored during the experiments. After “drying”, the layer from the glass Petri dish was transferred to a polystyrene one and cut into quarter-circular or semi-circular sections for further experiments. Initial experiments and preparations of thin metal layers were carried out on freshly prepared foils. Since the analytical evaluation of the initial DMA results showed that residual chloroform was present in the polymer even weeks after the film was cast, the samples used for the final experiments and analyses for bacterial and surface studies were prepared at least 3 months before the experiments and were aged under laboratory conditions in a polystyrene Petri dish without any intervention following removal from the glass Petri dish until the first modification.
The investigation of the properties of cyclic olefin copolymer films in the initiation phase was carried out on non-standardized sectors of a circle, which is based on the shape of the Petri dishes on which the films were cast. Due to the inclusion of bacterial tests in this work, a standard sample size was adopted, and all samples were cut out with a 20 mm diameter steel cutter after the primary aging process, before plasma modification. Due to the size of the culture tubes, circles with a diameter of 10 mm were punched out of the prepared samples for the bacterial study.
3.3. Plasma Modification
COC samples were modified on a BAL-TEC SCD 050 sputtering device in the etching mode (manufacturer BalTec Maschinenbau AG, Pfäffikon, Switzerland) in argon plasma with a power of 8 W for 240 s at a pressure of about 10 Pa, the electrode-sample distance was 50 mm. The modification was performed after the primary aging process.
3.4. Metal Layer Deposition
The deposition of thin Au and Ag layers was carried out in a Quorum Q300T ES sputtering magnetron device (manufacturer Quorum Technologies, Laughton, England). The sputtering times were 293 s for the Au layer and 1469 s for the thicker layer. The sputtering of the silver layers took place for 300 s and for the thicker layers 2000 s. The deposition times for all layers including their measured thicknesses are given in Table 2. The sputtering took place in an argon atmosphere with a pressure of 1 Pa, the deposition current was 20 mA, the distance between the metal target and the sample was 20 cm. The samples that were deposited without the primary aging process during the initial development were problematic.
3.5. Excimer Laser Treatment
The samples were exposed to a Coherent LEAP 100K excimer KrF laser manufactured by Coherent Corp. The samples were always exposed to a single beam hit with a wavelength of 248 nm in air. Different powers were tested, but in all cases, except for the use of the highest energy of 250 mJ cm−2, the noble metal layer were partially ablated. From the preliminary results, samples with thinner noble metal layers than the layers deposited at 1469 s in the case of Au and 2000 s in the case of Ag were excluded from the exposure by the excimer laser due to ablation. The thicknesses of the deposited metals were verified by the scratch method on glass, subsequently analyzed by AFM. The above times correspond to 50.1 ± 0.7 nm of Au and 77.4 ± 2.0 nm of Ag on a glass substrate. To prepare samples for antibacterial tests, 2 discharges of 6 mm width were used side by side to cover the required surface of the test foil.
3.6. Heat Treatment
Before antibacterial tests, all samples that did not undergo laser modification were placed in a Binder oven at 100 °C for 1 hour and 40 minutes to simulate aging after plasma modification. The samples were placed in the oven in cleaned Petri dishes. The temperature of 100 °C was chosen as the maximum possible for aged samples, above which undesirable effects (bubbles, etc.) occurred during thermal stress.
3.7. Antibacterial Testing
The antibacterial activity was determined by a drop test using gram-negative bacteria Escherichia coli and gram-positive bacteria Staphylococcus aureus. One colony from agar plates of E. coli bacterial strains was transferred to 20 ml of liquid Luria-Bertani (LB) medium, and one colony from agar plates of S. aureus bacterial strains was transferred to 5 ml of LB medium. The inocula prepared in this way were subsequently cultured overnight at 37 °C in an orbital shaker. The following day, the bacteria were “diluted” with sterile phosphate buffer (PBS) to a concentration of approximately 1.6 × 10³ bacteria per 1 ml for E. coli and to a concentration of 8 × 10⁴ bacteria per 1 ml for S. aureus. The tested samples were immersed in triplicate in 2 ml of bacterial suspension and were statically incubated at laboratory temperature. After 2 and 24 hours, the bacterial suspension was mixed and five drops of 25 μl each were pipetted onto LB agar culture plates. These plates were cultured overnight at 28 °C for E. coli and at 37 °C for S. aureus. Subsequently, the number of colony forming units (CFU) was determined and compared with the number of CFU on the control and unmodified COC (pristine). The experiment was performed under sterile conditions.
3.8. Analytical Methods
Atomic Force Microscopy
Surface morphology and roughness of the pristine and treated films were examined by atomic force microscopy (AFM) using Dimension ICON (Bruker Corp., Billerica, MA, USA). The samples were analyzed in Scan-Assyst® mode using nitride lever SCANASYST-AIR with Si tip (spring constant of 0.4 N·m-1). NanoScope Analysis software was applied for data processing. Surface roughness (Ra) represents the arithmetic mean of the absolute values of the height deviations measured from the central plane.
Scanning Electron Microscopy
The morphology of the sample surfaces was also characterized by scanning electron microscope FIB-SEM LYRA3 GMU (Tescan. Brno, Czech Republic). The acceleration voltage was set to 10 kV. The elemental composition was measured by energy-dispersive X-ray spectroscopy (EDS, analyzer X-ManN, 20 mm2 SDD detector, Oxford Instruments, United Kingdom), while the accelerating voltage for SEM-EDS analysis was set to 10 kV.
X-Ray Photoelectron Spectrometry
The elemental composition on the material surface was analyzed by X-ray photoelectron spectroscopy (XPS) using a spectrometer ESCAProbeP (Omicron Nanotechnology Ldt., Taunusstein, Germany). As a source, a monochromatic X-ray at an energy of 1486.7 eV was used. Atomic concentrations of the elements were determined from the individual peak areas using CasaXPS software.
Wettability
The wettability of the studied samples was determined by measurement of contact angles (CA, θ) using goniometer Advex Instruments (Brno, Czech Republic) connected to the SEE System 7.1 program. Analysis of CA was performed at room temperature with 8 µL drops of distilled water (dyed with methyl violet) using a Transferpette® automatic pipette (Brand, Wertheim, Germany) at 6 different positions of 3 samples in parallel and perpendicular directions. Subsequently, the drops were photographed and evaluated by 3 marked points.
Gravimetry
To determine the thickness of the deposited layers, pre-weighed samples were prepared after plasma modification, metal deposition was performed, and then secondary weighing was performed. From the differences in weights, the mass of the deposited metal was calculated, and the height of the noble metal layer was calculated through the uniform size of the sample. Weighing was performed on a UMX2 microbalance manufactured by Mettler-Toledo, Columbus, Ohio. Due to electrostatic effects of the copolymer samples, they were discharged in an antistatic gate manufactured by the same manufacturer before weighing.
Rutherford Backscattering Spectroscopy
RBS analyses were performed on the Tandetron 4130MC accelerator at the Institute of Nuclear Physics in Řež using 1.75 MeV 4He ions. Measurements were performed with an incident angle of 0° and a scattering angle of 170°. The typical energy resolution of the FWHM spectrometer used was 15 keV. RBS spectra were evaluated using the SIMNRA code.
Differential Scanning Calorimetry
Material analyses on an automated digital scanning calorimeter Discovery DSC250 Auto manufactured by TA Instruments, New Castle, Delaware were carried out in an air atmosphere from room temperature to 220 °C with a step of 10 °C min−1. Samples for insertion into the calorimeter binder were prepared so that their weight corresponded to 4 - 10 mg and were encapsulated in hermetic aluminium pans. The analysis of the results was carried out in the TRIOS program of the same manufacturer and the method of measuring half the height between the extrapolated tangents was used to determine the glass transition point. The results of DSC analysis is introduced in Figure 2. Differential scanning calorimetry measurements were performed on the granulate of the material used. The deviation in the glass transition temperature of 120.91 °C seen in Figure 16 compared to the manufacturer's declared 133.9 °C may be due to a different measurement or calculation procedure, since the glass transition temperature of polymers is not a discrete point, but an interval dependent on the polymer dispersity.
4. Conclusions
The analysis of the surface layers of the copolymer composite indicated the implantation of Au particles under the COC foil surface. Thermal stress and excimer laser exposure induced significant changes in surface morphology. The foils are significantly more hydrophilic after plasma modification compared to the unmodified foil, and they lose this hydrophilicity after thermal or laser stress in all metal-copolymer combinations except for COC foils with a thicker Au layer. Laser exposure of foils with deposited Au and Ag layers induced the formation of globular nanoclusters. All prepared materials except for the unmodified COC foil have antibacterial effects on gram-negative bacteria Escherichia coli, with Ag layers their growth is suppressed more significantly. Against the more resistant gram-positive bacteria Staphylococcus aureus, the Au layers have a negligible effect, but the activity of the Ag nanocomposites is again significant.
Supplementary Materials
The following supporting information can be downloaded at the website of this paper posted on Preprints.org.
Author Contributions
Conceptualization: P.S., N.S.K., V.Š.; Methodology: P.S., J.P., B.F., P.Saj., A.K., P.M.; Investigation: J.P., P.S., B.F., A.K., P.M., Z.H.; Formal analysis: J.P., B.F., P.Saj., O.K., N.S.K.; Data curation: J.P., B.F., A.K., P.Sa., P.M.; Writing – original draft: P.S., J.P., B.F.; Writing – review & editing: P.S., N.S.K.; Visualization: J.P., B.F., O.K., Z.H.; Supervision: P.S., V.Š., N.S.K. Project administration: P.S., N.S.K.; Funding acquisition: P.S., N.S.K.
Funding
This work was supported by the Project OP JAK EXRegmed, No CZ.02.01.01/00/22_008/0004562, of the Ministry of Education, Youth and Sports, which is co-funded by the European Union. This work was supported by the Grant of Ministry of Health of the Czech Republic No. NW26-09-00043.
Institutional Review Board Statement
Not applicable.
Informed Consent Statement
Not applicable.
Data Availability Statement
The original contributions presented in this study are included in the article/supplementary material. Further inquiries can be directed to the corresponding author.
Conflicts of Interest
The authors declare no conflicts of interest.
References
- Agha; Waheed, W.; Alamoodi, N.; Mathew, B.; Alnaimat, F.; Abu-Nada, E.; Abderrahmane, A.; Alazzam, A. A review of cyclic olefin copolymer applications in microfluidics and microdevices. Macromol. Mater. Eng. 2022, 307, 2200053. [Google Scholar] [CrossRef]
- Shin, J.Y.; Park, J.Y.; Liu, C.; He, J.; Kim, S.C. Chemical structure and physical properties of cyclic olefin copolymers (IUPAC Technical Report). Pure Appl. Chem. 2005, 77, 801–814. [Google Scholar] [CrossRef]
- Lago, W.S.R.; Aymes-Chodur, C.; Ahoussou, A.P.; Yagoubi, N. Physico-chemical ageing of ethylene–norbornene copolymers: a review. J. Mater. Sci. 2017, 52, 6879–6904. [Google Scholar] [CrossRef]
- Gutiérrez-Villarreal, M.H.; Zavala-Betancourt, S.A. A comparative study of the photodegradation of two series of cyclic olefin copolymers. Int. J. Polym. Sci. 2017, 1–10. [Google Scholar] [CrossRef]
- Bragheri, F.; Martínez Vázquez, R.; Osellame, R. Three-dimensional microfabrication using two-photon polymerization. In Three-Dimensional Microfabrication Using Two-Photon Polymerization; Elsevier, 2020; pp. 493–526. [Google Scholar]
- Scott, S.; Ali, Z. Fabrication methods for microfluidic devices: an overview. Micromachines 2021, 12 319. [Google Scholar] [CrossRef]
- Bischoff, K.; Mücke, D.; Roth, G.-L.; Esen, C.; Hellmann, R. UV-femtosecond-laser structuring of cyclic olefin copolymer. Polymers 2022, 14, 2962. [Google Scholar] [CrossRef]
- Guan, J.-H.; Pai; Cherrill, M.; Michalatos, B.; Priest, C. Injection moulding of micropillar arrays: a comparison of poly(methyl methacrylate) and cyclic olefin copolymer. Microsyst. Technol. 2022, 28, 2083–2091. [Google Scholar] [CrossRef]
- Kalkan, S.B.; Najafidehaghani, E.; Gan, Z.; Drewniok, J.; Lichtenegger, M.F.; Hübner, U.; Urban, A.S.; George, A.; Turchanin, A.; Nickel, B. High performance monolayer MoS₂ field effect transistors on cyclic olefin copolymer passivated SiO₂ gate dielectric. Adv. Opt. Mater. 2022, 11, 2201617. [Google Scholar] [CrossRef]
- Cutroneo, M.; Torrisi, L.; Silipigni, L.; Havranek, V.; Mackova, A.; Malinsky, P.; Miksova, R.; Maly, J.; Stofik, M.; Aubrecht, P.; Fajstavr, D.; Slepicka, P. Laminated cyclic olefin copolymer foil by pulsed laser deposition. Coatings 2023, 13, 596. [Google Scholar] [CrossRef]
- Muthuraj, R.; Misra, M.; Mohanty, A.K. Biodegradable compatibilized polymer blends for packaging applications: a literature review. J. Appl. Polym. Sci. 2018, 135, 45726. [Google Scholar] [CrossRef]
- Bao, Z.; Ding, S.; Dai, Z.; Wang, Y.; Jia, J.; Shen, S.; Yin, Y.; Li, X. Significantly enhanced high-temperature capacitive energy storage in cyclic olefin copolymer dielectric films via ultraviolet irradiation. Mater. Horiz. 2023, 10, 2120–2127. [Google Scholar] [CrossRef] [PubMed]
- Forcinio, H. Pre-filled syringes show strong growth. BioPharm Int. 2022, 35, 28–31. [Google Scholar]
- de Oliveira, Pedrosa; Costa, J.S.R.; Oliveira-Nascimento, L. Sustainability of blisters for medicines in tablet form. Sustain. Chem. Pharm. 2021, 21, 100423. [Google Scholar] [CrossRef]
- Slepička, P.; Michaljaničová, I.; Slepičková Kasálková, N.; Kolská, Z.; Rimpelová, S.; Ruml, T.; Švorčík, V. Poly-L-lactic acid modified by etching and grafting with gold nanoparticles. J. Mater. Sci. 2013, 48, 5871–5879. [Google Scholar] [CrossRef]
- Slepička, P.; Peterková, L.; Rimpelová, S.; Pinkner, A.; Slepičková Kasálková, N.; Kolská, Z.; Ruml, T.; Švorčík, V. Plasma activated perfluoroethylenepropylene for cytocompatibility enhancement. Polym. Degrad. Stab. 2016, 130, 277–287. [Google Scholar] [CrossRef]
- Carvalho, R.M.; Santos, L.M.N.B.F.; Bastos, M.; Costa, J.C.S. Carbon-induced changes in the morphology and wetting behavior of ionic liquids on the mesoscale. Langmuir 2024, 40, 3949–3961. [Google Scholar] [CrossRef]
- Slepička, P.; Slepičková Kasálková, N.; Pinkner, A.; Sajdl, P.; Kolská, Z.; Švorčík, V. Plasma induced cytocompatibility of stabilized poly-L-lactic acid doped with graphene nanoplatelets. React. Funct. Polym. 2018, 131, 266–275. [Google Scholar] [CrossRef]
- Lišková, J.; Slepičková Kasálková, N.; Slepička, P.; Švorčík, V.; Bačáková, L. Heat-treated carbon coatings on poly(L-lactide) foils for tissue engineering. Mater. Sci. Eng. C 2019, 100, 117–128. [Google Scholar] [CrossRef]
- Krajcar, R.; Siegel, J.; Slepička, P.; Fitl, P.; Švorčík, V. Silver nanowires prepared on PET structured by laser irradiation. Mater. Lett. 2014, 117, 184–187. [Google Scholar] [CrossRef]
- Slepička, P.; Rebollar, E.; Heitz, J.; Švorčík, V. Gold coatings on polyethyleneterephthalate nano-patterned by F₂ laser irradiation. Appl. Surf. Sci. 2008, 254, 3585–3590. [Google Scholar] [CrossRef]
- Slepička, P.; Neznalová, K.; Fajstavr, D.; Švorčík, V. Nanostructuring of honeycomb-like polystyrene with excimer laser. Prog. Org. Coat. 2020, 145, 105670. [Google Scholar] [CrossRef]
- Parízek, M.; Kasálková, N.; Bačáková, L.; Slepička, P.; Lísa, V.; Blažková, M.; Švorčík, V. Improved adhesion, growth and maturation of vascular smooth muscle cells on polyethylene grafted with bioactive molecules and carbon particles. Int. J. Mol. Sci. 2009, 10, 4352–4366. [Google Scholar] [CrossRef] [PubMed]
- von Woedtke, T.; Bekeschus, S.; Weltmann, K. D.; Wende, K. Plasma-Treated Liquids for Medicine: A Narrative Review on State and Perspectives. 2025, 22, e2400255. [Google Scholar] [CrossRef]
- Švorčík, 25. V.; Siegel, J.; Slepička, P.; Kotál, V.; Špirková, M. Au nanolayers deposited on PET and PTFE degraded by plasma discharge. Surf. Interface Anal. 2007, 39, 79–84. [Google Scholar] [CrossRef]
- Bashir, S.; Ahmad, S.; Ali, N.; Kalsoom, U.; Rafique, M.S.; Alshehri, A.M.; Husinsky, W. Modification in electrical conductivity correlated with surface, structural & optical characteristics of graphite ions implanted CR-39. Heliyon 2024, 10, e34553. [Google Scholar] [CrossRef]
- Roy, S.; Yue, C.; Lam, Y.; Wang, Z.; Hu, H. Surface analysis, hydrophilic enhancement, ageing behavior and flow in plasma modified cyclic olefin copolymer (COC)-based microfluidic devices. Sens. Actuators B Chem. 2010, 150, 537–549. [Google Scholar] [CrossRef]
- Dawaymeh, F.; Abbas, Y.; Khaleel, M.; Alazzam, A.; Alamoodi, N. Tuning the surface wettability of cyclic olefin copolymer by plasma treatment and graphene oxide deposition and reduction. Polymers 2021, 13, 2305. [Google Scholar] [CrossRef]
- Schaub, A.; Slepicka, P.; Kasparkova, I.; Malinsky, P.; Mackovy, A.; Svorcik, V. Gold nanolayer and nanocluster coatings induced by heat treatment and evaporation technique. Nanoscale Res. Lett. 2013, 8 266. [Google Scholar] [CrossRef]
- Font, F.; Myers, T.G. Spherically symmetric nanoparticle melting with a variable phase change temperature. J. Nanopart. Res. 2013, 15, 2086. [Google Scholar] [CrossRef]
- Schwartzkopf, M.; Hinz, A.; Polonskyi, O.; Strunskus, T.; Löhrer, F.C.; Körstgens, V.; Müller-Buschbaum, P.; Faupel, F.; Roth, S.V. Role of sputter deposition rate in tailoring nanogranular gold structures on polymer surfaces. ACS Appl. Mater. Interfaces 2017, 9, 5629–5637. [Google Scholar] [CrossRef]
- Font, F.; Myers, T.G. Spherically symmetric nanoparticle melting with a variable phase change temperature. J. Nanopart. Res. 2013, 15, 2086. [Google Scholar] [CrossRef]
- Yang, D.Q.; Meunier, M.; Sacher, E. Excimer laser manipulation and patterning of gold nanoparticles on the SiO₂/Si surface. J. Appl. Phys. 2004, 95, 5023–5026. [Google Scholar] [CrossRef]
- Granata, F.; Pirillo, N.; Alabastri, A.; Schirato, A.; Bruno, L.; Costa, R.; Malara, N.; Onesto, V.; Coluccio, M.L.; Iodice, M.; Coppola, G.; Gentile, F. Synthesis of plasmonic gold nanoparticles on soft materials for biomedical applications. Micro Nano Eng. 2023, 19, 100207. [Google Scholar] [CrossRef]
- Sasikanth, G.; Prasad, M.D.; Radhakrishnan, T.P. Polymer–metal nanocomposite thin films fabricated by a sputter–anneal process and relevance of the polymer matrix. J. Chem. Sci. 2021, 133 36. [Google Scholar] [CrossRef]
- More, P.R.; Pandit, S.; Filippis, A.D.; Franci, G.; Mijakovic, I.; Galdiero, M. Silver nanoparticles: bactericidal and mechanistic approach against drug resistant pathogens. Microorganisms 2023, 11 369. [Google Scholar] [CrossRef]
- Gouyau, J.; Duval, R.E.; Boudier, A.; Lamouroux, E. Investigation of nanoparticle metallic core antibacterial activity: gold and silver nanoparticles against Escherichia coli and Staphylococcus aureus. Int. J. Mol. Sci. 2021, 22 1905. [Google Scholar] [CrossRef]
- Shamaila, S.; Zafar, N.; Riaz, S.; Sharif, R.; Nazir, J.; Naseem, S. Gold nanoparticles: an efficient antimicrobial agent against enteric bacterial human pathogen. Nanomaterials 2016, 6 71. [Google Scholar] [CrossRef]
- GmbH, T.A.P. TOPAS® 5013L-10 Technical Data Sheet. Available online: https://topas.com/wp-content/uploads/2023/05/TDS_5013L-10_english-units.pdf (accessed on 16 February 2026).
Figure 1.
Surface morphology of COC films (a) after plasma modification for 240 s and power 8 W and (b) after plasma modification and Ag deposition for 300 s. AFM 2D images of an area of 10 x 10 μm2.
Figure 1.
Surface morphology of COC films (a) after plasma modification for 240 s and power 8 W and (b) after plasma modification and Ag deposition for 300 s. AFM 2D images of an area of 10 x 10 μm2.
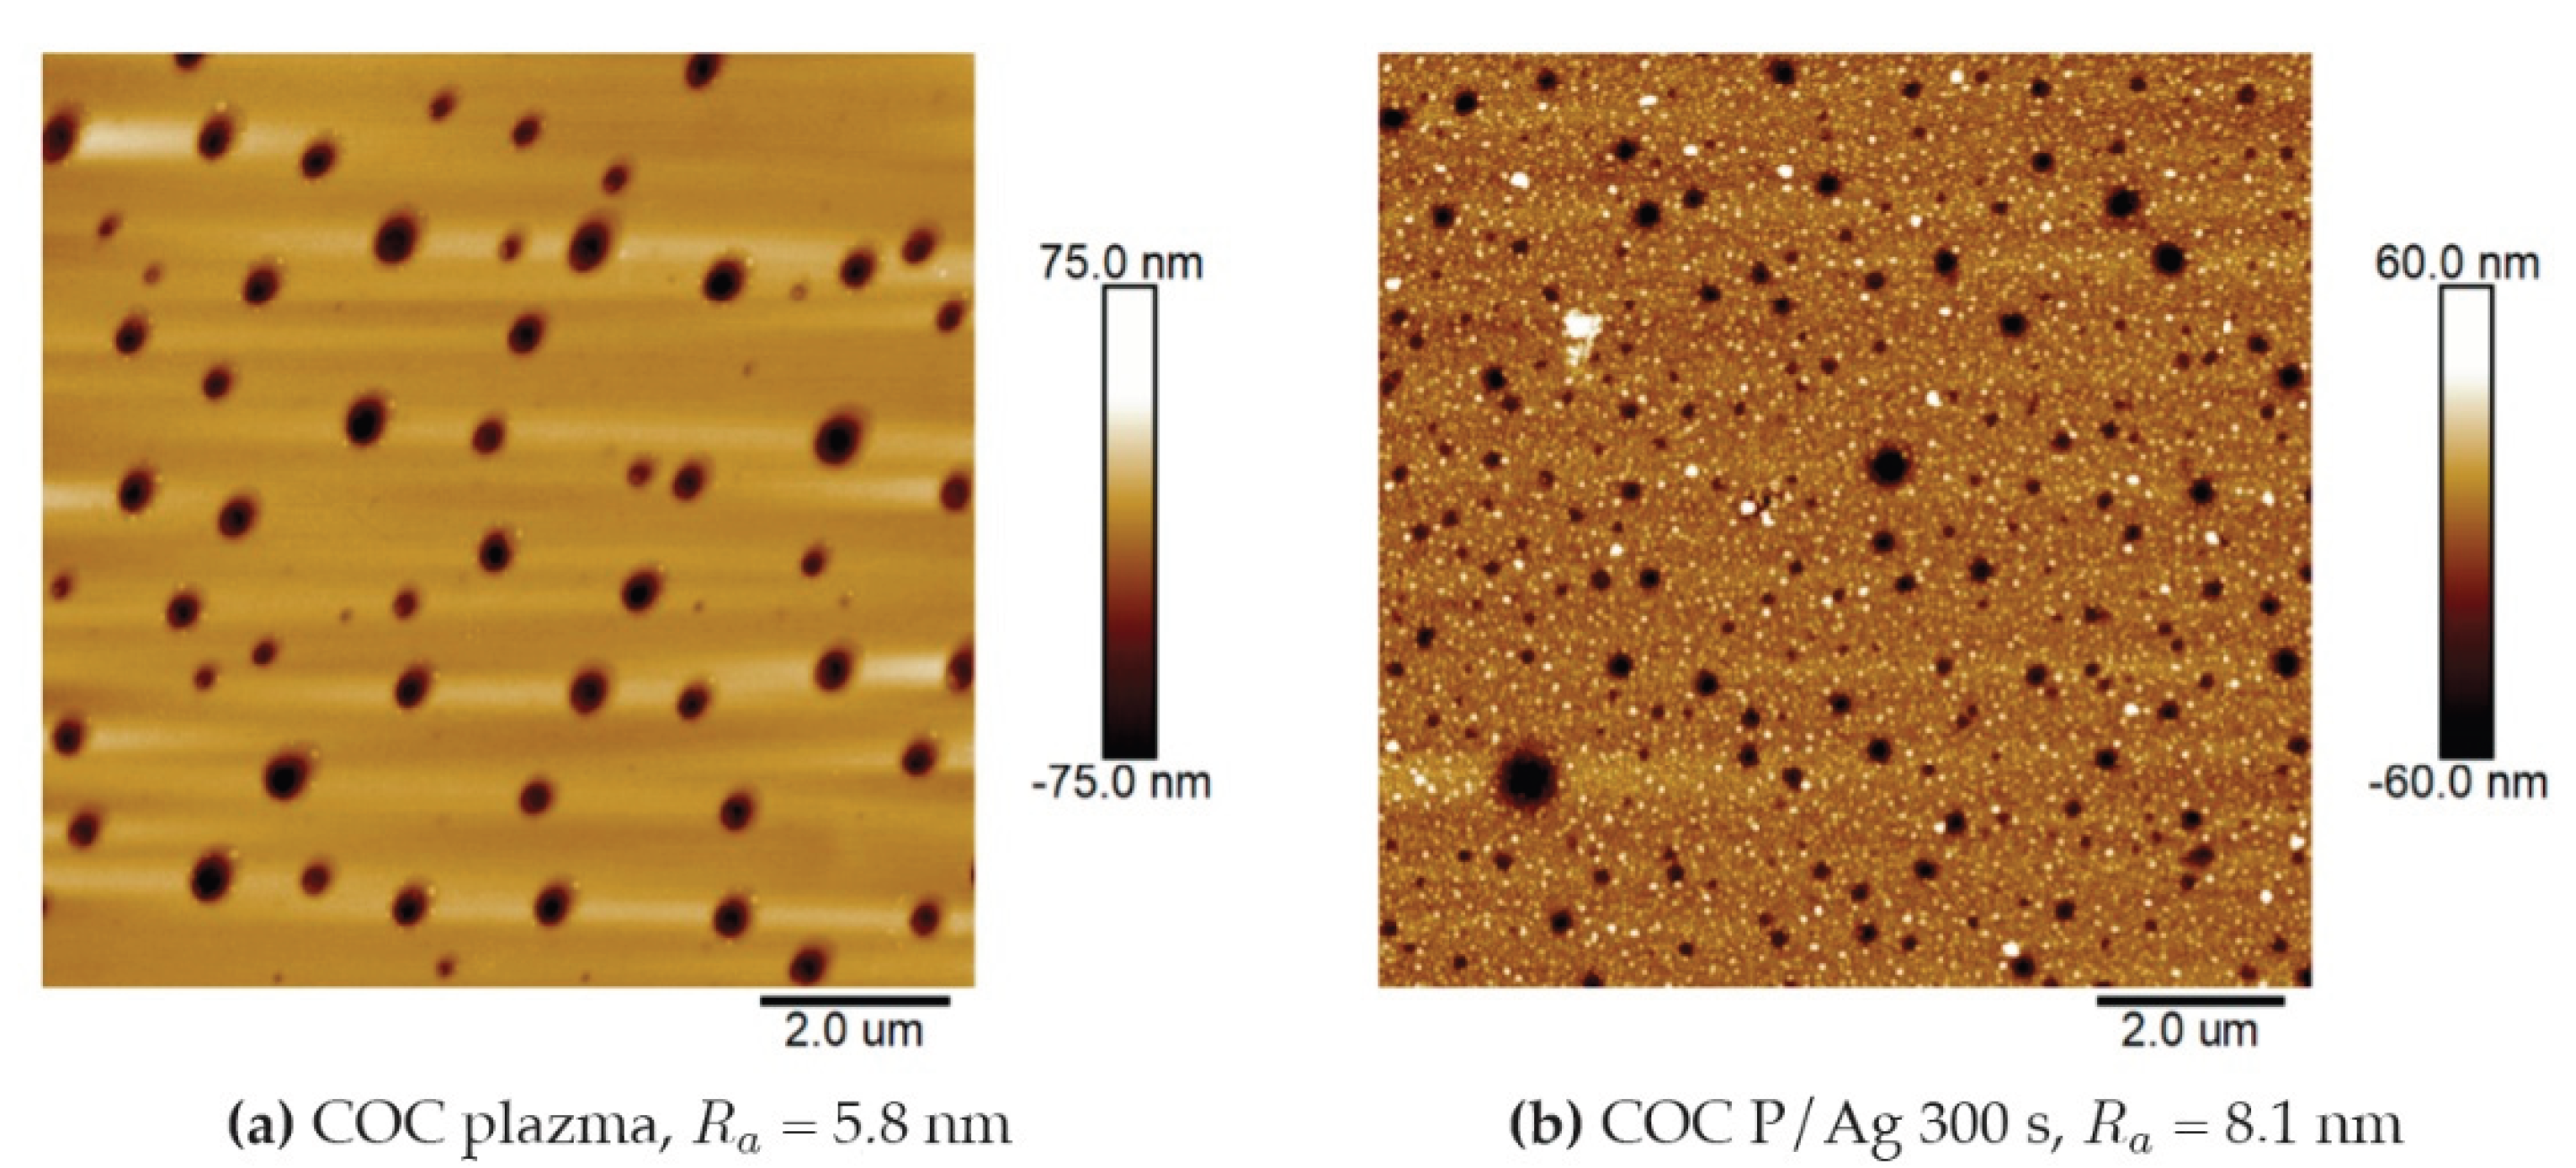
Figure 2.
Height profile of Au atom concentration deposited for 219 s on COC foil, RBS analysis.
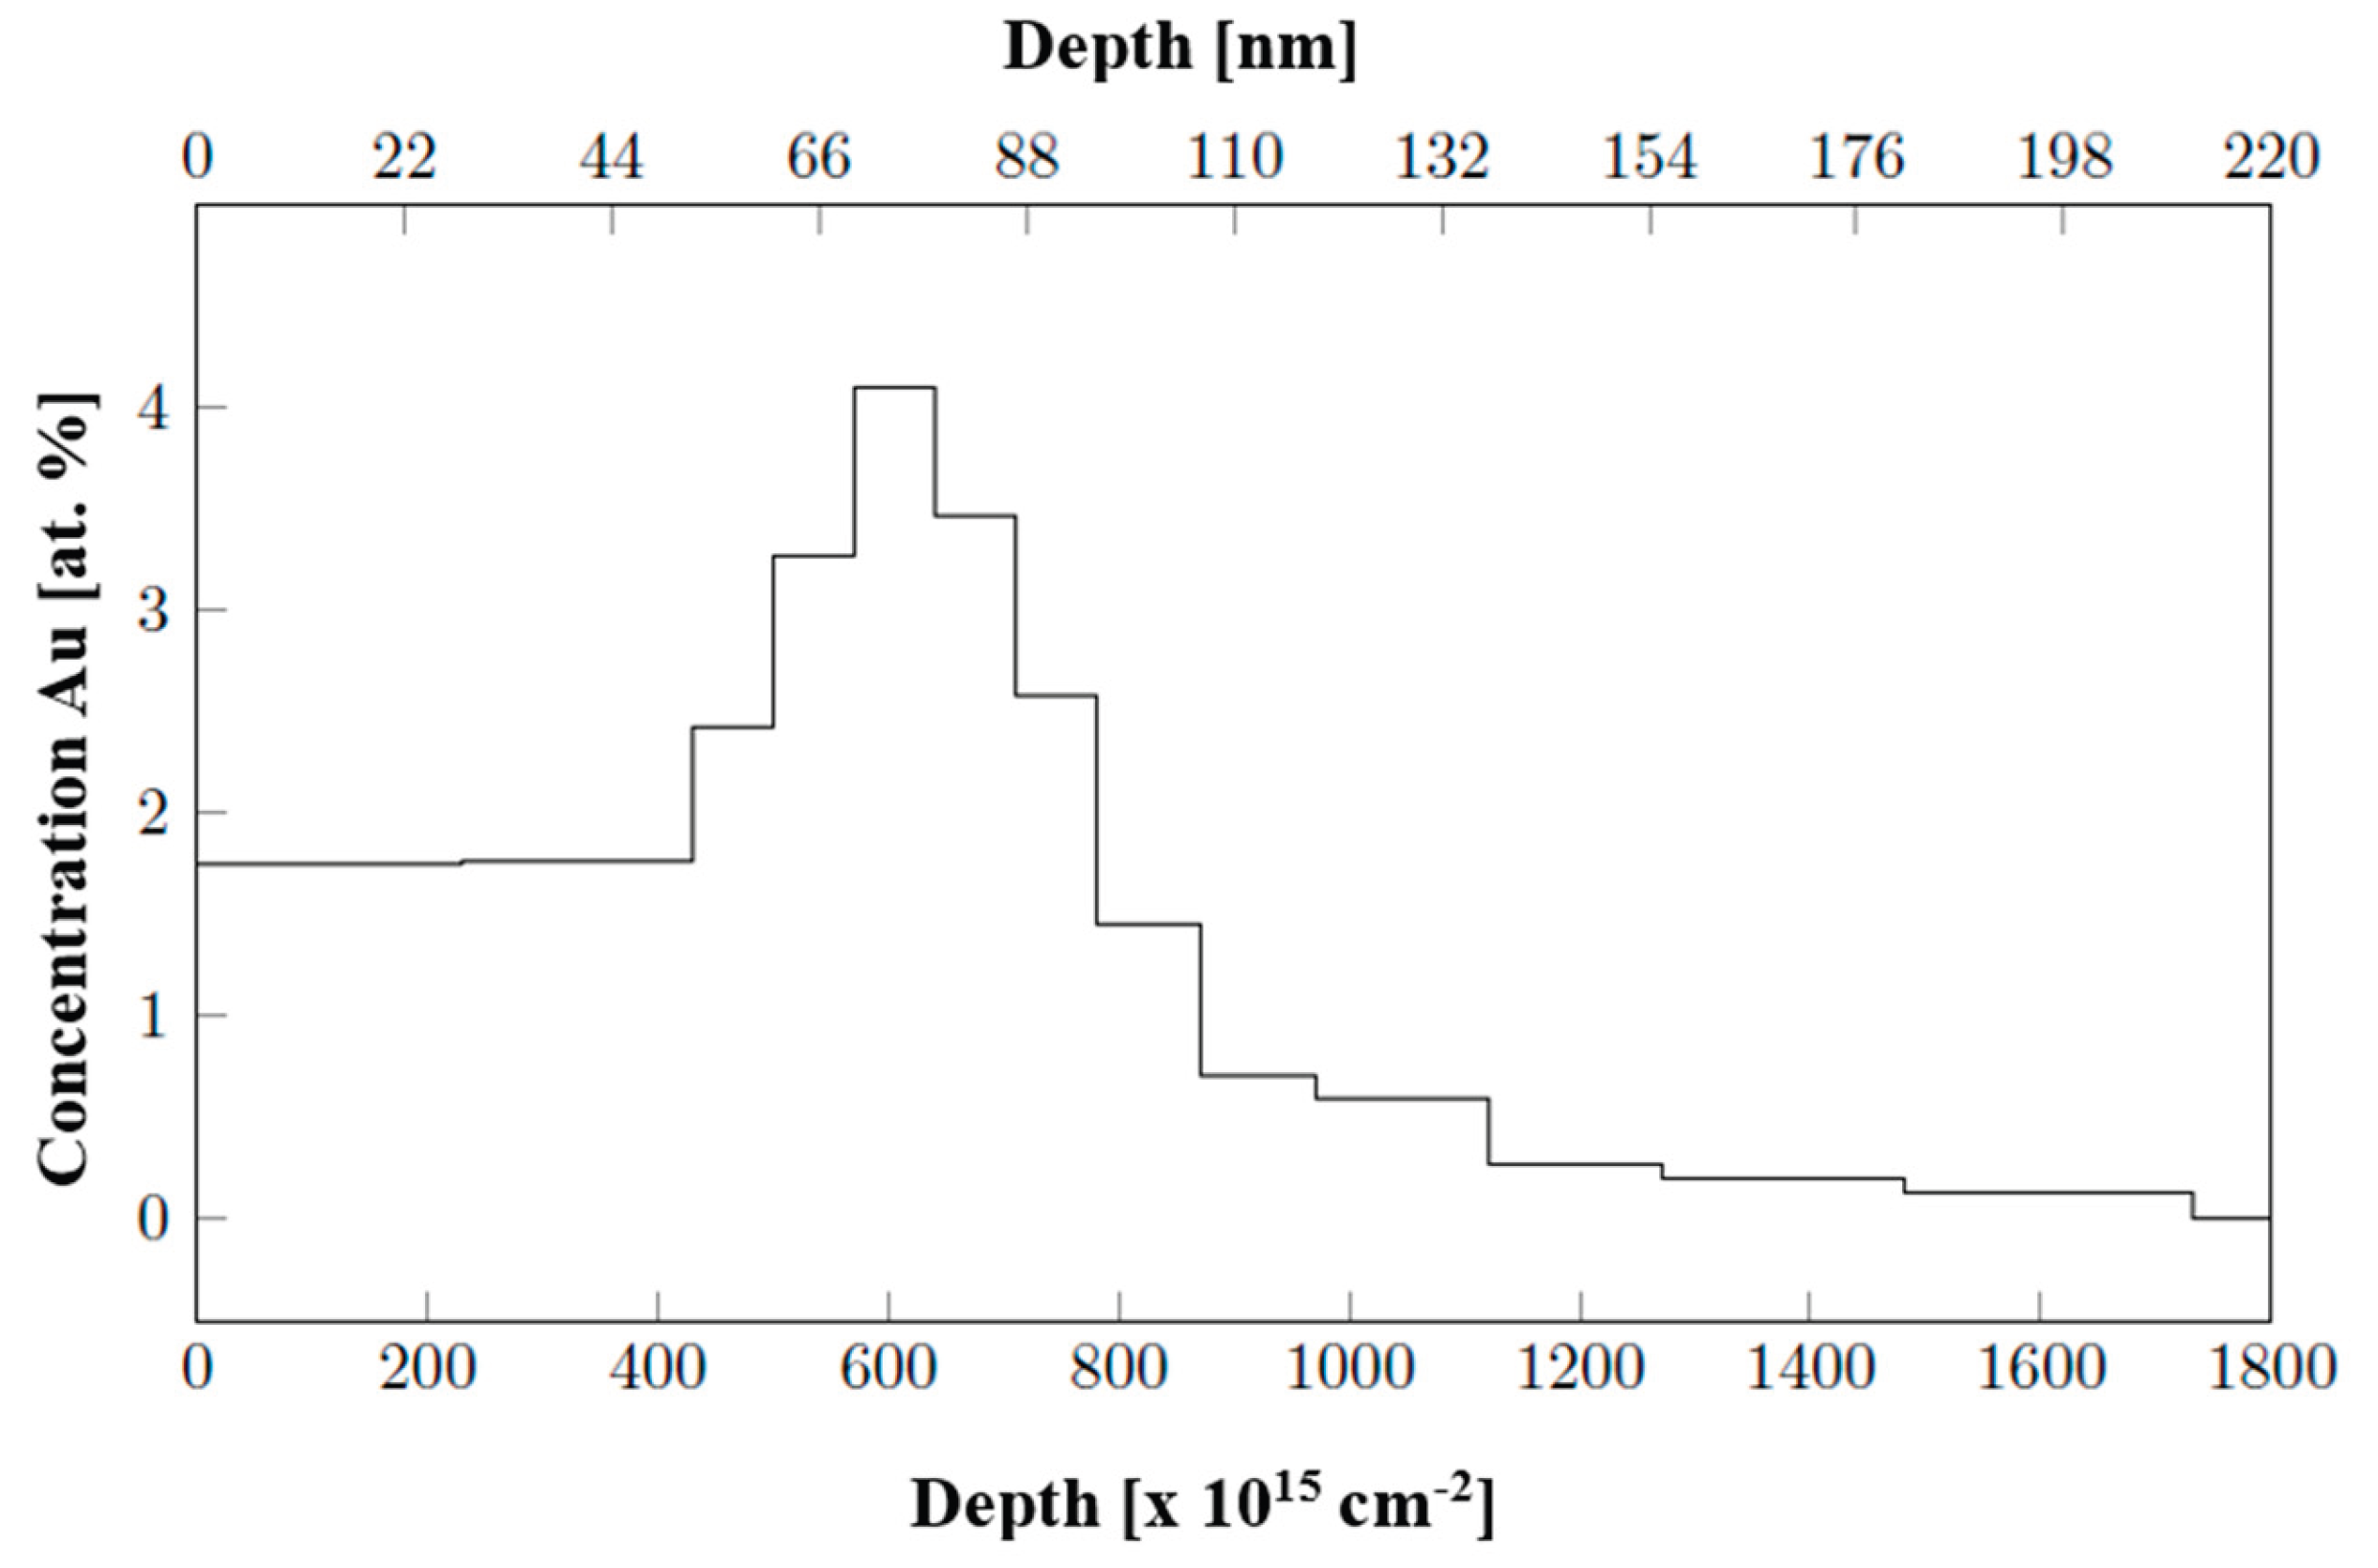
Figure 3.
Contact angle values of distilled water on the surfaces of unmodified samples (pristine), modified by plasma (plasma, P), thermal stress (T), laser KrF beam (L) and deposited layers of noble metals Au and Ag. Blue corresponds to undeposited samples, red to samples with deposited gold layer.
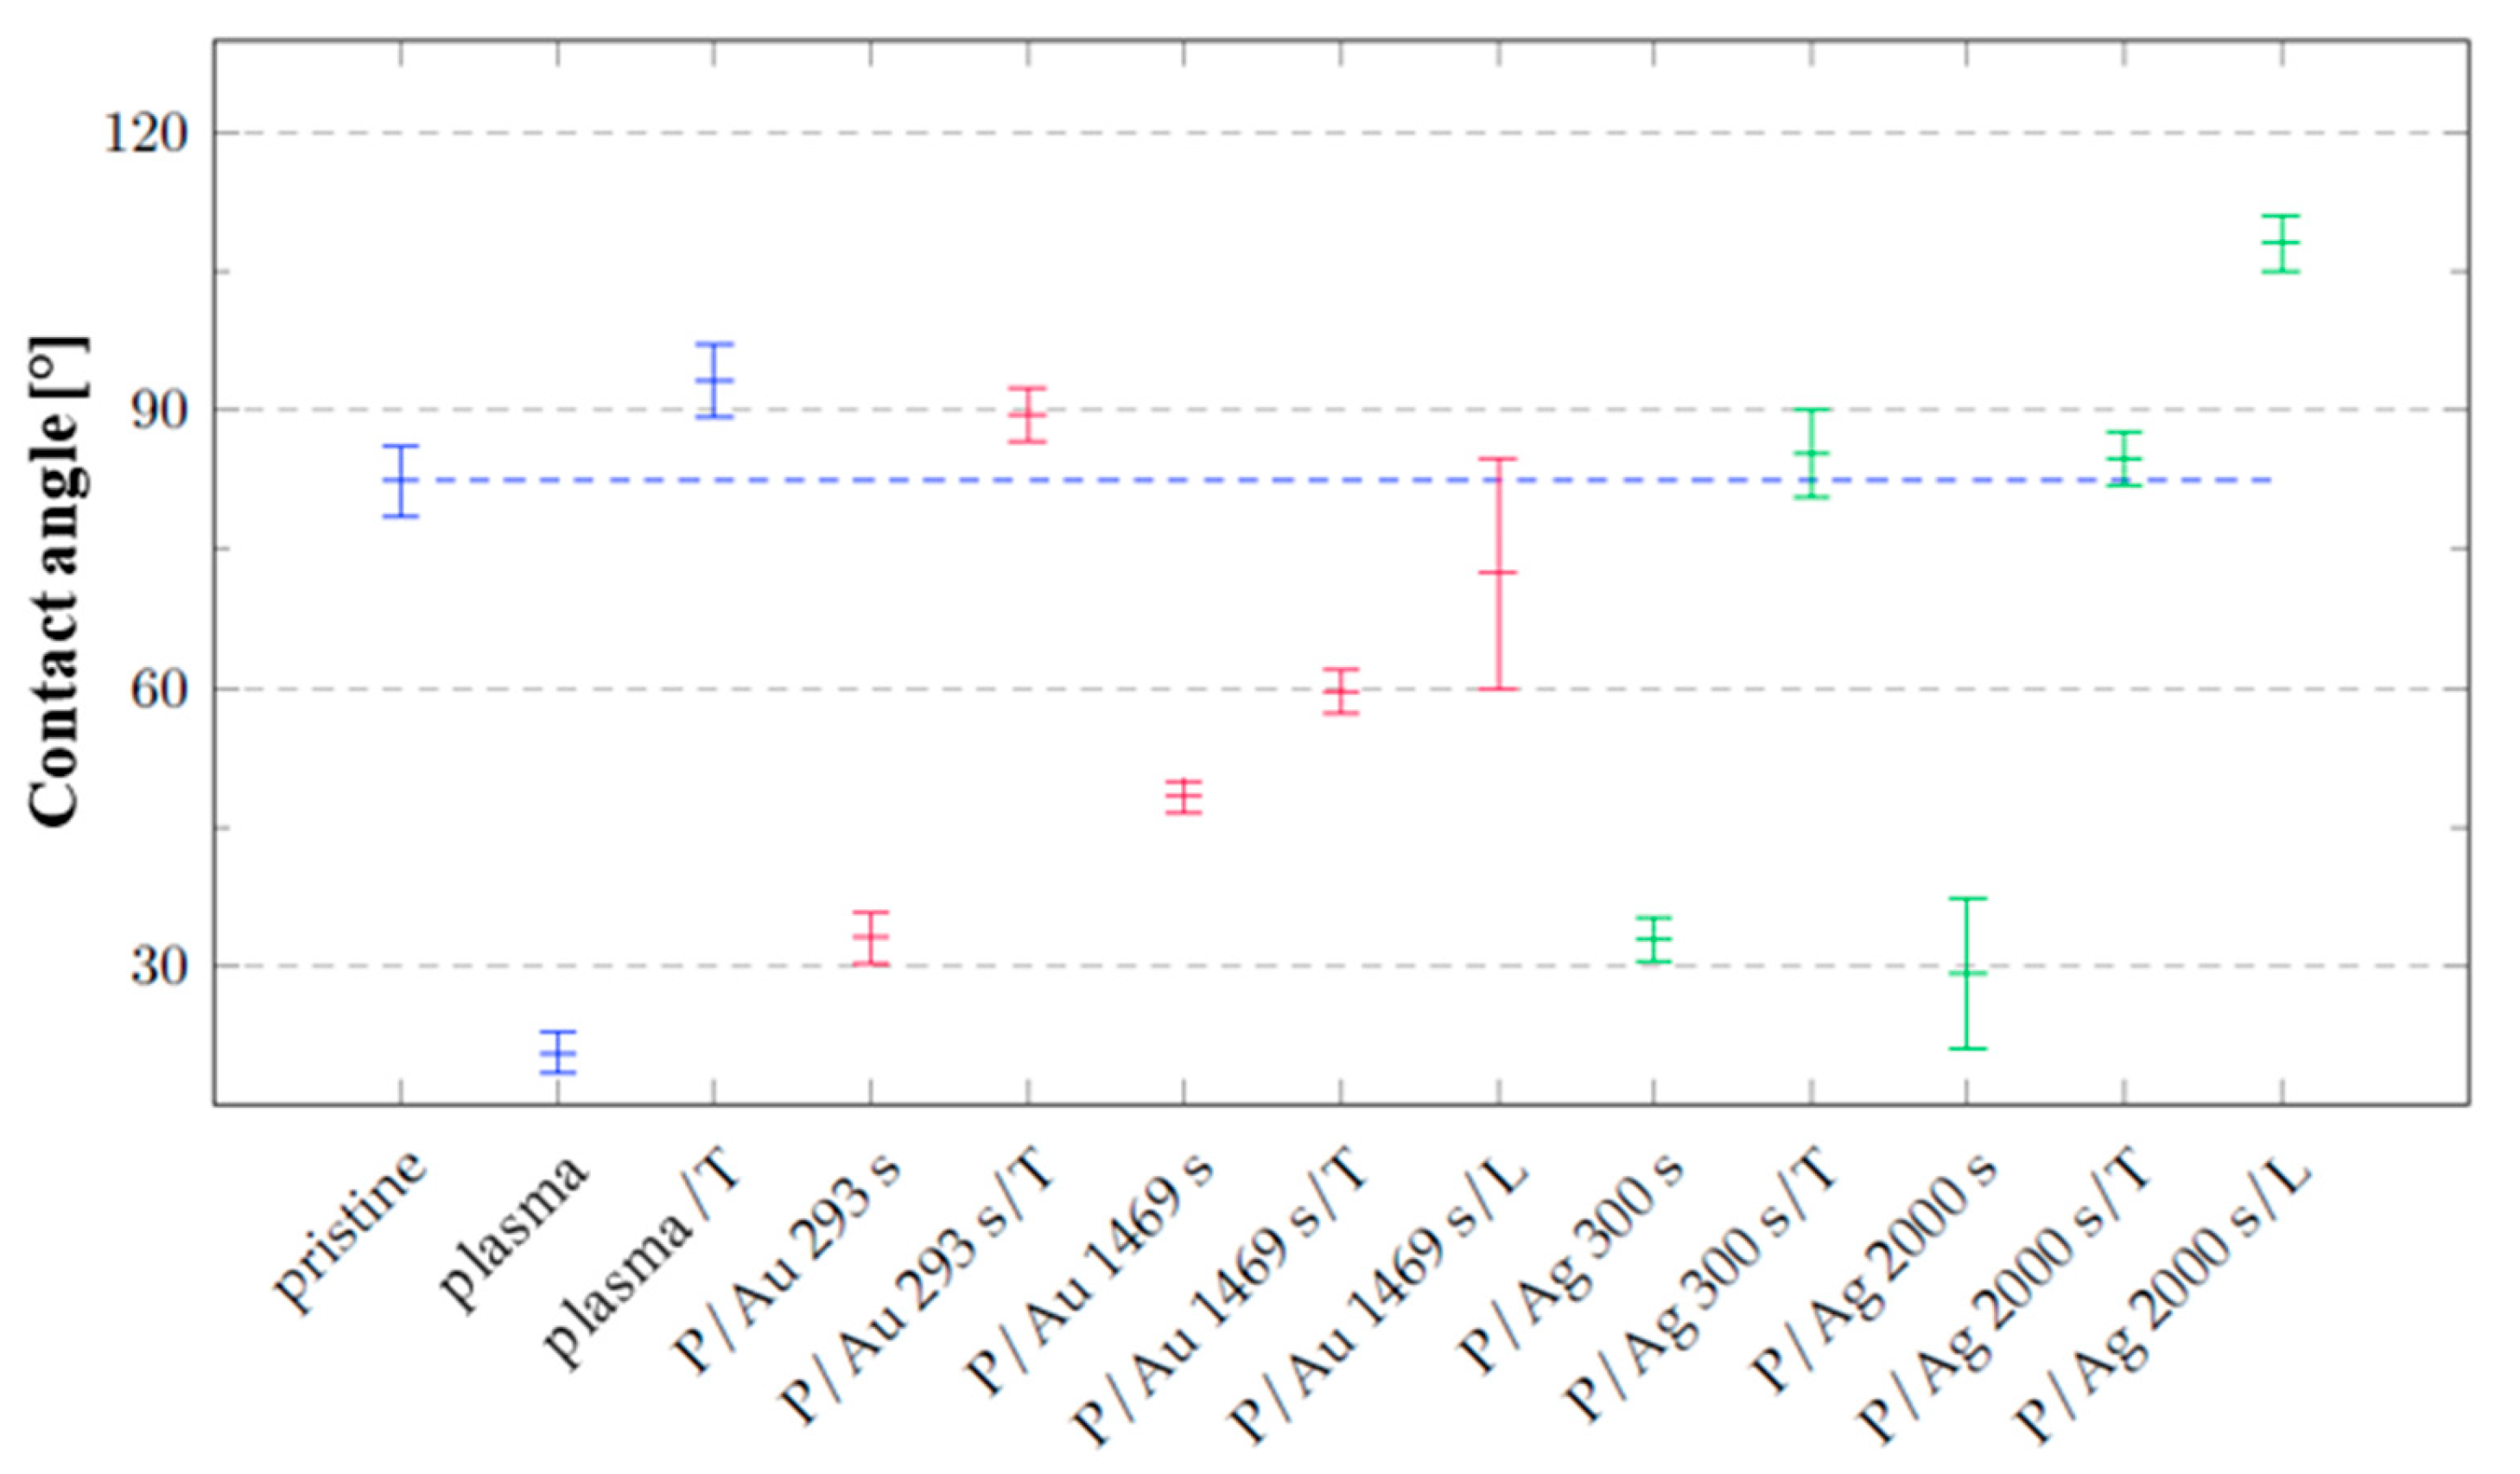
Figure 4.
Comparison of the surface of a 100 μm thick COC film (a) before and (b) after plasma modification at 8 W for 240 s. 3D AFM images of an area of 300 x 300 nm2.
Figure 4.
Comparison of the surface of a 100 μm thick COC film (a) before and (b) after plasma modification at 8 W for 240 s. 3D AFM images of an area of 300 x 300 nm2.
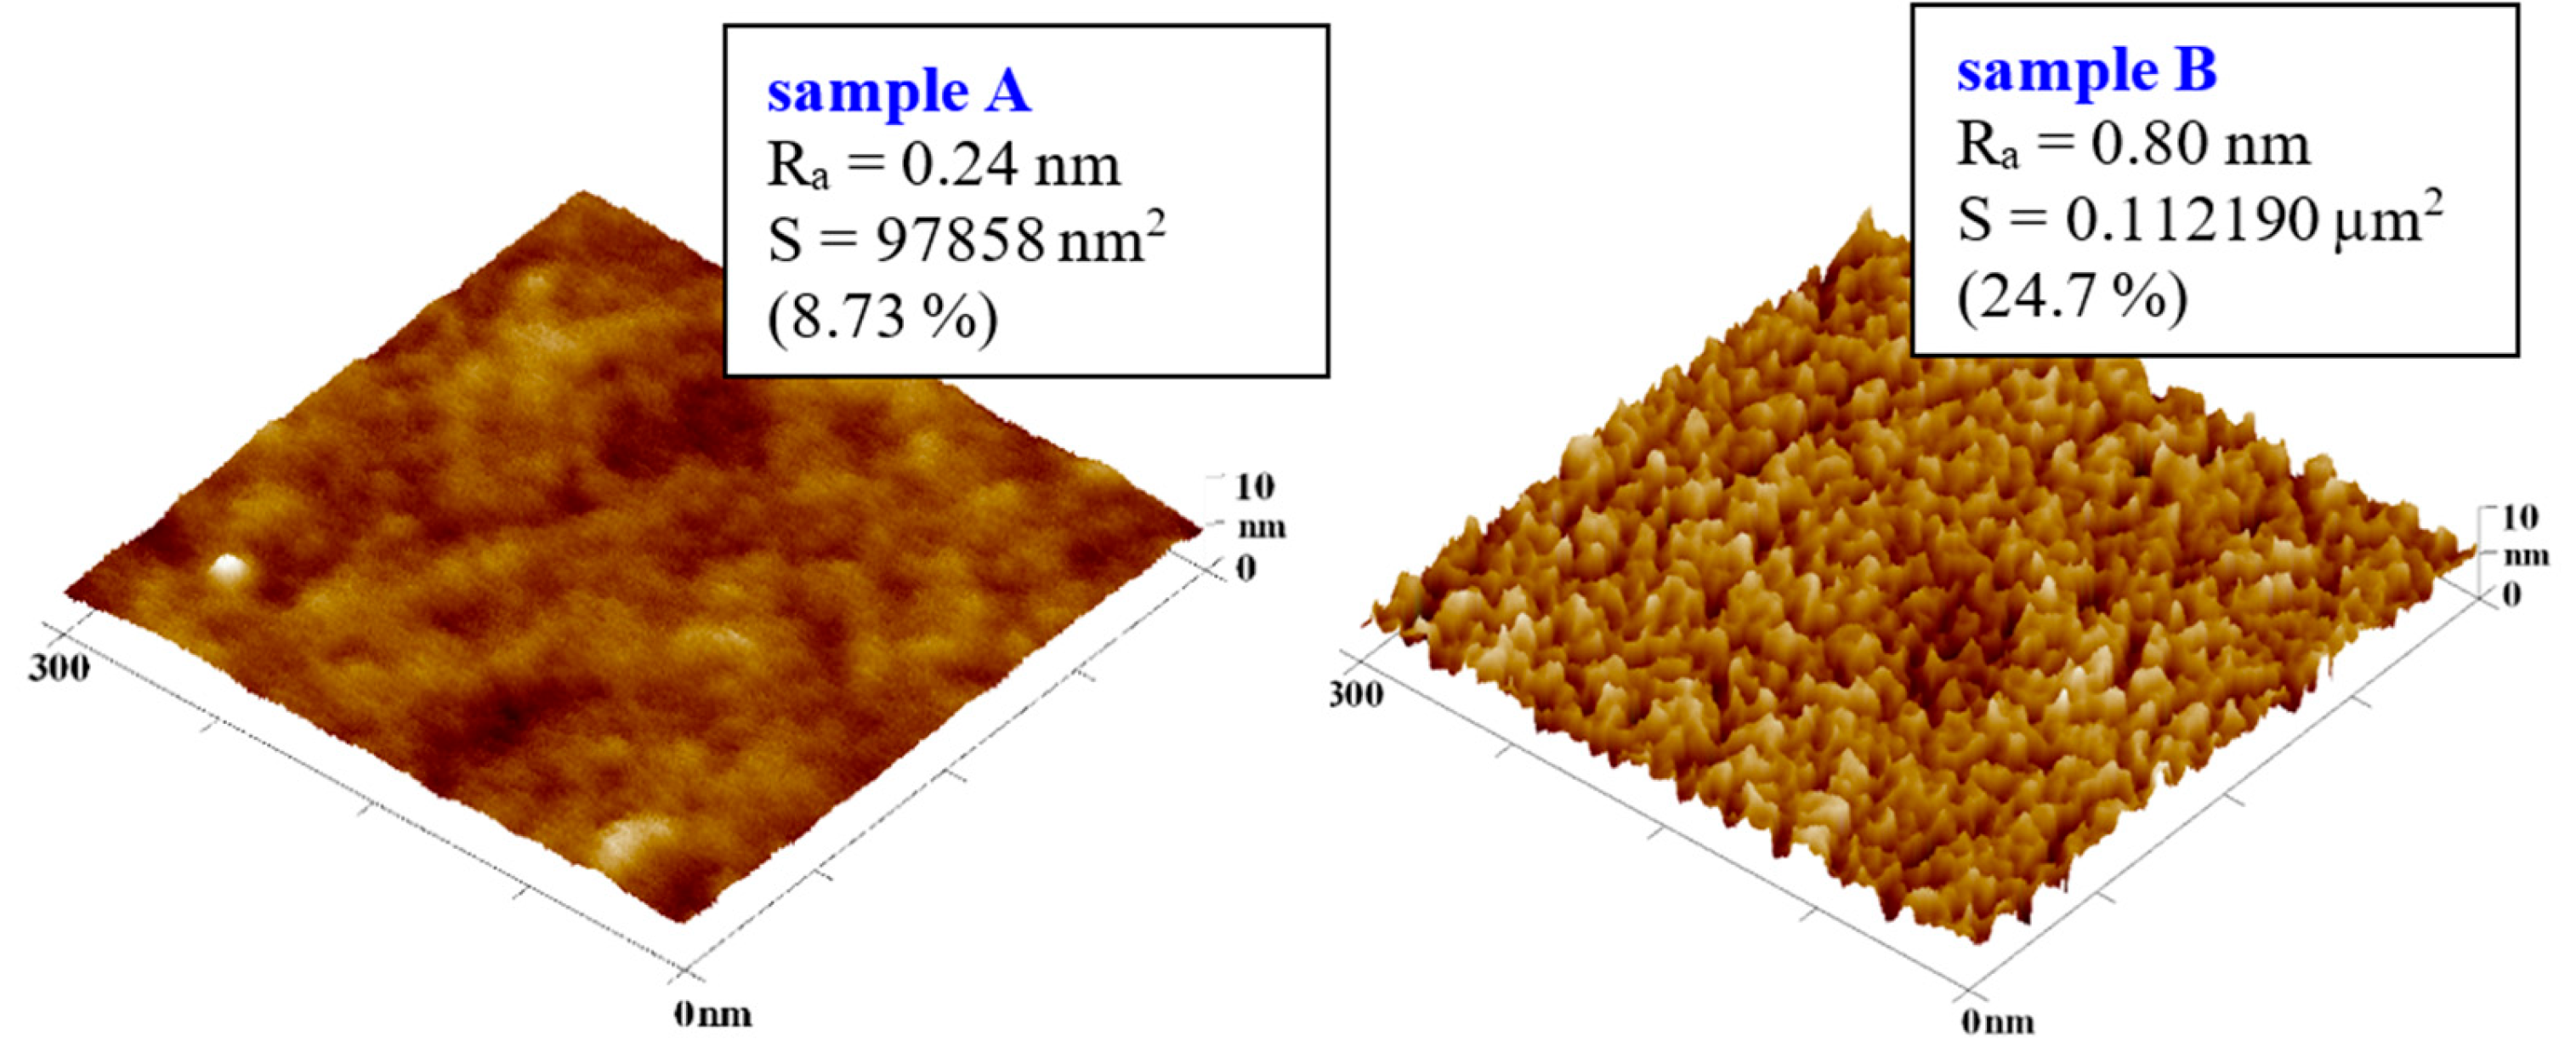
Figure 5.
Roughness values Ra COC surface of unmodified (pristine), modified by plasma (plasma, P), thermal stress (T), laser KrF beam (L) and deposited Au layers. Blue corresponds to non-deposited samples, red to samples with deposited gold layer. Results from AFM images with an area of 300 x 300 nm2 are introduced.
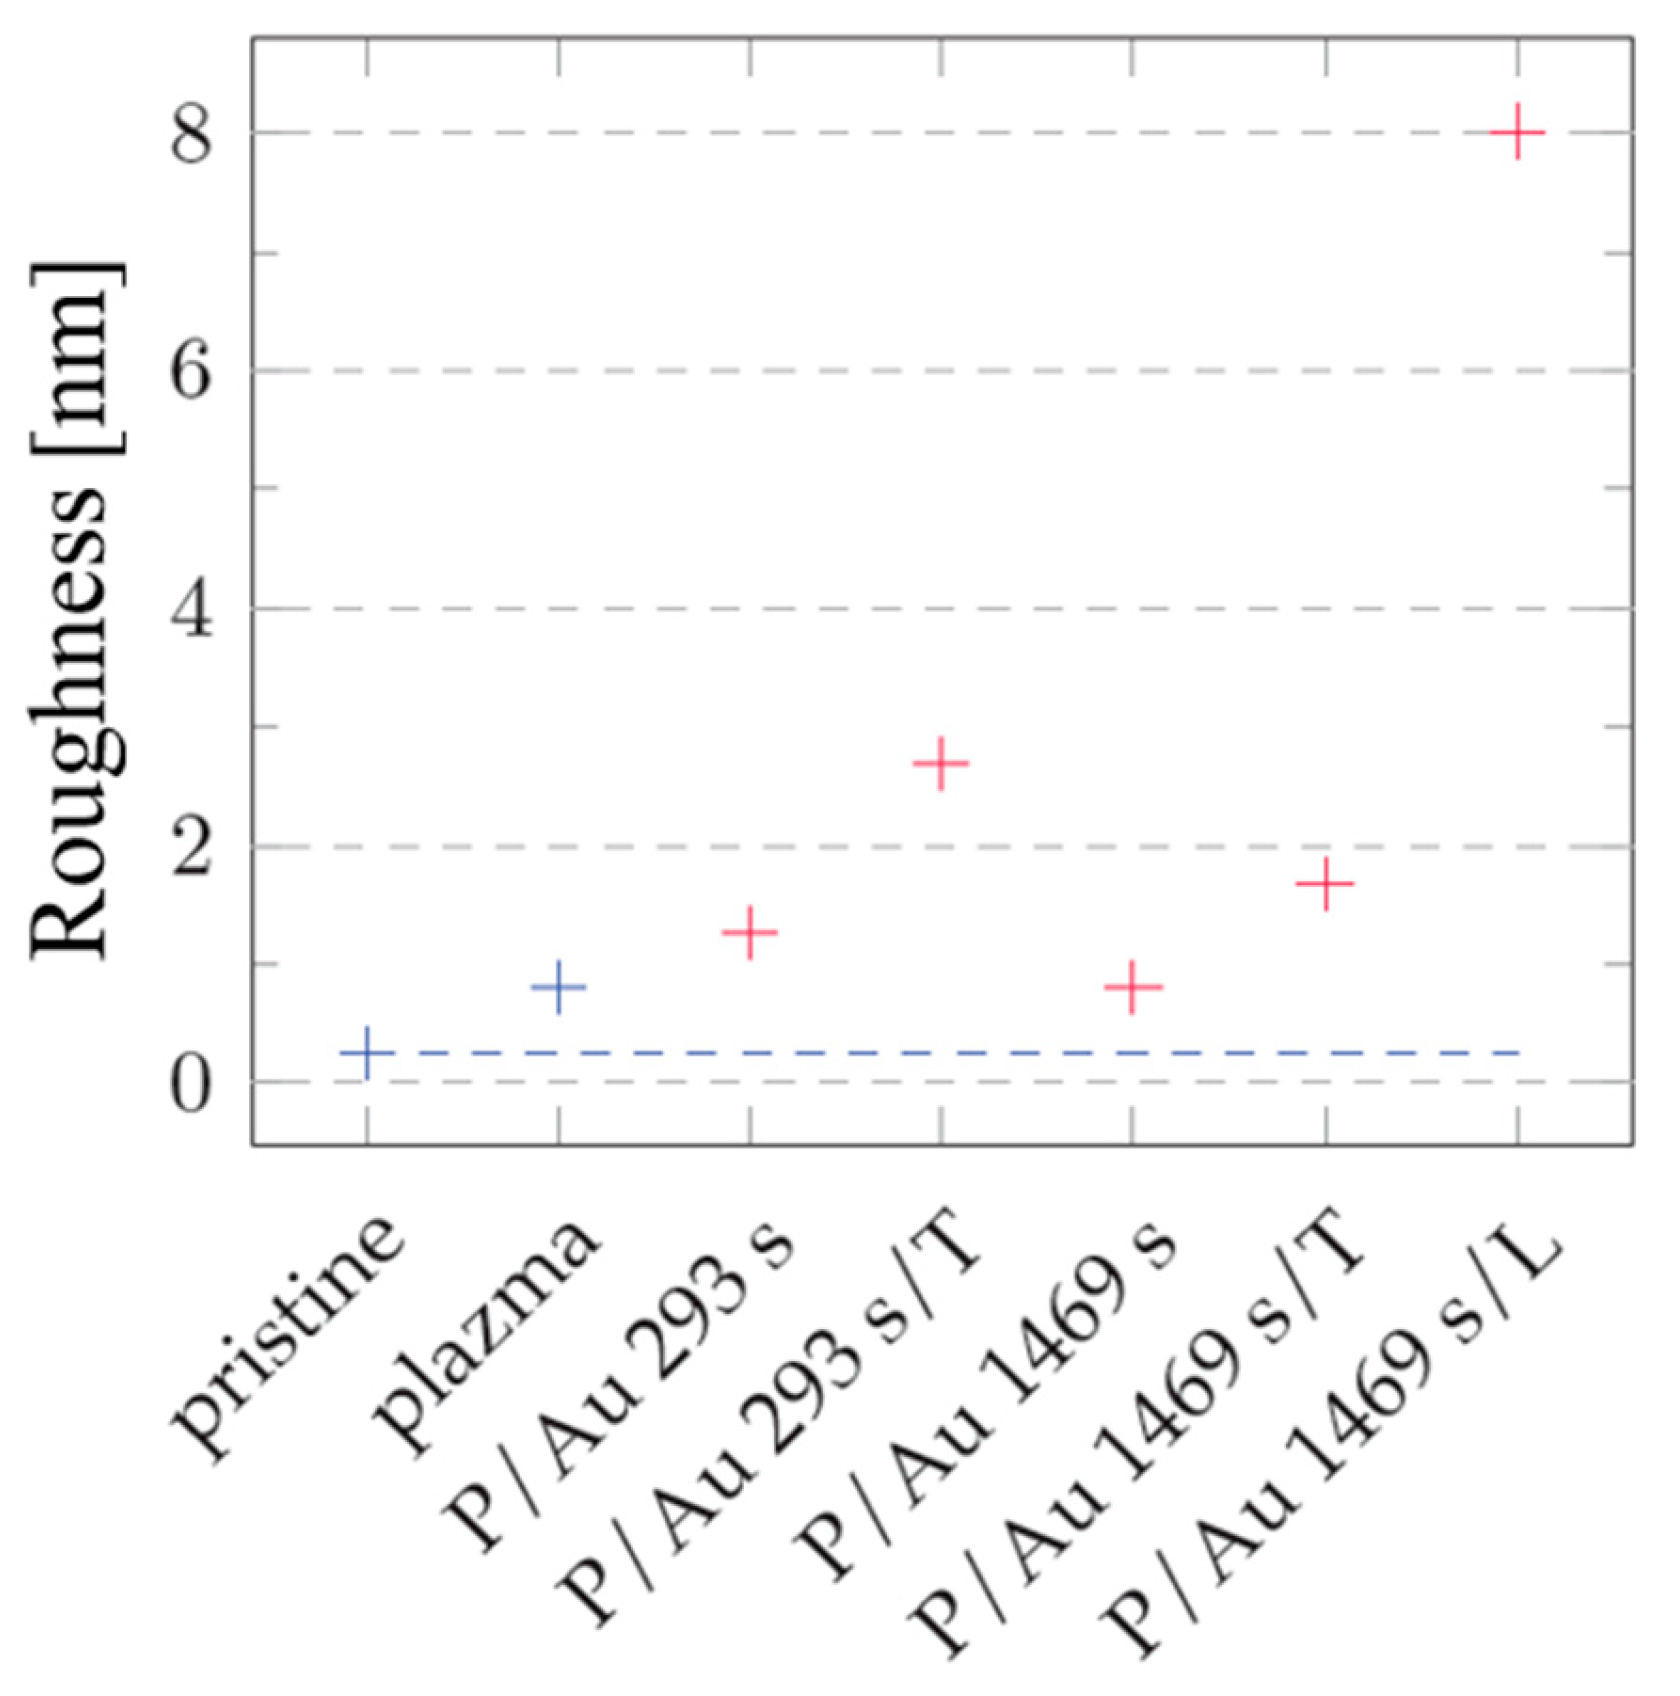
Figure 6.
Comparison of the surfaces of a plasma-treated COC foil and the same foil after 293 s of Au sputtering (plasma/Au). COC foil with the Au layer was subsequently heat treated (plasma/Au/HT). Evaluated from AFM images of an area of 300 x 300 nm2. Bottom image represent the SEM scan of plasma treated and heated COC substrate, scan size 1 x 1 μm2.
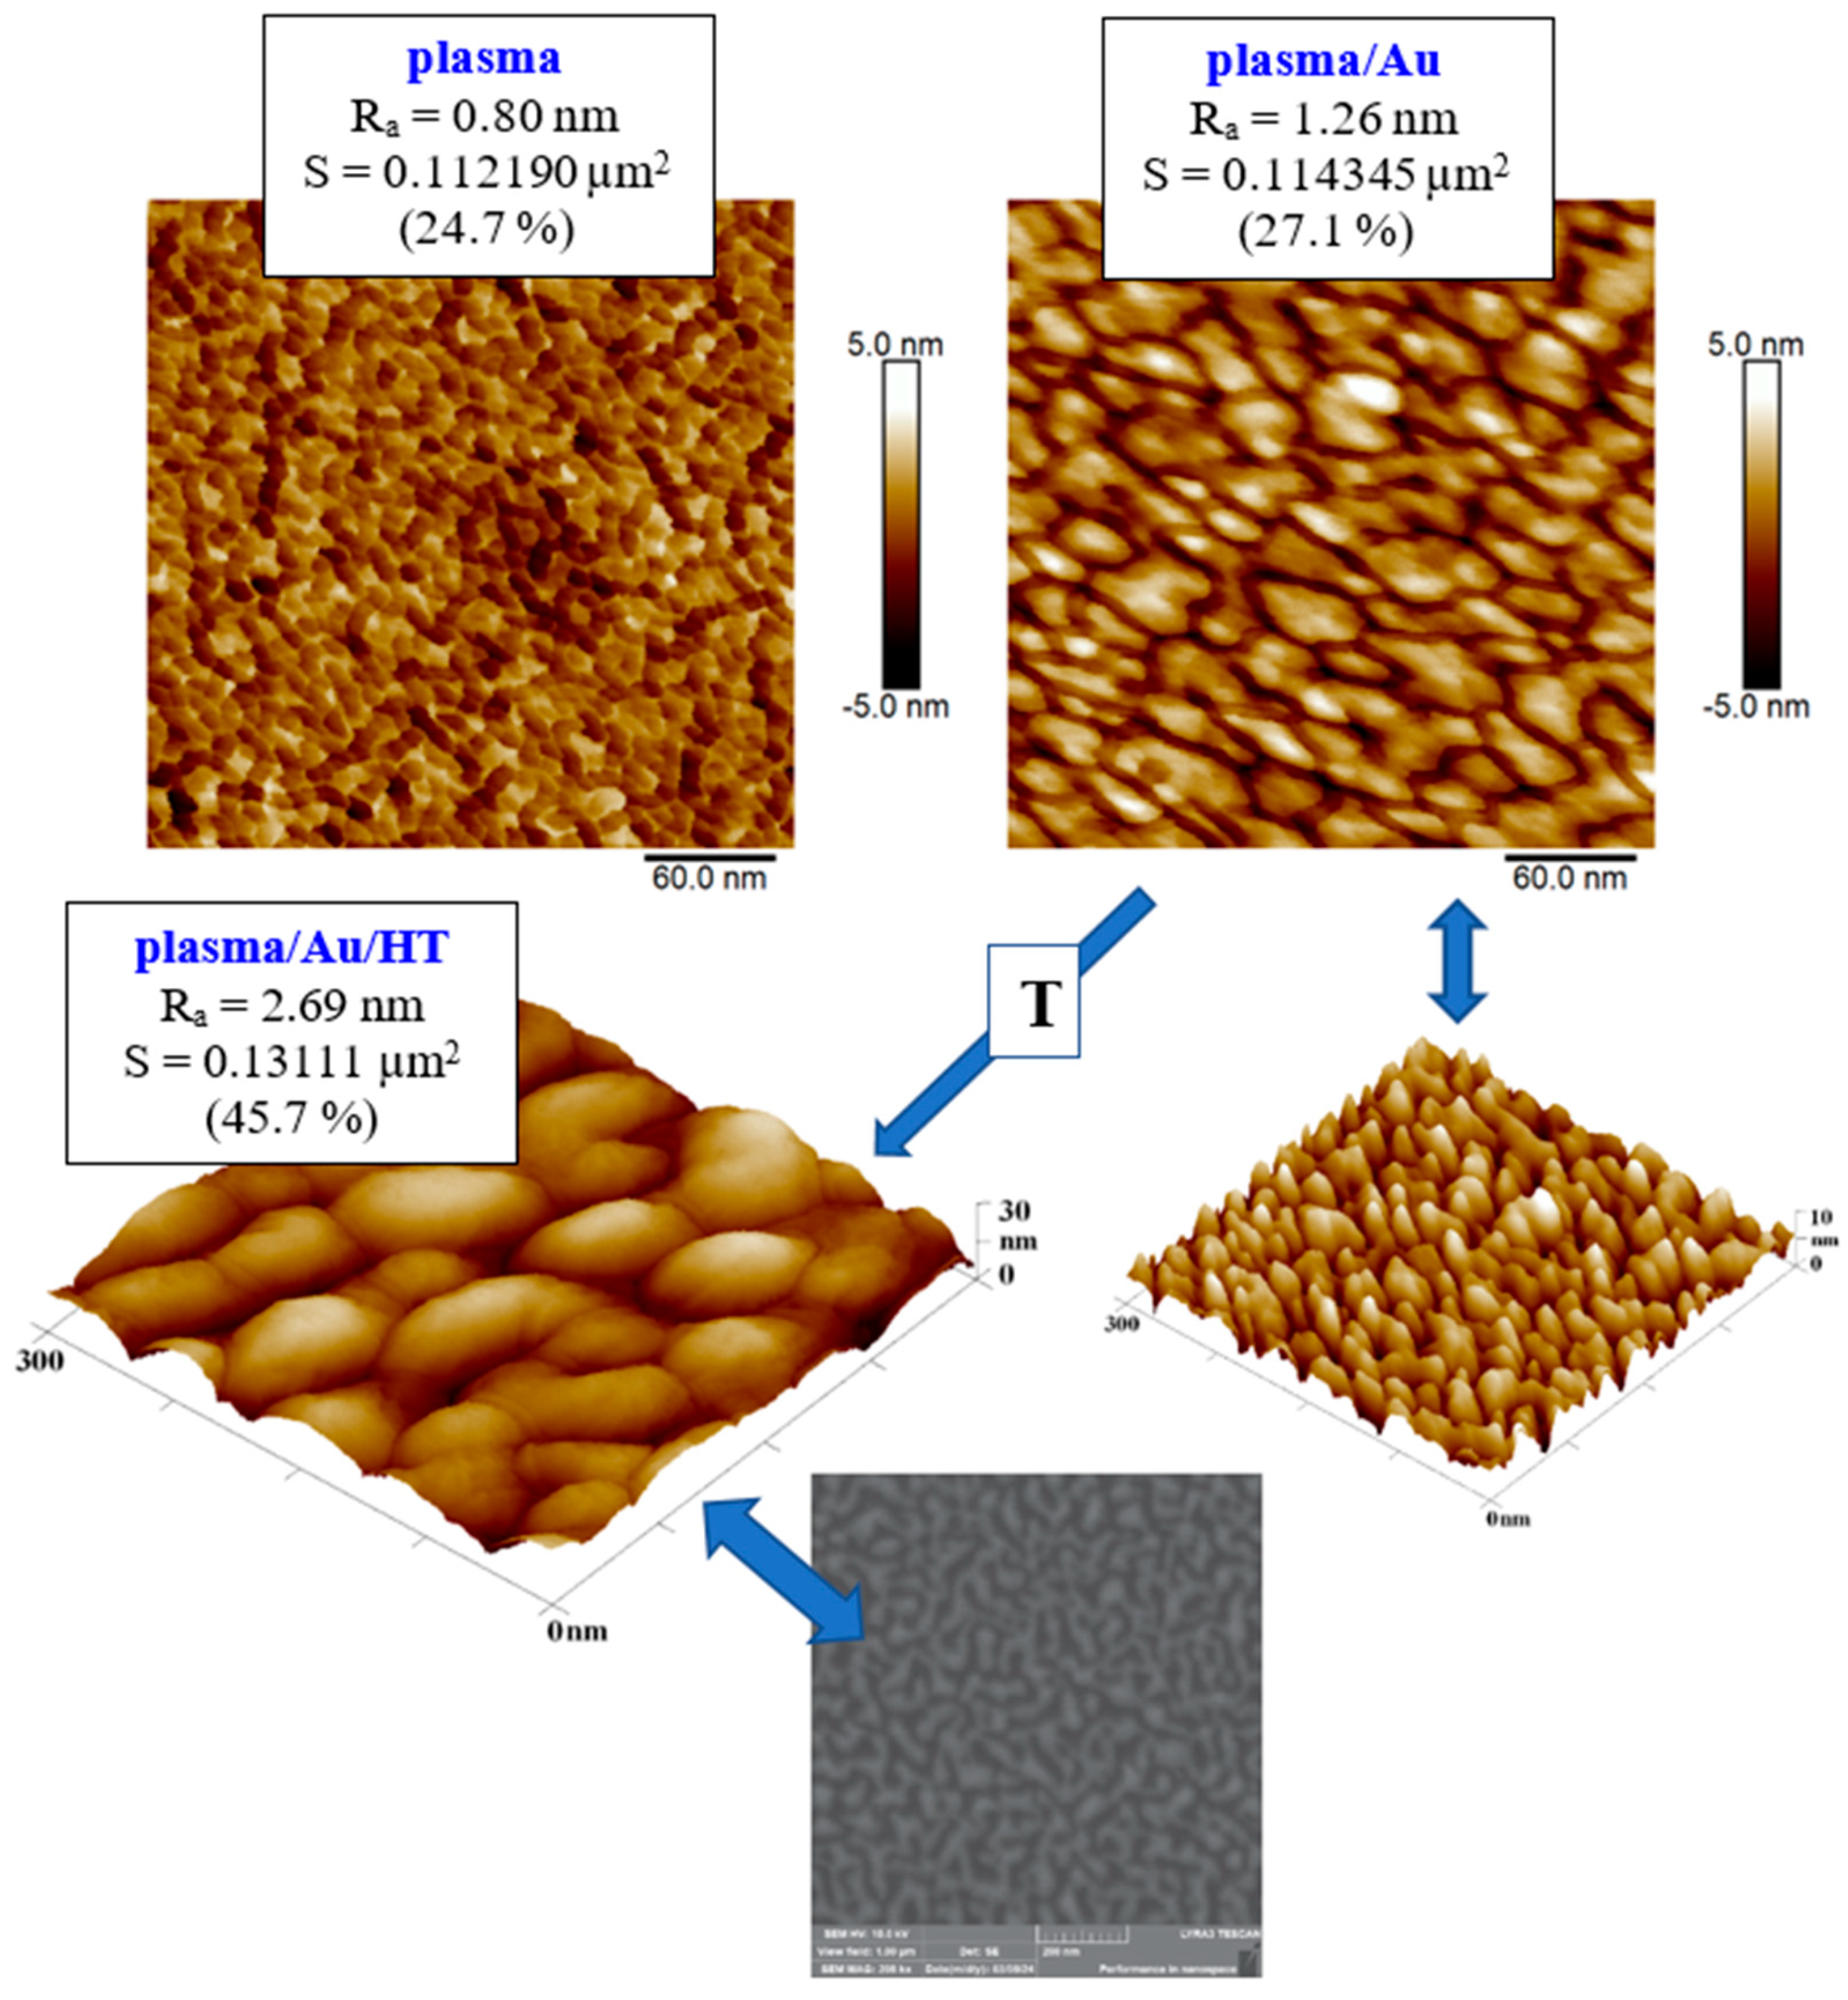
Figure 7.
Comparison of the surface morphology (a) before and (b) after thermal stress of a COC foil with a layer of gold deposited 1469 s and surface of COC foil with Au layer deposited 1469 s after laser exposure (c). 3D AFM images of an area of 1 x 1 μm2.
Figure 7.
Comparison of the surface morphology (a) before and (b) after thermal stress of a COC foil with a layer of gold deposited 1469 s and surface of COC foil with Au layer deposited 1469 s after laser exposure (c). 3D AFM images of an area of 1 x 1 μm2.
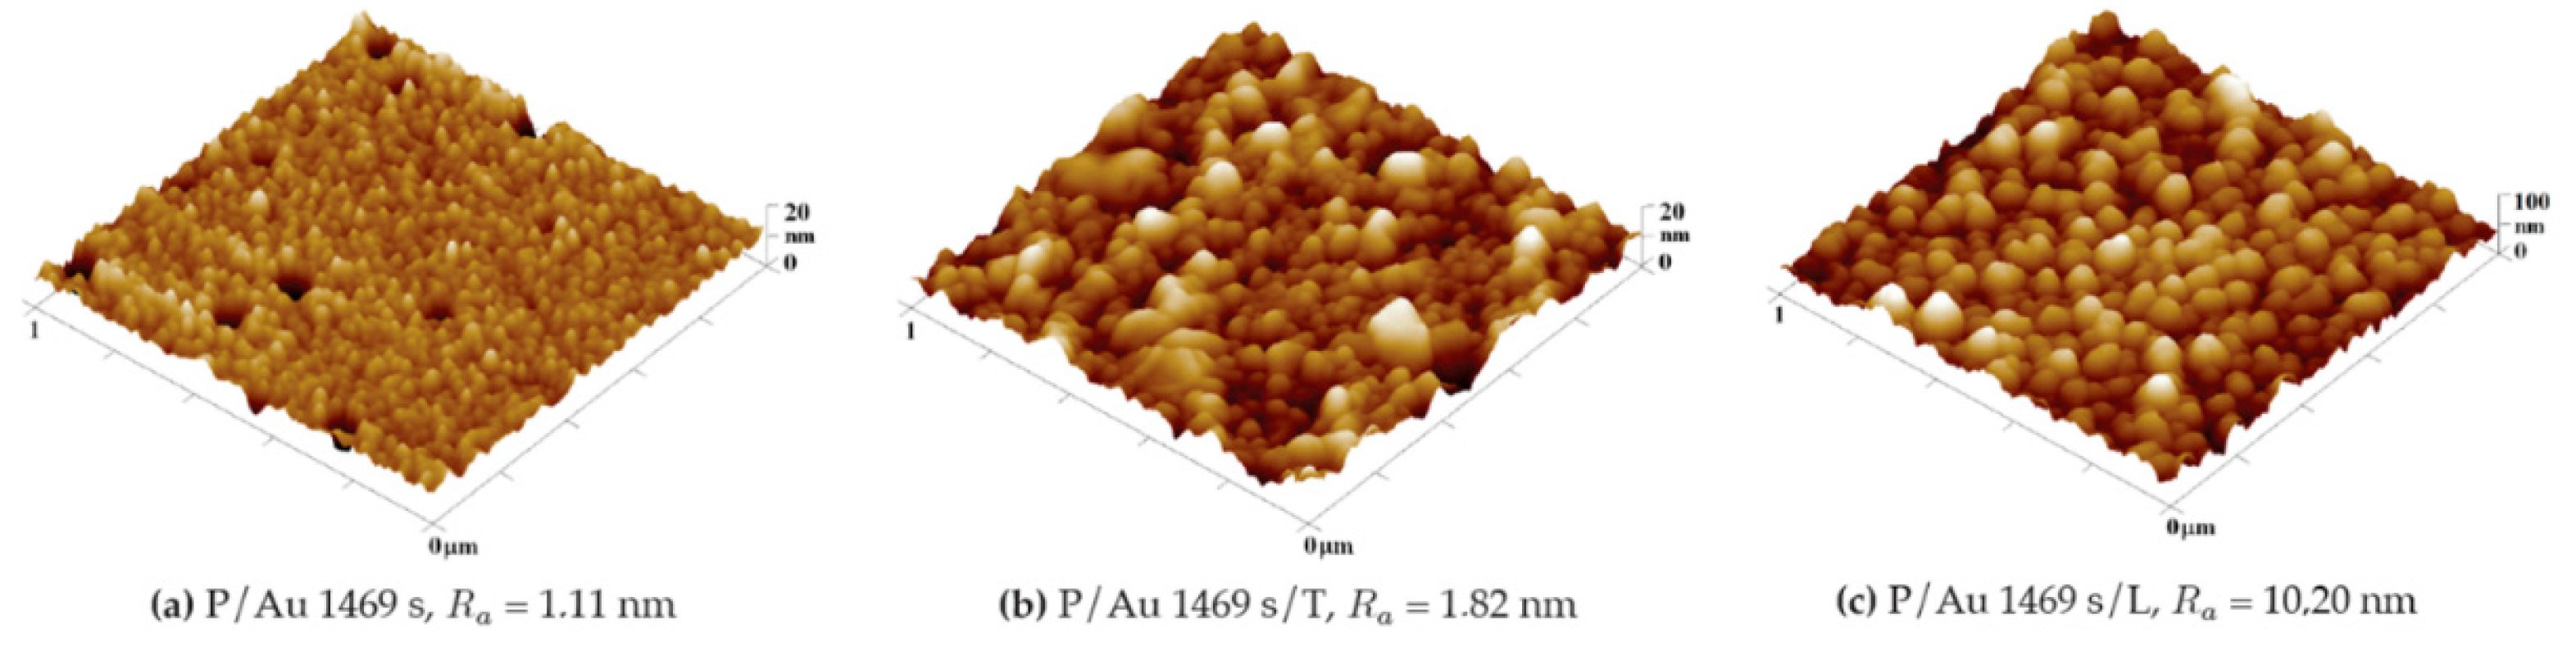
Figure 8.
Comparison of the surface morphology (a) before and (b) after thermal stress of a COC foil with a layer of gold deposited 293 s and surface of COC foil with Au layer deposited 1469 s after laser exposure. 3D AFM images of an area of 1 x 1 μm2.
Figure 8.
Comparison of the surface morphology (a) before and (b) after thermal stress of a COC foil with a layer of gold deposited 293 s and surface of COC foil with Au layer deposited 1469 s after laser exposure. 3D AFM images of an area of 1 x 1 μm2.
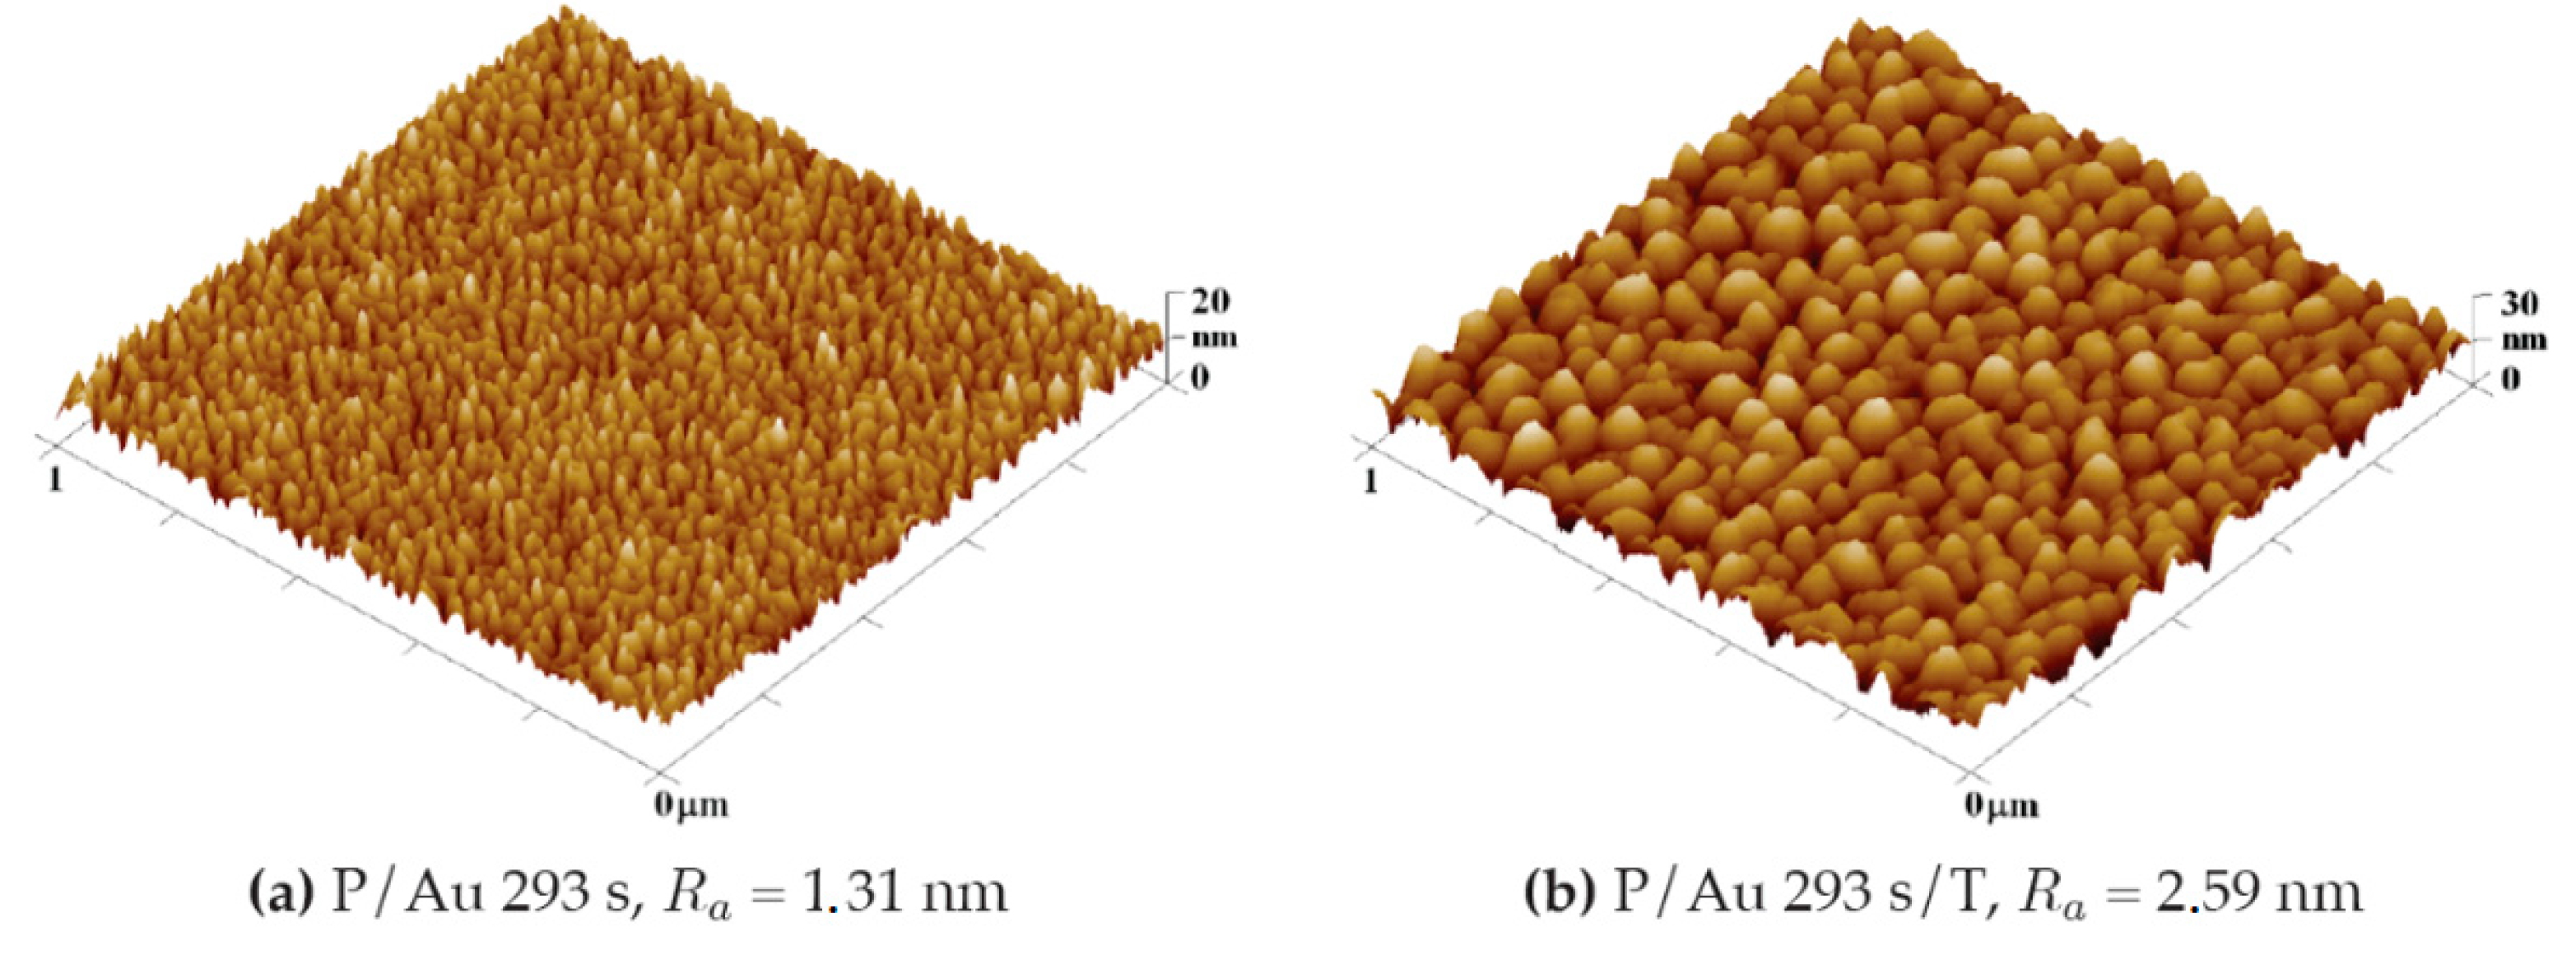
Figure 9.
Comparison of the surface morphology (a) before and (b) after thermal stress of a COC foil with a silver layer deposited for 300 s and the same set for deposition time 2000 s (c and d) 3D AFM images of an area of 1 x 1 μm2.
Figure 9.
Comparison of the surface morphology (a) before and (b) after thermal stress of a COC foil with a silver layer deposited for 300 s and the same set for deposition time 2000 s (c and d) 3D AFM images of an area of 1 x 1 μm2.
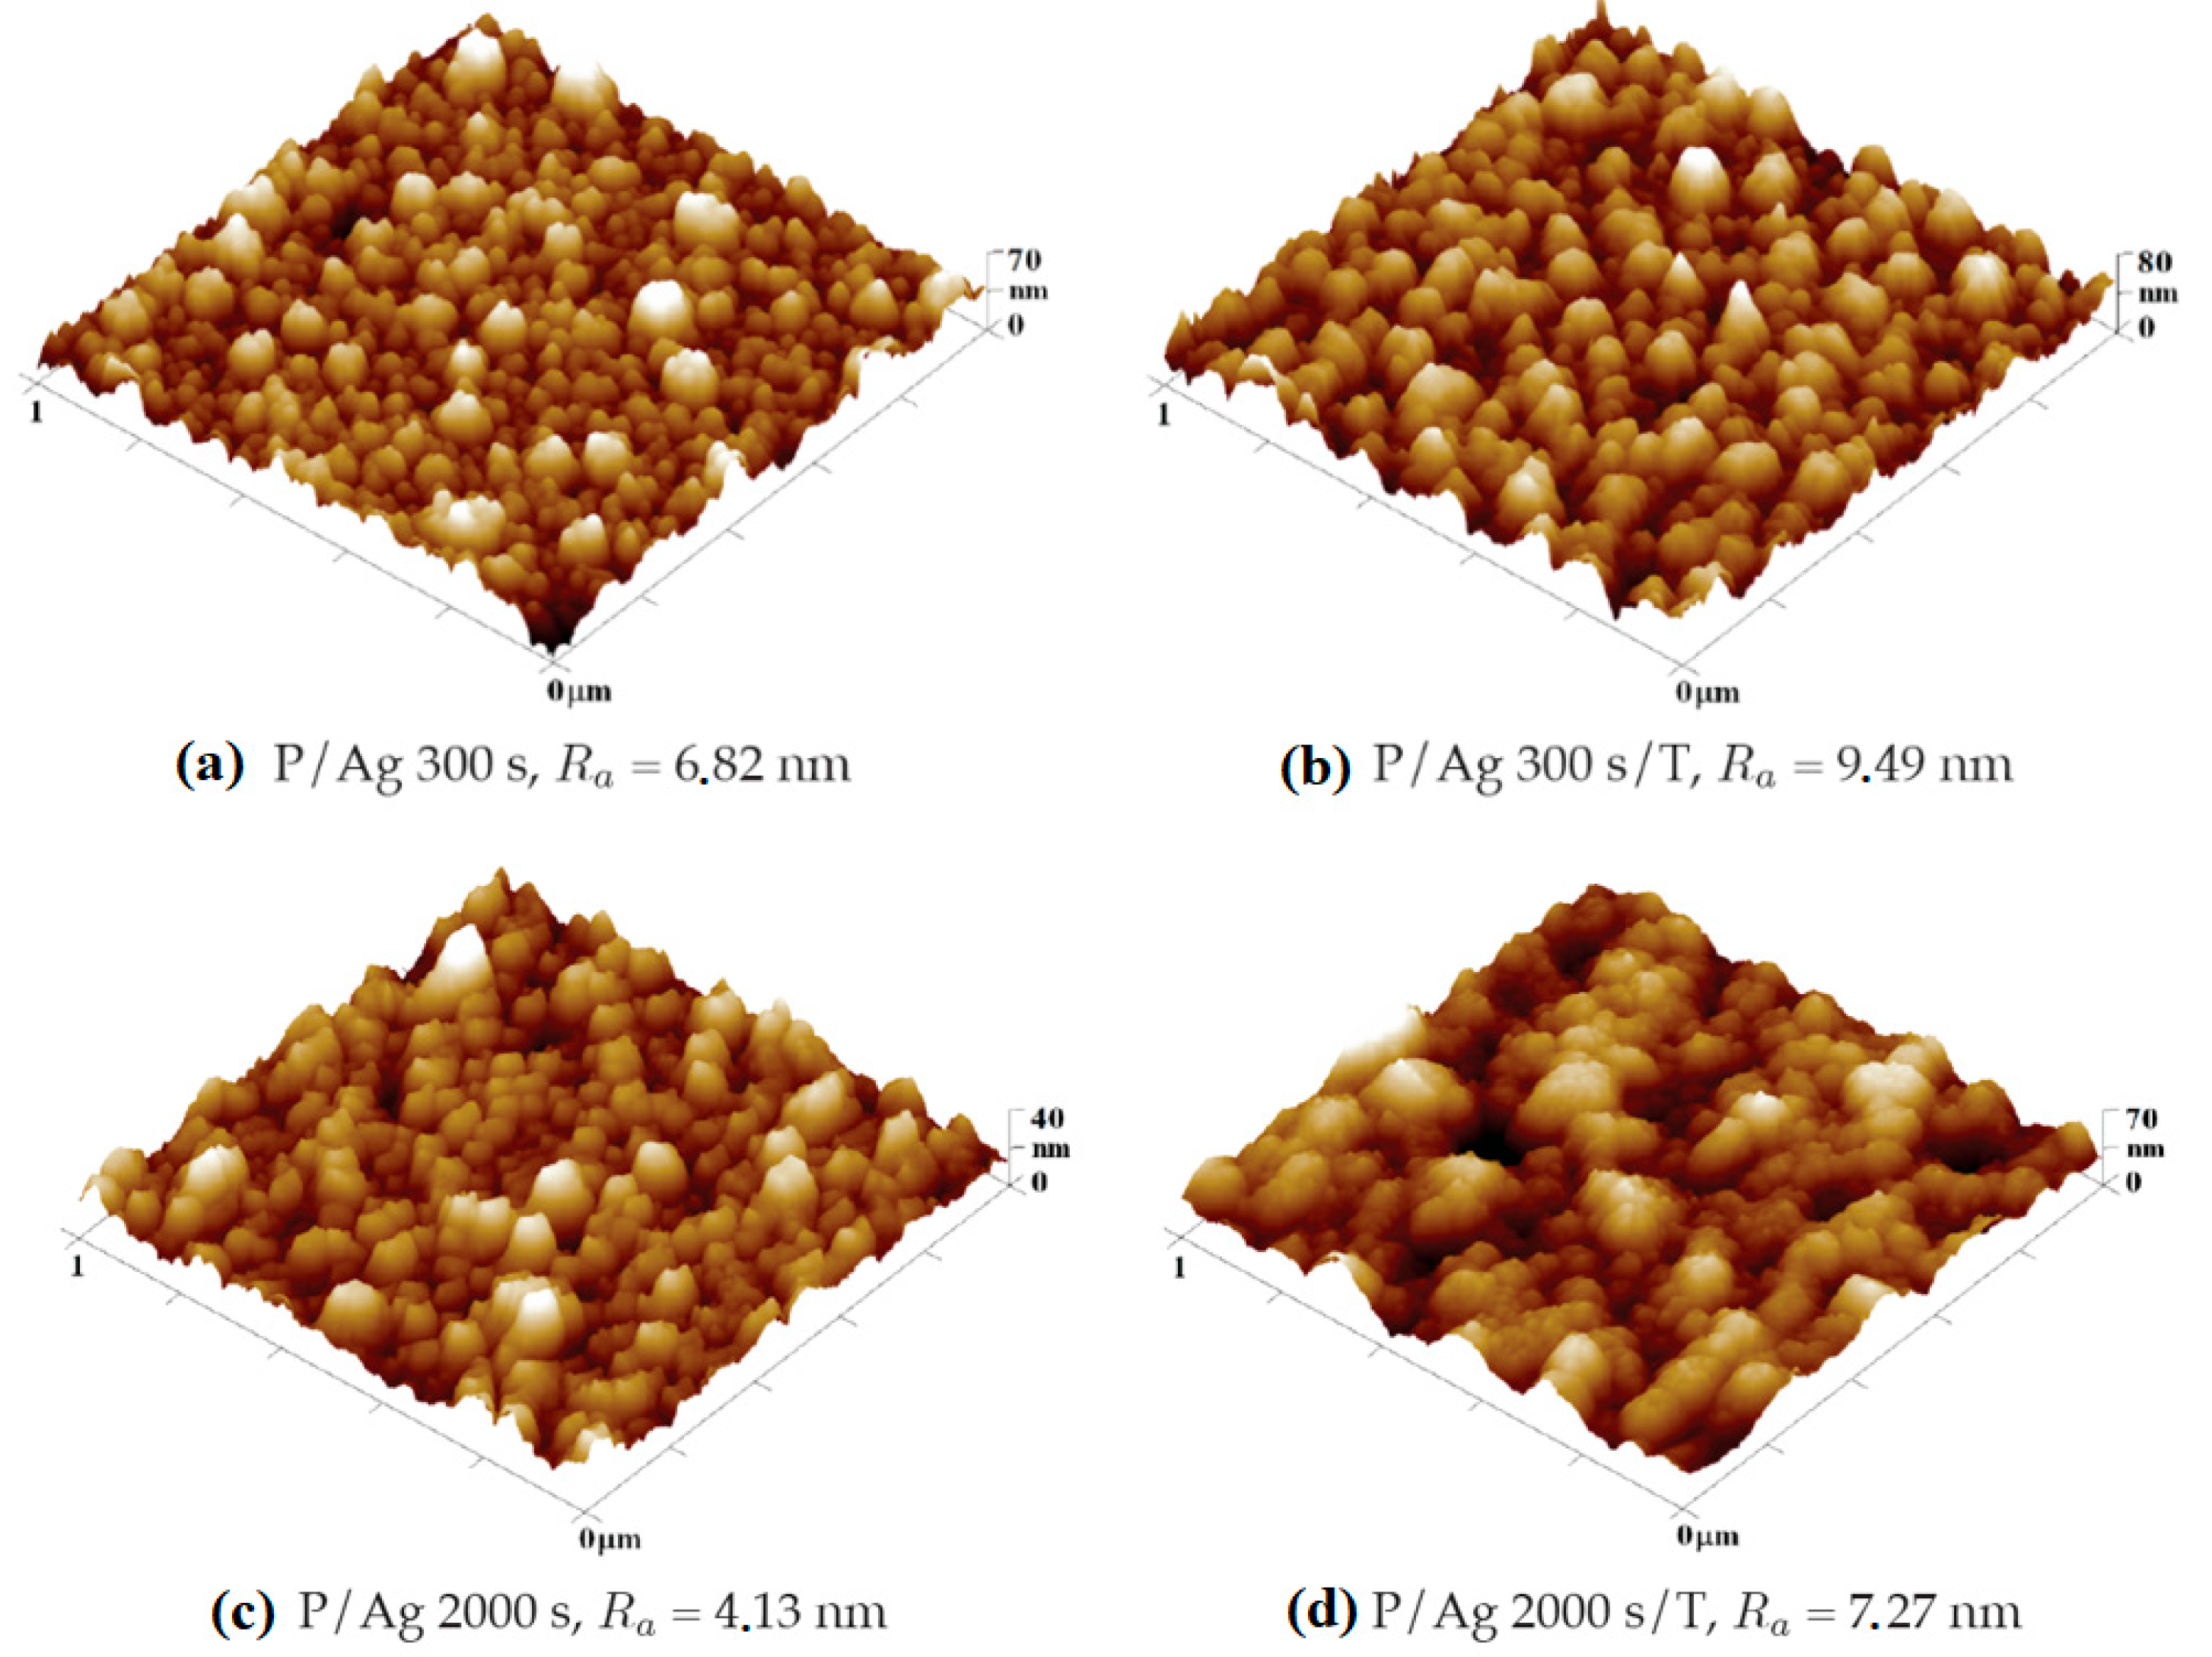
Figure 10.
Roughness values Ra COC of the surface of unmodified (pristine), modified by plasma (plasma), thermal stress (T), laser KrF beam (L) and deposited with different thickness/deposition time of Ag. Blue corresponds to non-deposited samples, green to samples with deposited silver layer. 3D AFM images of an area of 1 x 1 μm2.
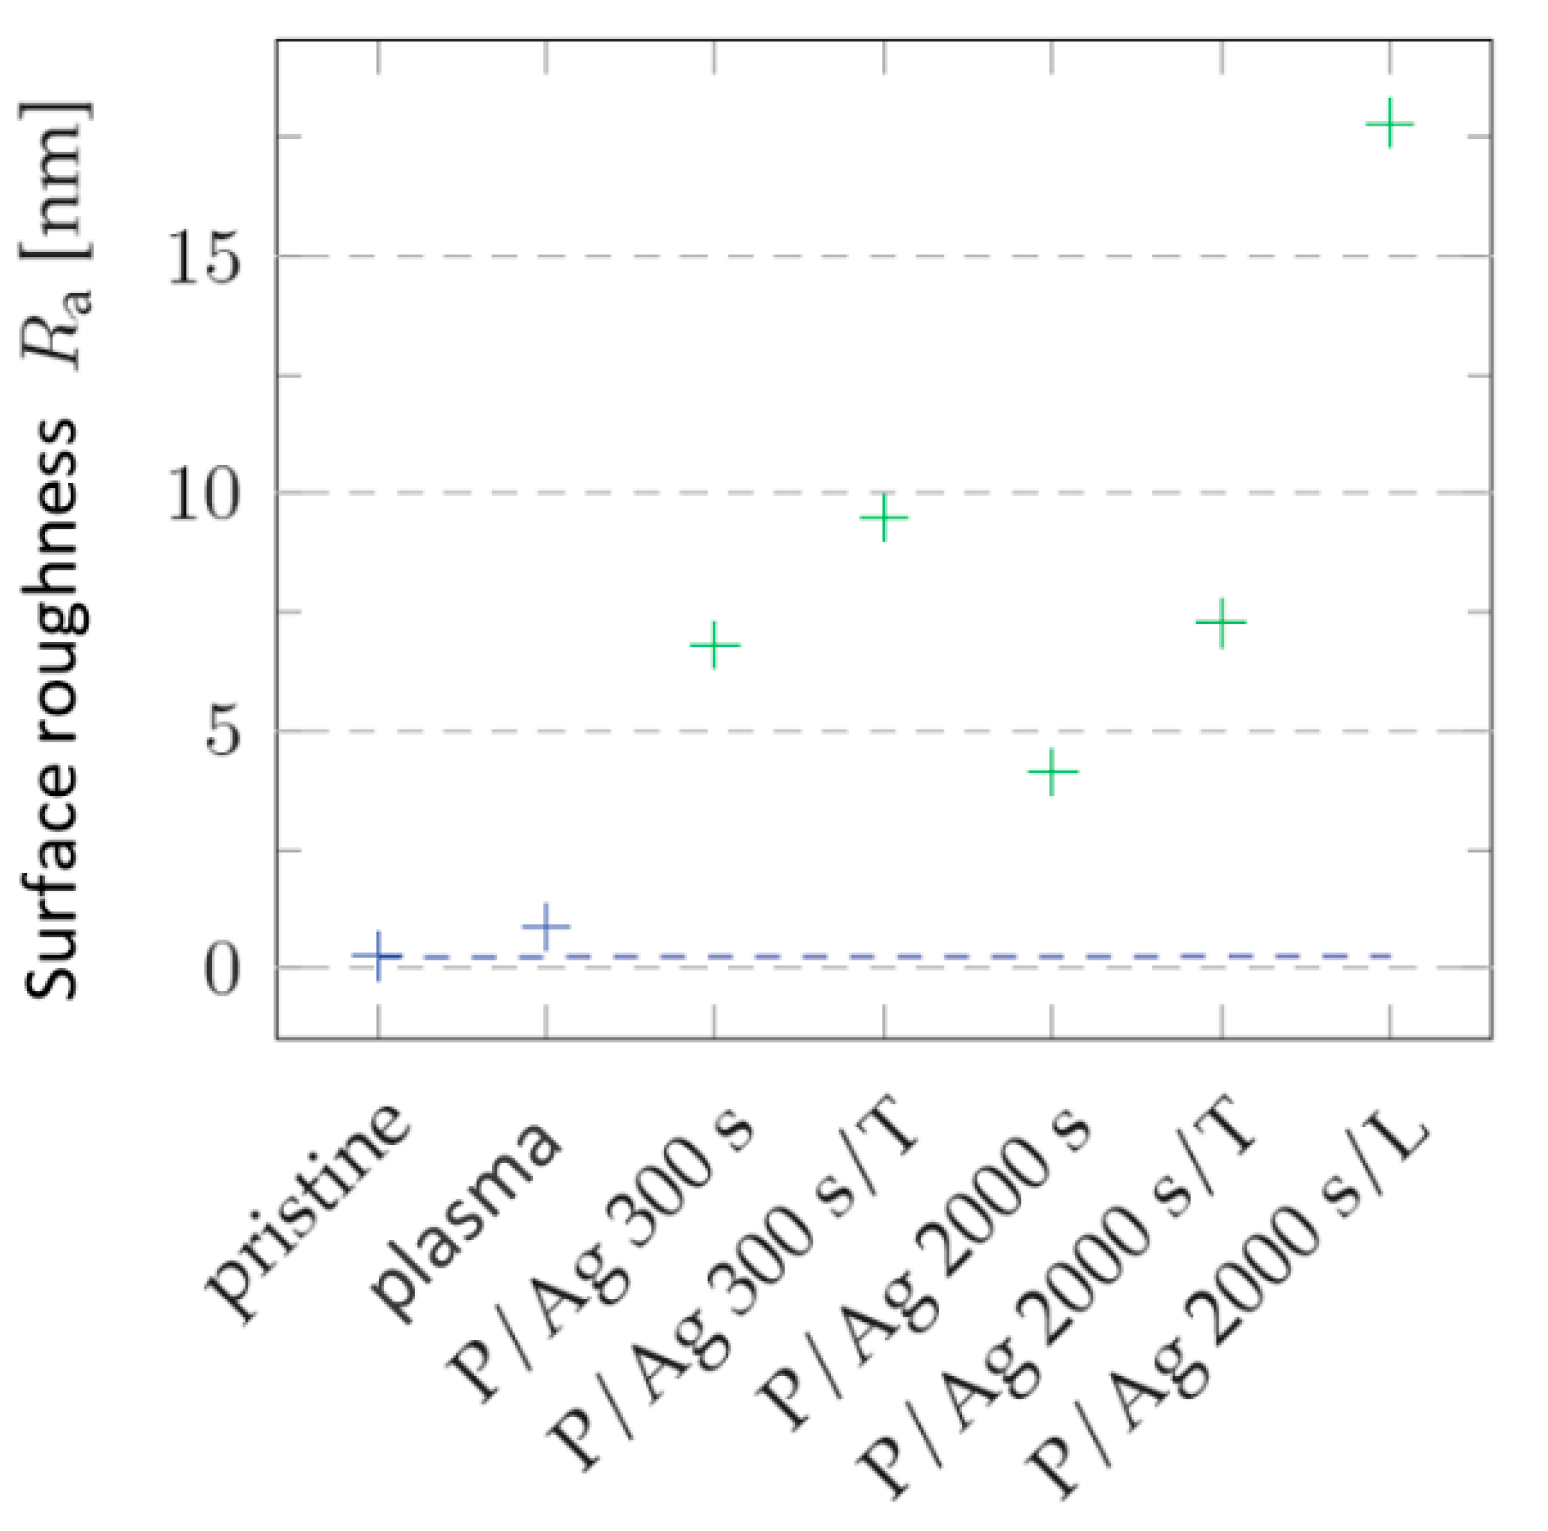
Figure 11.
Dependence of the number of Escherichia coli CFUs after 24 hours of cultivation on the type of COC foil sample with layers of (a) gold particles = red and (b) silver particles = green, samples without deposited metal = blue, control = black.
Figure 11.
Dependence of the number of Escherichia coli CFUs after 24 hours of cultivation on the type of COC foil sample with layers of (a) gold particles = red and (b) silver particles = green, samples without deposited metal = blue, control = black.
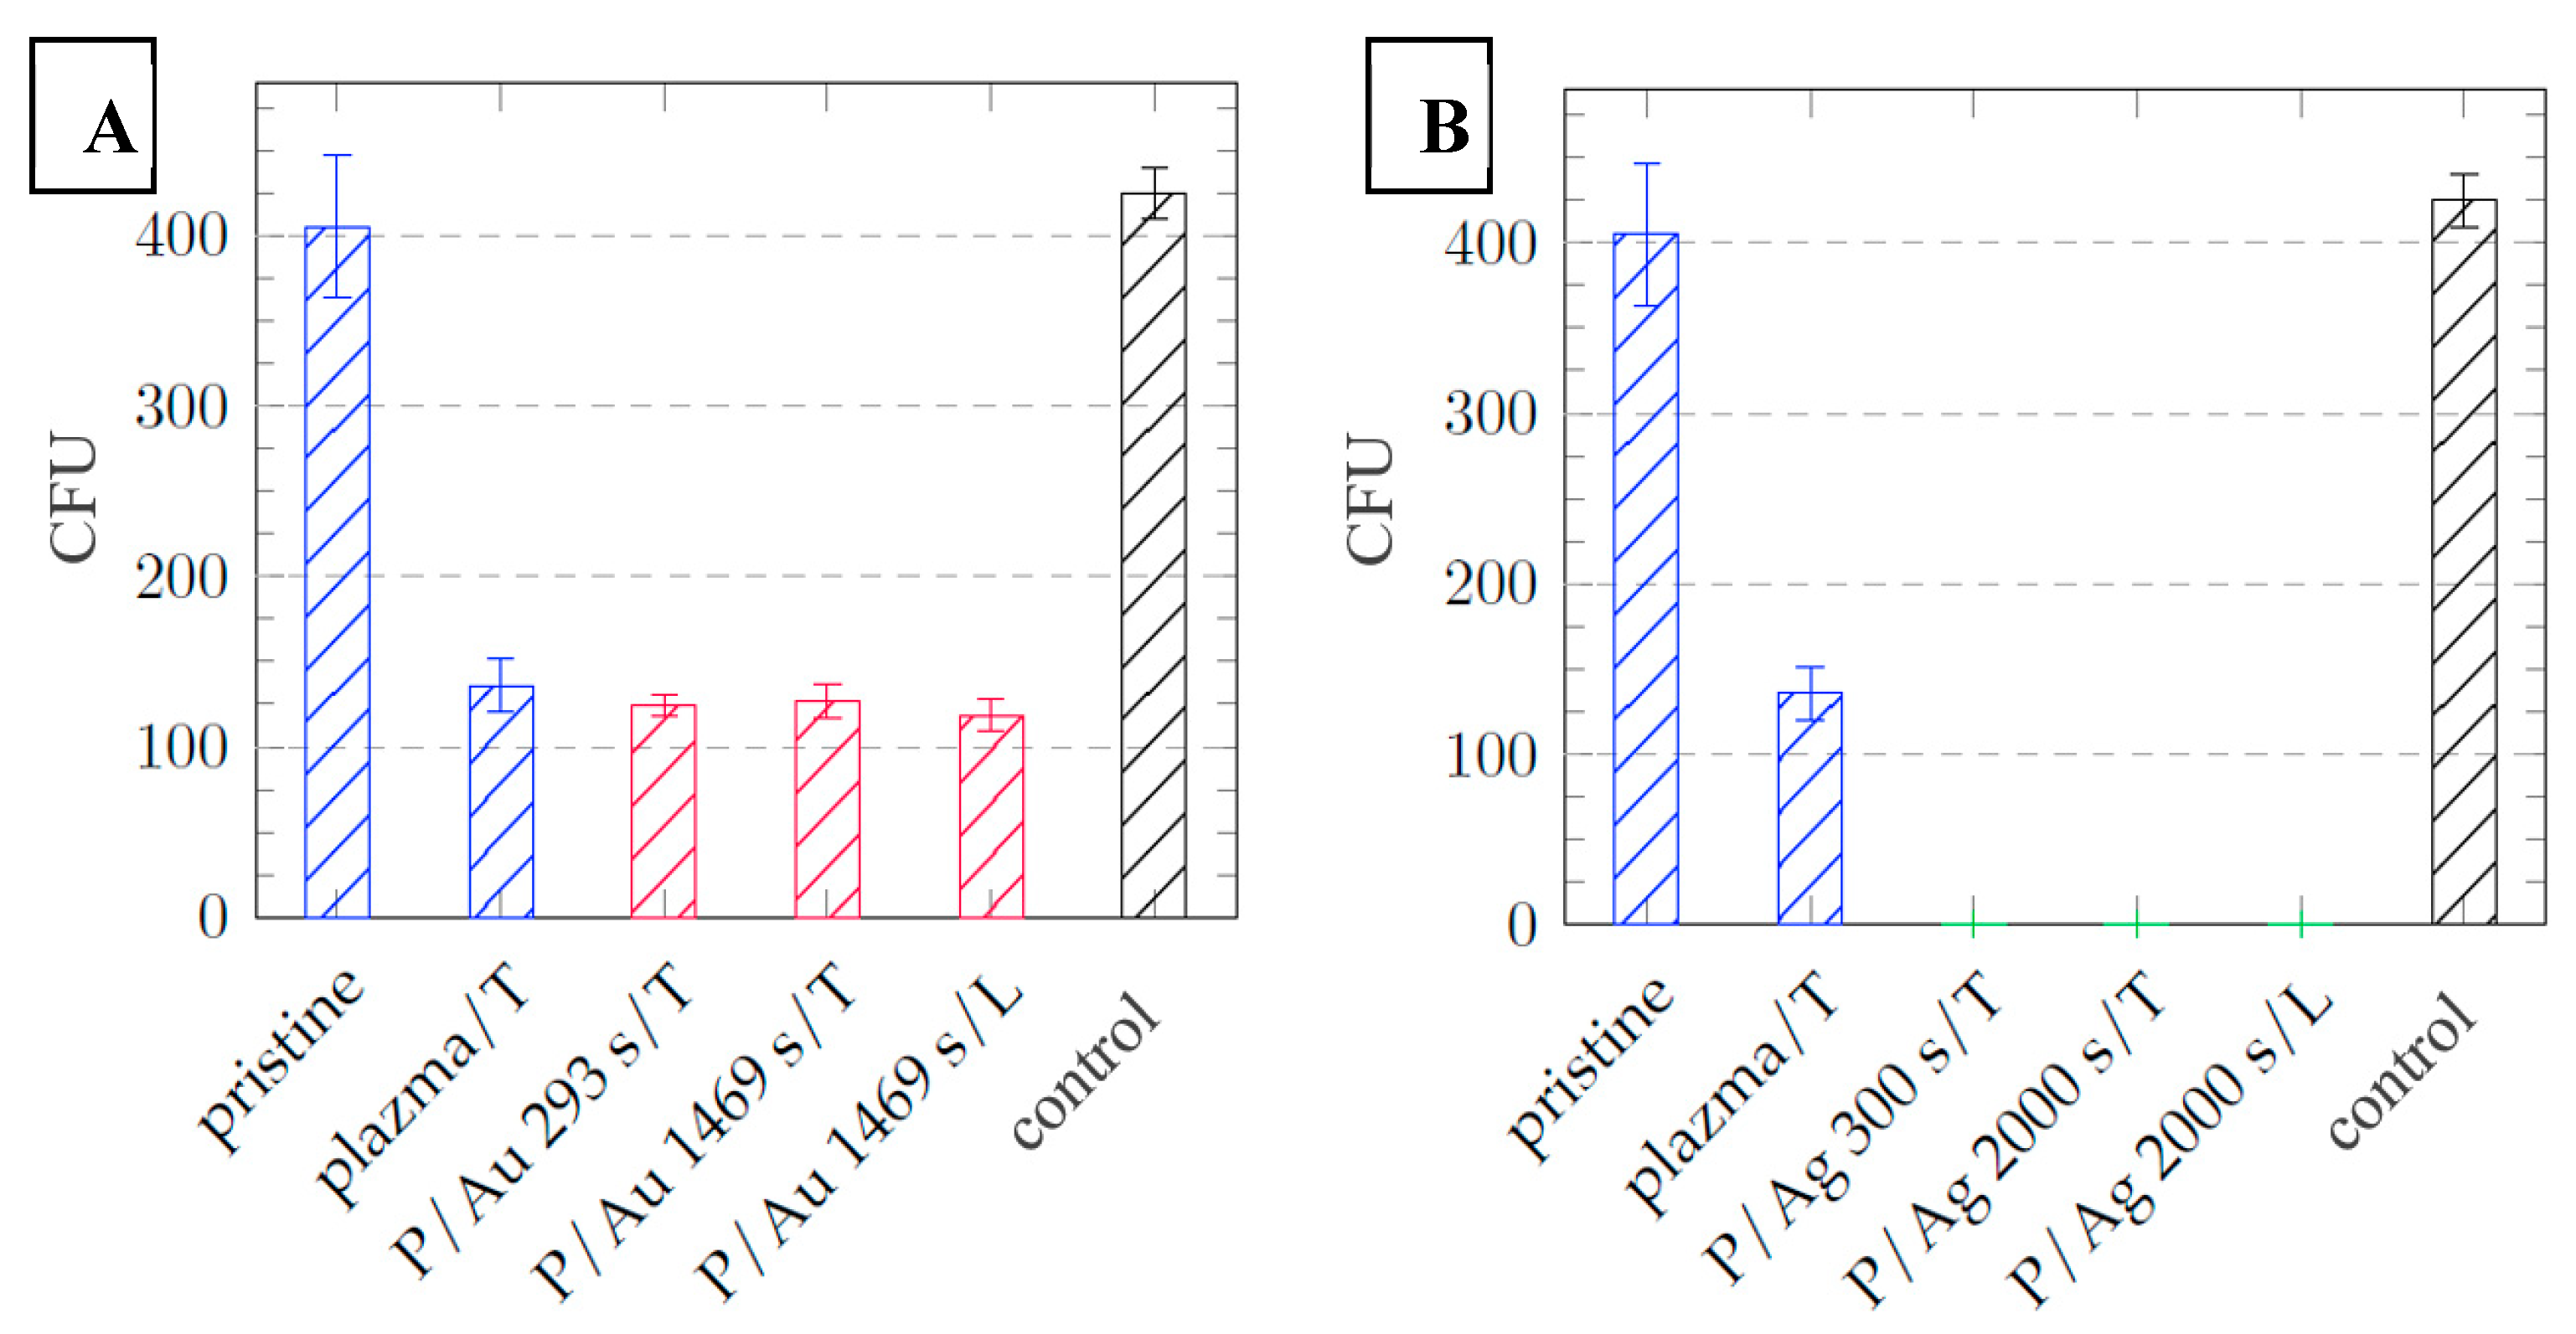
Figure 12.
Dependence of the number of CFU of Staphylococcus aureus after 24 hours of cultivation on the type of sample of COC films with layers of (a) gold particles = red and (b) silver particles = green, samples without deposited metal = blue, control = black.
Figure 12.
Dependence of the number of CFU of Staphylococcus aureus after 24 hours of cultivation on the type of sample of COC films with layers of (a) gold particles = red and (b) silver particles = green, samples without deposited metal = blue, control = black.
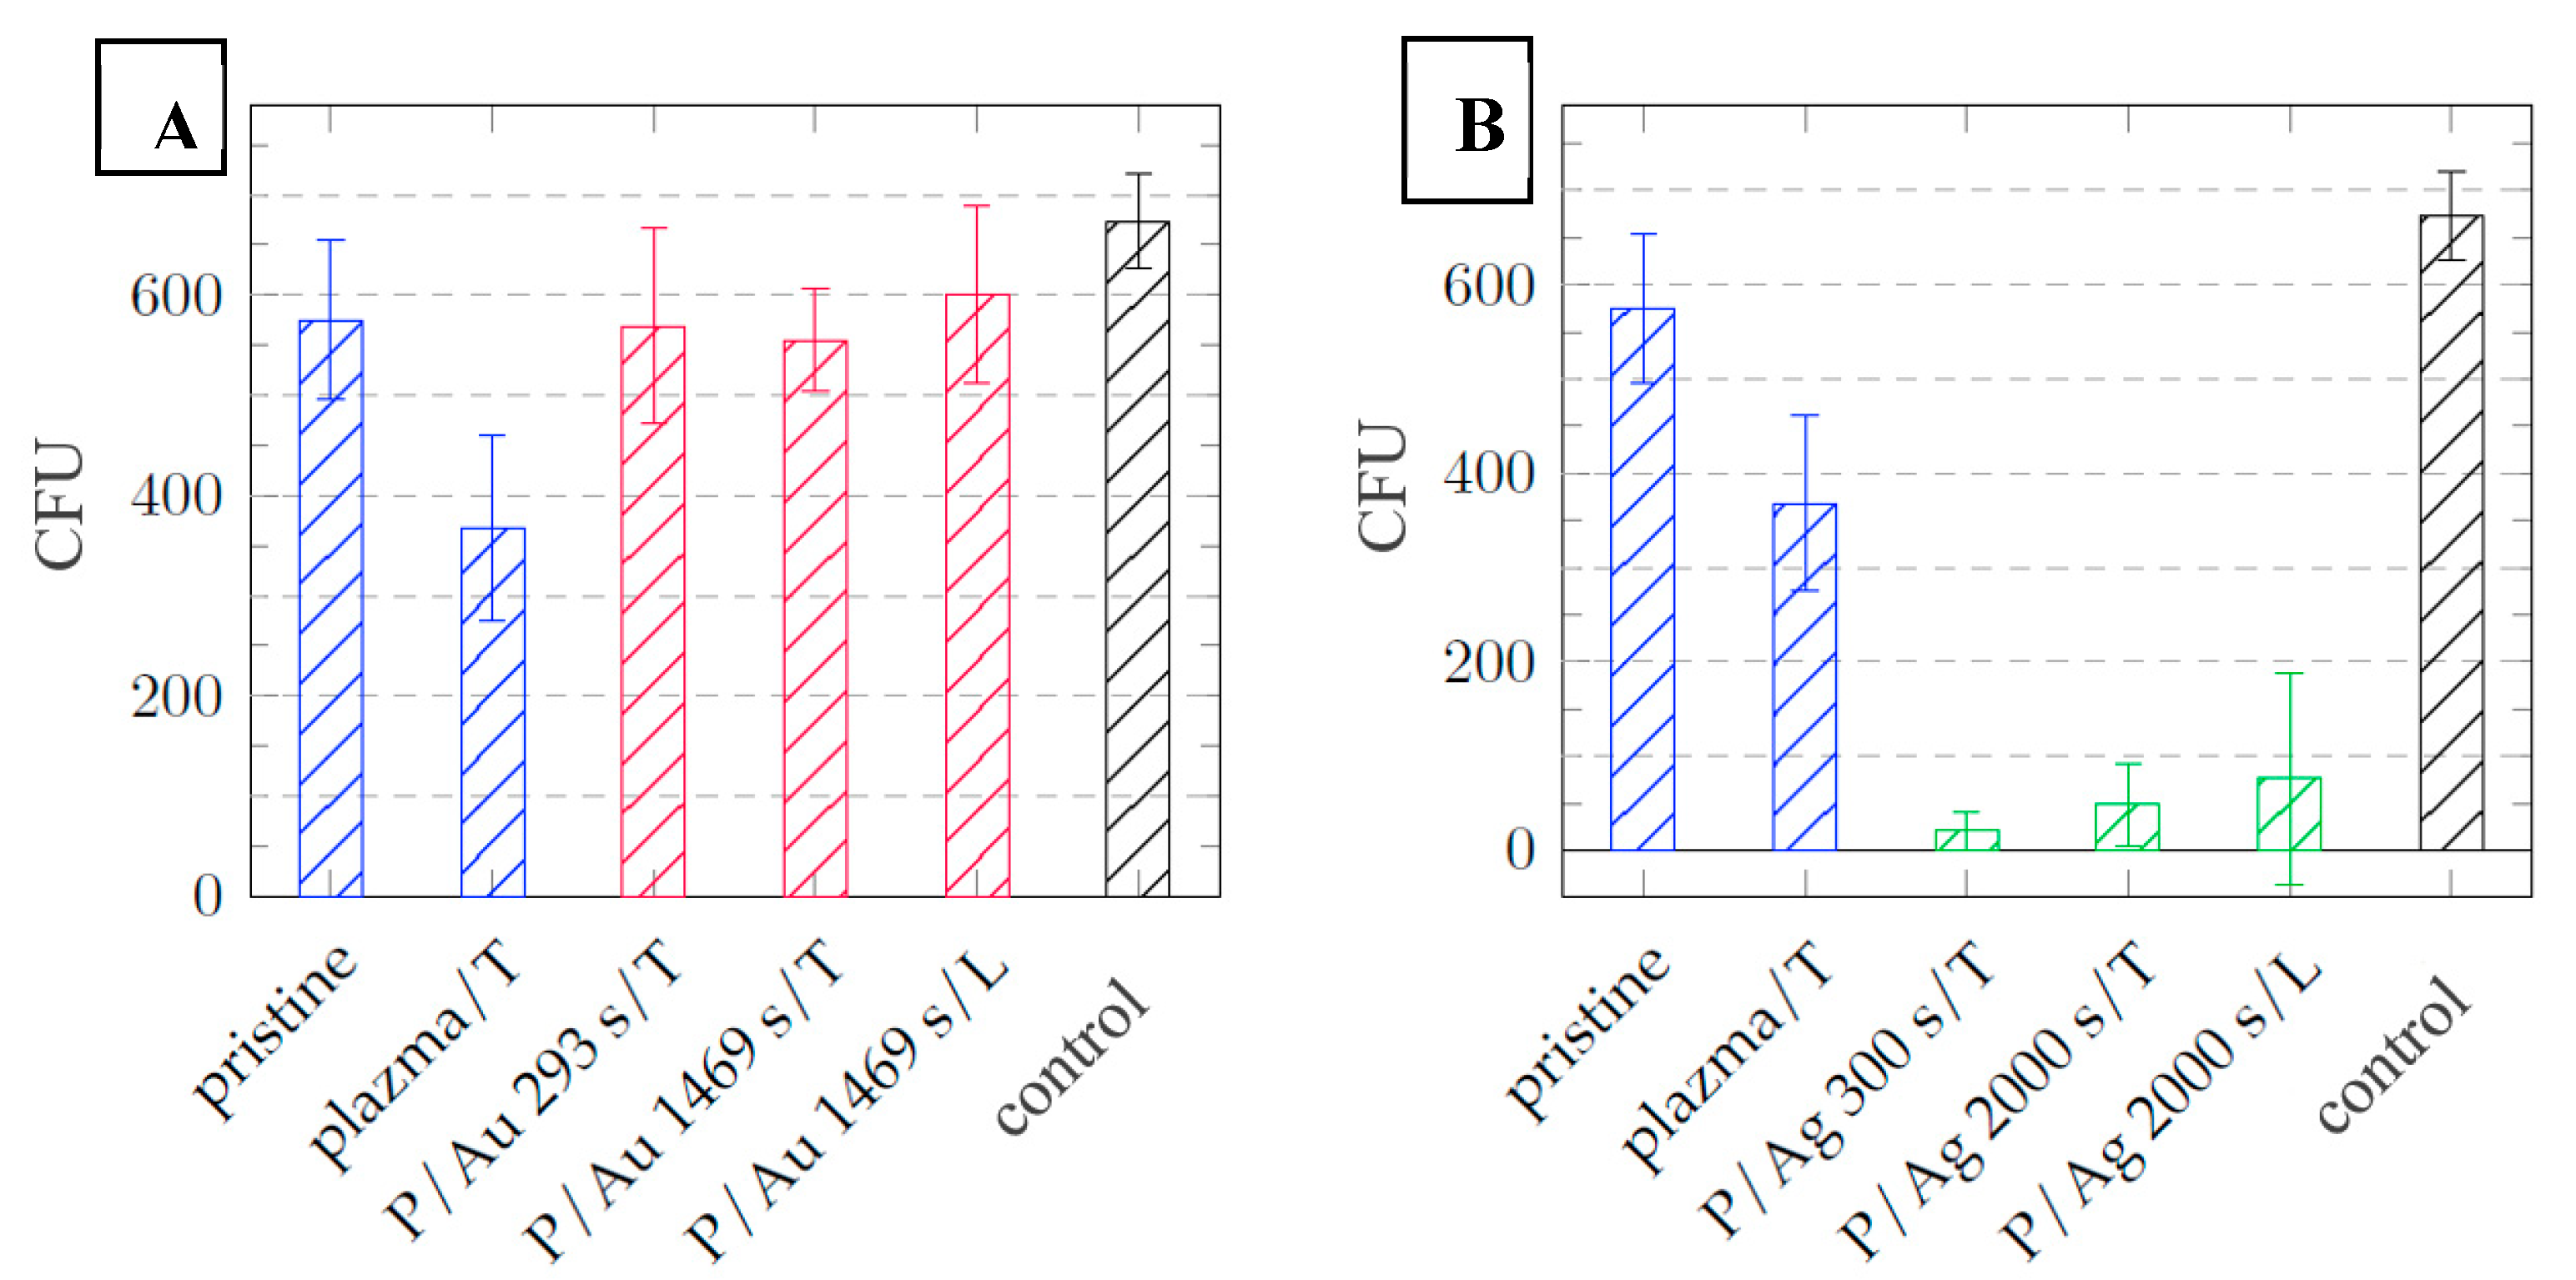
Figure 13.
Petri dishes after cultivation of individual Escherichia coli inocula with COC foil samples. Figures (d) and (e) show low antibacterial activity of Au surfaces, while (f) and (g) show significant antibacterial activity of Ag surfaces. COC samples: unmodified (pristine), modified by plasma (plasma, P), thermal stress (T), KrF laser beam (L) and deposited Au and Ag layers.
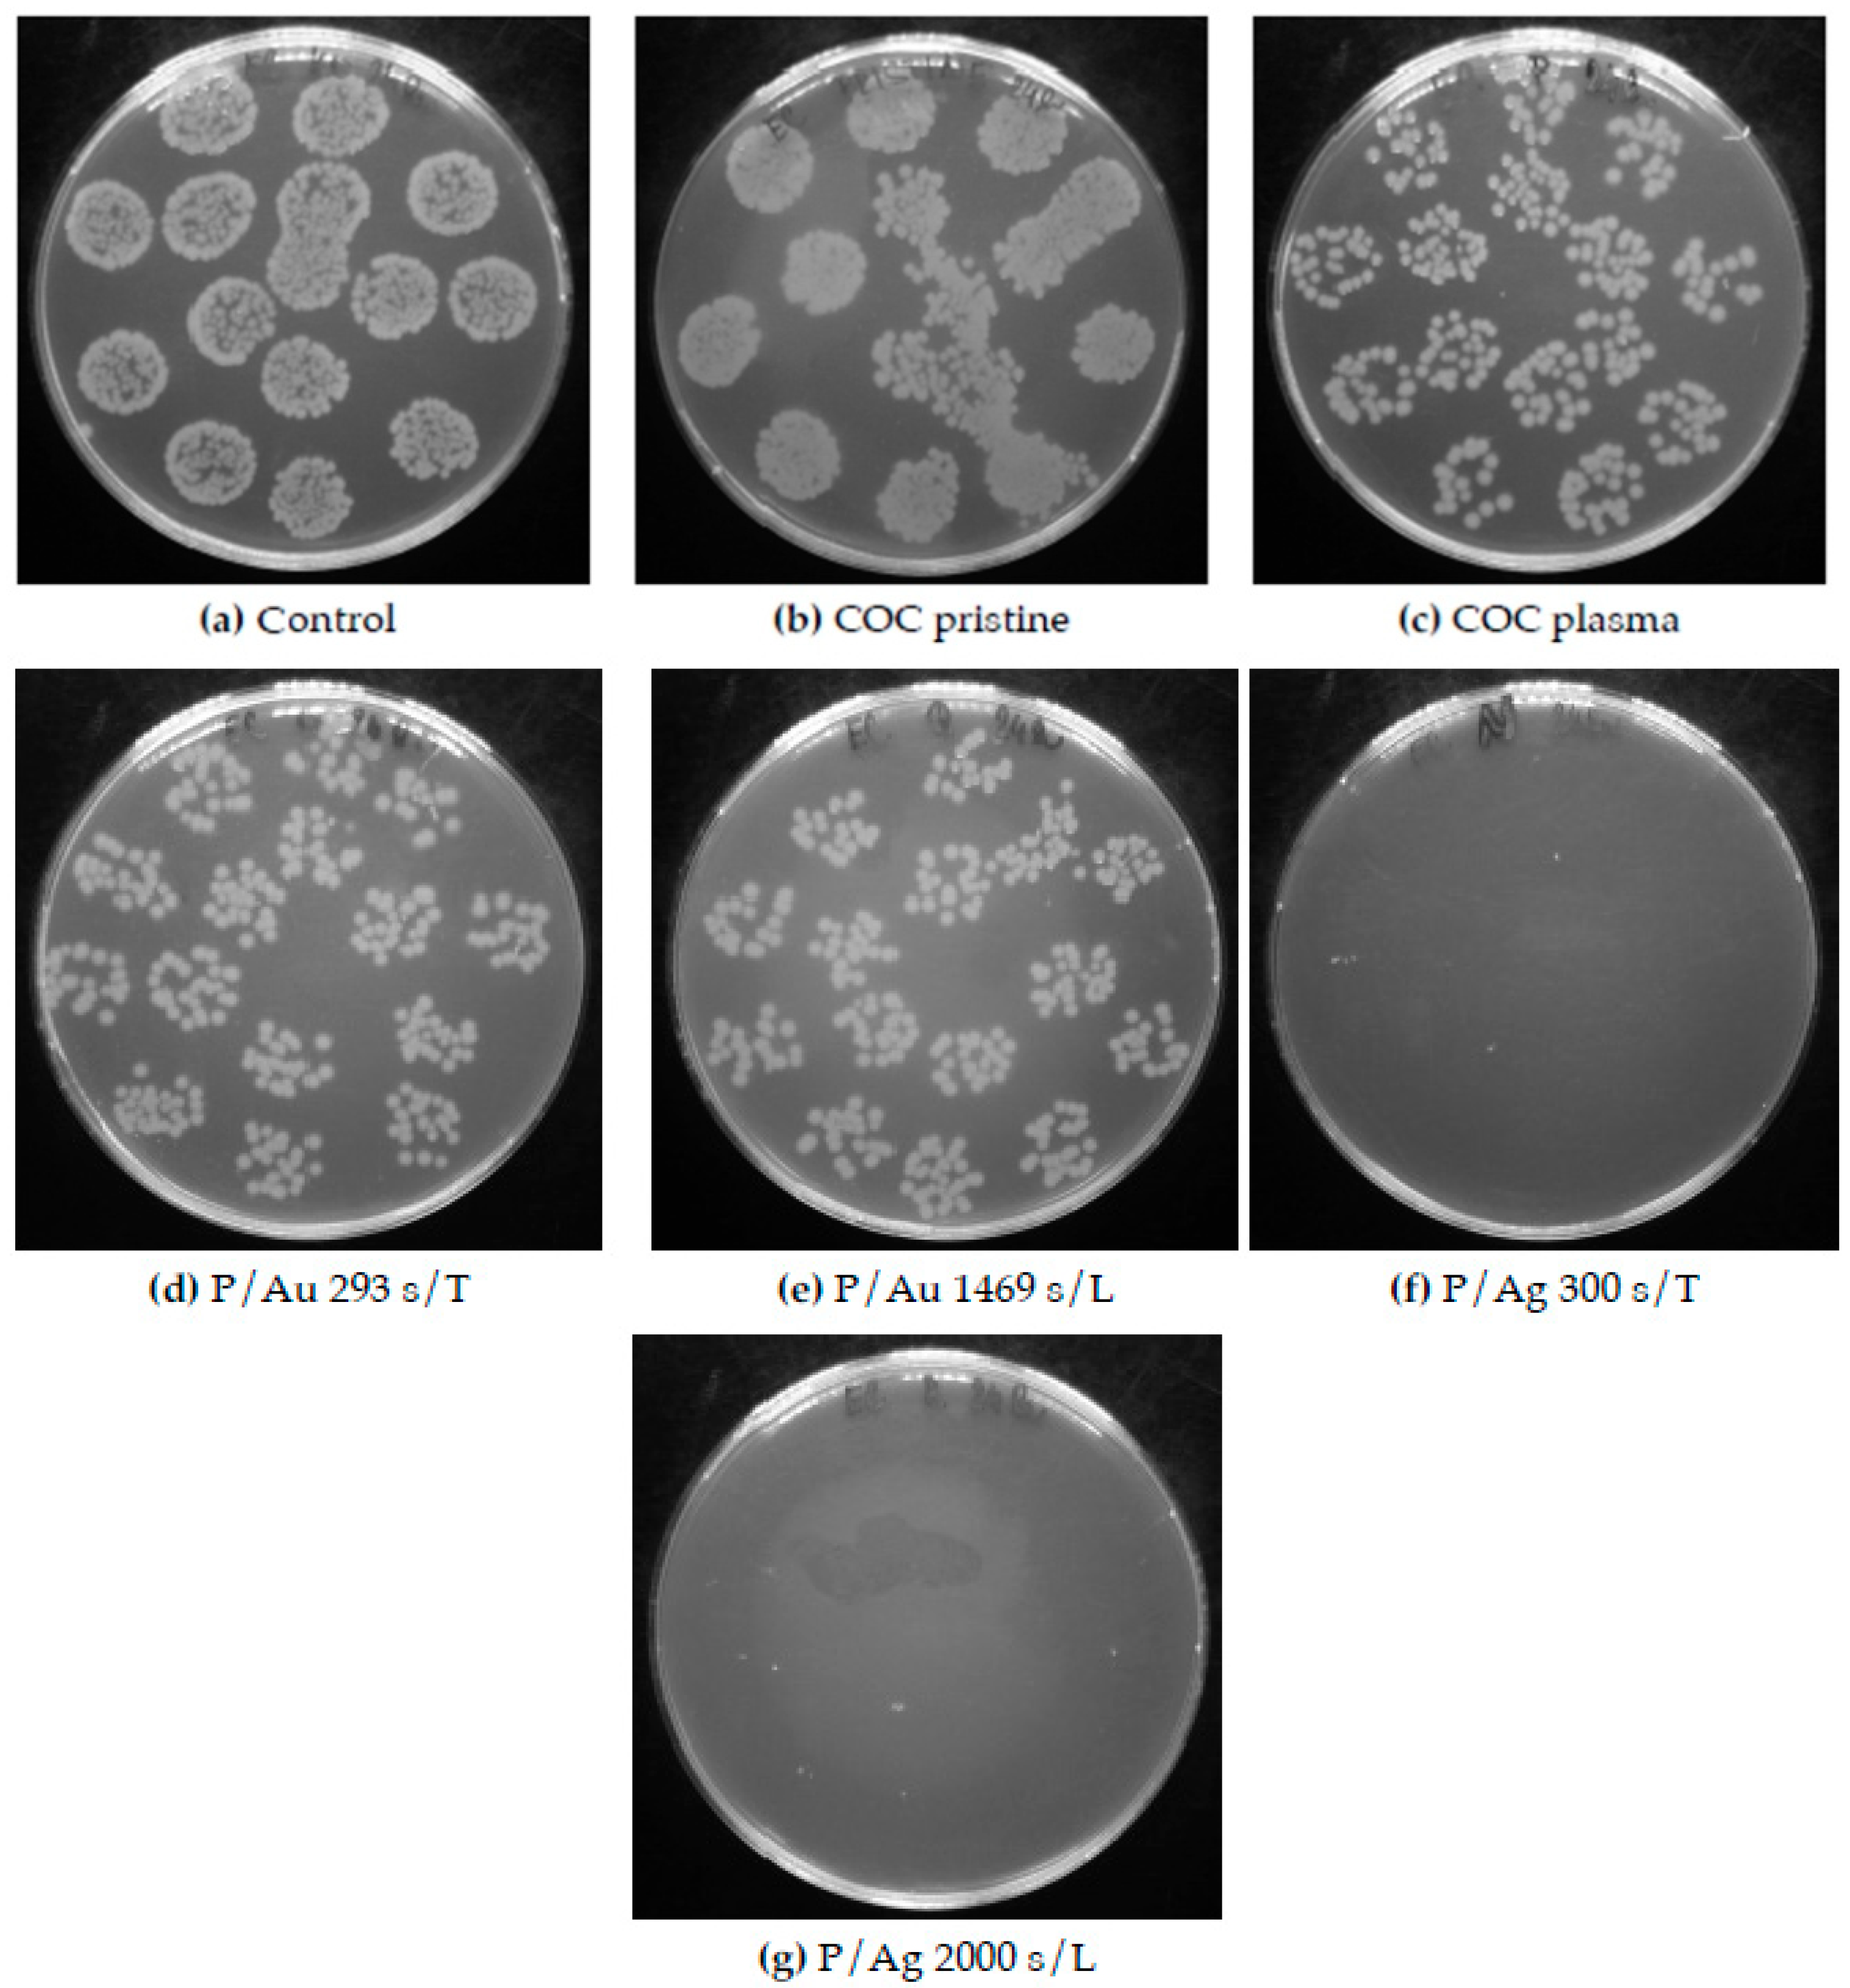
Figure 14.
Petri dishes after cultivation of individual inocula of Staphylococcus aureus with samples of COC films. Figures (d) and (e) show a small antibacterial activity of Au surfaces, in contrast to (f) and (g) a significant antibacterial activity of Ag surfaces is evident. COC samples: unmodified (pristine), modified by plasma (plasma, P), thermal stress (T), laser KrF beam (L) and deposited Au and Ag layers.
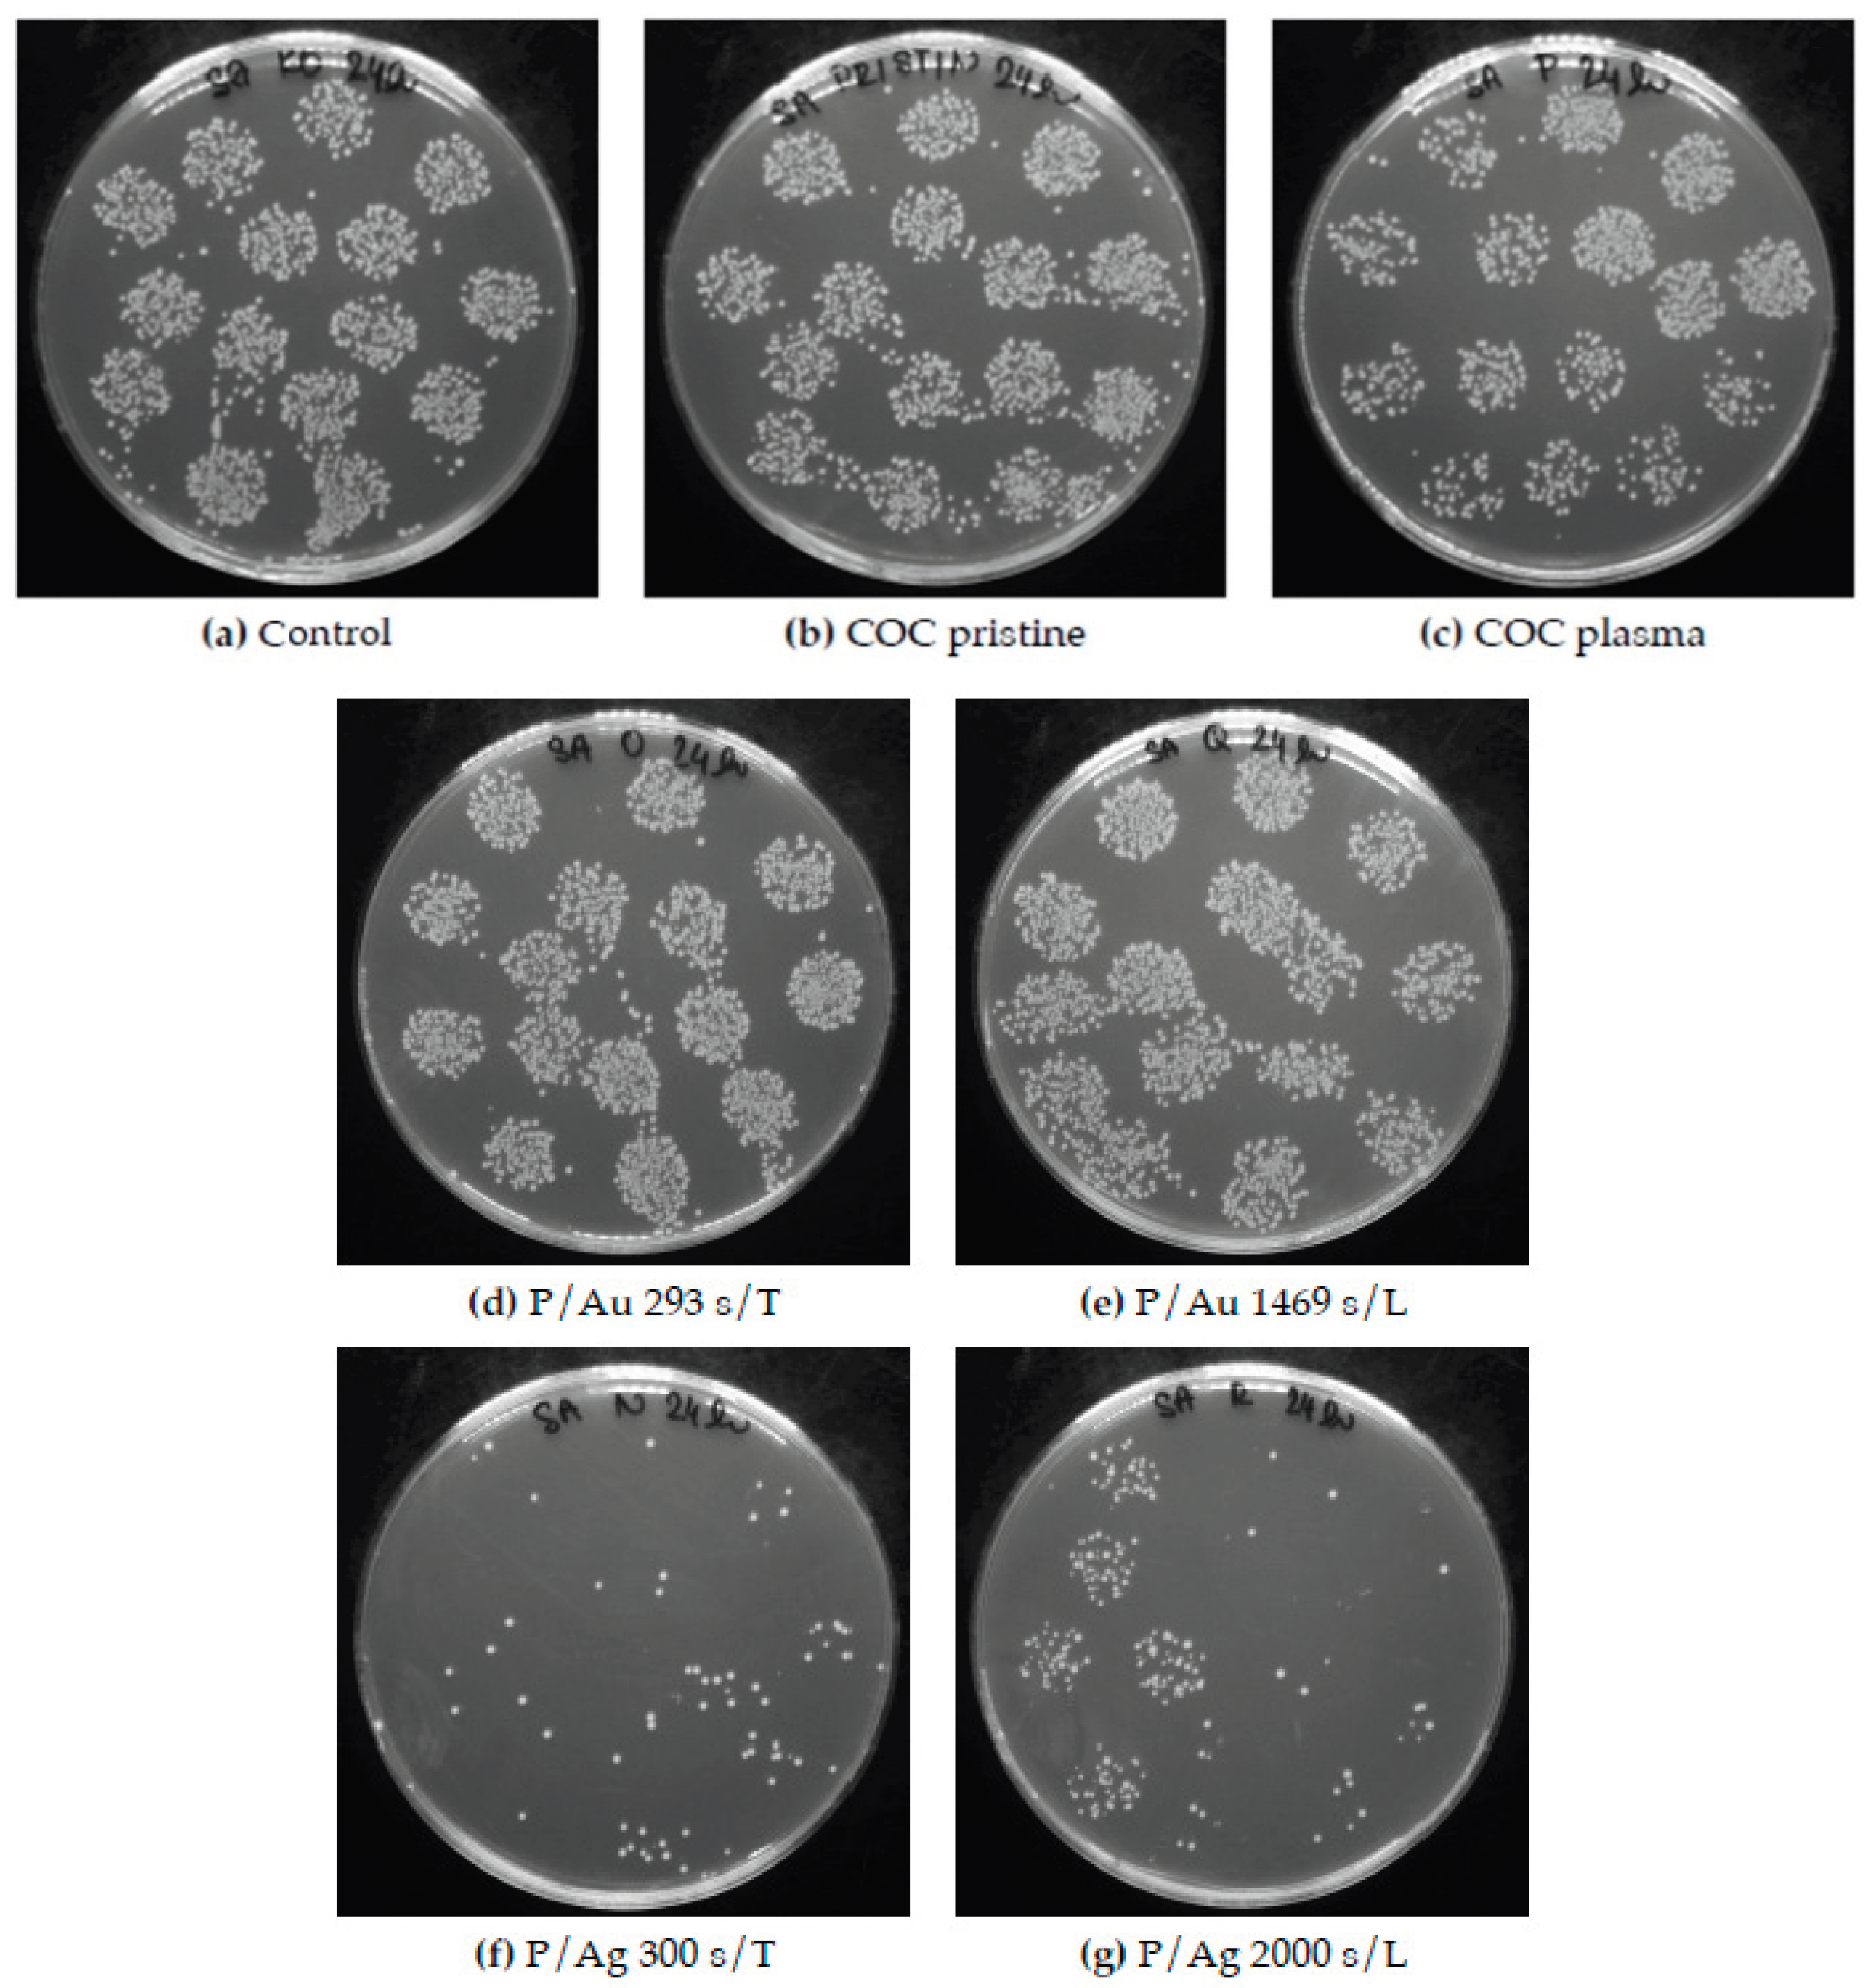
Figure 15.
Histogram of the granule weight distribution in a sample of 100 particles.
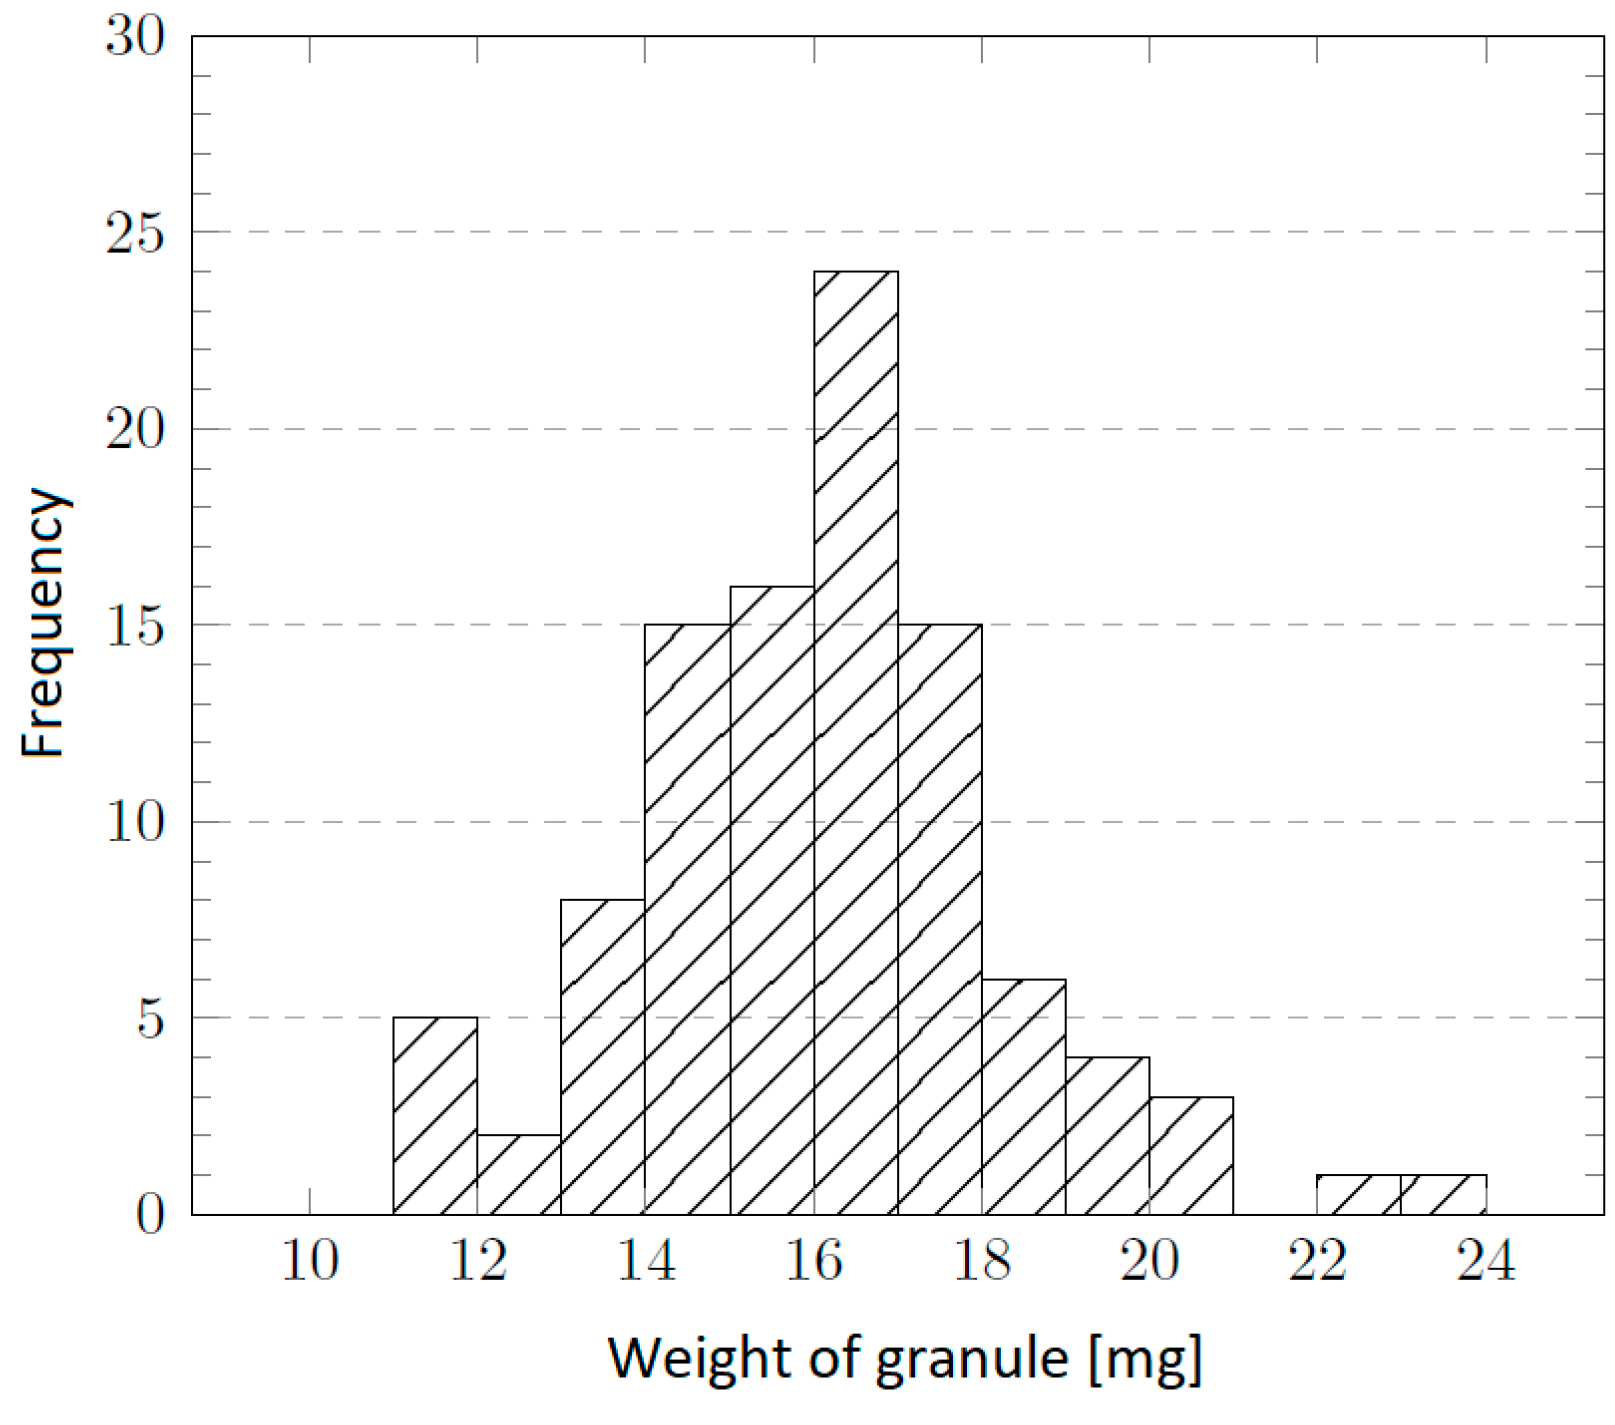
Figure 16.
DSC measurement of the COC granulate.
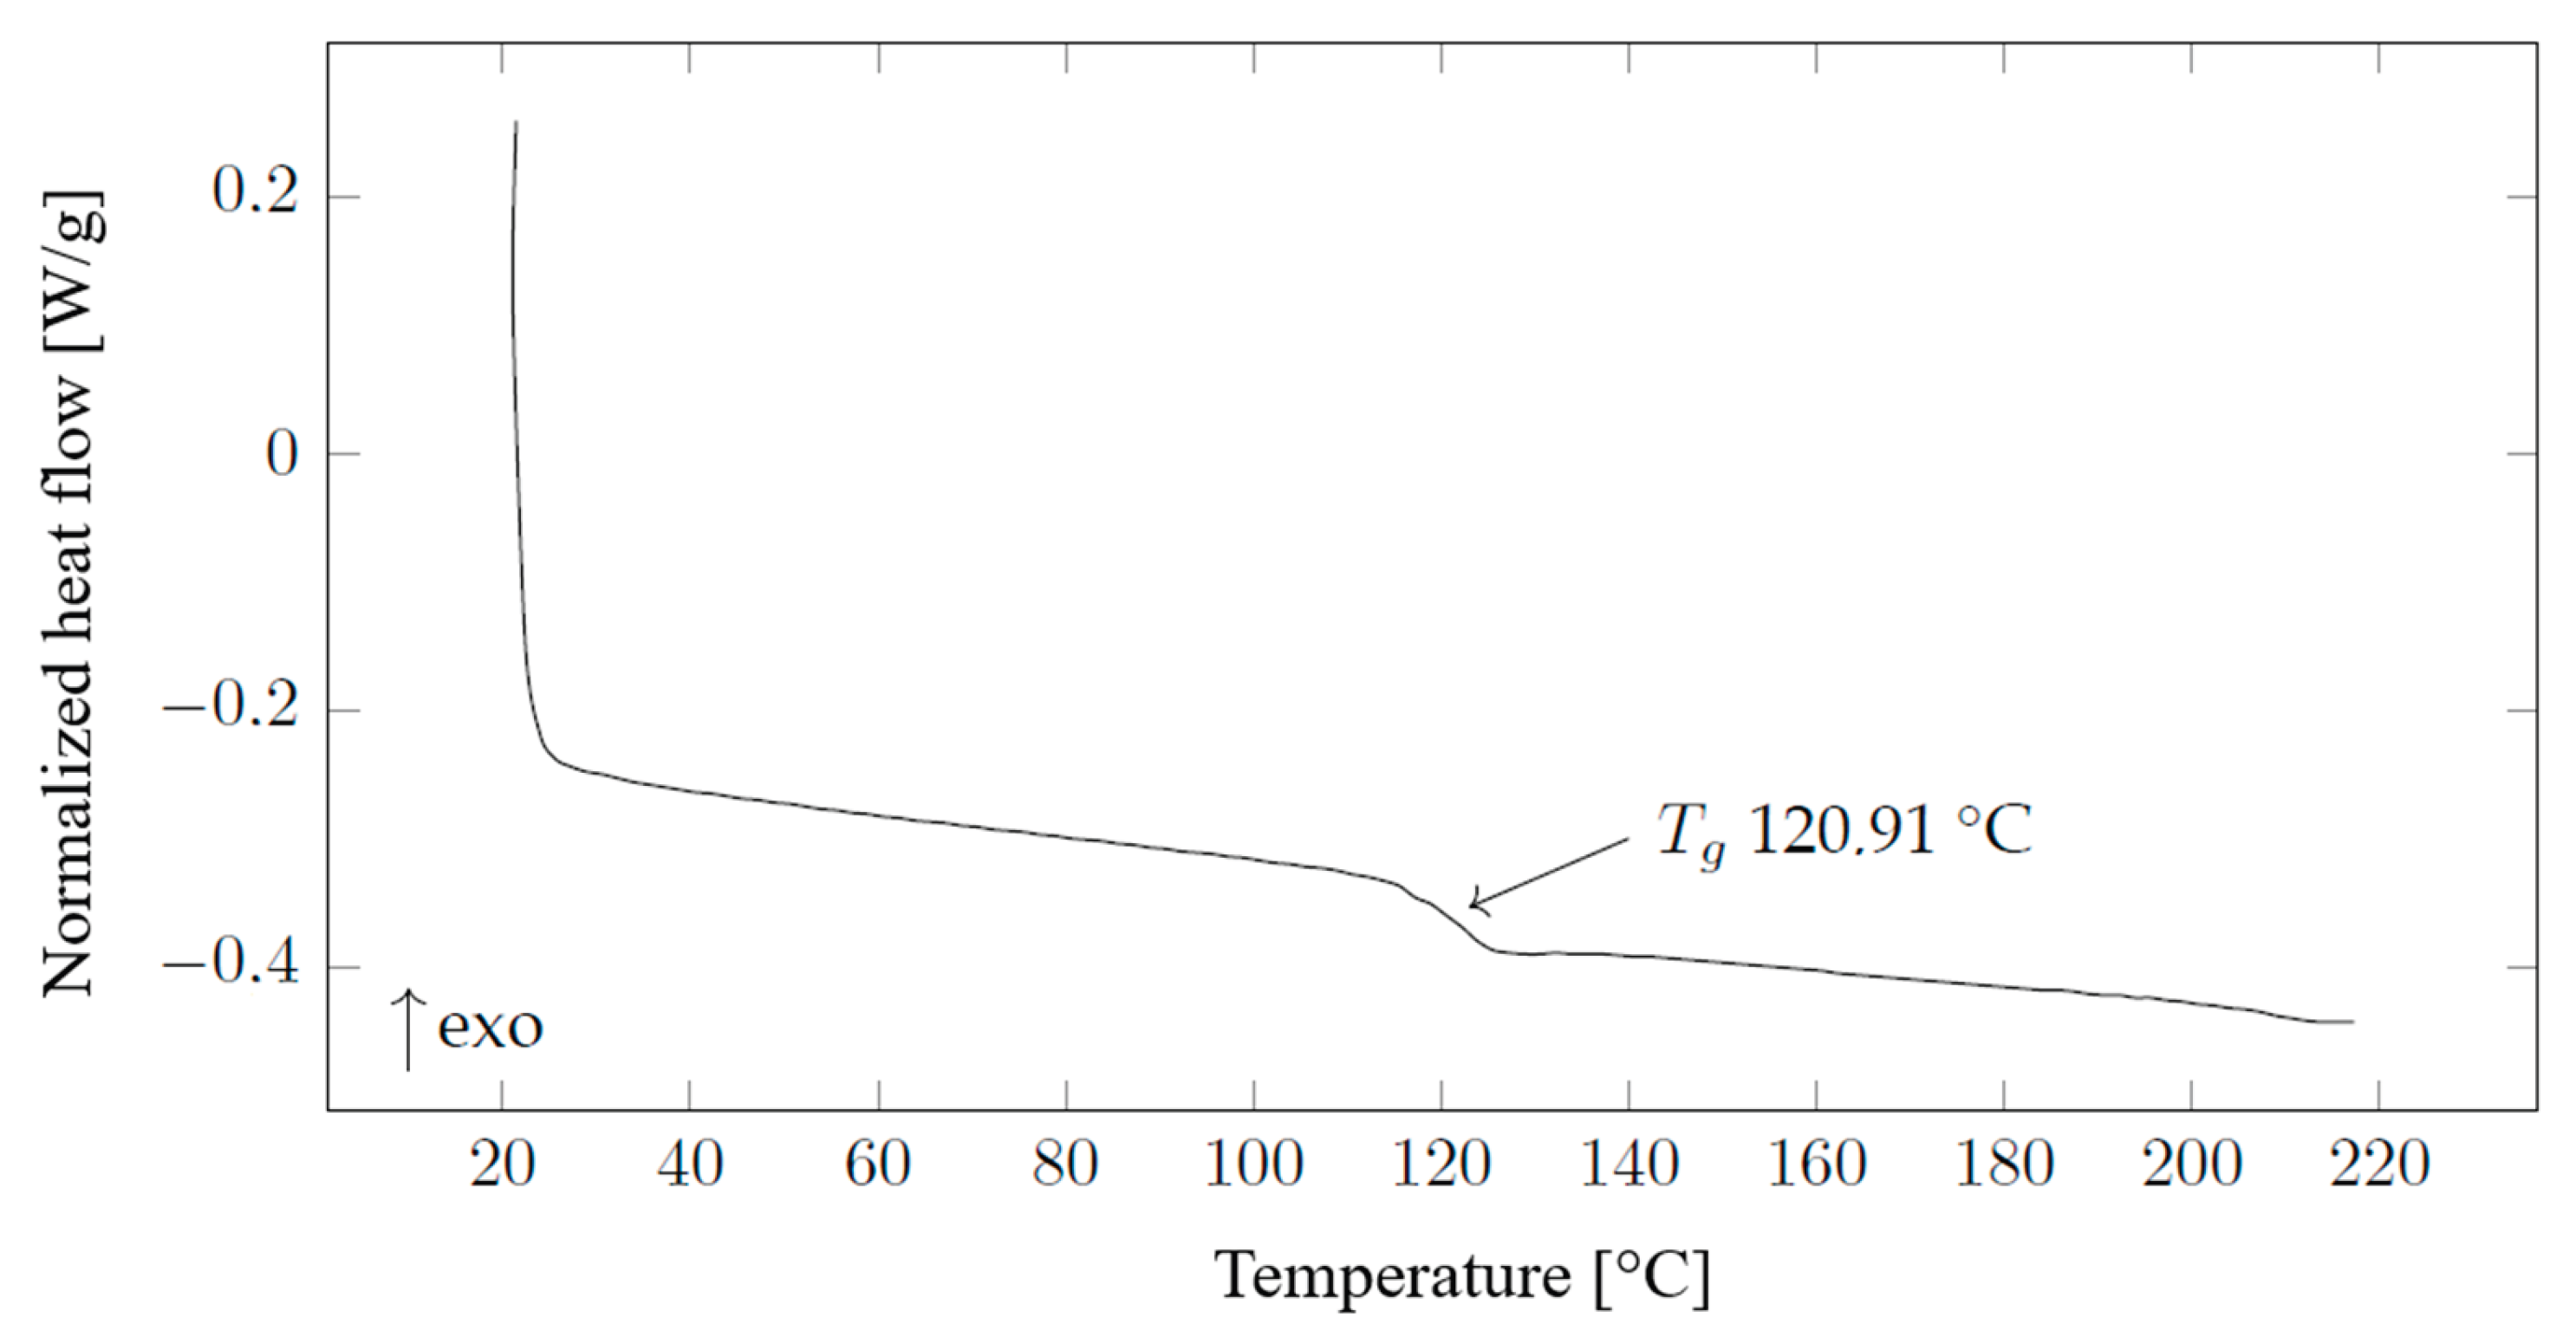

Table 1.
Atomic concentration of elements in prepared COC films according to EDS analysis.
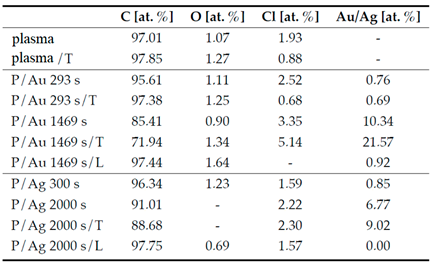 |
Table 2.
Atomic concentration of elements in prepared COC films according to EDS analysis.
 |
Disclaimer/Publisher’s Note: The statements, opinions and data contained in all publications are solely those of the individual author(s) and contributor(s) and not of MDPI and/or the editor(s). MDPI and/or the editor(s) disclaim responsibility for any injury to people or property resulting from any ideas, methods, instructions or products referred to in the content. |
© 2026 by the authors. Licensee MDPI, Basel, Switzerland. This article is an open access article distributed under the terms and conditions of the Creative Commons Attribution (CC BY) license (http://creativecommons.org/licenses/by/4.0/).
Copyright: This open access article is published under a Creative Commons CC BY 4.0 license, which permit the free download, distribution, and reuse, provided that the author and preprint are cited in any reuse.


