
Submitted:
24 February 2026
Posted:
25 February 2026
You are already at the latest version
Abstract
This study extends previous research on key banking indicators during crisis periods by conducting a comprehensive comparative analysis of crisis and recovery periods for five major Canadian banks across five distinct economic crises from 1992 to 2020. It examines which market price indices significantly predicted daily closing prices during five crisis periods compared to their corresponding recovery periods using multiple linear regres-sion. Findings reveal that the Financials index shows consistently positive significance during crises and their recovery periods across all banks. During recovery periods, the significance of indicators changed toward sector-specific indices, interest rates, and market capitalization variables that were less important during crises. Banks exhibited heterogeneous recovery paths, with some normalizing quickly while others remaining sensitive to crisis-related predictors. These findings enhance understanding of banking sector resilience and inform portfolio management during recovery periods. The results indicate that recovery periods require distinct analytical approaches from crisis periods, with important implications for risk management and investment decisions.
Keywords:
banking sector
; crises
; recovery period
; Canadian banks
; stock market indices
; multiple linear regression
; financial risks
1. Introduction
Economic and financial crises change the balance of life and affect all sectors, including the banking sector. It is most common that during crises, GDP and household purchasing power decrease, while unemployment, interest rates, and uncertainty in investments and in the stock market increase. Economic crises influence bank performance, sectoral exposure, and macro-financial relationships. Prior research has highlighted that sectoral composition and macro-financial conditions influence stock returns, but cross-bank comparative analyses across multiple crises and recovery periods remain limited. This study addresses this gap by analyzing five major Canadian banks, five crises and their recovery periods using multiple linear regressions with sectoral indices, financial variables, and market-level indices.
The stability of the banking sector is crucial for economic resilience, especially during periods of financial turbulence. In the literature, the relationship between banking sector performance and economic crises has been extensively studied, some scholars studied banking sectors in 2008 crisis (Beltratti and Stultz, 2009), (King 2009), (Merrouche et al. 2010), (Schafer et al. 2013), some studied the effects of Covid-19 crisis on banking sector (Bobiceanu and Nistor 2021), (Brindha and Sathyasree 2022), (Demirguc-Kunt et al. 2020), (Trinh et al. 2021), (Trinth et al. 2023), (Mirsaei et al. 2024), (Tsagkanos et al. 2021), some compared banking sectors in different crisis periods (Ruzgar and Chua-Chow 2023), (Garel et al. 2020), (Asteriou et al. 2019), (Baron et al. 2021). However, the number of papers on post-crisis recovery periods is fewer than the number of studies during the crisis periods. Barisitz and Lahnsteiner (2010), Allard and Blavy (2011), and Cools et al. (2016) compared recoveries in bank-based and market-based economies. In literature, the dynamics of recovery periods remain comparatively underexplored. The published study "Behavior of Banks’ Stock Market Prices during Long-Term Crises" (2023) established that market price indices, particularly the Financials index (ind15), consistently predicted daily closing prices (DCP) of five major Canadian banks during five distinct crisis periods from 1992 to 2020 (Ruzgar and Chua-Chow 2023). However, that analysis focused exclusively on crisis periods, leaving a critical gap in understanding how these relationships evolve during subsequent recovery phases. This study addresses this gap by conducting a comprehensive comparative analysis of crisis periods (C-I through C-V) and their corresponding recovery periods (R-I through R-V) for the same five Canadian banks: Bank of Montreal (BMO), Bank of Nova Scotia (BNS), Canadian Imperial Bank of Commerce (CIBC), Royal Bank of Canada (RBC), and Toronto-Dominion Bank (TD) using multiple linear regression. This study aims to investigate three key questions: How do the patterns of market price index significance differ between crisis and recovery periods, which sectors dominate during crises versus recoveries, and what do these differences reveal about banking sector resilience and recovery trajectories?
The importance of this research is highlighted by recent global economic disruptions, particularly the COVID-19 pandemic. These events show that understanding how economies and financial systems recover is as important as understanding how they are affected during a crisis. Recent studies indicate that recovery patterns in the banking sector are different from crisis patterns. Policy interventions, bank-level characteristics, and market structure influence banks differently during crisis and recovery periods (Aldasoro et al. 2020), (Nguyen et al. 2020), (Salehi 2021). The Canadian banking system, known for its resilience during the 2008 global financial crisis, provides a suitable setting for examining these dynamics (Trinh et al. 2021), (Duncan 2019), (He 2024).
This study makes several contributions to the literature. First, it presents a systematic comparison of the significance of crisis and recovery indicators for Canadian banks across multiple crisis periods. Second, it identifies bank-specific recovery paths, showing differences in resilience and adaptation strategies among banks. Third, it extends the original study’s methodology by applying the same multiple linear regression approach to recovery periods, allowing direct comparison of results. Finally, it provides practical insights for portfolio managers, risk analysts, and policymakers by identifying how predictors of bank stock performance differ across economic cycles.
2. Literature Review
The banking sector's response to economic crises has been extensively documented across multiple crisis periods. 2-Levine et all (2016) searched for the answer to “Do stock markets serve as a backup source of financing during banking crises and help reduce their economic impact?”. Using firm-level data from 36 countries between 1990 and 2011, they found that countries with stronger shareholder protection laws experience smaller negative effects of banking crises on equity issuance, firm profitability, employment, and investment efficiency. Brindha et al. (2022) studied bank stock prices worldwide to evaluate how the COVID-19 pandemic affected the banking sector. They used a global database of crisis policy responses to examine how financial sector policy announcements influenced bank stock performance. They found that the crisis put strong pressure on banks, causing bank stocks to perform worse than the overall market and other financial firms. Beltratti and Stulz (2009) examined factors influencing bank performance during the 2007-2008 crisis. Findings revealed that governance, regulation, and balance sheet characteristics significantly impacted returns. Batten et al. (2023) studied the volatility transmission between European Global Systematically Important Banks (GSIBs). The implied stock market volatility was analyzed using a Dynamic Conditional Correlation Generalized Autoregressive Conditional Heteroskedasticity model. They found a higher negative co-relationship between the VIX and GSIB returns during the COVID-19 period compared with the Global Financial Crisis (GFC. During the COVID-19 pandemic, bank stocks performed worse than domestic markets and non-bank financial firms. This reflected market expectations that banks would absorb large losses from the corporate sector (Mills 2018). A similar pattern was observed during the 2008 collapse of Lehman Brothers. In that period, the market initially affected all banks, but later differences appeared based on nationality and pre-crisis characteristics (Aldasoro et al. 2020). Banks with higher pre-crisis credit risk experienced larger increases in credit default swap spreads, while recovery tended to favour more profitable banks with stronger balance sheets (Aldasoro et al. 2020).
The crisis impacts the importance of bank-specific characteristics in determining vulnerability. During COVID-19, banks with lower liquidity experienced larger declines in stock prices (Brindha et al. 2022). Similarly, during the 2008 financial crisis, banks that relied on asset reclassifications for short-term regulatory relief were generally in weaker financial positions in later years. These banks showed lower capital buffers, higher default risk, and slower stock price recovery (Bischof et al. 2023). These findings suggest that pre-crisis financial health and management strategies significantly influence crisis-period performance. Sector-specific indices also play crucial roles during crises. The original study on Canadian banks found that the Financials index (ind15) consistently showed positive impacts on daily closing prices across all five crisis periods for all five banks, while other sector indices (Energy, Utilities, Healthcare, Information Technology) had mixed impacts depending on individual bank investment portfolios (Ruzgar and Chua-Chow 2023). This heterogeneity reflects the different causes of major crises. These include the 1992 Canadian recession, which was linked to high inflation and changes in monetary policy; the 1998 Asian financial crisis, which affected global trade; the 2007–2009 global financial crisis, which began in the subprime mortgage market; the 2014–2016 oil price decline; and the 2020 COVID-19 pandemic (Ruzgar and Chua-Chow 2023).
Recovery dynamics differ fundamentally from crisis dynamics, but they have received less attention in the literature. Recent studies show that the recovery of the banking sector after COVID-19 was slower than after the 2007–2009 financial crisis. In particular, large negative returns lasted longer, and financial instability remained high for an extended period (Trinh et al. 2021). This shows that the type of crisis (related to both health and financial) influences recovery patterns. Policy interventions also play different roles during recovery. Measures such as liquidity support, borrower assistance, and monetary easing helped reduce negative effects during the initial phase of the COVID-19 crisis, but their impact during recovery was mixed (Demirguc-Kunt et al. 2020), (Brindha et al. 2022). In some cases, borrower assistance and policies increased stress for undercapitalized banks or for banks in countries with limited fiscal capacity (Demirguc-Kunt et al. 2020). These findings indicate that recovery is not uniform and depends on bank-specific characteristics. Market perceptions change during recovery periods. In the early stage of the COVID-19 crisis, investors focused mainly on the vulnerability of poorly capitalized banks with low liquidity buffers. After government support measures were announced, market attention shifted toward differences in economic and financial performance, with large retail banks showing greater resilience (Bernardelli et al. 2021). This indicates that recovery phases involve a reassessment of market expectations and a renewed focus on fundamental values.
The Canadian banking system showed strong resilience during the recovery from the 2008 financial crisis, supported by strong financial fundamentals, effective regulation, and conservative lending practices (Salahi 2021), (He 2024). In contrast, during the COVID-19 period, Canadian bank stocks remained significantly undervalued even after macroeconomic policy measures were introduced. Projections indicated short-term recovery followed by a decline (He 2024). This pattern implies that recovery is not linear and may occur in multiple stages.
Comparative studies that directly examine crisis and recovery periods are limited but provide valuable insights. For example, a study of Indonesian banking stocks found no significant differences in returns across pre-pandemic, pandemic, and post-pandemic periods. This was attributed to strong financial fundamentals, such as stable non-performing loan and return on assets ratios, along with government support and digitalization efforts (Tompo et al. 2025). This suggests that well-capitalized banking systems with strong fundamentals may experience smoother transitions between crisis and recovery.
Studies of European banks after the global financial crisis showed different patterns between market-based and structural indicators (Basten and Mariathasan 2019). Market-based indicators decreased but remained above pre-crisis levels. In contrast, structural indicators showed that banks had become safer (Basten and Mariathasan 2019). This difference suggests a shift from high risks that were not fully priced before the crisis to lower risks that were better recognized by markets. It also highlights the importance of using multiple types of indicators when studying crisis and recovery cycles (Basten and Mariathasan 2019). A case study of Bank of America from 2006 to 2017 showed that recovery patterns differ across financial indicators (Mills 2018). Nonperforming loans increased sharply during the crisis and then slowly returned to normal levels after the crisis. Return on assets and return on equity decreased during the crisis and remained lower afterward due to acquisitions and legal costs (Mills 2018). Earnings per share dropped during the crisis and stayed unstable afterward. In contrast, capital adequacy increased during the crisis, possibly due to government support, and continued to rise later. Stock prices fell significantly during the crisis and did not return to pre-crisis levels (Mills 2018). These findings show that different financial indicators follow different recovery paths.
The Canadian banking system is widely viewed as resilient across several crisis periods. During the 2008 global financial crisis, strong financial fundamentals and an effective regulatory framework allowed Canadian banks to perform better than many international peers (Nguyen et al. 2020), (Pringle 2019). The 1998 Canadian bank merger decision, which rejected proposed mergers of four large banks, has been examined in relation to the 2008 crisis performance. The investigations suggested that the competitive structure contributed to resilience (Pringle 2019). During the COVID-19 pandemic, Canadian banks again showed resilience due to strong capitalization before the crisis, reflected in high capital adequacy, liquidity, and profitability levels (Danaee et al. 2021). However, the pandemic also exposed weaknesses, as bank stock prices remained undervalued despite policy support measures (He 2024). The Canadian banking system’s oligopolistic structure, dominated by five major banks, has been studied for its role in stability. While higher concentration may strengthen resilience, it may also reduce competition (Gaa et al. 2019). Previous studies have also shown that the yield curve affects Canadian bank equity returns, with both current and lagged yield curve spreads having positive effects (Killins and Wang 2021). This indicates that interest rate conditions, captured by variables such as the Call Loan Interest Rate (ind31) in the original study, are important for bank stock performance. Examining how these relationships change from crisis to recovery periods is essential for a full assessment of banking sector risk.
This study is based on several related theoretical perspectives that explain why crisis and recovery periods show different dynamics. Crisis Impact Theory states that financial and fiscal crises strongly affect economic conditions through channels such as exchange rates, interest rates, commodity prices, and investor confidence (Markowitz 1952), (Ruzgar and Chua-Chow 2023). During crises, these effects are rapid and severe, creating high uncertainty and high risk. The theory suggests that investors focus more on systemic risk and safe-haven assets. Market Efficiency and the Adaptive Markets Hypothesis suggest that financial markets respond quickly to unexpected shocks, but this response changes over time (Lo and Zhang 2024). During crises, markets may become temporarily inefficient due to liquidity shortages, information gaps, and behavioural biases. During recovery, as information improves and liquidity returns, markets gradually become more efficient. This framework implies that the key predictors of stock prices may differ between crisis and recovery periods (Lo and Zhang 2024). On the other hand, Banking Sector Resilience Theory highlights that banks’ ability to resist and recover from shocks depends on their financial strength before the crisis, management quality, portfolio diversification, and regulatory environment (Gaa et al. 2019), (Aldasoro et al. 2020), (Salehi 2021), (Danaee et al. 2021). This theory suggests that recovery paths will differ across banks. Banks with stronger fundamentals are expected to return to normal conditions faster, while weaker banks may remain sensitive to crisis-related factors for longer periods. Portfolio Theory and Sectoral Exposure explain why banks react differently to the same market indices (Markowitz 1952). Banks’ investment portfolios determine their exposure to different economic sectors, creating bank-specific sensitivities. During crises, these vulnerabilities can either increase or reduce negative impacts depending on which sectors are most affected. During recovery, banks may adjust their portfolios, which can change which sector indices influence stock prices (Markowitz 1952). Policy Intervention and Market Structure Theory recognizes that government and central bank actions during crises change market behaviour and shape recovery outcomes (WTO Report 2004), (Demirguc-Kunt et al. 2020), (Brindha et al. 2022), (Bernardelli et al. 2021). Measures such as liquidity support, borrower assistance, monetary easing, and regulations affect banks differently depending on their characteristics and the policy environment. This theory suggests that recovery-period indicators will reflect the effectiveness and targeting of policy interventions. Temporal Dynamics and Regime Switching Theory suggests that relationships between economic indicators and outcomes change over time as economies move from crisis to recovery (Ryo et al. 2019), (Basten and Mariathasan 2019), (Bischof et al. 2023). Crisis and recovery periods can be viewed as different regimes with different underlying mechanisms. Some indicators may remain important across both periods, while others may only be important in specific periods.
Based on these perspectives, this study proposes the following hypotheses:
H1: The Financials index (ind15), which showed consistent positive significance during all crisis periods, will show varied significance during recovery periods as market conditions normalize and bank-specific factors become more important.
H2: Recovery periods will show increased significance of sector-specific indices that were less prominent during crises.
H3: Interest rate and exchange rate variables will show different levels of significance between crisis and recovery periods.
H4: Banks with stronger pre-crisis financial fundamentals will show faster normalization of indicator relationships during recovery, with fewer crisis-related predictors remaining significant.
3. Methodology
This study employs a comparative quantitative research design and extends the method used in the original crisis-period study to the recovery periods. The research examines how market price indices predict daily closing prices (DCP) for five Canadian banks during five crisis periods and their related recovery periods. This design allows a direct comparison of indicator behaviour between crisis and recovery periods while keeping the same methodological framework as the original study.
Sample and Data
The study examines the five largest Canadian banks, including Bank of Montreal (BMO), Bank of Nova Scotia (BNS), Canadian Imperial Bank of Commerce (CIBC), Royal Bank of Canada (RBC), and Toronto-Dominion Bank (TD). Daily common stock market prices and indexes from 2/1/1980 to 31/12/2024 of five banks were collected from http://clouddc.chass.utoronto.ca.ezproxy.lib.ryerson.ca/ds/cfmrc/displayTSX.do?ed=2018&t=ts&f=daily&lang=en#v2, (Accessed on September 13, 2025). In this study, the five crisis periods identified in the previous study by Ruzgar and Chua-Chow (2023) are used without modification. The recovery periods following each crisis are defined based on the average date when daily closing prices (DCP) return to the pre-crisis level. Figure 1 shows the crisis periods as the DCP declines and the recovery periods, as the DCP increases, for five banks. The analysis covers five crises and their recovery periods:
- Crisis I (C-I): January 1, 1992 – April 30, 1993 (Canadian Recession) Recovery I (R-I): May 1, 1993 – December 31, 1994
- Crisis II (C-II): July 1, 1998 – October 30, 1998 (Asian Financial Crisis) Recovery II (R-II): November 1, 1998 – June 30, 1999
- Crisis III (C-III): May 1, 2007 – March 30, 2009 (Global Financial Crisis) Recovery III (R-III): April 1, 2009 – December 31, 2010
- Crisis IV (C-IV): September 1, 2014 – February 28, 2016 (Oil Price Decline) Recovery IV (R-IV): March 1, 2016 – December 31, 2017
- Crisis V (C-V): February 1, 2020 – March 30, 2020 (COVID-19 Pandemic) Recovery V (R-V): April 1, 2020 – December 31, 2020
As in the previous paper, the DCP represent the dependent variable. The independent variables include eleven sector indexes (ind1-ind21), four Market capitalization indexes (ind23-ind29), two financial variables (ind31 and ind32), and four Canadian Financial Markets Research Centre (CFMRC) indices (ind 33-ind38). Table 1 displays the definitions of dependent and independent variables. In CFMRC, an even number of indices from ind1 to ind30 are daily total return indexes. Since the daily closing price of indices was included in the analysis, the return indices were excluded from the data set. An odd number of indices from ind1 to ind30, along with the remaining financial and CFMRC indices, were analyzed.
In the data set, it was noticed that some indices have different starting dates and have missing values, so these missing periods within each index were removed if they fell into the studied crisis and recovery periods. SPSS version 30 was used to analyze the data for five crisis and their recovery periods for each bank. Following the methodology of the original study (Ruzgar and Chua-Chow2023), the data from five banks across ten periods (5 crises and 5 recovery periods) were analyzed using Multiple Linear Regression (MLR) to identify significant predictors of DCP for each bank in each crisis and recovery period. The general model is presented in Equation 1.
(1)
where DCP is the daily closing price of the bank, is constant (intercept), (i=1, 2, 3,…, 23) are the regression coefficients, (i=1, 2, 3,…, 23) are the daily prices of indices, and ε is the error term. All models satisfied the requisite conditions and were validated for linearity, multicollinearity, normality and homoscedasticity. The Variation Inflation Factor (VIF) were less than 10, residuals were normally distributed, and they had constant variance. Models were tested using adjusted R-squared for the proportion of variance explained, F-statistic for the overall model significance, and t-statistics and p-values for the individual predictor significance. Comparative analysis for each bank was performed by comparing which indices were significant during crisis versus recovery periods, direction of relationships (positive/negative coefficients), model fit (R-squared) and pattern across five crisis-recovery periods.
4. Results
This section presents the multiple linear regression results for five Canadian banks across five crisis periods (C-I to C-V) and their respective recovery periods (R-I to R-V). The analysis compares crisis vs. recovery effects, highlighting sectoral contributions, macro-financial sensitivity, and cross-bank dynamics. The multiple linear regression analyses produced high-quality models for all banks across all crisis and recovery periods. Adjusted R-squared values consistently exceeded 0.80, indicating that the selected market price indices explained more than 80% of the variance in DCPs. All models showed statistically significant F-statistics (p < 0.001). VIF values remained below 10 for all predictors, indicating no serious multicollinearity issues.
The following subsections present detailed results for each bank, comparing crisis and recovery period indicator significance.
4.1. Bank of Montreal (BMO)
BMO experienced an extreme C-I intercept, reflecting early crisis volatility. Across the five crisis periods, BMO showed consistent positive significance for the Financials index (ind15) in all five crises, confirming the original study's findings (Ruzgar and Chua-Chow 2023). Other frequently significant indices during crises included Energy (ind3), Consumer Discretionary (ind9), Consumer Staples (ind11), Health Care (ind13), Information Technology (ind17), Telecommunications Services (ind19), Utilities (ind21), TSX 60 (ind23), TSX Venture (ind29) and Call Loan Interest Rate (ind31). Foreign Exchange Rate (ind32) and CFMRC Value Weighted Under 2 dollars Index (ind36). The specific combination of significant indices varied by crisis, reflecting the different origins and characteristics of each economic shock.
During the recovery periods, BMO exhibited several important changes in the significance and direction of its predictors. In R-I, the Financials index (ind15) remained a significant positive predictor, although its coefficient decreased compared to C-I. Consumer Discretionary (ind9) became significant and positive, indicating greater sensitivity to improvements in consumer spending. In contrast, the Call Loan Interest Rate (ind31) changed from a positive effect during C-I to a negative effect in R-I, indicating a change in monetary policy influence. In R-II, Financials (ind15) remained significant, while Healthcare (ind13) and Telecommunications Services (ind19) gained significance, reflecting a rebalancing toward defensive and growth sectors. The Daily Foreign Exchange Rate (ind32) also became significant, indicating ongoing currency volatility following the Asian crisis. In R-III, the most substantial changes were observed: Financials (ind15) remained significant, and both Consumer Staples (ind11) and Consumer Discretionary (ind9) became strongly positive predictors, indicating the importance of consumer sector recovery. The TSX 60 index (ind23) is also significant, suggesting alignment with large-cap market recovery. In R-IV, Energy (ind3) shifted from a negative effect during C-IV to a positive effect, reflecting oil price stabilization. Information Technology (ind17) became more significant, indicating increased vulnerability to the technology sector. The Venture index (ind29) also became significant, indicating a higher risk during recovery. Finally, in R-V, the COVID-19 recovery period showed distinct dynamics: Financials (ind15) remained significant but with a smaller coefficient than in C-V, Healthcare (ind13) became highly significant and positive, and the CFMRC Under $2 Value Weighted Index (ind36) remained significant. This indicates increased attention to small-cap value stocks during the recovery period. Based on the MLR results for BMO in Table 2, the Financials index remained significant across most recovery periods, but with varying magnitudes. Consumer sector indices (Consumer Discretionary, Consumer Staples) showed increased importance during recovery and Interest rate, while Exchange rate variables exhibited an inverse sign between crisis and recovery. In terms of the diversity of significant predictors, recovery periods had more significant predictors compared to crisis periods. The last two recovery periods (R-IV, R-V) showed increased significance of growth-oriented indices.
4.2. Bank of Nova Scotia (BNS)
BNS had extreme negative intercepts during the first two crises (C-I, C-II), which indicates high volatility. For BNS, the Financials index (ind15) is significant in all five crisis periods, except in C-IV, the oil price decline crisis (Ruzgar and Chua-Chow 2023). Other significant indices during the crisis periods included Composite (ind1), Energy (ind3), Materials (ind5), Industrials (ind7), Consumer Staples (ind11), Healthcare (ind13), Telecommunications Services (ind19), Utilities (ind21), Call Loan Interest Rate (ind31), Foreign Exchange Rate (ind32), and CFMRC Equal Weighted Over 2-dollar Index (ind37). BNS exhibited greater sensitivity to international indices, consistent with its significant international operations.
During the recovery periods, BNS showed several structural changes in the significance and direction of its predictors. In R-I, Financials (ind15) remained significant after being presented in C-I. Industrials (ind7) became highly significant and positive, indicating strong sensitivity to manufacturing and industrial sector recovery. The CFMRC Equal Weighted Index Over $2 (ind37) also became significant, suggesting broad market participation. In R-II, Consumer Staples (ind11) and Healthcare (ind13) remained significant from the crisis period (C-II), indicating stability in defensive sectors, while the Call Loan Interest Rate (ind31) changed from positive to negative, showing that central banks increased the money supply and reduced the interest rates to stimulate economic growth during recovery. Materials (ind5) became significant, showing sensitivity to commodity price improvements. In R-III, Financials (ind15) remained highly significant, and Consumer Discretionary (ind9) and Information Technology (ind17) remained as positive predictors, indicating diversification toward growth sectors. The TSX Composite (ind1) and the Daily Foreign Exchange Rate (ind32) also became significant, showing strong correlation with market recovery and the importance of international vulnerability. In R-IV, Energy (ind3) changed from negative to positive, consistent with oil price recovery, while the TSX 60 (ind23) and the Small Cap index (ind27) became significant, indicating participation across firm sizes. Financials (ind15), which were not a predictor in C-IV, were a key predictor in R-IV, indicating normalization in financial sector relationships. In R-V, Telecommunications Services (ind19) became highly significant, demonstrating the importance of digital infrastructure during the pandemic recovery. Healthcare (ind13) remained significant, and the Daily Foreign Exchange Rate (ind32) showed increased importance, indicating global currency volatility. Utilities (ind21) also remained significant. According to the MLR results in Table 3, BNS demonstrated greater variability in the significance of Financials, and strong sensitivity to commodity and materials indices during commodity-related recoveries. In addition, it consistently showed a high importance on exchange rate variables due to its international operations, and increased significance with broad market indices during recovery periods. Defensive sector indices such as Utilities, Consumer Staples, and Health Care maintained their importance during the transition from crisis to recovery period.
4.3. Canadian Imperial Bank of Commerce (CIBC)
Crisis intercepts varied from moderate (C-III) to extreme (C-IV, C-V). CIBC showed Financials index (ind15) significance in all five crisis periods (Ruzgar and Chua-Chow 2023). Healthcare (ind13) and Utilities (ind21) were frequently significant across crises. Other significant indices were Energy (ind3), Materials (ind5), Industrials (ind7), Consumer Discretionary (ind9), Consumer Staples (ind11), Telecommunications Services (ind19), Call Loan Interest Rate (ind31), Foreign Exchange Rate (ind32), CFMRC Daily Value Weighted Index (ind34) and CFMRC Equal Weighted Over 2 dollars Index (ind37) but, these are included in some of the crisis periods. CIBC demonstrated consistent patterns across crises compared to other banks, indicating a more stable portfolio composition.

Table 4.
MLR results of CIBC during crises and recoveries.
| C-I | R-I | C-II | R-II | C-III | R-III | C-IV | R-IV | C-V | R-V | |
|---|---|---|---|---|---|---|---|---|---|---|
| Constant | 6.443 ** | 5.129* | −9.25 *** | -0.131 | 42.219 * | -48.104* | 136.592 * | 64.587* | 108.046 * | 112.977* |
| Ind3 | −0.012 * | -0.007* | 0.011* | -0.005* | -0.006* | −0.009 * | ||||
| Ind5 | 0.01 * | -0.004* | -0.009* | −0.007 * | 0.003* | −0.011 * | ||||
| Ind7 | −0.021 * | -0.023* | 0.011* | 0.010** | -0.007** | 0.014 * | -0.011* | |||
| ind9 | −0.041 * | -0.031* | 0.032 * | 0.040* | -0.010* | |||||
| ind11 | -0.021* | 0.034 ** | 0.008** | 0.041 * | 0.006* | |||||
| ind13 | 0.010* | 0.018 ** | 0.012* | 0.038 * | -0.007** | −0.003 * | −0.014 ** | -0.020* | ||
| ind15 | 0.18 * | 0.118* | 0.074 * | 0.056* | 0.023 * | 0.046* | 0.034 * | 0.034* | 0.031 * | 0.045* |
| ind17 | 0.045* | -0.015* | -0.056** | 0.010* | ||||||
| ind19 | 0.029 ** | 0.028* | 0.019* | -0.035* | ||||||
| ind21 | −0.012 ** | 0.032* | −0.015 * | -0.010** | −0.018 * | 0.017* | −0.018 * | 0.014* | ||
| ind31 | -0.107** | 2.286 * | 2.173* | −3.054 * | 1.472** | −11.815 * | -27.407** | 17.844* | ||
| ind32 | -21.724* | −52.803 * | 22.561* | −64.981 * | -34.050* | −56.177 * | -106.884* | |||
| ind33 | -46.296* | |||||||||
| ind34 | 34.513 ** | |||||||||
| ind36 | 10.688** | |||||||||
| ind37 | −62.732** | -59.183* | ||||||||
| ind38 | -14.348** | 22.140** | ||||||||
| R-Square | 0.913 | 0.989 | 0.926 | 0.965 | 0.920 | 0.955 | 0.895 | 0.962 | 0.912 | 0.988 |
* p < 0.001, ** p < 0.05, *** p > 0.05. Source: http://clouddc.chass.utoronto.ca.ezproxy.lib.ryerson.ca/ ds/cfmrc/displayTSX.do?ed=2018&t=ts&f=daily&lang=en#v2, accessed 13 September 2025. Crises: C-I: 1/1/1992–30/4/1993; C-II: 1/7/1998–30/10/1998; C-III: 1/5/2007–30/3/2009 ; C-IV: 1/9/2014–30/2/2016; C-V: 1/2/2020–30/3/2020. Recoveries: R-I: 30/4/1993-7/3/1997, R-II: 30/4/1998-12/3/1999; R-III: 30/3/2009-23/3/2011, R-IV: 29/2/2016-14/3/2017; R-V:23/3/2020-8/2/2022.
During the recovery periods, CIBC demonstrated several changes in sectoral indices. In R-I, Financials (ind15) remained significant with a similar magnitude to C-I, while Utilities (ind21) changed from positive in C-I to negative in R-I. Telecommunications Services (ind19) became a significant positive predictor in R-I, indicating growth sector increased during recovery. In R-II, Healthcare (ind13) maintained significance from C-II into R-II, showing stability in this sector increase, while Materials (ind5) became significant, indicating sensitivity to commodity recovery post-Asian crisis. The Call Loan Interest Rate (ind31) showed increased significance during recovery, suggesting greater sensitivity to monetary policy normalization. In R-III, Financials (ind15) remained significant, Consumer Discretionary (ind9) and Consumer Staples (ind11) both became strongly significant positive predictors, indicating strong sensitivity to consumer sector recovery. Energy (ind3) shifted from negative in C-III to positive in R-III, reflecting oil price recovery, and the Daily Value Weighted Index (ind34) became significant. In R-IV, Industrials (ind7) and Information Technology (ind17) became highly significant, showing increased exposure to manufacturing and technology sectors. The Daily Foreign Exchange Rate (ind32) also gained significance, while Healthcare (ind13) reversed from positive in C-IV to negative in R-IV, indicating portfolio rebalancing. In R-V (2020), Financials (ind15) remained significant, but with reduced magnitude, Healthcare (ind13) became highly significant and positive, consistent with the sector's pandemic importance. Consumer Staples (ind11) remained important, and Energy (ind3) remained negative from C-V into R-V, indicating continued sensitivity to weakness in the oil sector. According to the MLR results in Table 3, CIBC showed the most consistent significance of the Financials index during the transition from crisis to recovery, and strong sensitivity to consumer sectors during recovery. The Health Care index showed complex patterns with sign changes between some crises and recovery. Recovery periods showed increased significance of market indices, and finally, the Energy sector effects extending from the crisis into recovery periods.
4.4. Royal Bank of Canada (RBC)
RBC showed Financials index (ind15) significance in all five crisis periods, with the highest consistency among all banks (Ruzgar and Chua-Chow 2023). Other frequently significant indices included TSX Composite (ind1), Energy (ind3), Healthcare (ind13), and various CFMRC indices (Daily Equal Weighted Index, Value Weighted Index). The indices were varied among the crisis periods. Their effects were reversed in sign in some crisis periods, such as Energy (ind3) (positive in C-I and C-III, negative in C-IV), Telecommunication services (ind19) (positive in C-II and C-III, negative in C-IV). While Information Technology (ind9) in C-I, C-IV and C-V, Utilities (ind11) in C-III and C-IV, Information Technology (ind17) in C-II and C-III and Mid Cap (ind25) in C-II and C-III have a negative effect on DCP, Health Care (ind13) in C-I and C-IV has a positive effect.
During the recovery periods, RBC exhibited clear changes in sectoral and market indices. In R-I, Financials (ind15) remained strongly significant with a coefficient similar to that in C-I, while Consumer Discretionary (ind9) became a highly significant positive predictor, indicating sensitivity to consumer spending recovery. Utilities (ind21) remained significant, and the DEWI (ind33) became significant, indicating broad market participation. In R-II, Healthcare (ind13) maintained significance from C-II into R-II with increased magnitude. The CFMRC Daily Value Weighted Index (ind34) showed increased significance, Industrials (ind7) became significant, and the Call Loan Interest Rate (ind31) changed from positive to negative, consistent with monetary easing during recovery. In R-III, RBC displayed the widest range of significant predictors. Financials (ind15) remained highly significant. Consumer Discretionary (ind9), Consumer Staples (ind11), and Information Technology (ind17) became significant positive predictors, indicating diversified recovery across growth and defensive sectors. The Composite index (ind1) and Mid Cap index (ind25) also became significant. The Daily Foreign Exchange Rate (ind32) maintained significance, indicating continued currency effects. In R-IV, Energy (ind3) changed from negative to positive, showing oil price stabilization. Telecommunications Services (ind19) became highly significant, indicating increased exposure to this sector. The TSX 60 (ind23) showed increased significance, and Information Technology (ind17) remained significant with increased magnitude, indicating growing technology exposure. In R-V, Financials (ind15) remained significant, but with a lower coefficient than C-V. Healthcare (ind13) became the strongest positive predictor, and Consumer Staples (ind11) continued to be significant. Both the CFMRC Daily Value Weighted Index (ind33) and Mid Cap (ind25) showed heightened significance, indicating broad and mid-cap market recovery. Based on the MLR results in Table 5, RBC demonstrated the strongest and most consistent Financials index significance in the transition from all crises to recovery. The results revealed greater diversity of significant predictors during recovery than crisis periods. Consumer sector indices consistently gained importance during recovery periods, and the technology sector exposure increased in later recovery periods.
4.5. Toronto-Dominion Bank (TD)
TD showed Financials index (ind15) significance and positive in all five crisis periods (Ruzgar and Chua-Chow 2023). Industrials (ind7) in C-I, Consumer Discretionary (ind9) in C-II and in C-III, (ind11) in C-II and C-III, Healthcare (ind13) in C-I and C-III, Utilities (ind21) in C-IV, Mid Cap (ind25) in C-V and Call Loan Interest Rate (ind31) in C-V negatively affect the DCP. Telecommunication Services (ind19) in C-III, TSX Venture (ind29) in C-V and CFMRC Daily Equal Weighted Index (ind33) in C-IV positively affect the DCP. Additionally, Information technology (ind17) has negative effects in C-I and C-II, while having a positive effect in C-IV.
Table 6.
MLR results of TD during crises and recoveries.
| C-I | R-I | C-II | R-II | C-III | R-III | C-IV | R-IV | C-V | R-V | |
|---|---|---|---|---|---|---|---|---|---|---|
| Constant | 8.964 * | -13.967* | 70.542 * | 422.696* | 14.127 * | -10.990* | 7.049 * | -17.981* | 2.757 * | -41.294* |
| Ind3 | 0.002* | -0.058* | -0.003* | 0.004* | ||||||
| Ind5 | -0.001** | -0.003* | 0.004* | |||||||
| Ind7 | −0.018 * | -0.008* | -0.002* | -0.002* | ||||||
| ind9 | 0.013* | −0.027 ** | 0.054* | -0.016* | −0.01 * | -0.007* | 0.005* | |||
| ind11 | -0.015* | −0.054 ** | 0.042** | −0.011 * | 0.002* | -0.003* | ||||
| ind13 | −0.003 ** | 0.004* | -0.118* | −0.015 * | 0.012* | |||||
| ind15 | 0.072 * | 0.079* | 0.121 * | 0.137* | 0.041 * | 0.063* | 0.03 * | 0.033* | 0.041 * | 0.034* |
| ind17 | −0.017 * | -0.010* | −0.024 * | -0.055* | -0.028* | 0.034 * | -0.010* | |||
| ind19 | -0.019* | 0.069* | 0.007 ** | 0.042* | 0.005** | -0.020* | ||||
| ind21 | -0.004** | -0.038** | -0.008* | −0.004 * | -0.004* | -0.002 | ||||
| ind25 | −0.072 * | |||||||||
| ind29 | 0.046 * | |||||||||
| ind31 | -0.238* | −0.967 * | 2.568* | −2.168 * | -1.210* | |||||
| ind32 | 14.298* | −29.948 * | -254.034* | 9.215* | 42.248* | |||||
| ind33 | 13.438 * | |||||||||
| ind36 | -5.912** | |||||||||
| ind38 | 10.878* | -11.666** | ||||||||
| R-Square | 0.903 | 0.987 | 0.917 | 0.889 | 0.925 | 0.983 | 0.864 | 0.993 | 0.910 | 0.990 |
* p < 0.001, ** p < 0.05, *** p > 0.05. Source: http://clouddc.chass.utoronto.ca.ezproxy.lib.ryerson.ca/ ds/cfmrc/displayTSX.do?ed=2018&t=ts&f=daily&lang=en#v2, accessed 13 September 2025. Crises: C-I: 1/1/1992–30/4/1993; C-II: 1/7/1998–30/10/1998; C-III: 1/5/2007–30/3/2009; C-IV: 1/9/2014–30/2/2016; C-V: 1/2/2020–30/3/2020. Recoveries: R-I: 30/4/1993-7/3/1997, R-II: 30/4/1998-12/3/1999; R-III: 30/3/2009-23/3/2011, R-IV: 29/2/2016-14/3/2017; R-V:23/3/2020-8/2/2022.
During the recovery periods, TD showed clear changes in sectoral and market indices. In R-I, Financials (ind15) remained significant with a similar magnitude to C-I, while Industrials (ind7) became a highly significant positive predictor, indicating importance to manufacturing recovery. Consumer Discretionary (ind9) also became significant, indicating exposure to improving consumer spending, and Utilities (ind21) remained significant but with a smaller coefficient. In R-II, Healthcare (ind13) continued to be significant, and Consumer Staples (ind11) became significant, indicating increased defensive positioning during recovery. Information Technology (ind17) emerged as a positive predictor, suggesting early technology exposure, and the Call Loan Interest Rate (ind31) gained importance, showing the importance of monetary policy conditions. In R-III, TD showed diversification. Financials (ind15) remained significant, while Consumer Discretionary (ind9), Consumer Staples (ind11), and Information Technology (ind17) became highly significant positive predictors, indicating strong recovery effects in consumer and technology sectors. Telecommunications Services (ind19) gained significance, the Daily Foreign Exchange Rate (ind32) remained important, and the CFMRC Daily Equal Weighted Index (ind33) became significant, suggesting broad market participation. In R-IV, Industrials (ind7) and Information Technology (ind17) were highly significant, the Mid Cap index (ind25) emerged as significant, and the Call Loan Interest Rate (ind31) changed from positive in the crisis period to negative in recovery, reflecting changes in monetary policy conditions. In R-V, Financials (ind15) remained significant but with reduced magnitude; Healthcare (ind13) became a highly significant positive predictor; and both Consumer Discretionary (ind9) and Consumer Staples (ind11) remained significant, indicating strong consumer-sector sensitivity. Telecommunications Services (ind19) showed increased importance. CFMRC Daily Equal Weighted Index (ind33) remained significant, indicating market recovery participation. The MLR results show that TD demonstrated consistent significance of the Financials index in the transition from crisis to recovery. There is increasing sensitivity to consumer sectors during recovery. The technology and telecommunications sectors had importance across the recovery periods. Healthcare also showed importance, especially in later periods. The sign of interest rate variables changed from crises to recovery periods.
4.6. Cross-Bank Comparative Analysis
The cross-bank comparative analysis reveals several consistent patterns across all five banks. First, the Financials index (ind15) was significant in nearly all crisis periods (except BNS in C-IV) and remained significant in at least four of the five recovery periods for each bank. However, its magnitude was generally more variable during recovery, and in some cases, weaker than during crises. Second, Consumer Discretionary (ind9) and Consumer Staples (ind11) displayed highly consistent behaviour across banks. Although they were less important during crisis periods, they became more significant during recovery periods, particularly in R-III and R-V. This indicates that improvements in consumer activity are key drivers of bank stock prices during recoveries. Third, the Healthcare index (ind13) showed increasing importance across crisis and recovery periods for all banks, with particularly strong significance during C-V and R-V (COVID-19 crisis and recovery). Fourth, the Call Loan Interest Rate (ind31) shows consistent patterns, but a sign change between crisis and recovery periods across multiple banks. It was positive during crisis periods, consistent with higher risk premiums, and turned negative during recovery, indicating monetary normalization. Finally, the Foreign Exchange Rate (ind32) became more significant during recovery than crisis periods for most banks. This shows that currency dynamics play important roles during recovery periods.
The results reveal clear patterns for all banks across the five crisis and recovery periods. RBC demonstrated the most consistent and predictable patterns, with the highest model fit statistics. It has a stable significance of the Financials index. It showed the greatest diversity of significant predictors during recovery periods, indicating a highly diversified portfolio. BNS demonstrated the greatest variability in financial significance and the strongest sensitivity to international variables, such as exchange rates and commodity indices. This shows its international operations and commodity exposure. CIBC showed stable patterns in transitions from crisis to recovery periods. CIBC exhibited strong sensitivity to consumer sector indices during recovery periods. BMO displayed increasing sensitivity to Information Technology and Venture indices in later recovery periods. TD showed a similar pattern to CIBC, with strong consumer sector sensitivity and increasing technology sector exposure during the recoveries.
During the crisis and recovery periods, several common patterns were observed. The last two crises and recovery periods exhibited more complex models with a great number of significant predictors. This shows increasing market complexity and portfolio diversification. Information Technology and Telecommunications Services showed increasing importance during the recovery periods. This indicates the growing role of digital sectors in both the economy and bank portfolios. Health Care (ind13), Utilities (ind21), and Consumer Staples (ind11) maintained their importance throughout all crises and recovery periods, particularly during C-V and R-V. In terms of market capitalization, large-cap indices (TSX 60) showed increased significance during recovery periods, while mid-cap and small-cap indices showed more variable patterns. This indicates that recoveries begin with large-cap stocks. Finally, each recovery period showed unique patterns depending on the nature of the crisis. R-I emphasized industrial recovery, R-II focused on international and commodity markets, R-III showed consumer and financial sector recovery, R-IV highlighted the energy sector and technology, and R-V was characterized by the importance of Health Care and digital infrastructure.
The results of examining the MLR results of all five banks together in terms of the importance of the indices during crisis and recovery periods are presented in Table 7.
Table 7 clearly demonstrates that consumer sector indices, healthcare, information technology, telecommunications, and exchange rate variables gained importance during recovery periods, while the Financials index, utilities, and energy showed relatively decreased importance during recovery compared to crisis periods.
5. Discussion
The results reveal systematic differences in the patterns of market price index significance between crisis and recovery periods. They support the hypotheses. The most distinct finding is that the Financials index (ind15) was almost significant during crisis periods. Although it remained important during recovery periods, its magnitude was lower. This partially supports Hypothesis 1 and indicates that DCPs are strongly affected by financial sector conditions during crises, while influenced by a diverse set of indices during the recovery periods.
Consumer Discretionary (ind9) and Consumer Staples (ind11) displayed increased roles during the recovery periods. This supports Hypothesis 2. The significance of Consumer Discretionary (ind9) increased by 44% from crisis to recovery period, while Consumer Staples (ind11) increased by 32%. This pattern is consistent with recovery theory, which emphasizes the importance of consumer spending recovery as a key driver of economic recovery (Tompo et al. 2025). For banks, this shows both direct involvement in consumer lending and indirect involvement through investments in consumer-related firms. These findings reveal that consumer sector performance becomes a key driver of DCP during recovery periods. In addition, technology-related indices, including Information Technology and Telecommunications Services, showed greater significance across recovery periods. This trend was especially strong during the COVID-19 recovery (R-V), when telecommunications services became highly significant for all banks. This shows the increasing role of digital infrastructure in the economy, and the pandemic's acceleration of digital transformation (He 2024). This finding suggests that bank portfolios have gradually increased their exposure to technology sectors and that recovery periods provide opportunities to rebalance their portfolios toward growth-oriented industries. Finally, Call Loan Interest rate (ind31) and Foreign Exchange Rate (ind32) showed different behaviours between crisis and recovery periods. This supports Hypothesis 3. The Call Loan Interest Rate (ind31) often showed opposite signs during crises and recovery periods. It is generally positive during crises, showing higher risk premiums and tight monetary conditions, while it is negative during recovery periods, indicating monetary easing and policy normalization. This pattern is consistent with central bank policy responses to crises, which typically involve aggressive rate cuts during crises, gradual normalization during recovery (Demirguc-Kunt et all, 2020), (Brindha et al. 2022). Exchange rate variables became more significant during recovery periods, particularly for internationally active banks such as BNS. This indicates that currency dynamics play a stronger role as global trade stabilizes during recovery periods.
The comparative analysis reveals that crisis and recovery periods represent distinct structures with different dynamics. Crisis periods are characterized by high correlation among financial assets, systemic risk factors, such as the Financials index, and reduced importance of sector variables. In contrast, recovery periods include more sector variables with strong significance of growth indices. These findings are consistent with recent research on banking sector performance during COVID-19, which found that the initial crisis period saw similar negative impacts across banks, but recovery periods included diverse structures based on specific characteristics of banks and sectoral exposures (Aldasoro et al. 2020), (Bernardelli et al. 2023). The findings of this paper showed similar results that markets focus on risk during crises, but change direction toward more sector variables during recovery periods. This leads to more variables involved in recovery periods.
The evaluation of five crisis and recovery periods showed that the dynamics became more complex. The last two crises and recovery periods (C-IV/R-IV and C-V/R-V) included more significant indicators and complex relationships. This increasing complexity may reflect the growing complexity of financial markets, more structurally complex crises such as oil price shocks and the pandemic, and the expanding role of technology and global integration in the financial system. Finally, for some banks, particularly RBC and BNS, recovery periods produced higher adjusted R-squared values than crisis periods. This may result from lower uncertainty and volatility compared to crisis conditions, or from the ability of market indices to better capture recovery dynamics. This finding has practical implications, indicating that quantitative investment models may perform more reliably during recovery periods than during times of acute financial stress. The findings showed that recovery periods had higher adjusted R-squared values than crisis periods for some banks, particularly RBC and BNS. This may be interpreted as DCPs being more predictable during recovery than during crises. This finding has implications for investment strategies, suggesting that quantitative models may be more reliable during recovery periods.
Based on the individual analyses of banks' structures during the recovery period, the following findings were observed. The results reveal differences in recovery paths across the five banks, which supports Hypothesis 4. RBC demonstrated the most consistent patterns and highest model fit statistics, showing the most predictable recovery path. This likely reflects RBC's position as Canada's largest bank with the most diversified portfolio and strongest pre-crisis fundamentals (Salehi 2021), (Danaee et al. 2021). During recovery periods, RBC consistently showed rapid normalization of market relationships. BNS showed the most variable patterns, particularly on the Financials index (ind15) and Foreign Exchange Rate (ind32) variables. This reflects its international operations, which expose it to diverse economic conditions and currency movements. As a result, BNS experienced longer and internationally influenced recovery patterns. CIBC and TD showed similar patterns, with strong consumer sector sensitivity during recovery periods. This similarity may reflect comparable business models focused on retail and commercial banking in Canada. Both banks responded quickly to improvements in consumer spending. This shows that their portfolios are structured depending on domestic economic activity. BMO demonstrated increasing interest in Information Technology (ind17) and TSX Venture (ind29) during the recovery periods. This shows that its portfolio composition changes toward growth sectors during the recovery. From above, banks showed different patterns during recovery periods. This suggests important implications for investors and risk managers. Investors and risk managers should evaluate banks individually during recovery periods rather than assuming all banks using similar portfolio combination.
The findings contribute to several theoretical areas. First, the effects of a crisis are fixed, but they change during the recovery period. This leads to Crisis Impact Theory. The variable differences between crisis and recovery periods indicate that DCP changes according to the improvement of economic conditions. This shows that models developed during crisis periods may not perform well during recovery periods and should be adjusted accordingly. Second, the results support and extend the Adaptive Markets Hypothesis (Lo and Zhang 2024). The findings show that market efficiency changes over crisis and recovery periods. During recovery periods, a large number of variables become significant, and model fit statistics are often higher. This indicates that markets are more efficient when the uncertainty decreases, and liquidity improves. Third, the findings contribute to Banking Sector Resilience Theory by identifying specific indicators of resilience and recovery (Gaa et al. 2019). Banks showed rapid normalization during recovery, particularly RBC, which demonstrated greater resilience. However, BNS showed long recovery periods for some recovery terms. This shows that resilience can be assessed by both the crisis and recovery period performances. Fourth, the results also contribute to Portfolio Theory, introduced by Economist Harry Markowitz in 1952. It demonstrates that portfolio composition has differential effects during crisis versus recovery periods. The importance of consumer sector indices during recovery suggests that portfolios with more consumer-related stocks may perform better during recovery periods. Finally, the findings contribute to Policy Intervention Theory (WTO report 204; Ryo et al. 2019). It supports the policy effects that vary across crisis and recovery periods. The reversal in the direction of interest rate effects between crisis and recovery periods suggests that monetary policy actions do not have uniform impacts. For example, interest rate cuts during crises may influence bank stock prices differently than interest rate increases during recovery.
The findings provide important practical insights for portfolio managers, risk analysts, policymakers, and bank management. For portfolio managers, recovery periods require different analytical approaches than crisis periods. Consumer sector stocks become more important during the recovery period, suggesting that greater attention should be given to sector and growth-related indices. Since banks show individual differences in their portfolios during recovery periods, they need to pay attention to stock selection during the recovery period. In addition, in parallel with the rapid development of technology, the important role of the technology sector during crisis and recovery periods requires banks to adjust their portfolios by including the technology sector in the long term. For risk analysts, models built during crises may not accurately reflect risks during recovery periods. Recovery periods contain a wider range of factors that increase the risk. The differences in banks' recovery speeds require systematic risk assessment for individual banks. For policymakers, the results indicate that policy actions have different effects during the crisis and recovery phases. The opposite-signed effects of interest rate between crisis and recovery periods imply that monetary policy normalization must be carefully managed. During recovery periods, consumer-related variables gained more importance, showing the value of policies that support consumer spending. In addition, increasing complexity in financial systems also requires adaptable policy frameworks. For bank management, the findings suggest that adjusting portfolios toward consumer and growth sectors in early recovery periods may support DCP performance. Greater attention to technology-related activities is increasingly important during recovery periods. Finally, monitoring a broad range of market indicators becomes even more important during recovery than during crisis periods.
6. Conclusion
This study presents a comprehensive comparative analysis of crisis and recovery dynamics in Canadian bank stock prices across five major economic crises between 1992 and 2020. By extending earlier crisis-focused research to include recovery periods, the study identifies the differences between crisis and recovery phases. The results show that recovery periods are not simply a continuation of crisis conditions. They have their own patterns and drivers. These findings have important implications for financial theory, investment practice, and public policy.
The results show that the indicator importance changes significantly between crisis and recovery periods. During crises, the Financials index was dominant, showing a very high frequency of significance (96%). This suggests that risk and sector-wide shocks play a central role during periods of financial stress. In contrast, recovery periods displayed more diverse patterns. Consumer Discretionary and Consumer Staples became more important. The Healthcare, Information Technology, and Telecommunications sectors also gained importance during recovery periods. This change suggests that sectoral leadership changes as economic conditions improve.
The analysis also shows that crisis and recovery periods represent different economic conditions. Crisis periods are characterized by high systemic risk and high correlations across sectors, while recovery periods show a more complex structure with more variables. This confirms that recovery dynamics cannot be analyzed using the same assumptions applied during crises. The findings also reveal substantial differences across banks. RBC showed the most stable and predictable recovery patterns. BNS demonstrated more variable patterns, likely reflecting its greater international activities. Meanwhile, other banks such as CIBC and TD displayed stronger sensitivity to consumer sector indicators. These differences show that recovery paths vary across institutions.
The structures of the models in crisis and recovery periods have become more complex from C-I/R-I to C-V/R-V. More recent crises and recovery periods showed a larger number of significant predictors, indicating portfolio diversification and the increasing importance of technology sectors. In addition, interest rate and foreign exchange rate variables changed direction between the crisis and recovery periods. This reflects changes in monetary policy and currency conditions.
The findings contribute to Crisis Impact Theory by showing that the effects of crises change during recovery (Markowitz 1952). They also support the Adaptive Markets Hypothesis, as market efficiency appears to gradually improve during recovery periods (Lo and Zhang 2024). The results contribute to Banking Sector Resilience Theory by identifying normalization patterns during recovery as indicators of resilience (Gaa et al. 2019). The study also contributes to Portfolio Theory by demonstrating that portfolio addition effects differ across crisis and recovery phases (Markowitz 1952). Furthermore, the results suggest that portfolio managers should apply different analytical approaches during recovery periods. They need to pay greater attention to consumer and growth sectors. Risk analysts should know that models developed during crises may not be suitable for recovery conditions. Policymakers should consider that policy measures may have different effects across crisis and recovery periods.
The results suggest that understanding a crisis and its recovery period is very important. Based on the literature, the world experiences disruptions approximately every ten years, such as financial shocks, pandemics, and geopolitical instability. The reasons vary. Canada has experienced many economic crises, which sometimes led to recessions or depressions (Ruzgar and Chua-Chow 2023). As Bonham (2017) mentioned, Canada experienced a total of five recessions between 1970 and 2009. This study demonstrates that recovery is not simply a return to pre-crisis conditions. For example, the most recent crisis, the COVID-19 pandemic, demonstrated unique recovery characteristics. During the recovery period, the health care and telecommunication sectors played an important role. At this point, understanding the crisis and its recovery period structures is very important to be ready for future crises.
This study has several limitations that provide directions for future research. From a data and methodological perspective, the study does not include detailed information on the banks’ portfolio. Future studies should include detailed portfolio composition data to better understand this relationship. The recovery periods were defined using economic indicators and prior literature, but the timing of recovery may differ across banks. Future research could use the new models to identify crisis and recovery periods separately for each bank. The study also focuses on DCPs, which reflect market perception. For future studies, including other variables, such as volatility and financial ratios, would provide more comprehensive results. In the study, MLR is used for the analysis. Although all requirements for MLR are satisfied, new models with additional variables can be nonlinear. For future studies, nonlinear or machine learning methods could improve analysis. In addition, the study examines five Canadian banks, which limits the generalizability. Future research should include banks from other countries. Although five crisis and recovery periods were analyzed, including more historical crises and recovery periods would strengthen conclusions.
Supplementary Materials
The following supporting information can be downloaded at: https://www.mdpi.com/article/10.3390/ijfs11010031/s1,Figure S1: Daily closing prices of five banks; Table S1: Indices and their definitions; Table S2: MLR results for BMO During Crises and Recoveries; Table S3: MLR results for BNS During Crises and Recoveries; Table S4: MLR results of CIBC During Crises and Recoveries; Table S5: MLR results of RBC During Crises and Recoveries; Table S6: MLR results of TD During Crises and Recoveries; Table S7: Frequency of indices across banks in crisis and recovery periods.
Author Contributions
Conceptualization, N.S.R.; methodology, N.S.R.; software, N.S.R.; validation, N.S.R. and C.C-C.; formal analysis, N.S.R.; investigation, N.S.R.; resources, N.S.R.; data curation, N.S.R.; writing—original draft preparation, N.S.R.; writing—review and editing, N.S.R. and C.C-C.; visualization, C.C-C; supervision, N.S.R.; project administration, N.S.R. All authors have read and agreed to the published version of the manuscript.”.
Funding
This research received no external funding.
Data Availability Statement
Restrictions apply to the availability of these data. Data were obtained from the University of Toronto Library via the Toronto Metropolitan University library using the link: http://clouddc.chass.utoronto.ca.ezproxy.lib.ryerson.ca/ds/cfmrc/displayTSX.do?ed=2018&t=ts&f=daily&lang=en#v2. (Accessed on 13 September 2025).
Acknowledgments
This research builds upon the foundational work of the original study "Behavior of Banks’ Stock Market Prices during Long-Term Crises", published in IJFS in 2023. We acknowledge the University of Toronto CFMRC database for providing the comprehensive market price index data that made this analysis possible. SPSS version 30 was used for the analysis.
Conflicts of Interest
The authors declare no potential conflict of interest with respect to the research, authorship, and/or publication of this article.
Abbreviations
The following abbreviations are used in this manuscript:
| GDP | Gross Domestic Products |
| DCP | Daily closing price |
| GSIBs | Global systematically important banks |
| VIF | Variation inflation factor |
| BMO | Bank of Montreal |
| BNS | Bank of Nova Scotia |
| CIBC | Canadian Imperial Bank of Commerce |
| RBC | Royal Bank of Canada |
| TD | Toronto-Dominion Bank |
| C-I | Crisis I: January 1, 1992 – April 30, 1993 (Canadian Recession) |
| C-II | Crisis II: July 1, 1998 – October 30, 1998 (Asian Financial Crisis) |
| C-III | Crisis III: May 1, 2007 – March 30, 2009 (Global Financial Crisis) |
| C-IV | Crisis IV: September 1, 2014 – February 28, 2016 (Oil Price Decline) |
| C-V | Crisis V: February 1, 2020 – March 30, 2020 (COVID-19 Pandemic) |
| R-I | Recovery from C-I: May 1, 1993 – December 31, 1994 |
| R-II | Recovery from C-II: November 1, 1998 – June 30, 1999 |
| R-III | Recovery from C-III: April 1, 2009 – December 31, 2010 |
| R-IV | Recovery from C-IV: March 1, 2016 – December 31, 2017 |
| R-V | Recovery from C-V: April 1, 2020 – December 31, 2020 |
| WTO | World Trade Organization |
References
- Aldasoro, I.; Fender, I.; Hardy, B.; Tarashev, N. Effects of Covid-19 on the banking sector: the market's assessment. BIS Bulletin 2020, 12. [Google Scholar]
- Allard, J.; Blavy, R. Market phoenixes and banking ducks are recoveries faster in market-based financial systems? IMF Working Papers 2011, 2011(213), 26. [Google Scholar] [CrossRef]
- Asteriou, D.; Pilbeam, K.; Sarantidis, A. The behaviour of banking stocks during the financial crisis and recessions. Evidence from changes-in-changes panel data estimations. Scottish J. Political Economy. 2019, 66(1), 154–179. [Google Scholar] [CrossRef]
- Barisitz, S.; Lahnsteiner, M. Russian banks on the route of fragile recovery. Financial Stability Report, Oesterreichische Nationalbank (Austrian Central Bank) 2010, 20, 77–85. [Google Scholar]
- Baron, M.; Laeven, L.; Pénasse, J.; Usenko, Y. Investing in crises. European Central Bank Eurosystem 2021. [Google Scholar] [CrossRef]
- Basten, C.; Mariathasan, M. European banks after the global financial crisis: a new landscape. J. Banking Regulation. 2019, 20(1), 51–72. [Google Scholar] [CrossRef]
- Batten, J.A.; Choudhury, T.; Kinateder, H.; Wagneret, N. Volatility impacts on the European banking sector: GFC and COVID-19. Ann. Oper. Res. 2023, 330, 335–360. [Google Scholar] [CrossRef]
- Beltratti, A.; Stulz, R. M. Why did some banks perform better during the credit crisis? A cross-country study of the impact of governance and regulation. ECGI Working Paper Series in Finance 2009, 254/2009. [Google Scholar] [CrossRef]
- Bernardelli, M.; Korzeb, Z.; Niedziółka, P. The banking sector as the absorber of the COVID-19 crisis's economic consequences: Perception of WSE investors. Oeconomia Copernicana 2021, 12(2), 335–374. [Google Scholar] [CrossRef]
- Bischof, J.; Laux, C.; Leuz, C. Asset reclassifications and bank recapitalization during the financial crisis. Man. Sci. 2023, 69(6), 3349–3373. [Google Scholar] [CrossRef]
- Bobiceanu, A. M.; Nistor, S. The impact of coronavirus pandemic on the stock market reaction in the banking sector. The role of regulatory and supervisory framework across European Union members. Rev. Econ. and Bus. Stu 2021, (28), 41–64. [Google Scholar] [CrossRef]
- Bonham, M. S. Recession in Canada. The Canadian Encyclopedia. 2017. Available online: https://www.thecanadianencyclopedia.ca/en/article/recession (accessed on 8 March 2025).
- Brindha, K.; Sathyasree, C. M. Banking sector performance during the Covid-19 crisis. Ymer 2022, 21(7), 1–15. [Google Scholar] [CrossRef] [PubMed]
- Cools, K.; Van Soest, A.; Van Toor, J. When are pre-crisis winners post-crisis losers? 2016. Available online: https://ssrn.com/abstract=2826140. [CrossRef]
- Danaee, E.; Fung, L.; Tarashev, N. How well can large banks in Canada withstand a severe economic downturn? Bank of Canada Staff Analytical Note 2021, 2021–6. [Google Scholar]
- Data. Available online: http://clouddc.chass.utoronto.ca.ezproxy.lib.ryerson.ca/ (accessed on 13 September 2025).
- Demirguc-Kunt, A.; Pedraza, A.; Ruiz-Ortega, C. Banking sector performance during the COVID-19 crisis. World Bank Policy Research Working Paper 2020, 9363. [Google Scholar] [CrossRef]
- Duncan, A. S. An analysis of US financial stock returns post announcements of quantitative easing: An investigation post 2008 financial crisis. J. Eco. and Fin. An. 2019, 3(1), 1–28. [Google Scholar]
- Gaa, C.; Liu, X.; MacDonald, C.; Shen, X. Assessing the resilience of the Canadian banking system, Bank of Canada. 2019. Available online: https://www.bankofcanada.ca/2019/05/staff-analytical-note-2019-16/ (accessed on 2 February 2026).
- Garel, A.; Martin Flores, J. M.; Petit-Romec, A. Stock market listing and the persistence of bank performance across crises. J. Bank. & Fin. 2020, 118, 105885. [Google Scholar] [CrossRef]
- He, Y. Valuation and Analysis of the Canadian banking sector during the COVID-19 pandemic. In App. Econ. and Policy Stud.; Springer, 2024; pp. 1389–1397. [Google Scholar] [CrossRef]
- Killins, R. N.; Ngo, T.; Wang, H. J. The impact of the yield curve on bank equity returns: Evidence from Canada. The Quar. Rev. of Econ. and Fin. 2021, 82, 119–140. [Google Scholar] [CrossRef]
- King, M. R. Time to Buy or Just Buying Time? The market reaction to bank rescue packages. Bank for Inter. Settlements (BIS), Working paper 2009, 288, 34. Available online: https://ssrn.com/abstract=1481578. [CrossRef]
- Lo, A. W.; Zhang, R. The Adaptive markets hypothesis: An evolutionary approach to understanding financial system dynamics; Oxford University Press, 2024. [Google Scholar]
- Markowitz, H.M. Portfolio Selection. J. Fin. 1952, 7(1), 77–91. [Google Scholar] [CrossRef] [PubMed]
- Merrouche, O.; Detragiache, E.; Demirguc-Kunt, A. Bank Capital: Lessons from the financial crisis. IMF Working Papers 2010. 2010, 286. [Google Scholar] [CrossRef]
- Mills, K. Financial institutions and systemic risk: The case of Bank of America 2006-2017. J. Fin.& Accoun. 2018, 24, 1–18. [Google Scholar]
- Mirzaei, A.; Saad, M.; Emrouznejad, A. Bank stock performance during the COVID-19 crisis: does efficiency explain why Islamic banks fared relatively better? Ann. Oper. Res. 2024, 334, 317–355. [Google Scholar] [CrossRef] [PubMed]
- Nguyen, T.; Nguyen, H. G.; Yin, X. Canadian commercial banks and corporate governance: 2006-2018. Int. J. Man. Fin. 2020, 17(2), 227–243. [Google Scholar]
- Pringle, R. The 1998 Canadian bank merger decision and the 2008 financial crisis: Factual and counterfactual investigations. Canadian Public Policy 2019, 45(3), 289–308. [Google Scholar]
- Ruzgar, N. S.; Chua-Chow, C. Behaviour of banks’ stock market prices during long-term crises. Int. J. Fin. Stud. MDPI. 2023, 11(1)(31), 1–25. [Google Scholar] [CrossRef]
- Ryo, M.; Aguilar-Trigueros, C. A.; Pinek, L.; Muller, L.A.H.; Rilling, M. C. Basic principles of temporal dynamics. Trends in Ecology & Evolution 2019, 34(8), 723–733. [Google Scholar] [CrossRef]
- Salehi, M. Assessing the impact of the Covid-19 pandemic on the banking system performance: Evidence from the Canadian banking industry. Int. J. Fin. & Econ. 2021, 28(2), 1915–1928. [Google Scholar]
- Schäfer, A.; Schnabel, I.; Weder di Mauro, B. Financial sector reform after the crisis: Has anything happened? 2013. Available online: https://ssrn.com/abstract=2274044. [CrossRef]
- Tompo, A. F.; Karamoy, H.; Pusung, R. J. Analysis of banking stock performance before, during, and after the COVID-19 pandemic on the Indonesia Stock Exchange (IDX). J. Econ. Res.& Soc. Sci. 2025, 9(2), 1–15. [Google Scholar] [CrossRef]
- Trinh, V. Q.; Cao, N. D.; Elnahass, M. Financial stability: a ‘vaccine’ for tail risk of the global banking sector in the shadow of the pandemic. Euro. J. Fin. 2023, 29(7), 726–753. [Google Scholar] [CrossRef]
- Trinh, V. Q.; Elnahass, M.; Salama, A.; Izzeldin, M. Financial stability: a 'vaccine' for tail risk of the global banking sector in the shadow of the pandemic. J. Int. Fin.Mar., Institutions and Money. 2021, 74. [Google Scholar] [CrossRef]
- Tsagkanos, A.; Gkillas, K.; Konstantatos, C. Does trading volume drive systemic banks’ stock return volatility? Lessons from the Greek banking system. Int. J. Fin. Stud. 2021, 9(2), 24. [Google Scholar] [CrossRef]
- World Trade Report 2004. II Coherence, C Market Structure, Externalities and Policy Intervention WTO document WT/WGTCP/W/228. 2004, pp. 150–174. Available online: https://www.wto.org/english/res_e/booksp_e/anrep_e/wtr04_2c_e.pdf (accessed on 2 February 2026).
Figure 1.
Daily closing prices of five banks. Data source: https://clouddc-chass-utoronto-ca.ezproxy.lib.torontomu.ca/ds/cfmrc/display TSX.do?ed=2022&lang=en#v4 (Accessed on September 13, 2025).
Figure 1.
Daily closing prices of five banks. Data source: https://clouddc-chass-utoronto-ca.ezproxy.lib.torontomu.ca/ds/cfmrc/display TSX.do?ed=2022&lang=en#v4 (Accessed on September 13, 2025).
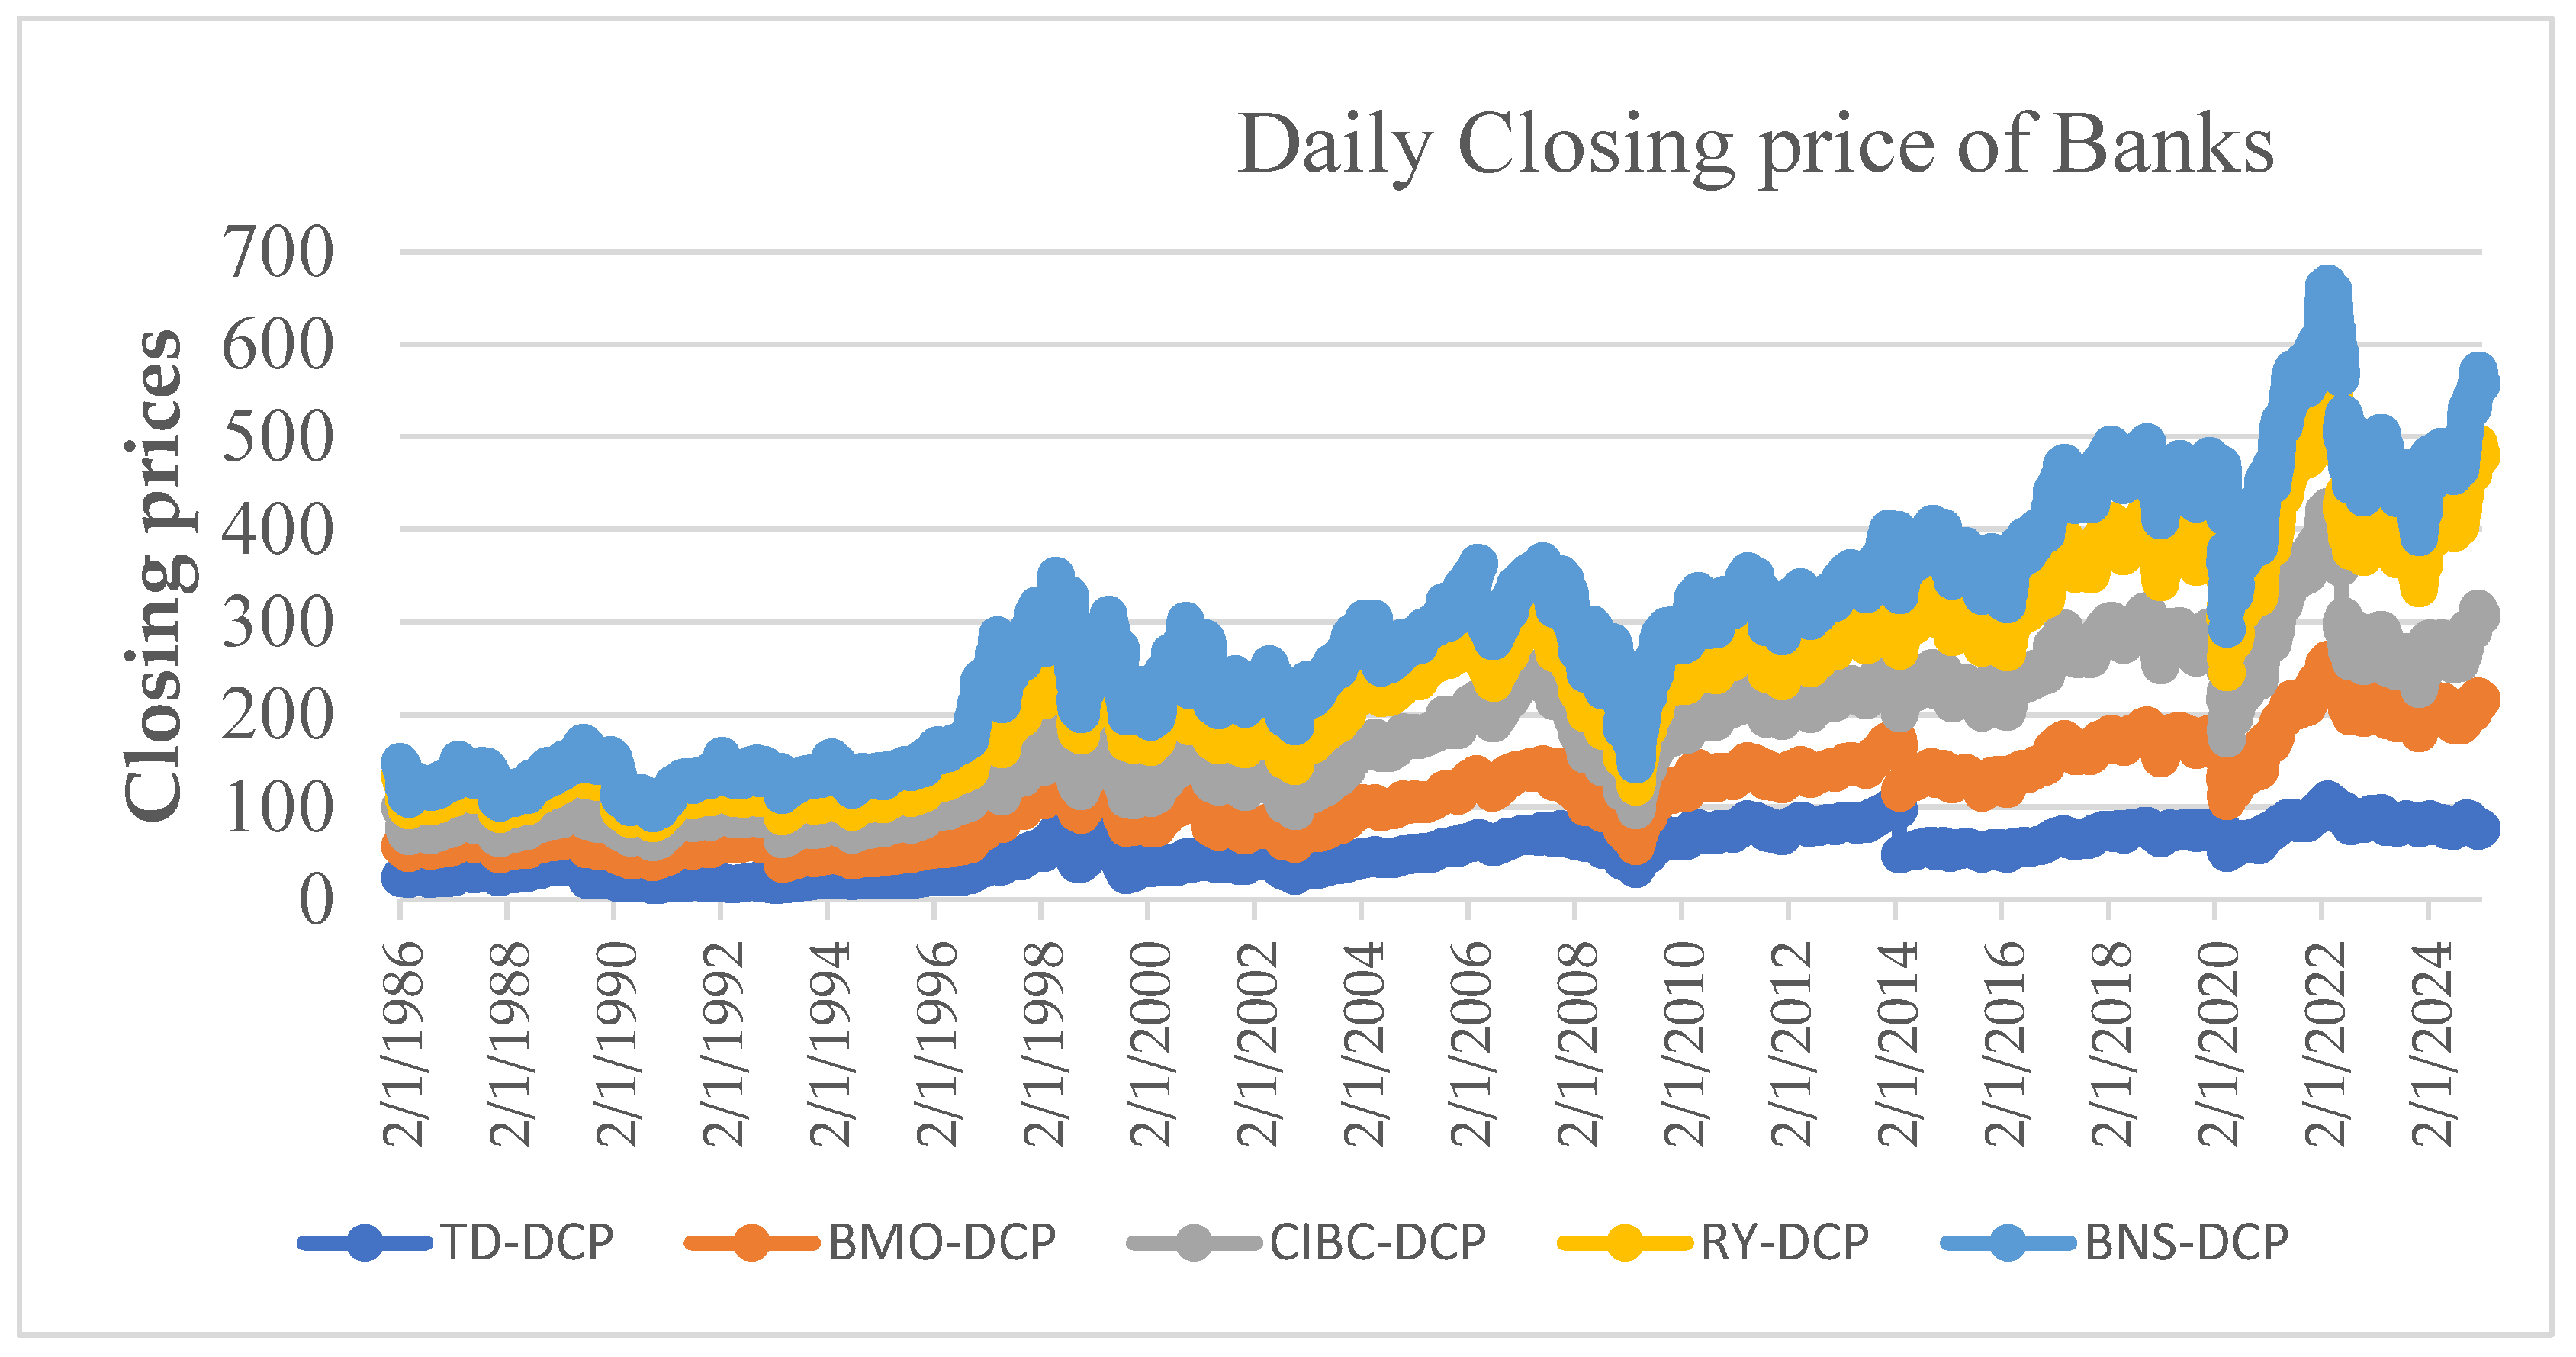
Table 1.
Indices and their definitions.
| Variables | Indices | Definitions |
|---|---|---|
| Y | Daily Closing price | |
| X1 | ind1 | SampPTSX Composite DPI |
| X2 | ind3 | Sector 10 Energy DPI |
| X3 | ind5 | Sector 15 Materials DPI |
| X4 | ind7 | Sector 20 Industrials DPI |
| X5 | ind9 | Sector 25 Consumer Discretionary DPI |
| X6 | ind11 | Sector 30 Consumer Staples DPI |
| X7 | ind13 | Sector 35 HealthCare DPI |
| X8 | ind15 | Sector 40 Financials DPI |
| X9 | ind17 | Sector 45 Information Technology DPI |
| X10 | ind19 | Sector 50 Telecommunications Services DPI |
| X11 | ind21 | Sector 55 Utilities DPI |
| X12 | ind23 | SampPTSX 60 DPI |
| X13 | ind25 | SampPTSX Mid Cap DPI |
| X14 | ind27 | SampPTSX Small Cap DPI |
| X15 | ind29 | SampPTSX Venture DPI |
| X16 | ind31 | Call Loan Interest Rate |
| X17 | ind32 | Daily Foreign Exchange Rate |
| X18 | ind33 | CFMRC Daily Equal Weighted Index |
| X19 | ind34 | CFMRC Daily Value Weighted Index |
| X20 | ind35 | CFMRC Equal Weighted Under 2 dollars Index |
| X21 | ind36 | CFMRC Value Weighted Under 2dollars Index |
| X22 | ind37 | CFMRC Equal Weighted Over 2dollars Index |
| X23 | ind38 | CFMRC Value Weighted Over 2dollars Index |
Data source: https://clouddc-chass-utoronto-ca.ezproxy.lib.torontomu.ca/ds/cfmrc/display TSX.do?ed=2022&lang=en#v4 (Accessed on September 13, 2025).
Table 2.
MLR results for BMO during crises and recoveries.
| C-I | R-I | C-II | R-II | C-III | R-III | C-IV | R-IV | C-V | R-V | |
|---|---|---|---|---|---|---|---|---|---|---|
| Constant | 196.632 * | 11.821* | −14.635** | 64.069* | −32.255 * | 18.751** | 11.027 * | -18.030** | 40.476** | 8.625*** |
| Ind3 | −0.156 * | -0.006* | 0.025* | -0.002** | -0.003* | -0.005* | ||||
| Ind5 | -0.002* | -0.006* | -0.006* | -0.003* | ||||||
| Ind7 | -0.053* | -0.011* | 0.005** | 0.002** | ||||||
| ind9 | -0.010* | −0.036 * | -0.020* | 0.022* | −0.012 * | -0.004** | ||||
| ind11 | 0.024* | -0.037* | 0.002 * | -.007* | ||||||
| ind13 | 0.002* | 0.014* | -0.013* | −0.002 * | 0.003* | 0.071 * | -0.032* | |||
| ind15 | 0.394 * | 0.083* | 0.108 * | 0.093* | 0.042 * | 0.041* | 0.04 * | 0.045* | 0.095 * | 0.052* |
| ind17 | −0.33 * | 0.009* | -0.010** | −0.006 ** | -0.032* | -0.084* | 0.005* | |||
| ind19 | -0.014* | 0.034* | 0.014* | 0.37* | −0.006** | 0.011* | ||||
| ind21 | −0.456 * | 0.02 * | 0.025* | 0.022* | ||||||
| ind23 | −0.041 * | 0.106 * | ||||||||
| ind29 | 0.004 * | −0.046** | ||||||||
| ind31 | −1.313 * | 0.232* | 1.719 * | -1.121** | 3.505 * | |||||
| ind32 | 101.129 * | -5.919* | -24.574* | 23.65 * | -23.527* | -22.217* | −42.847 * | -19.614* | ||
| ind33 | -27.166** | |||||||||
| ind35 | -21.746** | |||||||||
| ind36 | 35.278 ** | 12.756 * | 17.021** | |||||||
| ind37 | 71.889** | |||||||||
| ind38 | 10.541* | 21.694** | -56.334** | |||||||
| R-Square | 0.918 | 0.993 | 0.902 | 0.983 | 0.895 | 0.966 | 0.803 | 0.982 | 0.902 | 0.995 |
* p < 0.001, ** p < 0.05, *** p > 0.05. Source: http://clouddc.chass.utoronto.ca.ezproxy.lib.ryerson.ca/ ds/cfmrc/displayTSX.do?ed=2018&t=ts&f=daily&lang=en#v2, accessed 13 September 2025.Crises: C-I: 1/1/1992–30/4/1993; C-II: 1/7/1998–30/10/1998; C-III: 1/5/2007–30/3/2009; C-IV: 1/9/2014–30/2/2016; C-V: 1/2/2020–30/3/2020. Recoveries: R-I: 30/4/1993-7/3/1997, R-II: 30/4/1998-12/3/1999; R-III: 30/3/2009-23/3/2011, R-IV: 29/2/2016-14/3/2017; R-V:23/3/2020-8/2/2022.
Table 3.
MLR results for BNS during crises and recoveries.
| C-I | R-I | C-II | R-II | C-III | R-III | C-IV | R-IV | C-V | R-V | |
|---|---|---|---|---|---|---|---|---|---|---|
| Constant | −33.554 * | -6.430 | −33.234 ** | -20.457* | 6.932 * | -2.071* | −1.535 *** | -6.492** | 25.001 * | -11.010* |
| ind1 | 0.027 * | |||||||||
| Ind3 | -0.006 | -0.007* | 0.002 * | 0.002** | 0.004* | |||||
| Ind5 | -0.001 | 0.015* | 0.002* | 0.002** | −0.009 * | -0.002* | ||||
| Ind7 | −0.02 * | -0.013* | 0.006** | −0.009 * | ||||||
| ind9 | 0.007* | −0.017 * | 0.008* | -0.006** | 0.009* | |||||
| ind11 | 0.047 * | 0.026 | 0.005* | |||||||
| ind13 | 0.022 * | -0.005 | −0.009 ** | -0.004** | −0.007 * | 0.008* | 0.014* | |||
| ind15 | 0.084 * | 0.098 | 0.042 * | 0.031* | 0.035 * | 0.035* | 0.026* | 0.015 * | 0.027* | |
| ind17 | -0.003 | 0.014* | 0.005 * | -0.026* | −0.094 * | 0.079* | -0.006* | |||
| ind19 | 0.087 * | -0.022* | -0.021* | -0.010* | ||||||
| ind21 | 0.01 ** | 0.017 * | 0.006** | 0.009 * | 0.003** | |||||
| ind23 | − | 0.021 * | ||||||||
| ind25 | -0.046* | |||||||||
| ind27 | 0.061 * | |||||||||
| ind29 | 0.012* | |||||||||
| ind31 | −0.925 ** | -2.057* | 1.943* | -4.151* | ||||||
| ind32 | 2.429 | 17.498 ** | 18.162* | -15.509* | 21.677* | |||||
| ind33 | -279.642* | 78.965* | ||||||||
| ind35 | 67.599* | |||||||||
| ind36 | -6.031 | -16.340** | ||||||||
| ind37 | −17.937 ** | 22.426 ** | 72.613* | 213.535* | -47.338* | -74.836* | ||||
| ind38 | 11.549 | -14.887** | ||||||||
| R-Square | 0.921 | 0.991 | 0.912 | 0.920 | 0.918 | 0.985 | 0.899 | 0.977 | 0.915 | 0.991 |
* p < 0.001, ** p < 0.05, *** p > 0.05. Source: http://clouddc.chass.utoronto.ca.ezproxy.lib.ryerson.ca/ ds/cfmrc/displayTSX.do?ed=2018&t=ts&f=daily&lang=en#v2, accessed 13 September 2025. Crises: C-I: 1/1/1992–30/4/1993; C-II: 1/7/1998–30/10/1998; C-III: 1/5/2007–30/3/2009 ; C-IV: 1/9/2014–30/2/2016; C-V: 1/2/2020–30/3/2020. Recoveries: R-I: 30/4/1993-7/3/1997, R-II: 30/4/1998-12/3/1999, R-III: 30/3/2009-23/3/2011, R-IV: 29/2/2016-14/3/2017; R-V:23/3/2020-8/2/2022.
Table 5.
MLR results of RBC during crises and recoveries.
| C-I | R-I | C-II | R-II | C-III | R-III | C-IV | R-IV | C-V | R-V | |
|---|---|---|---|---|---|---|---|---|---|---|
| Constant | 14.431 * | 14.547* | 3.969 * | -3.827* | 2.406 *** | -31.803* | 27.377 * | -1.427** | 18.368 * | 28.364* |
| ind1 | 0.002 ** | |||||||||
| Ind3 | 0.024 * | 0.006* | 0.004 * | −0.005 * | -0.003* | |||||
| Ind5 | -0.003* | 0.006* | 0.001* | 0.002* | 0.003* | |||||
| Ind7 | 0.006* | −0.024 ** | -0.043* | 0.031* | 0.007* | -0.008* | ||||
| ind9 | −0.021 * | 0.004** | -0.006* | -0.035* | −0.008 * | -0.004** | −0.013 * | -0.005* | ||
| ind11 | -0.023* | −0.007 * | −0.002 * | 0.003* | ||||||
| ind13 | 0.011 * | 0.014* | -0.015* | 0.001 * | -0.008* | |||||
| ind15 | 0.11 * | 0.115* | 0.12 * | 0.096* | 0.036 * | 0.046* | 0.047 * | 0.038-* | 0.039 * | 0.039* |
| ind17 | -0.014* | −0.41 * | 0.011* | −0.02 * | -0.033* | 0.022** | ||||
| ind19 | -0.046* | 0.038 | -0.012* | 0.006 * | 0.014* | −0.005 * | -0.005** | -0.005** | ||
| ind21 | −0.051 * | 0.011* | 0.021 * | 0.025* | -0.007* | 0.005* | 0.010* | |||
| ind25 | −0.027* | −0.027 * | ||||||||
| ind31 | 0.350* | -5.030* | -24.770* | 9.141* | ||||||
| ind32 | -11.921* | 7.546 * | 24.726* | −14.039 * | -6.972** | -24.811* | ||||
| ind33 | 13.085 ** | 648.651* | -709.530** | -17.131* | ||||||
| ind34 | 18.681 ** | |||||||||
| ind35 | -160.898* | 207.534** | -8.225** | |||||||
| ind37 | -444.144* | 515.343** | -50.994** | |||||||
| ind38 | 31.137** | |||||||||
| R-Square | 0.920 | 0.991 | 0.888 | 0.979 | 0.939 | 0.956 | 0.875 | 0.991 | 0.905 | 0.994 |
* p < 0.001, ** p < 0.05, *** p > 0.05. Source: http://clouddc.chass.utoronto.ca.ezproxy.lib.ryerson.ca/ ds/cfmrc/displayTSX.do?ed=2018&t=ts&f=daily&lang=en#v2, accessed 13 September 2025. Crises: C-I: 1/1/1992–30/4/1993; C-II: 1/7/1998–30/10/1998; C-III: 1/5/2007–30/3/2009 ; C-IV: 1/9/2014–30/2/2016; C-V: 1/2/2020–30/3/2020. Recoveries: R-I: 30/4/1993-7/3/1997, R-II: 30/4/1998-12/3/1999; R-III: 30/3/2009-23/3/2011, R-IV: 29/2/2016-14/3/2017; R-V:23/3/2020-8/2/2022.
Table 7.
Frequency of indices across banks in crisis and recovery periods.
| Index | Crisis Periods (Total) | Recovery Periods (Total) | Difference |
|---|---|---|---|
| ind15 (Financials) | 24/25 (96%) | 22/25 (88%) | -8% |
| ind13 (Healthcare) | 18/25 (72%) | 21/25 (84%) | +12% |
| ind9 (Consumer Disc.) | 12/25 (48%) | 23/25 (92%) | +44% |
| ind11 (Consumer Staples) | 14/25 (56%) | 22/25 (88%) | +32% |
| ind17 (Info Tech) | 15/25 (60%) | 20/25 (80%) | +20% |
| ind21 (Utilities) | 19/25 (76%) | 16/25 (64%) | -12% |
| ind3 (Energy) | 16/25 (64%) | 14/25 (56%) | -8% |
| ind31 (Call Loan Rate) | 17/25 (68%) | 18/25 (72%) | +4% |
| ind32 (FX Rate) | 13/25 (52%) | 19/25 (76%) | +24% |
| ind19 (Telecom) | 14/25 (56%) | 18/25 (72%) | +16% |
Note: Percentages represent the frequency of indices for five banks, including five crisis and five recovery periods.
Disclaimer/Publisher’s Note: The statements, opinions and data contained in all publications are solely those of the individual author(s) and contributor(s) and not of MDPI and/or the editor(s). MDPI and/or the editor(s) disclaim responsibility for any injury to people or property resulting from any ideas, methods, instructions or products referred to in the content. |
© 2026 by the authors. Licensee MDPI, Basel, Switzerland. This article is an open access article distributed under the terms and conditions of the Creative Commons Attribution (CC BY) license (http://creativecommons.org/licenses/by/4.0/).
Copyright: This open access article is published under a Creative Commons CC BY 4.0 license, which permit the free download, distribution, and reuse, provided that the author and preprint are cited in any reuse.


