
Submitted:
09 April 2025
Posted:
09 April 2025
You are already at the latest version
Abstract
This study examines the economic and financial performance of a sample of popular Italian banks that maintained their mutualistic structure after the 2015 reform that imposed the conversion of the largest banks into joint-stock companies. The analysis covers 2013-2023 and employs two financial ratios, profit margin and Tier 1 ratio, to assess the impact of structural transformation and pandemic crisis. First, the size trend is quantified by assessing the asset trend. The methodology integrates balance sheet analysis, variance analysis (ANOVA) and the Tukey-Kramer test to detect significant differences between geographical areas (North, Central and South Italy). The results partially confirm the hypothesis that cooperative banks have grown despite macroeconomic challenges. The Tier 1 ratio confirms the financial stability of the cooperative banks that have remained so. The profit margin, on the other hand, shows territorial variability, suggesting a correlation between bank performance and local socio-economic conditions. These findings contribute to the debate on the sustainability of cooperative banking models. Future research could extend this analysis with additional financial indicators and apply machine learning techniques to improve predictive modelling in performance evaluation.
Keywords:
cooperative banks
; financial performance
; profitability analysis
; Tier 1 Ratio
; ANOVA
; Tukey-Kramer test
; financial resilience
; banking regulation
; economic geography
MSC: 91G50; 62P20; 91B84
1. Introduction
Italian popular banks have a long tradition in the national financial system, dating back to the second half of the 19th century. Inspired by the European mutualist models developed by Friedrich Wilhelm Raiffeisen and Hermann Schulze-Delitzsch (Henzler, 1971), these institutions have played a crucial role in the financing of small and medium-sized enterprises for over a century, adapting their operations to the economic characteristics of their territories of reference (Confalonieri, 1982; De Lucia Lumeno, 2024). However, since the 2000s, the banking sector has undergone a profound transformation process, characterised by concentration phenomena and an evolution of financial regulation on a European scale.
A turning point was Decree-Law No. 3/2015, known as the Investment Compact, converted into Law No. 33/2015, which mandated the transformation of the largest cooperative banks into joint-stock companies (Banca d’Italia, 2015). The reform aimed to increase transparency and management efficiency, reducing systemic risks in the context of the European Banking Union (Assonime, 2015). Almost ten years later, it remains crucial to investigate the economic-financial evolution of cooperative banks that have maintained the cooperative form, verifying the extent to which they have preserved their capital soundness and competitiveness in the market.
This study proposes a quantitative analysis of the economic-financial performance of a sample of Italian ‘popular’ banks over the period 2014-2023, adopting key indicators such as profit margin and Tier 1 ratio, two key metrics to assess the operating profitability and capital strength of banking institutions, respectively (Stock & Watson, 2019). Furthermore, business performance is preliminarily examined as a proxy for firm size to understand possible correlations between size growth and changes in capital structure.
The methodological approach is based on balance sheet analysis applied to data extracted from Moody’s Analytics (formerly Bureau van Dijk) financial databases, supplemented with statistics to validate the results. ANOVA and Tukey-Kramer tests are used to compare performance between different geographical areas (North, Centre, South and Islands) to examine the relationships between location and balance sheet variables (Stock & Watson, 2019). These tools allow for the identification of statistically significant differences between groups.
The analysis aims to answer key questions concerning the sustainability of cooperative banks in the new competitive scenario:
- Has the sector’s transformation affected the profitability of the remaining cooperative banks?
- Has their capital strength improved or worsened over time?
- Does geographical location affect key balance sheet indicators?
The empirical evidence provided by the study contributes to the debate on the sustainability of the popular bank model in a context increasingly dominated by large banking institutions, complementing the existing literature on the dynamics of the Italian banking sector (Barra & Ruggiero, 2023; Barra & Zotti, 2020). Moreover, the results obtained may provide valuable indications for the regulation of the sector and the strategic management of these institutions in the long run.
2. Literature Review
2.1. A First Bibliometric Approach
In the face of an innumerable international bibliographic production on credit companies’ economy and balance sheets, few contributions focus on popular Italian banks’ managerial and accounting aspects.
In March 2025, an initial exploratory search on Scopus using the terms ‘Italian AND popular AND banks’ identified only 21 papers. Of these, only 10 were related to business, management, accounting, economics, econometrics, and finance.
Production was occasional, focusing more on the pandemic years (Figure 1).
A few interdisciplinary profiles are identified mainly with the social sciences, while other areas are in the minority (Figure 2).
The most widely cited paper dates back more than twenty years: Girardone et al. (2004), which analysed the determinants of bank efficiency. It is a fundamental reference for all studies on the subject (Table 1).
Following at a distance, but still often cited, is the work of Altman et al. (2020), which analysed the creditworthiness assessment of Italian SMEs and mini-bond issuers. The other papers were much more rarely considered worthy of attention by researchers.
The small number of researchers who have ventured into the topic and the frequency of citations concentrated on a few papers makes the ranking of the most cited authors very similar to the previous one (Table 2).
More interesting for identifying the most frequently discussed topics is the list of keywords characterising the publications (Table 3).
It is not possible to identify relevant common topics. There is too much dispersion among the proposed terms. Only three words were used twice: Banking, Financial Services, and Italy.
More interesting is the observation of each term’s Total Link Strength (TLS), which is the sum of the ‘strength’ of all the connections of a keyword (node). A node may have few links but a high strength if its links to other nodes are significant1.
The TLSs of the most cited keywords have the highest value. However, some terms have significant strength, even with only one citation.
The dispersion of authors and the considerable diversity of searches is also evident in Figure 3, which illustrates the co-occurrence among all keywords.
There is no polarisation on specific terms. There is only evidence that, over time, there has been a progressive shift towards specific topics.
2.2. The Main Topics Covered
The bank performance analysis is based on various financial indicators to assess credit institutions’ profitability, capital strength and operational efficiency. The balance sheet represents the primary source of information for studying these phenomena, allowing quantitative models to be applied to identify trends and anomalies in banks’ financial behaviour (Stock & Watson, 2019).
Numerous studies have investigated banks’ economic and financial performance determinants, adopting advanced financial analysis tools. For example, the modified DuPont model was used to break down bank profitability into elementary components, identifying the specific contribution of operating margins, leverage, and asset turnover (Mahdawi et al., 2021). In parallel, research on business cycles has demonstrated the procyclicality of credit, highlighting how changes in macroeconomic growth rates affect lending and banks’ capital strength (Ibáñez-Hernández et al., 2014).
The stability and capitalisation of banks were also the subject of in-depth analyses concerning the effects of institutional reforms and financial globalisation. Andries et al. (2014), for example, assessed the impact of market opening on the banking systems of 17 Central and Eastern European countries, finding that increased monetary and financial freedom, while fostering the growth of the banking sector, has accentuated the volatility of profitability in times of crisis. The Z-score model, developed to measure banking stability, has also been applied to understand the risk of failure of different financial institutions, demonstrating the greater resilience of cooperative banks compared to commercial banks (López-Espinosa et al., 2013).
The performance of Italian cooperative banks was investigated mainly from the point of view of governance and financial stability. Barra and Zotti (2020) analysed the relationship between market power and financial stability, showing a non-linear U-shaped relationship between the sector’s concentration level and systemic risk. In other words, an overly fragmented market and a high concentration of banks can lead to inefficiencies. In addition, subsequent studies have shown that cooperative banks tend to adopt more prudent credit strategies than commercial banks, particularly after the global financial crisis and the implementation of Basel regulations (Barra & Ruggiero, 2023).
Statistical methodologies used to analyse banks’ performance have included data envelopment analysis (DEA) approaches to measure banking efficiency (Avkiran, 2011). This technique, combined with the Malmquist Productivity Index, made it possible to assess changes in efficiency over time, highlighting the differences between banking institutions with different ownership structures. These quantitative methods have also been applied to the Italian context, where the effects of digitisation and banking concentration have been studied to understand the variations in operational efficiency between banks of different sizes (Fiordelisi et al., 2011).
The effects of recent economic crises on bank performance have been the subject of extensive empirical literature. During the financial crisis of 2008-2009, bank ownership and lending policies significantly impacted lenders’ resilience (Coleman & Feler, 2015). More recently, the COVID-19 outbreak has put additional pressure on the banking sector, reducing profitability and increasing levels of credit risk (Risfandy & Pratiwi, 2022). Amrani and Najab (2023) compared the responsiveness of Islamic and conventional banks between 2006 and 2020, highlighting that differentiated governance models affected the ability to absorb exogenous shocks. These studies suggest that the structural characteristics of banks, including their legal form and governance, are key determinants of their ability to adapt in crisis scenarios.
The analysis of Italian cooperative banks that have remained in cooperative form is a field of research that is still relatively little explored in the international literature, especially concerning the evolution of capital solidity in the post-reform context. The transformation of the largest cooperative banks into joint-stock companies, imposed by the 2015 legislation (Banca d’Italia, 2015), has redefined the sector’s structure, raising questions about the sustainability of the banks that have remained cooperative. The analysis of the Tier 1 ratio, a key measure of bank capital strength, makes it possible to verify whether the cooperative base reduction has affected the ability of these institutions to maintain adequate levels of capitalisation (Menicucci & Paolucci, 2023).
One of the key aspects of the Italian banking system is the relationship between capital strength and credit stability. Recent studies have shown that, despite the growing concentration of the sector, cooperative and cooperative banks maintain an important function in supporting SMEs, showing more excellent stability in times of crisis than commercial banks (Carbó-Valverde et al., 2019). This result is consistent with Tier 1 ratio data, which correlates with higher capitalisation and lower volatility in bank yields (Bongini et al., 2021).
The effect of the 2015 cooperative banking reform has been widely debated in the economic literature. The legislation imposed the transformation into joint-stock companies for cooperative banks with assets above a certain threshold, changing their governance and operational strategies. Empirical studies have shown that banks that have maintained the cooperative form have recorded reduced employment and greater prudence in granting credit, but they have shown a significant deterioration in profitability (Ciocchetta et al., 2020). An econometric analysis based on panel data confirmed that the reform’s effect varies depending on geographical location, with banks in the South having a more significant impact on self-financing capacity than those in the North and Centre (Anolli et al., 2021).
Finally, a crucial aspect of the Italian banking sector is operational efficiency. Recent studies have used the Malmquist Productivity Index to analyse the evolution of the productivity of Italian banks, showing that the digitisation and automation of services have helped improve commercial banks’ efficiency more quickly than cooperative and cooperative banks (Bos et al., 2020). However, cooperative banks maintained positive profitability thanks to prudent credit risk management.
This brief literature analysis provides a more detailed quantitative picture of the evolution of Italian cooperative banks, highlighting the factors that influence their profitability and capital solidity. This study, therefore, aims to contribute to the debate by applying advanced quantitative models to assess these institutions’ profitability and capital strength in 2013-2023. Statistical techniques such as ANOVA and Tukey-Kramer tests make it possible to identify significant patterns in the data, offering new evidence on the economic and financial sustainability of these realities in the changed regulatory and market context.
We therefore want to verify the following hypotheses:
- H1: Italian cooperative banks have increased their size despite the pandemic economic crisis and the spread of online banking;
- H2: profitability has tended to grow in recent years;
- H3: the higher quality capital component of the capital that guarantees depositors from any losses with the consequent liquidation of the institution’s capital has been improved;
- H4: location influences profitability and capitalisation, being linked to the characteristics of the territory in which cooperative banks operate.
3. Methodology
The empirical analysis was conducted through a quantitative approach based on processing financial data extracted from Moody’s Analytics (formerly Bureau van Dijk) databases, which provide detailed information on Italian banks. The dataset covers 2013-2023 and includes key variables such as geographical location, total assets and two main balance sheet ratios. Therefore, the study’s subject is a sample of Italian cooperative banks that have maintained their cooperative configuration without transforming into joint-stock companies following the 2015 reform.
The analysis focuses on three fundamental dimensions:
- Company size is measured through the trend of total assets to identify expansionary trends or operational contractions.
- Profitability is assessed through the Profit Margin, which expresses the bank’s ability to generate profit compared to revenues. This Margin provides a direct measure of earning capacity, allowing the sustainability of cooperative banks to be compared with broader banking contexts (Fiordelisi et al., 2011).
- Capital strength, analysed through the Tier 1 ratio, is a key indicator for measuring the bank’s ability to absorb financial shocks and comply with regulatory capital requirements. The choice of the Tier 1 ratio responds to the growing academic focus on capital stability as a key element for the financial resilience of banking institutions (Berger et al., 2016).
The quantitative analysis was structured on several levels to ensure methodological robustness and statistical validity. The research hypotheses were tested by analysis of variance (ANOVA) and the Tukey-Kramer test.
One-factor ANOVA: this technique was used to verify whether there are statistically significant differences between the three Italian macro-regions (North, Centre, South and Islands) concerning the two budget indicators considered. ANOVA allows the evaluation of intra-group and intergroup variation, comparing the averages of the different subsamples to identify any systematic divergences in the performance of cooperative banks (Kutneret al., 2005).
Tukey-Kramer test: In the case of ANOVA significance, this post hoc test was used to determine which groups differ from each other accurately. The Tukey-Kramer test is beneficial in financial studies to avoid the problem of Type I error accumulation when making multiple comparisons (Montgomery, 2019).
The combined use of ANOVA and Tukey-Kramer is justified by the need to obtain a rigorous quantitative picture of the performance of cooperative banks, with a focus on territorial differences and structural dynamics of the particular segment of the Italian banking sector investigated.
This methodology makes it possible to answer research questions, verify the related hypotheses, identify any critical issues and strengths of Italian cooperative banks, contribute to the literature on banking performance dynamics and assess the implications of financial regulation.
4. The Banks Analysed
There are 15 Italian cooperative banks under study, located as follows: 2 in the North, 6 in the Centre and 7 in the South and the major islands (Table 4).
The Popolare Valpadana Institute was not included in the analysis as it is currently in liquidation, thus reducing the adequate sample to 14 cooperative banks. In addition, data availability was not uniform for all the institutions examined.
The dynamics of cooperative banks reflect the transformations imposed by the current regulatory framework, which has led many companies in the North to convert into joint-stock companies. As a result, the concentration of banks that have retained the cooperative structure is higher in the central and southern regions, where credit institutions tend to be smaller and operate in markets characterised by less structured economic environments.
In the South, the situation is further complicated due to the difficulties in accessing credit for small and medium-sized enterprises, influenced by less financial transparency and higher insolvency rates (Corvino & Coppola, 2019; Angelini, 2022). In this context, cooperative and credit banks play a fundamental role, providing more flexible financial solutions than large banking institutions bound by strict supervisory and risk management criteria.
All the banks included in the analysis have confirmed the legal form of Limited Liability Cooperative Company for Shares by the regulations currently in force in the banking sector.
Their size was determined by analysing the trend of the Total assets (Table 5).
Depending on the ten-year values, a graph is drawn up that highlights the trend (Figure 4).
Over the years, the amount of assets in the historical series maintains a non-constant trend. The North is the only one to present an anomaly in the period considered, as in recent years, it has not recorded positive values, which are always available for the Centre, South and Islands.
The trend is varied everywhere. In the years 2020-21, there is a peak in growth, which then decreases. It should be remembered that 2020-2022, Italy was hit by the Covid-19 pandemic, causing an intense economic and financial crisis. Paradoxically, these are the years characterised by the highest asset amounts: this could be attributable to the high number of loans granted by banks and tiny and medium-sized companies (SMCs) in the pandemic period to cope with the emergence of the health crisis. During the pandemic period, small and medium-sized companies were able to receive loans more quickly as a result of the “Liquidity Decree”, which provided for the guarantee of the Guarantee Fund for SMCs, 100% up to 30,000 euros, automatically, free of charge and without evaluation, therefore without waiting for the outcome of the investigation (Ceroni, 2024).
5. The Trend of the Main Ratios
5.1. The Profit Margin
The profit margin is a profitability index that measures the bank’s ability to control expenses and, therefore, the ability to produce net profit from its operating revenues, i.e. those of core operations (Alemanni et al., 2015). This index is used in financial statement analysis as it helps identify expenses that should be reduced and products or services with inadequate performance that may need to be discontinued. Additionally, it allows for highlighting the business’s top-performing products and services that contribute to the growth and, consequently, improve the profit margin. The formula is:
Profit Margin = Net Profit/Net Sales
For this indicator, the descriptive statistics shown in Table 6 were calculated for the different groups that comprise the sample under analysis.
The trends in the average profit margin of the credit institutions under analysis can be better observed in Figure 5.
For a better graphical representation of the trends employing interpolating curves, it is necessary first to identify the interpolating equation of the arithmetic mean: the most expressive is the polynomial of order six that maximises R2 (Table 7).
The R2 values are excellent for each area, except for the Center, which is still acceptable. It is, therefore, possible to represent the interpolating curves of the profit margin (Figure 6).
It is denoted that the index trend is relatively irregular in all areas.
The results recorded by the cooperative banks of Central Italy are the best, and they are always positive. They assumed values close to 20% from 2013 to 2017, then rose slightly in 2018 and fell again in 2019 and 2020. The value of 2023, which is equal to 100%, referable to a single bank, is insignificant. It was, therefore, taken into account only for graphical representation purposes but not for the subsequent Anova and Tukey-Kramer tests.
A similar trend, but with lower values, characterises the trend of South and Island banks. The improvement of this index over the years can be seen, also recording the highest profit margin value in 2023 of 31.49%, but referring to only half of the companies, only three, compared to six in previous years.
A very different situation emerges for northern banks. The trend is, in fact, uneven, with even negative values in the years 2014 and 2017. The situation, however, has improved significantly in 2021 and 2022.
In order to assess the presence of statistically significant differences between the macro-regions, we move on to the analysis of the variance with one factor, ANOVA, which produced the results outlined in Table 8.
From the results of the ANOVA method, the H0 hypothesis is rejected, and the alternative H1 hypothesis is accepted because the value of F>F is critical. This indicates significant differences between the various groups, to be detected with the Post-Anova test (Table 9).
The test identifies significant differences in the comparison between North and Centre, confirming what can already be guessed by observing the previous graphs: the North recorded the worst value of all the trends of the different territories; on the contrary, the Centre was characterised by much better values, always positive.
5.2. Tier 1 Ratio
The Tier 1 ratio is the “core capital” of a bank, a fundamental element in assessing the “financial strength” of all financial institutions. This indicator is crucial because it provides information on a bank’s ability to absorb losses without jeopardising its operations and the safety of customer deposits.
The Tier 1 ratio is the ratio of Tier 1 capital (which includes Core Tier 1 and eligible hybrid capital instruments) to Risk-Weighted Assets (RWAs), the aggregate value of assets a bank holds, weighted according to their credit, market and operational risk.
In summary, more simply:
Tier 1 ratio = Core capital/Risk-weighted assets
It is referred to in the Notes to the Financial Statements, Part F, Section 2, 2.2 Capital Adequacy, B. Quantitative information, item C.2 Core capital/Tier 1 Capital Ratio, in the Bank of Italy’s circular governing the financial statements of banks in Italy2.
The ideal Tier 1 Ratio level is 8%. Suppose banks do not reach the required level of capital ratio. In that case, the Supervisory Authorities require the latter to increase their capital to restore a healthy balance between financial sources and uses so that the stability and continuity of the credit institution over time can be guaranteed. In general, a healthy core capital ratio indicates that a bank has a sound capital base and is better able to absorb losses without damaging its financial stability.
Table 10 shows the descriptive statistics of the index.
Figure 7 illustrates the trend of the index’s average over the 2013–2023 time frame.
To better represent the trend, it is necessary to identify the interpolating equation of the arithmetic mean. Again, the polynomial of order 6 allows a better representation because it maximises the values of R2 (Table 11).
The R2 values are excellent for every area except for the Center; however, they are outstanding. It is, therefore, possible to represent the interpolating curves of the profit margin (Figure 8).
The previous calculations show a homogeneous index trend in all territorial areas. The values are always higher than 4.5%. Overall, the entire sample of banks considered complies with the minimum required by Basel. It can, therefore, be deduced that all cooperative banks have a sound capital base. They can, therefore, absorb any losses in the best possible way without damaging their financial structure. Specifically, the best value was recorded by northern banks only in 2013, but in the following years, it fell sharply, from about 22% to about 15% in 2015. From 2018 to 2023, all macro-regions recorded constant growth, unaffected by the Covid-19 crisis.
ANOVA and Post-ANOVA statistical techniques are needed to verify the presence of significant differences between macro-regions. The analysis of one-factor variance yielded the results shown in Table 12.
The H0 hypothesis is accepted because of the F<F value critics: no group variability or difference exists. Italian cooperative banks recorded a similar trend in the eleven years considered. This conclusion is confirmed in the Tukey-Kramer post-Anova test (Table 13).
There is no significant difference between the banking institutions analysed for the Tier 1 Ratio. The result obtained with Anova is confirmed.
6. Discussion and Conclusion
The analysis conducted on the Italian cooperative banks that remained in cooperative form in 2013-2023 made it possible to highlight the economic and financial dynamics that characterise this segment of the banking sector, offering a quantitative perspective on their main balance sheet ratios. The results are part of a line of studies investigating the resilience of cooperative banks, their role in the financial system and the implications of recent regulatory transformations.
Firstly, the H1 hypothesis, relating to the dimensional growth of cooperative banks despite the challenges of the pandemic crisis and digitalisation, is only partially confirmed. The data show growth in total assets in periods of more significant public intervention in support of small and medium-sized companies, consistent with the evidence of Ciocchetta et al. (2020), who pointed out that emergency policies temporarily affected the volume of activity of cooperative banks. However, the subsequent decline in assets in 2023 raises questions about the long-term sustainability of the mutual model, recalling the concerns expressed by Anolli et al. (2021) about the impact of the 2015 reform on the self-financing capacity of cooperative banks, especially in the southern regions.
For profitability (H2), the results confirm a general growth trend, albeit with territorial differences. The profit margin was more stable for banks in the Centre and South, while institutions in the North showed more discontinuous trends, with some years characterised by negative results. This result aligns with studies by Barra and Zotti (2020), which showed a correlation between banking concentration and financial stability. The profitability of the Centre and South seems to reflect a lower exposure to competition from large banks than in the North, where the transformation into joint-stock companies has reduced the number of cooperative institutions, as Rossi (2020) noted.
The analysis of the Tier 1 Ratio confirmed the H3 hypothesis, showing a solid capitalisation of the cooperative banks analysed, with values above the Basel requirements. These data support the literature emphasising the greater prudence in risk management by cooperative banks compared to commercial banks (Carbó-Valverde et al., 2019; Bongini et al., 2021). However, the decline in the Tier 1 Ratio in Northern banks between 2013 and 2015 suggests that the forced transition of some cooperative banks to the form of joint stock companies resulted in an initial impact on their capital capacity, a phenomenon already discussed by Menicucci & Paolucci (2023).
Finally, the H4 hypothesis, relating to the influence of location on financial performance, is confirmed by statistical analysis. The significant territorial variability, with the North recording the most unstable performances, recalls the debate on the persistence of regional imbalances in the Italian banking system, already underlined by Viesti (2021). Banks in the South, while showing increasing profitability, operate in a context characterised by greater credit risk and less financial transparency, consistent with the observations of Corvino and Coppola (2019) and Angelini (2022).
These results have important theoretical and practical implications.
On a theoretical level, the study contributes to the literature on cooperative banks and their role in the financial system, confirming the effectiveness of cooperative governance in maintaining capital solidity and profitability despite a context of increasing digitalisation and competition from large credit institutions (Barra & Ruggiero, 2023). In addition, empirical evidence strengthens the debate on regulating cooperative banks, suggesting that the 2015 reform had differentiated effects depending on geographical areas and company size.
From a practical perspective, these findings can be helpful for banking institutions, regulators and trade associations. Cooperative banks can use this analysis to assess their growth and capitalisation strategies, while policymakers could consider more targeted interventions to support the sustainability of cooperative banks in economically less developed territories. In addition, the academic sector could benefit from further studies that deepen the link between banking performance and institutional characteristics, adopting even broader methodological approaches, as suggested by Alabbad and Schertler (2022) and Zahid et al. (2023).
In conclusion, the Italian cooperative banks that have remained in cooperative form have shown a good ability to adapt to changes in the economic and regulatory context, albeit with some critical issues related to location and dimensional growth. If financial inclusion policies continue to enhance their role, these institutions can represent a credible alternative to the growing concentration of banks, contributing to the diversification of the financial system and the support of local economies.
This study is part of a larger research project on the financial and economic performance of numerous Italian production sectors, and it is also compared with similar trends in other countries. The results of these studies are summarised in Table 14.
Author Contributions
This article derives from the paper presented by the authors at the 4th International Scientific Conference on “Inclusion: Tools, Paths and Perspectives” that took place in Benevento (Italy), on 22 October 2024, at the Giustino Fortunato University. The conference proceedings, awaiting publication, analysed the number of employees as an indicator of company size, and two of the primary financial statement ratios: ROE and the debt ratio. The research subsequently developed to compose this article, which investigates another size parameter and two other financial statement ratios. The article is the result of collaboration between the two authors. However, it is possible to attribute the different paragraphs in relation to the prevailing tasks that were carried out. Guido Migliaccio was responsible for the design and scientific setting of the work, identifying the banks, outlining the theoretical aspects and the critical analysis of the results. The paragraphs ’Introduction’, ’Literature Review’ and ’Discussion and Conclusion’ are therefore attributable to him. Francesca Zerillo, on the other hand, procured and analysed the balance sheet data by statistically processing them and presenting the relevant comments. The paragraphs “Methodology”, “The banks analysed” and “The trend of the main ratios” with related subsections are therefore attributed to her.
Funding
This research received no external funding.
Data Availability Statement
The data used to support the reported results can be found in the sources indicated in the article.
Conflicts of Interest
The authors declare no conflicts of interest.
Abbreviations
The following abbreviations are used in this manuscript:
| MDPI | Multidisciplinary Digital Publishing Institute |
| DOAJ | Directory of open access journals |
| TLA | Three letter acronym |
| LD | Linear dichroism |
| 1 | A high TLS value indicates, for instance, that an article is highly connected and thus has a central relevance in the network. |
| 2 | Banca d’Italia, The bank balance sheet: schemes and compilation rules, Circular no. 262 of 22 December 2005 and subsequent amendments. |
References
- Alabbad, A.; Schertler, A. COVID-19 and bank performance in dual-banking countries: An empirical analysis. Journal of Business Economics 2022, 92(9), 1511–1557. [Google Scholar] [CrossRef] [PubMed]
- Al-Halabi, N. B. The impact of applying modern financial analysis tools on detecting fraudulent practices in financial statements of listed banks: An analytical study. Pertanika Journal of Social Sciences and Humanities 2018, 26(4), 2599–2612. [Google Scholar]
- Al-Nasser Mohammed, S. A. S.; Muhammed, D. J. Financial crisis, legal origin, economic status, and multi-bank performance indicators: Evidence from Islamic banks in developing countries. Journal of Applied Accounting Research 2017, 18(2), 208–222. [Google Scholar] [CrossRef]
- Altman, E.I.; Esentato, M.; Sabato, G. Assessing the credit worthiness of Italian SMEs and mini-bond issuers. Global Finance Journal 2020, 43, 100450. [Google Scholar] [CrossRef]
- Ambrosio, R.A.; Coccorese, P. Bad loans and de novo banks: Evidence from Italy. Economic Notes 2015, 44(1), 101–122. [Google Scholar] [CrossRef]
- Amrani, O.; Najab, A. The impact of multi-layer corporate governance on banks’ performance under the GFC and the COVID-19: A cross-country panel analysis approach. Journal of Risk and Financial Management 2023, 16(1), Article 15. [Google Scholar] [CrossRef]
- Andries, A. M.; Mutu, S.; Ursu, S. G. Impact of institutions, financial reform and economic governance on bank performance. Transformations in Business and Economics 2014, 13(3C), 410–429. [Google Scholar]
- Angelini, P. Il Mezzogiorno per lo sviluppo dell’Italia: il ruolo delle banche e delle imprese; Banca d’Italia, 2022; Available online: https://www.bancaditalia.it/pubblicazioni/interventi-direttorio/int-dir-2022/Angelini_sistema_produttivo_finanziario_mezzogiorno_12102022.pdf (accessed on 10 December 2024).
- Anolli, M.; Beccalli, E.; Borello, G. The impact of regulation on the Italian banking system: Evidence from the transformation of cooperative banks. Economic Modelling 95 2021, 376–390. [Google Scholar] [CrossRef]
- Antoniades, A. Liquidity risk and the credit crunch of 2007–2008: Evidence from micro-level data on mortgage loan applications; Bank for International Settlements, Monetary and Economic Department; Basel, 2014. [Google Scholar]
- Assonime, *!!! REPLACE !!!*. La riforma delle banche popolari: Un’analisi critica; Associazione fra le Società Italiane per Azioni, 2015. [Google Scholar]
- Avkiran, N. K. Association of DEA super-efficiency estimates with financial ratios: Investigating the case for Chinese banks. OMEGA 2011, 39(3), 323–334. [Google Scholar] [CrossRef]
- Banca d’Italia (2005), Il bilancio bancario: schemi e regole di compilazione, Circolare n. 262 del 22 dicembre 2005 e successive modifiche.
- Banca, & d’Italia. La riforma delle banche popolari: Obiettivi e implicazioni; Banca d’Italia, 2015. [Google Scholar]
- Barra, C.; Ruggiero, N. The role of nonlinearity on the financial development–economic performance nexus: An econometric application to Italian banks. Empirical Economics 2021, 60(5), 2293–2322. [Google Scholar] [CrossRef]
- Barra, C.; Ruggiero, N. Bank-specific factors and credit risk: Evidence from Italian banks in different local markets. Journal of Financial Regulation and Compliance 2023, 31(3), 316–350. [Google Scholar] [CrossRef]
- Barra, C.; Zotti, R. Market power and stability of financial institutions: Evidence from the Italian banking sector. Journal of Financial Regulation and Compliance 2020, 28(2), 235–265. [Google Scholar] [CrossRef]
- Barucci, E.; De Cecco, M. Banche popolari: Governance, riforme e futuro; Il Mulino, 2015. [Google Scholar]
- Battaglia, F.; Gualandri, E. Banche popolari e concentrazione nel settore bancario italiano: Sfide e prospettive. Rivista di Economia e Banca 2021, 45(3), 56–78. [Google Scholar]
- Beck, T.; Demirguc-Kunt, A.; Levine, R. Finance and inequality: Theory and evidence. Annual Review of Financial Economics 2015, 7(1), 31–52. [Google Scholar] [CrossRef]
- Berger, A. N.; Bouwman, C. H. S.; Kick, T.; Schaeck, K. Bank risk-taking and liquidity creation following regulatory interventions and capital support. Journal of Financial Intermediation 26 2016, 115–141. [Google Scholar] [CrossRef]
- Bhattacharya, S.; Momaya, K. S.; Iyer, K. C. Benchmarking enablers to achieve growth performance: A conceptual framework. Benchmarking 2020, 27(4), 1475–1501. [Google Scholar] [CrossRef]
- Bongini, P. The financial crisis and Italian banks: A twofold downturn. Journal of Banking Regulation 2017, 18(2), 1–12. [Google Scholar] [CrossRef]
- Bongini, P.; Iannidou, S.; Nieri, L. Bank stability and capital regulation in Italy: Evidence from the banking sector. Journal of Financial Stability 54 2021, 100879. [Google Scholar] [CrossRef]
- Bos, J. W.; Contreras, I.; Tortosa-Ausina, E. Banking efficiency and financial technology: Evidence from Italy. European Journal of Operational Research 2020, 287(2), 613–630. [Google Scholar] [CrossRef]
- Bussoli, C. Gualandri, E., Bussoli, P., Eds.; Corporate governance and bank performance in Italy. In Financial Systems in Troubled Waters: Information, Strategies, and Governance to Enhance Performances in Risky Times; Taylor and Francis; Abingdon, 2013; pp. 40–61. [Google Scholar]
- Carbó-Valverde, S.; Rodríguez-Fernández, F.; Udell, G. F. Trade credit, the financial crisis, and SME access to finance. Journal of Money, Credit and Banking 2019, 51(4), 701–733. [Google Scholar] [CrossRef]
- Ciocchetta, F.; Conti, F. M.; Rendina, A. The effects of the 2015 Italian cooperative bank reform on credit allocation and employment. Banca d’Italia Occasional Papers 2020, (553), 1–34. [Google Scholar] [CrossRef]
- Coleman, N.; Feler, L. Bank ownership, lending, and local economic performance during the 2008–2009 financial crisis. Journal of Monetary Economics 71 2015, 50–66. [Google Scholar] [CrossRef] [PubMed]
- Confalonieri, A. Banca e industria in Italia 1861–1980; Il Mulino, 1982. [Google Scholar]
- De Bonis, R.; Silvestri, L. La funzione sociale delle banche popolari. Economia Italiana 2019, 34(2), 123–144. [Google Scholar]
- De Lucia Lumeno, G. 160 anni banche popolari al servizio del paese 1864–2024; Edicred, 2024. [Google Scholar]
- Ferrari, P. Il ruolo delle banche popolari nel sistema finanziario italiano. Rivista Bancaria 2018, 74(4), 234–250. [Google Scholar]
- Fiordelisi, F.; Marques-Ibanez, D.; Molyneux, P. Efficiency and risk in European banking. Journal of Banking & Finance 2011, 35(5), 1315–1326. [Google Scholar] [CrossRef]
- Fiordelisi, F.; Marques-Ibanez, D.; Molyneux, P. Efficiency and risk in European banking. Journal of Banking & Finance 2011, 35(5), 1315–1326. [Google Scholar] [CrossRef]
- Fiorentino, E.; De Vincenzo, A.; Heid, F.; Karmann, A. The effects of consolidation and competition on the performance of Italian banks. Journal of Banking & Finance 2011, 35(2), 349–366. [Google Scholar] [CrossRef]
- Girardone, C.; Molyneux, P.; Gardener, E.P.M. Analysing the determinants of bank efficiency: The case of Italian banks. Applied Economics 2004, 36(3), 215–227. [Google Scholar] [CrossRef]
- Henzler, H. Raiffeisen und Schulze-Delitzsch: Die Geschichte der Genossenschaftsbewegung; Kohlhammer, 1971. [Google Scholar]
- Ibáñez-Hernández, F. J.; Peña-Cerezo, M. Á.; De La Mata, A. A. Identifying credit procyclicality processes and the impact of statistical provision in Spain: Analysis of bank financial statements. Revista Española de Financiación y Contabilidad 2014, 43(4), 380–403. [Google Scholar] [CrossRef]
- Ielasi, F. Basel Pillar II risks in Italian banks. Banks and Bank Systems 2012, 7(4), 67–74. [Google Scholar]
- Illia, L.; Colleoni, E.; Meggiorin, K. How infomediaries on Twitter influence business outcomes of a bank. International Journal of Bank Marketing 2021, 39(5), 709–724. [Google Scholar] [CrossRef]
- Kadir, N. A.; Abdullah, N. L.; Harun, N.; Nordin, N. A.; Jaffar, A. Financial performance of Islamic bank in Malaysia during and after economic crisis. 2011 IEEE Colloquium on Humanities, Science and Engineering (CHUSER) 2011, Article 6163855, 839–844. [Google Scholar] [CrossRef]
- Kutner, M. H.; Nachtsheim, C. J.; Neter, J.; Li, W. Applied linear statistical models, 5th ed.; McGraw-Hill, 2005. [Google Scholar]
- López-Espinosa, G.; Moreno, A.; Rubia, A.; Valderrama, L. Good for banking stability? An assessment of market discipline across bank governance models. Journal of Banking & Finance 2013, 37(6), 2230–2242. [Google Scholar] [CrossRef]
- Luzzatti, L. La diffusione del credito popolare in Italia. Francesco Sacchetto: Padova. Re-edition La diffusione del credito e le banche popolari; Pecorari, *!!! REPLACE !!!*, Ed.; Istituto veneto di scienze lettere ed arti, 1997. [Google Scholar]
- Luzzatti, L. Discorso di Luigi Luzzatti per le onoranze tributate a Tiziano Zalli, il fondatore della Banca popolare di Lodi; senza editore, 1909. [Google Scholar]
- Menicucci, E.; Paolucci, G. ESG dimensions and bank performance: An empirical investigation in Italy. Corporate Governance (Bingley) 2023, 23(3), 563–586. [Google Scholar] [CrossRef]
- Migliaccio, G.; Sorrentino, F. Alcuni aspetti delle performance economico-finanziarie delle banche in epoca pandemica: Un confronto internazionale. In Full paper conference proceeding del XV Convegno nazionale dell’Accademia italiana di Economi Aziendale (AIDEA 2023): “L’aziendalismo crea valore! Il ruolo dell’accademia nelle sfide della società, dell’economia e delle istituzioni”; AIDEA, 2023; pp. 1–28. [Google Scholar]
- Montgomery, D. C. Design and analysis of experiments, 10th ed.; Wiley, 2019. [Google Scholar]
- Mykhayliv, D.; Zauner, K. G. The financial and economic performance of social banks. Applied Economics 2018, 50(34–35), 3833–3839. [Google Scholar] [CrossRef]
- Risfandy, T.; Pratiwi, D. I. The performance of Indonesian Islamic rural banks during COVID-19 outbreak: The role of diversification. Journal of Islamic Monetary Economics and Finance 2022, 8(3), 455–470. [Google Scholar] [CrossRef]
- Rossi, S. Le banche popolari: Cooperazione e credito al servizio del territorio; Il Mulino, 2020. [Google Scholar]
- Sharma, N.; Thakur, S. Relocating the roots of marxism in the call of the wild and the iron heels of Jack London. International Journal of Recent Technology and Engineering 2019, 7(6), 318–320. [Google Scholar]
- Signorini, L. F. The journey to financial well-being through financial inclusion; Banca d’Italia, 2024; Available online: https://formatresearch.com/wp-content/uploads/2024/11/Testo-int-ING-signorini-04112024.pdf (accessed on 8 December 2024).
- Solari, S. Luigi Luzzatti and the making of the Italian monetary system. History of Economic Thought and Policy 2020, (2), 67–84. [Google Scholar] [CrossRef]
- Stock, J.H.; Watson, M.W. Introduction to econometrics; Pearson, 2019. [Google Scholar]
- Sun, Y.; Gozgor, G.; Lau, C. K. M.; Soliman, A. M. Inclusive finance and sustainability: The dynamic spillover effects of uncertainties on access to credit. Research in International Business and Finance 2025b, 73, 102628. [Google Scholar] [CrossRef]
- Sun, Y.; Wang, M.; Mehmood, U.; Wang, Y.; Dan, J. Technological advancement and inclusive finance: Dual influences on environmental quality in OECD countries. Finance Research Letters 2025a, 72, 106496. [Google Scholar] [CrossRef]
- Viesti, G. Centri e periferie: Europa, Italia, Mezzogiorno dal XX al XXI secolo; Laterza, 2021. [Google Scholar]
- Xu, T.; Yang, G.; Chen, T. The role of green finance and digital inclusive finance in promoting economic sustainable development: A perspective from new quality productivity. Journal of Environmental Management 2024, 370, 122892. [Google Scholar] [CrossRef] [PubMed]
- Zahid, M.; Naqvi, S. U.-U.-B.; Jan, A.; Rahman, H. U.; Wali, S. The nexus of environmental, social, and governance practices with the financial performance of banks: A comparative analysis for the pre and COVID-19 periods. Cogent Economics and Finance 2023, 11(1), Article 2183654. [Google Scholar] [CrossRef]
Figure 1.
Documents by year. Source: Scopus.
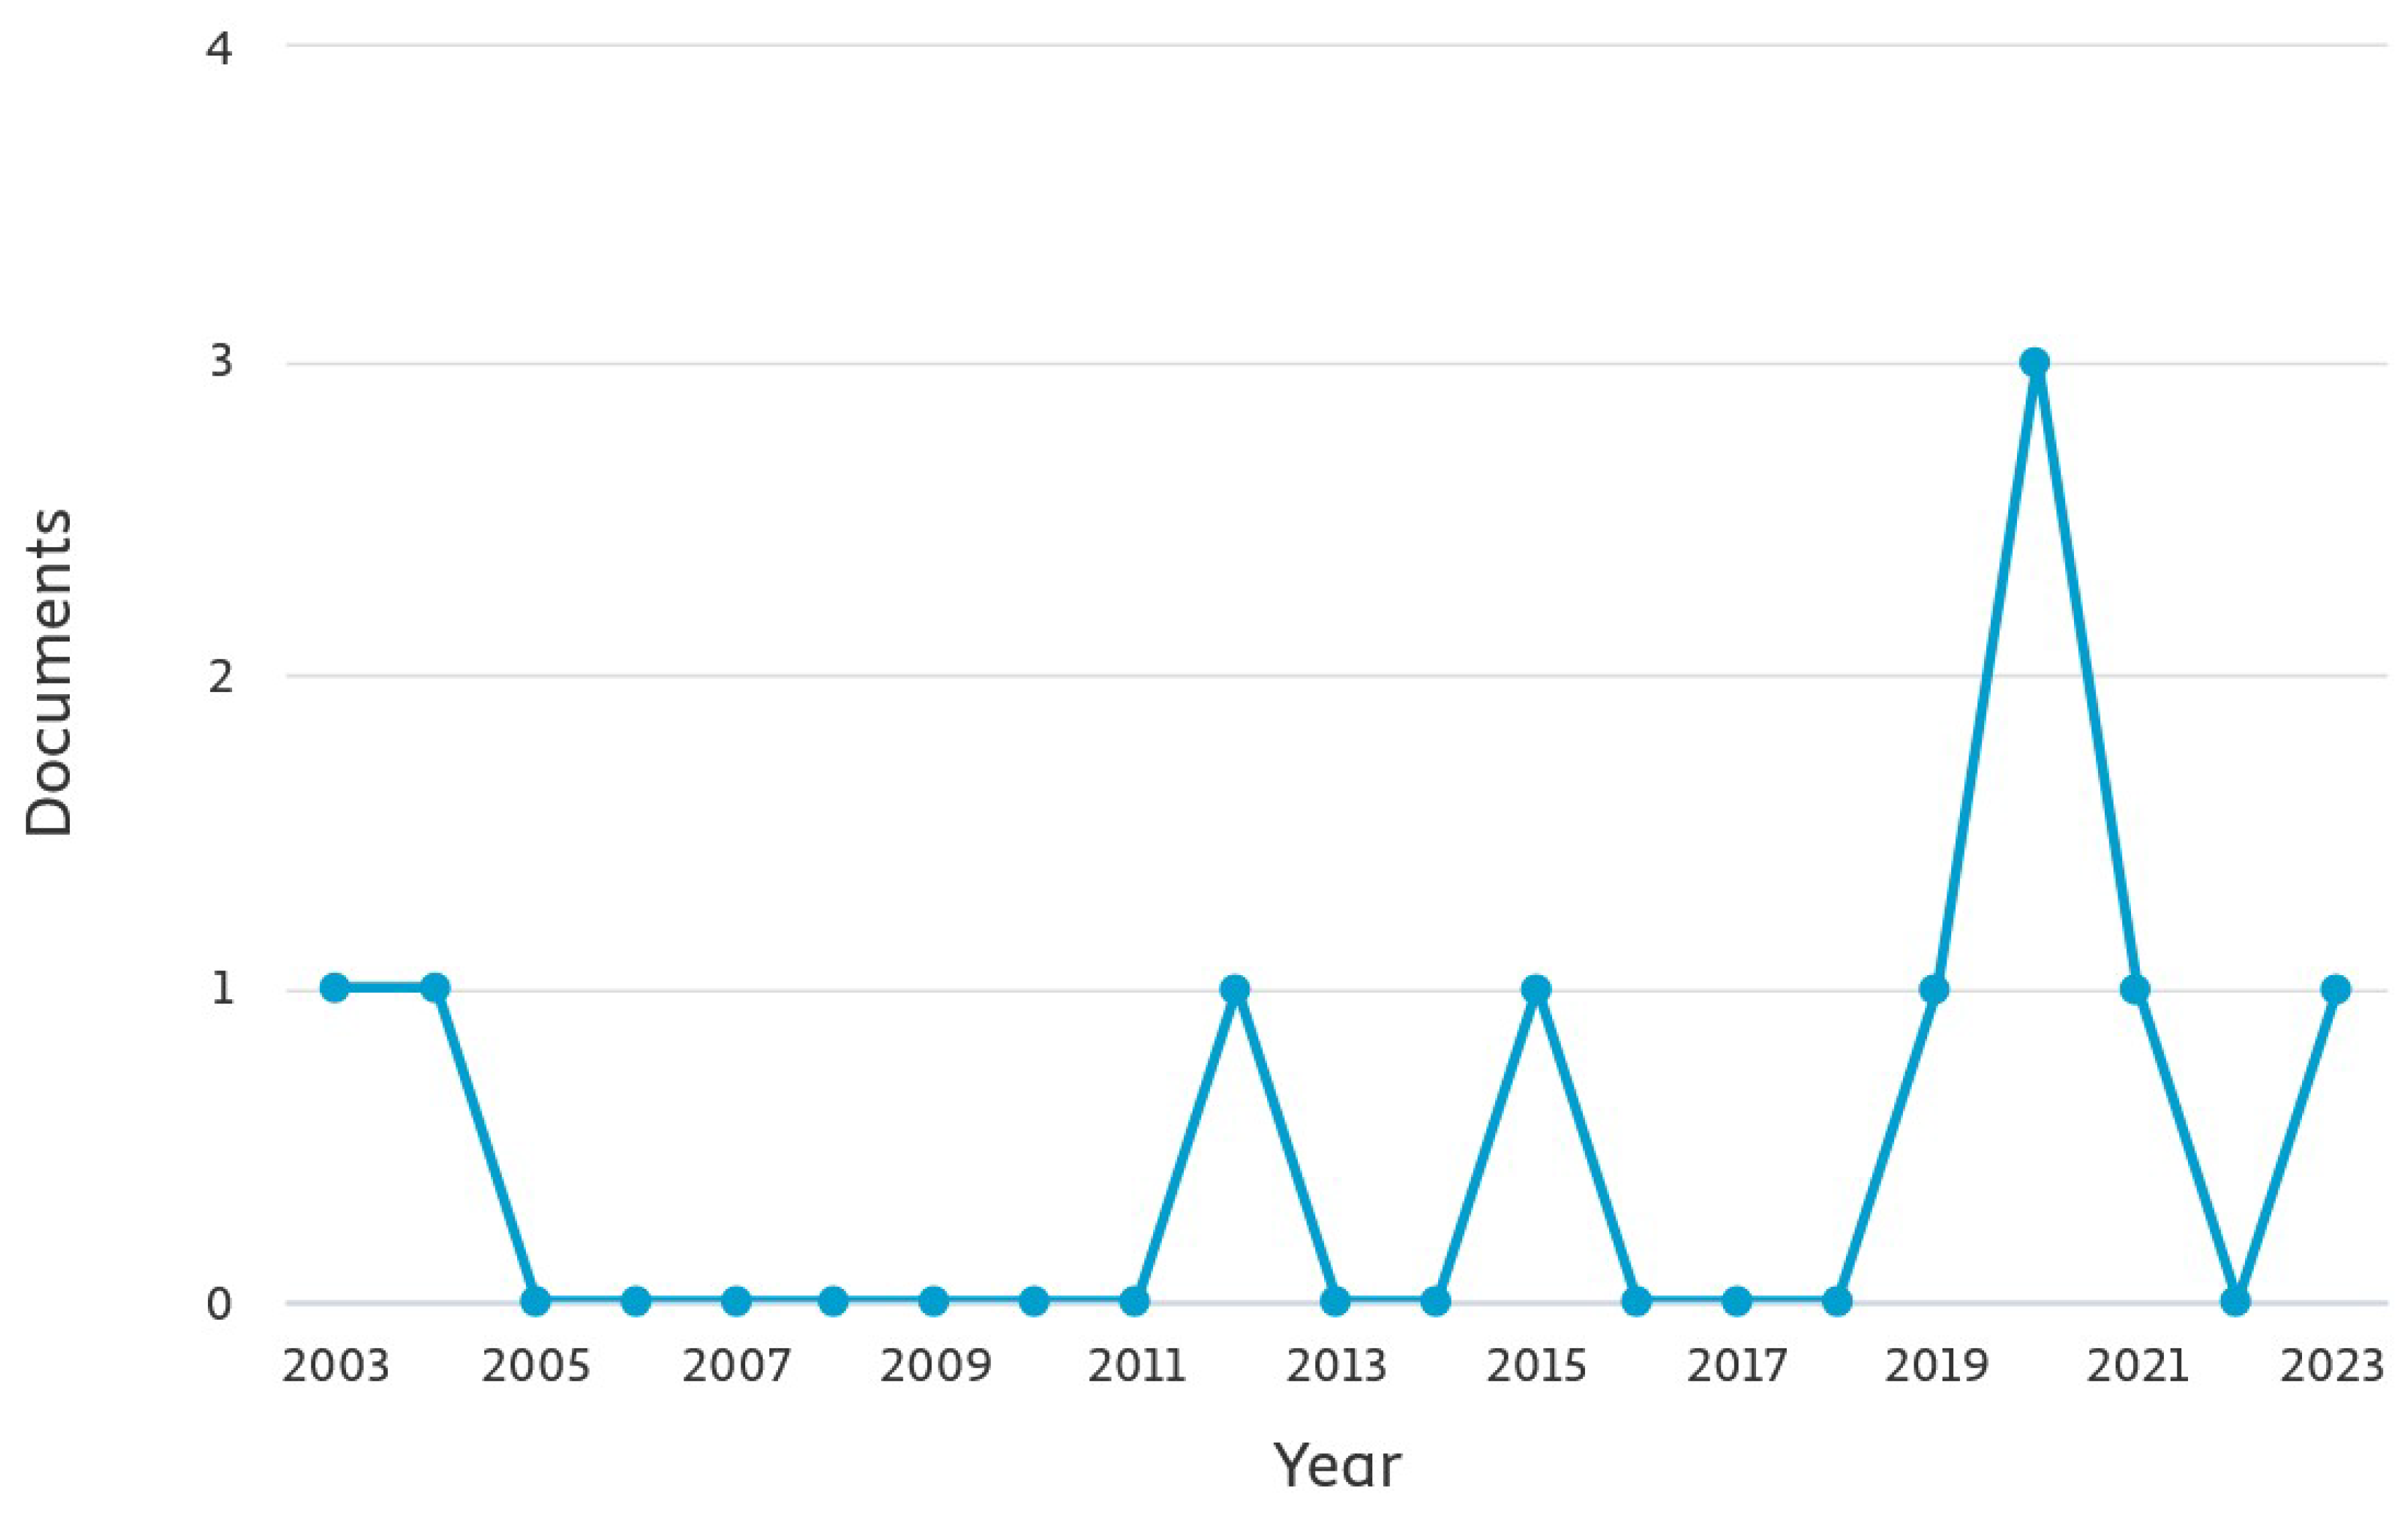
Figure 2.
Documents by subject area. Source: Scopus.
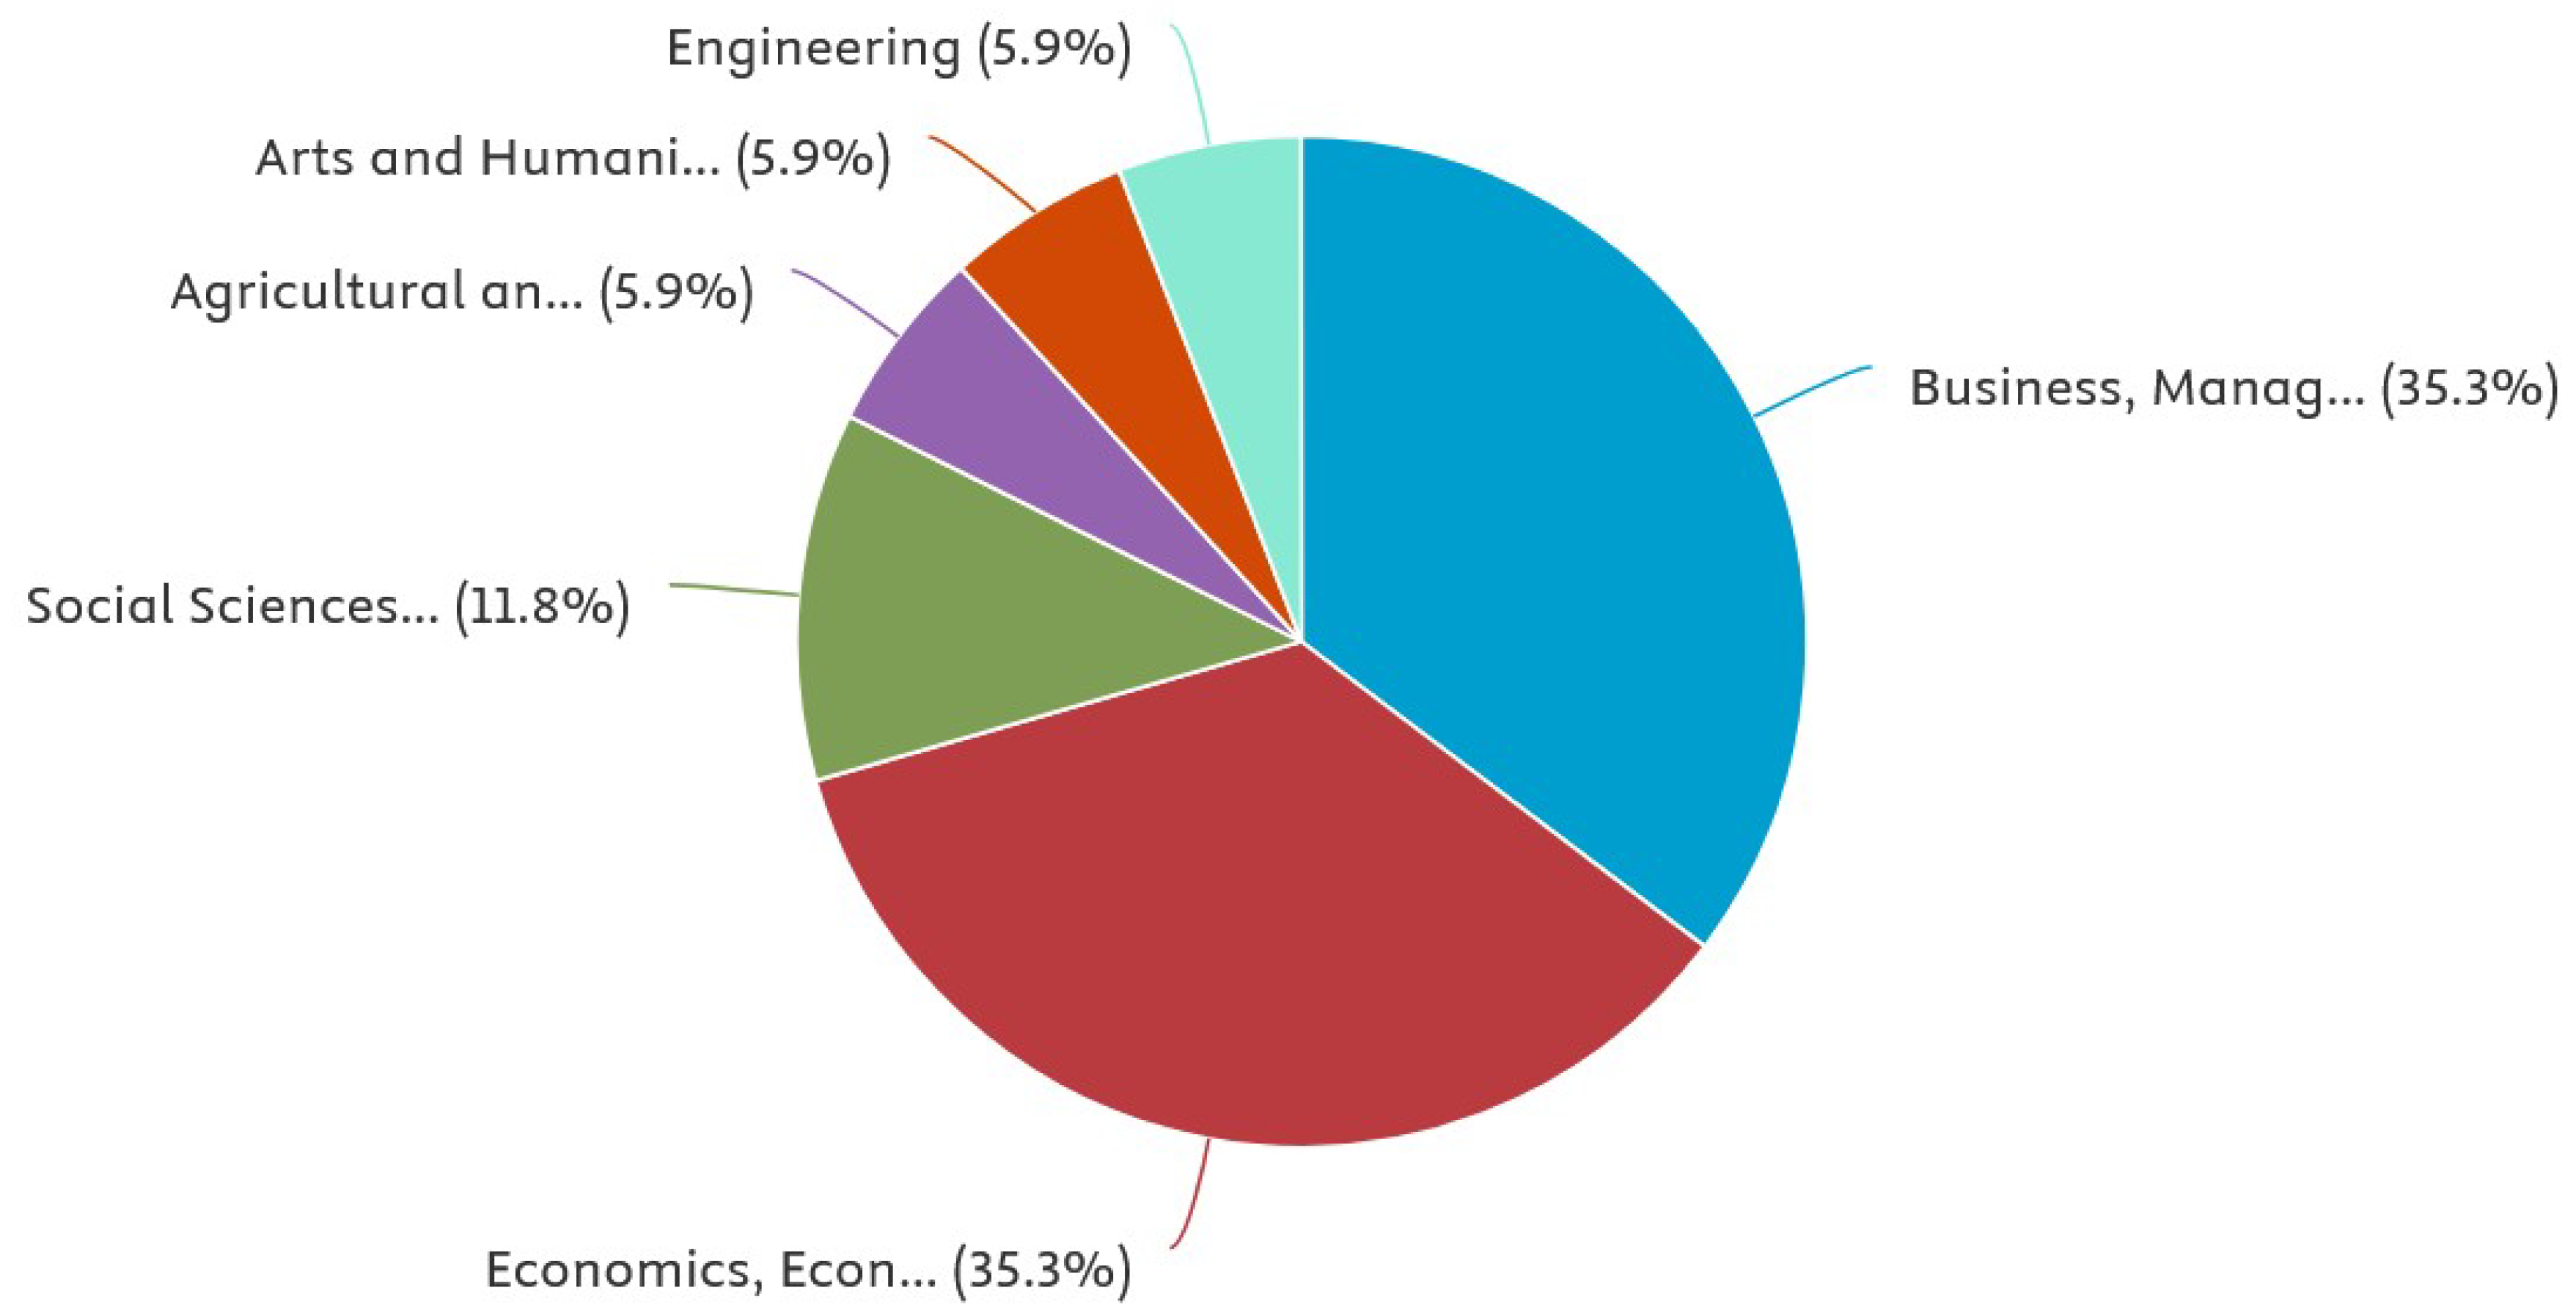
Figure 3.
Co-occurrence between all keywords. Source: VOSviewer.
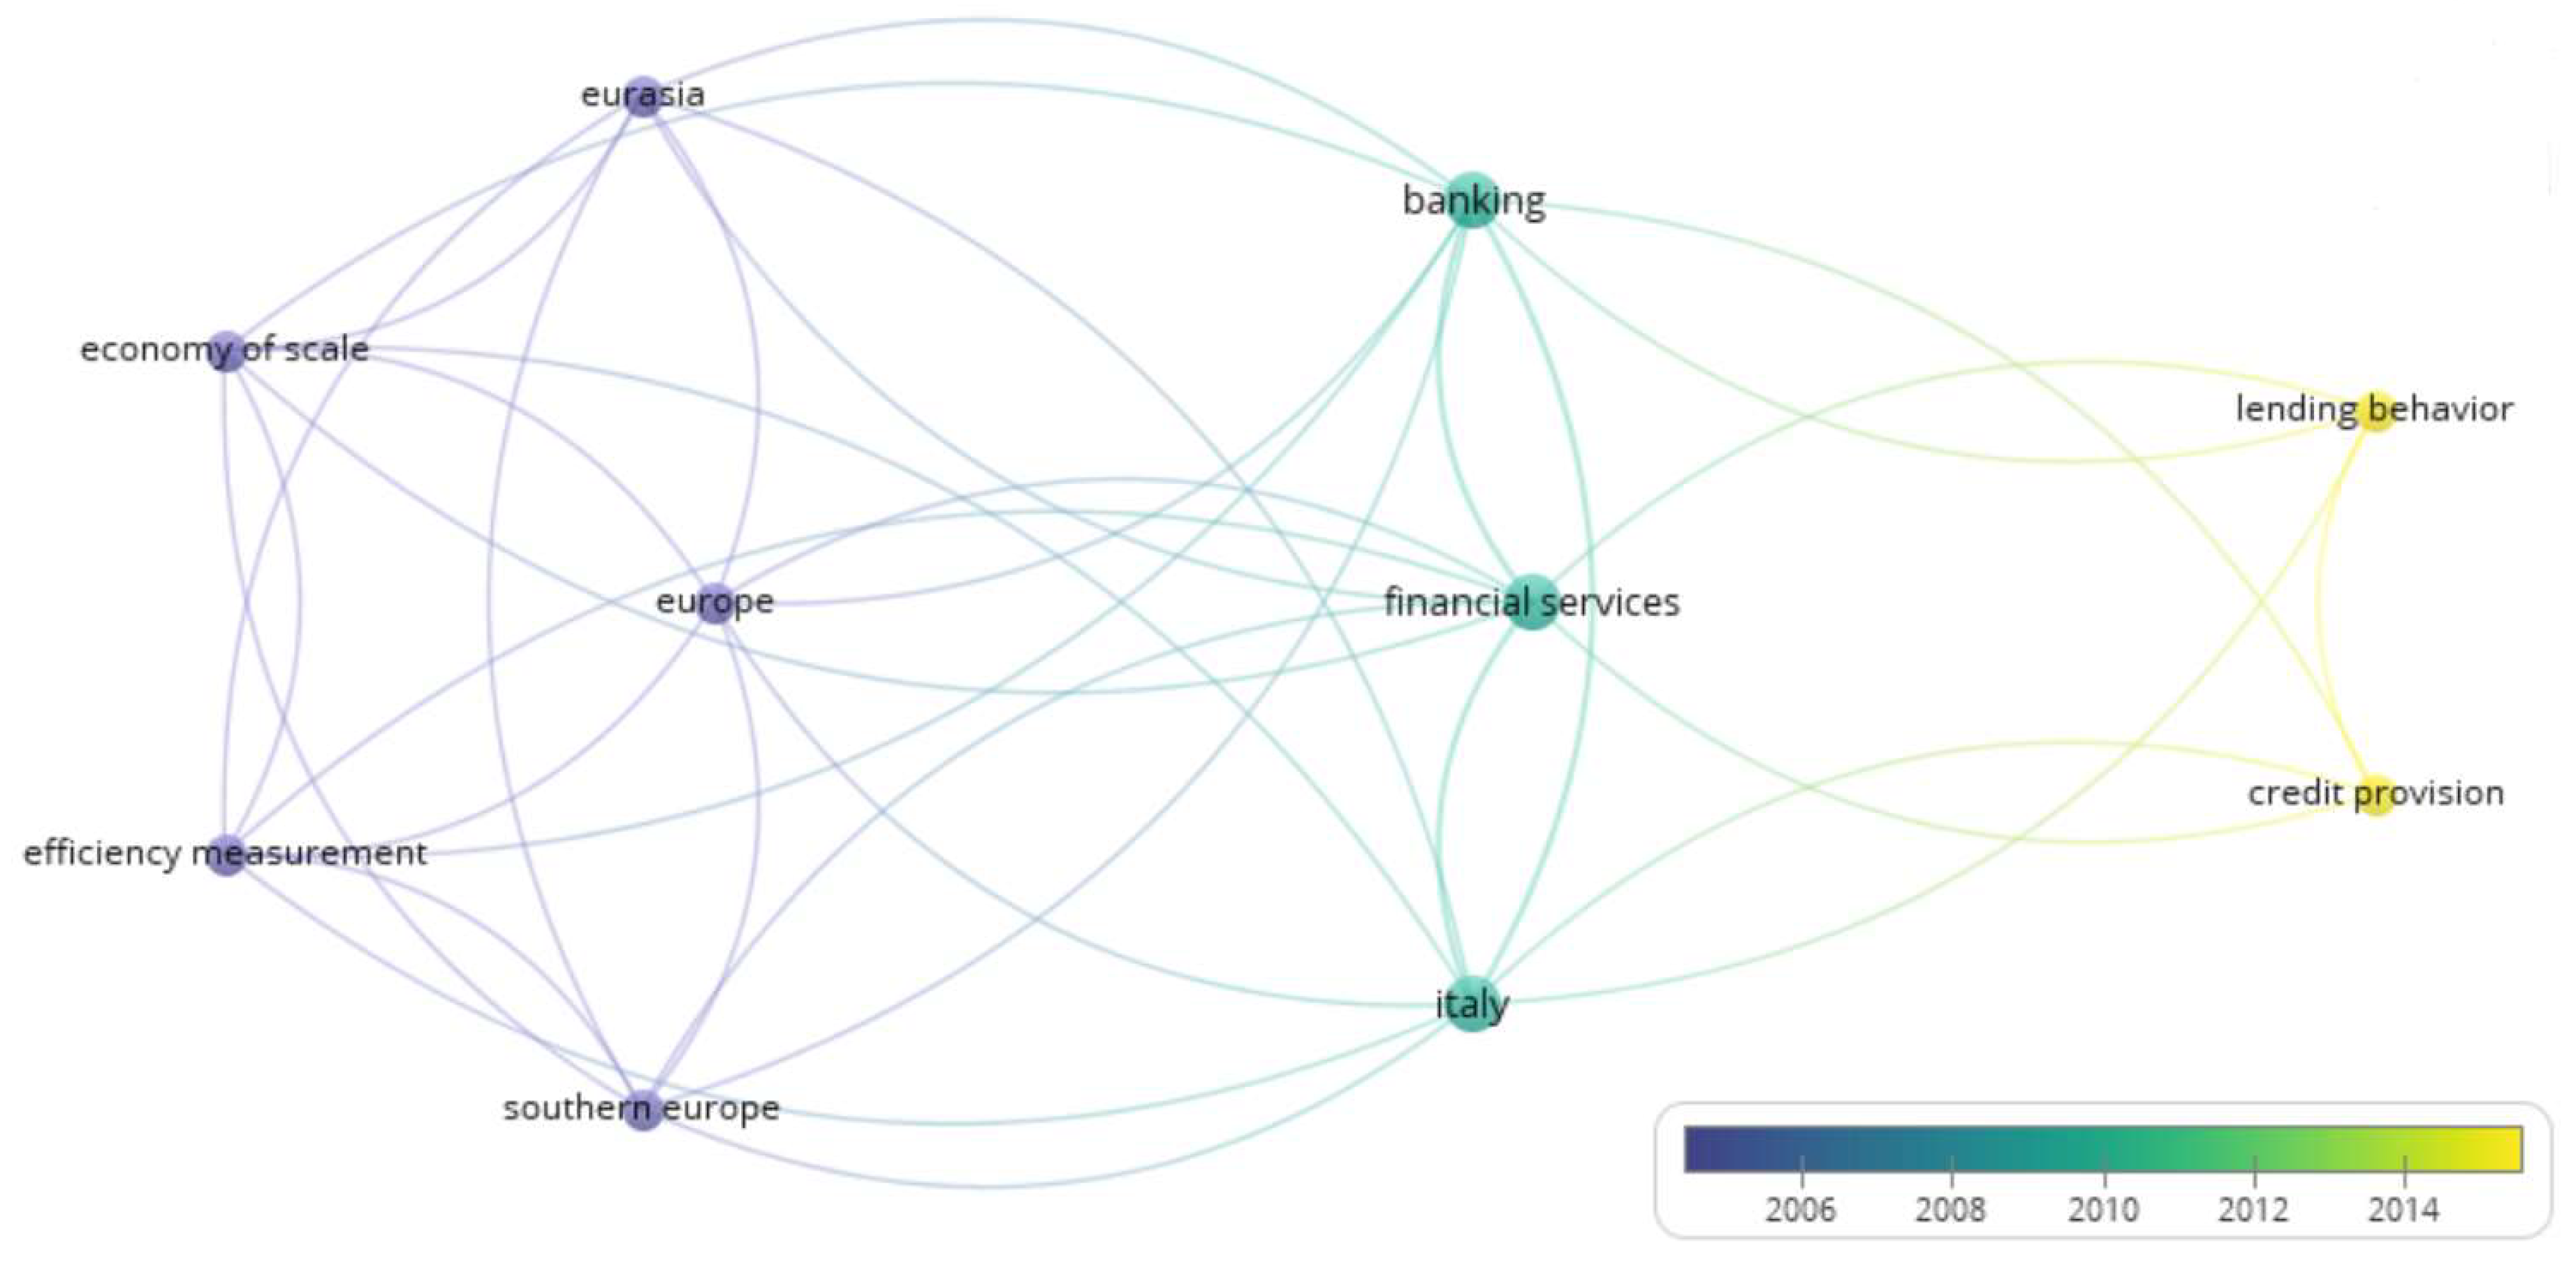
Figure 4.
Graphic trend of total assets 2013-2023. Source: Our elaboration.
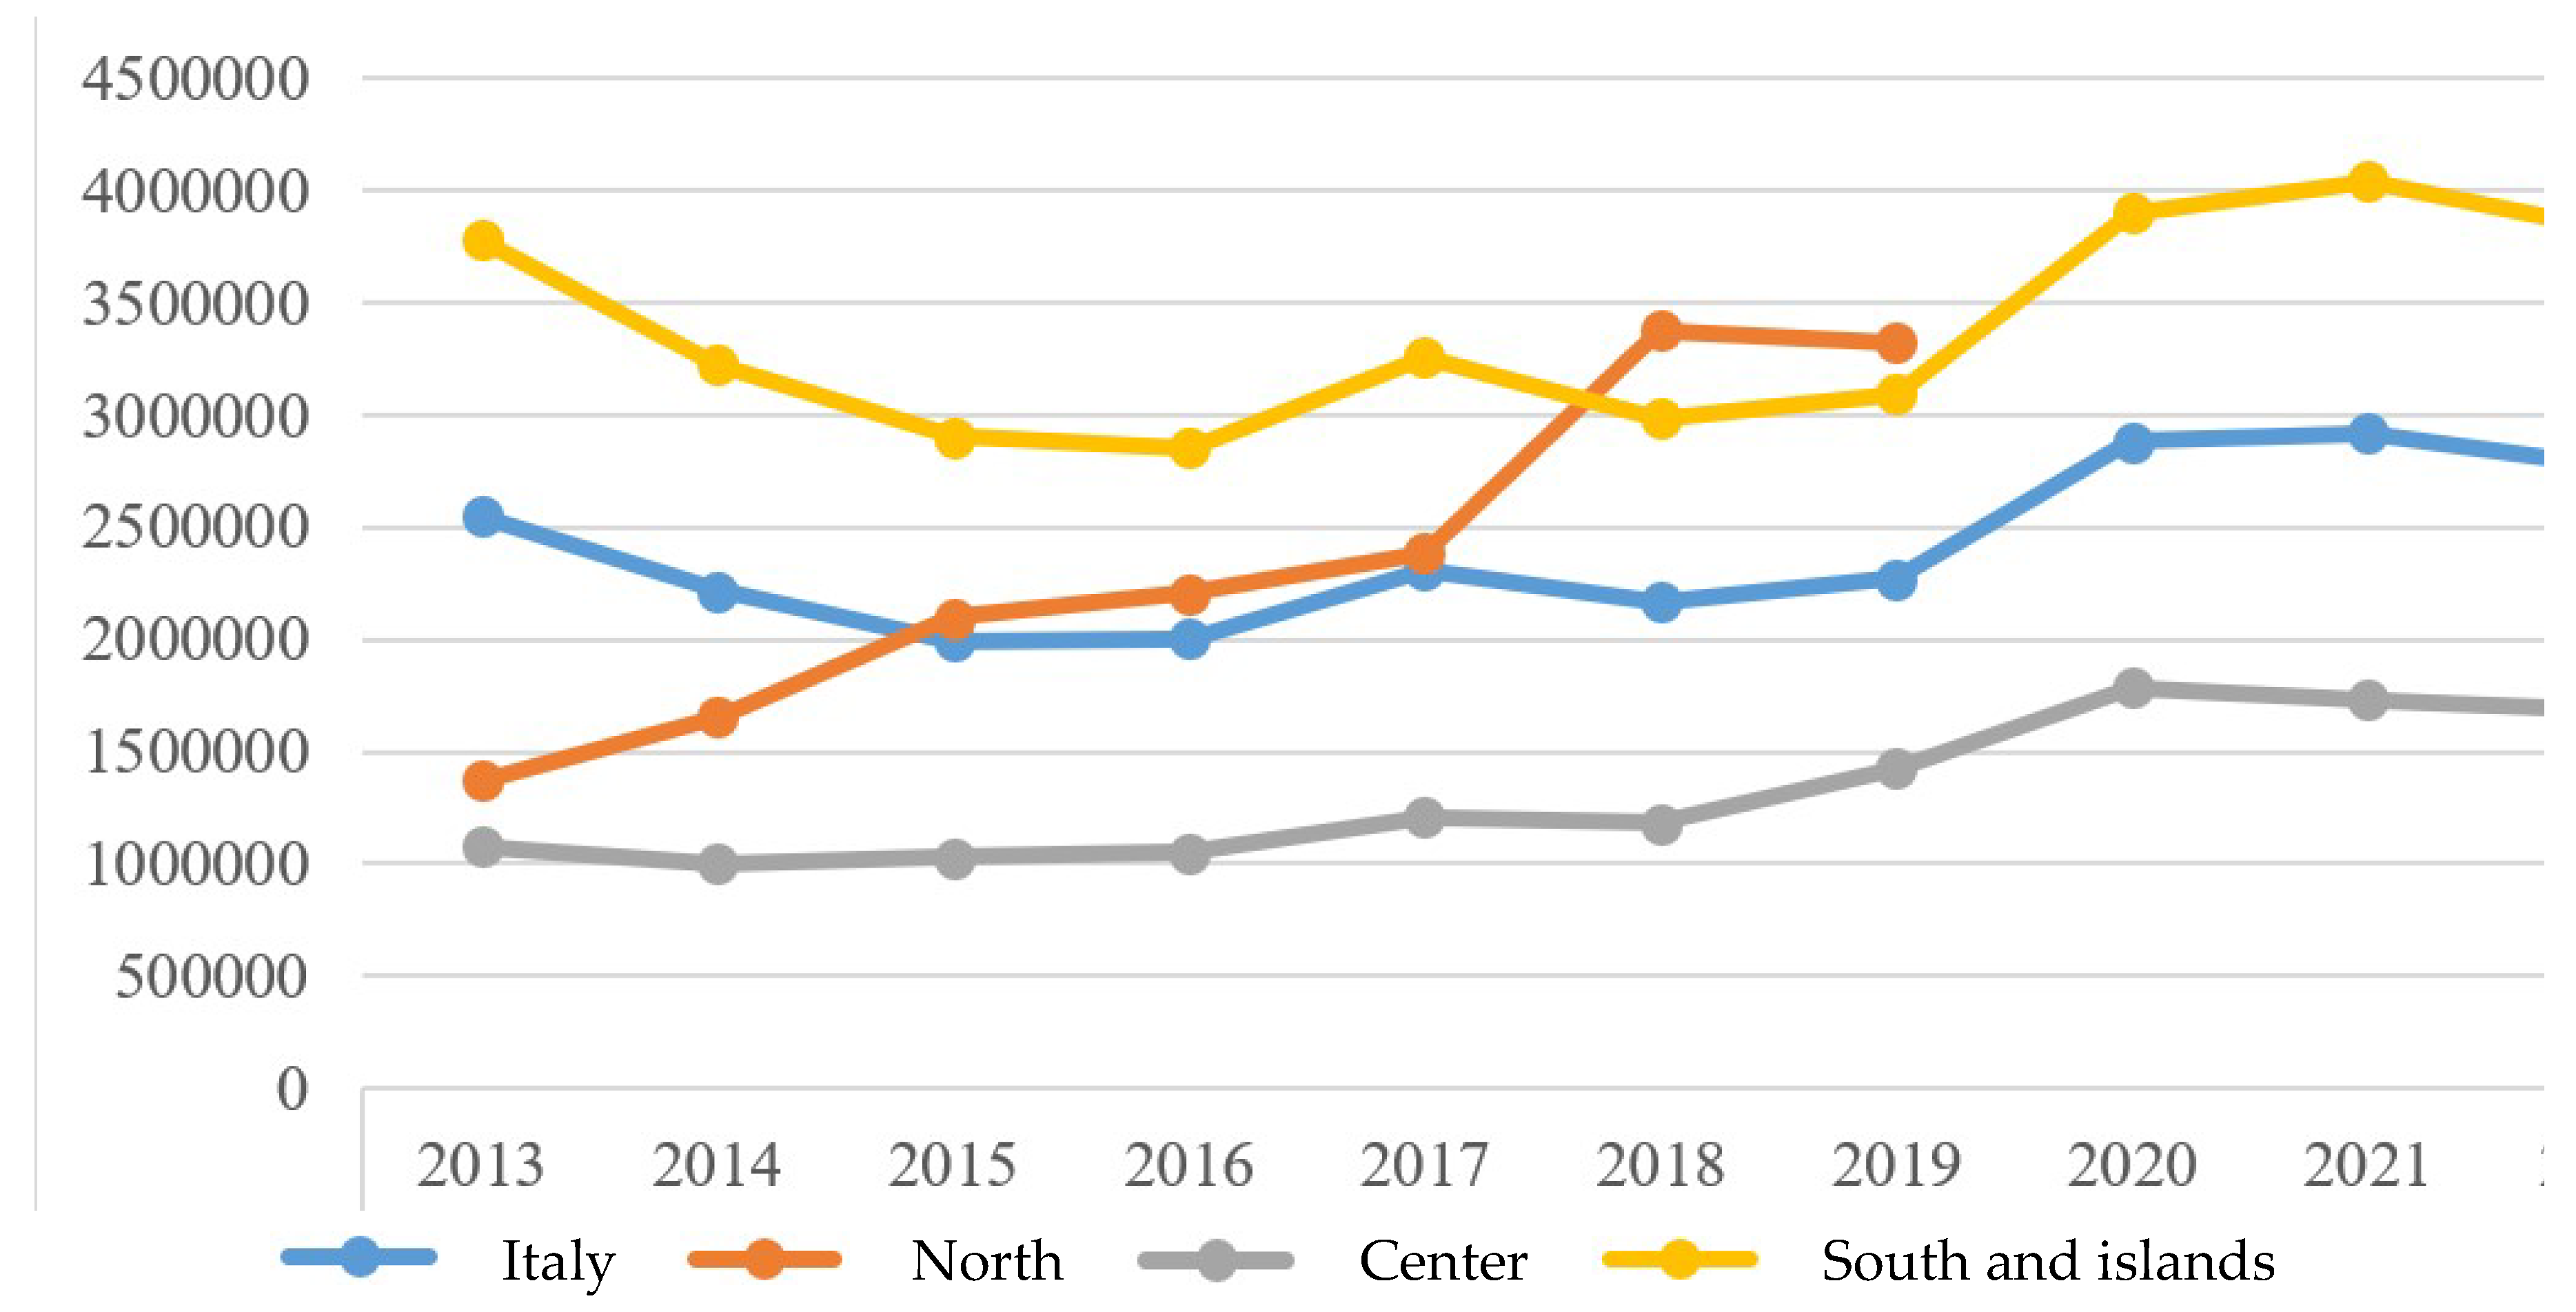
Figure 5.
Profit Margin—Chart Trend. Source: our elaboration.
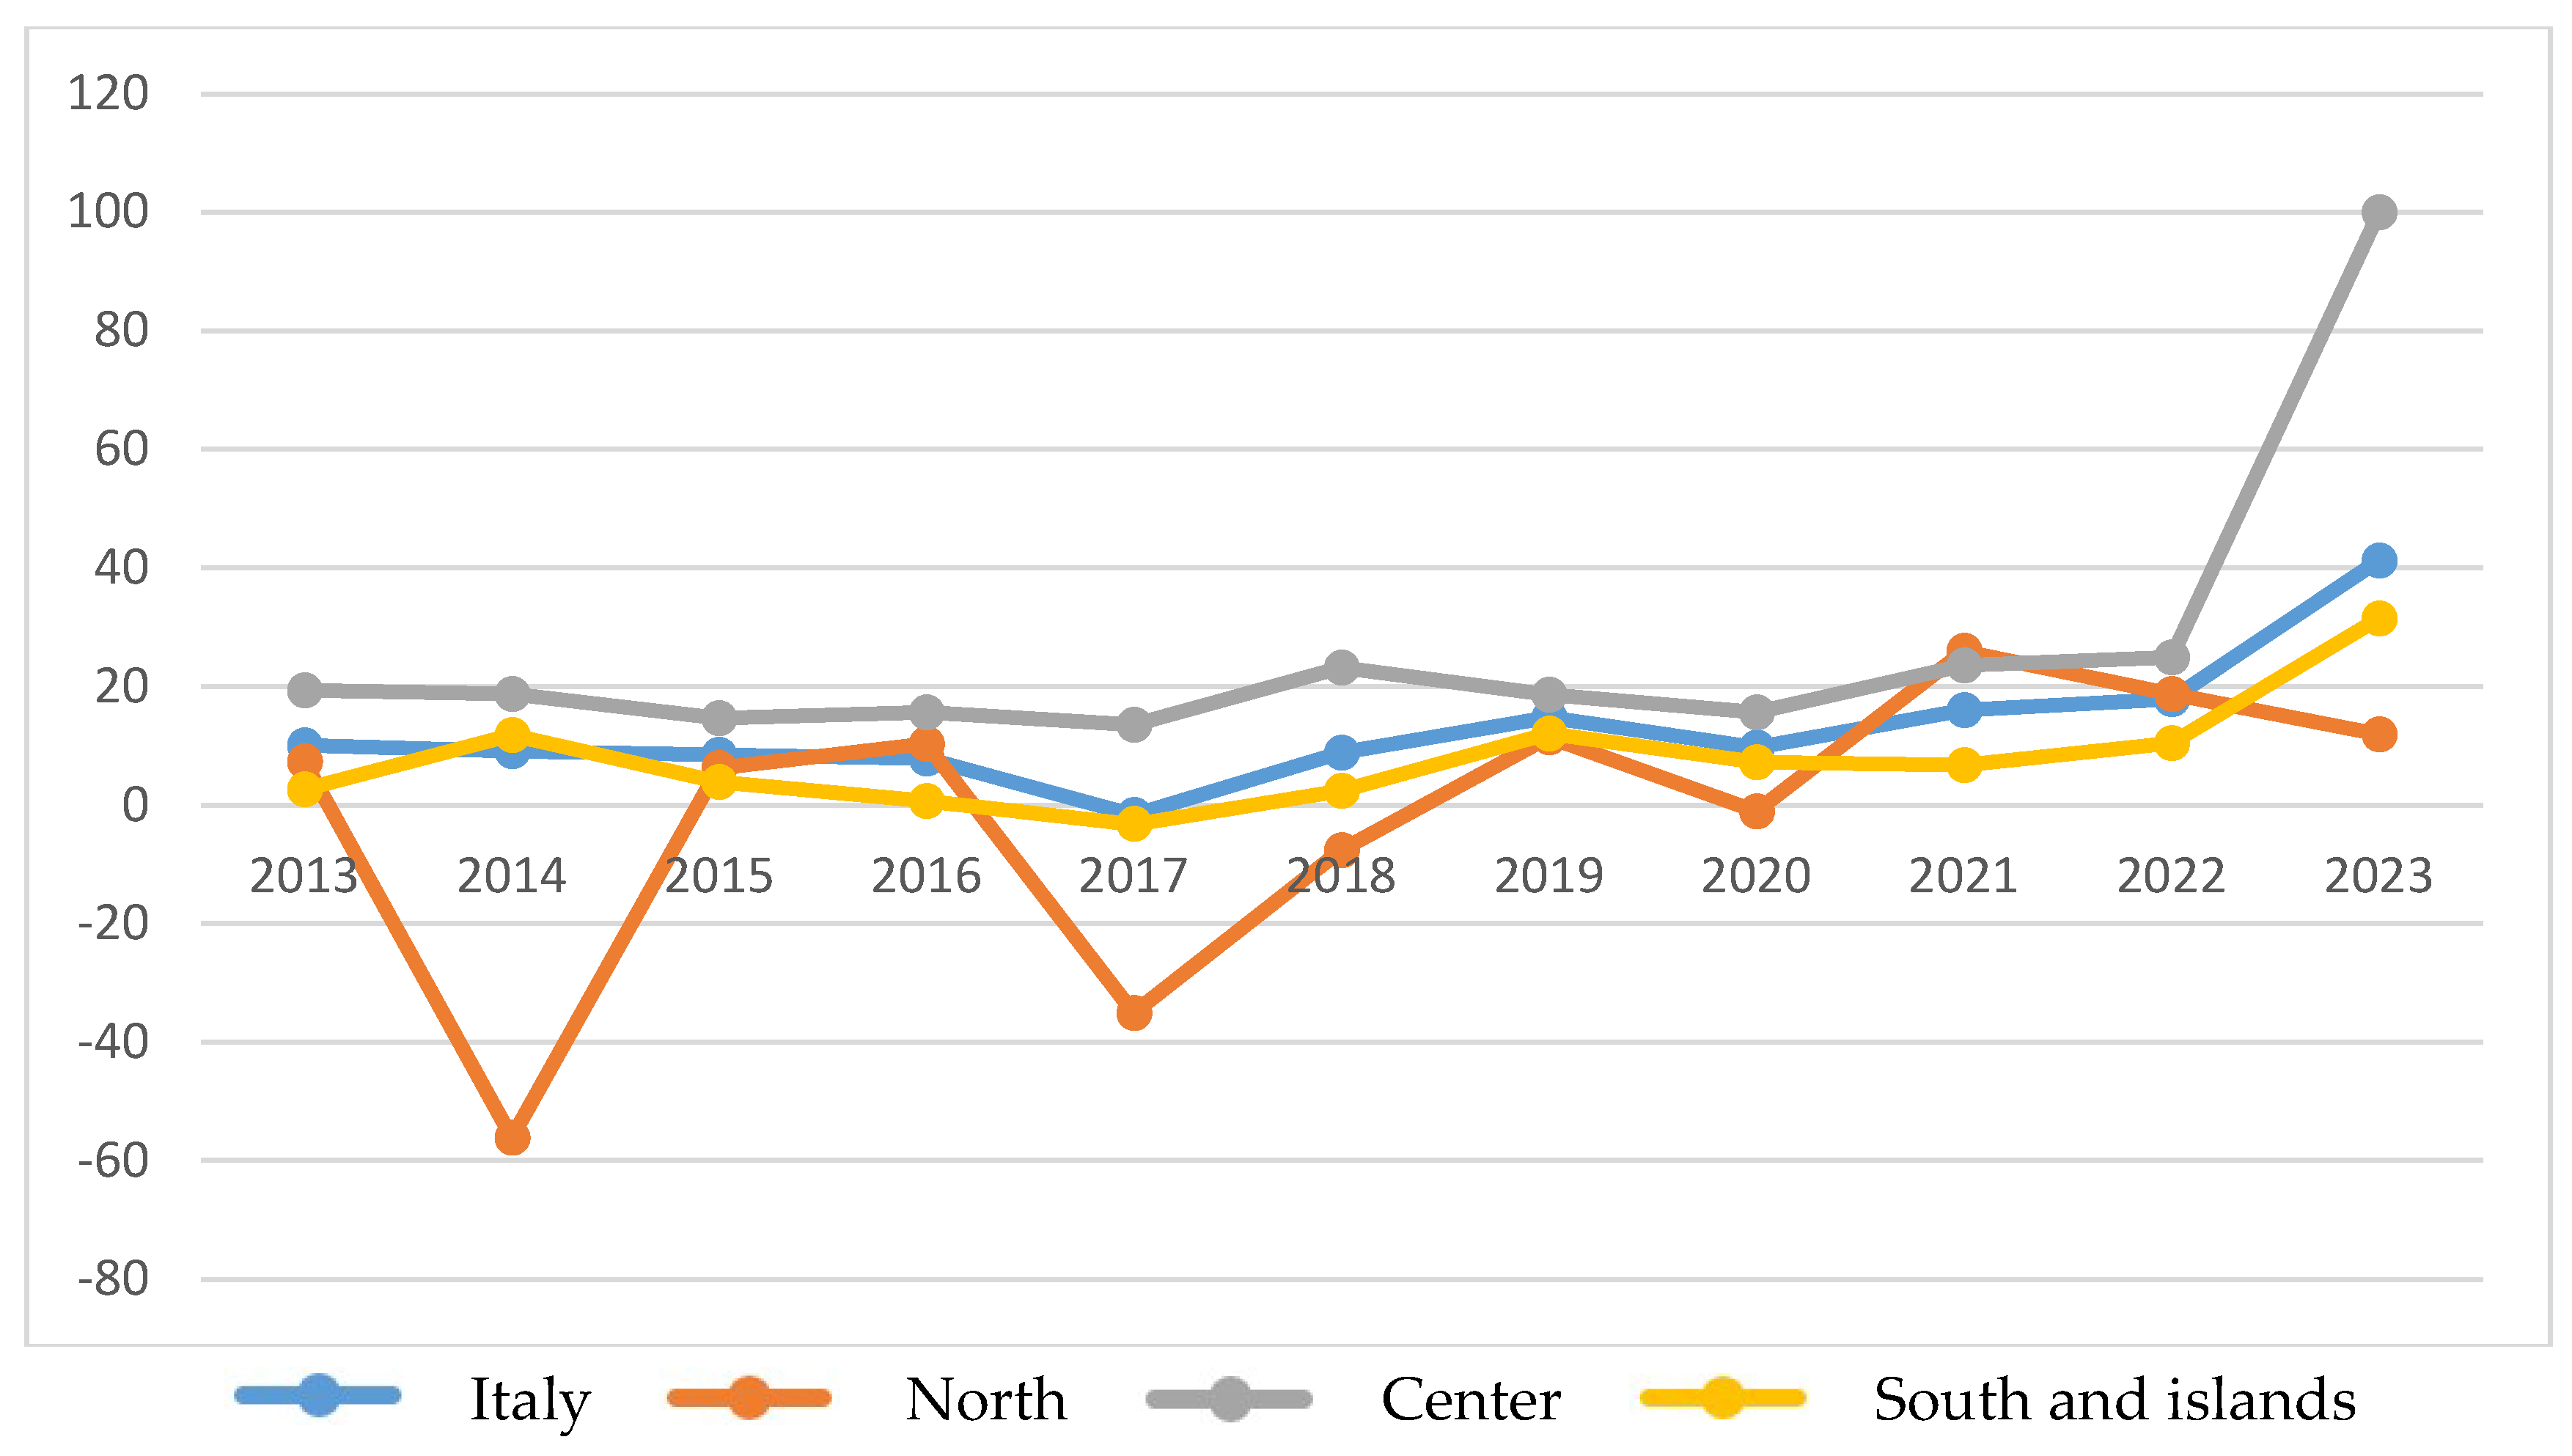
Figure 6.
Profit Margin—Interpolating curves. Source: Our elaboration.
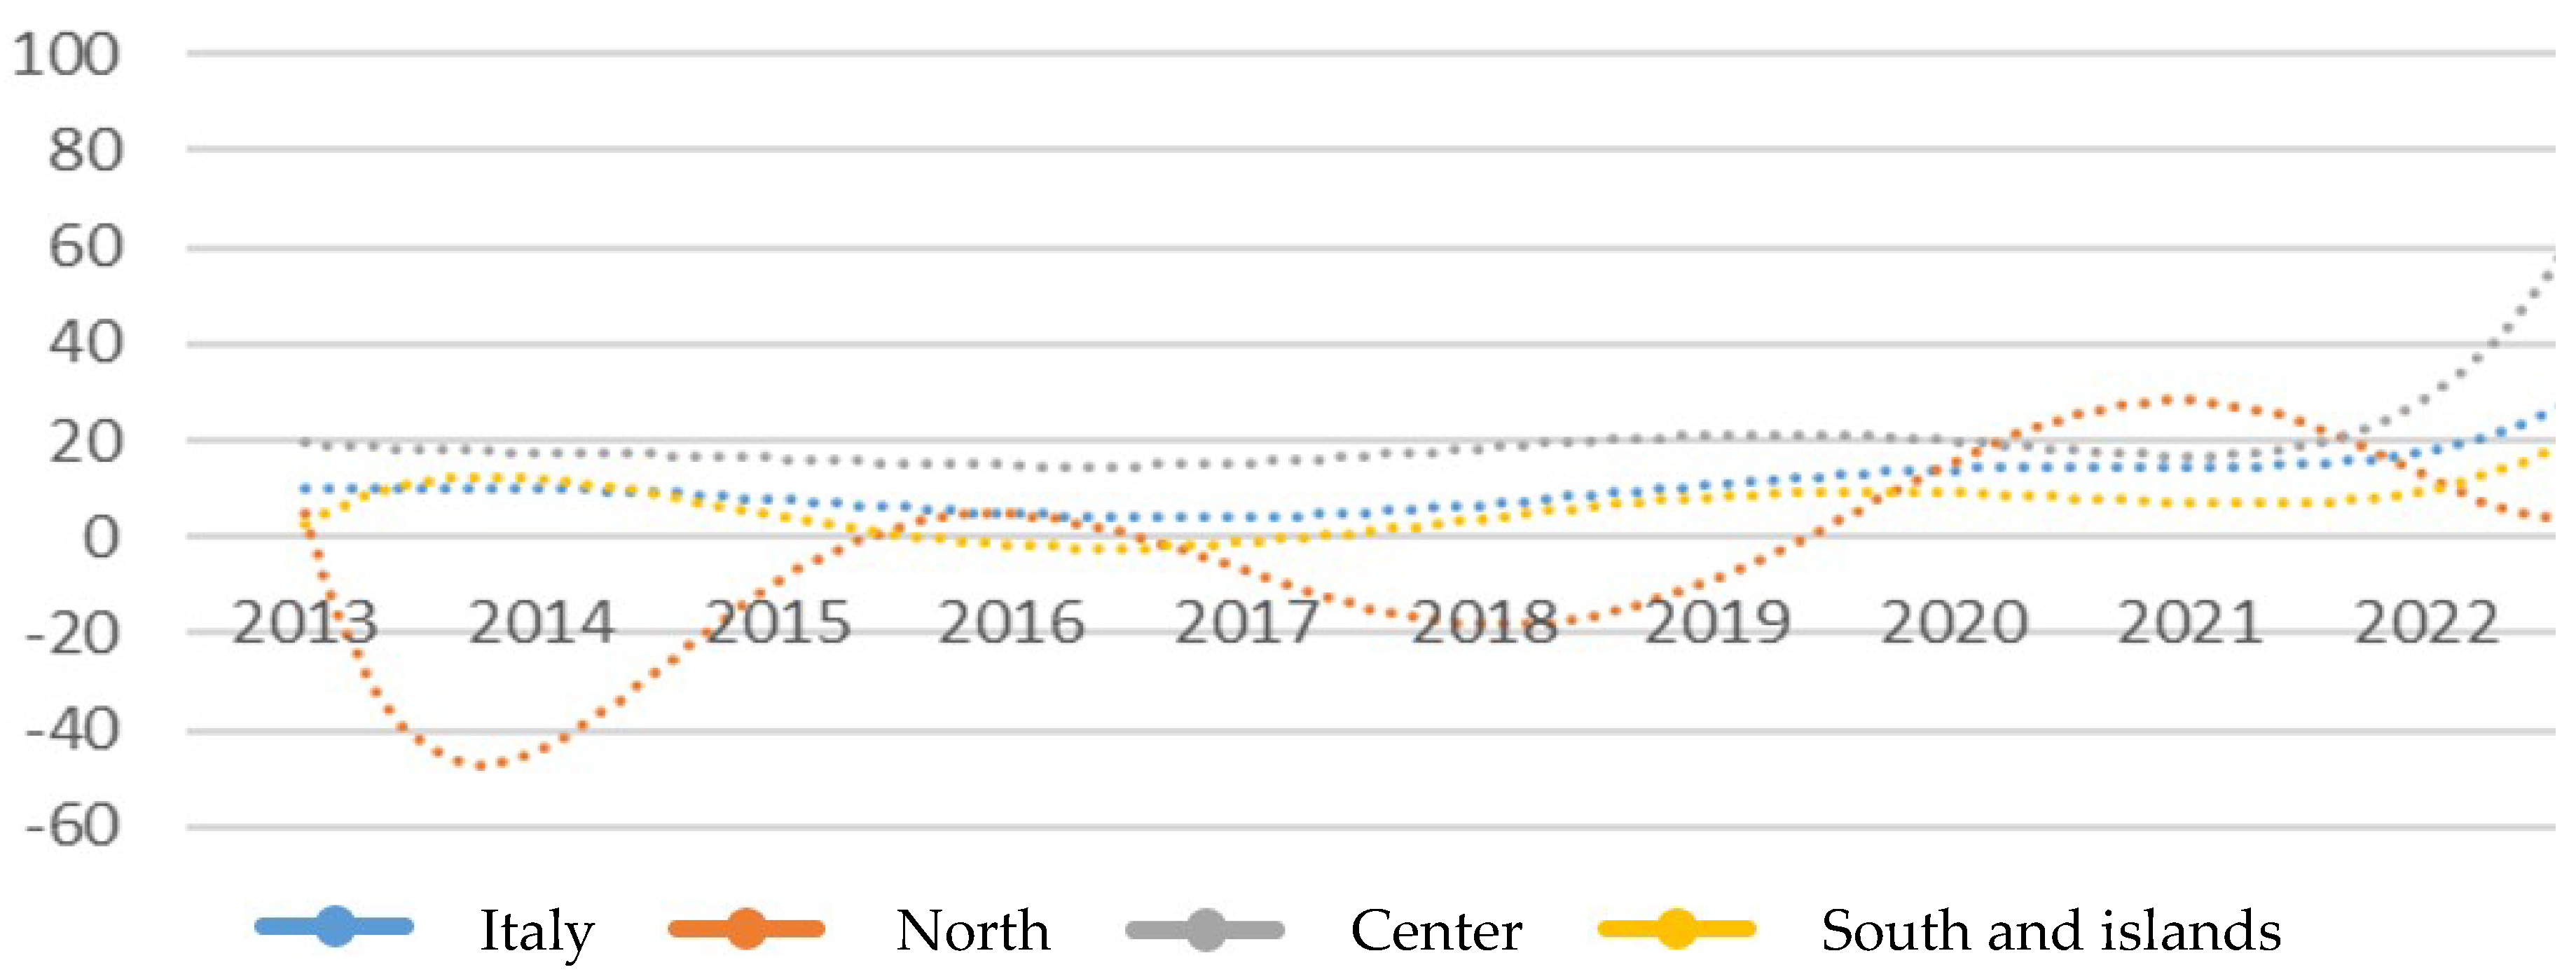
Figure 7.
Tier 1 Ratio—Chart Trend. Source: our elaboration.
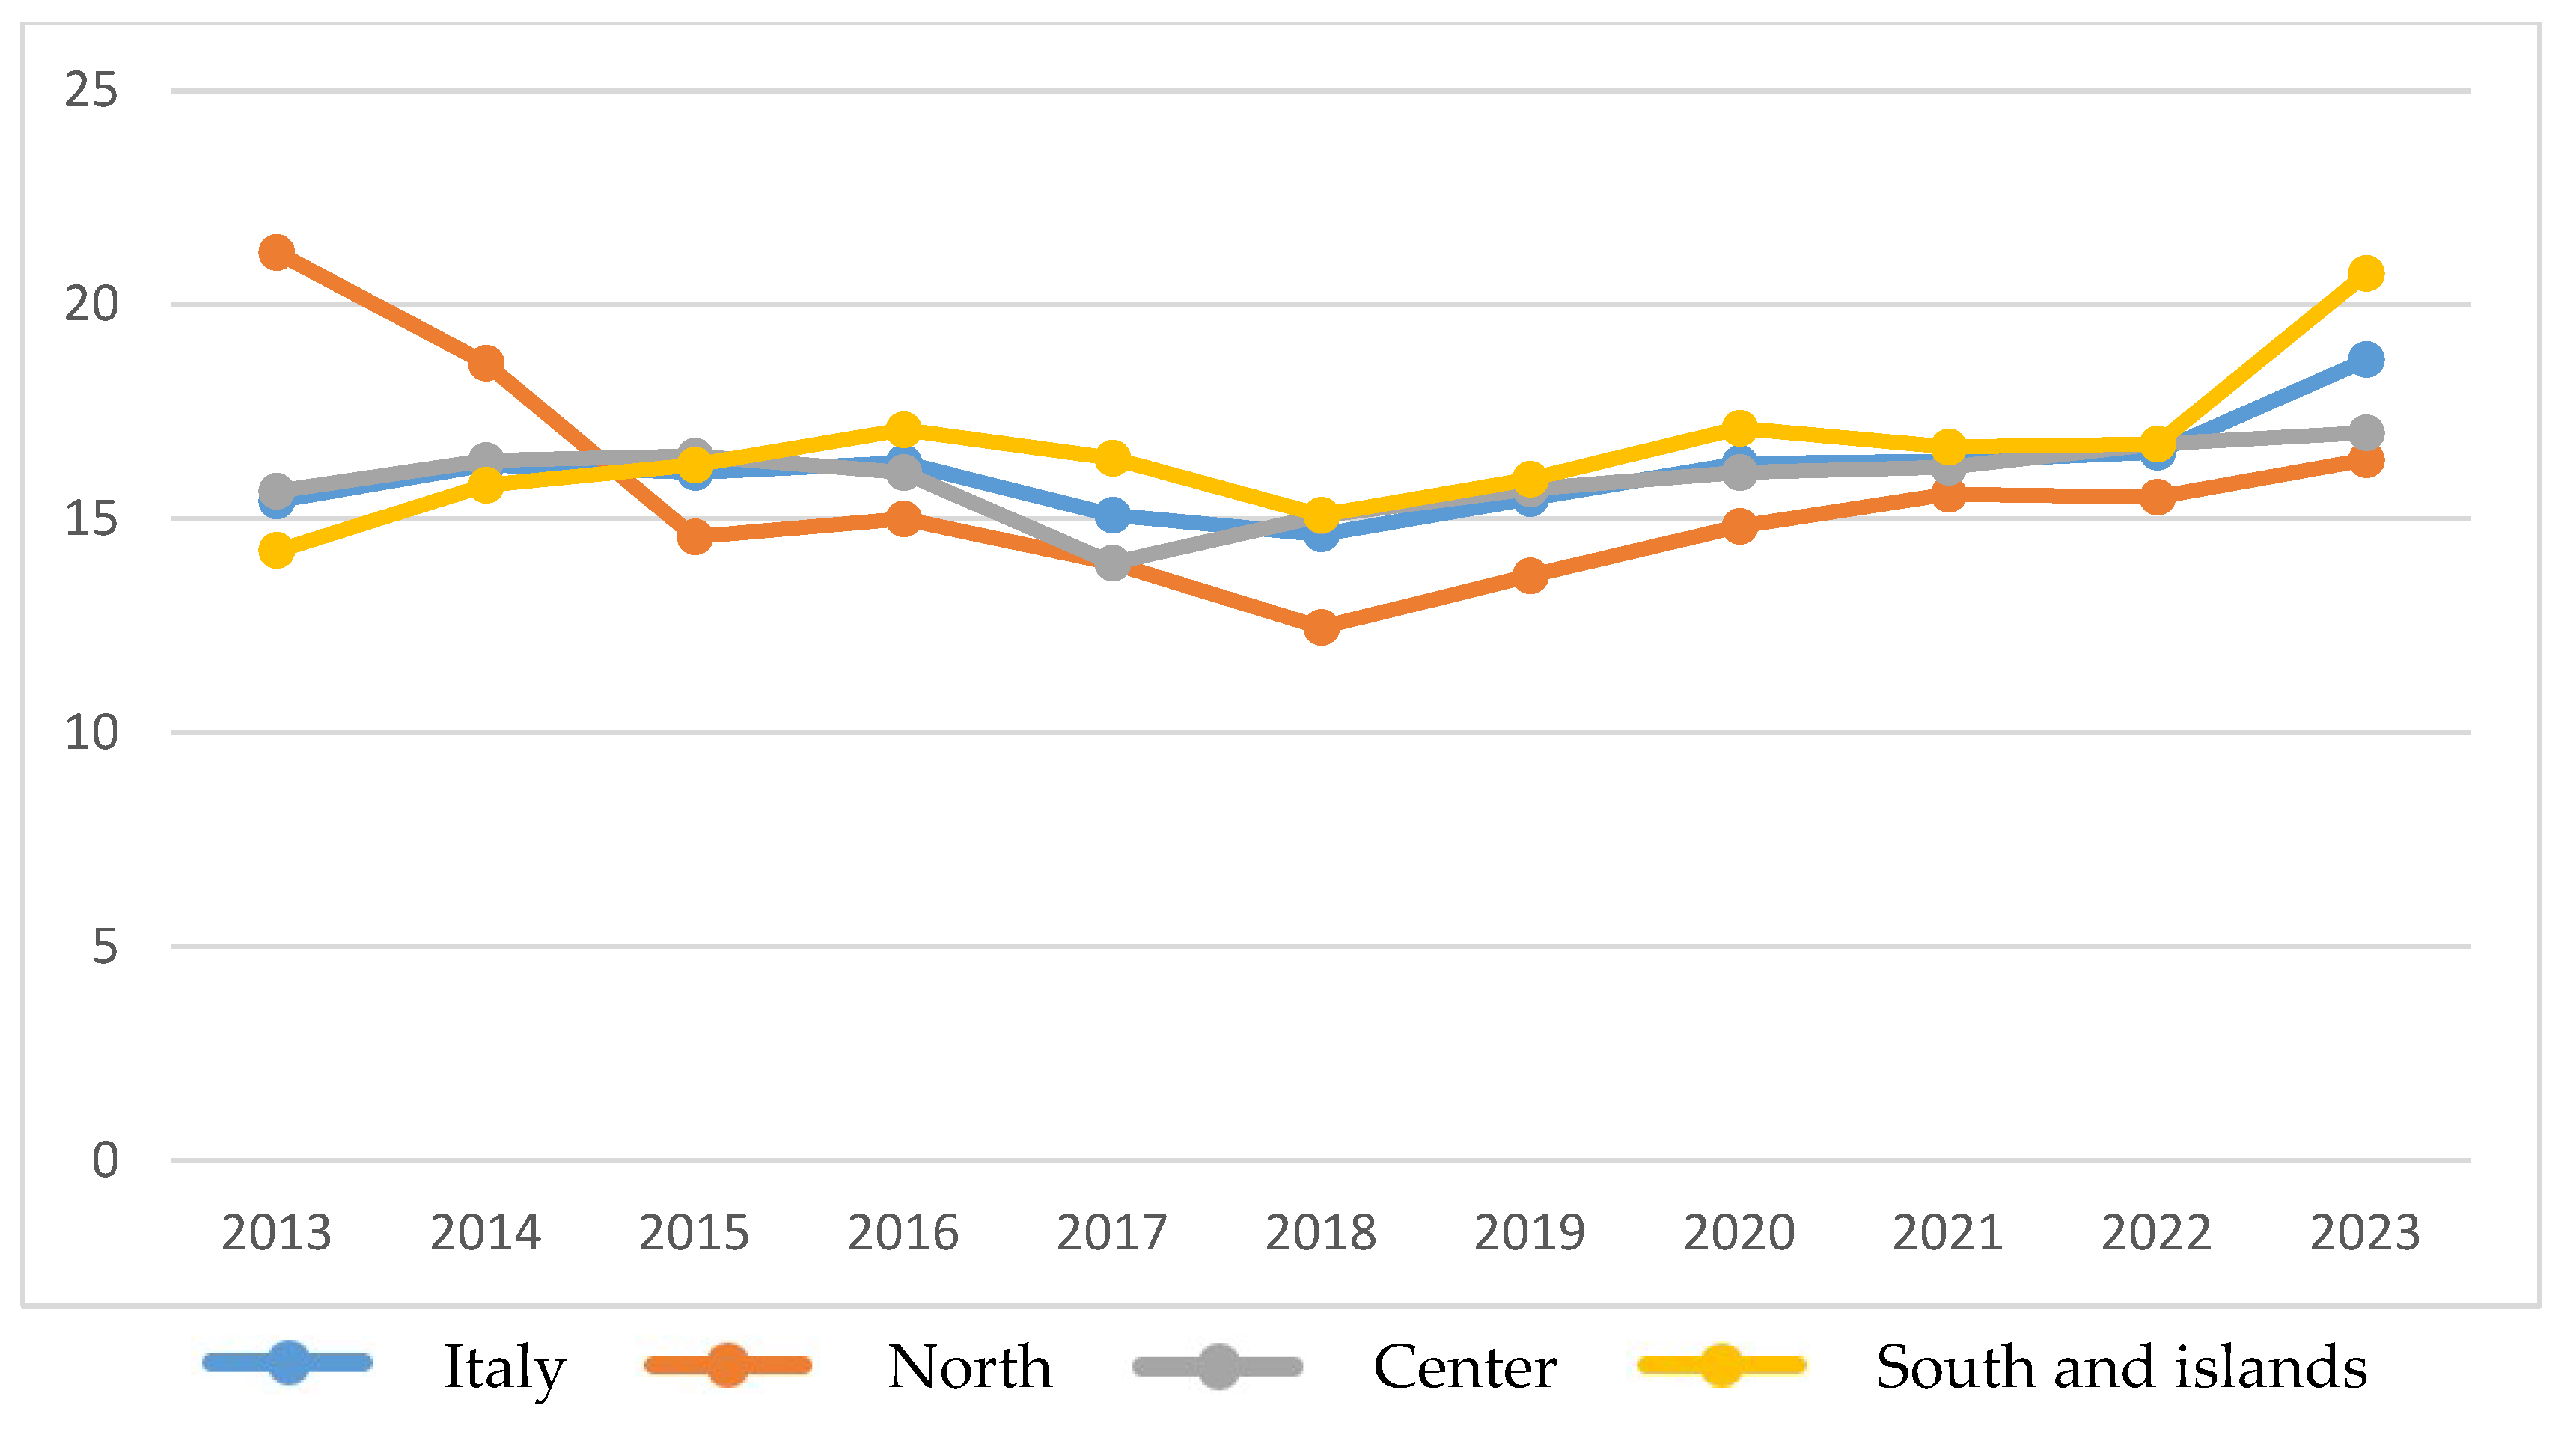
Figure 8.
Tier 1 Ratio—Interpolating curve. Source: Our elaboration.
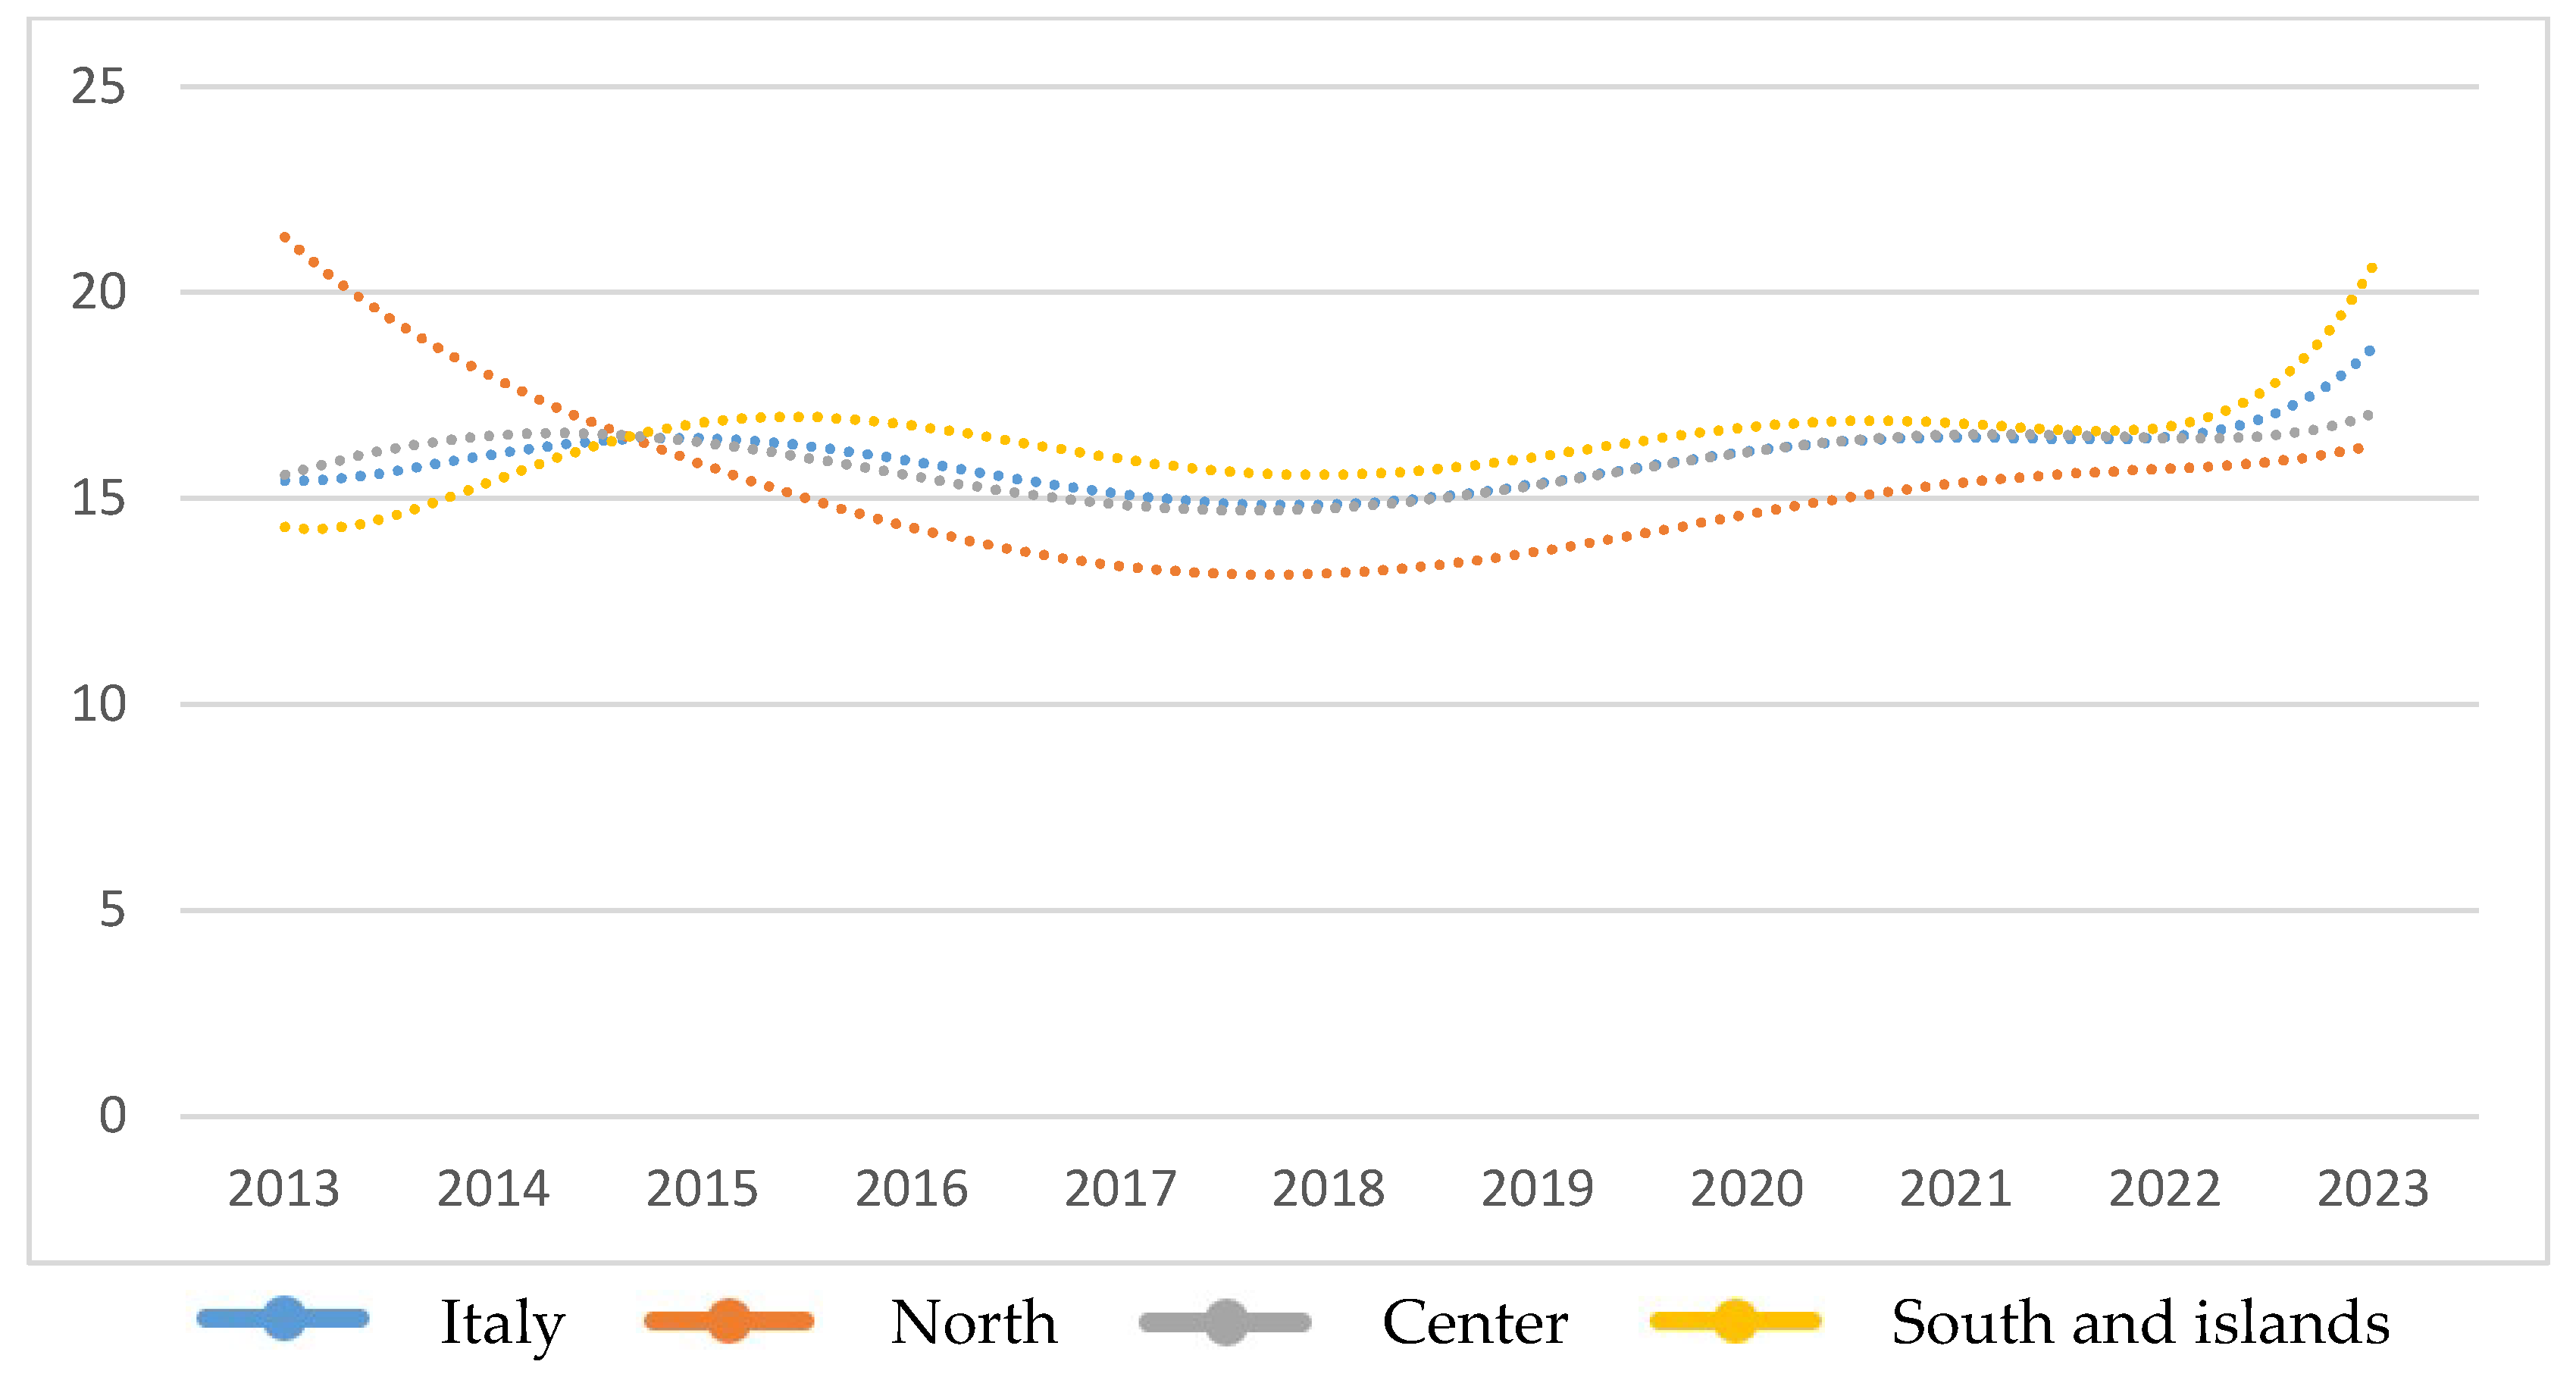

Table 1.
Most cited documents.
| N. | Document | Citations |
|---|---|---|
| 1 | Girardone et al. (2004) | 187 |
| 2 | Altman et al. (2020) | 52 |
| 3 | Barra & Zotti (2020) | 8 |
| 4 | Ambrosio & Coccorese (2015) | 7 |
| 5 | Illia et al. (2021) | 7 |
| 6 | Barra & Ruggiero (2023) | 3 |
| 7 | Sharma & Thakur (2019) | 1 |
| 8 | Ielasi (2012) | 0 |
| 9 | Solari (2020) | 0 |
| Source: Our elaboration on VOSviewer data | ||
Table 2.
Most cited authors.
| Author | Documents | Citations |
|---|---|---|
| Gardener, Edward P.M. | 1 | 187 |
| Girardone, Claudia | ||
| Molyneux, Philip | ||
| Altman, Edward I. | 1 | 52 |
| Esentato, Maurizio | ||
| Sabato, Gabriele | ||
| Barra, Cristian | 2 | 11 |
| Zotti, Roberto | 1 | 8 |
| Ambrosio, Rachele Anna | 1 | 7 |
| Coccorese, Paolo | ||
| Colleoni, Elanor | 1 | 7 |
| Illia, Laura | ||
| Meggiorin, Katia | ||
| Ruggiero, Nazzareno | 1 | 3 |
| Sharma, Neetu | 1 | 1 |
| Thakur, Shivani | ||
| Ielasi, Federica | 1 | 0 |
| Solari, Stefano | 1 | 0 |
| Source: Our elaboration on VOSviewer data | ||
Table 3.
Popular keywords.
| Keyword | Occurrences | Total Link Strength |
|---|---|---|
| Banking | 2 | 11 |
| Financial Services | 2 | 11 |
| Italy | 2 | 11 |
| Accumulate | 1 | 5 |
| Bank Regulation | 1 | 3 |
| Bank-Specific Factors | 1 | 3 |
| Banking Risks | 1 | 3 |
| Basel Iii | 1 | 3 |
| Business Outcomes | 1 | 2 |
| Buying | 1 | 6 |
| Capital Requirements | 1 | 3 |
| Capitalism | 1 | 5 |
| Clearing Houses | 1 | 3 |
| Consumer Evaluation | 1 | 2 |
| Cooperative And Non-Cooperative Banks | 1 | 3 |
| Crease Resistance | 1 | 6 |
| Credit Provision | 1 | 4 |
| Credit Risk | 1 | 3 |
| Degradation | 1 | 5 |
| Economy Of Scale | 1 | 7 |
| Efficiency Measurement | 1 | 7 |
| Eurasia | 1 | 7 |
| Europe | 1 | 7 |
| Exploitation Repression | 1 | 5 |
| Fashion | 1 | 6 |
| Financial Stability | 1 | 3 |
| Financial Unbalances | 1 | 3 |
| Lending Behavior | 1 | 4 |
| Local Banks | 1 | 3 |
| Luigi Luzzatti | 1 | 3 |
| Manufacturer | 1 | 6 |
| Market Efficiency | 1 | 3 |
| Market Power | 1 | 3 |
| Market Structure | 1 | 3 |
| Mini-Bonds | 1 | 3 |
| Modelling Credit Risk For Smes | 1 | 3 |
| Monetary System | 1 | 3 |
| Pillar Ii | 1 | 3 |
| Price | 1 | 6 |
| Revolution | 1 | 5 |
| Sme Finance | 1 | 3 |
| Socialism | 1 | 5 |
| Southern Europe | 1 | 7 |
| Suit | 1 | 6 |
| 1 | 2 | |
| Wool Fabric | 1 | 6 |
| Source: Our elaboration on VOSviewer data | ||
Table 4.
List of banks.
| N. | Name | Location | Macro-region |
|---|---|---|---|
| 1 | Banca popolare etica | Veneto | North |
| 2 | Sanfelice 1893 banca popolare | Emilia-Romagna | North |
| 3 | Banca popolare del frusinate | Latium | Center |
| 4 | Banca popolare di Fondi | Latium | Center |
| 5 | Banca popolare del Cassinate | Latium | Center |
| 6 | Banca popolare di Lajatico | Tuscany | Center |
| 7 | Banca popolare del Lazio | Latium | Center |
| 8 | Banca popolare di Cortona | Tuscany | Center |
| 9 | Banca agricola popolare di Ragusa | Sicily | South and Islands |
| 10 | Banca popolare di Puglia e Basilicata | Apulia | South and Islands |
| 11 | Banca popolare pugliese | Apulia | South and Islands |
| 12 | Banca di credito popolare | Campania | South and Islands |
| 13 | Banca popolare Sant’Angelo | Sicily | South and Islands |
| 14 | Banca popolare delle province molisane | Molise | South and Islands |
| 15 | Popolare Valpadana (in liquidation) | Sicily | South and Islands |
| Source: Our elaboration. | |||
Table 5.
Total Active trend.
| 2013 | 2014 | 2015 | 2016 | 2017 | 2018 | 2019 | 2020 | 2021 | 2022 | 2023 | |
|---|---|---|---|---|---|---|---|---|---|---|---|
| Italy | 2.552.428 | 2.215.432 | 1.994.455 | 2.002.364 | 2.309.128 | 2.170.116 | 2.270.518 | 2.883.830 | 2.921.520 | 2.780.583 | 1.892.419 |
| North | 1.371.068 | 1.658.297 | 2.095.804 | 2.204.134 | 2.386.974 | 3.375.983 | 3.323.417 | ||||
| Center | 1.078.532 | 1.003.372 | 1.028.873 | 1.049.913 | 1.210.828 | 1.181.046 | 1.429.250 | 1.785.473 | 1.732.279 | 1.687.260 | 387.652 |
| South and Islands | 3.780.675 | 3.225.482 | 2.903.004 | 2.853.418 | 3.259.931 | 2.988.671 | 3.092.377 | 3.900.161 | 4.043.779 | 3.838.724 | 2.895.597 |
| Source: our elaboration | |||||||||||
Table 6.
Profit Margin—Descriptive statistics.
| ITALY | |||||||||||
|---|---|---|---|---|---|---|---|---|---|---|---|
| 2013 | 2014 | 2015 | 2016 | 2017 | 2018 | 2019 | 2020 | 2021 | 2022 | 2023 | |
| Average | 10,018 | 9,0374 | 8,4314 | 7,8876 | -1,6478 | 8,8562 | 14,764 | 9,6638 | 15,966 | 17,817 | 41,285 |
| Standard deviation |
13,945 | 22,267 | 18,301 | 14,762 | 30,627 | 20,272 | 9,7391 | 14,365 | 13,404 | 11,998 | 55,549 |
| Sample Variance | 194,45 | 495,82 | 334,92 | 217,91 | 938,03 | 410,96 | 94,85 | 206,35 | 179,66 | 143,95 | 3085,7 |
| Minimum | -12,321 | -56,069 | -40,958 | -28,112 | -83,457 | -30,025 | 1,689 | -22,137 | -7,595 | -1,541 | -21,561 |
| Maximum | 36,278 | 30,034 | 31,001 | 32,399 | 31,679 | 41,763 | 34,279 | 35,399 | 41,892 | 41,961 | 100 |
| Sum | 120,22 | 108,45 | 109,61 | 102,54 | -21,421 | 115,13 | 206,7 | 135,29 | 207,56 | 249,44 | 206,42 |
| Available data | 12 | 12 | 13 | 13 | 13 | 13 | 14 | 14 | 13 | 14 | 5 |
| NORTH | |||||||||||
| 2013 | 2014 | 2015 | 2016 | 2017 | 2018 | 2019 | 2020 | 2021 | 2022 | 2023 | |
| Average | 7,345 | -56,069 | 6,2845 | 10,338 | -35,088 | -7,591 | 11,4 | -1,0445 | 26,013 | 18,761 | 11,944 |
| Standard deviation |
8,0476 | 10,969 | 68,405 | 31,726 | 13,733 | 29,829 | 8,0087 | ||||
| Sample Variance | 64,764 | 120,33 | 4679,2 | 1006,6 | 188,59 | 889,79 | 64,139 | ||||
| Minimum | 7,345 | -56,069 | 0,594 | 2,581 | -83,457 | -30,025 | 1,689 | -22,137 | 26,013 | 13,098 | 11,944 |
| Maximum | 7,345 | -56,069 | 11,975 | 18,094 | 13,282 | 14,843 | 21,11 | 20,048 | 26,013 | 24,424 | 11,944 |
| Sum | 7,345 | -56,069 | 12,569 | 20,675 | -70,175 | -15,182 | 22,799 | -2,089 | 26,013 | 37,522 | 11,944 |
| Available data | 1 | 1 | 2 | 2 | 2 | 2 | 2 | 2 | 1 | 2 | 1 |
| CENTER | |||||||||||
| 2013 | 2014 | 2015 | 2016 | 2017 | 2018 | 2019 | 2020 | 2021 | 2022 | 2023 | |
| Average | 19,395 | 18,773 | 14,701 | 15,605 | 13,583 | 23,19 | 18,568 | 15,661 | 23,554 | 24,896 | (100) |
| Standard deviation |
11,831 | 10,186 | 15,553 | 10,68 | 10,331 | 16,954 | 10,78 | 15,06 | 13,233 | 13,095 | |
| Sample Variance | 139,96 | 103,74 | 241,9 | 114,07 | 106,74 | 287,42 | 116,21 | 226,79 | 175,1 | 171,47 | |
| Minimum | 7,497 | 10,901 | -8,519 | 5,749 | 7,068 | 8,581 | 5,104 | 0,111 | 8,752 | 5,577 | (100) |
| Maximum | 36,278 | 30,034 | 31,001 | 32,399 | 31,679 | 41,763 | 34,279 | 35,399 | 41,892 | 41,961 | (100) |
| Sum | 96,974 | 93,863 | 73,503 | 78,024 | 67,914 | 115,95 | 111,41 | 93,967 | 141,33 | 149,37 | (100) |
| Available data | 5 | 5 | 5 | 5 | 5 | 5 | 6 | 6 | 6 | 6 | 1 |
| SOUTH AND ISLANDS | |||||||||||
| 2013 | 2014 | 2015 | 2016 | 2017 | 2018 | 2019 | 2020 | 2021 | 2022 | 2023 | |
| Average | 2,6495 | 11,776 | 3,9227 | 0,64 | -3,1933 | 2,394 | 12,082 | 7,2358 | 6,7027 | 10,423 | 31,493 |
| Standard deviation |
12,701 | 7,5014 | 23,06 | 16,813 | 23,408 | 13,831 | 7,8844 | 5,971 | 7,989 | 7,992 | 62,236 |
| Sample Variance | 161,32 | 56,271 | 531,78 | 282,67 | 547,92 | 191,29 | 62,164 | 35,653 | 63,824 | 63,872 | 3873,4 |
| Minimum | -12,321 | 0,208 | -40,958 | -28,112 | -34,389 | -17,301 | 7,283 | 0,197 | -7,595 | -1,541 | -21,561 |
| Maximum | 15,007 | 20,399 | 21,654 | 23,607 | 23,414 | 22,948 | 27,437 | 17,518 | 15,522 | 19,833 | 100 |
| Sum | 15,897 | 70,655 | 23,536 | 3,84 | -19,16 | 14,364 | 72,493 | 43,415 | 40,216 | 62,539 | 94,479 |
| Available data | 6 | 6 | 6 | 6 | 6 | 6 | 6 | 6 | 6 | 6 | 3 |
| Source: Our elaboration | |||||||||||
Table 7.
Profit Margin—Interpolating equations.
| Group | Equation | R² |
|---|---|---|
| Italy | y = 0,0025x6 − 0,0736x5 + 0,7795x4 − 3,5347x3 + 6,2415x2 − 3,1922x + 9,5281 | 0,93 |
| North | y=0,005x6 − 0,1466x5 + 1,6236x4 − 8,6253x3 + 23,246x2 − 31,59x + 35,166 | 0,98 |
| Center | y = 0,0322x6 − 1,209x5 + 17,675x4 − 126,63x3 + 458,59x2 − 767,75x + 424 | 0,66 |
| South and Islands | y = -0,0013x6 + 0,077x5 − 1,5214x4 + 13,754x3 − 59,522x2 + 112,25x − 62,48 | 0,96 |
| Source: our elaboration. | ||
Table 8.
Profit Margin—ANOVA test.
| Groups | Count | Sum | Average | Variance | ||
|---|---|---|---|---|---|---|
| North | 11 | -7,707 | -0,7006364 | 592,9803597 | ||
| Center | 10 | 187,926 | 18,7926 | 15,94689982 | ||
| South | 11 | 86,1254 | 7,82958182 | 84,67994274 | ||
| ANALYSIS OF VARIANCE | ||||||
| Origin of the variation | SQ | dof | MQ | F | Significance value | F crit |
| Between groups | 1994,489461 | 2 | 997,244731 | 4,179129232 | 0,025419379 | 3,33 |
| In groups | 6920,125123 | 29 | 238,625004 | |||
| Total | 8914,614584 | 31 | ||||
| Source: Our elaboration | ||||||
Table 9.
Profit Margin—Tukey-Kramer test.
| Average North | -0,700636364 |
| Variance Nord | 592,9803597 |
| n Nord | 11 |
| Average Center | 18,7926 |
| Variance Center | 15,94689982 |
| n Center | 10 |
| Average South and Islands | 7,829581818 |
| Variance South and Islands | 84,67994274 |
| n South and Islands | 11 |
| N (total number) | 32 |
| Smallest group size | 10 |
| Number of groups | 3 |
| Pooled variance (common) | 238,6250042 |
| Degrees of Freedom | 29 |
| Q | 3,49 |
| Comparison North and Center | |
| Average difference North and Center | 19,49323636 |
| Critical value | 17,04839117 |
| Significant difference | |
| Comparison North and South and Islands | |
| Average difference North and South and Islands | 8,530218182 |
| Critical value | 16,25500319 |
| Difference NOT significant | |
| Comparison Center and South and Islands | |
| Average difference Center and South and Islands | 10,96301818 |
| Critical value | 16,25500319 |
| Difference NOT significant | |
| Source: Our elaboration | |
Table 10.
Tier 1 Ratio—Descriptive statistics.
| ITALY | |||||||||||
|---|---|---|---|---|---|---|---|---|---|---|---|
| 2013 | 2014 | 2015 | 2016 | 2017 | 2018 | 2019 | 2020 | 2021 | 2022 | 2023 | |
| Average | 15,41 | 16,253 | 16,071 | 16,309 | 15,073 | 14,635 | 15,463 | 16,28 | 16,339 | 16,556 | 18,708 |
| Standard deviation |
4,9551 | 4,0906 | 3,6264 | 3,4814 | 4,0515 | 3,3437 | 2,8313 | 2,9223 | 3,1019 | 2,5097 | 2,4988 |
| Sample Variance | 24,553 | 16,733 | 13,151 | 12,12 | 16,415 | 11,18 | 8,0163 | 8,54 | 9,622 | 6,2986 | 6,244 |
| Minimum | 7,32 | 10,82 | 11,18 | 12,27 | 8,01 | 11,11 | 11,33 | 13,4 | 12,9 | 14,3 | 16,38 |
| Maximum | 23,82 | 22,95 | 24,303 | 24,85 | 24,7 | 21,38 | 21,86 | 24,02 | 24,35 | 22,01 | 21,8 |
| Sum | 184,92 | 195,04 | 208,92 | 195,71 | 165,81 | 175,62 | 201,02 | 211,64 | 196,07 | 215,22 | 74,83 |
| Available data | 12 | 12 | 13 | 12 | 11 | 12 | 13 | 13 | 12 | 13 | 4 |
| NORTH | |||||||||||
| 2013 | 2014 | 2015 | 2016 | 2017 | 2018 | 2019 | 2020 | 2021 | 2022 | 2023 | |
| Average | 21,22 | 18,63 | 14,58 | 14,99 | 13,96 | 12,46 | 13,656 | 14,815 | 15,56 | 15,505 | 16,38 |
| Standard deviation |
3,6628 | 3,8467 | 0,6505 | 0,4179 | 0,0778 | 0,1202 | |||||
| Sample Variance | 13,416 | 14,797 | 0,4232 | 0,1746 | 0,006 | 0,0145 | |||||
| Minimum | 21,22 | 18,63 | 11,99 | 12,27 | 13,96 | 12 | 13,36 | 14,76 | 15,56 | 15,42 | 16,38 |
| Maximum | 21,22 | 18,63 | 17,17 | 17,71 | 13,96 | 12,92 | 13,951 | 14,87 | 15,56 | 15,59 | 16,38 |
| Sum | 21,22 | 18,63 | 29,16 | 29,98 | 13,96 | 24,92 | 27,311 | 29,63 | 15,56 | 31,01 | 16,38 |
| Available data | 1 | 1 | 2 | 2 | 1 | 2 | 2 | 2 | 1 | 2 | 1 |
| CENTER | |||||||||||
| 2013 | 2014 | 2015 | 2016 | 2017 | 2018 | 2019 | 2020 | 2021 | 2022 | 2023 | |
| Average | 15,636 | 16,354 | 16,454 | 16,083 | 13,965 | 15,055 | 15,684 | 16,075 | 16,2 | 16,746 | 17,01 |
| Standard deviation |
3,1187 | 2,5696 | 2,2804 | 1,9502 | 3,5114 | 3,6454 | 1,9453 | 1,9397 | 2,1515 | 2,7466 | #DIV/0! |
| Sample Variance | 9,7264 | 6,6027 | 5,2002 | 3,8034 | 12,33 | 13,289 | 3,7842 | 3,7625 | 4,6291 | 7,544 | #DIV/0! |
| Minimum | 12,82 | 14,03 | 13,97 | 13,39 | 8,01 | 12,57 | 13,71 | 14,22 | 13,52 | 14,3 | 17,01 |
| Maximum | 19,67 | 19,14 | 18,89 | 18,36 | 17,105 | 21,38 | 18,53 | 19,34 | 19,79 | 22,01 | 17,01 |
| Sum | 78,18 | 81,77 | 82,27 | 80,413 | 69,825 | 75,275 | 94,101 | 96,451 | 97,202 | 100,47 | 17,01 |
| Available data | 5 | 5 | 5 | 5 | 5 | 5 | 6 | 6 | 6 | 6 | 1 |
| SOUTH AND ISLANDS | |||||||||||
| 2013 | 2014 | 2015 | 2016 | 2017 | 2018 | 2019 | 2020 | 2021 | 2022 | 2023 | |
| Average | 14,253 | 15,773 | 16,249 | 17,064 | 16,404 | 15,085 | 15,922 | 17,112 | 16,662 | 16,748 | 20,72 |
| Standard deviation |
6,1504 | 5,4876 | 4,8626 | 4,9174 | 4,9648 | 3,8094 | 4,1599 | 4,349 | 4,5126 | 2,9681 | 1,5274 |
| Sample Variance | 37,828 | 30,113 | 23,645 | 24,18 | 24,649 | 14,512 | 17,305 | 18,914 | 20,363 | 8,8099 | 2,3328 |
| Minimum | 7,32 | 10,82 | 11,18 | 12,78 | 12,56 | 11,11 | 11,33 | 13,4 | 12,9 | 14,4 | 19,64 |
| Maximum | 23,82 | 22,95 | 24,303 | 24,85 | 24,7 | 20,326 | 21,86 | 24,02 | 24,35 | 21,22 | 21,8 |
| Sum | 85,52 | 94,64 | 97,493 | 85,32 | 82,02 | 75,426 | 79,61 | 85,56 | 83,31 | 83,74 | 41,44 |
| Available data | 6 | 6 | 6 | 5 | 5 | 5 | 5 | 5 | 5 | 5 | 2 |
| Source: Our elaboration | |||||||||||
Table 11.
Tier 1 Ratio—Interpolating equations.
| Group | Equation | R² |
|---|---|---|
| Italy | y = 0,0008x6 − 0,0274x5 + 0,3558x4 − 2,1714x3 + 6,2291x2 − 7,383x + 18,435 | 0,96 |
| North | y = 0,0003x6 − 0,0124x5 + 0,1678x4 − 1,1179x3 + 4,1742x2 − 10,265x + 28,407 | 0,94 |
| Center | y = 0,0004x6 − 0,0126x5 + 0,1462x4 − 0,7036x3 + 1,025x2 + 0,9672x + 14,166 | 0,79 |
| South and Islands | y = 0,0013x6 − 0,0444x5 + 0,5903x4 − 3,7643x3 + 11,578x2 − 14,822x + 20,778 | 0,96 |
| Source: our elaboration | ||
Table 12.
Tier 1 Ratio—ANOVA Test.
| Groups | Count | Sum | Average | Variance | ||
|---|---|---|---|---|---|---|
| North | 11 | 171,756 | 15,6141818 | 5,973917364 | ||
| Center | 11 | 175,262 | 15,9329091 | 0,717765091 | ||
| South | 11 | 181,992 | 16,5447273 | 2,655284618 | ||
| ANALYSIS OF VARIANCE | ||||||
| Origin of the variation | SQ | dof | MQ | F | Significance value | F crit |
| Between groups | 4,920019152 | 2 | 2,46000958 | 0,789564002 | 0,463251481 | 3,32 |
| In groups | 93,46967073 | 30 | 3,11565569 | |||
| Total | 98,38968988 | 32 | ||||
| Source: our elaboration | ||||||
Table 13.
Tier 1 ratio—Tukey-Kramer test.
| Average North | 15,61418182 |
| Variance Nord | 5,973917364 |
| n Nord | 11 |
| Average Center | 15,93290909 |
| Variance Center | 0,717765091 |
| n Center | 11 |
| Average South and Islands | 16,54472727 |
| Variance South and Islands | 2,655284618 |
| n South and Islands | 11 |
| N (total number) | 33 |
| Smallest group size | 11 |
| Number of groups | 3 |
| Pooled variance (common) | 3,115655691 |
| Degrees of Freedom | 30 |
| Q | 3,49 |
| Comparison North and Center | |
| The average difference between North and Center | 0,318727273 |
| Critical value | 1,857393038 |
| Difference NOT significant | |
| Comparison of North and South and Islands | |
| The average difference between North and South and Islands | 0,930545455 |
| Critical value | 1,857393038 |
| Difference NOT significant | |
| Comparison Centre and South and Islands | |
| The average difference between the Center and South and Islands | 0,611818182 |
| Critical value | 1,857393038 |
| Difference NOT significant | |
| Source: our elaboration | |
Table 14.
Publications related to the “Performance” project.
| Indications temporarily omitted to avoid identification of the authors |
| Source: our elaboration |
Disclaimer/Publisher’s Note: The statements, opinions and data contained in all publications are solely those of the individual author(s) and contributor(s) and not of MDPI and/or the editor(s). MDPI and/or the editor(s) disclaim responsibility for any injury to people or property resulting from any ideas, methods, instructions or products referred to in the content. |
© 2025 by the authors. Licensee MDPI, Basel, Switzerland. This article is an open access article distributed under the terms and conditions of the Creative Commons Attribution (CC BY) license (http://creativecommons.org/licenses/by/4.0/).
Copyright: This open access article is published under a Creative Commons CC BY 4.0 license, which permit the free download, distribution, and reuse, provided that the author and preprint are cited in any reuse.


