
Submitted:
19 February 2026
Posted:
25 February 2026
You are already at the latest version
Abstract
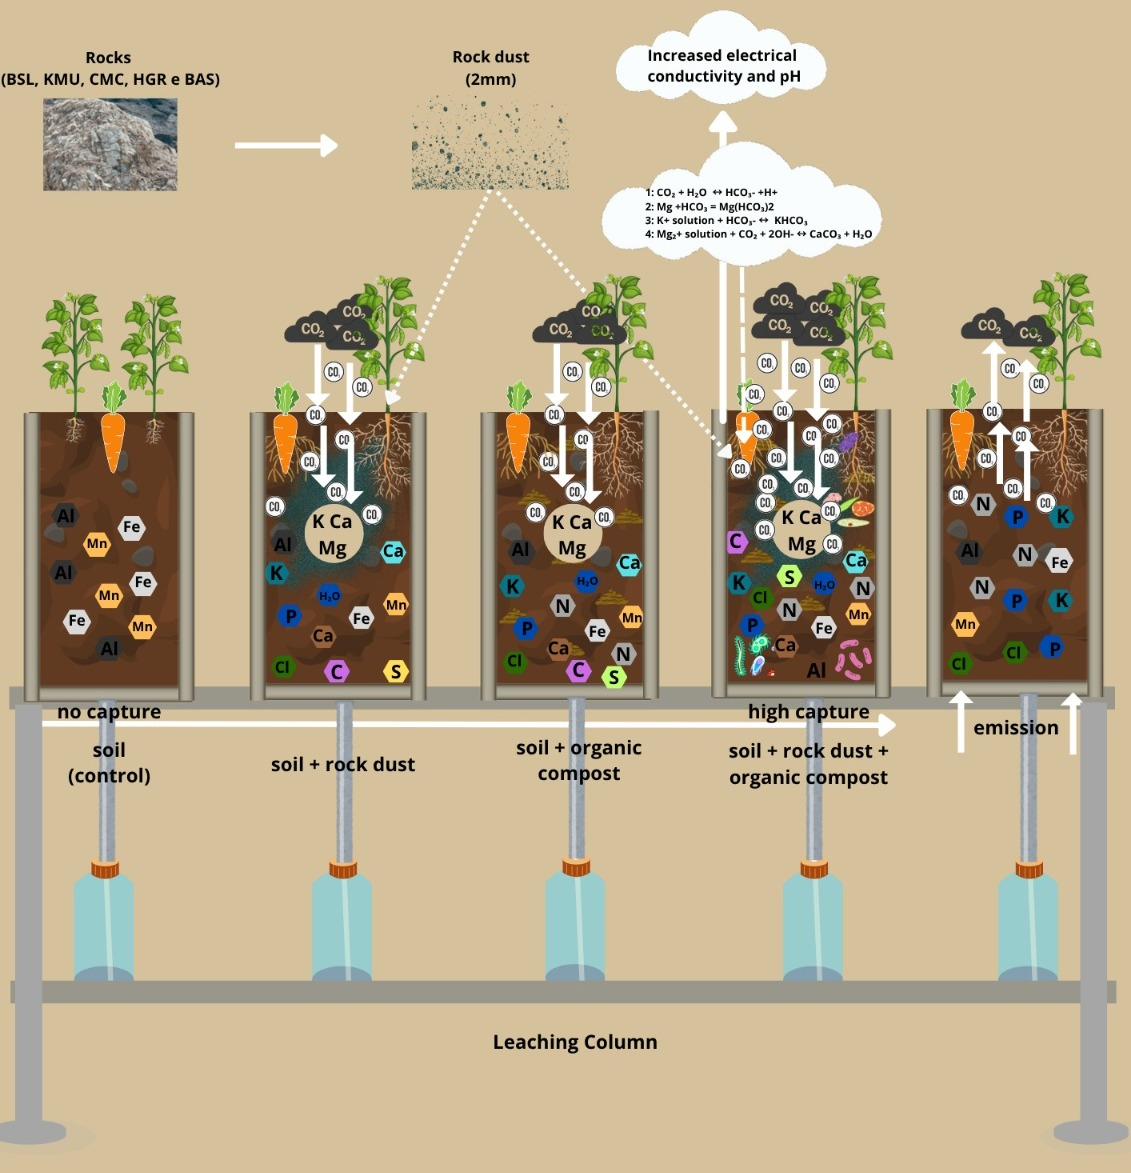
Addressing climate change and food security, this article evaluates ground silicate rocks (remineralizers) as tools for atmospheric CO2 capture and food and nutrition security. The experiments were conducted under controlled conditions using leaching columns (to quantify the leached carbon) and pots (to evaluate the growth and nutrition of three agricultural crops). Five rock types (basalt, kamafugite, chlorite-muscovite calc-schist, hydrothermalized calc-silicate, and biotite-actinolite schist) were applied to a Red Oxisol (S) at 20 t ha⁻¹, with and without organic matter (OM) at 40 t ha⁻¹. The study involved 84 experimental units, including S, S+R, S+OM, S+R+OM, and S, S+OM and NPK controls. Results showed that rock-OM mixtures significantly improved soil pH and electrical conductivity, enhancing the growth and nutritional content of three agricultural crops (beans, arugula, and carrots) compared to controls. Nutrient dynamics varied across leached liquids and in the soils of the columns and pots. While OM increased leached carbon, the direct influence of silicate rocks on CO2 capture was more pronounced in S+R treatments. The findings underscore the vital role of local, innovative strategies in providing sustainable solutions to global challenges.
Keywords:
crushed silicate rocks
; remineralizer
; soil health
; organic material
; nutritional content
; CO2 capture
1. Introduction
The earth is restless. Forest fires, floods affecting large cities, and widespread heat waves are just some of the signs of a planet undergoing rapid change, which is considered a climate emergency [1]. Finding answers to mitigate problems is as important as implementing solutions [2]. There are many issues pertaining to this crisis; however, there are two we consider to be priorities: ensuring the food and nutrition security of the population and mitigating and reducing the gases that cause climate change.
To a large extent, these two issues are connected and require a thorough restructuring of food production systems and land use management [3]. However, this has been challenging [4], in part because the most realistic alternatives involve changes to the model of infinite economic growth, and especially because countries tend to only make impactful significant changes if these changes are implemented on a global scale. The relationship between agriculture and climate change is a complex and challenging one [5] and there is no magic solution.
According to the authors mentioned above, a large part of the discussions on GHGs focus on CO2 emissions, relegating other equally or more harmful gases such as CH4 and N2O to lesser relevance. Both are associated with food production activities, especially the use of chemical fertilizers with NPK formulations with greater solubility, which are used to ensure high productivity. It is important to point out that these inputs are expensive, their trade is under the control of only a few countries [6], and their nutritional supply is restricted as, unlike remineralizers, they do not include beneficial elements such as Li, V, Co, Se, Mo, and others macronutrients as Ca and Mg [7].
The widespread reliance on soluble fertilizers has led to the nutritional erosion of foods, with studies showing dramatic reductions in mineral content over decades [8]. Research in the Brazilian Cerrado confirms that crops such as quinoa have a higher concentration of nutrients when fertilized with ground rocks, or remineralizer (REM) as compared to NPK fertilizers, reinforcing the importance of multinutrient sources for soil health [7].
A transition to sustainable agricultural systems is increasingly recognized as essential to meet current and future challenges. These systems maintain productivity and crop diversity using low-emission inputs [9] and conservationist practices that restore soil health [10]. This approach enhances soil carbon capture [11] thereby reducing the CO2 footprint of agriculture.
Brazil has been seeking solutions to change this reality by adopting innovative technological approaches such as using remineralizers, which demonstrate the transformative potential of agriculture, making it more resilient, sustainable and less dependent on external inputs [12]. REM are derived from ground silicate rocks which are rich in macro and micronutrients and are based on stonemeal technology, a technique that consists of applying rocks dust to the soil [13]. More than 20 years of research [14] has shown that this technology is an effective tool to guarantee productivity and provide direct and indirect benefits to agroecosystems, such as increasing pH, CEC, soil water retention and nutrient availability, and reducing aluminum toxicity [12,15].
Additionally, they provide nutritional diversification [16] and reduce production costs [17]. These inputs also provide a multinutrient supply for plants that is made available gradually and for a prolonged period of time (residual effect) [18]. This reduces dependence on external inputs and significantly increases the potential to use local mineral resources, thus reducing costs and strengthening regional mining and agricultural production chains [19].
Furthermore, in terms of the more indirect effects, a number of studies highlight the large potential REM has to capture and store CO2 in the soil. This process is known as Enhanced Rock Weathering (ERW) and was coined by [11,20,21,22,23]. This mechanism results from the weathering-induced leaching of mineral constituents from rocks. Despite the significant potential of these inputs, their frequent use - particularly of ultramafic rocks - requires systematic investigation into the potential accumulation of toxic elements like chromium and nickel in soils [24]. To mitigate this risk, [25] propose leveraging natural organic and inorganic processes within agricultural systems for CO2 removal.
Our research is in line with this strategy, which involves local solutions that use regionally available resources. Thus, this article was structured around two main objectives: (i) Generate experimental data on ERW to parameterize and calibrate predictive quantitative models induced by different remineralizers (REM), and (ii) to demonstrate the effectiveness of five different types of crushed rocks (REM), mixed or unmixed, with organic matter as a tool to increase soil fertility (soil health) and ensure the production of agricultural crops with better nutritional quality.
2. Methodology
There were two groups of tests according to the two main objectives of the study: tests in leaching columns to evaluate carbon capture and agronomic tests in a greenhouse. Both tests were conducted at the Biology Experimental Station (15º44’13”S 47º 52’57”W).
Both tests used a sample of a dystrophic Red Oxisol (typical of the Cerrado biome) collected in Brasilia (DF, Brazil). The soil was homogenized, air-dried, and passed through a 2 mm sieve. The soil was characterized according to the initial content of total organic carbon by wet method, through the oxidation of organic matter by dichromate ions in a strongly acidic medium [26]. The other chemical properties were characterized according to [27] and showed acidity, dystrophy, and CTC typical of Oxisol in the Brazilian Savannah.
Five different types of ground silicate rocks were tested in both tests. These silicate rocks came from five Brazilian regions so as to characterize the wide possibilities throughout different parts of the country: kamafugite (Southeast), chlorite-muscovite calc-schist (Midwest); hydrothermalized calc-silicate rock (Northeast), biotite-actinolite schist (North) and basalt (South). The first three rocks have already been registered as soil remineralizers with the Ministry of Agriculture, Livestock and Supply (MALS). The remaining two are currently in the registration process. The granulometric range of the material used in the tests ranged from 0.3 mm to 2.8 mm.
Table 1 shows the chemical characterization of the five rocks in terms of the percentage of macronutrients (expressed in the form of oxides) and some potentially toxic elements (PTEs), in accordance with the conditions established in Normative Instruction No. 5/2016 (MALS) [28]. The Table shows that the total percentage of the sum of bases (CaO+MgO+K2O) of all rocks is greater than 9%, and the maximum PTE contents meet the limits established in the same standard.
Chemical analyses of the rocks were conducted at the Stable Isotope Laboratory (LABISE) at Pernambuco Federal University (UFPE) and by SGSGeosol. An X-ray fluorescence spectrometer was used for these analyses. The samples were manually quartered and dried in an oven at 110 °C. Aliquots of the dried samples were pressed into an aluminum capsule with 30 tons of force. The potentially toxic elements (PTE) of arsenic (As), lead (Pb) and cadmium (Cd) were analyzed by inductively coupled plasma optical emission spectrometry (ICP-OES), after triacid digestion with HNO₃ + H₂SO₄ + HF (EPA, 3052), while Mercury (Hg) was analyzed with the Direct Mercury Analyzer, via Atomic Absorption Spectrometry (AAS).
Organic matter (OM) derived from semi-tanned cattle manure was used in both tests. For the chemical characterization of this material, a composite sample was collected which was packaged in paper bags and placed in an oven (65 °C) with forced air circulation for 72 hours. After drying, the material was weighed, ground, packed in polyethylene bags, and subjected to nitric-perchloric digestion. Nutrient contents (Table 2) were quantified by atomic absorption spectrophotometry (Ca, Mg, Al and microelements), molecular absorption spectrometry (P and S), and flame photometry (K), according to [27].
Parameters analyzed by the method described in IN-SDA Nº003/2017 MAPA [29].
The leaching column experiment (Figure 1 - supplementary material) used deionized water reservoirs (400 mL) connected to a hydraulic circuit with a flow controller, 25 cm long PVC tubes (100 mm in diameter), nylon mesh and filter paper superimposed on a container to receive and direct the leached liquid (bottom cover with a diameter of 100 mm)1.
The leaching columns (PVC pipes) were filled with 1.5 kg of soil (S) which were added to the five rocks (R) mentioned above, mixed or unmixed, with organic matter (OM) and three controls: soil only, soil + organic matter (OM), and soil + NPK. The treatments had a 5x2+3 structure with four replicates arranged completely at random. The rocks (remineralizers) were added at a dose of 20 t ha-1 (15 g column-1) and the cattle manure at a dose of 40 t ha-1 (30 g column-1).
Deionized water was applied to the columns using a continuous flow drip system interspersed with stationary flow for ten months. In order to obtain the field capacity of the soil, 800 ml of water (equivalent to the average volume of rainfall in the Brazilian savannah) was initially added. This volume of water was applied by drip irrigation, in two stages of 400 ml each, over four days until the soil was completely saturated.
Leached water was collected on a weekly basis for a period of 10 months (10 cycles). For this purpose, 100 ml of deionized water was added every 7 days and all the content percolated through the column was collected at the end of each week. This water was stored in a refrigerator until the time of analysis. At the end of each month, the volume of leachate collected from the four percolation cycles of each column was quantified, and the chemical parameters pH, electrical conductivity, K, P, Ca, Mg, S, nitrates, nitrites, ammoniacal nitrogen, total carbon and organic carbon, and total acidity were analyzed. Our analysis methodologies are in accordance with the International Technical Standards (2017) for each parameter, aiming at the interrelation between these data and carbon capture. As the leached volumes in each column varied depending on the treatments, the leached nutrient contents (mg L-1) were converted into total leached contents (mg column-1).
For the agronomic efficiency tests, we used plastic pots filled with 5 kg of the previously described soil. The following rock types, also used in the leaching column experiment, were used: Basalt (BSL), kamafugite (KMU), chlorite-muscovite calc-schist (CMC), hydrothermalized calc-silicate rock (HGR), and biotite-actinolite schist (BAS). The agronomic tests were conducted in a greenhouse (Figure 2 - supplementary material) with the same structure used in the leaching column experiment (5x2+3), with four replicates in a completely randomized design. Each pot was covered with dry straw to help keep the soil moist throughout the experiment. Therefore, the results we obtained refer to the applied doses of remineralizer equivalent to 20 t ha-1 and 40 t ha-1 organic matter.
The agronomic tests were conducted with three agricultural crops grown in succession inside a greenhouse (beans, arugula and carrots). The decision was made to select agricultural crops that are common to the Brazilian savannah region and that also influence the food and nutrition security of the population. The bean crop (Phaseolus vulgaris) was first introduced. Three seeds were added per pot, and after germination, thinning was done, leaving a single plant per pot, grown for 60 days (flowering period) to measure the weight of fresh mass (FM) and the weight of dry mass (DM). Next, the arugula crop (Eruca vesicaria) was introduced, which has an extremely short cycle (40 days). Around 20 seeds were planted per pot. After germination, thinning was done, leaving three plants per pot. At the end of the cycle, the plants were harvested to quantify the FM and DM. The third crop was carrots (Daucus carota L), which has a cycle of approximately 110 days. Approximately 20 seeds were planted per pot, and after germination, thinning was done, leaving only three plants per pot. After completing the cycle, the roots were harvested, washed, and dried for 24 hours in an oven (60ºC). The nutritional content of the roots were then analyzed for the parameters N, P, K, Ca, Mg, S, B, Zn, Fe, Mn and Cu, according to [27].
The plants were irrigated manually every three days. After the three crop cycles had completed, soil samples were collected and then the pH (water and CaCl2), organic matter content, CEC, and availability of nutrients P, K, S, Ca, Mg, B, Zn, Fe, Mn and Cu were evaluated, according to [27].
The data was subjected to Analysis of Variance (ANOVA) with application of transformation when necessary. The conditions of normality of the residues, homogeneity of variances, and presence of outliers were verified by the Jarque-Bera, Bartlett, and generalized ESD tests, respectively. Contrasts of main interest (rock vs control within each organic fertilization condition) were tested by the one-tailed Holm test (H1: rocks > control; P<0.05). Comparisons of secondary interest (differences between rocks) were tested, on an exploratory basis, by the SNK test (P<0.05) within each organic fertilization condition. Additionally, the NPK treatment was compared to the average of the treatments with rock (with no organic compound) using the bilateral Holm test (P<0.05). The analyses were performed using the SPEED Stat software [30].
3. Results
The two types of tests performed – leaching columns and agronomic tests in pots - have different objectives, as such, the following results were displayed separately since they provide different information: (i) indicators for measuring carbon capture and (ii) assessment of nutrition content and plant yield.
As a way to standardize the materials tested, Table 3 displays information about the five rocks tested, showing the region (state) of origin, their geological framework, age, mineralogy, and main nutrients derived from the different minerals that make up these rocks. The information, which includes determining free silica content, observing textures and microstructures that facilitate understanding of the mineralogical assembly, and the degree of rock weathering and/or grain alteration was derived from previous work by the team.
As Table 3 shows, the rocks tested contain different minerals and have different susceptibilities to chemical and biological weathering. During weathering, the release of basic cations such as Ca²⁺, Mg²⁺, K⁺ and Na⁺ can replace exchangeable hydrogen (H⁺) and aluminum (Al³⁺) ions in the soil solution. This exchange reduces active acidity and increases soil pH [18]. These cations can react with CO₂ dissolved in the soil solution, forming carbonates that neutralize acidity and are capable of storing carbon.
3.1. Leach Columns
As important as nutritional parameters, pH data (Table 4) and electrical conductivity (Table 5) are fundamental indicators of changes in the fertility and possibility of carbon capture in the soil. We found significant differences (p<0.05) when comparing S treatments with S+R and S+OM treatments with S+R+OM, showing the efficiency of organic acids to enhance the solubilization/availability of nutrients. All the tested rocks resulted in some pH increase in some of the cycles, being slightly higher on average for the BAS, CMC and HGR rocks compared to the other rocks, and a slightly higher presence of OM in general than an absence of it. We were also able to verify that the pH values of the NPK control differed from the average of the S+R treatments in six events, with lower values than those of S+R and S+R+OM. At the end of the experiment, the soil in the columns showed active acidity (pH) ranging from 6.42 to 8.5. Over the course of the ten leaching events, we observed the pH values decrease and stabilize around 7.0, with the S+R+OM treatments always superior to the S+R ones. The treatments containing CMC and BAS (two types of schist) showed significant increases in soil pH in relation to the control (S) at the end of the experiment.
Electrical conductivity (EC), which is related to the presence of ions dissolved in solution (Table 5), was consistent with the availability of cations in the rock minerals, which have contents of 5 to 20% in free SiO2 (in the form of quartz) and high contents of K+, Ca2+ and Mg2+. In this framework, we observed significant differences in the collected leachates; however, this parameter was less influenced by the addition of remineralizers than the pH, highlighting only the increases in the leachates of the soils that received CMC. It is important to note that the values obtained for the S+NPK control treatment underwent significant reductions throughout the events, going from 1513 to values around 110 µS/Cm, which suggests rapid loss through leaching (K) or fixation (P).
Similar to what was previously observed by [33], our research showed that the first leaching cycles presented higher average contents for all nutrients evaluated (Ca, Mg, K, P and S), but they decreased over the course of the ten cycles, which is evident in the EC values in Table 5. Once the leached volume was measured and the nutrient contents were determined for each leachate, we then calculated the total nutrients leached throughout the experiment (Table 6). From this total, we found that CMC had a significant increase in Mg leaching from the treatments and, in the presence of OM, all rocks had a significant increase in K leaching in relation to the levels of the control treatment (S).
These results demonstrate a greater susceptibility to K leaching in relation to the other nutrients evaluated. They also confirm that the presence of organic fertilization has a marked influence on this K leaching process, possibly due to the release of soluble organic compounds with a greater affinity for soil charges than K, or due to the action of these organic compounds in intensifying mineral hydrolysis reactions, or even due to the greater action of microbial weathering.
P showed significant differences in HGR, possibly due to the recurring presence of apatite minerals (See Table 3). Although KMU is a rock with high P contents, we were unable to verify a significant increase in the total leachate content. However, we were able to verify the increase in the soil (Table 6), possibly indicating that the P was retained in the structure of the soil minerals. As with the other nutrients, we verified that the treatments with organic fertilizer had the same increase, although we could not find significant differences between the rocks.
Table 7 summarizes the results obtained for the soil in the columns. It shows that the applied remineralizers resulted in an increase in the average soil CEC, with emphasis on KMU, CMC and BAS that also had a significant increase in the potential acidity of the soil in relation to the control.
The nutrient availability in the soil in the columns was also influenced by the application of the different ground rocks (R), with emphasis on the increases in the levels of Ca2+ promoted by KMU, CMC and HGR, of Mg2+ promoted by CMC and HGR, of K promoted by BAS, and of P promoted by KMU and HGR. The significant increase in P extracted by Mehlich-1 in treatments with KMU and HGR (with or without OM) may be overestimated as this extractor is known to overestimate P availability in soils fertilized with apatite. We also observed significant increases in soil Fe availability promoted by CMC and BAS. The differences occurred mainly in the S+R treatments.
Although less frequently, we did verify differences in treatments containing rocks with more organic matter (S+R+OM), where the Mg2+ contents showed significant differences in treatments with BSL, CMC and HGR. Regarding Ca2+ levels, only treatments with CMC and HGR showed significant differences in the presence of OM. As for the K+ contents, the rocks with the best performance were BSL and HGR in the presence or absence of OM. Regarding the P contents, we verified that both KMU and HGR performed well in the presence or absence of OM. Regarding micronutrients (B and Zn), we observed different behaviors in the different rocks. However, they presented distinct and higher averages in the treatments that contained REM (all rocks) and OM in relation to the controls S, S+OM and S+NPK. It is important to note that we were unable to observe (in general) whether the presence of OM influenced rock weathering since there was no increased release of nutrients in the presence of OM; the exception being Mg in the BSL treatments, which could be an important indicator to be considered for carbon capture. The results in Table 7 suggest that the REM tested were able to make nutrients available to the soil after the ten months of experiment and that most of the nutrient levels analyzed were higher when compared to the treatment with NPK (conventional fertilizer); the exception being P and K, which demonstrates that these inputs are quite effective at providing nutrients to agriculture.
Literature on EWR has shown that ground rocks have the greatest carbon capture potential, by removing carbon dioxide (CDR) from the atmosphere [11,21]. Basalts have been used the most for carbon capture as they have a greater occurrence and distribution around the planet [34,35]. For this research, all the rocks in our study have carbon capture potential, as can be seen in Table 8.
When considering the total content of leached inorganic C (accumulated over the ten leaching cycles), the total contents were influenced by the presence of OM (higher values of leached inorganic C). However, there was insufficient evidence that OM influences the rock's ability to promote inorganic C leaching as significant increases in total leached inorganic C occurred in four of the five rocks (BAS, KMU, HGR, and CMS) in the absence of OM (Figure 1). Only CMS showed significant increases in the presence of OM.
Measures followed by * differ from their respective control by the Holm test at a 5% probability of error α (k=11 comparisons). Measures of the NPK treatment followed by “†” differ from the measures of the S+Rock treatments by the Holm test at a 5% probability of error α (k=11 comparisons). Measures followed by distinct letters differ from each other by the SNK test at a 5% alpha error probability (exploratory test comparing only between rocks within each group, S or S+OM).
The rock that had the largest influence on leaching of inorganic C was CMC, and the rock that had the least influence (or no influence) was BAS. However, it is important to note that part of the leached inorganic C may derive from the dissolution of calcite (CaCO3), indicating that emission may depend on the soil pH conditions. We were unable to demonstrate that the NPK treatment promoted a lower leaching of inorganic C than the average of rocks without OM as the contrast S+NPK versus rocks without OC was non-significant.
3.2. Agronomic Tests
As demonstrated by the soil analyses of the leaching columns, there were also important changes in the soils where the plant experiments were conducted; the use of different rocks caused variations that were statistically verifiable (Table 9). The five rocks showed significant increases in soil pH values compared to the controls (S, S+OM, and S+NPK), thus demonstrating their potential as a corrective for maintaining soil acidity.
The behavior of P in the different treatments with or without the presence of OM is also worth highlighting. All rocks show great potential as sources of phosphorus, and the addition of OM showed higher levels than soluble NPK sources (S+NPK). The K+ increases in the KMU and BAS treatments show the large potential of this rock as a source of this important nutrient. With regards to micronutrients, Fe, Zn and Mn showed significant differences in both the S+R treatments and those containing OM (S+R+OM) when compared to the S, S+OM and S+NPK controls. B and Cu were more expressive in the treatments without OM.
On a whole, plant growth was strongly influenced by organic fertilization, which even surpassed NPK treatment. There was insufficient evidence that rocks promoted bean growth as assessed by dry mass (DM) weight, either in the presence or absence of OM (Figure 2 A). However, BAS, CMC and KMU rocks positively influenced the growth of arugula plants (fresh mass) in the absence of OM (Figure 2B). In the presence of OM, we were unable to identify a positive influence, possibly due to the adequate supply of nutrients already provided by organic fertilization.
Measures followed by * differ from their respective control by the Holm test at a 5% probability of error α (k=11 comparisons). Measures of the NPK treatment followed by “†” differ from the measures of the S+REM treatments by the Holm test at a 5% probability of error α (k=11 comparisons). Measures followed by different letters differ from each other by the SNK test at a 5% probability of error alpha (exploratory test comparing only between the rocks within each group, S or S+OM).
Table 10 shows that the nutrition content of carrots was influenced by both the presence of OM and REM, with significant increases in the levels of P, K, Ca, B and Fe. The presence of OM may have masked the nutritional effect of the rocks due to significant effects of the rocks (by the 5% Holm test) being more frequent in the absence of OM.
Measures followed by* differ from their respective control by the Holm test at a 5% error probability α k=11 comparisons). Measures of the NPK treatment followed by “†” differ from the measures of the S+R treatments by the Holm test at a 5% probability of error α (k=11 comparisons). Measures followed, in the line, by different letters differ from each other by the SNK test at a 5% probability of alpha error (exploratory test comparing only between rocks).
With regards to the nutrient levels in carrots, in general, the different nutrients differ from the controls that used the 5% Holm test. Thus, for P we verified that KMU was 52.2% higher than the control (S) and 39.76% higher than S+NPK. CMC and HGR also had significant differences and higher values when compared to the two controls: 45.41%, 31.19%, 45.16% and 30.87%, respectively. For K+, all five types of rocks showed significant differences in relation to the S and S+NPK controls, particularly for HGR (73.56% and 44.07%), followed by BSL, KMU, CMC and BAS, with differences close to 70% of the rock compared to the Soil control (S). The differences in relation to the S+NPK control are noteworthy as all rocks were superior by an average of 35% to an input source that has readily available potassium. Regarding Ca2+, the differences between the rocks and the controls were around 40% greater than the Soil control (S), and 26% when compared to the NPK control.
The micronutrients boron, zinc, iron and copper also showed important differences when compared to the controls, particularly for Fe (CMC, BSL and BAS). Zinc and copper stood out in the treatments with HGR. As for boron, BSL, KMU and CMC obtained the most significant differences. The values were zero for the control (S) and S+NKP treatments, showing that this micronutrient was not available in these treatments, and may have affected root development.
4. Discussion
The results indicate that adding mineral silicatic sources to the soil promotes a continuous and permanent release of cations into the soil and into the fluids of the soil-root-plant system, which supports the principles established by [21,35,36] on Enhanced Rock Weathering (ERW) processes. It also reinforces the propositions of stonemeal technology as proposed by [12,37,38], who state that rocks rich in certain macro and micronutrients are capable of increasing the supply of nutrients in chemically-depleted soils.
The results also demonstrated other equally important benefits. These include an increased nutrient uptake by plants and an increase in pH and soil cation exchange capacity (CEC), similar to the results obtained by [39]. These indicators directly impact soil quality and health, and indirectly are associated with sustaining crop [40,41]. Therefore, recognizing the crucial role that a diversified supply of nutrients plays in agricultural production presents a new direction for achieving better indicators of nutrition security, mitigation of and adaptation to climate change, and the promotion of human health [42].
As reported in the preliminary tests of our investigation [33], and confirmed in this phase of the research, there was a synergistic effect between fertilization with remineralizer (REM) and organic matter (OM) which increased the solubility of mineral compounds and, consequently, a greater release of cations into the soil solution. The results demonstrated that the five types of rocks contributed directly to the increase in carbon leaching, as well as to the increase in the solubility of Ca, Mg, K, P and S, and increases in CEC and soil pH levels. It is likely that the organic acids from OM acted as chelating agents, accelerating the breakdown of silicate lattices (e.g., Al-silicates), which released the Ca²⁺ and Mg²⁺ needed for carbonation.
With regards to the total nutrient contents leached from the columns, K+ was the most frequent element in the leachates, both over time (10 cycles) and for the five different rock types. This cation presented average levels that differed significantly from the S control (Holm test at 5%), especially in treatments that combined rocks and organic fertilizer (S+R+OM). The higher potassium concentration in the leached liquid probably resulted from a combination of factors, such as the release of soluble organic compounds, the intensification of mineral hydrolysis, and the increase in microbial weathering [43].
Mg+2 also showed significant increases compared to the control (S), albeit in less expressive proportions (Table 6). In the S+R+OM treatments, a significant release of Mg+2 and Ca+2 was observed, suggesting that the organic component helps increase the supply as well as enhance the solubilization of these cations from the dissolution of minerals that compose the rocks.
Keeping with chemical changes in the soil, we compared the similarities and differences between the two types of tests. The interaction of soil with plant roots (pots) or without (leaching columns) showed distinct analysis perspectives for the supply and consumption of cations, whether in the plant growth process, in the possible formation of compounds in aggregates, or in new secondary minerals in the soil which can retain CO2, as suggested by [44,45]. The presence of roots and microorganisms increases the release of acids and the dynamics/adsorption of nutrients in the soil, including carbon dynamics [46].
In the soil without plants (column experiments), the application of different rocks significantly increased calcium (Ca²⁺) levels in treatments both with and without organic matter (OM), particularly in the CMC, HGR, and KMU treatments without OM. Magnesium (Mg²⁺) also showed significantly different average levels compared to the control.
Similar to the leaching column tests, in soils with plants, an increase in pH was observed for all rocks (with or without OM), a result previously reported by other authors [47]. The CEC was also influenced by the addition of mineral and organic sources, although the pot experiments demonstrated a less expressive effect in the soil with plants than in the soil of the leaching columns. This suggests that part of the available cations from the organomineral inputs may have been absorbed by the plant root systems.
Different from the results obtained for leached fluids, potassium (K⁺) availability varied significantly with rock mineralogy, showing particularly high levels from biotite-actinolite-schist (BAS), which is rich in biotite. The averages for K in the S+R+OM treatments differed significantly from all controls, including the soluble NPK fertilizer (S+NPK). Notably, K⁺ was the most abundant cation in the leachate, indicating that remineralizers can effectively supply this crucial nutrient for plant, as also observed by [48].
Conversely, phosphorus (P) availability did not follow a consistent trend, except for kamafugite, which outperformed the S+NPK control with or without organic matter (Table 7). Furthermore, the application of remineralizers (REM) enhanced the availability of key micronutrients - zinc (Zn), iron (Fe), copper (Cu), and boron (B) - in a manner that varied by rock type. The increased presence of these trace elements is vital for nutrition security, given their essential metabolic roles in plants and other organisms [49].
The results for soils with plants (pots) showed that Ca+2 had averages with more expressive significant differences (P<0.05). This cation exhibited similar results in both S+R and S+R+OM treatments. The more prominent presence of this cation demonstrates a greater probability of new minerals forming in the soil through carbonation, which would facilitate the carbon dioxide removal (CDR) from the atmosphere, since this process involves the formation of pedogenic carbonates from the reactions of CO2 with Ca+2, Mg+2 and K+ [23].
Although in different ways, the results obtained in the two systems (with and without plants) showed that rocks are capable of positively altering the main macro and micronutrient levels, which support soil fertility and promote plant growth. Equally important, we observed increased levels of the main indicators that promote the carbonation process when compared to the S and S+NPK controls.
Another key point is the yield of the crops inserted in the rotation system. The first two crops, beans and arugula, presented higher averages of plant biomass in the treatments that combined rocks with organic matter (OM), even surpassing the results from the control (S+NPK), which included high-solubility fertilizer, as shown in Figure 4A. Among the three crops we evaluated, the results for carrots were particularly relevant because they reflect the nutrition content of the plants after the application of treatments throughout the successive cultivation of three crops (residual effect). There was still a significant amount of macronutrients and micronutrients in the nutrition content which are higher in the rock treatments compared to the (Table 10), reinforcing the hypothesis that rocks have the ability to provide nutrients to plants in a long term [7].
Considering the fact that the rocks we tested are rich in Ca, Mg and K, our research showed that the nutrients in these rocks could be absorbed by the roots and thus increase the nutrition content of carrots, presenting means with significant differences (P < 0.05) in both treatments with or without OM when compared to the S and S+NPK controls. Significant differences relative to the control were observed for calcium and potassium in all rock-amended soils. The P content in plants was also significant, particularly for treatments with KMU, CMC and HGR.
Furthermore, considering the problem of nutrition erosion, a subject of study by [8] who report the drastic reduction in the supply of nutrients (especially micronutrients) in soils, our research showed that the use of REM in the soil, with or without OM, increases the availability of trace elements. The presence of boron, which is a fundamental micronutrient for this crop, showed significant differences in root dry matter in four of the five types of treatments (the exception being HGR) when compared to the S and S+NPK controls, which did not present this micronutrient. Fe was also prevalent in all treatments, but mainly in those with BSL, BAS and CMC, with or without OM.
These results are quite relevant as they show that soluble chemical inputs can be partially replaced in soils fertilized with lower soluble mineral sources, such as remineralizers, particularly when combined with organic matter. This substitution has significant implications for sustaining agricultural systems and reducing environmental and economic impacts associated with the extensive use of synthetic fertilizers [23].
Although the results confirm that the use of ground rocks increases all direct and indirect parameters of agricultural production, our research showed that OM played an important role in soil preservation and mineral dissolution and, consequently, nutrient availability probably due to the presence of organic acids produced during its decomposition [39]. CO2 adsorption is also facilitated, potentially through the formation of stable ion pairs with carbonates with the cations produced by this system [50].
However, as previously mentioned by other authors, particularly [11], in order to quantify the potential for rocks to capture carbon, one must take into account the complexity of the carbon cycle (derived from organic, inorganic and/or atmospheric sources). The COS and SIC facilitates the formation of secondary minerals in the soil during the weathering process of silicate rocks [35]. The presence of cations released by the hydrolysis of silicates (Ca²⁺, Mg²⁺, K⁺) tends to favor carbonation, which is considered one of the pathways for carbon dioxide remove (CDR) from atmosphere, transforming it into stable carbonates in the soil [51]. In the same line, [21] showed that the acceleration of chemical weathering processes facilitates atmospheric CO₂ removal through the transfer of carbon and other elements from rock and atmospheric reservoirs into long-term sinks in the biosphere and ocean.
Although the most common methodologies for quantifying ERW utilize a theoretical potential based on oxide stoichiometry (Renforth's Equation, 2012) [20], significant gaps remain regarding the actual value of CDR through carbonation processes [23] or via aqueous solutions that percolate through soils and eventually reach the oceans [21]. Some metrics are currently being refined to improve the precision of measurements associated with ERW, aiming to overcome the uncertainties inherent to the process.
From this perspective, our research evaluated the potential for captured carbon based on the results obtained from the dynamics of released cations over a 10-month interval. Considering the assumptions suggested by [43], who propose a new framework for understanding the dynamics and accounting of cations released in reactions to quantify the ERW, the methodological approach adopted was the use of the sum of exchangeable bases - Ca²⁺, Mg²⁺, and K⁺ (in mol) - dissolved in the aqueous phase (leachate) and in the soil.
This approach is based on the principle that the reactions resulting from these bases can provide a more accurate and direct estimate of the maximum carbon removal limit via carbonation. This framework assumes a proportional sequestration potential for each mole of released cation, thereby simplifying the calculation of ERW efficiency under tropical conditions, where weathering processes are typically more pronounced
A quantification facilitator can be obtained through direct stoichiometry, which allows for the application of a 1:1 ratio for monovalent cations (K+) and a 1:2 ratio for divalent cations (Ca2+, Mg2+) in the formation of stable bicarbonates/ion pairs. This approach transforms a theoretical estimate into a measurable indicator suitable for carbon sequestration audits.
We posit that carbon dioxide removal via carbonation - which can be subsequently accounted for and quantified as CO2 removed from the atmosphere - depends on the actual availability of cations Ca2+, Mg2+ and K+) in the soil solution to react with carbonic acid (H2CO3) derived from the hydration of atmospheric and/or soil organic carbon. By utilizing the sum of exchangeable bases expressed in moles, the variation in atomic mass between elements is neutralized, establishing a direct stoichiometric relationship with the bicarbonate (HCO3-) or carbonates produced. Consequently, the sum of bases serves as an indicator of the system's proton balance: each mole of positive charge released by silicate rocks necessarily implies the sequestration of an equivalent amount of carbon to maintain electroneutrality in the solution, rendering this method a reliable indicator for carbon credit quantification.
Chemical analysis of soil fertility and leached fluids offers greater precision than the analysis of total oxides. This occurs because the mineral content of rocks is not fully released within the short term (agronomic timeframe). Thus, the measurement of the sum of exchangeable bases represents an advancement in ERW monitoring: while traditional models establish a theoretical maximum ceiling (assuming complete dissolution), the sum of bases reflects the geochemically active fraction. In this context, pH and leached carbon data allow for an understanding of how carbonation rates vary across different agroecosystems with distinct rock types.
An inherent challenge to this process is the kinetic dichotomy between silicate hydrolysis (favored by low pH) and carbonate precipitation (favored by high pH). A potential resolution to this impasse may be linked to the presence of organic matter (OM), which promotes a reduction in alkalinity. The values obtained in this research ranged from 6.42 to 8.5, stabilizing around 7 (Table 4). We observed that the amount of leached Carbon, electrical conductivity, and the sum of bases more than doubled in treatments containing organic matter (where the pH was lower) compared to treatments with rock only. The organic source acted as an accelerator for the dissolution process through the production of organic acids and potential microbial respiration. The released cations were able to remain in solution, increasing fluid alkalinity and sequestering or storing carbon in aqueous form (at least temporarily as ion pairs) or in neoformed carbonate minerals, such as pedogenic carbonates (Bijma et al, 2025). Furthermore, Si, P, or K may stimulate the vegetal development, further contributing to the removal of CO2 from the atmosphere [21].
Utilizing the data obtained in this study, Table 11 compares the theoretical potential of each rock type used in the trials with the net values of removed carbon (Total Carbon minus SOC) recorded over the 10-month period. These comparisons include both the remineralizer-only treatments (S+R) and those incorporating organic matter (S+R+OM), as well as the incremental efficiency gained through the inclusion of organic matter in the system.
Legend: * Theoretical Potential: Calculated via oxide stoichiometry based on the Renforth Equation (2012). Net Capture: Represents net values (control-subtracted) observed in leached fluids over a 10-month period for treatments S+R (Soil + Rock) and S+R+OM (Soil + Rock + Organic Matter).
Notes of Conversion and Calculation:1 Incremental Efficiency with OM (%): Determined by the relative increase between treatments: [(S+R+OM - S+R) / S+R] X 100; 2 Real Capture Equivalent (kg CO2/ha): Calculated by multiplying the S+R+OM carbon values (kg C/ha) by the stoichiometric factor of 3.67; 3 Capture per tones (kg CO2/t): To determine capture per 20 tones of applied rock, divide the Real Capture Equivalent by the application rate (20 t/ha).
According to Table 11, the presence of OM (S+R+OM) elevated the measured (or removed) carbon by 3 times or more (case of basalt) in the comparison with treatments with exclusive use of rock (S+R). Increased base availability (Ca2+, Mg2+, K+) from rock minerals and higher carbon leaching rates likely facilitate carbonation, as supported by the mineralogical data in Table 7. According to the data, BSL was the rock that, in the presence of OM, exhibited the highest increase in carbon leaching efficiency during the tests (534%), followed by KMU and HGR (219%).
The presence of silicate minerals with a significant content of calcium and magnesium, combined with the presence of soil organic matter (SOM), enhanced reactivity and may have driven the increase in carbon capture efficiency. Microbial metabolism and the transformation of organic matter are crucial for the long-term storage of SOM [48]. From this perspective, soil carbon stabilization is driven by microbial metabolism and the microbial residues present in organic matter, which possess a superior affinity for the mineral matrix, facilitating the formation of Mineral-Associated Organic Matter (MAOM). This process of adsorption onto mineral surfaces and the eventual inclusion into soil microaggregates is considered the primary mechanism of physical and chemical protection that ensures carbon storage over extended periods.
However, questions persist regarding carbon absorption in the presence of rocks containing significant amounts of the mineral calcite (CaCO3), such as CMC. Although these rocks possess a lower theoretical potential (266 kg/t), they release substantially more carbon into the leachate (89.48 kg C/ha) when organic matter (OM) is present. This results in a more significant percentage efficiency, as the CaCO3 or MgCO3 found in calcite solubilizes more rapidly than Ca and Mg silicates (such as pyroxenes, amphiboles, and feldspars). The latter possess higher theoretical potentials but exhibit slower dissolution kinetics, resulting in lower real equivalent capture over the short term (10 months).
Another critical point concerns the data obtained for capture per tonne (kg CO2/t) based on the dosage of ground rocks applied to the soil (20 t/ha-1). These values are more modest than those expected from the theoretical potential projections presented in the literature. However, it is important to emphasize that our research did not account for other intervening factors that are equally vital to the CO2 capture process, such as management practices tailored to different edaphoclimatic conditions and the presence of plants (roots), which play a fundamental role in the process.
Despite this gap, the data evidence that silicate weathering kinetics were drastically altered by the presence of organic matter, changes in soil pH, and the supply of basic cations to the system, confirming the findings of [43]. It is probable that this set of interactions impacted the amount of leached carbon. However, it is essential to bear in mind that the transfer of carbon from the atmosphere to the soil (in a more permanent form) must be balanced with the soil's need to support a nutritionally diversified agricultural production. The balance between the amount of material added to the soil and its granulometry must be handled with prudence, so as not to drastically alter agroecosystems or lead to inconsequential carbon capture.
5. Conclusions
The application of ground silicate rocks to tropical soils represents a multifunctional strategy that simultaneously bolsters food security and climate change mitigation. This study, evaluating five types of rocks (REM) under controlled conditions, leads to the following conclusions: (i) REM significantly improved soil chemical properties, notably increasing pH and Cation Exchange Capacity (CEC). This translated into enhanced plant nutrition and biomass production in the S+R+OM treatments, which consistently outperformed all controls, including high-solubility NPK fertilizers; (ii) organic matter (OM) acted as a critical catalyst (chelating agents) for mineral dissolution. The release of essential divalent (Ca2+, Mg2+) and monovalent (K+) cations was significantly accelerated by the presence of organic ligands, which are fundamental drivers of the carbonation process; (iii) the leaching efficiency of total inorganic carbon (TIC) varied across rock types as a function of their mineralogical reactivity and the presence of OM. This synergy was about three times greater for all rocks but was most striking in basalt treatments, where the addition of OM resulted in a 534% increase in carbon leaching efficiency. These results highlight that biological catalysts are indispensable for maximizing the Carbon Dioxide Removal (CDR) potential of silicate rocks within agronomic timeframes and (iv) from a geochemical perspective, this study establishes the sum of exchangeable bases as a verifiable indicator of the system’s proton balance. By prioritizing the geochemically active fraction over theoretical stoichiometry, this framework provides a precise and auditable method for quantifying atmospheric CO2 flux into stable inorganic carbon sinks. Future research should prioritized long-term field trials. While the CDR potential of remineralizers is substantial, future research must evaluate these dynamics across diverse field-scale agricultural contexts, specially to monitor the stabilization of Mineral-Associated Organic Matter (MAOM) and the permanent storage of inorganic carbon in deep soil profiles. Refining quantification methodologies will ensure the precision, reliability, and transparency required to consolidate ground silicate rocks as a cornerstone of sustainable agriculture and global climate policy.
Supplementary Materials
The following supporting information can be downloaded at the website of this paper posted on Preprints.org.
Funding
This research was funded by Grantham Foundation for the Protection of the Environmental, grant number SEI/UnB nº 23106.078991/2022-77, Technological Enterprises (Finatec) and of the National Council for Scientific and Technological Development (CNPq) grant number 409283/2022-3.
CRediT authorship contribution statement
S.H. Theodoro: Writing – original draft, review and editing, data curation, validation, supervision, investigation, funding acquisition and project administration; F.P. Medeiros: Writing – original draft, investigation, formal analysis, data curation, conceptualization: A.M.X. Carvalho: Writing – review & editing, Validation, Software, Methodology. V.S. Oliveira: Writing – original draft, Investigation. L.C. Oliveira: Writing – original draft, Investigation. R.M.P Almeida: Investigation. M.B. Viana: Writing – original draft, Investigation, Conceptualization. G. R. Almeida: data curation, conceptualization. C.S. Gomide: Investigation, Data curation, Conceptualization.
Acknowledgements
we are grateful for the financial support of the Grantham Foundation for the Protection of the Environmental and we extend our thanks to Foundation for Scientific and Technological Enterprises (Finatec) for management of resources and the support of the National Council for Scientific and Technological Development (CNPq) providing scholarships for part of research group.
Interest Statement
The authors declare that they have no known competing financial interests or personal relationships that could have appeared to influence the work reported in this paper.
References
- IPCC: 2023: Sections. In: Climate Change 2023: Synthesis Report. Contribution of Working Groups I, II and III to the Sixth Assessment Report of the Intergovernmental Panel on Climate Change [Core Writing Team, H. Lee and J. Romero (eds.)]. IPCC, Geneva, Switzerland, pp. 35-115, . [CrossRef]
- Smith, P, Bustamante, M, Ahammad, H, Clark, H (2014) Agriculture, forestry and other land use (AFOLU). In Climate change 2014: Mitigation of climate change. Contribution of Working Group III to the Fifth Assessment Report of the Intergovernmental Panel on Climate Change. Cambridge University Press. [CrossRef]
- Smith P, Calvin K, Nkem J, et al. (2020) Which practices co-deliver food security, climate change mitigation and adaptation, and combat land degradation and desertification? Glob Change Biol. 26: 1532–1575. [CrossRef]
- Bossio, DA, Cook-Patton, SC, Ellis, PW (2020) The role of soil carbon in natural climate solutions. Nature Sustainability, 3, 391–398. [CrossRef]
- Seddon, N, Chausson, A, Berry, P, Girardin, C, Smith, A, Turner, B (2020) Understanding the value and limits of nature-based solutions to climate change and other global challenges. Philosophical Transactions of the Royal Society B: Biological Sciences, 375, 20190120. [CrossRef]
- Manning, DAC, Theodoro, SH (2018). Enabling food security through use of local rocks and minerals. Extractive Industries and Society, 7(2), 480–487. [CrossRef]
- Burbano, DFM, Theodoro, SH, Carvalho, AXM, Ramos CG (2022) Crushed vulcanic rock as soil remineralizer: a strategy to overcome the global fertilizer crisis. Natural Resources Research. 31: 2197-221. [CrossRef]
- McCance, RA, Widdowson, EM (2002) The Composition of Foods, Royal Society of Chemistry. ISBN: 0854044280. https://assets.publishing.service.gov.uk/government/uploads/system/uploads/attachment_data/file/971021/McCance_and_Widdowsons_Composition_of_Foods_integrated_dataset_2021.pdf.
- Gomes, L, Miranda, HS, Silvério, DV, Bustamante, MMC (2020) Effects and behaviour of experimental firesin grasslands, savannas, and forests of the Brazilian Cerrado. For. Ecol. Manage. 458, 117804. [CrossRef]
- Steffen, W, Richardson, K, Rockström, J et. al. (2015) Planetary boundaries: Guiding human development on a changing planet. Science. 347, i. 6223. [CrossRef]
- Manning, DAC, de Azevedo, AC, Zani, CF, Barneze, AS (2024).Soil carbon management and enhanced rock weathering: The separate fates of organic and inorganic carbon. European Journal of Soil Science, 75(4). [CrossRef]
- Theodoro, SH, Manning, DAC, Carvalho, AXM., Ferrão, FR, Almeida, GR (2022) Soil remineralizer: a new rote to sustentability for Brazil, a giant exporting agro-mineral commoditites. In: Yakovleva, N, Nickless, E (eds) Routledge Handbook of the Extractive Industries and Sustainable Development. 1st Ed. 261-281https://. [CrossRef]
- Leonardos, OH, Theodoro, SH, Assad, ML (2000) Remineralization for sustainable agriculture: a tropical perspective from a Brazilian viewpoint. Nutr. Cycl. Agroecosyst. 56: 3–9. [CrossRef]
- Ramos, CG, Hower, JC, Blanc E, Oliveira, MLS, Theodoro, SH (2022). Possibilities of using silicate rock powder: An overview. Geoscience Frontiers, 13(1). [CrossRef]
- Swoboda, P, Döring TF, Hamer M (2022) Remineralizing soils? The agricultural usage of silicate rock powders: A review. In Science of the Total Environment (807). Elsevier B.V. [CrossRef]
- Cherubin MR, Canisares LP, Souza LN, Pinheiro Jr CR, Moraes, MT Bertol, F Bortolo L, Menillo RB, Cerri CEP (2025) Long-term effects of crop diversification on soil health, crop yield and resilience of tropical agroecosystems, Journal of Environmental Management, 392,. [CrossRef]
- Martins, ES, Theodoro, SH, Bernardez, FFG, Luchese, AV, Bergmann M, Siqueira DS; Teixeira, A, Azevedo AC, Curtis, JCD (2024). Produção Brasileira de Remineralizadores e Fertilizantes Naturais: 2019 a 2023. Revista Novo Solo. Available:https://abrefen.org.br/2024/11/08/artigos-producao-brasileira-de-remineralizadores-e-fertilizantes-naturais-2019-a-2023/(accessed 24 Dez 2025).
- Van Straaten, P (2007) Farming with rocks and minerals: challenges and opportunities. Nairobi: International Centre for Research in Agroforestry. [CrossRef]
- Corrêa, RS, Oliveira, CG (2024) Classificação dos Remineralizadores. Revista do Instituto de Geociências. USP Geol. USP, Serie Científica., São Paulo, 24 (2) p. 23-37. [CrossRef]
- Renforth, P (2012) The potential of enhanced weathering in the UK. International Journal of Greenhouse Gas Control. (10) 229-243. [CrossRef]
- Hartmann, J, West, AJ, Renforth, P, Köhler, P, La Rocha, D, Christina, L, Wolf-Gladrow, DA, Dürr, H, Scheffran, J (2013). Enhanced chemical weathering as a geoengineering strategy to re- duce atmospheric carbon dioxide, supply nutrients, and mitigate ocean acidification. Rev. Geophys. 51 (2), 113–149. [CrossRef]
- Beerling, DJ, Leake, JR, Long, SP, Scoles, JD, Ton, J, Nelson, PN, Bird, M, Kantzas, E, Taylor, LL, Sarkar, B, Kelland, M, Delucia, E , Kantola, I, Muller, C, Rau, G, Hansen, J (2018) Farming with crops and rocks to address global climate, food and soil security. Nature Plants 4. 138–147. [CrossRef]
- Manning, DAC (2018) Innovation in resourcing geological materials as crop nutrients. Natural Resources Research. 27(2): 217–227. [CrossRef]
- Dupla, X, Möller, B, Baveye, PC, Grande, S (2023) Potential accumulation of toxic trace elements in soils during enhanced rock weathering. European Journal of Soil Science, 74 (1). [CrossRef]
- Buss, W, Hasemer, H, Sokol, NW, Rohling, EJ, Borevitz, J (2024) Applying minerals to soil to draw down atmospheric carbon dioxide through synergistic organic and inorganic pathways. Communic Earth & Environ, 5, 602. [CrossRef]
- Mendonça, EDS; Matos, EDS (2005) Matéria Orgânica do solo: métodos de análises; UFV: Viçosa, Brazil. ISBN: 978-85-69193-02-9.
- Silva, FC (2009) Manual de análises químicas de solos, plantas e fertilizantes. 2 Ed. Brasília: Embrapa Informações Tecnológicas. 627p. Brazil.
- 28. Brazil/MALS (2016) Normative Instruction nº 05, 10th Marc, 2016. Available: https://www.gov.br/agricultura/pt-br/assuntos/insumos-agropecuarios/insumos-agricolas/fertilizantes/legislacao/in-05-_ingles.pdf (Accessed 28th January 2025).
- Brazil/MALS (2017) Manual de métodos analíticos oficiais para fertilizantes e corretivos / Ministério da Agricultura, Pecuária e Abastecimento. Secretaria de Defesa Agropecuária – Brasília: MAPA. 240 p. ISBN 978-85-7991-109-5. (Accessed 28th January 2025).
- Carvalho, AMX, Mendes, FQ, Mendes, FQ, Tavares, LF, 2020. SPEED Stat: a free, intuitive, and minimalist spreadsheet program for statistical analyses of experiments. Crop Breeding and Applied Biotechnology 20 (3). [CrossRef]
- Theodoro S. H., Leonardos O. H.. Stonemeal: principles, potencial and perspective from Brazil.(2015) In: Goreau TJ, Larson RW, Campe J. Geotherapy: Innovative methods of soil fertility restoration, carbon sequestration and reversing CO2 increase. CRC Press. USA. 2014. 403-418. ISBN 9780429168901.
- Theodoro SH, Oliveira VS, Silva VL, Mesquita NM, Medeiros FP, Oliveira LC, Peixoto SF, Nascimento LC, Lima, CD (2025) A transformação de subprodutos da exploração de esmeraldas em remineralizadores de solo: o caso do APL de Monte Santo/TO. Revista Geologia USP. Série Científica 25(13). [CrossRef]
- Medeiros, FP, Theodoro, SH, Carvalho, AMX, Oliveira, VS, Oliveira, LV, Almeida, RAP, Viana, MB., Gomide, CS (2025) The combination of crushed rock and organic matter enhances the capture of inorganic carbon in tropical soils. Journal of South American Earth Sciences, 152. [CrossRef]
- Lefebvre, D, et al. (2019) Assessing the potential of soil carbonation and enhanced weathering through Life Cycle Assessment: a case study for Sao Paulo State, Brazil. Journal of Cleaner Production, 233(2), p. 468-481. [CrossRef]
- Beerling, DJ, Kantzas, E et al. (2020) Potential for large-scale CO2 removal enhanced rock weathering with croplands. Nature. 5839(7815), p. 242-248. 2020. [CrossRef]
- Renforth P, Von Strandmann, PAE, Henderson GM (2015) The dissolution of olivine added to soil: implications for enhanced weathering. Appl. Geochem (61): 109–118. [CrossRef]
- Hensel, J. (1874) Bread from Stones: A New and Rational System of Land Fertilization and Physical Regeneration.
- Leonardos, O. H., Fyfe, W. S., Kronberg, B. I. (1987) The use of ground rocks in laterite systems: an improvement to the use of conventional soluble fertilizers. Chemical Geology, 60 (1-4) p. 361-370. [CrossRef]
- Basak, B, Sarkar, B, Naidu, R (2021) Environmentally safe release of plant available potassium and micronutrients from organically amended rock mineral powder. Environmental Geochemistry Health. 43, 3273–3286. [CrossRef]
- Poppiel, RR, Cherubin, MR, Novais, JJM (2025) Soil health in Latin America and the Caribbean. Communications Earth Environment 6, 141 (2025). [CrossRef]
- Qiao, L et al. (2022) Oil quality both increases crop production and improves resilience to climate change. Nat. Clim. Change 12, 574–580. [CrossRef]
- Romano, I, Zelikoff, JT (2024) Soil health is human health. EXPLORE 20 (6), 103047. [CrossRef]
- Setiawati, TC, Mutmainnah, L. (2016) Solubilization of potassium containing mineral by microorganisms from sugarcane rhizosphere. Agriculture and Agricultural Science Procedia. V.9. 108-117. [CrossRef]
- Churchman, GJ, Singh, M, Schapel, A, Sarkar, B, Bolan, N (2020) Clay minerals as the key to the sequestration of carbon in soils. Clays and Clay Minerals, 68: 135–143. 384. [CrossRef]
- Bijma, J, Hagens, M, Hammes, J., Planavsky, N, Pogge von Strandmann, PAE., Reershemius, T, Reinhard, CT, Renforth, P, Suhrhoff, T.J, Vicca, S, Vienne, A, and Wolf-Gladrow, DA (2025) Reviews and syntheses: Carbon vs. cation based MRV of Enhanced Rock Weathering and the issue of soil organic carbon, EGUsphere [preprint],. [CrossRef]
- Gregory, PJ (2022). Russell Review. Are plant roots only “in” soil or are they “of” it? Roots, soil formation and function. European Journal of Soil Science, 73(1), e13219. [CrossRef]
- Agegnehu, G, Amede, T (2017) Integrated soil fertility and plant nutrient management in tropical agro-ecosystems: a review. Pedosphere. 27(4). 662-680. [CrossRef]
- Mbissik, A, Elghali, A, Ouabid, M, Raji, O, Bodinier, J-L, El Messbahi, H (2021) Alkali-hydrothermal treatment of K-rich Igneous rocks for their direct use as potassic fertilizers. Minerals. 11: 140. [CrossRef]
- Aliasgharpour M, Rahnamaye FM (2013) Trace Elements in Human Nutrition: A Review. J. Emerg. Health Care 115-128. http://intjmi.com/article-1-141-en.html.
- Dynarski KA, Bossio DA and Scow KM (2020) Dynamic Stability of Soil Carbon: Reassessing the “Permanence” of Soil Carbon Sequestration. Front. Environ. Sci. 8:514701. [CrossRef]
- Benson, SM, Cole, DR. (2008) CO2 Sequestration in Deep Sedimentary Formations. Elements 4 (5): 325–331. [CrossRef]
Figure 1.
Total content of inorganic C leached from soil columns fertilized or unfertilized with organic compound (OC) and with or without remineralizers after 10 monthly leaching events. NPK: control only with conventional fertilizer of greater solubility (NPK).
Figure 1.
Total content of inorganic C leached from soil columns fertilized or unfertilized with organic compound (OC) and with or without remineralizers after 10 monthly leaching events. NPK: control only with conventional fertilizer of greater solubility (NPK).
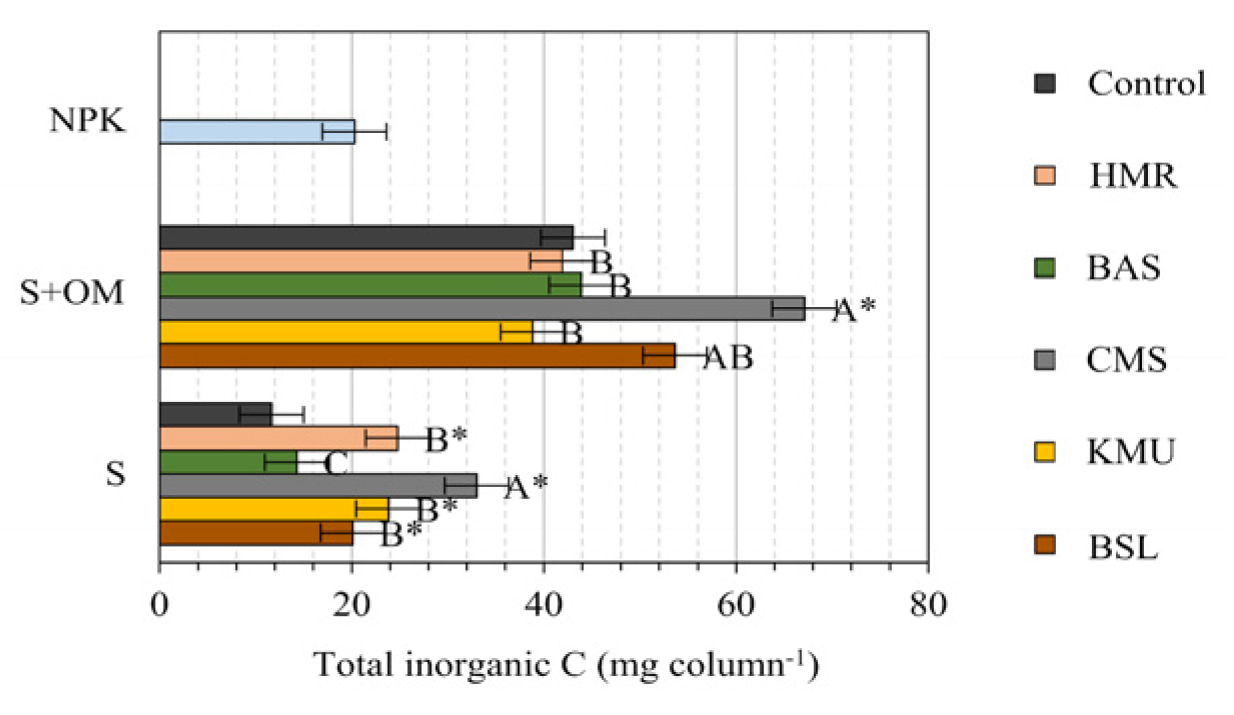
Figure 2.
Dry mass of bean plants and fresh mass of arugula plants fertilized or unfertilized with organic matter (OM) and in the presence or not of remineralizers. NPK: control only with conventional fertilizer of greater solubility (NPK).
Figure 2.
Dry mass of bean plants and fresh mass of arugula plants fertilized or unfertilized with organic matter (OM) and in the presence or not of remineralizers. NPK: control only with conventional fertilizer of greater solubility (NPK).
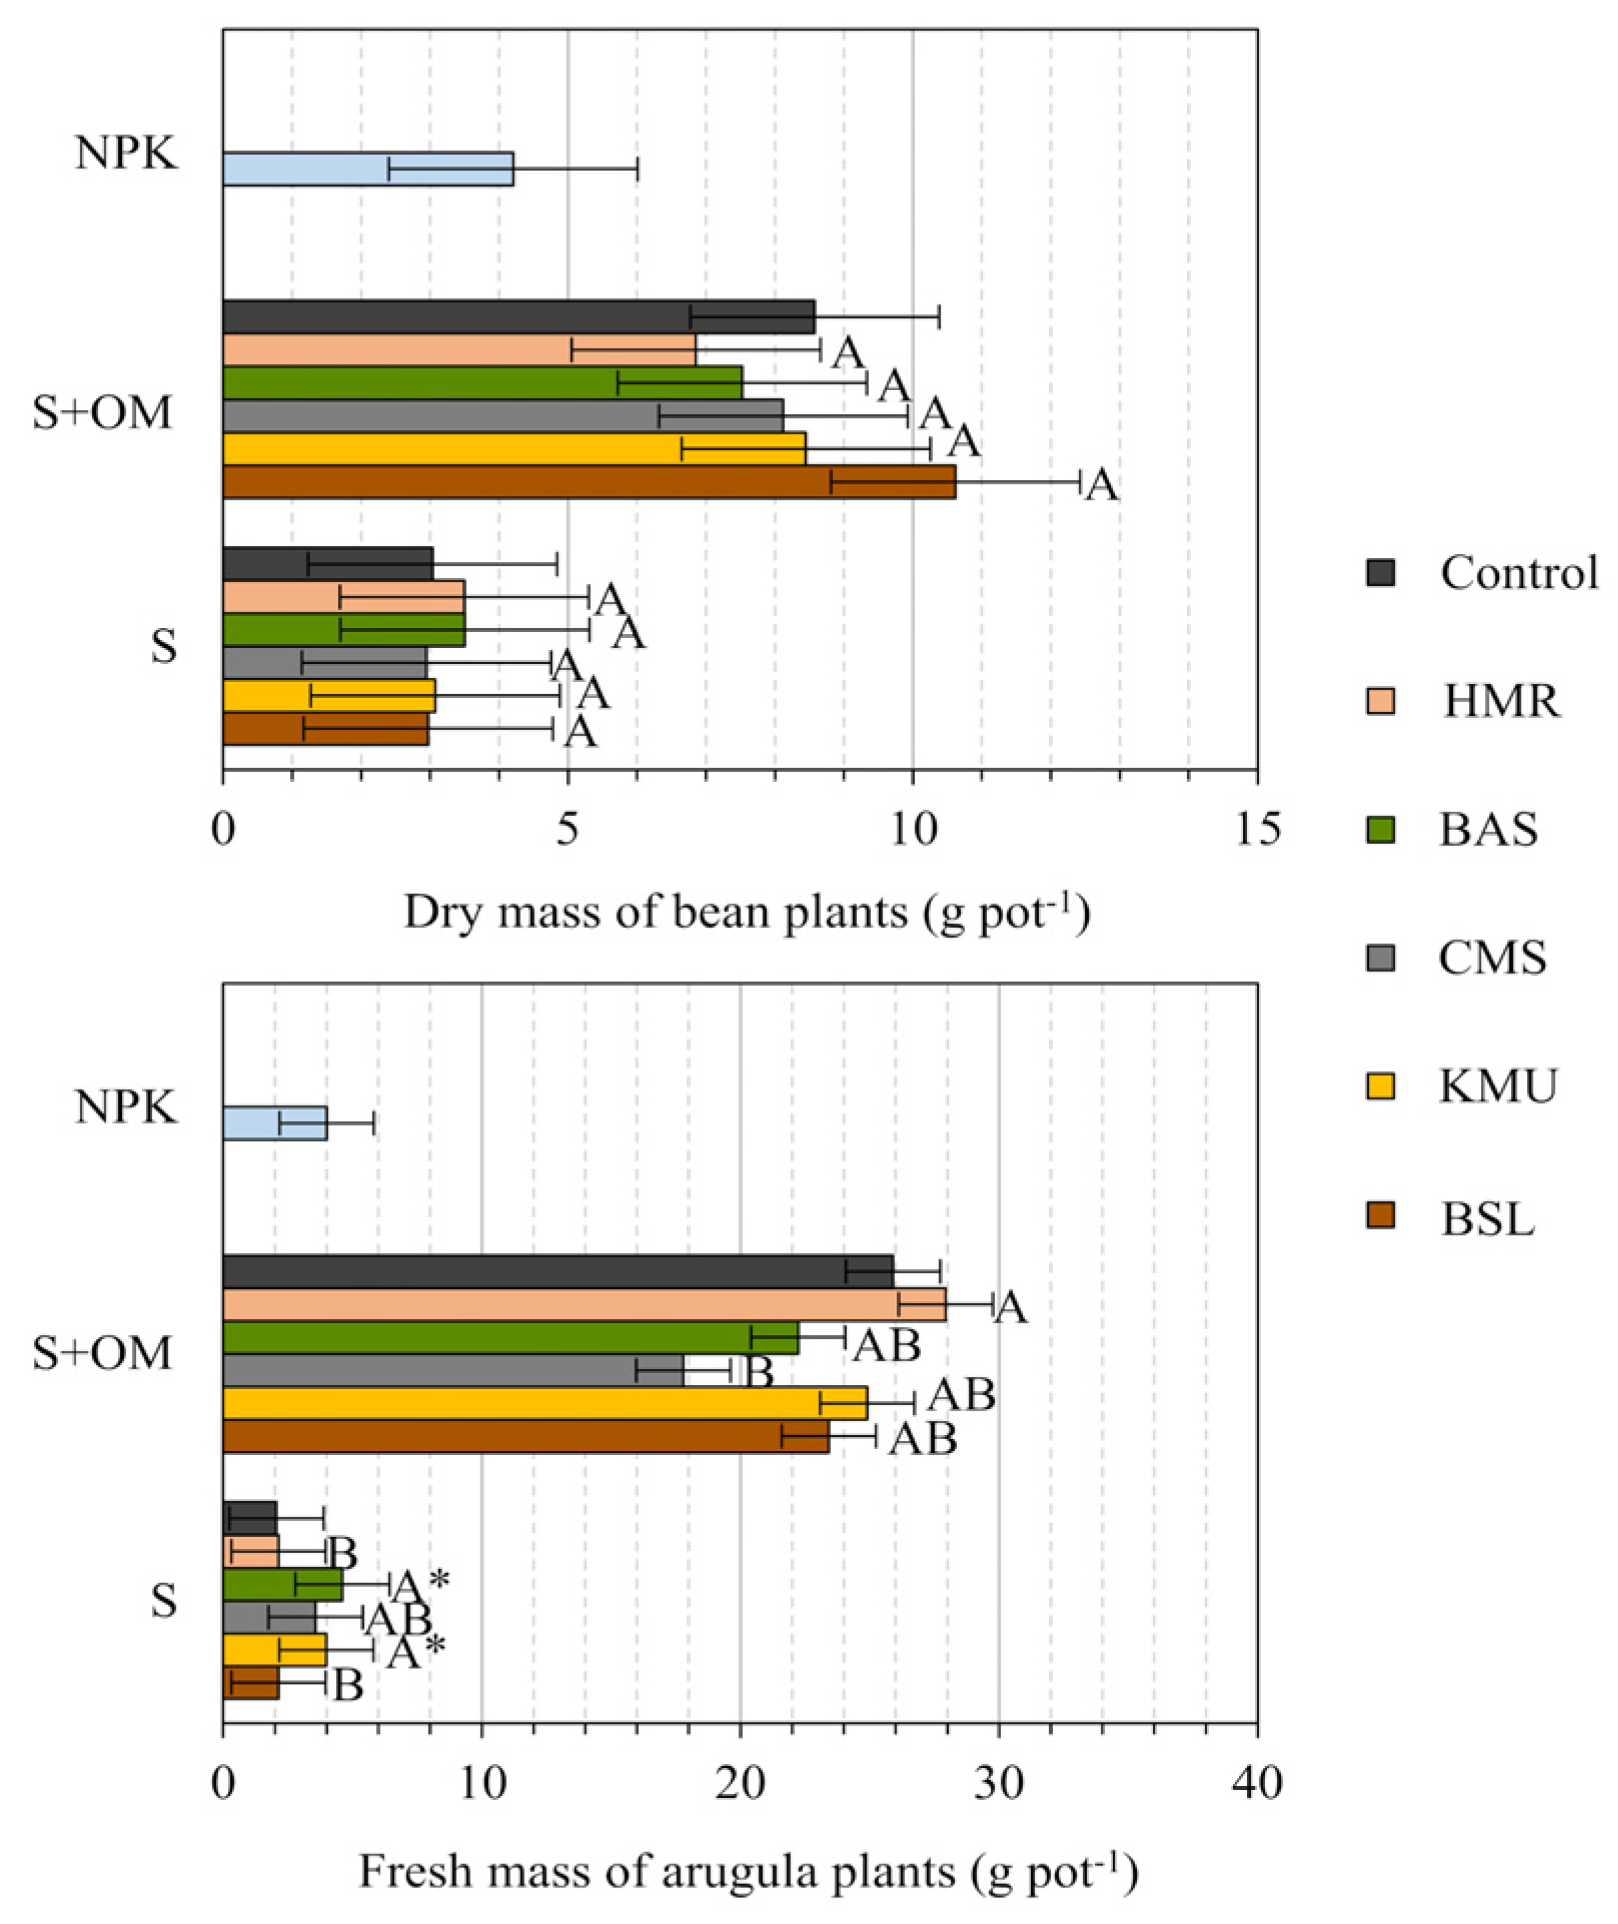

Table 1.
Results of analysis of macronutrients (%) and potentially toxic elements (PTEs) present in the rocks used in the experiment.
Table 1.
Results of analysis of macronutrients (%) and potentially toxic elements (PTEs) present in the rocks used in the experiment.
| Rocks | ............................ Macronutrients (%) ............................ | ...... PTEs (mg kg-1) ...... | ||||||||||||
| SiO2 | Al2O3 | Fe2O3 | CaO | MgO | K2O | P2O5 | Na2O | MnO | LOI | Hg | Cd | Pb | As | |
| BSL | 56.5 | 14.1 | 9.9 | 12.3 | 8 | 2.6 | 0.28 | 2.59 | 0.15 | 0,89 | <0.5 | <0.12 | <6.4 | <1 |
| KMU | 33.2 | 7.1 | 12.2 | 10.4 | 11.7 | 4.4 | 1.53 | Tr | 0.2 | 10,81 | <0.05 | <0.21 | 21.5 | 3 |
| CMC | 46.4 | 5.8 | 5.0 | 11.4 | 7.4 | 2.9 | 0.11 | 0.67 | 0.11 | 16,07 | <0.05 | <0.05 | <6.5 | <1 |
| BAS | 47.9 | 8,5 | 10.8 | 9.3 | 9,3 | 2.7 | 0.09 | 1.27 | 0.22 | 11,29 | <0.1 | <0.1 | <5.2 | <7.8 |
| HGR | 60.0 | 14.2 | 6.8 | 7.8 | 6.5 | 3.9 | 1.60 | 0.65 | 0.43 | 7,98 | <0.02 | <0.3 | <14 | <10 |
Legend: Basalt (BSL), kamafugite (KMU), chlorite-muscovite calc-schist (CMC), hydrothermalized calc-silicate rock (HGR), and biotite-actinolite schist (BAS).
Table 2.
Composition of manure used in the experiment.
| pH (CaCl2) | Humidity | C | N | K2O | P2O5 | Ca | Mg | S | Fe | MO | C/N Relation | Humic Acids | Fulvic Acids |
| a 65°C | ....................................................................... % ....................................................................... | ||||||||||||
| 7.84 | 7.5 | 20.4 | 1.42 | 1.1 | <1 | 1.07 | <0.5 | <1.0 | 1.9 | 35.2 | 14.37 | 4.29 | 5.84 |
Table 3.
Classification, origin, mineralogy, and main nutrients of the five rocks used in the experiments.
Table 3.
Classification, origin, mineralogy, and main nutrients of the five rocks used in the experiments.
| Rock Type | Origin/ Region | Geological Context | Mineralogy (main nutrients) |
| BSL1 | Rio Grande do Sul/S | Basaltic rocks (andesite-basalts) derived from the Paraná-Etendeka Magmatic Province, grayish in color with subcentimeter phenocrysts of plagioclase and pyroxene, immersed in a microcrystalline matrix. Lower Cretaceous | Volcanic glass (Ca, Mg, K) |
| Plagioclase CaAl2Si2O8 | |||
| Clinopyroxene Ca,Mg,Fe,Na)(Mg,Fe,Al) (Si,Al)2O6 | |||
| Saponite Ca0,5(Mg,Fe)3(Si,Al)4O10(OH)24H2O) | |||
| Magnetite Fe3O4 | |||
| Ilmenite FeTiO3 | |||
| Quartz - SiO2 | |||
|
KMU2* |
Minas Gerais/SW | Alkaline volcanic rock composed of lavas, tuffs and volcanic breccias of ultramafic and ultrapotassic nature, derived from the Alto Paranaiba Magmatic Province/Mata da Corda Group. Upper Cretaceous | Olivine - (Mg, Fe)2[SiO4] |
| Calcite CaCO3 | |||
| Diopside Ca(Mg,Fe)[SiO6] | |||
| Perovskite - Ca,Na,Fe2+Ce)(Ti,Nb)O3 | |||
| Phlogopite - K2(Mg,Fe2+)6[Si6Al20 ](OH,F)4 | |||
| Apatite - Ca5(PO4)3(OHCl) | |||
| Richterite - KNaCaMg5Si8O2 (OH)2 | |||
| Kalsilite - K(AlSi4) | |||
| Volcanic glass (Ca, Mg, K) | |||
| Ti magnetite - FeTiO3 | |||
| CMC3 | Goiás/MW | Rocks with schistosity marked by alternating muscovite and chlorite, in a lepidoblastic texture intercalated with crystals of calcite, dolomite, and quartz in a granoblastic texture belonging to the Canastra Group. Neoproterozoic. | Calcite/Dolomite – Ca Mg (CO3)2 |
| Quartz - SiO2 | |||
| Muscovite - KAl2Si3AlO10(OH, F)2 | |||
| Mg-Chlorite - Mg5Al (AlSi3O10) (OH)8 | |||
| Ilmenite/hematite - FeTiO3 / Fe2O3 | |||
| HGR4 | Bahia/NE | Mafic/ultramafic rocks and mylonitized calc-silicate rocks associated with hydrothermal processes linked to a high-potassium granitoid intrusion belonging to the Araras Complex. Paleoproterozoic. | Diopisium - CaMgSi2O6 |
| Apatite - Ca5(PO4)3(F,OH,Cl) | |||
| Hornblende - Ca2(Mg,Fe,Al)5(Al,Si)8O2(OH)2 | |||
| Talc - Mg6(Si8O20) (OH)4 | |||
| Enstatite – (Mg, Fe)2Si2O6) | |||
| Biotite – K (Mg, Fe2+)3[AlSi3O10] (OH, F)2 | |||
| Calcite - CaCO3 | |||
| Olivines – (Mg, Fe)2SiO4 | |||
| BAS5 | Tocantins/N | Mafic/ultramafic volcanic rocks from the Rio do Coco metavolcanic-sedimentary sequence composed of biotite-schists and hydrothermalized amphibolites with a preferential biotite-phlogopite or actinolite-tremolite composition. Paleoproterozoic | Biotite – K (Mg, Fe2+)3[AlSi3O10] (OH, F)2 |
| Actinolite - Ca2Al2(Fe3+, Al) O(SiO4) (Si2O7) (OH) | |||
| Plagioclase - (Na,Ca)Al(Si,Al)Si2O8 | |||
| Chlorite - (Mg,Al,Fe)12[(Si,Al)8O20](OH)16 | |||
| Calcite - CaCO3 | |||
| Allanite (Ce)2(Fe2+Fe3+Al)3(SiO4) (Si2O7) O (OH) | |||
| Oxyhydroxide -Fe Fex (O, OH)y | |||
| Opaques |
Table 4.
pH values in the leachates collected throughout the ten leaching events of the experiment.
Table 4.
pH values in the leachates collected throughout the ten leaching events of the experiment.
| BSL | KMU | CMC | BAS | MGR. | Controls | NPK | |||||||||
| 1st | S | 8.25 | AB | 8.08 | BC | 8.50 | A | 8.34 | AB | 7.82 | C | 8.64 | 6.61 | † | |
| S+OM | 7.90 | AB | 7.93 | AB | 8.20 | A | 7.91 | AB | 7.74 | B | 7.97 | ||||
| 2nd | S | 7.75 | B | 7.86 | B | 8.46 | A* | 7.77 | B | 8.26 | A* | 7.74 | 6.89 | † | |
| S+OM | 8.36 | A | 8.08 | A | 8.32 | A | 8.51 | A | 8.30 | A | 8.43 | ||||
| 3rd | S | 7.14 | C | 7.22 | C | 7.63 | B | 7.12 | C | 8.24 | A* | 7.32 | 6.87 | † | |
| S+OM | 7.94 | BC | 7.77 | C | 8.12 | ABC | 8.27 | AB | 8.53 | A* | 7.79 | ||||
| 4th | S | 7.20 | B | 7.36 | B | 7.84 | A* | 7.29 | B | 8.09 | A* | 7.15 | 7.67 | ||
| S+OM | 7.89 | A* | 7.83 | A* | 8.16 | A* | 8.10 | A* | 7.90 | A* | 7.25 | ||||
| 5th | S | 6.77 | B | 6.83 | B | 7.09 | A* | 6.86 | B | 7.25 | A* | 6.75 | 7.15 | ||
| S+OM | 7.19 | BC | 7.00 | C | 8.04 | A* | 7.85 | AB* | 7.25 | BC | 7.01 | ||||
| 6th | S | 6.98 | C* | 7.02 | BC* | 7.35 | B* | 7.09 | BC* | 7.70 | A* | 6.52 | 7.53 | † | |
| S+OM | 7.34 | B* | 7.23 | B | 7.98 | A* | 8.01 | A* | 7.51 | B* | 7.06 | ||||
| 7th | S | 7.09 | B* | 7.28 | B* | 7.97 | A* | 7.87 | A* | 7.78 | A* | 6.44 | 7.94 | † | |
| S+OM | 8.04 | AB* | 8.12 | AB* | 8.36 | A* | 8.24 | AB* | 7.93 | B* | 6.99 | ||||
| 8th | S | 6.51 | B | 6.91 | AB | 7.27 | A | 7.11 | A | 7.18 | A | 6.92 | 6.80 | ||
| S+OM | 7.26 | A | 7.36 | A | 7.38 | A | 7.40 | A | 7.29 | A | 7.40 | ||||
| 9th | S | 6.42 | C | 6.81 | B | 7.22 | A* | 7.10 | AB | 7.14 | AB | 6.85 | 7.55 | † | |
| S+OM | 7.21 | A | 7.57 | A* | 7.42 | A* | 7.28 | A | 7.27 | A | 6.95 | ||||
| 10th | S | 6.84 | B | 6.92 | B | 7.56 | A* | 7.18 | B* | 7.08 | B | 6.73 | 7.19 | ||
| S+OM | 7.50 | A* | 7.62 | A* | 7.88 | A* | 7.75 | A* | 7.61 | A* | 6.87 | ||||
Measures followed by * differ from their respective control by the Holm test at a 5% probability of error α (k=11 comparisons). Measures of the NPK treatment followed by “†” differ from the S+R treatment measures by the Holm test at a 5% probability of error α (k=11 comparisons). Measures followed, in the line, by different letters differ from each other by the SNK test at a 5% probability of alpha error (exploratory test only comparing between rocks). Legend: Basalt (BSL), kamafugite (KMU), chlorite-muscovite calc-schist (CMC), hydrothermalized calc-silicate rock (HGR), and biotite-actinolite schist (BAS).
Table 5.
Electrical conductivity (EC) of leachates collected over the ten experimental leaching events (expressed in μS/cm).
Table 5.
Electrical conductivity (EC) of leachates collected over the ten experimental leaching events (expressed in μS/cm).
| BSL | KMU | CMC | BAS | HGR | Controls | NPK | |||||||||
| 1st | S | 364.0 | A | 394.5 | A | 429.5 | A | 300.8 | A | 326.8 | A | 299.3 | 1512.8 | † | |
| S+OM | 946.5 | A | 944.7 | A | 836.8 | A | 859.0 | A | 884.3 | A | 751.5 | ||||
| 2nd | S | 123.5 | C | 118.5 | C | 239.6 | A* | 125.3 | C | 171.3 | B* | 99.9 | 878.0 | † | |
| S+OM | 378.3 | AB | 299.0 | B | 507.3 | A | 345.8 | AB | 402.3 | AB | 344.0 | ||||
| 3rd | S | 151.3 | AB | 133.8 | AB | 235.8 | A | 108.1 | B | 176.4 | AB | 165.7 | 456.0 | † | |
| S+OM | 330.8 | A | 307.3 | A | 429.0 | A | 361.3 | A | 418.0 | A | 347.2 | ||||
| 4th | S | 120.1 | AB | 114.6 | AB | 192.6 | A* | 94.8 | B | 136.8 | AB | 103.9 | 235.0 | † | |
| S+OM | 283.0 | A | 256.0 | A | 379.3 | A | 321.3 | A | 349.3 | A | 307.0 | ||||
| 5th | S | 113.1 | B | 107.7 | B | 178.5 | A | 101.6 | B | 148.8 | A | 135.8 | 162.5 | ||
| S+OM | 230.7 | B | 234.0 | B | 409.3 | A | 281.8 | AB | 344.5 | A | 299.8 | ||||
| 6th | S | 116.4 | AB | 113.9 | B | 182.9 | A* | 96.3 | B | 122.9 | AB | 97.0 | 127.2 | ||
| S+OM | 252.3 | A | 239.8 | A | 386.5 | A | 261.8 | A | 318.3 | A | 298.3 | ||||
| 7th | S | 104.6 | B | 106.4 | B | 164.0 | A | 93.0 | B | 111.1 | B | 114.9 | 106.2 | ||
| S+OM | 216.1 | A | 214.3 | A | 319.6 | A | 247.5 | A | 287.8 | A | 249.2 | ||||
| 8th | S | 94.5 | B | 99.2 | B | 143.4 | A | 89.5 | B | 103.6 | B | 116.0 | 94.9 | ||
| S+OM | 190.5 | A | 191.5 | A | 263.0 | A | 221.2 | A | 242.9 | A | 198.3 | ||||
| 9th | S | 134.2 | B | 131.2 | B | 200.3 | A* | 112.6 | BC | 84.7 | C | 139.5 | 108.7 | ||
| S+OM | 179.8 | B | 194.1 | B | 279.5 | A | 192.8 | B | 224.5 | AB | 262.7 | ||||
| 10th | S | 106.5 | BC | 126.5 | B | 182.0 | A* | 100.3 | C | 87.7 | C | 119.3 | 105.3 | ||
| S+OM | 174.4 | A | 186.8 | A | 238.0 | A | 229.8 | A | 210.4 | A | 231.3 | ||||
Measures followed by * differ from their respective control by the Holm test at a 5% probability of error α (k=11 comparisons). Measures of NPK treatment followed by “†” differ from the measures of S+R treatments by the Holm test at a 5% probability of error α (k=11 comparisons). Measures followed, in the line, by different letters differ from each other by the SNK test at a 5% probability of alpha error (exploratory test comparing only between rocks).
Table 6.
Total nutrient contents leached from the columns over the 10 leaching events of the experiment.
Table 6.
Total nutrient contents leached from the columns over the 10 leaching events of the experiment.
| BSL | KMU | CMC | BAS | HGR | Controls | NPK | |||||||||
| Ca | S | 14.5 | B | 17.0 | B | 22.9 | A | 8.0 | C | 14.4 | B | 52.7 | 84.5 | † | |
| mg column-1 | S+OM | 34.5 | AB | 30.4 | B | 48.0 | A | 30.4 | B | 35.0 | AB | 109.7 | |||
| Mg | S | 14.5 | AB | 17.0 | A | 22.9 | A* | 8.0 | B | 14.4 | AB | 10.8 | 29.8 | † | |
| mg column-1 | S+OM | 34.5 | B | 30.4 | B | 49.2 | A* | 30.4 | B | 35.0 | B | 34.0 | |||
| K | S | 103.1 | B | 90.7 | B | 113.4 | AB | 150.7 | A | 134.0 | AB | 121.7 | 71.2 | † | |
| mg column-1 | S+OM | 391.9 | A* | 401.1 | A* | 408.3 | A* | 430.4 | A* | 423.5 | A* | 87.7 | |||
| P | S | 0.06 | B | 0.09 | B | 0.06 | B | 0.08 | B | 0.13 | A* | 0.06 | 0.17 | ||
| mg column-1 | S+OM | 0.12 | A | 0.11 | A | 0.15 | A | 0.12 | A | 0.15 | A | 0.09 | |||
| S | S | 20.8 | A | 21.6 | A | 20.9 | A | 24.7 | A | 25.7 | A | 17.1 | 47.5 | † | |
| mg column-1 | S+OM | 21.8 | B | 41.0 | AB | 26.7 | AB | 35.2 | AB | 43.0 | A | 29.7 | |||
Measures followed by * differ from their respective control by the Holm test at a 5% probability of error α (k=11 comparisons). Measures of the NPK treatment followed by “†” differ from the measures of the S+Rock treatments by the Holm test at a 5% probability of error α (k=11 comparisons). Measures followed, in the line, by different letters differ from each other by the SNK test at a 5% probability of alpha error (exploratory test comparing only between rocks).
Table 7.
Results of soil fertility analysis at the end of the leaching column experiment.
| BSL | KMU | CMC | BAS | HGR | Controls | NPK | |||||||||
| pH CaCl2 | S | 4.40 | C | 5.56 | A* | 5.43 | AB* | 5.39 | AB* | 5.35 | B | 5.19 | 4.84 | † | |
| CV (%) 5.7 | S+OM | 5.25 | B | 5.05 | C | 5.53 | A* | 5.63 | A* | 5.26 | B | 4.97 | |||
| Ca (cmolc dm-3) | S | 2.28 | BC | 2.45 | B* | 3.47 | A* | 2.03 | C | 2.73 | B* | 1.99 | 1.19 | † | |
| CV (%) 2.3 | S+OM | 2.52 | B | 2.01 | C | 3.27 | A* | 2.60 | B | 2.81 | AB* | 2.20 | |||
| Mg (cmolc dm-3) | S | 0.47 | C | 0.54 | C | 0.75 | A* | 0.33 | D | 0.64 | B* | 0.41 | 0.37 | † | |
| CV (%) 6.4 | S+OM | 0.73 | B* | 0.63 | B | 0.92 | A* | 0.69 | B | 0.87 | A* | 0.63 | |||
| K (mg dm-3) | S | 34.7 | B | 41.0 | B | 39.6 | B | 190.5 | A* | 42.5 | B | 39.0 | 60.6 | ||
| CV (%) 11.2 | S+OM | 70.6 | C | 57.3 | C | 68.6 | C | 163.6 | A* | 84.7 | B* | 63.5 | |||
| P (mg dm-3) | S | 9.45 | B | 41.69 | A* | 3.50 | B | 1.41 | C | 4.93 | B* | 3.04 | 10.56 | ||
| CV (%) 32.8 | S+OM | 4.85 | BC | 28.99 | A* | 3.39 | C | 3.38 | C | 6.10 | AB | 4.08 | |||
| CTC (cmolc dm-3) | S | 4.95 | BC* | 5.10 | AB* | 5.53 | A* | 4.65 | C | 5.50 | A* | 4.48 | 4.55 | † | |
| CV (%) 28.4 | S+OM | 5.35 | A* | 5.28 | A* | 5.63 | A* | 5.35 | A* | 5.75 | A* | 4.60 | |||
| Fe (mg dm-3) | S | 31.6 | A | 24.9 | B | 45.6 | A* | 56.9 | A* | 22.9 | B | 24.4 | 17.8 | † | |
| CV (%) 0.22 | S+OM | 38.6 | A | 16.8 | B | 44.2 | A | 48.7 | A | 21.3 | B | 40.8 | |||
| B (mg dm-3) | S | 0.14 | A | 0.13 | AB | 0.11 | BC | 0.10 | C | 0.15 | A | 0.14 | 0.13 | ||
| CV (%) 10.1 | S+OM | 0.19 | A | 0.14 | B | 0.15 | B | 0.16 | B | 0.20 | A | 0.17 | |||
| Zn (mg/dm³) | S | 2.02 | A | 2.01 | A | 2.03 | A | 1.18 | B | 2.15 | A | 2.06 | 1.03 | † | |
| CV (%) 25.7 | S+OM | 3.10 | A | 2.33 | B | 2.67 | AB | 3.34 | A | 2.80 | AB | 3.10 | |||
Measures followed by * differ from their respective control by the Holm test at a 5% probability of error α (k=11 comparisons). Measures of the NPK treatment followed by “†” differ from the measures of the S+Rock treatments by the Holm test at a 5% probability of error α (k=11 comparisons). Measures followed, in the line, by different letters differ from each other by the SNK test at a 5% probability of alpha error (exploratory test comparing only between rocks).
Table 8.
Total inorganic carbon (TIC) content (mg L-1) in leachates collected over ten cycles.
| BSL | KMU | CMS | BAS | HMR | Controls | NPK | |||||||||
| 1st | S | 12.32 | A | 11.68 | A | 14.18 | A* | 5.73 | B | 15.58 | A* | 5.83 | 10.74 | ||
| S+OM | 27.88 | A | 23.95 | A | 20.65 | A | 17.98 | A | 23.45 | A | 20.93 | ||||
| 2nd | S | 5.63 | B | 6.52 | AB | 10.35 | A* | 6.40 | AB | 10.18 | AB* | 4.86 | 9.12 | ||
| S+OM | 18.78 | A | 13.45 | A | 16.65 | A | 17.73 | A | 13.34 | A | 14.70 | ||||
| 3rd | S | 10.23 | AB* | 7.54 | B* | 6.47 | B* | 9.38 | AB* | 14.98 | A* | 3.60 | 14.05 | ||
| S+OM | 7.87 | B | 6.92 | B | 7.80 | B | 9.08 | B | 19.05 | A | 9.70 | ||||
| 4th | S | 5.31 | B | 6.82 | AB* | 8.33 | A* | 5.28 | B | 6.69 | AB* | 4.13 | 4.96 | ||
| S+OM | 14.13 | A | 8.98 | B | 10.45 | AB | 11.48 | AB | 9.78 | AB | 11.48 | ||||
| 5th | S | 3.72 | B | 5.06 | B | 7.20 | A* | 2.99 | B | 4.20 | B | 3.66 | 2.98 | ||
| S+OM | 10.83 | A | 9.15 | A | 11.18 | A | 10.38 | A | 8.91 | A | 9.63 | ||||
| 6th | S | 3.15 | B | 4.40 | B | 6.54 | A* | 2.62 | B | 4.09 | B | 3.53 | 2.66 | ||
| S+OM | 8.05 | A | 7.31 | A | 8.22 | A | 8.50 | A | 8.22 | A | 6.84 | ||||
| 7th | S | 0.92 | B | 1.44 | B | 4.45 | A* | 1.12 | B | 1.39 | B | 1.19 | 0.89 | ||
| S+OM | 5.73 | A | 4.50 | A | 6.21 | A | 5.83 | A | 5.36 | A | 5.31 | ||||
| 8th | S | 4.74 | AB | 5.85 | AB | 10.01 | A* | 2.37 | B | 3.73 | AB | 2.19 | 1.75 | ||
| S+OM | 15.75 | AB | 10.78 | AB | 29.20 | A* | 15.53 | AB | 7.95 | B | 9.71 | ||||
| 9th | S | 4.49 | B | 6.95 | B* | 14.64 | A* | 2.88 | B | 3.80 | B | 1.50 | 2.04 | † | |
| S+OM | 14.23 | A | 9.50 | A | 23.18 | A | 11.02 | A | 8.74 | A | 11.28 | ||||
| 10th | S | 2.59 | B | 4.18 | B | 10.13 | A* | 2.18 | B | 4.39 | B | 2.33 | 2.11 | ||
| S+OM | 16.78 | AB | 8.48 | B | 24.85 | A* | 15.79 | AB | 10.09 | B | 13.11 | ||||
Measures followed by * differ from their respective control by the Holm test at a 5% probability of error α (k=11 comparisons). Measures of NPK treatment followed by “†” differ from the mean of S+R treatments by the Holm test at a 5% probability of error α (k=11 comparisons). Measures followed, in the line, by different letters differ from each other by the SNK test at a 5% probability of alpha error (exploratory test comparing only between rocks).
Table 9.
Results of chemical analyses of soils fertilized or not with different rocks in the presence or absence of organic compound at the end of agronomic tests. Measures followed by * differ from their respective control by the Holm test at a 5% error probability α k=11 comparisons). Measures of the NPK treatment followed by “†” differ from the measures of the S+R treatments by the Holm test at a 5% probability of error α (k=11 comparisons). Measures followed, in the line, by different letters differ from each other by the SNK test at a 5% probability of alpha error (exploratory test comparing only between rocks).
| BSLt | KMU | CMC | BAS | HGR | Controls | NPK | ||||||||
| pH (H2O) | S | 6.48 | B* | 6.55 | B* | 7.19 | A* | 7.08 | A* | 6.57 | B* | 5.83 | 6.08 | † |
| CV (%) 2.3 | S+OM | 6.30 | C* | 6.28 | C* | 7.10 | A* | 6.82 | B* | 6.46 | C* | 6.22 | ||
| P (mg dm-3) | S | 9.5 | B* | 76.5 | A* | 2.7 | C | 1.8 | C* | 6.5 | B* | 0.4 | 11.5 | † |
| CV (%) 26.8 | S+OM | 13.7 | AB* | 73.0 | A* | 9.7 | BC* | 6.5 | C* | 13.3 | BC* | 6.1 | ||
| K (mg dm-3) | S | 185 | B | 232 | AB* | 182 | B | 298 | A* | 179 | B | 136 | 195 | |
| CV (%) 24.3 | S+OM | 127 | C | 212 | ABC | 232 | AB | 294 | A* | 194 | BC | 198 | ||
| Ca (cmolcdm-3) | S | 1.98 | B* | 2.31 | B* | 3.3 | A* | 2.61 | B* | 2.34 | B* | 0.97 | 1.5 | † |
| CV (%) 17.6 | S+OM | 2.64 | B* | 2.86 | B* | 5.09 | A* | 3.14 | B* | 3.09 | B* | 2.5 | ||
| Mg (cmolcdm-3) | S | 0.51 | A | 0.71 | A* | 0.73 | A* | 0.56 | A | 0.88 | A* | 0.26 | 0.66 | |
| CV (%) 32.4 | S+OM | 1.17 | A | 1.32 | A | 1.37 | A | 1.12 | A | 1.37 | A | 1.07 | ||
| P (cmolc dm-3) | S | 4.9 | A | 5.45 | A* | 4.73 | A | 4.88 | A | 5.45 | B | 4.2 | 4.95 | |
| CV (%) 13.5 | S+OM | 5.53 | B | 6.45 | AB | 7.53 | A* | 6.28 | AB | 6.33 | AB | 5.85 | ||
| B (mg dm-3) | S | 0.11 | A | 0.15 | A* | 0.1 | A | 0.16 | A* | 0.11 | A | 0.1 | 0.11 | |
| CV (%) 39.9 | S+OM | 0.1 | B | 0.13 | AB | 0.17 | A | 0.18 | A | 0.13 | AB | 0.16 | ||
| Zn (mg dm-3) | S | 1.77 | A* | 1.82 | A* | 1.45 | A* | 1.83 | A* | 1.56 | A* | 0.59 | 0.85 | |
| CV (%) 22.9 | S+OM | 4.45 | AB* | 3.48 | B* | 5.28 | A* | 4.57 | AB* | 4.29 | AB* | 5.02 | ||
| Fe (mg dm-3) | S | 45.6 | A* | 23.3 | B* | 52.6 | A* | 57.8 | A* | 23.7 | B* | 32.3 | 27 | † |
| CV (%) 0.4 | S+OM | 48.8 | B* | 31.1 | C* | 100.1 | A* | 55.8 | B* | 25.7 | D* | 55.6 | ||
| Mn (mg dm-3) | S | 7.54 | C* | 11.54 | B* | 12.43 | B* | 8.78 | BC* | 17.54 | A* | 2.8 | 4.12 | † |
| CV (%) 7.5 | S+OM | 8.93 | B* | 12.53 | B* | 22.55 | A* | 10.01 | B* | 23.93 | A* | 7.08 | ||
| Cu (mg dm-3) | S | 0.5 | AB* | 0.62 | AB* | 0.22 | B | 0.89 | A* | 0.65 | AB* | 0.16 | 0.29 | |
| CV (%) 25.3 | S+OM | 0.76 | A | 0.64 | A | 0.55 | A | 0.78 | A | 1.1 | A | 0.53 | ||
We were able to verify that Ca2+ was the element with the greatest increases of all rocks in relation to the control treatments S, S+OM and S+NPK in soils that supported the cycle of three agricultural crops. Similar to the results for the column soils, the S+R treatments obtained better performance for this nutrient in the pot experiments, for all rocks with or without OM added. Mg2+ had a slightly different reaction as significant differences were more recurrent in treatments that did not contain OM, especially for the KMU, CMS and HGR rocks.
Table 10.
Nutrient levels in the dry matter of carrots fertilized or unfertilized with organic compost (OC) and in the presence (or not) of five different rock powders (third successive crop after application of treatments).
Table 10.
Nutrient levels in the dry matter of carrots fertilized or unfertilized with organic compost (OC) and in the presence (or not) of five different rock powders (third successive crop after application of treatments).
| BSL | KMU | CMC | BAS | HGR | Controls | NPK | |||||||||
| N | S | 4.85 | A | 10.20 | A | 3.81 | A | 5.99 | A | 7.07 | A | 7.14 | 7.65 | ||
| g kg-1 | S+OM | 6.37 | A | 6.50 | A | 4.46 | A | 6.24 | A | 6.35 | A | 9.55 | |||
| P | S | 1.86 | A | 2.49 | A* | 2.18 | A* | 2.11 | A | 2.17 | A* | 1.19 | 1.50 | ||
| g kg-1 | S+OM | 2.62 | B | 3.24 | AB | 2.56 | B | 2.86 | AB | 3.71 | A | 3.76 | |||
| K | S | 27.2 | A* | 26.7 | A* | 26.4 | A* | 25.8 | A* | 29.5 | A* | 7.8 | 16.5 | † | |
| g kg-1 | S+OM | 30.2 | A | 30.8 | A | 29.2 | A | 26.5 | A | 27.3 | A | 34.5 | |||
| Ca | S | 3.60 | A* | 4.09 | A* | 4.18 | A* | 4.17 | A* | 4.15 | A* | 2.49 | 2.92 | † | |
| g kg-1 | S+OM | 4.76 | A | 4.04 | A | 4.26 | A | 4.03 | A | 4.13 | A | 4.80 | |||
| Mg | S | 1.82 | A | 1.89 | A | 1.84 | A | 1.87 | A | 2.15 | A | 2.00 | 2.76 | † | |
| g kg-1 | S+OM | 2.59 | A | 2.92 | A | 2.21 | A | 2.30 | A | 2.94 | A | 2.91 | |||
| S | S | 1.00 | A | 1.13 | A | 1.00 | A | 1.01 | A | 1.94 | A* | 0.76 | 1.63 | ||
| g kg-1 | S+OM | 1.30 | A | 1.50 | A | 1.27 | A | 1.29 | A | 1.91 | A | 1.68 | |||
| B | S | 23.7 | A* | 23.5 | A* | 24.2 | A* | 24.1 | A* | 0.0 | B | 0.0 | 0.0 | † | |
| mg kg-1 | S+OM | 21.8 | A | 24.0 | A | 22.3 | A | 23.0 | A | 0.0 | B | 25.3 | |||
| Zn | S | 36.4 | AB | 37.7 | AB | 28.2 | B | 32.2 | AB | 45.2 | A* | 26.1 | 17.0 | † | |
| mg kg-1 | S+OM | 34.8 | A | 36.3 | A | 30.6 | A | 34.5 | A | 46.7 | A | 39.1 | |||
| Fe | S | 616 | B | 533 | B | 1986 | A* | 566 | B | 664 | B | 578 | 549 | ||
| mg kg-1 | S+OM | 1709 | A* | 734 | AB | 1352 | A* | 1008 | A* | 584 | B | 603 | |||
| Mn | S | 13.0 | B | 17.5 | AB | 13.3 | B | 16.2 | AB | 21.0 | A | 15.2 | 11.4 | ||
| mg kg-1 | S+OM | 23.6 | A | 21.6 | A | 11.7 | B | 12.7 | B | 46.3 | A | 18.6 | |||
| Cu | S | 13.1 | A | 12.1 | A | 11.6 | A | 12.6 | A | 14.4 | A* | 6.7 | 3.8 | † | |
| mg kg-1 | S+OM | 13.4 | A | 13.8 | A | 9.1 | A | 12.0 | A | 27.0 | A | 11.5 | |||
Table 11.
Comparative Values of Carbon Capture by Rock Type, Incremental Efficiency with OM and Capture per tones.
Table 11.
Comparative Values of Carbon Capture by Rock Type, Incremental Efficiency with OM and Capture per tones.
| Rock Type | Theoretical Potential (kg CO2/t)* | Net Carbon Removal (S+R) (kg C/ha) |
Net Carbon Removal (S+R+OM) (kg C/ha) |
Incremental Efficiency with OM1 (%) | Real Capture Equivalent (S+R+OM) (kg CO2/ha)1 | Capture per t (kg CO2/t - 20t)3 |
| CMC | 266 | 28,47 | 89,48 | 214.3% | 328,39 | 16,42 |
| BSL | 427 | 11,27 | 71,52 | 534.6% | 262,47 | 13,12 |
| BAS | 285 | 19,09 | 58,51 | 206.5% | 214,73 | 10,74 |
| HGR | 338 | 17,52 | 55,91 | 219.1% | 205,19 | 10,26 |
| KMU | 302 | 16,19 | 51,76 | 219.7% | 189,96 | 9,5 |
| 1 | The columns were 25 cm in length and 10 cm in diameter, and were filled with 1.5 kg of soil or soil+OM or soil+REM. Considering that 1 ha corresponds to approximately 2,000,000 kg of soil (surface layer of 0-20 cm, assuming Oxisol density as ~1 g/cm³), the 20 t/ha dosage corresponds to 10 g/kg. Therefore, for the 1.5 kg in the column, 15 g of rock dust were added. |
Disclaimer/Publisher’s Note: The statements, opinions and data contained in all publications are solely those of the individual author(s) and contributor(s) and not of MDPI and/or the editor(s). MDPI and/or the editor(s) disclaim responsibility for any injury to people or property resulting from any ideas, methods, instructions or products referred to in the content. |
© 2026 by the authors. Licensee MDPI, Basel, Switzerland. This article is an open access article distributed under the terms and conditions of the Creative Commons Attribution (CC BY) license (http://creativecommons.org/licenses/by/4.0/).
Copyright: This open access article is published under a Creative Commons CC BY 4.0 license, which permit the free download, distribution, and reuse, provided that the author and preprint are cited in any reuse.


