
Submitted:
03 March 2025
Posted:
03 March 2025
You are already at the latest version
Abstract
Soil degradation in mining-affected regions – characterized by nutrient depletion, in-creased salinization, and heavy metal accumulation–poses serious risks to ecosystem stability and agricultural productivity. We conducted a comprehensive field study analyzing soil profiles using chemical, agrochemical, granulometric, and salinization assessments, along with heavy metal analysis. The aim of this work is to characterize the vertical distribution of nutrients and contaminants in these soils and to provide recommendations for effective remediation and sustainable land management. Our results show that the upper organic-rich layers exhibit significantly higher nutrient levels that sharply decline with depth, while heavy metals such as lead and copper are markedly elevated in certain profiles–especially in tailings soils, where contamination exceeds permissible limits by multiple folds. Additionally, granulometric analysis revealed a predominance of medium sand, which enhances permeability but limits water retention, and salinization increases with depth due to mineral weathering processes. Overall, our work provides critical insights necessary for developing targeted remediation strategies and sustainable practices to restore degraded ecosystems in mining regions.
Keywords:
mineral resources
; open-pit mining
; environment
; heavy metals
; soil
; contamination
1. Introduction
Mining plays a pivotal role in global economic development, providing essential raw materials for various industries, including energy production, infrastructure, and manufacturing [1,2]. However, alongside its economic benefits, mining operations-particularly open-pit methods–pose significant environmental threats. One of the most pressing concerns is the degradation of soil quality due to heavy metal contamination, leading to long-term ecological and agricultural consequences. The increasing scale of mining activities has resulted in substantial land disturbances, with direct implications for soil degradation, water pollution, and biodiversity loss [3,4].
Open-pit mining generates vast amounts of waste materials, including overburden, tailings, and processing residues, which often contain elevated levels of heavy metals such as lead (Pb), cadmium (Cd), arsenic (As), copper (Cu), and zinc (Zn). These toxic elements, once released into the environment, infiltrate soil layers, altering their chemical composition and reducing fertility. Contaminated soils in mining regions exhibit poor nutrient content, disrupted microbial communities, and reduced vegetation cover, thereby exacerbating desertification processes [5,6,7]. For instance, Johnson et al. (2018) studied the long-term effects of heavy metal accumulation on soil quality in mining areas and found that the persistence of these contaminants significantly hinders natural recovery processes [8]. The ecological impact is particularly severe in arid and semi-arid regions, where natural soil regeneration occurs at an extremely slow rate due to limited water availability and harsh climatic conditions.
Kazakhstan, known for its rich mineral resources, predominantly employs open-pit mining methods, particularly in its arid and semi-arid regions. These areas, characterized by fragile ecosystems and low organic matter accumulation, are highly susceptible to environmental degradation. In such landscapes, mining-induced soil disturbances significantly hinder natural recovery processes, resulting in long-term ecological consequences. Studies have shown that once mining operations cease, the abandoned sites remain barren for decades due to extreme soil infertility and persistent contamination by heavy metals [9].
The process of soil degradation in mining areas is influenced by multiple factors, including the mineral composition of extracted ores, waste disposal methods, and regional climatic conditions. Heavy metals introduced into the soil accumulate over time, altering physical and chemical properties such as pH levels, cation exchange capacity (CEC), and organic matter content. In the absence of effective remediation strategies, these contaminants can spread through surface runoff and groundwater infiltration, posing risks to nearby agricultural lands and water sources [2,10]. Moreover, Chen et al. (2019) studied remediation strategies for mining-affected soils and highlighted the potential of phytoremediation and soil amendments to reduce heavy metal mobility [11]. Soil contamination by heavy metals is not only an environmental concern but also a significant socio-economic issue. In agricultural regions adjacent to mining sites, soil degradation directly affects crop productivity, food safety, and local livelihoods. Also, García et al. (2016) studied the impacts of heavy metal contamination on soil microbial communities, demonstrating a marked reduction in microbial biomass and enzymatic activities in affected soils [12]. Prolonged exposure to heavy metals also has severe health implications for humans and wildlife, contributing to bioaccumulation in the food chain and increasing the prevalence of toxicological disorders [13,14].
Given these challenges, it is crucial to conduct comprehensive assessments of soil contamination levels in mining-affected regions to develop effective mitigation strategies. This study focuses on the Akbakai gold mining deposit in the Zhambyl region of Kazakhstan, an area significantly impacted by open-pit mining. The primary objectives of this research are to analyze the physicochemical properties of soils in the Akbakai mining region; to assess the accumulation and mobility of heavy metals in different soil layers; to evaluate the extent of soil degradation and its implications for ecological restoration.
By providing a detailed investigation of soil contamination patterns, this study aims to contribute to the development of sustainable land management and remediation techniques in mining-affected areas. The findings will be critical for policymakers, environmental agencies, and mining companies in formulating strategies to minimize the long-term environmental impact of mining operations and promote ecological restoration efforts.
2. Materials and Methods
2.1. Study Area
This study was conducted at the Akbakai gold mining deposit, located 60 km northeast of Moynkum village in the Zhambyl region, Kazakhstan (45°07'08"N, 72°41'38"E). The deposit was discovered in 1968 and includes several mining fields, such as Akbakai, Beskempir, Quarry, Aksakal, Svetinskoye, and Kenzhem, as well as flotation waste from the Akbakai concentrator (Figure 1). The site is characterized by a semi-desert climate, with an average annual precipitation of 65.4 mm over the period 1960 to 2023. Soil moisture levels in the 0-40 cm depth range are typically below 20%. The landscape comprises rocky, sandy, and desert terrains, with an elevation ranging from 368 to 487 meters above sea level. Natural vegetation includes species such as wormwood, dogwood, mountain gum, and herbaceous plants from the grain family.
Gold ore processing in the region has resulted in extensive excavation, with industrial waste dumps reaching depths of 300-400 meters. These dumps primarily consist of dolomite, quartz, and slab rock. The mound formed from mining waste has existed for more than 50 years, with slow soil formation processes on its surface. The natural vegetation cover is sparse, with only 20-25% of the surface supporting plant growth.
2.2. Soil Sampling and Profile Analysis
Six representative soil profiles were excavated across the mounds to assess vertical variations in physical and biological characteristics (Figure 2). Soil profiles (SP) were described in the field by recording color, texture, structure, moisture content, and root distribution. For example: SP 1: 0–2 cm: Dark gray, dry, and loose; contains fine gravel, a very thin organic horizon, and scattered plant roots. 2–11 cm: Gray–brown, wet, and dense; exhibits a dusty–gravel structure with thin roots. 11–25 cm: yellowish gray–brown, moist, and dense; dominated by a stony–dusty structure with plant roots, although transitions are irregular. 25–35 cm: Dry, yellowish gray–brown, and very dense; characterized by coarse, stony layers lacking plant roots. SP 2–6: Each of these profiles displayed unique stratification patterns. In general, the upper layers (ranging from <1 cm to several centimeters thick) tended to be richer in organic matter and finer in texture, while deeper horizons (extending to 40–100+ cm) progressively exhibited increased coarseness, greater stoniness, and reduced root presence. Notably, SP 5 extended to over 100 cm with multiple distinct layers–from a matte-gray, moderately compacted surface to a deep stony gravel horizon–illustrating complex pedogenic processes on the anthropogenically altered substrate.
2.3. Soil Chemical and Physical Properties
Soil samples were collected at multiple depths from each section to assess their chemical and physical properties. Organic matter (humus) was determined using the Walkley-Black method [14] and confirmed by loss-on-ignition (LOI) measurements [15]. Nutrient elements, including total nitrogen, phosphorus, and potassium, were quantified following standard extraction protocols as described by Carter and Gregorich (2006) [16]. Soil pH was measured in a 1:2.5 soil-to-water suspension using a calibrated glass electrode, following procedures outlined in Blume et al. (1985) [17]. Measured pH values ranged from 8.06 to 9.12, indicating alkaline conditions. The presence of soluble salts, bicarbonates, chlorides, sulfates, calcium, magnesium, sodium, and potassium was determined using standard extractions and quantified by flame photometry and ion chromatography [16]. Soil salinity was assessed gravimetrically after water extraction, with total salt concentrations ranging between 0.061% and 1.059%, indicating a spectrum from weak to strong salinity [18].
The degree of soil sodicity was evaluated by measuring exchangeable sodium percentages using ammonium acetate extraction [19]. Values ranged from 3.1% to 23.8%. In addition, the sodicity index (Kₛ) was calculated as (Equation (1)):
Soils were classified based on the Kₛ value into non-sodic (<1), weakly sodic (1.1–2), moderately sodic (2–4), and strongly sodic (>4) [19]. The proportion of exchangeable sodium relative to the CEC was also determined to assess sodification, following the criteria suggested by Rengasamy (2006) [18]. All chemical data were interpreted in accordance with international guidelines [16]. All chemical data were interpreted in accordance with the USSR soil classification and diagnostic guidelines [20].
2.4. Heavy Metal Analysis
Soil contamination by heavy metals was assessed by measuring both total and mobile concentrations of elements such as copper (Cu), zinc (Zn), cadmium (Cd), lead (Pb), cobalt (Co), nickel (Ni), molybdenum (Mo), silver (Ag), and arsenic (As). Soil samples were collected from distinct layers (e.g., 0–11 cm, 11–25 cm, etc.) and subjected to microwave-assisted acid digestion using USEPA Method 3050B protocols [21]. The total metal content was quantified by Inductively Coupled Plasma Optical Emission Spectrometry (ICP-OES) [22]. The mobile (bioavailable) fraction of heavy metals was determined using a DTPA extraction method as described by Lindsay and Norvell (1978) [23]. This approach allowed us to compare total versus bioavailable metal concentrations, with the highest levels observed for lead and copper in the upper soil layers.
2.5. Granulometric Composition and Soil Texture
Particle size distribution was analyzed to classify soil texture and evaluate its influence on water retention and plant growth. Soil samples were dispersed and analyzed using the pipette method (Gee & Bauder, 1986), which allowed us to determine the percentages of sand, silt, and clay. Regional soils exhibited a more mixed texture with medium sand fractions ranging from 45.5% to 74.4%. In contrast, dump (or yard) soils were dominated by medium sand particles (72.5–84.0%), a characteristic that enhances water and air permeability but reduces water-holding capacity [24].
2.6. Soil Formation and Restoration Potential
The study evaluated natural soil formation processes and the restoration potential of mining dump areas. Excavation pits in various mound areas were examined, revealing newly formed soil layers with thicknesses ranging from 0.3 cm to 2 cm. Soil fertility, as indicated by humus content, was found to decline markedly with depth. Based on organic matter accumulation rates and comparisons with rates reported in similar arid environments [24], it was estimated that the development of a 13 cm thick fertile soil layer could require approximately 2200–2500 years under current conditions.
2.7. Statistical Analysis
3. Results
3.1. Soil Chemical and Agrochemical Properties
The investigated soils are generally characterized by a low content of organic matter, humus, and essential nutrients. In all soil profiles, the concentrations of these nutrients decrease markedly from the top organic-rich layer to the deeper horizons. This trend reflects the accumulation of organic residues in the upper layers-formed by soil digging and deposition of plant remains–with a rapid decline in nutrient levels in the subsequent layers.
In the studied profiles (SP 1 to SP 6), the upper layers of newly formed yard soils exhibit distinct chemical characteristics. For instance, in profile SP 1, humus content decreases from 0.82% at the surface to 0.45% in deeper layers, while total nitrogen diminishes from 0.17% to 0.11%. Mobile nitrogen, phosphorus, and potassium similarly decline from 33.6 to 14.0 mg/kg, 122.0 to 5.0 mg/kg, and from 220 to 50 mg/kg, respectively. Comparable decreasing trends with depth were observed in SP 2 through SP 6, albeit with varying absolute values. Notably, profile SP 4, influenced by a thick plant cover, exhibits a particularly high humus content of 1.1% in the top 0–1 cm layer (Table 1).
A closer examination of SP 3 reveals an interesting dynamic: despite its relatively low total nitrogen content (approximately 0.098%), it has a substantially elevated mobile nitrogen content of 145.6 mg/kg. This indicates an active transformation of total nitrogen into forms that are more readily available to plants, likely driven by the demands of vegetation uptake. Overall, the mobile forms of nitrogen in these yard soils are observed to be 2-4 times higher than those in regional soils, which is attributed to the accumulation of relatively undecomposed organic residues on the soil surface.
Similarly, the mobile phosphorus content in yard soils is found to be 1.7–2.5 times greater than in the surrounding regional soils. This enhancement is possibly due to the contribution of various rock fragments present in the yard soils, which may include phosphorus-rich mineral residues.
Soil pH measurements confirm that both the regional and yard soils are alkaline, with regional soils ranging between 8.5 and 9.2 and yard soils slightly lower at 8.1-8.9. Moreover, an evaluation of the soil’s exchangeable bases shows that the upper humus-rich layers possess a lower absorption capacity compared to the more mineral-rich deeper layers. The sum of absorbed bases–largely influenced by humus formation, soil salinity, genetic factors, mechanical properties, and leaching processes-follows the order: SP 5 > SP 6 > SP 2 > SP 3 > SP 4 > SP 1. In comparison to yard soils, regional soils exhibit a somewhat higher content of exchangeable bases.
Results indicate that while the upper layers of newly formed yard soils benefit from the accumulation of organic residues (leading to higher mobile nutrient forms), there is a significant vertical decrease in nutrient availability. The alkaline nature of the soils, combined with variations in the exchangeable base content, reflects the influence of both natural soil formation processes and the specific conditions associated with yard soil development.
3.2. Granulometric Analysis of Aggregated and Aegional Sandy Soils
The granulometric analysis of sandy, sandy loam, and sandy clay desert soils revealed distinct textural characteristics that have important implications for their hydraulic properties and suitability for plant growth. In the aggregated soils, medium sand particles (0.25–0.05 mm) were dominant, constituting 72.5–84.0% of the soil profile. Coarse sand particles (1–0.25 mm) accounted for 6–13%, coarse silt (0.05–0.01 mm) for 2.4–19.9%, medium silt (0.01–0.05 mm) for 0.4–15.2%, fine silt (0.005–0.001 mm) for 0.8–5.6%, and the clay fraction (<0.001 mm) ranged from 0.84–6.0%. In contrast, the regional soils exhibited a lower proportion of medium sand particles (45.5–74.4%), with coarse sand particles making up 5.9–18.7%, coarse silt 4.1–17.7%, medium silt 1.6–19.2%, fine silt 3.2–15.0%, and clay ranging from 3.2–15.0%. The predominance of medium sand particles in both soil types plays a crucial role in shaping the soil structure. These particles enhance water and air permeability and promote the decomposition of organic matter. The observed differences in the sand fraction between aggregated and regional soils likely reflect variations in soil formation processes and local climatic conditions. Notably, in the aggregated soils, a well-developed soil formation process has resulted in the establishment of four distinct soil horizons, with a light sandy loam mechanical composition appearing only in the lower layer (at a depth of 25–35 cm). In regional soils, a mixed mechanical composition–including sandy, sandy loam, and light sandy loam fractions–is evident (Table 2).
The studied soils are characterized predominantly by sandy and loamy compositions, which determine their water and air permeability properties. The dominance of sandy fractions, coupled with the presence of light sandy loam textures, leads to low water retention and moisture-holding capacities. These features create both opportunities and limitations for plant growth, emphasizing the need to consider soil texture in land management and agricultural practices.
3.3. Soil Salinization and Chemical Composition Analysis
The investigation of soil salinization in the studied aggregated soils revealed significant depth-related variations in salt content and chemical composition. In newly developed soils, such as those represented by the SP 4 profile, the upper organic layers exhibit weak salinization, while salinity increases progressively in the lower layers-from moderate to strong levels. For instance, in SP 1 sample, the slightly soluble salt content measured 0.181% at a 0–2 cm depth, increasing to 0.851% at a 2–11 cm depth. Similarly, in the SP 2 sample, salt content increased from 0.301% at 0–0.3 cm to 0.809% at a 0.3–14 cm depth. These trends indicate a migratory accumulation of salts with increasing depth, a pattern that is also evident in the SP 5 and SP 6 profiles. In SP 5, salinity is weak from the surface to 78 cm but becomes moderate between 78 and 95 cm, whereas in SP 6, weak salinization is observed in the lower layers starting from 35–57 cm.
The overall salt composition in the soil profiles is characterized by a chloride-sulfate type of anion and a magnesium-calcium dominance among cations. Notably, chloride concentrations peaked at 0.723% in the SP 6 profile between 72 and 100 cm, while sulfate levels varied between 0% and 1.16%. The total dissolved salt content across different depths ranged from 0.061% to 1.059%, reflecting a gradient from weak to strong salinization. Measurements of bicarbonate (HCO₃⁻) remained low (0.003–0.004%), indicating that sodic salinization is not a significant concern in these soils; indeed, neither aggregated nor undisturbed natural soils showed signs of sodic salinization.
The primary source of salinity appears to be the influence of salts from underlying bedrock formations – such as dolomites, quartz, and slate–which contribute to the formation of these new soils. Although the upper organic layers show only weak salinization, even this level may begin to adversely affect plant growth and development. In these aggregated soils, plant performance is influenced primarily by the composition and level of salts and secondarily by factors such as soil granulometry, moisture content, climatic conditions, and plant species.
Furthermore, the degree of soil sodification, determined by the proportion of exchangeable sodium, varies with depth. In the SP 1, SP 2, SP 3, and SP 4 profiles, exchangeable sodium levels remain low (ranging from 3.1% to 3.5%), while in the upper layers of the SP 5 and SP 6 profiles, there is a noticeable shift from weak to strong sodicity (with values reaching up to 23.8%) (Table 3). These variations underscore the complex interplay between salt accumulation and soil chemical properties, which in turn directly affect soil structure and the potential for plant root development.
The studied soils exhibit a clear depth-dependent salinity profile characterized by weak salinization in the upper organic layers and increasing salinity in the deeper layers. The chloride-sulfate type salinity, coupled with magnesium-calcium cations and variable exchangeable sodium levels, highlights the intricate chemical and physical dynamics that influence soil quality and its suitability for plant growth.
3.4. Heavy Metal Analysis in Soils
The analysis of heavy metals in the studied soils encompassed measurements of both total and mobile forms for copper (Cu), zinc (Zn), cadmium (Cd), lead (Pb), cobalt (Co), nickel (Ni), molybdenum (Mo), silver (Ag), and arsenic (As). The data reveal significant variation in metal concentrations across different soil layers, with notable discrepancies between total concentrations and their mobile, potentially bioavailable, fractions.
For copper, the total concentration ranged from 12.36 mg/kg in the SP 5 sample to 52.37 mg/kg in the SP 1 sample, indicating a substantial presence of copper in the soils. The highest copper levels were observed in the surface layer (0–11 cm) of the SP 1 and SP 6 profiles, suggesting marked contamination of the upper horizons. In contrast, the mobile form of copper was considerably lower, with the minimum value recorded at 0.395 mg/kg in the SP 6 sample. Zinc levels, on the other hand, showed total concentrations ranging from 64.49 mg/kg (SP 6) to 96.9 mg/kg (SP 3), reflecting a relatively high zinc content, particularly in the upper soil layers. In most samples, the mobile fraction of zinc did not exceed 0.5 mg/kg; however, an exception was noted in the SP 5 sample, where the mobile zinc concentration reached 5.127 mg/kg in the 13–27 cm soil layer. Cadmium was present at very low levels across all samples, with total concentrations consistently remaining below 0.05 mg/kg. This indicates that cadmium contamination in the studied soils is minimal. Lead exhibited a wide range of total concentrations–from 10.61 mg/kg in SP-1 to as high as 308 mg/kg observed in SP 1, SP 2, and SP 3-demonstrating significant lead contamination. The mobile form of lead also reached high levels, peaking at 80.35 mg/kg in SP-1 and 79.58 mg/kg in SP 3. Cobalt concentrations varied from 7.21 mg/kg (SP-5) to 19.79 mg/kg (SP-2), which generally fall within normal levels. Nevertheless, in some cases the total concentration of cobalt exceeded the permissible limit by approximately 1.3 times (up to 19.8 mg/kg). The mobile fraction ranged from 0.685 mg/kg in SP 5 to 5.223 mg/kg in SP 1, suggesting a degree of bioavailability that could potentially affect plant uptake. Nickel levels were relatively consistent, with total concentrations between 21.62 mg/kg (SP-4) and 30.95 mg/kg (SP-2), and mobile forms ranging from 1.398 mg/kg (SP 6) to 4.153 mg/kg (SP 1). These values are within the expected range for nickel in soils. Molybdenum was found at low levels, with total concentrations ranging from 5.34 mg/kg (SP-5) to 18.12 mg/kg (SP-1). In every sample, the mobile form of molybdenum did not exceed 1 mg/kg.
Both total and mobile forms of silver were below 0.5 mg/kg in all samples, indicating that silver is present at very low levels and does not pose an ecological threat. Arsenic concentrations ranged from 0.380 mg/kg (SP 6) to 5.96 mg/kg (SP 1). Although arsenic was detected in some samples, its levels generally remained within permitted standards. However, in certain cases the total form of arsenic was reported to be 2.98 times above the permissible limit, even though its mobile fraction remained low across all samples.
Overall, the primary pollutants identified in the soil were lead and copper. For example, in the SP-1 profile at a depth of 0–11 cm, the mobile form of copper was 2.96 times above the permissible concentration (8.88 mg/kg), while the total lead concentration was 9.6 times above the limit (308 mg/kg) with its mobile form 2.7 times above the threshold (80.35 mg/kg). In the 11–25 cm soil layer, the mobile copper concentration was 1.4 times above the limit (4.2 mg/kg), the total lead concentration was 8.9 times above (284 mg/kg), cobalt reached 1.3 times above (19.8 mg/kg), and arsenic was 1.83 times above (3.6 mg/kg). Additionally, in the SP-1 profile within the 13–27 cm layer, the mobile zinc concentration was 1.7 times above the permissible limit at 5.127 mg/kg (Table 4) .
3.5. Heavy Metal Analysis in Natural Soils of the Area Affected by Technogenic Pollution
Heavy metal concentrations in surface soils of technogenically disturbed areas were analyzed at two depths (0–20 cm and 20–40 cm) across two sampling points (point 1 and point 2). The levels of nine microelements (Cu, Zn, Co, Cd, Pb, Ni, Mo, Ag, and As) were all below the maximum permissible concentrations. Zinc’s mobile form remained below 0.5 mg/kg, indicating relatively high mobility, while cadmium was consistently under 0.05 mg/kg in both total and mobile forms, suggesting low ecological risk. Although lead concentrations were higher at one site (10.31 mg/kg in the 0–20 cm layer and 14.96 mg/kg in the 20–40 cm layer), its mobile fraction was very low. Cobalt and nickel showed increased total concentrations with depth, with their mobile forms ranging from 0.544 to 0.978 mg/kg and 0.748 to 2.451 mg/kg, respectively. Molybdenum, silver, and arsenic were uniformly low in both forms (Table 5). Overall, despite variations in mobility and depth distribution, all metals remain within safe limits, emphasizing the importance of ongoing monitoring
3.6. Investigation of Heavy Metals in Tailings Soils
Analyses of tailings soils (gray, red, and black) at depths of 0–20 cm and 20–40 cm revealed several heavy metals exceeding maximum permissible concentrations (MPC). In the gray tailings at 0–20 cm, total copper reached 138.11 mg/kg (2.5× MPC) with its mobile form at 3.75 mg/kg (1.2× MPC). Total zinc (127.9 mg/kg, 1.3× MPC), lead (51.8 mg/kg, 1.6× MPC), cobalt (18.9 mg/kg, 1.3× MPC with a mobile fraction of 6.5 mg/kg, 1.3× MPC), and total nickel (8.6 mg/kg, 2.2× MPC) were also elevated. Notably, arsenic in its mobile form reached 17.6 mg/kg–8.8 times the MPC. In the deeper gray tailings layer (20–40 cm), similar trends were observed with slightly lower copper (70.3 mg/kg, 1.3× MPC) and zinc (11.29 mg/kg, 1.1× MPC) levels, but lead (56.94 mg/kg, 1.8× MPC), nickel mobile (8.4 mg/kg, 2.1× MPC), and total arsenic (20.71 mg/kg, 10.4× MPC) remained notably high.
In red tailings, the 0–20 cm layer exhibited total copper at 85.3 mg/kg (1.5× MPC), zinc at 167.1 mg/kg (1.7× MPC), lead at 72.6 mg/kg (2.3× MPC), and cobalt at 22.4 mg/kg (1.5× MPC) with a mobile fraction of 5.97 mg/kg (1.2× MPC). Nickel in its mobile form was 8.8 mg/kg (2.2× MPC), while total arsenic reached 19.2 mg/kg (9.6× MPC). In the 20–40 cm layer of red tailings, copper (6.89 mg/kg, 2.3× MPC), zinc (114.2 mg/kg, 1.14× MPC), lead (35.79 mg/kg, 1.1× MPC), nickel mobile (9.9 mg/kg, 2.5× MPC), and total arsenic (19.7 mg/kg, 9.9× MPC) also exceeded safe limits.
Black tailings showed significant contamination primarily in the top 0–20 cm layer, where mobile zinc reached 5.03 mg/kg (1.7× MPC) and total zinc soared to 133.7 mg/kg (5.8× MPC). Total cobalt was 6.99 mg/kg (1.1× MPC), lead 56.5 mg/kg (1.8× MPC), nickel 10.1 mg/kg (2.5× MPC), and arsenic 15.8 mg/kg (7.9× MPC). In the 20–40 cm layer, nickel mobile was 5.88 mg/kg (1.5× MPC) and total arsenic was 15.8 mg/kg (2× MPC), with mobile zinc still slightly elevated (1.3× MPC) (Table 6).
Exceedances of MPC were predominantly found in technogenic sediments and tailings–specifically, both total and mobile forms of Cu, Zn, Co, and Pb; the mobile form of Ni; and the total form of As. No such exceedances were observed in the outer areas of the technogenic zone. The key pollutants adversely affecting soil quality, plant growth, and food chains are Cu, Zn, Pb, Co, Ni, and As, with arsenic in the gray tailings (at both depths) exhibiting the highest levels (8–10× MPC).
4. Discussion
This work was undertaken in response to the growing concerns over soil degradation in mining-affected areas and its profound impacts on agricultural productivity and ecosystem health. Mining operations have been linked to the depletion of soil nutrients, increased salinization, and the accumulation of heavy metals, all of which compromise soil quality and sustainability. Our study aims to comprehensively assess the chemical, physical, and agrochemical properties of soils from these regions, with a particular focus on the vertical distribution of nutrients, the granulometric composition, salinization trends, and heavy metal contamination.
4.1. Soil Chemical and Agrochemical Properties
Our results clearly indicate that the investigated soils exhibit a significant vertical gradient in nutrient content. In all profiles (SP 1 to SP 6), the upper organic-rich layer contains higher levels of organic matter, humus, and essential nutrients (both total and mobile forms), which sharply decline with depth. For instance, in profile SP 1, humus content decreases from 0.82% at the surface to 0.45% in deeper layers, while total nitrogen drops from 0.17% to 0.11%. This pattern suggests that surface layers benefit from the accumulation of undecomposed organic residues, promoting higher nutrient availability for initial plant growth. However, the rapid decline in nutrient levels with depth poses challenges for long-term soil fertility and ecosystem recovery. Critically, while our data indicate an active transformation of total nitrogen into its mobile form - as seen in SP 3 where mobile nitrogen is substantially elevated–this process may be a double-edged sword. On one hand, higher mobile nutrient forms can support early plant establishment; on the other, they may be more susceptible to leaching, particularly in sandy soils. Havlin et al. (2013) discussed the importance of nutrient retention in sustaining soil fertility, emphasizing that management practices must address both surface fertility and subsoil nutrient retention to ensure sustainable land use [27].
4.2. Granulometric Analysis of Aggregated and Regional Sandy Soils
The granulometric analysis revealed that aggregated (yard) soils are dominated by medium sand particles (72.5–84.0%), while regional soils exhibit a broader range of particle sizes. Our findings suggest that the predominance of medium sand enhances water and air permeability, which is beneficial for organic matter decomposition. However, this texture also limits water retention, potentially exacerbating nutrient leaching and affecting plant water availability in arid conditions. Our results are consistent with established soil physics principles. Hillel (2008) explained that soil texture plays a critical role in determining water retention and drainage properties [28]. In addition, Brady and Weil (2008) emphasized that sandy soils, although promoting rapid aeration and decomposition, often require supplemental management to mitigate rapid nutrient losses [24]. These insights underscore the need for tailored management practices in sandy soils to maintain adequate moisture and nutrient levels for sustainable vegetation growth.
4.3. Soil Salinization and Chemical Composition Analysis
Our salinization data indicate a distinct depth-dependent increase in salt content. For example, in SP 1, the slightly soluble salt content increased from 0.181% at 0–2 cm depth to 0.851% at 2–11 cm depth, reflecting a downward migration of salts likely derived from the underlying parent rock. The chloride–sulfate type of salinity, combined with a magnesium–calcium dominance among cations, points to the influence of mineral weathering on soil chemical composition. While the upper organic layers exhibit weak salinization, the increasing salt content in deeper layers may adversely affect root development and plant water uptake. Rengasamy (2006) studied salinity profiles and reported similar depth-related trends in salt accumulation, noting that increased salinity in subsoils can significantly impact plant growth [18]. These findings highlight the necessity for remediation measures that mitigate salt accumulation and preserve soil structure to support successful ecological restoration.
4.4. Heavy Metal Analysis in Soils Affected by Technogenic Pollution
In the natural soils located in technogenically disturbed areas, our heavy metal analysis shows that most elements (such as Cd, Zn, Co, and Ni) remain within permissible limits. However, lead and copper display elevated concentrations, with some profiles (e.g., SP 1) showing mobile copper levels 2.96 times above permissible limits and total lead levels 9.6 times above acceptable thresholds. The discrepancy between total and mobile forms suggests that soil properties (e.g., pH and organic matter content) may restrict immediate metal mobility, yet high total concentrations pose a risk of future mobilization. Wuana and Okieimen (2011) reviewed heavy metal behavior in contaminated soils and noted that even low mobile fractions can eventually lead to delayed ecological effects if total metal accumulation is significant [29]. Furthermore, Mulligan et al. (2001) discussed the potential for long-term heavy metal accumulation to become problematic under changing soil conditions [30]. Our data contribute to this understanding by providing detailed depth profiles that underscore the latent risks associated with heavy metal contamination in disturbed soils.
4.5. Investigation of Heavy Metals in Tailings Soils
In stark contrast to the natural soils, tailings soils exhibit severe heavy metal contamination. Our analysis of gray, red, and black tailings reveals that several heavy metals–including Cu, Zn, Pb, Co, and particularly as–exceed maximum permissible concentrations (MPC) in both total and mobile forms. For instance, mobile arsenic levels in gray tailings are as high as 8.8–10.4 times the MPC, while other metals such as Cu and Pb also show significant exceedances in the upper layers. This pattern of contamination suggests that tailings soils serve as hotspots for heavy metal accumulation, likely due to their fine particle size and limited natural attenuation processes. Kumar and Sharma (2009) investigated heavy metal pollution in soils and highlighted that tailings often contain extremely high levels of bioavailable metals, posing serious ecological threats [31,32]. These observations underscore the urgency for implementing remediation strategies to mitigate both ecological and human health risks.
5. Conclusions
In conclusion, our study demonstrates that while the organic-rich surface layers of yard soils initially support higher nutrient availability, the rapid depletion of nutrients with increasing depth, coupled with significant heavy metal contamination – particularly in tailings soils–poses serious long-term risks to soil fertility and ecosystem stability. The observed variations in granulometry and salinization further complicate the restoration process by affecting water retention, nutrient leaching, and overall soil structure. Detailed depth profiles reveal the potential for latent ecological effects if heavy metal mobilization increases over time under changing environmental conditions. These findings underscore the urgent need for comprehensive remediation and sustainable management strategies to mitigate the detrimental impacts of mining activities. Our study contributes valuable data to the body of knowledge on soil degradation in mining areas and reinforces the importance of integrating chemical, physical, and biological assessments in the design of restoration interventions. Future research should focus on exploring innovative remediation technologies and adaptive management practices to ensure the long-term recovery and sustainability of affected ecosystems.
Author Contributions
Conceptualization, Y.Z., B.B.K., and A.B.; Methodology, M.T. and Z.K.; Software, S.T. and E.A.; Validation, B.B.K., A.M.B., and G.K.K.; Formal analysis, M.E.B. and T.B.; Investigation, M.T. and S.T.; Resources, A.B. and Z.K.; Data curation, B.B.K.; Writing—original draft preparation, Y.Z. and S.T.; Writing—review and editing, B.B.K., M.T., and G.K.K.; Visualization, M.E.B.; Supervision, B.B.K.; Project administration, Y.Z.; Funding acquisition, A.B. All authors have read and agreed to the published version of the manuscript.
Funding
This research was funded by the Ministry of Science and Higher Education of the Republic of Kazakhstan under the framework of the project AP19576993. This work was also supported by the Tianjin Synthetic Biotechnology Innovation Capacity Improvement Project (TSBICIP-BRF1-009) titled "Research and Development of Multifunctional Synthetic Microbial Inoculants".
Data Availability Statement
The data supporting this study are available from the corresponding author upon reasonable request.
Acknowledgments
The authors thank all collaborators and institutions involved in this study for their support.
Conflicts of Interest
The authors declare no conflicts of interest.
Abbreviations
| CEC | Cation Exchange Capacity |
| Det. Ind. | Determined Indicator |
| Forms of Frac. | Forms of Fractions |
| ICP-OES | Inductively Coupled Plasma Optical Emission Spectrometry |
| LOI | Loss on Ignition |
| MPC | Maximum Permissible Concentration |
| SP | Soil Profile |
References
- Alloway, B.J. Heavy Metals in Soils: Trace Metals and Metalloids in Soils and Their Bioavailability; Springer Science & Business Media: Berlin, Germany, 2013. [Google Scholar]
- Zhao, F.J.; Ma, Y.; Zhu, Y.G.; Tang, Z.; McGrath, S.P. Soil contamination and remediation: Progress, challenges and opportunities. Environ. Int. 2014, 66, 36–51. [Google Scholar]
- Soltani, A.; Mahvi, A.H.; Shahcheraghi, F. Evaluation of heavy metal contamination in soils around mining sites in Iran. Environ. Monit. Assess. 2017, 189, 520. [Google Scholar]
- Mir, R.; Ahmad, N.; Qayyum, A.; Khan, S. Assessment of heavy metal contamination in mining soils: A case study from the Indian subcontinent. J. Hazard. Mater. 2020, 383, 121102. [Google Scholar]
- Bradshaw, A.D. Restoration of mined lands: Where science and art meet. Ecol. Appl. 1997, 7, 944–953. [Google Scholar]
- Sheoran, V.; Shukla, A.; Sharma, R. Assessment of heavy metals in soils of a mining region in India. Ecotoxicol. Environ. Saf. 2008, 71, 344–349. [Google Scholar]
- Newbold, J.; Hudson, L.N.; Hill, S.L.L.; et al. Global effects of land use on local terrestrial biodiversity. Nature 2015, 520, 45–50. [Google Scholar] [CrossRef] [PubMed]
- Johnson, M.; Smith, L.; Davis, R. Long-term impacts of heavy metal accumulation on soil quality in mining regions. Environ. Sci. Technol. 2018, 52, 4567–4575. [Google Scholar]
- Wang, Z.; Li, Y.; Zhang, H.; Zhang, Q. Long-term impacts of mining on soil quality: Evidence from an abandoned open-pit mine. Environ. Pollut. 2021, 270, 116341. [Google Scholar]
- Wan, Y.; Liu, J.; Zhuang, Z.; Wang, Q.; Li, H. Heavy metals in agricultural soils: Sources, influencing factors, and remediation strategies. Toxics 2024, 12, 63. [Google Scholar] [CrossRef] [PubMed]
- Chen, Y.; Li, H.; Wang, J.; et al. Remediation strategies for heavy metal-contaminated soils in mining areas: Phytoremediation and soil amendments. J. Hazard. Mater. 2019, 369, 1–10. [Google Scholar]
- García, P.; Martinez, R.; Lopez, F. Effects of heavy metal contamination on soil microbial diversity in mining-impacted areas. Chemosphere 2016, 150, 36–42. [Google Scholar]
- Crutzen, P.J.; Steffen, W. The Anthropocene. Glob. Change Newsl. 2003, 41, 17–18. [Google Scholar]
- Lehmann, J.; Stahr, K. Biochar for Environmental Management: Science and Technology; Earthscan: London, UK, 2007. [Google Scholar]
- Nelson, D.W.; Sommers, L.E. Total carbon, organic carbon, and organic matter. In Methods of Soil Analysis, Part 3: Chemical Methods; Sparks, D.L., Ed.; Soil Science Society of America: Madison, WI, USA, 1996; pp. 961–1010. [Google Scholar]
- Carter, M.R.; Gregorich, E.G. Soil Sampling and Methods of Analysis, 2nd ed.; CRC Press: Boca Raton, FL, USA, 2006. [Google Scholar]
- Blume, H.-P.; Page, A.L.; Miller, R.H.; Keeney, D.R. Methods of Soil Analysis: Chemical and Microbiological Properties, 2nd ed.; American Society of Agronomy: Madison, WI, USA, 1982; 1184 pp. Z. Pflanzenernähr. Bodenkd. 1985, 148, 363–364. [Google Scholar]
- Rengasamy, P. World salinization with emphasis on Australia. J. Exp. Bot. 2006, 57, 1017–1023. [Google Scholar] [PubMed]
- US Salinity Laboratory Staff. Diagnosis and Improvement of Saline and Alkali Soils; USDA: Washington, DC, USA, 1954. [Google Scholar]
- Krasilnikov, P.; Martí, J.-J.I.; Arnold, R.; Shoba, S. Soil Classification and Diagnostics of the Former Soviet Union, 1977. In A Handbook of Soil Terminology, Correlation and Classification; Routledge: London, UK, 2009. [Google Scholar]
- USEPA. Method 3050B: Acid Digestion of Sediments, Sludges, and Soils; U.S. Environmental Protection Agency: Washington, DC, USA, 1996. [Google Scholar]
- Senila, M. Recent advances in the determination of major and trace elements in plants using inductively coupled plasma optical emission spectrometry. Molecules 2024, 29, 3169. [Google Scholar] [CrossRef] [PubMed]
- Lindsay, W.L.; Norvell, W.A. Development of a DTPA soil test for zinc, iron, manganese, and copper. Soil Sci. Soc. Am. J. 1978, 42, 421–428. [Google Scholar] [CrossRef]
- Brady, N.C.; Weil, R.R. The Nature and Properties of Soils, 14th ed.; Pearson Prentice Hall: Upper Saddle River, NJ, USA, 2008. [Google Scholar]
- R Core Team. R: A Language and Environment for Statistical Computing; R Foundation for Statistical Computing: Vienna, Austria, 2020. [Google Scholar]
- IBM Corp. IBM SPSS Statistics for Windows, Version 27.0 [Computer software]; IBM Corp.: Armonk, NY, USA, 2020. [Google Scholar]
- Havlin, J.L.; Tisdale, S.L.; Nelson, W.L.; Beaton, J.D. Soil Fertility and Fertilizers: An Introduction to Nutrient Management, 8th ed.; Pearson: Boston, MA, USA, 2013. [Google Scholar]
- Hillel, D. Environmental Soil Physics: Fundamentals, Applications, and Environmental Considerations; Academic Press: San Diego, CA, USA, 2008. [Google Scholar]
- Wuana, R.A.; Okieimen, F.E. Heavy metals in contaminated soils: A review of sources, chemistry, risks and best available strategies for remediation. ISRN Ecol. 2011, 2011, 402647. [Google Scholar] [CrossRef]
- Mulligan, C.N.; Yong, R.N.; Gibbs, B.F. Remediation technologies for metal-contaminated soils and groundwater. Environ. Sci. Technol. 2001, 35, 4551–4558. [Google Scholar] [CrossRef]
- Kumar, P.; Sharma, P. Heavy metal pollution in soils. Environ. Monit. Assess. 2009, 157, 173–195. [Google Scholar]
- Zhakypbek, Y.; Kossalbayev, B.D.; Belkozhayev, A.M.; Murat, T.; Tursbekov, S.; Abdalimov, E.; Pashkovskiy, P.; Kreslavski, V.; Kuznetsov, V.; Allakhverdiev, S.I. Reducing heavy metal contamination in soil and water using phytoremediation. Plants 2024, 13, 1534. [Google Scholar] [CrossRef] [PubMed]
Figure 1.
Map of the location and climate of the research object. a - Location of studied area (Akbakay mine), b,c - Akbakai deposit DEM Alos Palsar 12.5-meter, d - Map of average monthly precipitation in Zhambyl region for 10-year periods from 1960 to 2023, e - Map of soil moisture in Zhambyl region for a soil layer 0-40 cm deep, f - 50-year-old man-made dump, g - Surface part of the pile of the man-made dump.
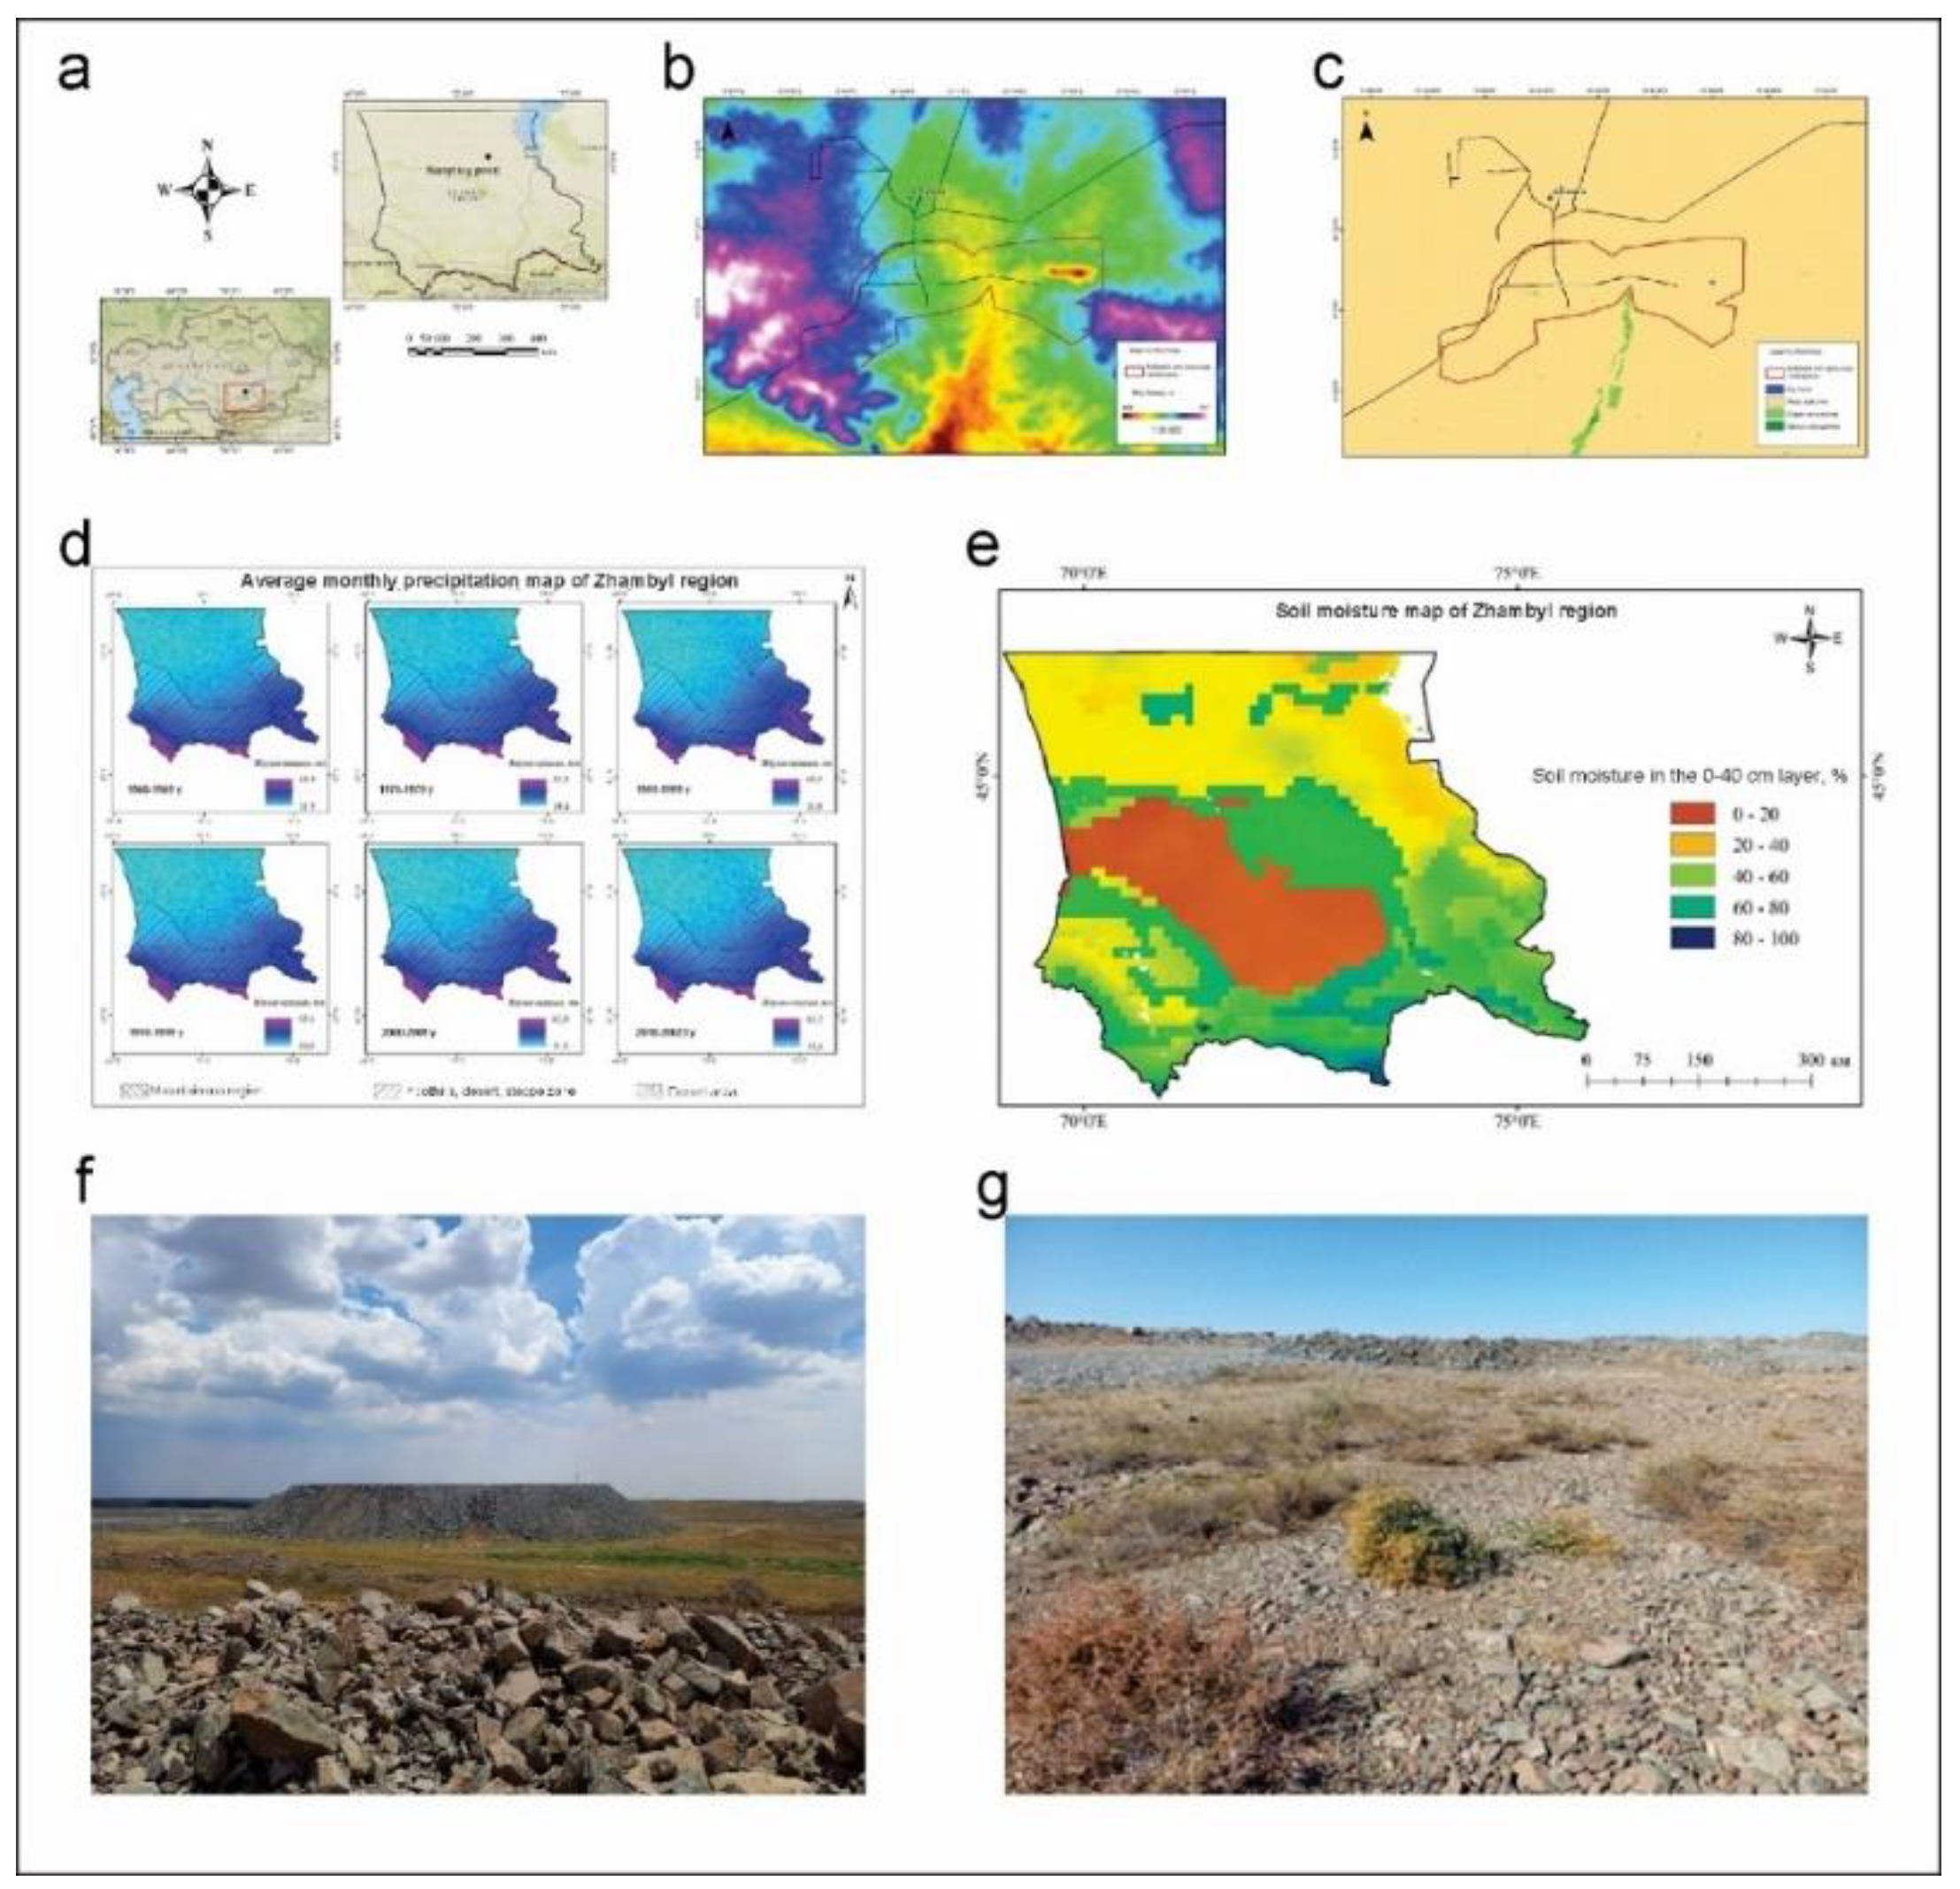
Figure 2.
Excavated land from the top of the mound in soil. Note: a – soil profile 1, 2 – soil profile 2, c – soil profile 3, d – soil profile 4, e – soil profile 5, f – soil profile 6.
Figure 2.
Excavated land from the top of the mound in soil. Note: a – soil profile 1, 2 – soil profile 2, c – soil profile 3, d – soil profile 4, e – soil profile 5, f – soil profile 6.
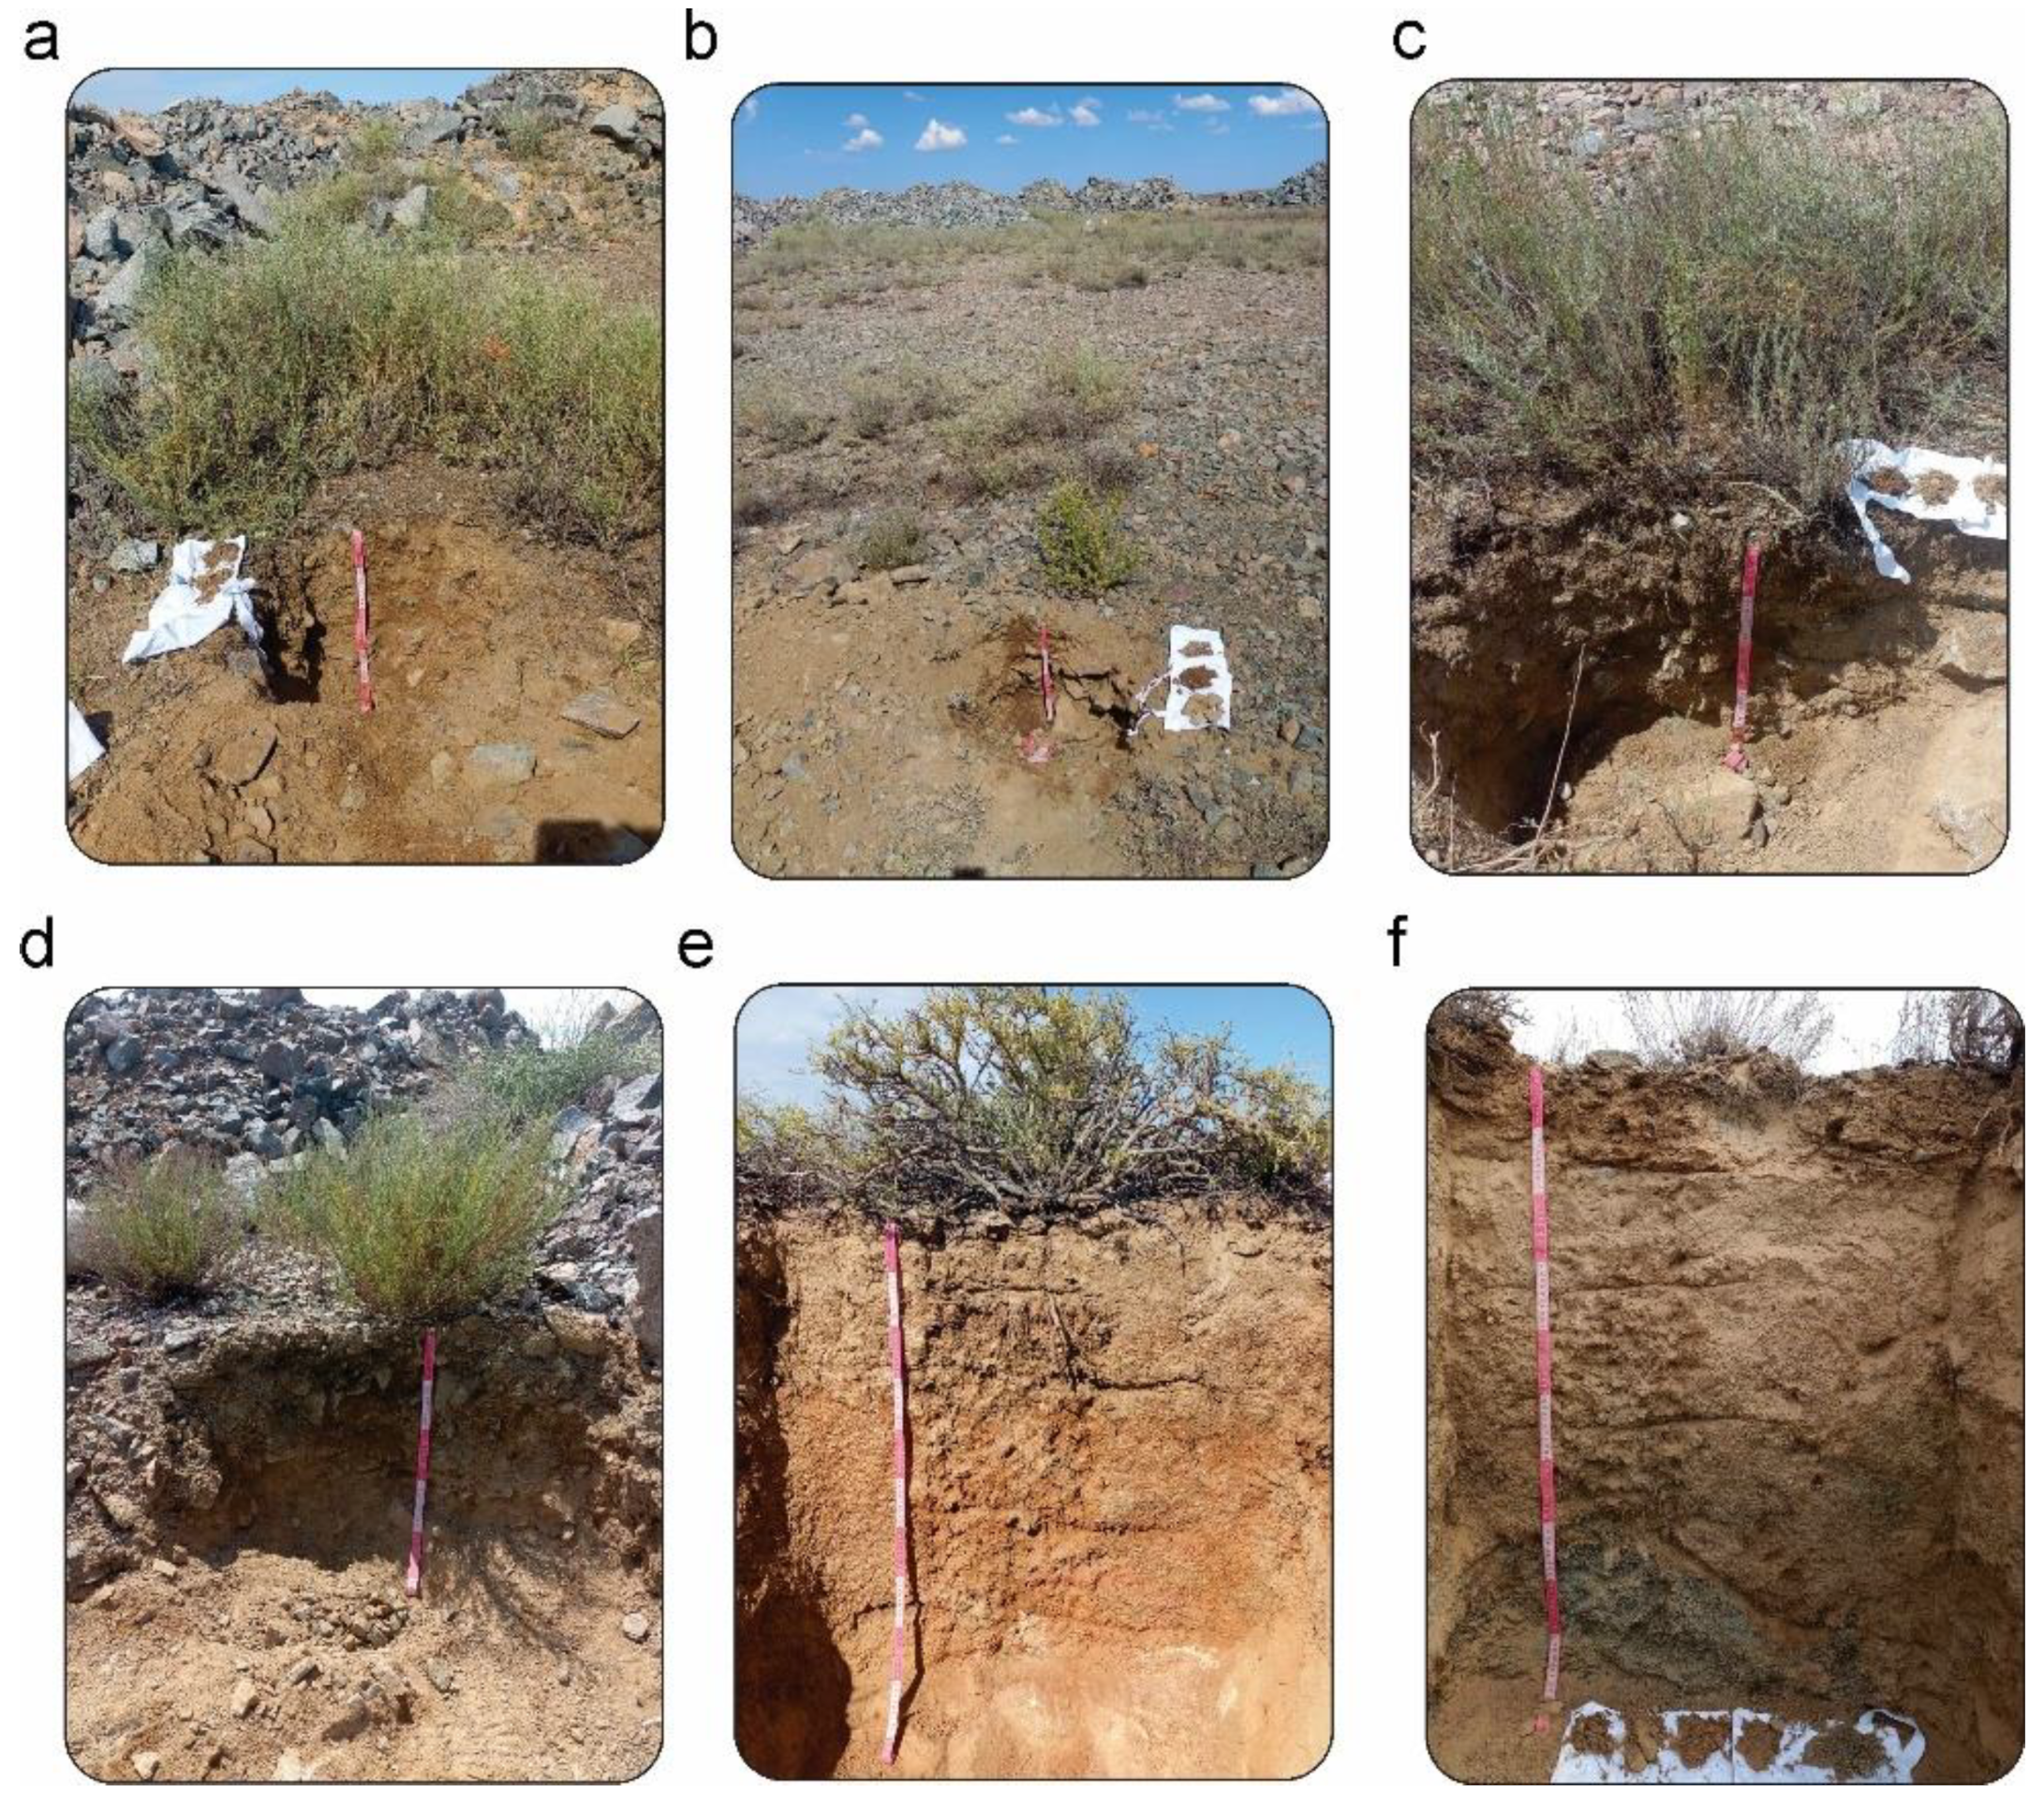

Table 1.
Analysis results of soil chemical and agrochemical properties.
| Soil sections |
Depth, cm | Humus (O.M.),% |
Total | Mobile | pH | Soil absorbed bases, mg-eq/100 g of soil | |||||||
|---|---|---|---|---|---|---|---|---|---|---|---|---|---|
| N | P2O5 | K2O | N | P2O5 | K2O | Ca2+ | Mg2+ | Na+ | K+ | ||||
| % | % | % | Mg/ kg |
Mg/ kg |
Mg/ kg |
||||||||
| SP 1 |
0-2 | 1,82 | 0,168 | 0,276 | 2,875 | 98 | 122 | 220 | 8,06 | 10,89 | 1,49 | 0,31 | 0,15 |
| 2-11 | 0,45 | 0,112 | 0,192 | 2,75 | 25,2 | 23 | 160 | 8,2 | 12,38 | 7,43 | 0,31 | 0,19 | |
| 11-25 | 0,41 | 0,056 | 0,16 | 2,437 | 19,6 | 13 | 90 | 8,26 | 12,38 | 7,92 | 0,31 | 0,26 | |
| 25-35 | 0,45 | 0,042 | 0,128 | 2,187 | 14 | 5 | 50 | 8,2 | 12,87 | 7,43 | 0,31 | 0,26 | |
| SP 2 | 0-0,3 | 1,07 | 0,056 | 0,384 | 3,187 | 33,6 | 81 | 140 | 8,53 | 8,91 | 0,99 | 0,31 | 0,25 |
| 0,3-14 | 0,27 | 0,056 | 0,36 | 3 | 14 | 61 | 90 | 8,49 | 27,23 | 2,48 | 0,31 | 0,25 | |
| SP 3 | 0-1 | 1,03 | 0,098 | 0,328 | 3,125 | 145,6 | 100 | 170 | 8,72 | 4,95 | 2,48 | 0,31 | 0,21 |
| 1-12 | 0,55 | 0,126 | 0,296 | 3 | 58,8 | 78 | 90 | 8,57 | 12,38 | 5,94 | 0,29 | 0,25 | |
| 12-25 | 0,58 | 0,07 | 0,296 | 2,75 | 33,6 | 48 | 90 | 8,26 | 12,87 | 7,43 | 0,31 | 0,26 | |
| 25-43 | 0,38 | 0,056 | 0,208 | 2,25 | 19,6 | 31 | 70 | 8,22 | 9,9 | 9,9 | 0,27 | 0,26 | |
| SP 4 | 0-1 | 1,86 | 0,126 | 0,276 | 3 | 75,6 | 100 | 220 | 8,02 | 7,43 | 2,48 | 0,31 | 0,17 |
| 1-11 | 0,41 | 0,112 | 0,232 | 3,187 | 19,6 | 28 | 120 | 8,47 | 4,95 | 2,48 | 0,31 | 0,25 | |
| 11-22 | 0,17 | 0,042 | 0,192 | 2,312 | 19,6 | 8 | 50 | 8,98 | 11,88 | 9,9 | 0,31 | 0,26 | |
| 22-42 | 0,1 | 0,042 | 0,192 | 2,187 | 8,4 | 8 | 50 | 8,37 | 12,87 | 7,43 | 0,31 | 0,26 | |
| SP 5 | 0-4 | 1,07 | 0,14 | 0,16 | 2,187 | 36,4 | 48 | 220 | 8,77 | 4,95 | 2,48 | 0,27 | 0,22 |
| 4-13 | 0,41 | 0,07 | 0,148 | 1,875 | 36,4 | 20 | 230 | 9,12 | 3,47 | 1,49 | 0,31 | 0,26 | |
| 13-28 | 0,48 | 0,056 | 0,128 | 2,187 | 19,6 | 5 | 150 | 8,91 | 8,42 | 8,91 | 0,24 | 0,26 | |
| 28-56 | 0,58 | 0,042 | 0,072 | 3 | 14 | 5 | 80 | 9,07 | 9,9 | 3,47 | 0,31 | 0,26 | |
| 56-78 | 0,21 | 0,07 | 0,072 | 2,437 | 8,4 | 5 | 50 | 9,09 | 12,38 | 2,48 | 0,31 | 0,26 | |
| 78-95 | 0,17 | 0,014 | 0,136 | 3,75 | 5,6 | 3 | 30 | 8,38 | 27,23 | 2,48 | 0,31 | 0,26 | |
| SP 6 |
0-13 | 0,31 | 0,056 | 0,136 | 1,625 | 22,4 | 31 | 140 | 8,99 | 4,95 | 3,47 | 0,31 | 0,26 |
| 13-25 | 0,45 | 0,07 | 0,136 | 1,812 | 25,2 | 13 | 110 | 9,03 | 2,48 | 2,48 | 0,31 | 0,26 | |
| 35-57 | 0,62 | 0,07 | 0,148 | 1,5 | 22,4 | 8 | 70 | 8,48 | 12,38 | 2,48 | 0,22 | 0,26 | |
| 57-72 | 0,65 | 0,056 | 0,16 | 1,375 | 22,4 | 10 | 50 | 8,67 | 7,43 | 5,45 | 0,05 | 0,26 | |
| 72-100 | 0,52 | 0,014 | 0,168 | 0,625 | 19,6 | 5 | 50 | 8,54 | 9,9 | 5,94 | 0,28 | 0,26 | |
Table 2.
Granulometric composition of soils in the study area.
| Soil sections | Depth, cm | Fraction content in % on absolute dry soil, fraction size in mm | ||||||
|---|---|---|---|---|---|---|---|---|
| Sand | Silt |
Clay | 3-x | |||||
| 1,0-0,25 | 0,25-0,05 | 0,05-0,01 | 0,01-0,005 | 0,005-0,001 | <0,001 | Factions <0,01 | ||
| SP 1 | 0-2 | 8,523 | 72,537 | 9,672 | 4,030 | 3,627 | 1,612 | 9,269 |
| 2-11 | 2,311 | 76,602 | 16,626 | 1,217 | 2,028 | 1,217 | 4,461 | |
| 11-25 | 10,913 | 63,935 | 19,878 | 2,028 | 1,623 | 1,623 | 5,274 | |
| 25-35 | 8,756 | 63,226 | 5,356 | 15,245 | 4,944 | 2,472 | 22,662 | |
| SP 2 | 0-0,3 | 12,321 | 71,170 | 4,429 | 6,443 | 0,805 | 4,832 | 12,080 |
| 0,3-14 | 5,926 | 72,304 | 14,513 | 1,613 | 2,016 | 3,628 | 7,257 | |
| SP 3 | 0-1 | 7,654 | 70,307 | 11,621 | 2,805 | 5,610 | 2,004 | 10,419 |
| 1-12 | 12,027 | 78,367 | 2,401 | 0,400 | 3,602 | 3,202 | 7,204 | |
| 12-25 | 10,040 | 74,729 | 5,611 | 0,802 | 2,806 | 6,012 | 9,619 | |
| 25-43 | 5,238 | 78,863 | 7,746 | 2,854 | 0,815 | 4,484 | 8,153 | |
| SP 4 | 0-1 | 2,022 | 79,183 | 8,989 | 2,860 | 2,860 | 4,086 | 9,806 |
| 1-11 | 10,995 | 77,717 | 2,508 | 0,836 | 7,107 | 0,836 | 8,779 | |
| 11-22 | 9,925 | 79,181 | 6,859 | 1,614 | 0,807 | 1,614 | 4,035 | |
| 22-42 | 4,842 | 84,218 | 2,431 | 0,405 | 4,862 | 3,241 | 8,509 | |
| SP 5 | 0-4 | 10,446 | 51,788 | 17,678 | 12,455 | 4,419 | 3,214 | 20,088 |
| 4-13 | 5,929 | 74,439 | 4,808 | 2,804 | 4,006 | 8,013 | 14,824 | |
| 13-28 | 10,557 | 45,504 | 7,730 | 19,121 | 2,441 | 14,646 | 36,208 | |
| 28-56 | 14,396 | 56,407 | 7,705 | 2,028 | 4,461 | 15,004 | 21,492 | |
| 56-78 | 10,047 | 70,914 | 4,051 | 1,215 | 2,431 | 11,343 | 14,989 | |
| 78-95 | 13,603 | 68,988 | 6,073 | 0,405 | 0,405 | 10,526 | 11,336 | |
| SP 6 |
0-13 | 15,493 | 55,457 | 8,876 | 5,649 | 4,035 | 10,490 | 20,173 |
| 13-25 | 8,819 | 73,102 | 7,232 | 2,411 | 0,402 | 8,035 | 10,848 | |
| 35-57 | 18,792 | 46,341 | 11,758 | 10,136 | 2,433 | 10,541 | 23,110 | |
| 57-72 | 17,348 | 60,918 | 7,245 | 2,012 | 3,622 | 8,855 | 14,490 | |
| 72-100 | 15,313 | 69,293 | 5,266 | 1,620 | 2,836 | 5,671 | 10,128 | |
Table 3.
Concentration of heavy metals in soil from the top, bottom, and surrounding areas of the dump.
Table 3.
Concentration of heavy metals in soil from the top, bottom, and surrounding areas of the dump.
| Soil sections | Depth, cm | Total salts, % | Alkalinity, total in HCO₃⁻, % | Total in HCO₃⁻, meq | CO32-, % | CO₃2⁻, meq | Cl-, % | Cl⁻, meq | SO4 2-, % | SO₄2⁻, meq | Ca2+, % | Ca2⁺, meq | Mg2+,% | Mg2⁺, meq | Na+, % | Na+, mg/eq | K+, % | K⁺, meq |
|---|---|---|---|---|---|---|---|---|---|---|---|---|---|---|---|---|---|---|
| SP 1 | 0-2 | 0,181 | 0,029 | 0,48 | 0 | 0 | 0,004 | 0,11 | 0,098 | 2,04 | 0,028 | 1,39 | 0,011 | 0,93 | 0,002 | 0,1 | 0,009 | 0,22 |
| 2-11 | 0,851 | 0,017 | 0,28 | 0 | 0 | 0,004 | 0,11 | 0,581 | 12,09 | 0,235 | 11,75 | 0,006 | 0,46 | 0,002 | 0,1 | 0,007 | 0,18 | |
| 11-25 | 0,882 | 0,015 | 0,24 | 0 | 0 | 0,004 | 0,11 | 0,606 | 12,62 | 0,25 | 12,49 | 0,005 | 0,37 | 0,002 | 0,08 | 0,001 | 0,03 | |
| 25-35 | 0,9 | 0,012 | 0,2 | 0 | 0 | 0,003 | 0,07 | 0,626 | 13,05 | 0,241 | 12,04 | 0,014 | 1,16 | 0,002 | 0,1 | 0,001 | 0,03 | |
| SP 2 | 0-0,3 | 0,301 | 0,017 | 0,28 | 0 | 0 | 0,004 | 0,11 | 0,195 | 4,07 | 0,068 | 3,42 | 0,01 | 0,84 | 0,003 | 0,11 | 0,003 | 0,09 |
| 0,3-14 | 0,809 | 0,012 | 0,2 | 0 | 0 | 0,004 | 0,11 | 0,565 | 11,77 | 0,194 | 9,72 | 0,025 | 2,08 | 0,004 | 0,19 | 0,003 | 0,09 | |
| SP 3 | 0-1 | 0,105 | 0,032 | 0,52 | 0 | 0 | 0,004 | 0,11 | 0,043 | 0,9 | 0,009 | 0,46 | 0,01 | 0,84 | 0,002 | 0,1 | 0,005 | 0,13 |
| 1-12 | 0,376 | 0,015 | 0,24 | 0 | 0 | 0,003 | 0,07 | 0,252 | 5,26 | 0,088 | 4,4 | 0,011 | 0,92 | 0,004 | 0,17 | 0,003 | 0,08 | |
| 12-25 | 0,797 | 0,015 | 0,24 | 0 | 0 | 0 | 0 | 0,555 | 11,57 | 0,204 | 10,19 | 0,017 | 1,39 | 0,004 | 0,17 | 0,003 | 0,07 | |
| 25-43 | 0,887 | 0,017 | 0,28 | 0 | 0 | 0,003 | 0,07 | 0,617 | 12,85 | 0,222 | 11,11 | 0,022 | 1,85 | 0,005 | 0,21 | 0,001 | 0,03 | |
| SP 4 | 0-1 | 0,134 | 0,029 | 0,48 | 0 | 0 | 0,003 | 0,07 | 0,067 | 1,39 | 0,017 | 0,83 | 0,01 | 0,84 | 0,002 | 0,1 | 0,007 | 0,18 |
| 1-11 | 0,083 | 0,017 | 0,28 | 0 | 0 | 0,003 | 0,07 | 0,041 | 0,86 | 0,009 | 0,46 | 0,007 | 0,56 | 0,003 | 0,11 | 0,003 | 0,08 | |
| 11-22 | 0,83 | 0,012 | 0,2 | 0 | 0 | 0,003 | 0,07 | 0,574 | 11,97 | 0,227 | 11,34 | 0,008 | 0,69 | 0,004 | 0,17 | 0,001 | 0,03 | |
| 22-42 | 0,86 | 0,012 | 0,2 | 0 | 0 | 0,003 | 0,07 | 0,605 | 12,6 | 0,208 | 10,42 | 0,028 | 2,31 | 0,003 | 0,11 | 0,001 | 0,03 | |
| SP 5 | 0-4 | 0,084 | 0,027 | 0,44 | 0 | 0 | 0,003 | 0,07 | 0,033 | 0,69 | 0,006 | 0,28 | 0,008 | 0,65 | 0,004 | 0,17 | 0,004 | 0,11 |
| 4-13 | 0,11 | 0,024 | 0,4 | 0 | 0 | 0,003 | 0,07 | 0,055 | 1,14 | 0,007 | 0,37 | 0,011 | 0,93 | 0,005 | 0,21 | 0,004 | 0,11 | |
| 13-28 | 0,087 | 0,029 | 0,48 | 0,01 | 0,2 | 0,003 | 0,07 | 0,034 | 0,71 | 0,006 | 0,28 | 0,008 | 0,65 | 0,007 | 0,3 | 0,001 | 0,03 | |
| 28-56 | 0,077 | 0,02 | 0,32 | 0 | 0 | 0,001 | 0,04 | 0,037 | 0,77 | 0,006 | 0,28 | 0,008 | 0,65 | 0,004 | 0,17 | 0,001 | 0,03 | |
| 56-78 | 0,105 | 0,015 | 0,24 | 0 | 0 | 0,001 | 0,04 | 0,064 | 1,34 | 0,007 | 0,37 | 0,014 | 1,12 | 0,002 | 0,1 | 0,001 | 0,03 | |
| 78-95 | 0,334 | 0,01 | 0,16 | 0 | 0 | 0,003 | 0,07 | 0,234 | 4,88 | 0,059 | 2,96 | 0,025 | 2,04 | 0,002 | 0,08 | 0,001 | 0,03 | |
| SP 6 | 0-13 | 0,091 | 0,02 | 0,32 | 0 | 0 | 0,003 | 0,07 | 0,046 | 0,96 | 0,009 | 0,46 | 0,008 | 0,65 | 0,005 | 0,21 | 0,001 | 0,03 |
| 13-35 | 0,061 | 0,02 | 0,32 | 0 | 0 | 0,003 | 0,07 | 0,023 | 0,48 | 0,007 | 0,37 | 0,003 | 0,28 | 0,004 | 0,19 | 0,001 | 0,03 | |
| 35-57 | 0,216 | 0,015 | 0,24 | 0 | 0 | 0,001 | 0,04 | 0,148 | 3,08 | 0,019 | 0,93 | 0,026 | 2,14 | 0,006 | 0,26 | 0,001 | 0,03 | |
| 57-72 | 0,203 | 0,015 | 0,24 | 0 | 0 | 0,013 | 0,36 | 0,121 | 2,53 | 0,022 | 1,11 | 0,017 | 1,39 | 0,014 | 0,59 | 0,001 | 0,03 | |
| 72-100 | 1,059 | 0,007 | 0,12 | 0 | 0 | 0,019 | 0,55 | 0,723 | 15,05 | 0,218 | 10,88 | 0,022 | 1,85 | 0,068 | 2,96 | 0,001 | 0,03 |
Table 4.
Concentration of heavy metals in soil from the top, bottom, and surrounding areas of the dump.
Table 4.
Concentration of heavy metals in soil from the top, bottom, and surrounding areas of the dump.
| Det. Ind. | Forms of Frac. |
Results, mg/kg | |||||||||||
|---|---|---|---|---|---|---|---|---|---|---|---|---|---|
| SP 1 | SP 2 | SP 3 | SP 4 | SP 5 | SP 6 | ||||||||
| 0-11 cm | 11-25 cm | 0-3 cm | 3-14 cm | 0-1 cm | 1-12 cm | 0-1 cm | 1-11 cm | 0-13 cm | 13-28 cm | 0-13 cm | 13-35 cm | ||
| Cu | Total | 48,13 | 46,66 | 47,38 | 47,91 | 38,21 | 49,62 | 23,58 | 50,12 | 12,36 | 52,37 | 15,97 | 3,163 |
| Mobile | 8,879 | 4,221 | 8,773 | 3,976 | 8,123 | 3,834 | 7,838 | 3,319 | 1,346 | 0,395 | 0,703 | 0,606 | |
| Zn | Total | 96,81 | 85,17 | 94,58 | 83,72 | 91,35 | 82,74 | 89,35 | 79,58 | 96,9 | 73,4 | 64,49 | 49,37 |
| Mobile | <0,5 | <0,5 | <0,5 | <0,5 | <0,5 | <0,5 | <0,5 | <0,5 | <0,5 | 5,127 | <0,5 | <0,5 | |
| Cd | Total | <0,05 | <0,05 | <0,05 | <0,05 | <0,05 | <0,05 | <0,05 | <0,05 | <0,05 | <0,05 | <0,05 | <0,05 |
| Mobile | <0,05 | <0,05 | <0,05 | <0,05 | <0,05 | <0,05 | <0,05 | <0,05 | <0,05 | <0,05 | <0,05 | <0,05 | |
| Pb | Total | 308 | 284 | 298 | 256 | 223 | 197 | 194 | 176 | 15,26 | 13,89 | 10,61 | 11,79 |
| Mobile | 80,35 | 41,15 | 79,58 | 39,95 | 72,16 | 37,02 | 70,34 | 35,23 | 2,356 | <0,5 | 0,887 | 0,824 | |
| Co | Total | 18,31 | 19,79 | 17,98 | 18,11 | 15,78 | 16,92 | 13,89 | 13,22 | 7,21 | 10,39 | 8,65 | 8,399 |
| Mobile | 5,223 | 2,068 | 4,989 | 2,001 | 4,867 | 1,976 | 2,567 | 1,345 | 0,685 | 1,058 | 0,907 | 0,501 | |
| Ni | Total | 28,46 | 30,95 | 26,32 | 29,72 | 23,32 | 29,13 | 21,62 | 28,83 | 19,6 | 28,76 | 21,64 | 20,19 |
| Mobile | 4,153 | 2,262 | 3,996 | 2,146 | 3,772 | 1,954 | 2,458 | 1,912 | 1,541 | 1,851 | 1,398 | 0,812 | |
| Mo | Total | 18,12 | 16,99 | 17,86 | 15,34 | 9,43 | 5,34 | <1,0 | 1,32 | <1,0 | 1,32 | 1,03 | <1,0 |
| Mobile | <1,0 | <1,0 | <1,0 | <1,0 | <1,0 | <1,0 | <1,0 | <1,0 | <1,0 | <1,0 | <1,0 | <1,0 | |
| Ag | Total | <0,5 | <0,5 | <0,5 | <0,5 | <0,5 | <0,5 | <0,5 | <0,5 | <0,5 | <0,5 | <0,5 | <0,5 |
| Mobile | <0,5 | <0,5 | <0,5 | <0,5 | <0,5 | <0,5 | <0,5 | <0,5 | <0,5 | <0,5 | <0,5 | <0,5 | |
| As | Total | 5,96 | 3,66 | 5,74 | 3,12 | 4,86 | 2,87 | 3,77 | 2,13 | 0,380 | 1,58 | 0,652 | <0,05 |
| Mobile | 0,291 | 0,064 | 0,243 | 0,061 | 0,196 | 0,058 | <0,05 | <0,05 | <0,05 | <0,05 | <0,05 | <0,05 | |
Table 5.
Concentration of heavy metals in natural soils outside the technologically disturbed area.
| Measured indicator | Forms of fractions | Results, mg/kg | |||
|---|---|---|---|---|---|
| Point 1 | Point 2 | ||||
| 0-20 cm | 20-40 cm | 0-20 cm | 20-40 cm | ||
| Cu | Total | 3,542 | 1,748 | 12,672 | 22,83 |
| Mobile | 1,731 | 0,974 | 1,274 | 2,730 | |
| Zn | Total | 46,33 | 44,72 | 50,422 | 73,77 |
| Mobile | <0,5 | <0,5 | <0,5 | <0,5 | |
| Cd | Total | <0,05 | <0,05 | <0,05 | <0,05 |
| Mobile | <0,05 | <0,05 | <0,05 | <0,05 | |
| Pb | Total | 10,31 | 8,618 | 11,34 | 14,96 |
| Mobile | 2,163 | 1,672 | 1,169 | 2,146 | |
| Co | Total | 7,542 | 7,422 | 7,987 | 9,704 |
| Mobile | 0,909 | 0,792 | 0,544 | 0,978 | |
| Ni | Total | 20,71 | 20,48 | 21,27 | 25,15 |
| Mobile | 2,451 | 1,534 | 0,748 | 1,511 | |
| Mo | Total | <1,0 | <1,0 | <1,0 | <1,0 |
| Mobile | <1,0 | <1,0 | <1,0 | <1,0 | |
| Ag | Total | <0,5 | <0,5 | <0,5 | <0,5 |
| Mobile | <0,5 | <0,5 | <0,5 | <0,5 | |
| As | Total | <0,05 | <0,05 | 0,291 | <0,05 |
| Mobile | <0,05 | <0,05 | <0,05 | <0,05 | |
Table 6.
Concentration of heavy metals in soil across the tailings area.
| Det. Ind. | Forms of Frac. |
Results, mg/kg | |||||
|---|---|---|---|---|---|---|---|
| Tailings (Gray) Layer I | Tailings (Red) Layer I | Tailings (Black) Layer II | |||||
| 0-20 cm | 20-40 cm | 0-20 cm | 20-40 cm | 0-20 cm | 20-40 cm | ||
| Cu | Total | 138,11 | 70,28 | 85,33 | 41,74 | 33,79 | 18,92 |
| Mobile | 3,748 | 4,694 | 5,275 | 6,885 | 5,028 | 3,941 | |
| Zn | Total | 127,94 | 112,89 | 167,1 | 114,2 | 133,7 | 2,216 |
| Mobile | <0,5 | <0,5 | 3,254 | <0,5 | 11,13 | <0,5 | |
| Cd | Total | 0,128 | 0,098 | 0,130 | 0,129 | 0,171 | <0,05 |
| Mobile | 0,068 | <0,05 | <0,05 | <0,05 | <0,05 | <0,05 | |
| Pb | Total | 51,79 | 56,94 | 72,595 | 35,79 | 56,48 | 13,68 |
| Mobile | 20,36 | 20,20 | 21,12 | 16,24 | 21,33 | 5,559 | |
| Co | Total | 18,9 | 15,56 | 22,38 | 12,48 | 16,47 | 9,413 |
| Mobile | 6,534 | 5,015 | 5,969 | 5,413 | 6,992 | 4,708 | |
| Ni | Total | 50,59 | 46,9 | 56,81 | 38,73 | 44,40 | 21,14 |
| Mobile | 8,645 | 8,449 | 8,756 | 9,902 | 10,08 | 5,882 | |
| Mo | Total | 3,65 | 2,05 | 2,387 | 1,685 | 2,01 | <1,0 |
| Mobile | <1,0 | <1,0 | <1,0 | <1,0 | <1,0 | <1,0 | |
| Ag | Total | <0,5 | <0,5 | <0,5 | <0,5 | <0,5 | <0,5 |
| Mobile | <0,5 | <0,5 | <0,5 | <0,5 | <0,5 | <0,5 | |
| As | Total | 17,60 | 20,71 | 19,15 | 19,71 | 15,77 | 4,05 |
| Mobile | 2,76 | 4,22 | 3,68 | 5,83 | 3,60 | 1,19 | |
Disclaimer/Publisher’s Note: The statements, opinions and data contained in all publications are solely those of the individual author(s) and contributor(s) and not of MDPI and/or the editor(s). MDPI and/or the editor(s) disclaim responsibility for any injury to people or property resulting from any ideas, methods, instructions or products referred to in the content. |
© 2025 by the authors. Licensee MDPI, Basel, Switzerland. This article is an open access article distributed under the terms and conditions of the Creative Commons Attribution (CC BY) license (http://creativecommons.org/licenses/by/4.0/).
Copyright: This open access article is published under a Creative Commons CC BY 4.0 license, which permit the free download, distribution, and reuse, provided that the author and preprint are cited in any reuse.


