
Submitted:
10 April 2025
Posted:
10 April 2025
You are already at the latest version
Abstract
Liming is a common practice for improving the quality of soils affected by acidity, due to climate change, acid rain, nitrate leaching, and oxidation of sulphide minerals. This study aimed not only to assess the efficiency of fine and coarse lime application at 3 t/ha and 6 t/ha doses in mitigating soil acidity, but also to determine which of the options has a stronger impact on improving subsoil characteristics. Over a period of two years, several key parameters were monitored: pH, exchangeable base cations (Caexch, Mgexch, and Kexch), and Alexch. In the topsoil, the highest increase in pH was observed 6 months after the ap-plication of 3 t/ha fine lime, while in the subsoil, only a modest increase was noted. The highest values of exchangeable base cations in the topsoil were: Caexch = 9.06 cmol/kg soil; Mgexch = 1.15 cmol/kg soil; Kexch = 0.360 cmol/kg soil. These were recorded 24 months after applying 6 t/ha of fine aglime, and were higher than those obtained in the subsoil. While in topsoil Alexch reached 0 at T3, in subsoil, the largest decrease was 38% at T3. The release rate of ca Ca and its mobility depend on the particle size and dose of aglime, playing an important role in alleviating aluminium toxicity.
Keywords:
pH
; exchangeable calcium
; exchangeable magnesium
; cation exchange capacity
1. Introduction
Soil acidification has a significant impact on reducing crop productivity and damaging terrestrial and aquatic ecosystems. Approximately 4 billion hectares of land worldwide are estimated to suffer from varying levels of acidity [1]. While soil acidity typically increases gradually in natural ecosystems, extensive studies have revealed that soil pH can shift rapidly from alkaline to acidic when annual precipitation surpasses annual potential evapotranspiration [2,3]. Major factors driving soil acidification include nitrate leaching, caused by ammonium fertilizers and biological nitrogen fixation, removal of crop products, accumulation of organic matter, acid rain and oxidation of sulphide minerals [4].
Acidic soils are characterized by low pH, reduced cation exchange capacity (CEC), and decreased base saturation. Natural processes like the leaching of cations and decomposition of organic matter alter soil pH. The displacement of essential basic cations, which move deeper into the soil, is harmful as they are replaced by elements like aluminium, iron, manganese, and hydrogen [5]. This chemical shift reduces nutrient availability, thereby lowering crop yields [1].
The chemical properties of soil, including plant nutrient availability, are heavily influenced by pH. When soil pH falls below 5.5, deficiencies in nutrients such as nitrogen, phosphorus, potassium, sulphur, calcium, magnesium and molybdenum occur, making a pH increase necessary for optimal crop growth [6]. Soil fertility depends heavily on CEC, with lower CEC leading to faster pH changes and weaker buffering capacity [7].
Tian and Niu (2015) [8] conducted a meta-analysis of 106 studies to identify global patterns of soil acidification. Their findings revealed that nitrogen addition globally reduced soil pH by an average of 0.26, shifting soils into the Al3+ buffering phase. In Romania, the use of chemical fertilizers per hectare increased by 63.33% from 60 kg a.s./ha in 2007 to 98 kg a.s./ha in 2020, with 60 kg a.s./ha being nitrogen primarily applied as ammonium nitrate and urea [9]. The annual application of nitrogen fertilizers contributes to soil acidification, primarily through nitrate leaching and the release of hydrogen ions during the conversion of ammonium-based fertilizers [10]. Over time, these processes lower soil pH, reduce cation exchange capacity, and decrease base saturation. Base cations such as Ca2+, Mg2+, and K+ play a crucial role in buffering against nitrogen-induced soil acidification in its early stages.
Liming is a widely adopted method for improving the quality of acidic soils, providing both direct and indirect benefits. It influences soil acidity, nutrient mobility, heavy metal behavior, aggregate stability, and biological activity [11]. Studies show that lime reduces exchangeable and soluble aluminum, increases soil pH, and enhances the availability of nutrients like phosphorus, nitrogen, calcium, and magnesium [12]. Additionally, liming promotes microbial activity, boosts organic matter decomposition, facilitates nutrient absorption, and strengthens soil structure by forming stable aggregates. By balancing soil pH, lime decreases toxicity caused by hydrogen, aluminum, and manganese [13,14]. It produces bicarbonate (HCO₃⁻) and hydroxide (OH⁻), which neutralize H⁺ and Al³⁺ ions, raising soil pH through reactions with carbon dioxide and water. Research by Daba et al. [15] highlights the significant improvement in wheat and maize yields due to lime's role in elevating soil pH, increasing exchangeable base cations (e.g., Ca²⁺ and Mg²⁺), and reducing aluminum toxicity, with pH adjustment being the most impactful. The required lime amount depends on factors such as soil acidity severity, soil properties, land use, and fertilizer application methods. However, the effectiveness of various lime types in improving soil chemical properties is not well-documented. Field efficiency of lime application is influenced by material fineness, even distribution, and thorough soil mixing; yet, due to limited effectiveness in field conditions, application rates are often doubled. Moreover, treating acidic subsoil presents a significant challenge, as surface lime application does not effectively address subsoil acidity [4].
Calcium carbonate, despite being a limited natural resource, remains the most widely used amendment for neutralizing acidic soils due to its cost-effectiveness and efficiency [3]. By neutralizing excess hydrogen ions, it enhances agricultural productivity [16]. Additionally, it improves the soil’s chemical and physical properties while promoting nutrient uptake by plants [15]. Its long-term presence in the soil significantly influences its effectiveness, as it is essential for enhancing the productivity of acidic soils.
Given the limited data on the effectiveness of various lime types and the frequent need to double application rates, this study aimed to assess the effectiveness of fine and coarse agricultural lime applications at rates of 3 t/ha and 6 t/ha in mitigating soil acidity. Over a two-year period, it focused on evaluating key parameters, including soil pH changes, cation exchange capacity (CEC), levels of exchangeable base cations (Ca2+, Mg2+, and K+), and exchangeable aluminium. Furthermore, the study examined whether the fineness of lime or higher application rates had a more substantial impact on enhancing subsoil characteristics compared to lower rates.
2. Materials and Methods
2.1. Experimental site
The experimental field GPS coordinates are: 45°25'31.8"N 21°23'51.8"E, located in Barzava Plain, in the West part of Romania.
From a climatic point of view, the area where the experimental field was located is characterized by an average annual temperature of 10.5°C and an annual average of precipitation between 600-700 mm, distributed unevenly throughout the year. The number of days with snow on the ground is an average of 25 days, a fact determined by the geographic position.
The type of soil on which the research was carried out is a Gleyic Fluvisols with the main characteristics presented in Table 1.
The study took place between September 2022 and March 2024, utilizing randomized experimental plots measuring 50m x 30m under maize cultivation. The design included four amendment variants arranged in three replications. Agricultural limestone (aglime) with 98% CaCO₃ was applied in two distinct doses—3 t/ha and 6 t/ha—and two granulometries: coarse (1–2 mm) and fine (0.1 mm). pH, base cations and exchangeable aluminum were monitored at two soil depths, topsoil 0–20 cm (d1) and subsoil 20–40 cm (d2). Figure 1 provides a graphical representation of the experimental setup.
2.2. Soil Sampling
To determine the influence of aglime on pH, CEC, and the exchangeable forms of Ca, Mg, K, and Al, four soil sampling periods were established: T₀ – September 2022 (before aglime application), T₁ – March 2023 (6 months after application), T₂ – September 2023 (12 months after application), T₃ – March 2024 (18 months after application).
Soil samples were collected from each replication of each aglime variant at two depths during the four sampling periods, resulting in a total of 96 soil samples. After collection, soil samples from the two specified depths were placed in labelled polyethylene bags. Prior to laboratory analysis, the samples were air-dried and passed through a 2 mm soil sieve to separate the fine soil fraction (<2 mm) from the coarse fraction [17,18,19].
2.2.1. pH Determination
Soil pH was measured according the FAO, [20,21,22], which recommends a 1:2.5 soil-to-water ratio. For the measurements a Mettler Toledo digital pH-meter was used, bearing a combine glass electrode, which had been previously calibrated with buffer solutions of pH=4, pH=7, pH=10, using reagents of analytical grade (Merck).
2.2.2. Exchangeable Ca (Caexch), Mg (Mgexch), and K (Kexch) Determination
The exchangeable forms of Caexch, Mgexch, and Kexch were determined from the 0.1M BaCl₂·2H₂O soil extract using atomic absorption spectrometry. A 2 g soil sample (<2 mm sieved) was subjected to repeated extraction with 20 ml of 0.1M BaCl₂·2H₂O to obtain a final volume of approximately 100 ml. Merck-grade reagents were used [23]. After filtration and adjusting the extract to a final volume of 100 ml, the concentrations of Caexch, Mgexch, and Kexch were determined using a Varian 240 FS (USA) atomic absorption spectrophotometer. The working conditions were as follows: air:acetylene ratio = 13.50:2, Nebulizer uptake rate = 5 ml/min, Wavelengths: λCa = 422.7 nm, λMg = 282.5 nm, λK = 766.5 nm. For calibration were used standard solutions with the concentration ranging from 0.3 to 3 mg/l, prepared from multielement solution ICP Standard solution 1000 mg/L (Merck).
2.2.3. Exchangeable Al (Alexch) Determination
Alexch was determined using ICP-MS (Inductively Coupled Plasma Mass Spectrometry) on a PlasmaQuant Elite – Analytik Jena instrument with an AIM3300 autosampler (Germany), from a 1M KCl extract, using a soil-to-solution ratio of 1:10. The instrument's operating conditions were as follows: plasma flow: 9 L/min, auxiliary flow: 1.50 L/min, nebulizer flow: 1.05 L/min, sampling depth: 5 mm, RF power: 1.40 kW. For calibration, standards with concentrations ranging from 0.5 to 100 µg/L were prepared from a multi-element ICP standard solution (1000 mg/L, Merck). A 10 µg/L Sc internal standard (Analytik Jena) was used.
2.2.4 CEC Determination
CEC was calculated based on the exchangeable forms of the base cations: Ca, Mg, K, and Al, using the following equation [24]:
(1)
2.3 Data Analysis
Statistical analysis was performed using Microsoft Excel, SPSS 12.0, and OriginPro 2024b. Statistical significance level was determined at 0.05 (p value). The results for pH, Caexch, Mgexch, Alexch and Kexch were expressed as mean ± standard deviation (SD) (n=3). Correlation analysis was carried out to determine the association between soil parameters at different time intervals after the application of the two aglime doses with two different granulometries. Analysis of variance (ANOVA) and mean separation (Tuckey test) were carried out to identify the statistical significance of the effect of aglime rate and granulation on some soil parameters. For dimensionality reduction, principal component analysis (PCA) with varimax rotation was performed to provide a concise and optimal description of the data.
3. Results
The values obtained for the investigated parameters, expressed as the mean of three distinct determinations ± SD, are presented in Table 2 and Table 3. To determine whether there were significant differences between the experimental variants at the same time after lime application, the means were compared using ANOVA and the Tukey test at a statistical significance level of α = 0.05.
3.1. Modification in Soil pH Values
In variant V1 (Table 2), soil pH increased from 5.08 to 6.47 in the topsoil (d1) and from 5.15 to 5.85 in the subsoil (d2). The highest pH value for V1 was recorded at T2 in the topsoil, while in the subsoil it peaked at T3. In variant V2, the maximum pH values, 6.55 for d1 and 5.85 for d2, were both reached at T2. For V3, the highest pH in the topsoil (6.60) was observed at T3, whereas the subsoil's maximum pH (5.70) occurred at T2.
At T2, statistical analysis (α = 0.05) showed significant differences in the highest pH values between V2 (d1) and V3 (d2), as well as between V1 (d1) and V2 (d2). Similarly, at T3, significant differences were noted between V4 (d2) and V3 (d1), as well as within V4 (d1 and d2). In variant V4, pH values rose from 5.06 to 6.60 in the topsoil and from 5.17 to 5.60 in the subsoil, with the highest pH levels for both depths recorded at T3.
During T1, V2 exhibited the most significant pH increase, rising by 12% in the topsoil and 6% in the subsoil (Table S1). At T2, V4 showed the largest pH increase in the topsoil, with a 23% rise compared to T0, while in the subsoil, V2 recorded the greatest increase, an 8% rise relative to T0. Fine lime applied to the topsoil (d1) resulted in the highest pH increase at T2, regardless of the quantity applied, whereas coarse lime was most effective at T3. In the subsoil (d2), the greatest pH increase was observed at T3 following the application of 3 t/ha fine lime (V2).
3.2. CEC Values After Lime Application
The cation exchange capacity (CEC) rises as pH values increase, because of the deprotonation of pH-dependent charges. These charges originate from either the carboxylic or phenolic groups in organic matter, or from aluminium or iron hydroxides. The greatest increases in CEC values were observed with the application of 6 tons per hectare of fine lime (V4), regardless of the time elapsed since the amendment was applied (Table 2). In this variant, the increases compared to T0 are 16% at T1, 18% at T2, and 24% at T3. When the same amount of amendment is applied for the same duration, fine lime results in greater increases in CEC compared to coarse lime. The highest CEC value recorded was 12.43 cmol/kg with the application of 6 tons per hectare of fine lime at T3, at d1. At depth d2, the maximum CEC value was 12.21 cmol/kg in V3 at T3. Between the two mentioned values, there are no significant differences at a statistical significance level of α = 0.05. However, the increase in CEC values compared to T0 is roughly the same for both V3 and V4, at 23.9% and 23.3%, respectively (Table S1).
3.3. Modification of Exchangeable Ca, Mg and K Values
The studied soil exhibits a basification of the colloidal complex due to both pH-dependent and permanent charges of mineral colloids, resulting in aluminium ions (Al³⁺, Al(OH)²⁺, Al(OH)₂⁺) replacing basic cations in the cation exchange capacity. Consequently, the Caexch content is reduced, ranging from 4.62 to 4.71 cmol/kg at T0 (Table 3). The application of aglime increased this content, with a maximum value of 9.06 cmol/kg observed in V4 T3 at d1, which is 48% higher than in V3 at T0. Over time, the calcium content retained by the colloidal complex increases following aglime application. This gradual effect is due to the slow reactivity of lime in releasing Ca²⁺ ions, resulting in a longer-lasting impact. Similar values were found in V1 at T3 and V3 at T3, with 8.1 cmol/kg (41.9% higher than T0) and 8.2 cmol/kg (42.5% higher than T0) (Table S1), respectively. Statistically, there are no significant differences between these maximum values at a significance level of α = 0.05. Caexch at depth d2 are significantly lower compared to d1, with the highest value recorded in the V3 at T3 variant at 7.85 cmol/kg.
The application of lime resulted in an increase in exchangeable magnesium (Mgexch) content, which rose from 0.74 cmol/kg to 1.15 cmol/kg at d1 in variant V3 at T3 (Table 3). Lower increases in exchangeable Mg were observed at d2, with the highest value being 1.03 cmol/kg in variant V2 at T3. Regardless of the lime amount, the content of exchangeable Mg increases with time after its application. At d1, the most significant increases in Mgexch compared to T0 were at doses of 6 t/ha, with coarse lime showing an increase of 34.7% and fine lime an increase of 31.8% (Table S1). At d2, the largest increases compared to T0 were at doses of 3 t/ha, with coarse lime showing an increase of 18.6% and fine lime 19.4%. The mean values determined for Mgexch, regardless of the experimental variant and depth, do not differ significantly at a statistical level of assurance α=0.05, at any of the time intervals: T1(P=0.666), T2(P=0.116), T3 (P=0.318).
The treatments with 3 t/ha F (fine lime) and 6 t/ha F show a rapid increase in the Ca/Mg ratio, reaching a peak around T1/T2 before slightly declining by T3 (Figure 2). This indicates that fine lime dissolves quickly, releasing calcium (Ca) into the soil at an accelerated rate and temporarily boosting the Ca/Mg ratio. The 6 t/ha F treatment exhibits a more pronounced effect than 3 t/ha F, achieving the highest peak. In contrast, the 3 t/ha C and 6 t/ha C treatments display a steadier rise in the Ca/Mg ratio without a sharp peak. The 6 t/ha C treatment has the lowest R² value (0.4425), reflecting higher variability, likely due to its slower soil breakdown. The 3 t/ha C treatment follows a consistent linear trend (R² = 0.952), resulting in a gradual, predictable increase in Ca/Mg over time.
Exchangeable potassium (Kexch) content also increased with depth, lime additions, and time since application. The values ranged from 0.110 cmol /kg to 0.360 cmol /kg (Table 3). Although lower compared to Mgexch values, the increases relative to T0 ranged from 23.2% in variant V5T1 to 60.5% in variant V4T3. Like Caexch and Mgexch, Kexch content at a d1 was higher than at d2, regardless of the fertilization variant. The application of fine lime, at both doses and depths, resulted in higher increases in Kexch content, particularly at T1 and T2. At T3, the highest content at both depths was achieved with the application of 6 t/ha fine lime (an increase of 60.5% at T1 and 56.2% at T2) and coarse lime (an increase of 55.1% at T1 and 49.2% at T2) (Table S1). It was observed that there were no significant differences between the mean values determined in the 4 experimental variants, at the 2 depths (d1 and d2) at α=0.05, both at the time interval T1 (P=0.434) and T2 (P=0.137).
3.4. Exchangeable Aluminium
Alexch is present in significant quantities in acidic soils with pH levels below 5.5. Analysis of the samples indicates that (Table 2) the Alexch content decreases as soil acidity diminishes, with values ranging from 3.3 cmol/ kg soil in V3T0 (d1) to 0 cmol/ kg soil in V3T3 (d1) and V4T3 (d1). At the highest amount of aglime applied, Alexch content declines further over time following amendment application. At T1, Alexch content decreases in d1 by 32.12% in V3 and 37.14% in V2, and in d2 between 4.29% in V3 and 12.90% in V1. It was observed that there were no significant differences between the mean values determined in the 4 experimental variants, at the 2 depths at α=0.05, at the time interval T1 (P=0.2665). By T2, regardless of depth, the reduction in Al³⁺ content in the colloidal complex doubles, reaching 89.3% in V4 at d1 and 29.03% in V3 at d2 (Table S1). Although the findings reveal that fine lime is more effective than coarse lime in reducing Alexch content, in subsoil this phenomenon is reduced.
3.5 Pearson Correlations
Examining the Pearson correlation matrix across three-time intervals (T1, T2, and T3) within the four experimental variants (V1–V4) and two soil depths (0–20 cm and 20–40 cm), several trends are observed.
At T1, there are strong positive correlations between CEC and Caexch (R=0.87), and between Mgexch and Kexch (R=0.89) (Figure 3). A negative correlation exists between pH and Alexch (R=-0.75). Lime application typically increases soil pH, reducing acidity, which aligns with the observed negative correlation between pH and exchangeable aluminium.
T2 reveals strong positive correlations between pH and Caexch (R=0.87), pH and Mgexch (R=0.78), and pH and Kexch (R=0.85) (Figure 4). Additional positive correlations are noted between Caexch and Kexch (R=0.94), Mgexch and Kexch (R=0.83), and Caexch and Mgexch (R=0.67). Strong negative correlations are present between Alexch and pH (R=-0.98), Alexch and Caexch (R=-0.86), Alexch and Mgexch (R=-0.84), and Alexch and Kexch (R=-0.87). These relationships highlight lime’s role in increasing soil pH, reducing aluminium toxicity, and enhancing nutrient availability.
At T3, strong positive correlations between pH and Caexch (R=0.63), pH and Mgexch (R=0.80), and pH and Kexch (R=0.79) persist, alongside correlations between Caexch and Kexch (R=0.91) and Mgexch and Kexch (R=0.79) (Figure 5). Positive correlations between CEC and Ca exch (R=0.77), CEC and Kexch (R=0.66), and CEC and Mgexch (R=0.43) are intensified. Strong negative correlations between Alexch and pH (R=-0.95), Alexch and Caexch (R=-0.63), Alexch and Mgexch (R=-0.82), and Alexch and Kexch (R=-0.87) are maintained.
Our findings underscore aglime’s effectiveness in enhancing soil health by neutralizing acidity, reducing exchangeable aluminium, and improving nutrient availability (calcium, magnesium, and potassium). Sixteen months after application, the lasting improvements emphasize the long-term benefits of lime amendments for soil fertility and plant growth.
3.6 Principal Component Analysis
Principal component analysis (PCA), Figure 6 – applied to data obtained at intervals T1, T2 and T3, at depth d1 extracted 2 components with Eigenvalue˃1 that provide in total 94.21% of the total variation. PC1 contributing with 81.65% of the total variance is strongly correlated with pH and the exchangeable content of Ca, Mg and K. This indicates that both pH and Caexch, Mgexch and Kexch are strongly and directly influenced by the addition of aglime in the soil. PC2 accounts for the next 20.58% and its correlated with CEC and Alexch. Analysing Figure 6 it is observed that aglime, at a dose of 6t/ha (V3 and V4), regardless of granulation, at interval T3 determines the highest values for Caexch, respectively Kexch. The Alexch content, on the other hand, is strongly influenced by the same V3 and V4 variants, at the T1 time interval.
4. Discussion
The effectiveness of calcium carbonate in raising pH levels depends on factors such as soil texture, organic matter, and the size of lime particles [25]. While the greatest pH increases in T1 occurred with 3 t/ha of fine lime, the most notable differences compared to T0 at T2 and T3 were observed with 6 t/ha of fine lime. Enesi et al. [26] demonstrated that higher lime application rates yielded greater pH increases and improved yields, while Oliver et al. [27] emphasized liming rate as the most influential factor for pH and yield changes in acidic soils. The soil's buffering capacity, or its resistance to pH alterations, dictates the lime quantity required for significant changes. Although higher lime amounts can more effectively overcome buffering capacity, the resulting pH increase can vary with management practices [28]. Greater lime application neutralizes more acidity, producing a higher final pH. Our findings align with [29], who found that changes in soil pH depended on lime rates, time post-application, and soil depth.
Finer lime particles have a greater surface area in contact with the soil, enabling a faster and more efficient reaction with soil acids, which accelerates the pH increase. Their smaller size allows them to dissolve more quickly, ensuring a prompt adjustment in soil pH. In contrast, coarser particles dissolve at a slower rate, leading to a more gradual pH change. Additionally, finer particles distribute more evenly throughout the soil, promoting a consistent pH adjustment, while coarser particles may lead to uneven changes. Overall, finer lime particles contribute to a quicker and more uniform rise in soil pH, whereas coarser particles offer a slower yet sustained effect. This conclusion aligns with findings from [30], which highlighted that powdered lime was the most effective, achieving the highest pH increase in both severely acidic (+19%) and moderately acidic (+14%) environments. In a study examining lime particle sizes ranging from 3 mm to 0.005 mm, Scott et al. [31] observed that finer particles consistently caused larger pH increases, with no minimum particle size for maximum efficacy identified.
Improving subsoil acidity is notably challenging, as liming often proves ineffective due to the slow downward movement of lime within soil profiles. Our study revealed only a modest increase in soil pH at a depth of 20-40 cm following liming. Lime predominantly impacts the topsoil, moving through the profile at a very gradual pace. Over time, it can incrementally enhance subsoil pH by neutralizing acidity, provided it is applied in adequate amounts and properly incorporated. Du Toit et al. [32] demonstrated that liming raised soil pH above the target level of 5.5 at depths of 5–10 cm (pH 6.83) and 10–15 cm (pH 5.73), but showed no significant effect at depths of 15–40 cm. Research made in New Zeeland showed that lime application at 8 t/ha increased soil pH by about 0.5 pH units in the 7.5-15 and 15-30 cm soil horizons [33].
The mineralogical study conducted by [34], utilizing X-ray diffraction of the soil, revealed that the upper horizons contain illitic (30%), chloritic (50%), and kaolinitic minerals (<15%). Due to the soil's acidic nature, the cation exchange capacity (CEC) is low because of the presence of H⁺ and Al³⁺ ions, which occupy exchange sites and reduce the overall CEC. At low pH values (pH < 5.5), only the permanent charges of 2:1 type clay and a small portion of the pH-dependent charges of organic colloids and 1:1 type clay holds exchangeable ions.
After lime application, as the pH increases, the negative charges of 1:1 type clay (such as kaolinite), humus, and even Fe and Al oxides increase, thereby enhancing the cation exchange capacity [35]. The effect of calcium carbonate application in this study on cation exchange capacity aligns with previously reported results [36]. These effects mainly involve a decrease in the Al level in the soil and, consequently, a decrease in the effective saturation of Al in the exchange complex, as well as an increase in the proportion of Ca in the exchange complex for both studied soils [37,38,39]. Fine lime particles react more quickly, increasing soil pH relatively fast. As the pH increases, the negative charge on clay minerals and organic matter may slightly increase, enhancing the soil's CEC. Coarse lime particles dissolve more slowly, having minimal immediate effect on pH and CEC. Lime application promotes microbial activity and organic matter breakdown, leading to the formation of new functional groups (such as carboxyl and phenol groups), which can contribute additional cation exchange sites, further increasing CEC.
Applying lime to the soil generally increases the calcium content in the topsoil, and this increase is directly proportional to the amount of lime applied. Similar results were observed in [40], which showed that the highest exchangeable levels of Ca, Mg, and K were recorded in plots that received the highest dose of lime. Lime primarily affects the soil layers where it is incorporated [41]. In our study, lime was applied and mixed into the topsoil, resulting in the most significant immediate increase in calcium content there. Over time, some calcium from the lime leached into the subsoil, particularly with substantial autumn rainfall. Fine lime particles provided relatively faster calcium release and movement even in the subsoil, as their smaller size allows easier transport by water moving through the soil profile, enabling deeper layer penetration. Coarser lime particles dissolve and release calcium more slowly. However, due to their limited movement through the soil, calcium release is more gradual and sustained over a longer period. Because of the sandy loam texture of the studied soil, calcium may leach faster compared to clay-rich soils, leading to an increase in calcium content in the subsoil.
Aluminium toxicity poses a significant challenge in acidic soils, as pH levels below 5.5 cause aluminium to be solubilized into toxic ionic forms like Al³⁺, which hinder plant root growth and nutrient absorption [42,43]. At pH levels between 5.0 and 5.25, Al(OH)₂⁺ species dominate, while between 5.25 and 6.50, Al(OH)₂⁺ becomes predominant. According to Sparks et al. [4], 6–28% of the total aluminium in soil solution occurs as free Al³⁺. Post-liming, as pH rises, the concentration of monomeric Al³⁺ ions decrease, giving way to Al-hydroxy species. In the topsoil layer (0-20 cm), as pH exceeds 5.5 beginning at T2, Al-hydroxy ions likely polymerize, forming large, positively charged structures tightly bound to the negatively charged colloidal sites, rendering them non-exchangeable. By T3, the increasing concentration of Ca²⁺ ions raise the pH to values between 6.3 and 6.63. Calcium ions from lime exhibit a higher affinity for exchange sites on soil colloids compared to Al³⁺, displacing Al ions, which subsequently precipitate as Al(OH)₃. This displacement frees the negative colloidal sites for further cation exchange.
A study by Moir and Moot [33] demonstrated that liming reduced Al exch levels in the surface soil horizon (0-7 cm) from 0.9 to 0.1–0.2 meq/100 g. However, the effects were less pronounced in deeper horizons, showing only modest reductions in Al exch. This increase in pH resulted in a decline of exchangeable aluminium, from around 1.0 meq/100 g at an 8 t/ha lime rate to approximately 0.45 and 1.1 meq Al/100 g in the 7.5–15 cm and 15–30 cm soil horizons, respectively. Literature indicates that aluminium toxicity remains a concern in soils with pH below 5.5, while Whitley et al. [44] reported that soils with pH (H₂O) up to 5.9 may still exhibit aluminium concentrations toxic to plants.
By analysing PCA we can see that V3 and V4 generally show stronger effects on improving soil properties like pH, calcium (Caexch), magnesium (Mgexch), and potassium (Kexch), as indicated by their alignment with vectors for these parameters in the PCA biplot. The higher lime dose likely enhances nutrient availability and neutralizes acidity more effectively. V1 (3 t/ha coarse lime) and V2 (3 t/ha fine lime) show a milder impact, with less pronounced changes in soil properties. However, fine lime (V2) may exhibit quicker reactivity compared to coarse lime (V1), due to its finer granulometry. At d1 (0–20 cm), lime application tends to have a greater influence, as reflected by stronger positive correlations with properties like pH, Caexch, and CEC. This aligns with the common observation that lime primarily affects the topsoil layer. At d2 (20–40 cm), the effects are less pronounced but still visible, suggesting residual or gradual lime influence over time. The initial changes 6 months after lime application (T1) are evident but less stable, as lime begins to dissolve and interact with the soil. Twelve months after application (T2) the strongest improvements are observed, with significant increases in pH and nutrient availability (Ca exch, Mg exch, K exch) and a marked reduction in exchangeable aluminium (Al exch). Eighteen months after lime application (T3) effects remain, but there is slight attenuation compared to T2, reflecting potential leaching or stabilization over time.
5. Conclusions
The capacity of calcium carbonate to correct soil acidity is determined by several factors, including soil texture, organic matter content, lime particle size, and application rate. Fine lime particles demonstrated superior efficiency over coarser particles, leading to quicker and more uniform pH increases due to their greater surface area and faster solubility. The most pronounced pH elevation occurred with applications of highest dose of fine lime, particularly over extended timeframes, corroborating previous findings that associate higher lime rates with improved pH and crop productivity.
Lime application also enhanced cation exchange capacity (CEC), largely through reductions in exchangeable aluminium (Al³⁺) and increases in calcium (Ca²⁺) availability, especially in the topsoil. Although lime's downward movement within the soil profile is generally slow, fine particles contributed to slight improvements in subsoil pH, particularly in sandy loam soils where leaching is more evident. As soil pH increased following liming, so did the negative charge of soil colloids, boosting CEC—further supported by enhanced microbial activity and organic matter decomposition.
Incorporation of lime primarily raises calcium concentrations in the surface layers, with the magnitude of increase proportional to the applied dose. Fine lime particles facilitated faster calcium release and deeper mobility, while coarser particles provided a slower, more prolonged supply. Over time, leaching—especially in sandy loam soils—allowed some calcium to reach lower soil horizons.
Additionally, liming plays a crucial role in alleviating aluminium toxicity by elevating pH levels. This transformation reduces harmful Al³⁺ ions into less toxic Al-hydroxy species. As pH rises, aluminium is displaced from exchange sites and precipitated as Al(OH)₃, enabling calcium to occupy those sites. While these effects are most pronounced in the topsoil, aluminium toxicity may persist at depth or in soils with pH below 5.5—and, in some cases, even up to pH 5.9.
Soil parameters such as pH, CEC, and exchangeable cations (Ca²⁺, Mg²⁺, K⁺) showed strong positive correlations with lime application, especially at higher rates. Conversely, exchangeable aluminium (Al³⁺) displayed a negative correlation with both pH and nutrient cations, reflecting lime's efficacy in neutralizing soil acidity and reducing aluminium toxicity. Principal component analysis further highlighted the effectiveness of higher lime doses in improving soil health. Fine lime produced rapid responses, while coarse lime offered a slower but sustained impact. Notable improvements in the topsoil and consistent patterns across later sampling periods underscore lime's role in enhancing nutrient availability and ameliorating acid soil conditions over time.
Supplementary Materials
The following supporting information can be downloaded at: www.mdpi.com/xxx/s1, Table S1: Percentage variation of monitored parameters.
Author Contributions
Conceptualization, A.L. and I.R.; methodology, A.B.; software, A.B., I.R. and F.S.; formal analysis, L.C..; investigation, I.L. and F.C.; data curation, A.B.; writing—original draft preparation, A.L.; writing—review and editing, I.R.; visualization, L.C.; supervision, I.R.; All authors have read and agreed to the published version of the manuscript.
Funding
This research received no external funding
Data Availability Statement
The original contributions presented in the study are included in the article. Further inquires can be directed to the corresponding author/s.
Acknowledgments
Not applicable.
Conflicts of Interest
The authors declare no conflicts of interest.
Abbreviations
The following abbreviations are used in this manuscript:
| Aglime | Agricultural lime (CaCO3) |
| Kg a.s./ha | Kg active substance/ha |
References
- Ji, F.N.; Osumanu, H.A.; Mohamadu, B.J.; Latifah, O.; Yee, M.K.; Adiza, A.M.; Ken, H.P. Soil nutrient retention and pH buffering capacity are enhanced by calciprill and sodium silicate. Agronomy 2022, 12. [Google Scholar]
- Slessarev, E.; Lin, Y.; Bingham, N.J.; Johnson, E.; Dai, Y.; Schimel, J.P. Water balance creates a threshold in soil pH at the global scale. Nature 2016, 540, 567–569. [Google Scholar] [CrossRef]
- Nagasinghe, I.U.; Saito, T.; Takemura, T.; Kawamoto, K.; Komatsu, T.; Watanabe, N.; Kawabe, Y. Applicability of alkaline waste and by-products as low cost alternative neutralizers for acidic soils. ISIJ Int. 2022, 63, 228–234. [Google Scholar] [CrossRef]
- Sparks, D. L.; Singh, B.; Siebecker, M.G. Environmental soil chemistry, 3rd edition. Publisher: Academic Press, 2023, pp. 351–360.
- Holland, J.E.; White, P.J.; Glendining, M.J.; Goulding, K.W.T.; McGrath, S.P. Yield responses of arable crops to liming–An evaluation of relationships between yields and soil pH from a long-term liming experiment. Eur. J. Agron. 2019, 105, 176–188. [Google Scholar] [CrossRef] [PubMed]
- Neina, D. The role of soil pH in plant nutrition and soil remediation. Appl. Environ. Soil Sci. 2019. [CrossRef]
- Corbett, D.; Wall, D.P.; Lynch, M.B.; Tuohy, P. The influence of lime application on the chemical and physical characteristics of acidic grassland soils with impeded drainage. The Journal of Agricultural Science. 2021, 159, 206–215. [Google Scholar] [CrossRef]
- Dashuan, T.; Shuli, N. A global analysis of soil acidification caused by nitrogen addition. Environ. Res. Lett. 1088. [Google Scholar]
- Popescu, A.; Dinu, T. A.; Stoian, E.; Şerban, V. The use of chemical fertilizers in Romania's agriculture. Scientific Papers Series Management, Economic Engineering in Agriculture and Rural Development 2021, 21.
- Vicar, N.; Lațo, A.; Lațo, I.; Crista, F.; Berbecea, A.; Radulov, I. Effect of Urease and Nitrification Inhibitors on Heavy Metal Mobility in an Intensively Cultivated Soil. Agronomy 2025, 15, 49. [Google Scholar] [CrossRef]
- Jaskulska, I.; Jaskulski, D.; Kobierski, M. Effect of liming on the change of some agrochemical soil properties in a long-term fertilization experiment. Plant Soil Environ. 2014, 60, 146–150. [Google Scholar] [CrossRef]
- Li, Y.; Cui, S.; Chang, S.X.; Zhang, Q. Liming effects on soil pH and crop yield depend on lime material type, application method and rate, and crop species: A global meta-analysis. J. Soils Sediments 2019, 19, 1393–1406. [Google Scholar] [CrossRef]
- Goulding, K.W.T. Soil acidification and the importance of liming agricultural soils with particular reference to the United Kingdom. Soil Use Manag. 2016, 32, 390–399. [Google Scholar] [CrossRef]
- Brown, T.T.; Koenig, R.T.; Huggins, D.R.; Harsh, J.B.; Rossi, R.E. Lime effects on soil acidity, crop yield, and aluminum chemistry in direct-seeded cropping systems. Soil Sci. Soc. Am. J. 2008, 72, 634–640. [Google Scholar] [CrossRef]
- Daba, N.A.; Li, D.; Huang, J.; Han, T.; Zhang, L.; Ali, S.; Khan, M.N.; Du, J.; Liu, S.; Legesse, T.G. Long-term fertilization and lime-induced soil pH changes affect nitrogen use efficiency and grain yields in acidic soil under wheat-maize rota-tion. Agronomy 2021, 11. [Google Scholar] [CrossRef]
- Yu, X.; Keitel, C.; Dijkstra, F.A. Ameliorating soil acidity with calcium carbonate and calcium hydroxide: effects on carbon, nitrogen, and phosphorus dynamics. J. Soil. Sci. Plant. Nutr. 2023, 23, 5270–5278. [Google Scholar] [CrossRef]
- Zajicova, K.; Chuman, T. Effect of land use on soil chemical properties after 190 years of forest to agricultural land conversion. Soil and Water Research 2019, 14, 121–131. [Google Scholar] [CrossRef]
- Henderson, W.H.; Lalande, H.; Duquette, M. Soil reaction and exchangeable acidity. In Soil Sampling and Methods of Analysis, 2nd ed., 2007; pp. 173–178.
- Shaimaa, H.A.E.; Mostafa, M.A.M.; Taha, T.A.; Elsharawy, M.A.O.; Eid, M.A. Effect of different amendments on soil chemical characteristics, grain yield and elemental content of wheat plants grown on salt-affected soil irrigated with low quality water. Annals of Agricultural Science 2012, 57, 175–182. [Google Scholar] [CrossRef]
- FAO. Standard operating procedure for soil pH determination, Rome, 2021.
- Kibet, P.K.; Mugwe, J.N.; Korir, N.K.; Mucheru-Muna, M.W.; Ngetich, F.K. Granular and powdered lime improves soil properties and maize (Zea mays l.) performance in humic Nitisols of central highlands in Kenya. Heliyon. [CrossRef]
- Sikiric, B.; Stajkovic-Srbinovic, O.; Cakmak, D.; Delic, D.; Kokovic, N.; Kostic-Kravljanac, Lj.; Mrvic, V. Macronutrient contents in the leaves and fruits of red raspberry as affected by liming in an extremely acid soil. Plant Soil Environ. 2015, 61, 23–28. [Google Scholar] [CrossRef]
- Jönsson, U.; Rosengren, U.; Bengt, N.; Thelin, G. A comparative study of two methods for determination of pH, exchangeable base cations, and aluminum. Communications in Soil Science and Plant Analysis 2002, 33, 3809–3824. [Google Scholar] [CrossRef]
- Ross, D.S.; Ketterings, Q. Recommended methods for determining, soil cation exchange capacity. In Recommended Soil Testing Procedures for the Northeastern United States, Last Revised 5/2011.
- Jones, J.D.; Mallarino, A.P. Influence of source and particle size on agricultural limestone efficiency at increasing soil pH. In North Central Extension-Industry Soil Fertility Conference, Des Moines, IA, 2016.
- Enesi, R.O.; Dyck, M.; Chang, S.; Thilakarathna, M.S.; Fan, X.; Strelkov, S.; Gorim, L.Y. Liming remediates soil acidity and improves crop yield and profitability - a meta-analysis. Front. Front. Agron. 2023, 5. [Google Scholar] [CrossRef]
- Oliver, Y.M.; Gazey, C.; Fisher, J.; Robertson, M. Dissection of the contributing factors to the variable response of crop yield to surface applied lime in Australia. Agronomy 2021, 11. [Google Scholar] [CrossRef]
- Tutivén, J.C.B.; Suarez, H.O.E.; Montúfar, G.H.V. Buffer capacity as a method to estimate the dose of liming in acid. Agro Productividad 2022. [CrossRef]
- Caires, E.F.; Haliski, A.; Bini, A.R.; Scharr, D.A. Surface liming and nitrogen fertilization for crop grain production under no-till management in Brazil. European Journal of Agronomy 2015, 66, 41–53. [Google Scholar] [CrossRef]
- Kibet, P.K.; Mugwe, J.N.; Korir, N.K.; Mucheru-Muna, M.W.; Ngetich, F.K.; Mugendi, D.N. Granular and powdered lime improves soil properties and maize (Zea mays l.) performance in humic Nitisols of central highlands in Kenya. Heliyon. [CrossRef]
- Scott, B. J.; Conyers, M. K.; Fisher, R.; Lill, W. Particle size determines the efficiency of calcitic limestone in amending acidic soil. Aust. J. Agric. Res. 1992, 43, 1175–1185. [Google Scholar] [CrossRef]
- du Toit, D. J. J.; Swanepoel, P. A.; Hardie, A. G. Effect of Lime Source, Fineness and Granulation on Soil Permeation with Contrasting Textures under Simulated Mediterranean Climate Rainfall Conditions. Communications in Soil Science and Plant Analysis 2024, 55, 3011–3024. [Google Scholar] [CrossRef]
- Moir, J. L.; Moot, D. J. Soil pH, exchangeable aluminium and lucerne yield responses to lime in a South Island high country soil. Proceedings of the New Zealand Grassland Association 2010, 72, 191–196. [Google Scholar] [CrossRef]
- Ianos, Gh.; Pusca, I.; Goian, M. Banat Soils – part II – Natural conditions and fertility; Publisher: Mirton 1997, Timisoara, Romania, pp. 118–130.
- Brady, N.C. , Weil R.R. The nature and properties of soils, 14th ed.; Publisher: Pearson Education Inc, 2008; pp. 423–444. [Google Scholar]
- Wang, X.; Tang, C.; Baldock, J.A.; Butterly, C.R.; Gazey, C. Long-term effect of lime application on the chemical composition of soil organic carbon in acid soils varying in texture and liming history. Biol. Fertil. Soils 2016, 52, 295–306. [Google Scholar] [CrossRef]
- Goulding, K.W.T. Soil acidification and the importance of liming agricultural soils with particular reference to the United Kingdom. Soil Use Manag. 2016, 32, 390–399. [Google Scholar] [CrossRef]
- Jaskulska, I.; Jaskulski, D.; Kobierski, M. Effect of liming on the change of some agrochemical soil properties in a long-term fertilization experiment. Plant Soil Environ. 2014, 60, 146–150. [Google Scholar] [CrossRef]
- Olego, M.Á.; Quiroga, M.J.; Mendaña-Cuervo, C.; Cara-Jiménez, J.; López, R.; Garzón-Jimeno, E. Long-term effects of calci-um-based liming materials on soil fertility sustainability and rye production as soil quality indicators on a Typic Palexerult. Processes 2021, 9. [Google Scholar] [CrossRef]
- Workineh, E.; Yihenew, G. S.; Eyasu, E.; Eyayu, M. Effect of lime rates and method of application on soil properties of acidic Luvisols and wheat (Triticum aestivum, L.) yields in northwest Ethiopia. Heliyon. [CrossRef]
- Miyazawa, M.; Pavan, M.A.; Ziglio, C.O.; Franchini, J.C. Reduction of Exchangeable Calcium and Magnesium in Soil with Increasing pH. Brazilian Archives of Biology and Technology 2001, 44, 149–153. [Google Scholar] [CrossRef]
- Rahman, R.; Upadhyaya, H. Aluminium Toxicity and Its Tolerance in Plant: A Review. J. Plant Biol. 2021, 64, 101–121. [Google Scholar] [CrossRef]
- Munyaneza, V.; Zhang, W.; Haider, S. Strategies for alleviating aluminum toxicity in soils and plants. Plant Soil 2024, 504, 167–190. [Google Scholar] [CrossRef]
- Whitley, A.E.; Moir, J.L.; Almond, P.C.; Moot, D.J. Soil pH and exchangeable aluminium in contrasting New Zealand high and hill country soils, Hill Country. Grassland Research and Practice Series 2016, 16, 169–172. [Google Scholar] [CrossRef]
Figure 1.
Field experiences description.
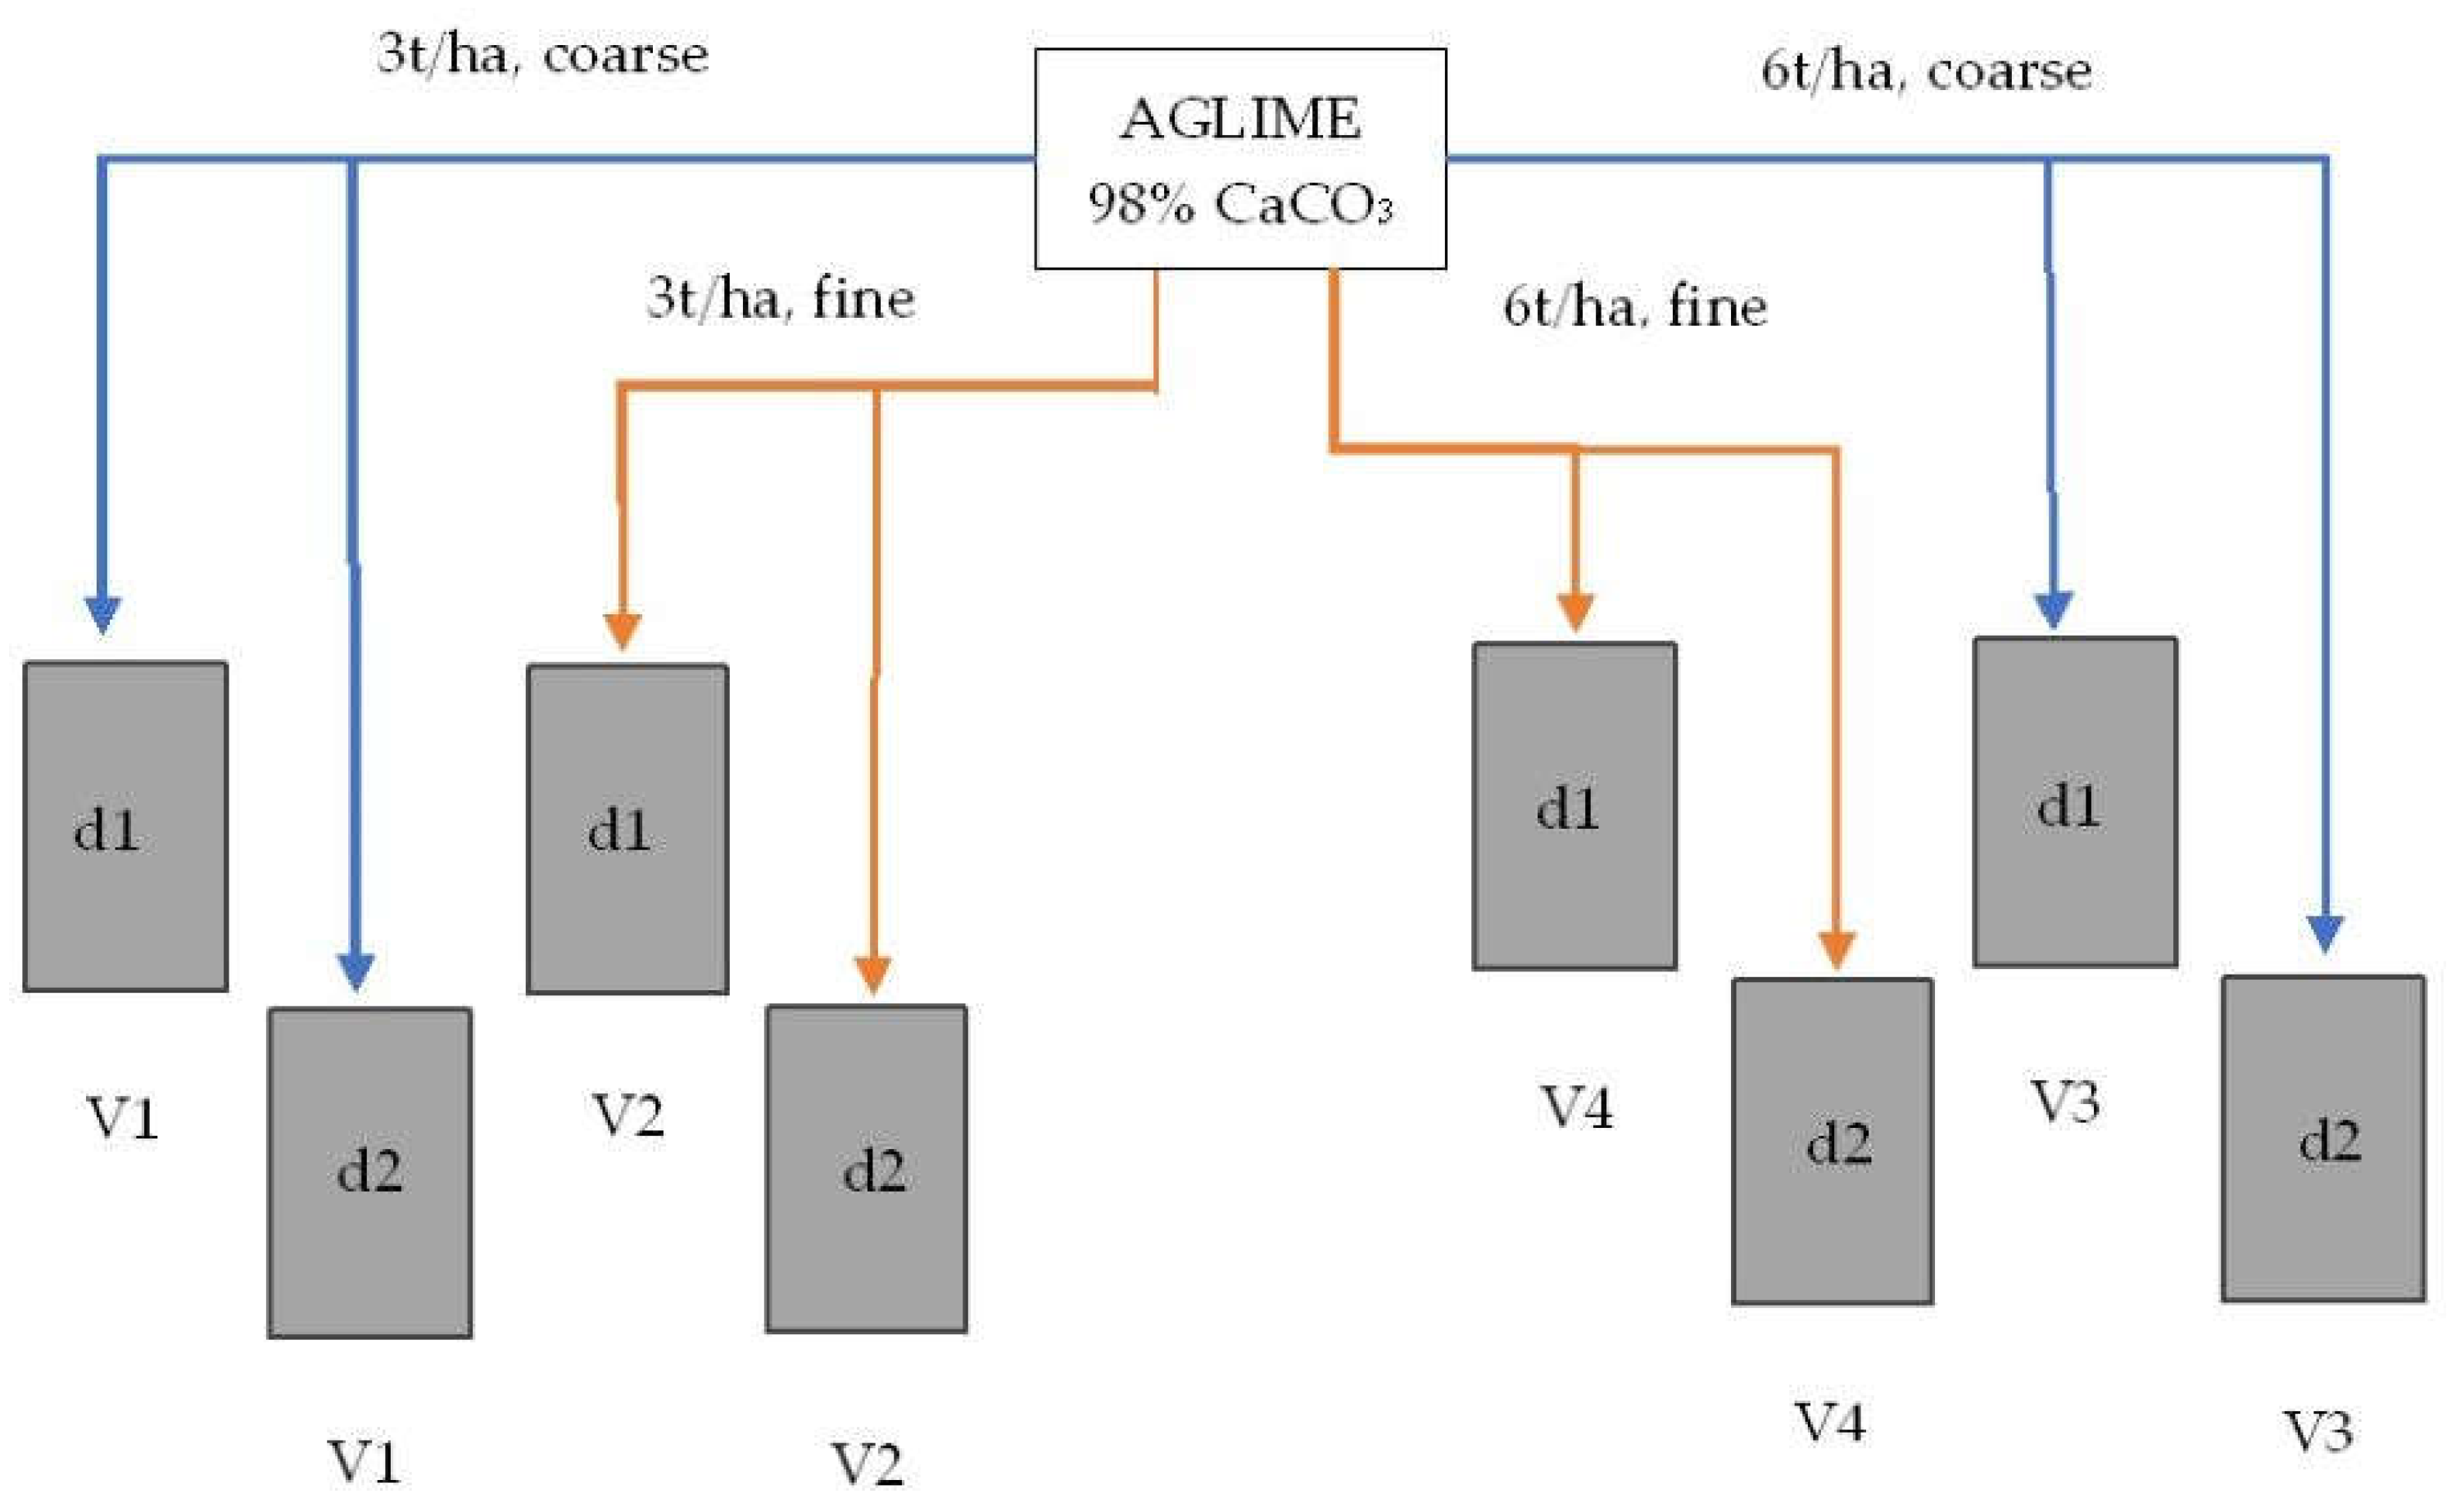
Figure 2.
Influence of lime application on Ca/Mg ratio.
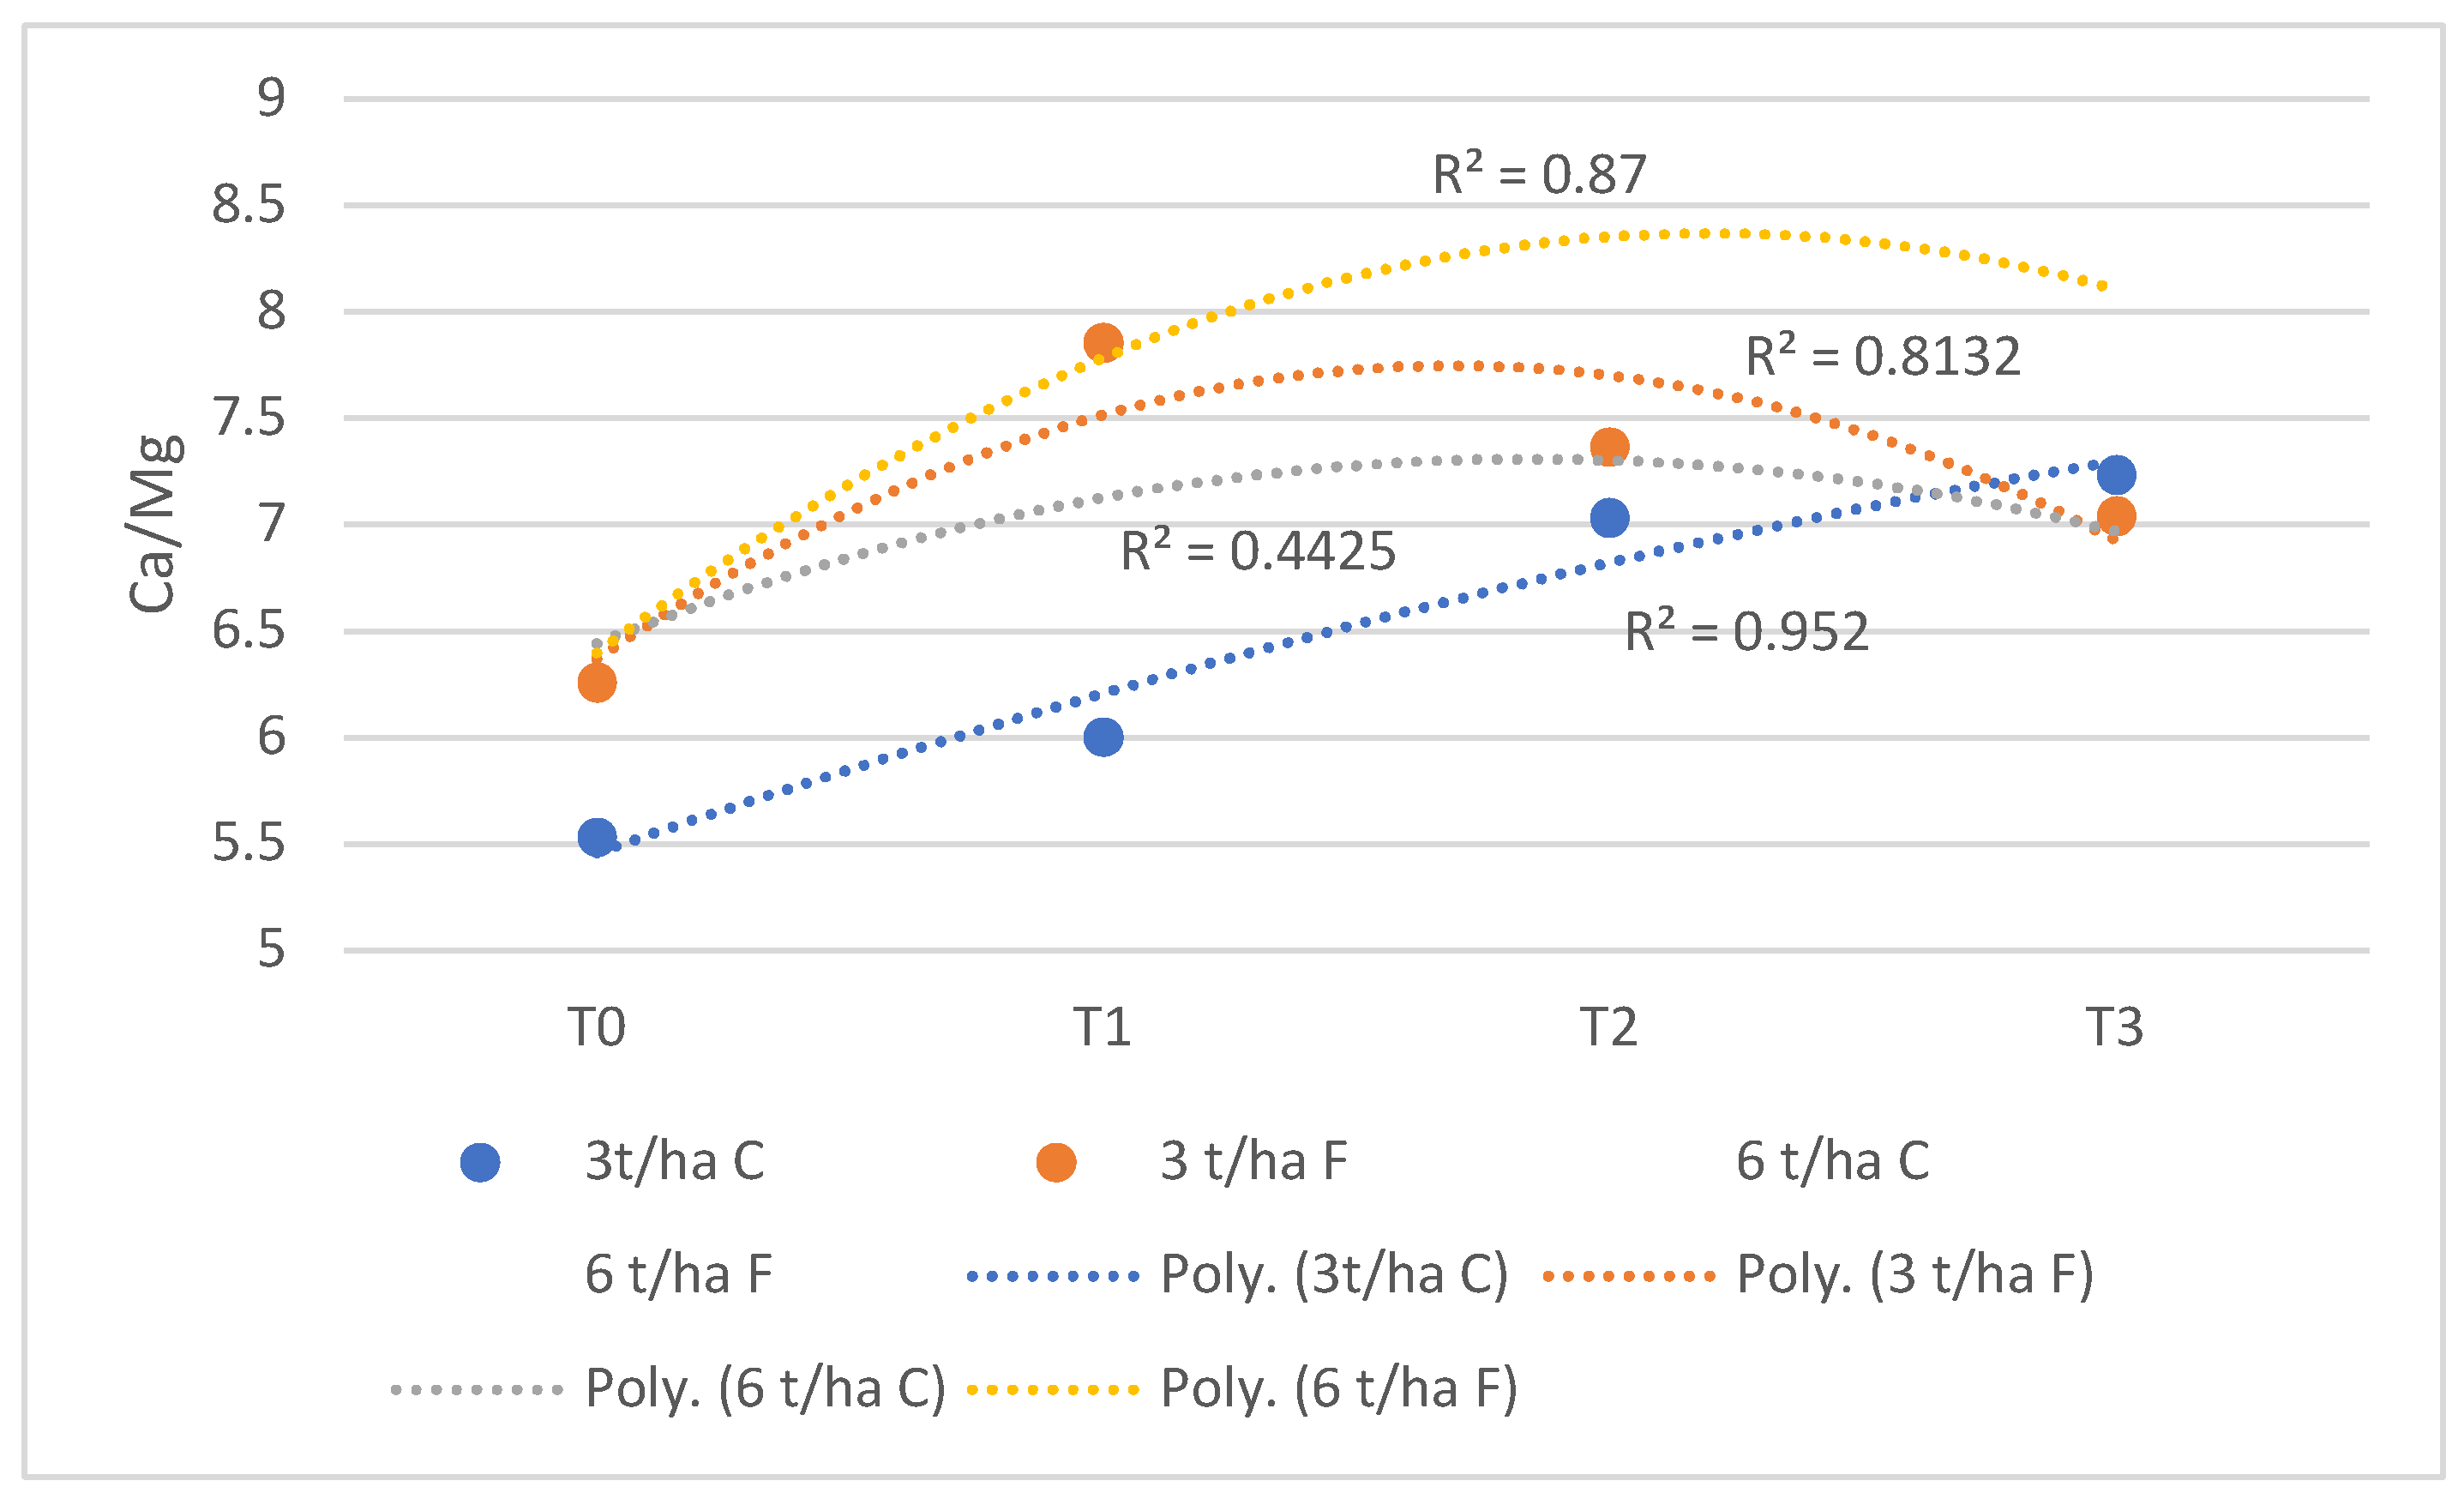
Figure 3.
Pearson correlation matrix at T1.
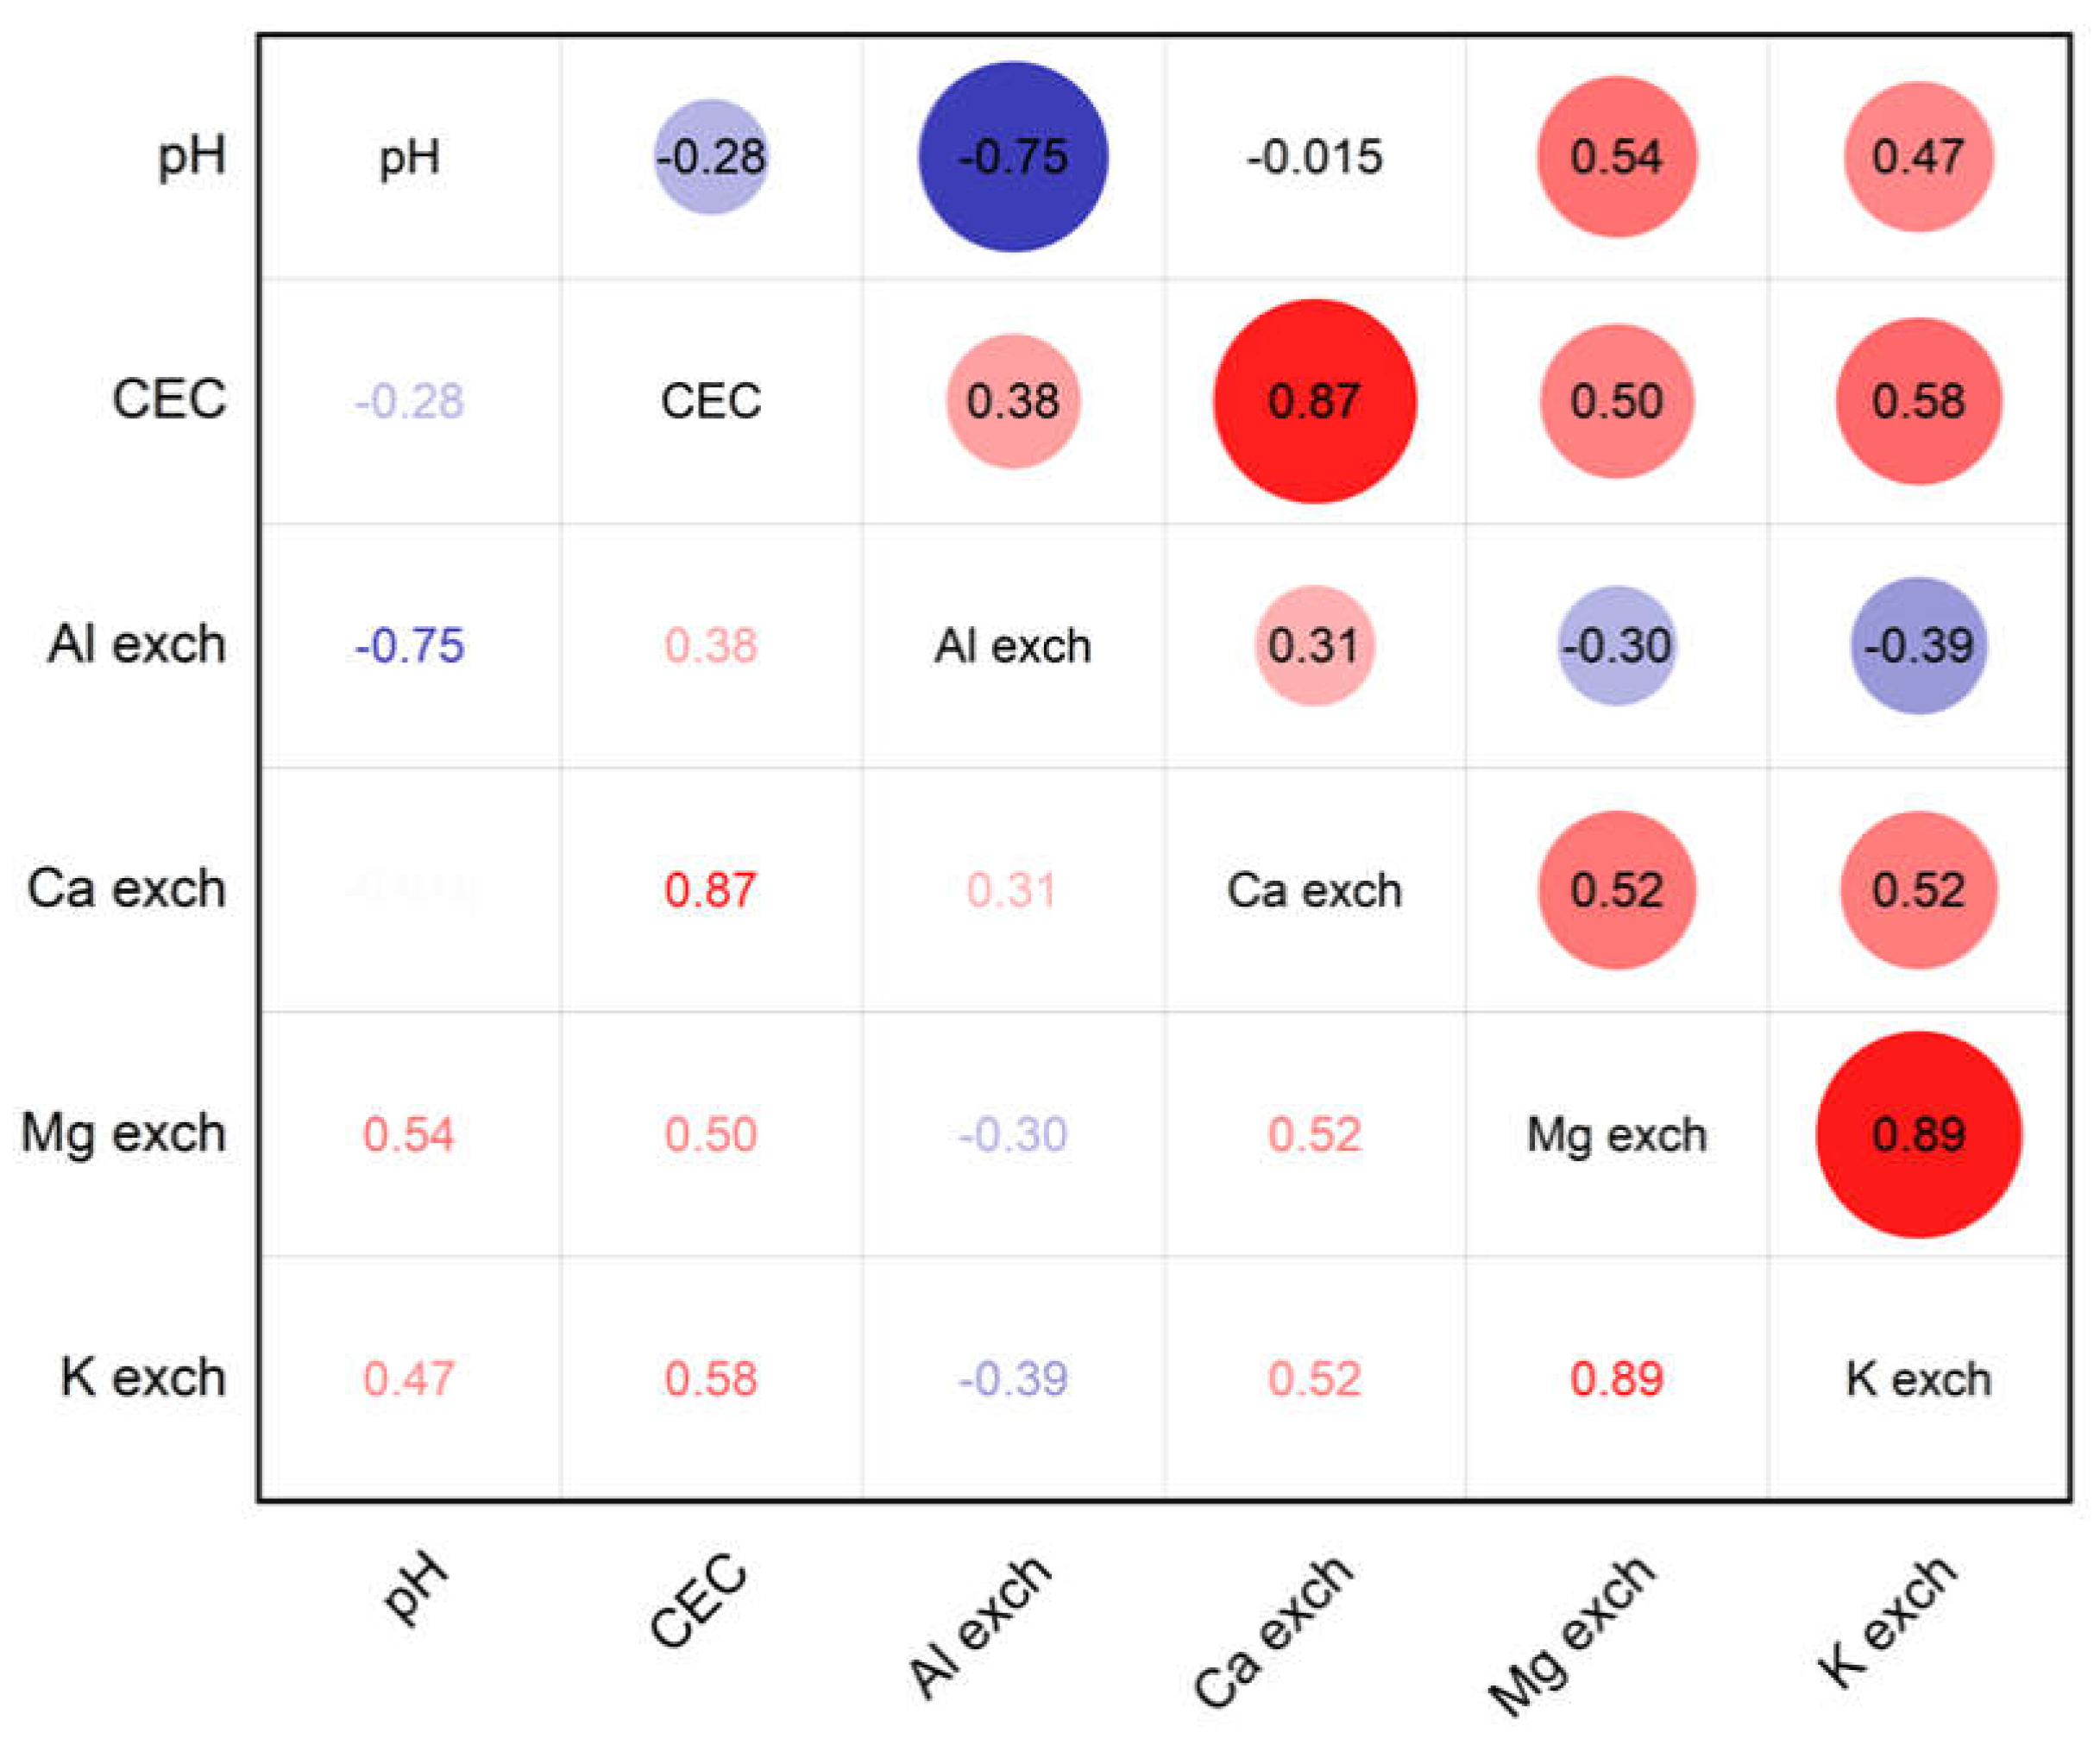
Figure 4.
Pearson correlation matrix at T2.
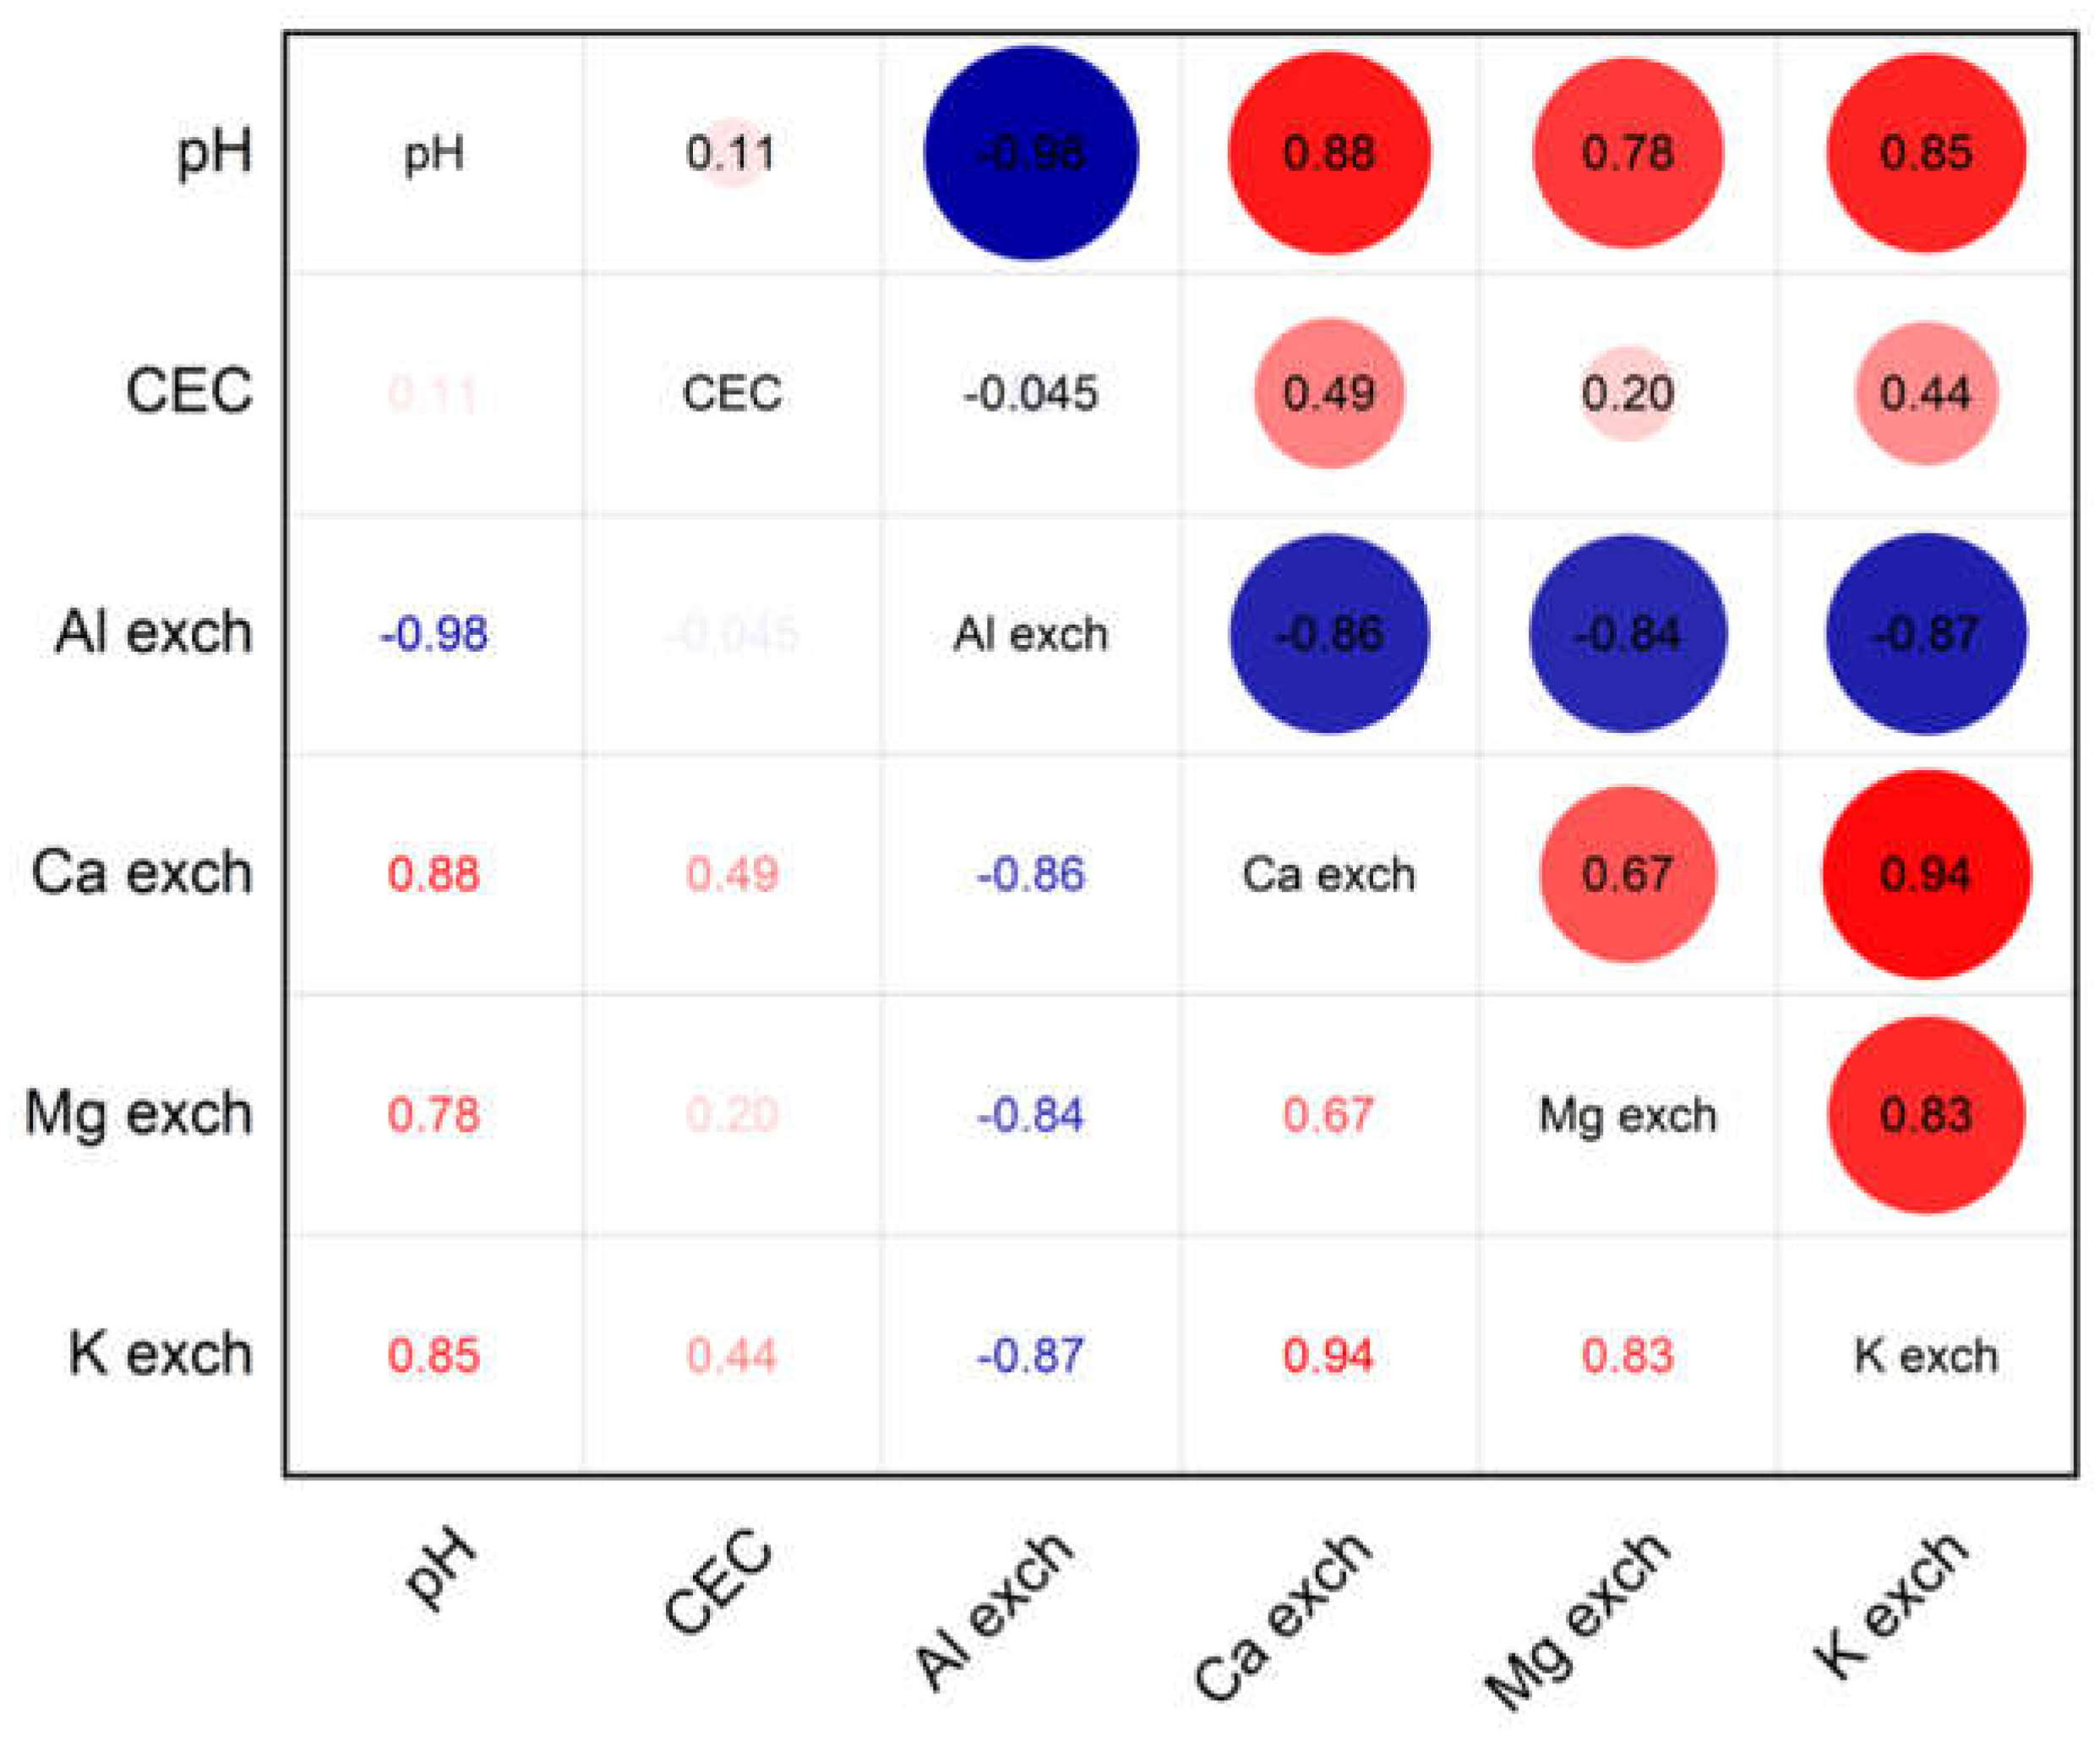
Figure 5.
Pearson correlation matrix at T3.
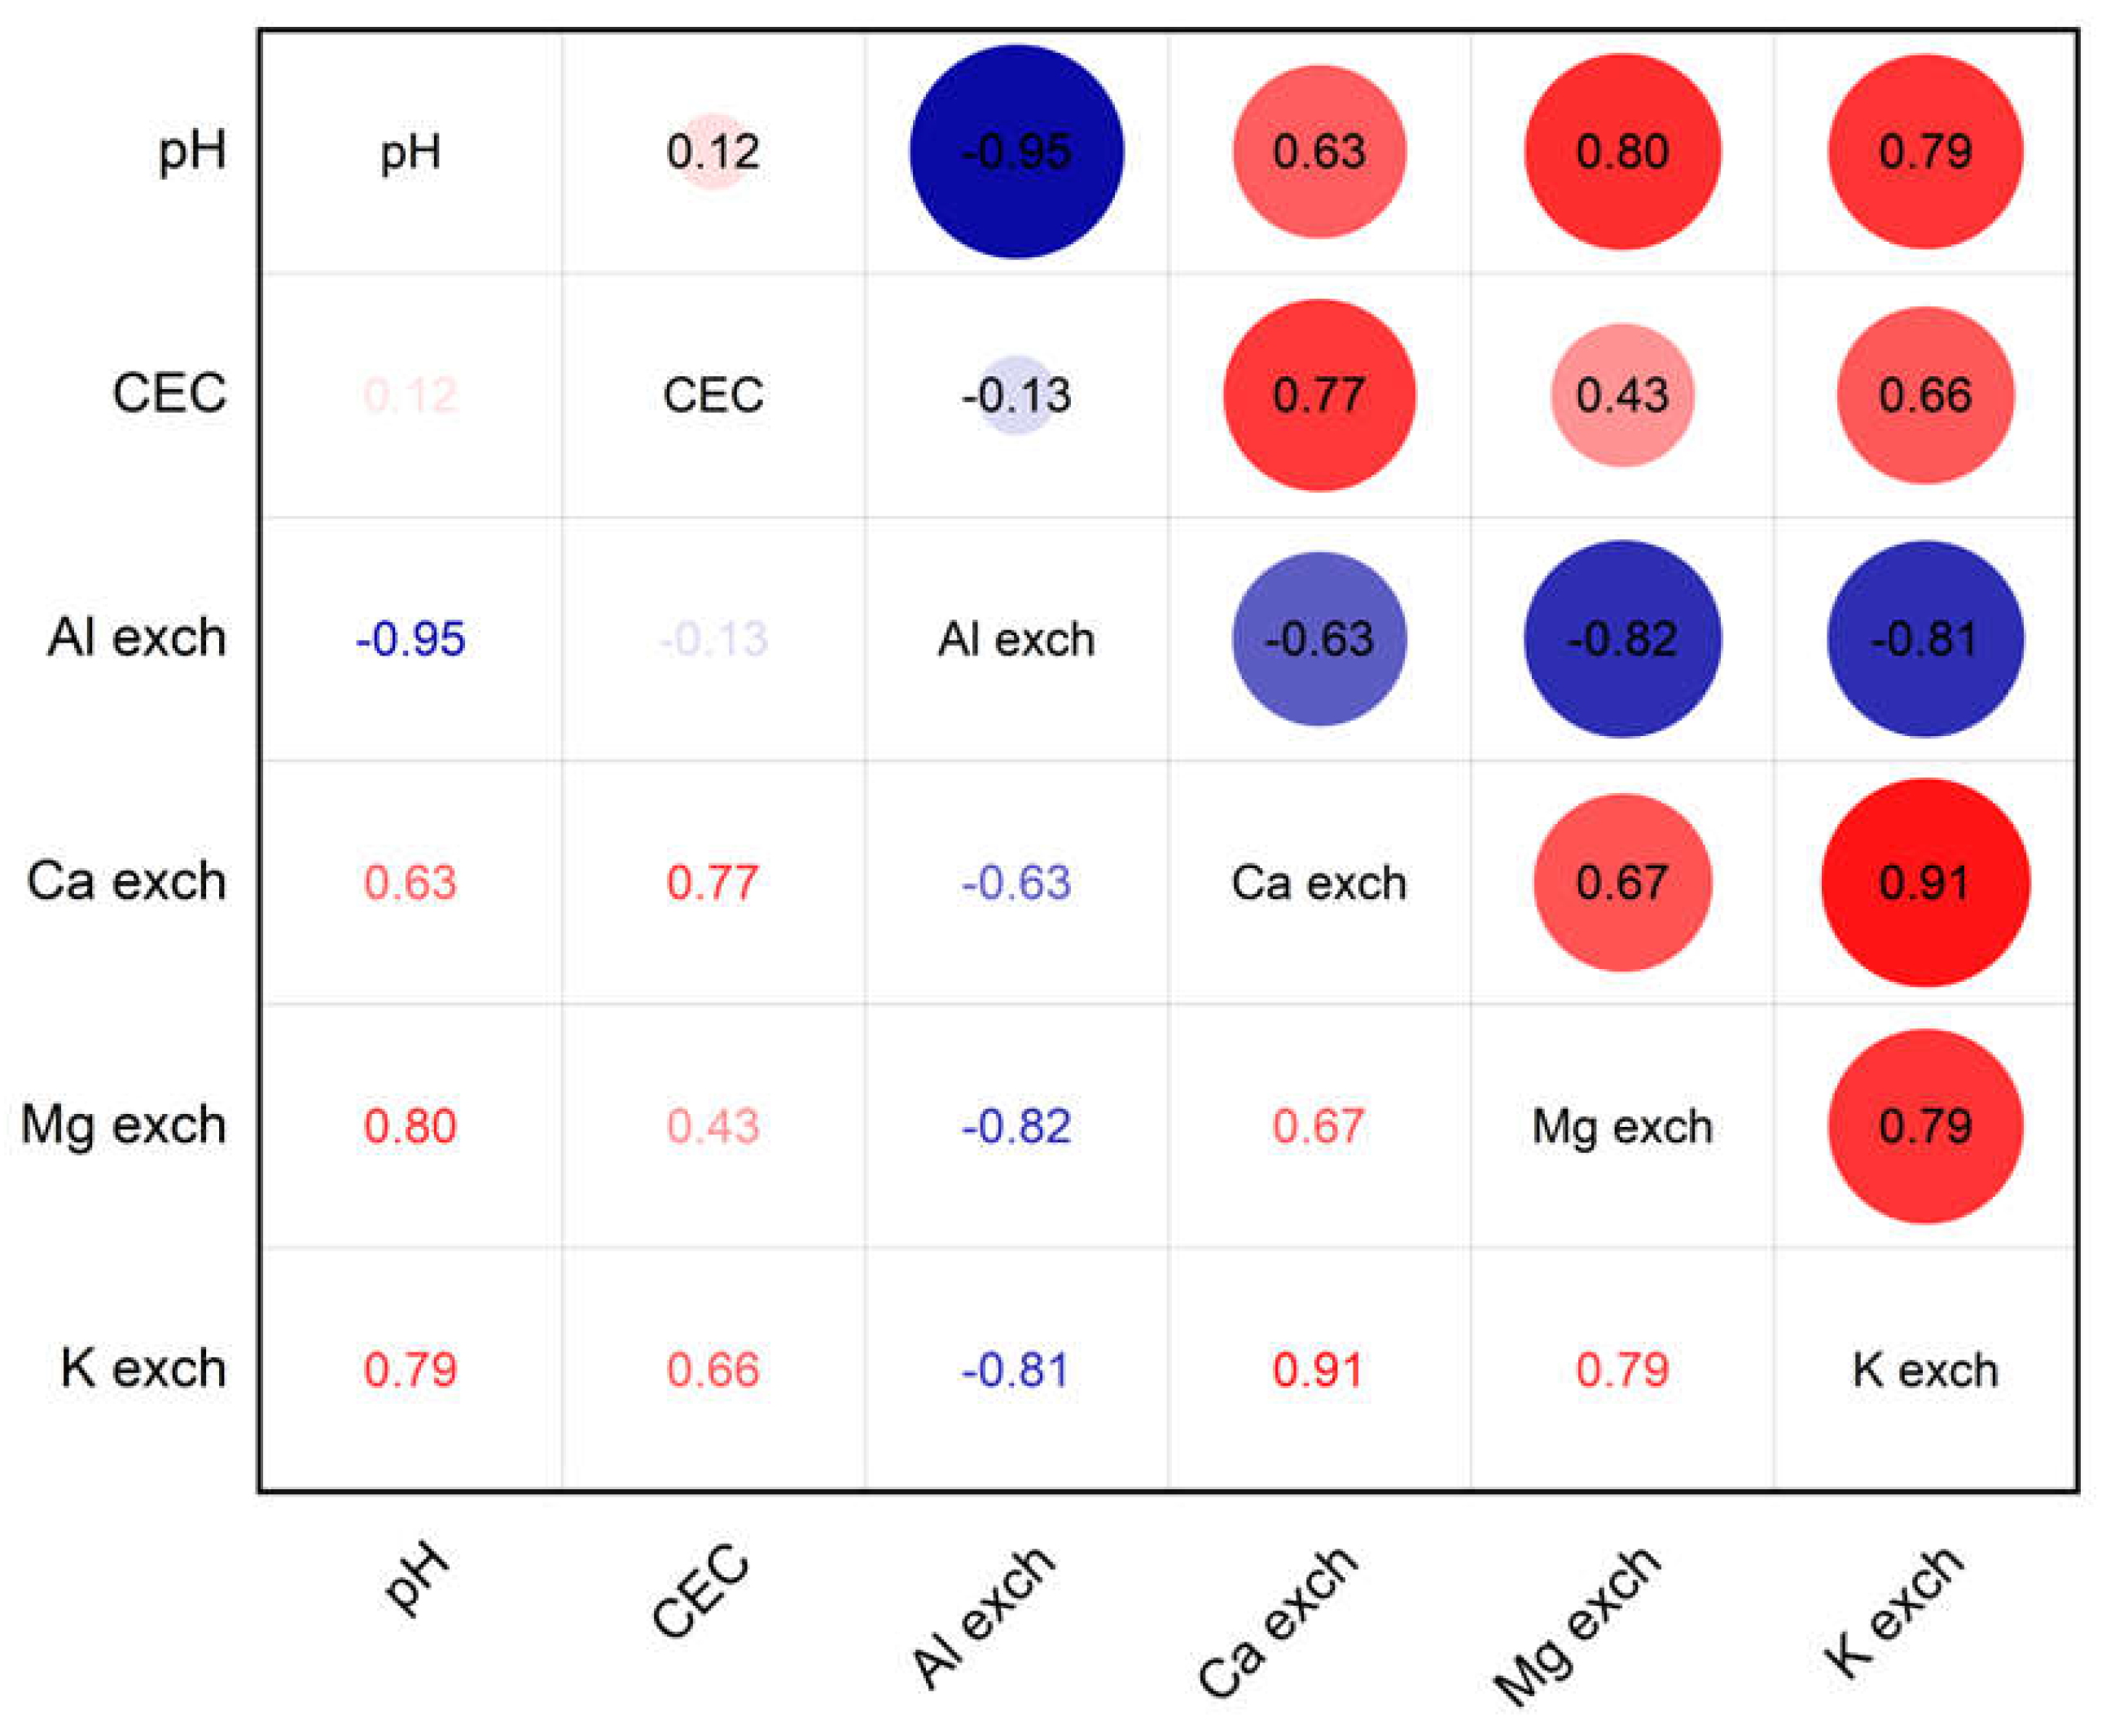
Figure 6.
The influence of aglime dose on soil parameters.


Table 1.
Main characteristics of Gleyic Fluvisol
| Characteristic | |
|---|---|
| Texture | Loamy sandy |
| Structure | Granular |
| Total porosity | 54% in the first horizon |
| Humus content | 2.8% |
| pH | 5.03 ÷ 5.12 |
| CEC (cation exchange capacity) | 9.27 ÷ 9.42 cmol/kg |
| Caexch (exchangeable Ca) | 4.63 ÷4.71 cmol/kg |
| Mgexch (exchangeable Mg) | 0.74 ÷ 0.85 cmol/kg |
| Kexch (exchangeable K) | 0.140 ÷ 0.151 cmol/kg |
| Alexch (exchangeable Al) | 2.780 ÷ 3.300 cmol/kg |
Table 2.
pH, CEC and Alexch values after lime application.
| T0 | T1 | T2 | T3 | |
| V1, d1=0-20 cm | ||||
| pH | 5.08±0.10 | 5.62±0.06ab | 6.47±0.05a | 6.39±0.04b |
| CEC (cmol/kg) | 9.4±0.18 | 9.71±0.05c | 10.21±0.10d | 10.88±0.14b |
| Alexch(cmol/kg) | 3.10±0.310 | 1.98±0.050 | 0.43±0.080b | 0.08±0.060b |
| V1, d2=20-40 cm | ||||
| pH | 5.15±0.04 | 5.39±0.02cde | 5.43±0.08d | 5.64±0.05d |
| CEC (cmol/kg) | 9.31±0.12 | 9.62±0.04c | 10.12±0.24d | 10.05±0.16c |
| Alexch(cmol/kg) | 2.79±0.470 | 2.43±0.460 | 1.98±0.250a | 1.71±0.530a |
| V2, d1=0-20 cm | ||||
| pH | 5.12±0.02 | 5.80±0.06a | 6.55±0.03a | 6.33±0.05b |
| CEC (cmol/kg) | 9.27±0.03 | 9.92±0.08c | 10.79±0.27c | 10.37±0.08c |
| Alexch (cmol/kg) | 2.78±0.250 | 1.74±0.290 | 0.31±0.030b | 0.05±0.010b |
| V2, d2=20-40 cm | ||||
| pH | 5.24±0.05 | 5.6±0.12abc | 5.72±0.04c | 5.85±0.06c |
| CEC (cmol/kg) | 9.24±0.16 | 9.93±0.03c | 11.1±0.15abc | 10.19±0.19c |
| Alexch (cmol/kg) | 2.590±0.140 | 2.29±0.440 | 1.84±0.230a | 1.61±0.260a |
| V3, d1=0-20 cm | ||||
| pH | 5.03±0.05 | 5.49±0.04abc | 6.28±0.04b | 6.6±0.05a |
| CEC (cmol/kg) | 9.42±0.11 | 10.61±0.06a | 11.04±0.15a | 12.43±0.17a |
| Alexch(cmol/kg) | 3.300±0.590 | 2.24±0.540 | 0.44±0.210b | - |
| V3, d2=20-40 cm | ||||
| pH | 5.13±0.03 | 5.21±0.1cde | 5.39±0.06d | 5.36±0.05a |
| CEC (cmol/kg) | 9.3±0.25 | 10.47±0.24a | 10.75±0.08abc | 12.21±0.19a |
| Alexch(cmol/kg) | 2.330±0.540 | 2.23±0.190 | 1.94±0.300a | 1.7±0.400a |
| V4 d1=0-20 cm | ||||
| pH | 5.06±0.12 | 5.62±0.08ab | 6.57±0.03a | 6.63±0.08a |
| CEC (cmol/kg) | 9.41±0.19 | 11.22±0.20b | 11.55±0.13bc | 12.09±0.19a |
| Alexch (cmol/kg) | 3.290±0.360 | 2.19±0.480 | 0.35±0.130b | - |
| V4, d2=20-40 cm | ||||
| pH | 5.17±0.03 | 5.31±0.08de | 5.45±0.07d | 5.6±0.14d |
| CEC (cmol/kg) | 9.26±0.06 | 11.05±0.16b | 11.44±0.17 | 12.13±0.15a |
| Alexch (cmol/kg) | 2.790±0.630 | 2.61±0.370 | 2.1±0.210a | 1.86±0.460a |
Means (calculated at the same time) that do not share a letter are significantly different at the 0.05 level.
Table 3.
Exchangeable Ca, Mg and K values after lime application
| T0 | T1 | T2 | T3 | |
| V1, d1=0-20 cm | ||||
| Caexch (cmol/kg) | 4.70±0.32 | 5.82±0.79ab | 7.25±0.56ab | 8.10±0.30ab |
| Mgexch (cmol/kg) | 0.85±0.085 | 0.97±0.174 | 1.03±0.069 | 1.12±0.188 |
| Kexch (cmol/kg) | 0.151±0.022 | 0.212±0.017 | 0.264±0.038 | 0.286±0.082abc |
| V1, d2=20-40 cm | ||||
| Caexch (cmol/kg) | 4.65±0.39 | 5.69±0.44ab | 6.18±0.71b | 7.03±0.30bc |
| Mgexch (cmol/kg) | 0.740±0.123 | 0.77±0.147 | 0.82±0.182 | 0.91±0.058 |
| Kexch (cmol/kg) | 0.122±0.013 | 0.159±0.024 | 0.191±0.017 | 0.209±0.023c |
| V2, d1=0-20 cm | ||||
| Caexch (cmol/kg) | 4.63±0.50 | 6.45±0.56ab | 7.66±0.54ab | 7.46±0.47bc |
| Mgexch (cmol/kg) | 0.740±0.028 | 0.82±0.060 | 1.04±0.06 | 1.06±0.064 |
| Kexch (cmol/kg) | 0.140±0.035 | 0.225±0.05 | 0.267±0.027 | 0.297±0.029abc |
| V2, d2=20-40 cm | ||||
| Caexch (cmol/kg) | 4.62±0.39 | 5.45±0.46b | 6.54±0.28b | 6.82±0.20c |
| Mgexch (cmol/kg) | 0.830±0.046 | 0.89±0.102 | 0.93±0.115 | 1.03±0.047 |
| Kexch (cmol/kg) | 0.110±0.019 | 0.172±0.021 | 0.213±0.014 | 0.215±0.016bc |
| V3, d1=0-20 cm | ||||
| Caexch (cmol/kg) | 4.71±0.31 | 6.47±0.56ab | 7.50±0.49ab | 8.20±0.75ab |
| Mgexch (cmol/kg) | 0.750±0.051 | 0.85±0.016 | 1.1±0.101 | 1.15±0.068 |
| Kexch (cmol/kg) | 0.150±0.023 | 0.231±0.042 | 0.283±0.054 | 0.334±0.044ab |
| V3, d2=20-40 cm | ||||
| Caexch (cmol/kg) | 4.65±0.37 | 5.28±0.51b | 6.20±0.80b | 7.65±0.43bc |
| Mgexch (cmol/kg) | 0.840±0.062 | 0.92±0.198 | 0.99±0.091 | 1.02±0.127 |
| Kexch (cmol/kg) | 0.129±0.024 | 0.18±0.095 | 0.22±0.065 | 0.254±0.04abc |
| V4 d1=0-20 cm | ||||
| Caexch (cmol/kg) | 4.70±0.30 | 6.95±0.26a | 8.20±0.38a | 9.06±0.26a |
| Mgexch (cmol/kg) | 0.75±0.073 | 0.85±0.051 | 1.03±0.126 | 1.1±0.202 |
| Kexch (cmol/kg) | 0.142±0.013 | 0.246±0.048 | 0.289±0.063 | 0.36±0.041a |
| V4, d2=20-40 cm | ||||
| Caexch (cmol/kg) | 4.65±0.37 | 5.96±0.31ab | 7.00±0.52b | 7.85±0.43bc |
| Mgexch (cmol/kg) | 0.840±0.113 | 0.9±0.150 | 0.88±0.122 | 1.01±0.016 |
| Kexch (cmol/kg) | 0.120±0.011 | 0.21±0.069 | 0.243±0.046 | 0.274±0.028abc |
Means (calculated at the same time) that do not share a letter are significantly different at the 0.05 level.
Disclaimer/Publisher’s Note: The statements, opinions and data contained in all publications are solely those of the individual author(s) and contributor(s) and not of MDPI and/or the editor(s). MDPI and/or the editor(s) disclaim responsibility for any injury to people or property resulting from any ideas, methods, instructions or products referred to in the content. |
© 2025 by the authors. Licensee MDPI, Basel, Switzerland. This article is an open access article distributed under the terms and conditions of the Creative Commons Attribution (CC BY) license (https://creativecommons.org/licenses/by/4.0/).
Copyright: This open access article is published under a Creative Commons CC BY 4.0 license, which permit the free download, distribution, and reuse, provided that the author and preprint are cited in any reuse.


