
Submitted:
25 September 2025
Posted:
26 September 2025
You are already at the latest version
Abstract
Enhanced Rock Weathering (ERW) is a promising carbon dioxide removal (CDR) strategy that accelerates mineral dissolution, sequestering atmospheric CO₂ while improving soil health. This study builds on prior applications of soil calcimetry by investigating its ability to resolve short-term carbonate fluxes and rainfall-modulated weathering dynamics in wollastonite-amended croplands. Conducted over a single growing season (May–October 2024) in temperate row-crop fields near Port Colborne, Ontario—characterized by lacustrine clay soils and variable rainfall—the study tests whether calcimetry can differentiate between dissolution and precipitation phases and serve as a proxy for total weathering flux within the sentinel layer. Monthly measurements of soil pH (Milli‐Q and CaCl₂ extractions) and calcium carbonate equivalent (CCE) were collected from 10 plots. Results show significant alkalinization (p < 0.001) in both pH measures, whereas CCE exhibited high spatial and temporal variability with no consistent seasonal trend. The calcimetry‐derived weathering proxy, log (Σ ΔCCE/Δt), correlated positively with pH (r = 0.652), capturing net carbonate accumulation, while the kinetic dissolution rate model correlated strongly and negatively with pH (r ≈ −1), reflecting acid‐promoted dissolution. This divergence confirms that the two metrics capture complementary stages of the weathering–precipitation system. Rainfall exerted a strong short‐term influence on carbonate formation, with cumulative precipitation over the preceding 7–10 days showing a saturating positive effect, while dissolution fluxes were unaffected by rainfall. These findings expand calcimetry’s potential for ERW MRV, providing a direct, scalable, and dynamic measure of CO₂ sequestration in suitable climates and soils.
Keywords:
soil inorganic carbon (SIC) dynamics
; pedogenic carbonate formation
; silicate mineral weathering
; carbon sequestration
; soil pH evolution
; rainfall–soil carbon interactions
; field-based soil monitoring
; land-based climate regulation
1. Introduction
The Widespread implementation of atmospheric carbon dioxide removal (CDR) strategies, in conjunction with efforts to reduce emissions, will be crucial to mitigating future climate change driven by human-caused CO2 and other greenhouse gas emissions [1]. Enhanced Rock Weathering (ERW) is an emerging climate solution that provides the dual benefits of long-term atmospheric carbon dioxide (CO2) removal and improved soil health [2,3,4,5] This approach involves the application of finely ground silicate minerals, such as wollastonite, basalt or olivine, onto agricultural soils to accelerate natural weathering processes. Specifically, this strategy promotes the dissolution of silicate rocks, releasing base cations (e.g., Ca2+ and Mg2+) that react with CO2 to form bicarbonate (HCO3−) in soil solutions. These bicarbonate ions are eventually transported to groundwater and oceans, where the captured carbon can be stably stored over timescales exceeding 10,000 years. In parallel, this geochemical process enhances soil fertility and pH, offering co-benefits for crop production and ecosystem resilience [2,3,6].
Field trials play a pivotal role in advancing Enhanced Rock Weathering (ERW) from a promising theoretical approach to a scalable and credible carbon dioxide removal (CDR) strategy. While modeling studies have long highlighted ERW’s potential for long-term CO2 sequestration and agronomic benefits [6,7,8,9], empirical data from field experiments are essential to reduce uncertainties around mineral dissolution rates, bicarbonate formation, and carbon permanence under real-world conditions. Recent multi-year field studies, such as those conducted in the U.S. Corn Belt, have demonstrated that ERW can sequester up to 15.4 ± 4.1 t CO2 ha−1 while simultaneously increasing crop yields by 12–16% [2]. In Brazil, a sugarcane field experiment conducted on acidic Oxisols in São Paulo State demonstrated measurable carbon dioxide removal alongside substantive improvements in soil parameters, including increased pH, enhanced cation exchange capacity, and elevated nutrient availability, after basalt application rates ranging from 10 to 100 t/ha in a commercial-scale randomized block design [10]. Similarly, in western Germany, pilot field trials led by Project Carbdown and companies like InPlanet and ZeroEx have applied basalt and olivine-rich rock dust to agricultural fields, reporting improvements in soil fertility, microbial activity, and nutrient cycling under temperate conditions (Remineralize.org overview; ZeroEx pilot project). Such tangible outcomes provide critical evidence for policy makers, farmers, and project developers, reinforcing the environmental and economic viability of ERW.
Moreover, field trials are central to building robust monitoring, reporting, and verification (MRV) frameworks that underpin the integrity of ERW-based carbon credits [11,12,13,14]. As observed in recent industry-standard protocols, such as the Puro.earth methodology, Isometric methodology, carbon removal credits are issued only after field-data measurements validate model predictions, including soil chemistry changes and carbon fluxes [15,16].
These large-scale field trials are generating critical real-world insights that help refine MRV frameworks by grounding carbon removal estimates in actual soil and crop data. However, to translate these valuable field signals into robust and trustworthy MRV systems, there is a pressing need for the development of methodologies or technologies that can capture and process this information in a way that is simple, practical, and cost-effective. Although some MRV protocols have historically excluded pedogenic carbonates from formal CO2 removal accounting due to concerns about reversibility, recent field studies and methodological advances increasingly recognize their value as indicators of silicate weathering and alkalinity migration. In field settings where direct bicarbonate tracking is impractical, calcimetry offers a scalable alternative for capturing the transformation of inorganic carbon pools. Ideally, these tools should minimize uncertainty and signal distortion, enabling clear and consistent integration of field-based evidence into formal carbon accounting protocols.
Traditional laboratory-based models, such as those by Palandri and Kharaka (2004), Brantley and White (2009), often overestimate mineral weathering rates because they do not fully account for the complexities of field conditions, such as soil heterogeneity, limited mineral-soil contact, fluctuating moisture regimes, irregular dissolutions, and the formation of passivation layers that inhibit reactivity. To bridge this gap, researchers are increasingly relying on direct field measurements to calibrate and validate MRV approaches, ensuring that reported carbon removals more accurately reflect in-situ weathering dynamics under real agricultural settings.
A variety of field-based tools are now being tested to turn silicate-weathering reactions into verifiable carbon-removal numbers. Cation-flux tracking follows the release of divalent base cations (Ca2+, Mg2+) and, with simple charge–balance models, infers the stoichiometric uptake of CO2 as bicarbonate [17,18]. Lysimeter and soil-column systems extend this idea by capturing leachate so that dissolved inorganic carbon (DIC), bicarbonate and accompanying cations can be measured directly, enabling full mass-balance estimates of carbon export to deeper soil or groundwater [19]. Isotopic tracing with δ13C or radiocarbon (14C) adds still finer attribution, distinguishing newly formed pedogenic carbonates from geogenic sources and thus identifying the carbon truly sequestered by enhanced weathering [20,21]. Although these approaches deliver rich mechanistic insight, they depend on specialised equipment, continuous solution sampling, or high-cost isotope analyses—constraints that hinder their use at the scale of commercial croplands.
Soil calcimetry offers a pragmatic alternative. By simply reacting a small soil subsample with hydrochloric acid and measuring the CO2 evolved, calcimetry yields the soil-inorganic-carbon (SIC) pool directly. Repeated sampling through time and depth converts this pool into a carbonate-formation flux (ΔSIC / Δt), which can be integrated into MRV frameworks with minimal analytical overhead [9,22]. The method requires only inexpensive glassware or a portable volumetric calcimeter, tolerates field-moist samples, and is fast enough to process dozens of replicates per day, attributes that make it cost-competitive with standard agronomic soil tests. Crucially, the carbonate signal it records integrates all upstream processes (dissolution, transport, precipitation) without the need to monitor each step individually. These advantages, low capital cost, high throughput and direct quantification of the sequestration product, explain why calcimetry is increasingly favoured for large-area trials and why it forms the methodological core of the present study.
Rainfall plays a dual role in enhanced weathering systems, acting both as a solvent that promotes mineral dissolution and as a transport agent that mobilizes weathering products such as Ca2+ and HCO3− [3,23]. While this dual function is well acknowledged in modeling and soil column experiments [24,25,26] empirical validation under agronomic field conditions remains limited. One minor yet important objective of this work is to evaluate how variations in rainfall, both in volume and timing, affect the carbonation signal observed through soil calcimetry. Since rainwater influences the kinetics of mineral weathering and the leaching of carbonate and bicarbonate species, it may either enhance or dilute the apparent accumulation of soil inorganic carbon (SIC) over time. By tracking calcimetry responses alongside precipitation events, this study aims to better understand how rainfall modulates the detectability and interpretation of ERW-induced carbonate formation in the field. This understanding is essential for refining MRV approaches and improving the reliability of CO2 removal estimates under real agronomic conditions.
Considering these gaps, the overall objective of this study is to evaluate the use of soil calcimetry as a field-based method to estimate the total weathering flux in wollastonite-amended agricultural soils. This general aim is addressed through the following specific objectives:
- To assess whether calcimetry can simultaneously reflect pedogenic carbonate formation and calcium loss via leaching.
- To evaluate the robustness of calcimetry as a proxy for total weathering flux under varying precipitation regimes.
- To compare field-derived measurements with carbon removal estimates predicted by kinetic mineral dissolution models.
- To investigate how precipitation dynamics influence the effectiveness of Enhanced Rock Weathering (ERW) in raising soil pH and promoting inorganic carbon accumulation.
Based on these objectives, the central research question guiding this study is: Can soil calcimetry be used as a reliable and field-operational method to quantify mineral weathering and carbon sequestration resulting from silicate mineral application in agricultural soils, particularly under variable rainfall conditions?
The core hypothesis of this work is that calcimetry, when applied at appropriate temporal and spatial resolution, can capture both carbonate formation and base cation loss in deeper soil layers, serving as a practical indicator of weathering intensity in ERW systems. It is further hypothesized that rainfall acts as a key modulator of the carbonation signal’s strength and detectability, potentially enhancing or attenuating the response observed through calcimetry measurements. To test this hypothesis and address the research objectives outlined above, the following sections describe the study site, experimental setup, sampling strategy, and analytical methods employed to quantify soil inorganic carbon and related weathering indicators under field conditions.
2. Materials and Methods
2.1. Study Area Description, Soil Characteristics, and Wollastonite Application
Wollastonite (CaSiO3), a calcium silicate mineral, was selected due to its favorable properties for enhanced rock weathering [7,27]. Its performance remains effective in environmental conditions less favorable to silicate weathering such as alkaline soils or cooler temperate climates characteristic of Southern Ontario, where several field trials have already demonstrated significant accumulation of soil inorganic carbon (SIC) following wollastonite amendment [7,27,28]. Previous studies in Ontario reported SIC accumulation rates of up to 2 t CO2 ha−1 yr−1 [27]. Wollastonite has also been shown to enhance plant growth, particularly in legumes like soybean and alfalfa, by supplying bioavailable silicon and calcium while buffering soil acidity [7,28] These co-benefits position wollastonite as a promising alternative to conventional liming agents, with the added advantage of transforming agricultural soils into carbon sinks.
The study area is in Port Colborne, Ontario, Canada, with a significant land use (72% of farmland area), with field crops such as corn, wheat, oats, barley, soybeans, and hay [29]. The region’s climate is classified as humid continental (Köppen Dfa), characterized by warm summers and cold, snowy winters. The mean annual temperature is approximately 9.5 °C, with average temperatures ranging from -3.7 °C in February to 22.7 °C in July. Annual precipitation averages around 1,129 mm, with June typically being the wettest month (Climate Canada, 2024). Soils in the area are predominantly reddish-hued lacustrine heavy clays with poor or imperfect drainage, situated in smooth basins to very gently sloping terrains. The B horizon, which was sampled in studies, is characterized by a sandy texture, neutral pH (~6.5), negligible soil organic carbon (<0.1 wt.%), and poor drainage [29]. This combination of soil characteristics and climate conditions influences the agricultural practices in Port Colborne, with a focus on field crops that are well-suited to the region’s environmental conditions [29].
The B horizon was selected for sampling to provide a baseline soil condition with naturally low soil organic carbon (SOC) and moderately elevated soil inorganic carbon (SIC). Unlike deeper layers such as the Ck horizon, the B horizon remains more active in terms of soil formation processes and may participate more dynamically in carbonate precipitation due to occasional exposure to root activity, seasonal moisture fluctuations, and limited but relevant biological influence [30]. This makes it a suitable target for studying mid-term carbonate accumulation from enhanced rock weathering.
Soils at the study site were characterized by laboratory analyses conducted by the Agriculture and Food Laboratory at the University of Guelph. The results identified the soils as heavy clays, with clay contents exceeding 50% in both composite samples (52.1% and 54.1% for Composite A and B, respectively), and low sand fractions (~15%). The pH of the soils ranged from 6.26 to 6.72 (SMP buffer method), indicating a neutral to slightly acidic environment favorable for wollastonite dissolution. These soils are consistent with lacustrine clay landscapes typical of poorly drained, low-slope regions of southern Ontario. Based on their fine texture, low organic matter, and compaction potential, a bulk density of approximately 1,500 kg/m3 was assumed for subsequent calculations of weathering rates and carbonate formation potential.
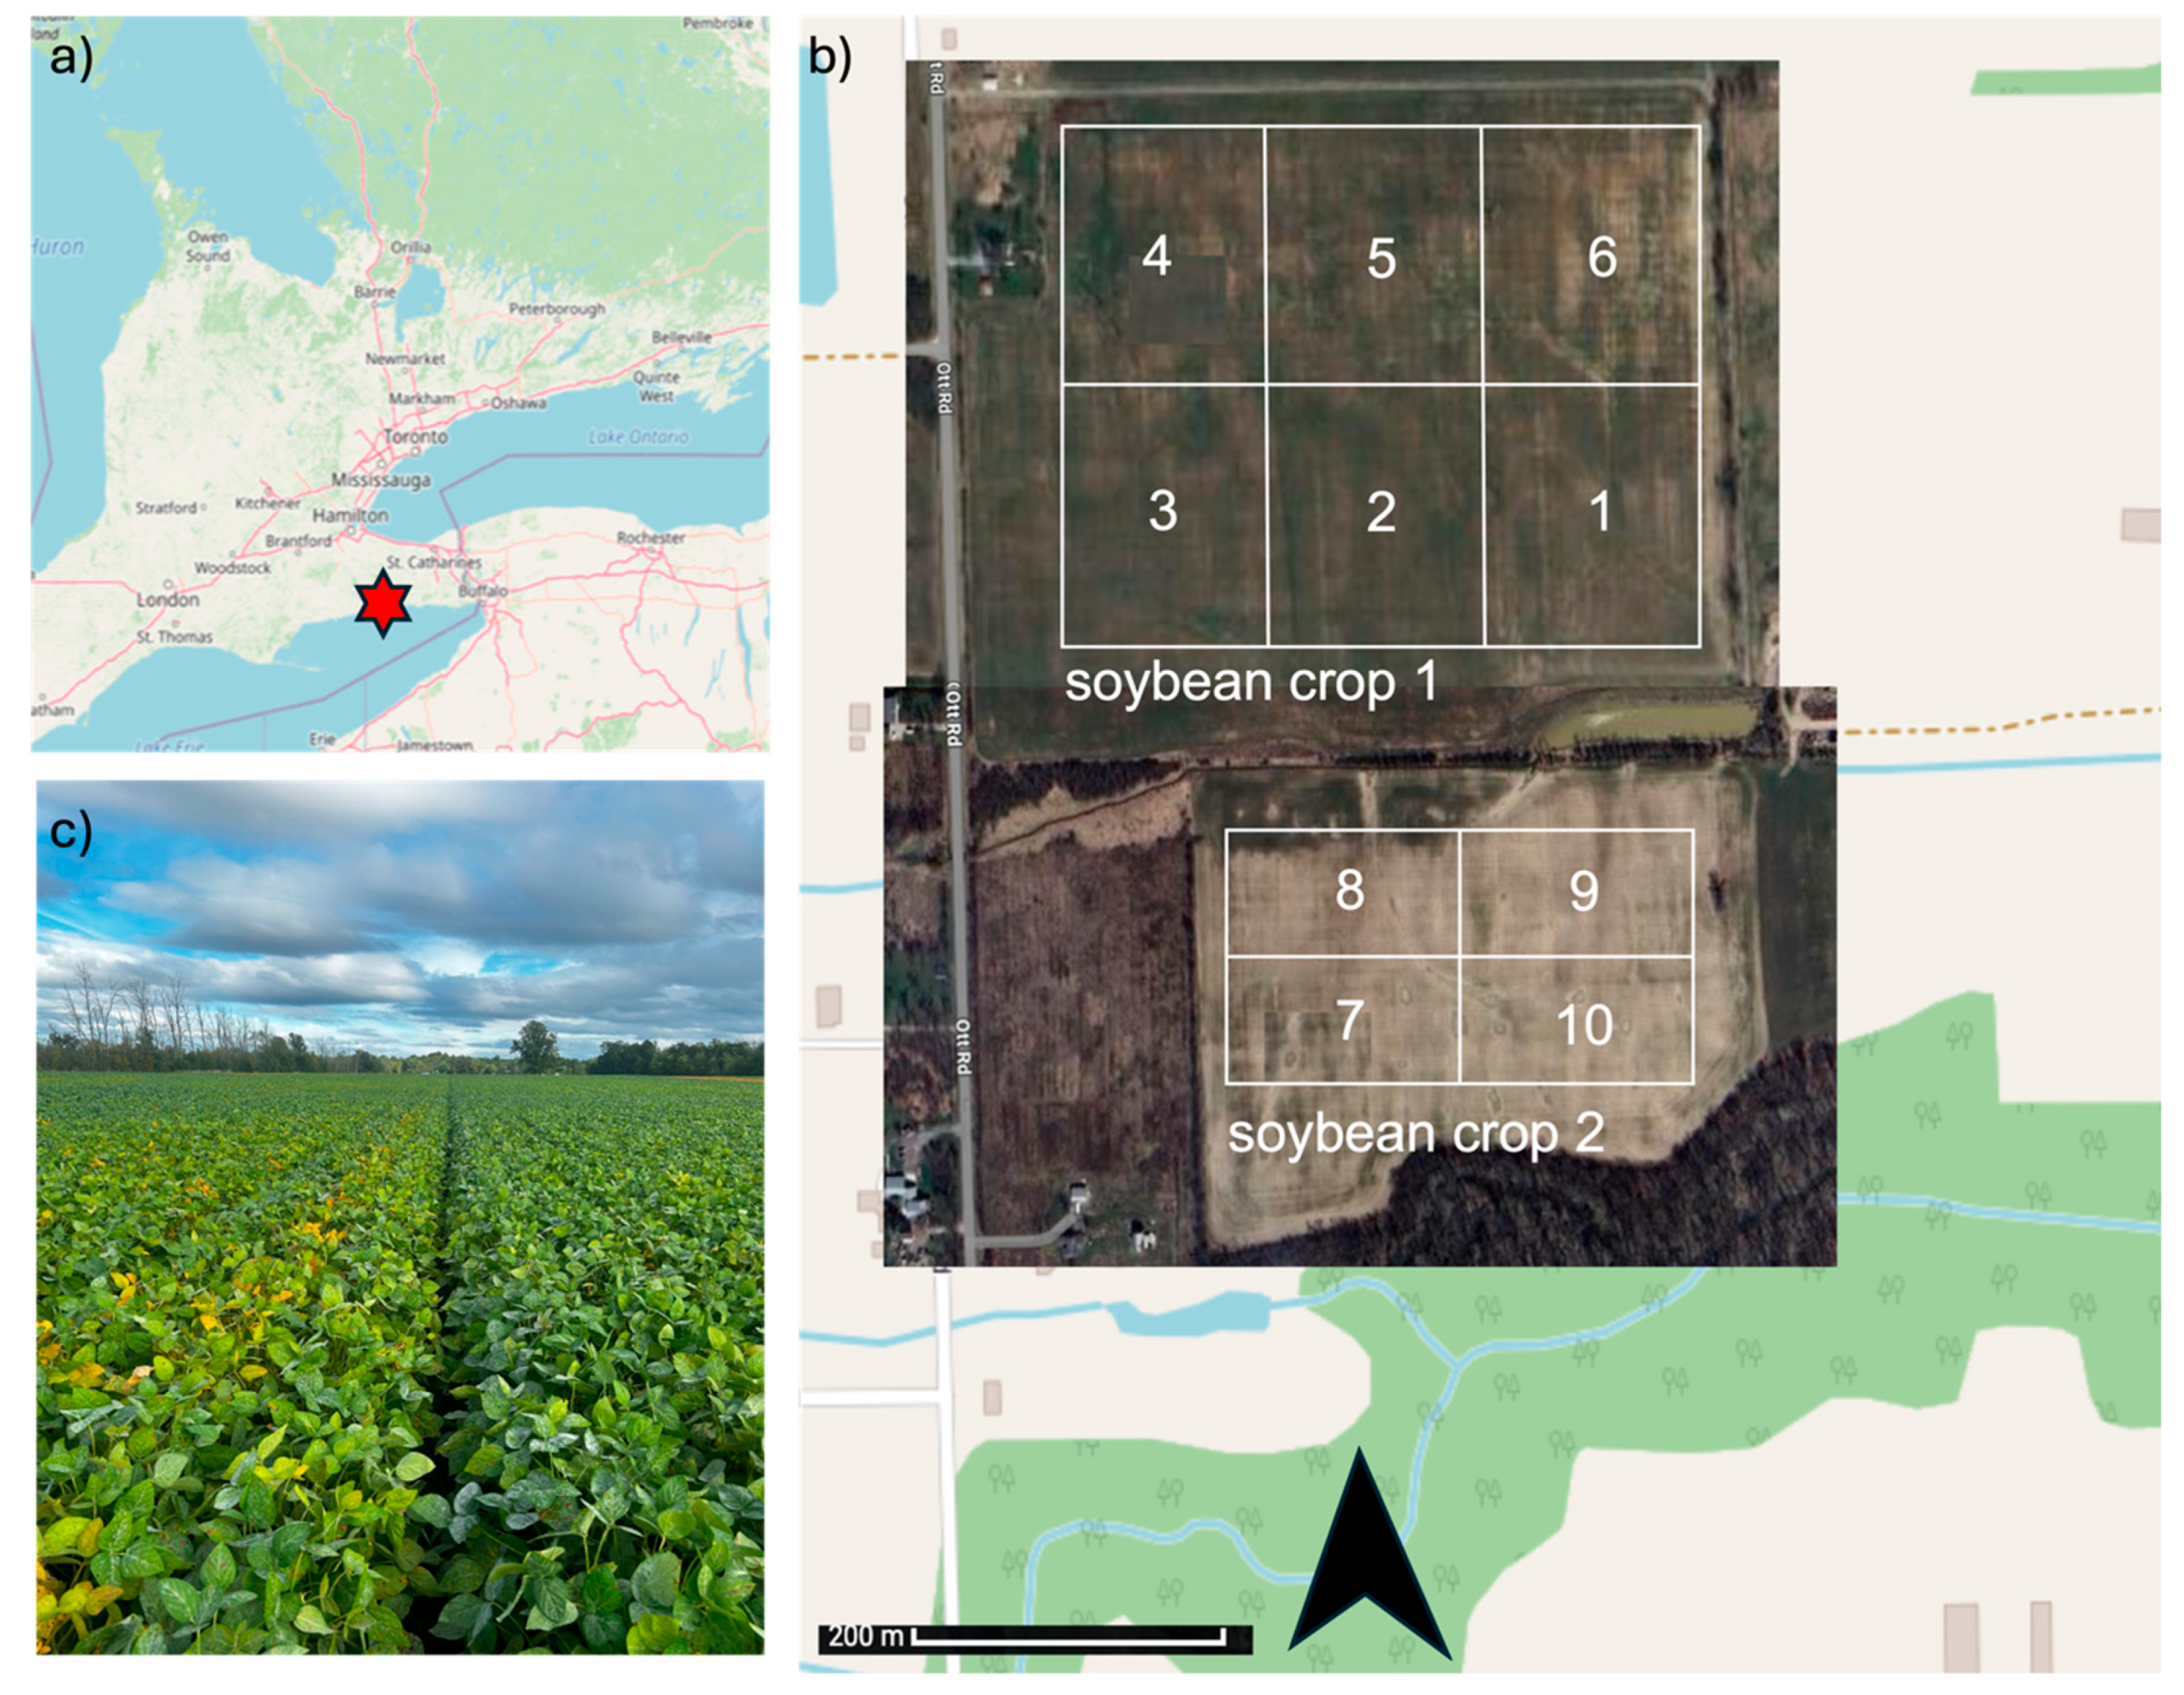
The site comprises two adjacent soyabean agricultural fields designated as Farm 1 (location 1) and Farm 1 (location 2), each hosting six and four experimental plots (1-6 and 7-10, respectively). The soil used for this study was collected from May to October 2024 at a depth of 20 cm. Prior to sampling, the entire area received an application of regular crushed wollastonite (30μm) at a rate of 2.908 metric tonnes per acre (7.186 tonnes/ha) on April 29, 2024, as part of an enhanced weathering strategy aimed at increasing soil inorganic carbon through silicate mineral amendment.
These plots were laid out in a grid format, with spatial reference coordinates recorded using GPS for precise geolocation and replication. As shown in the aerial imagery and map overlay, Farm 1 (location 1) is situated in the northern field, while Farm 1 (location 2) occupies a more forest-adjacent southern area, which may reflect differences in microclimate and soil conditions. This geographic setup facilitates comparative analysis of treatments across similar but distinct field environments (Figure 1).
Figure 1.
Location, layout, and field conditions of the Enhanced Rock Weathering (ERW) trial site in Port Colborne, Ontario. a) Location of the field site (red star). b) Aerial view, showing two soybean crops (crop 1: plots 1–6; crop 2: plots 7–10) with plot boundaries outlined. c) Photograph of soybean growth during the trial period.
2.2. Soil Sampling and Analysis
The Soil samples were collected using an auger to a depth of 20 cm at the designated plot locations, covering the entire soybean growing season from May to October 2024. Approximately 500 g of soil was collected per sample and stored in labeled zip-lock plastic bags. Upon arrival at the laboratory, each sample was weighed, air-dried for 24 hours at room temperature, and weighed again to determine gravimetric moisture content. Initial measurements included soil pH and electrical conductivity (EC), both assessed using handheld meters. A subset of the first batch of samples was further subsampled for commercial laboratory analysis, which included pH buffering capacity and particle size distribution from composited samples. Subsequently, all samples underwent additional testing for pH and inorganic carbon content via calcimetry.
Soil pH was measured following the procedure outlined in ISO 10390:2005 [31]. Prior to measurement, air-dried soil samples were sieved to <2 mm. For each measurement, 10 g of sieved (mesh 10 or 2 mm) soil was weighed and placed into a 50 mL beaker. Two extraction methods were used: one with 25 mL of deionized Milli-Q water and another with 25 mL of 0.01 M CaCl2 solution, both maintaining a 1:2.5 soil-to-solution ratio (mass: volume). The suspensions were stirred thoroughly and left to equilibrate for 30 minutes, with occasional agitation to ensure uniform mixing. After settling, pH was measured in the supernatant using a calibrated digital pH meter equipped with a glass electrode (Orion Star A329, Thermo-Fisher scientific). The meter was calibrated before each session using standard buffer solutions (pH 4.00, 7.00, and 10.00), and electrode performance was verified regularly. To minimize variability, all measurements were performed in triplicate, and the average value was reported for both water and CaCl2 extractions.
For calcimetry, soil sample preparation followed the ISO 11464:2006 [32] standard, involving air-drying and sieving the material to a particle size of less than 2 mm. Gravimetric water content was determined in accordance with ISO 11465:1993 [33]. Soil inorganic carbon (SIC) content, expressed as g CaCO3 per kg of soil, was quantified using a volumetric calcimetry method with an Eijkelkamp calcimeter, based on ISO 10693:1995 [34]. In this procedure, 20 mL of Milli-Q water was first added to each soil sample in an Erlenmeyer flask. After sealing and agitation, 7 mL of 4 M HCl was introduced to initiate the reaction [35]. The CO2 released was collected and its volume measured by observing the displacement of water in a connected graduated column, marked in 0.2 mL increments. The carbonate content w(CCE) of the sample (in grams per kilogram was calculated based on the volume change observed in the burette for the samples, the blanks, and the CaCO3 calibration values, using the following formula:
where: w(CCE) = calcium carbonate equivalent content of the soil (g/kg); m1 = the mass (g) of the test portion; m2 = the mean mass (g) of the calcium carbonate standards; v1 = the volume (mL) of carbon dioxide produced by the reaction of the test portion; v2 = the mean volume (ml) of carbon dioxide produced by the calcium carbonate standards; v3 = the volume changes (ml) in the blank determinations; w(H2O) = the water content (wt. %) of the sample before drying.
All experimental analyses were performed in triplicate, and the results are reported as mean values with corresponding standard errors. To facilitate interpretation and comparison, the measured CCE values (expressed in g/kg) were also converted to total mass (CCE in grams) based on the actual soil mass used in each analysis. This adjustment helps account for potential dilution effects caused by the incorporation of mineral amendments. Additionally, a proportional average CCE (g/kg) was calculated for each amendment treatment by converting the total carbonate content back to a per-kilogram basis, considering only the soil fraction.
Then, weathering-fluxes are first derived from month-to-month changes in calcium-carbonate equivalent (ΔCCE / Δt), expressed as g kg−1 s−1, and then normalised by soil bulk density and sampling depth to obtain a surface-area-based proxy (mol m−2 s−1) for silicate dissolution. These empirically measured fluxes are compared directly with theoretical dissolution rates predicted by the Palandri & Kharaka (2004) kinetic model, revealing where laboratory rate laws tend to over- or underestimate in-field behaviour. See Figure 2 for an overview of workflow. The outcomes are presented in Section 3 and further interpreted in Section 4.
2.3. Weathering Rate (Theoretical Approach)
To establish a baseline understanding of wollastonite weathering dynamics, we begin with estimating the weathering rates using a theoretical approach grounded in established geochemical kinetics developed by Palandri and Kharaka. This method provides an estimation of weathering rates based on mineral properties and reaction parameters. This theoretical framework provides a solid basis for interpreting empirical findings from calcimetry [36]. To begin, the logarithm of the Arrhenius pre-exponential factor at 25 °C (298.15 K) (Log A, in mol·m−2·s−1) was obtained from equation (2). Subsequently, the weathering rate was calculated using equation (3), which incorporates both pH and temperature (fixed at 25 °C). For this calculation, we applied the coefficients k, E, and n, specific to the neutral pH range (~6–9), as provided by Palandri and Kharaka. We also followed the guidance of Haque et al. [7] for selecting an appropriate weathering mechanism applicable to mildly acidic conditions, situated between fully acidic and neutral regimes. In this context, k represents the rate constant at 25 °C and pH = 0 (mol·m−2·s−1), E is the Arrhenius activation energy (kJ·mol−1), and nₕ₊ denotes the reaction order with respect to H+ concentration.
The equation for the theoretical model is given for (4):
To assess the applicability of this model under real field conditions, we developed an empirical proxy derived from calcimetry measurements, as detailed in Section 3.3. By comparing the model-derived values with those calculated through changes in calcium carbonate content (ΔCCE/Δt), we aim to evaluate the reliability of using calcimetry as a practical and field-accessible method to estimate silicate weathering rates in situ.
2.4. Weathering Flux (ΣΔCCE/Δt)
The process for calculating ΔCCE/Δt involves determining the rate of accumulation in calcium carbonate content (g/kg) over time (flux) for each soil plot, serving as a proxy variable and the associated inorganic carbon sequestration. First, the differences in CCE between each pair of consecutive sampling dates (ΔCCE) were then calculated to capture the incremental change in carbon accumulation. Simultaneously, the time elapsed between sampling dates (Δt) was computed in seconds, allowing for high-resolution temporal comparisons. Finally, the rate of change in calcium carbonate accumulated was derived by dividing each ΔCCE by its corresponding Δt, yielding ΔCCE/Δt in units of g·kg−1·s−1. This approach quantifies the temporal dynamics of carbonate formation in the soil, enabling comparison of weathering activity across plots and over time. This flux (ΔCCE/Δt) was converted from g·kg−1·s−1 to mol·m−2·s−1 using Equation 5, which accounts for soil bulk density (), sampling depth (d), wollastonite purity (), molar mass (and specific surface area (SSA). This allows the proxy to reflect calcium release at the mineral–soil interface in standardized units for weathering rate comparisons.
Where ΔCCE/Δt is the temporal change accumulated in carbonate content (g CaCO3·kg−1·s−1), (), is the soil bulk density (1500 kg·m−3), and d is the sampling depth (0.2 m). (refers to the applied wollastonite mass per surface area (736.37 g·m−2), (), refers to molar mass (g/mol), and SSA is the specific surface area considering cylinder format instead of sphere due his shaped form (0.01146 m2·g−1) [37]. The resulting (ΔCCE/Δt) values provide a normalized, surface-area-based estimate of silicate weathering dynamics under field conditions.
2.5. The Role of the Rain
Rainfall plays a pivotal role in the enhanced rock weathering (ERW) process because it functions both as a catalyst for mineral dissolution and as a transport mechanism for dissolved products [38]. When rain infiltrates the soil, it facilitates the dissolution of silicate minerals by supplying water and protons (H+), which are essential for the chemical breakdown of the mineral structure. This reaction releases base cations like Ca2+ and Mg2+ that subsequently bind with dissolved CO2 to form bicarbonate ions (HCO3−), which can be leached into groundwater or eventually reach the oceans, where the carbon is stored for millennia [39]. The magnitude of this dissolution is influenced not just by total rainfall, but also by its timing and distribution, frequent light rains can sustain steady mineral–water contact, whereas prolonged dry spells followed by intense storms may lead to rapid but short-lived dissolution pulses [3,38,39].
Rainfall also drives the lateral and vertical movement of carbonate and bicarbonate species within the soil profile, affecting where and how carbonate precipitation occurs. Moderate, well-distributed rainfall can promote pedogenic carbonate formation in the rooting zone, enhancing in situ CO2 sequestration. In contrast, heavy rainfall events may bypass this precipitation stage by flushing bicarbonate ions quickly through the profile before they can precipitate, effectively shifting the carbon storage pathway toward aquatic systems [3,27,30]. Studies such as Amann et al. [24] and Kelland et al. [25] have shown that cumulative rainfall in the preceding days or weeks can act as a strong predictor of bicarbonate flux in leachate, reinforcing the need to integrate precipitation patterns into ERW monitoring and verification protocols.
In carbonate weathering systems, cumulative precipitation over short preceding intervals (e.g., 7–10 days) can exert a saturating positive influence on mineral dissolution and carbonate formation. Deng et al. [3] observed diminishing marginal returns of weathering rates under high precipitation regimes, indicating that beyond a certain threshold, additional rainfall does not proportionally enhance dissolution. This saturation effect has been attributed to the finite availability of reactive mineral surfaces and to leaching losses that occur when infiltration exceeds the soil’s water-holding capacity.
From an MRV perspective, understanding rainfall’s dual role is essential for interpreting calcimetry data accurately. Without accounting for hydrological dynamics, weathering flux estimates could be misattributed to changes in mineral reactivity rather than to transient moisture conditions. Incorporating precipitation metrics into MRV models can improve the reliability of CO2 removal estimates, especially in temperate agricultural systems where rainfall variability is high. This approach ensures that field-derived sequestration rates reflect both geochemical kinetics and the hydrological context that governs carbonate formation and transport.
3. Results and Discussions
3.1. pH and Calcimetry
The progressive increase in soil pH observed across both Milli-Q and CaCl2 extracts during the soybean growing season indicates effective alkalinization of the soil matrix following wollastonite application (see Figure 4 and Table 1). One-way ANOVA confirmed that these changes were statistically significant over time (p < 0.001), reinforcing the role of wollastonite in neutralizing soil acidity through silicate weathering reactions.
The pH rise, particularly between mid- and late season, coincided with peak temperature months (See Figure 3) and likely enhanced biological activity, both of which are known to accelerate silicate mineral dissolution [30,40]. In contrast, calcium carbonate equivalent (CCE) values did not exhibit significant variation over time (ANOVA p = 0.201) and showed no statistical difference between May and October (Wilcoxon p = 1.000). These results suggest that, despite favorable weathering conditions, carbonate accumulation in the topsoil was limited or spatially heterogeneous. Pearson correlation analysis between pH and CCE revealed moderate but statistically significant relationships. For pH measured in CaCl2, the correlation was r = 0.47, p = 0.0001, and for pH measured in Milli-Q, r = 0.42, p = 0.0009. These updated values indicate a stronger association between alkalinization, and inorganic carbon accumulation than previously observed, although variability across plots still plays a role.
Taken together, these findings suggest that while wollastonite application effectively increased soil pH and showed some association with carbonate formation, short-term CCE accumulation remained modest. This may reflect delayed pedogenic carbonate crystallization, lateral or vertical translocation of carbonates, or spatially variable microenvironments within the field that influenced carbonate precipitation. Detailed plot-level data on soil pH (Milli-Q and CaCl2) and calcium carbonate equivalent (CCE) measurements from May to October 2024 are provided in the supplementary material (Tables S1–S3).
Figure 3.
Monthly accumulated precipitation and mean air temperature in Port Colborne (Ontario, Canada) from May to November 2024. Total precipitation is represented by green bars (mm), and the red dotted line indicates monthly mean temperatures (°C). Data source: Environment and Climate Change Canada, Port Colborne (AUT) Station. [11,12].
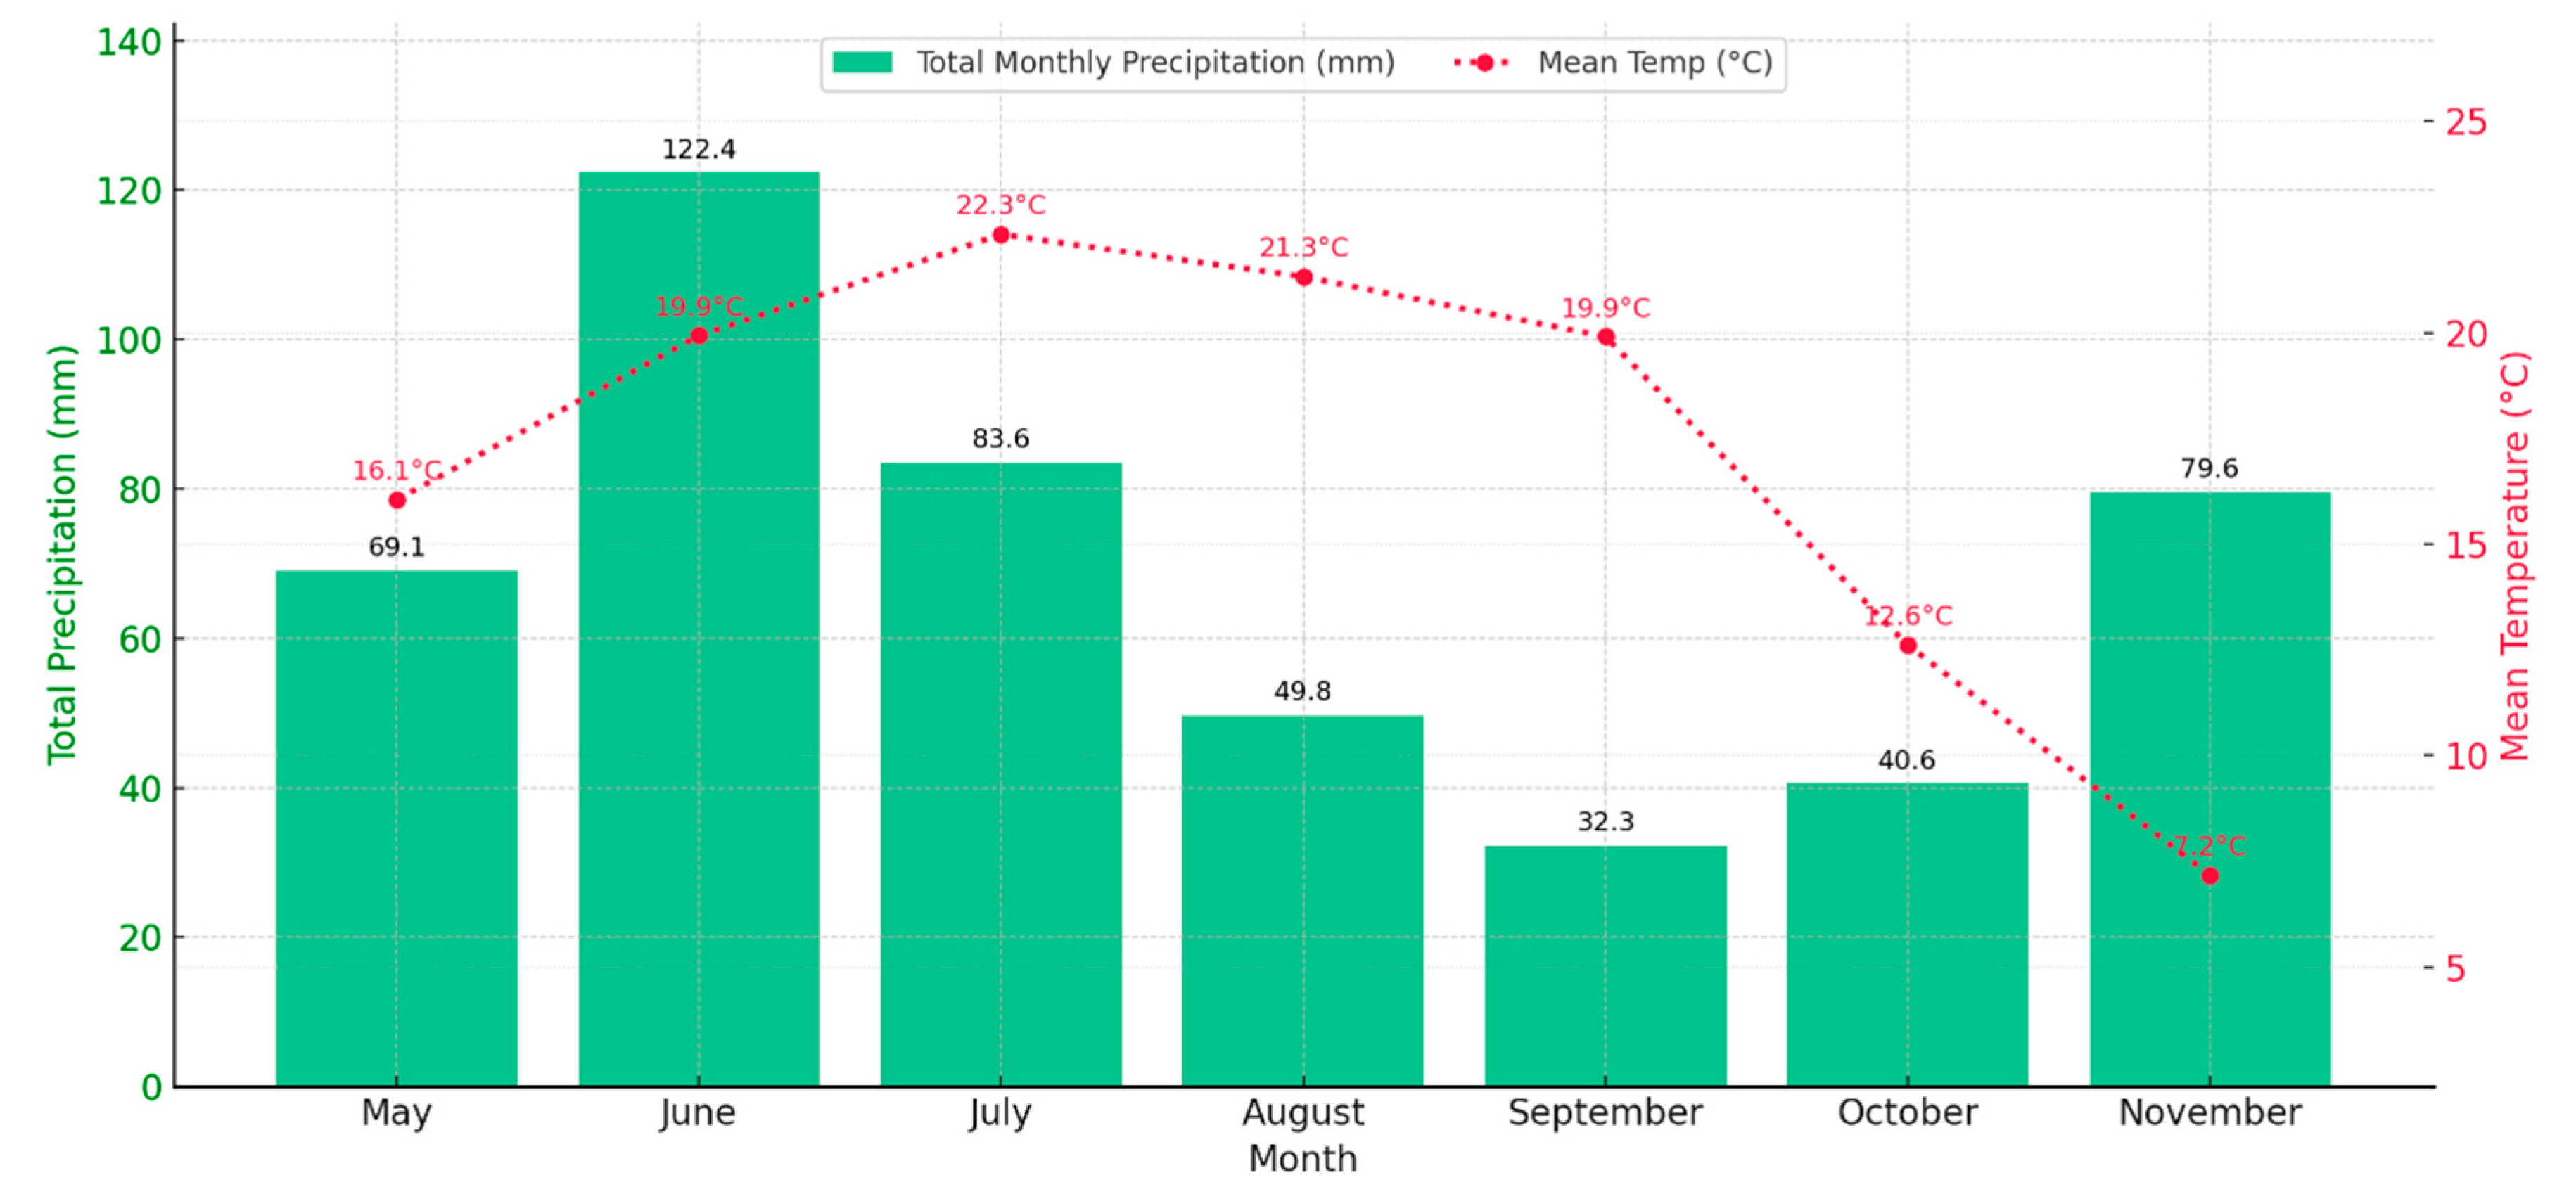
Figure 4.
Seasonal pH and carbonate by plot (May–October 2024). The 10 panels show monthly data for each field plot (1–10). Shaded pink areas are soil pH measured in Milli-Q water; shaded blue areas are pH in 0.01 M CaCl2 (left y-axis, 0–8). Where they overlap, the hue appears purple. Shaded green areas show inorganic carbonate (CCE, g kg−1) on the right y-axis (0–7). Months on the x-axis run from May to October.

The two boxplots (Figure 3a and 3b) representing pH measured in MilliQ-water and in CaCl2 from May to October together reveal a consistent trend of gradual alkalinization across the monitored plots following wollastonite application. In both cases, the median pH values increase over time, suggesting a cumulative response likely driven by progressive mineral weathering [7,27,30]. From May through July, both datasets show relatively stable behavior, with modest variability and fewer outliers. This early-phase uniformity may reflect the initial buffering capacity of the soil or a lag in the weathering response. Several studies report a lag in alkalinization after silicate amendment, due to soil buffering and delayed weathering responses. At Hubbard Brook, wollastonite-treated plots showed minimal pH or Ca change for years [41]. In rooftop and microplot trials, Haque et al. [7] found gradual pH increases despite initial buffering by organic matter and roots. Similar delays in pH rise have been observed in olivine- and basalt-amended mesocosms [24,25]. Silva et al. [22] observed that carbonate formation may remain below detection thresholds during the early stages of mineral. Additionally, Swoboda et al. [10] emphasized that weathering rates under field conditions are often initially limited by moisture availability and surface passivation, which can further contribute to slow early-phase geochemical responses.
Figure 3.
Monthly variation in soil pH (Milli-Q and CaCl2 extractions) and inorganic carbonate content (CCE) across 10 field plots from May to October 2024.
Figure 3.
Monthly variation in soil pH (Milli-Q and CaCl2 extractions) and inorganic carbonate content (CCE) across 10 field plots from May to October 2024.

However, starting in August, a clear shift occurs both the CaCl2 and Milli-Q measurements display increased dispersion and the emergence of outlier’s indicators of growing heterogeneity within the system. This could be due to spatial differences in mineral dissolution rates, root-zone processes, or environmental stressors such as moisture variability or microbial activity [30]. Similar trends of early uniformity followed by increasing variance have been documented in field soils more broadly, where soil solution chemistry exhibits high spatial and temporal variability due to heterogeneous pore structure, moisture dynamics, and microbial community distribution [42,43]. Such heterogeneity means that even under the same treatment, different microsites within a field can respond differently over time.
The peak in September, especially prominent in the Milli-Q dataset, captures the highest pH values and the greatest variability, marking a dynamic phase in the system’s evolution. By October, a slight decline or stabilization in pH suggests the onset of a new equilibrium or a seasonal transition, as external drivers like temperature and biological activity begin to shift. Overall, the results reflect a soil system that evolves gradually under mineral amendment but becomes increasingly complex over time. This underscores the need for ongoing monitoring to better understand the temporal dynamics of alkalinity development and their potential agronomic or environmental implications.
The boxplot for inorganic carbonate content (CCE) from May to October (Figure 3c) displays a pattern marked by substantial variability across months, without a clear temporal trend. Such trends have been well documented in soil studies, where monthly sampling across field experiments showed significant temporal and spatial variability in inorganic carbon and soil solution chemistry [42,44]. Additionally, in ongoing ERW field trials in Malaysia, small plot-scale differences led to variable soil carbonate responses despite standardized treatments, highlighting how microsite conditions influence the consistency of weathering signals [45].
The monthly variation in CCE observed in this study, particularly the low and tightly clustered values in June contrasted with the higher median and broader spread in August, is consistent with findings in previous studies as reported by Cipolla et al. [38], who found that rainfall seasonality influenced carbonate fluxes, with wetter months yielding greater variability across sites. Field trials with kimberlite residues in Ontario also demonstrated significant microsite heterogeneity in dissolved inorganic carbon despite uniform application, attributed to localized differences in soil structure and moisture [46,47]. Furthermore, broader studies on seasonal carbonate cycling, such as those by Kaufhold et al. [46] show substantial intra-seasonal variation in total alkalinity and dissolved carbon species linked to hydrologic pulses and microbial activity. These findings support the interpretation that spatial and temporal variability in carbonate accumulation is an inherent feature of field-scale enhanced weathering systems.
Taken together, the three boxplots (pH in Milli-Q, pH in CaCl2, and CCE) reveal distinct yet interrelated trends that characterize the early-stage geochemical response to wollastonite amendment:
- pH in Milli-Q extracts showed a sharper and more variable increase over time, with a mid-season peak followed by stabilization. This dynamic pattern may reflect evolving soil chemistry influenced by seasonal temperature changes, biological activity, and mineral dissolution.
- pH in CaCl2 extracts exhibited a steady and more uniform rise throughout the season, indicating sustained alkalinization of the soil matrix and a slower buffering effect in the exchangeable phase of the soil solution.
- CCE (inorganic carbonate content) displayed substantial spatial and temporal heterogeneity, without a clear seasonal trend. This suggests that carbonate accumulation is governed by microsite-specific factors such as moisture availability, root activity, and local soil structure, making it less predictable than pH response
3.2. Temporal Dynamics of Carbonate Accumulation and Weathering Fluxes
Table 2 shows the monthly variation in calcium carbonate equivalent (CCE), expressed as ΔCCE (change from the previous month), |ΔCCE| (absolute change), and Σ|ΔCCE| (absolute cumulative sum), for each of the 10 monitored plots. The columns labeled t1 through t5 represent five intervals from May to October 2024. Positive ΔCCE values suggest net carbonate accumulation, while negative values may indicate leaching or re-dissolution processes. High variability across plots reflects site-specific dynamics of carbonate formation and potential loss. The final column provides the duration of each interval (Δt) in seconds, used for flux calculations. In this scenario, we consider all monthly variations as positive by working with the absolute value of ΔCCE. This approach yielded the best regression performance and improved the correlation between measured carbonate accumulation and mineral weathering rates predicted by kinetic models (e.g., Palandri & Kharaka [36]). It is important to note that this use of absolute ΔCCE values reflects the intensity of carbonate transformation (both formation and loss) rather than net CO2 sequestration. While carbonate dissolution may represent the remobilization of previously sequestered carbon, it does not imply a second sequestration event. Therefore, this approach does not double count CO2, but instead captures the dynamic turnover of inorganic carbon as a proxy for silicate weathering activity. It is important to distinguish between carbonate transformation and carbon permanence. While calcimetry effectively captures the intensity and direction of inorganic carbon fluxes, it does not directly measure the long-term fate of sequestered CO2. Complementary methods such as isotopic tracing or leachate monitoring are needed to assess permanence.
Table 3 presents the temporal flux of inorganic carbonate accumulation in soil, normalized by time (Δt) and surface area. The flux is expressed as ΣΔCCE/Δt in both mass (g/kg/s) and molar (mol/m2/s) units for each plot and time interval. These values serve as empirical proxies for carbonate formation in the field. Notably, higher fluxes indicate periods or locations with greater mineral reactivity, dissolution, or CO2 sequestration rates, consistent with enhanced weathering activity. Data support subsequent modeling and comparison with kinetic rate laws.
Table 4 shows the base-10 logarithm of empirical weathering flux values (ΣΔCCE/Δt), providing a normalized and scale-compressed view of temporal carbonate formation rates across plots. These values facilitate comparison with theoretical dissolution rate laws and enable improved statistical modeling of weathering kinetics under field conditions. Less negative values indicate higher weathering activity and potential CO2 drawdown, while more negative values reflect lower carbonate accumulation or leaching-dominated phases.
The Table 5 represent the dataset used to compare measured soil pH, the empirical weathering for the first three plots sampled in May; the full dataset for all plots is available in Table S4 -Supplementary Material section. Each row corresponds to an individual field sampling per plot and includes the following variables: the calculated weathering rate (WR) its logarithmic transformation (logWR), the Arrhenius model parameters used (pre-exponential factor A, activation energy E, and reaction order with respect to proton concentration nH), soil pH measured in 0.01 M CaCl2, sampling date, and plot number. The final column contains log (ΣΔCCE/Δt), calculated from Table S4. This dataset forms the basis for the regressions and correlation analyses presented in the following tables, where we examine the relationship between soil pH and log (ΣΔCCE/Δt) and assess how well this proxy aligns with the theoretical logWR.
Table 6 summarizes the statistical relationships among modeled weathering rates (logWR), an empirical weathering proxy derived from soil calcimetry (log (Σ ΔCCE/Δt)), and measured soil ph. For each comparison, the table reports the Pearson’s r, Spearman’s ρ, and Kendall’s τ correlation coefficients, as well as the slope and R2 of the linear regression.
Figure 4.
Relationships among modeled and measured weathering rates and soil pH. Panel (a) shows a linear regression between the empirical weathering proxy log (Σ ΔCCE/Δt), derived from soil calcimetry, and measured ph. Panel (b) shows the modeled weathering rate (log WR), based on Palandri & Kharaka [36], also regressed against ph. Panel (c) compares log(Σ ΔCCE/Δt) with log WR, revealing a moderate correlation between the two approaches, which reflects both their shared dependence on pH and methodological differences.
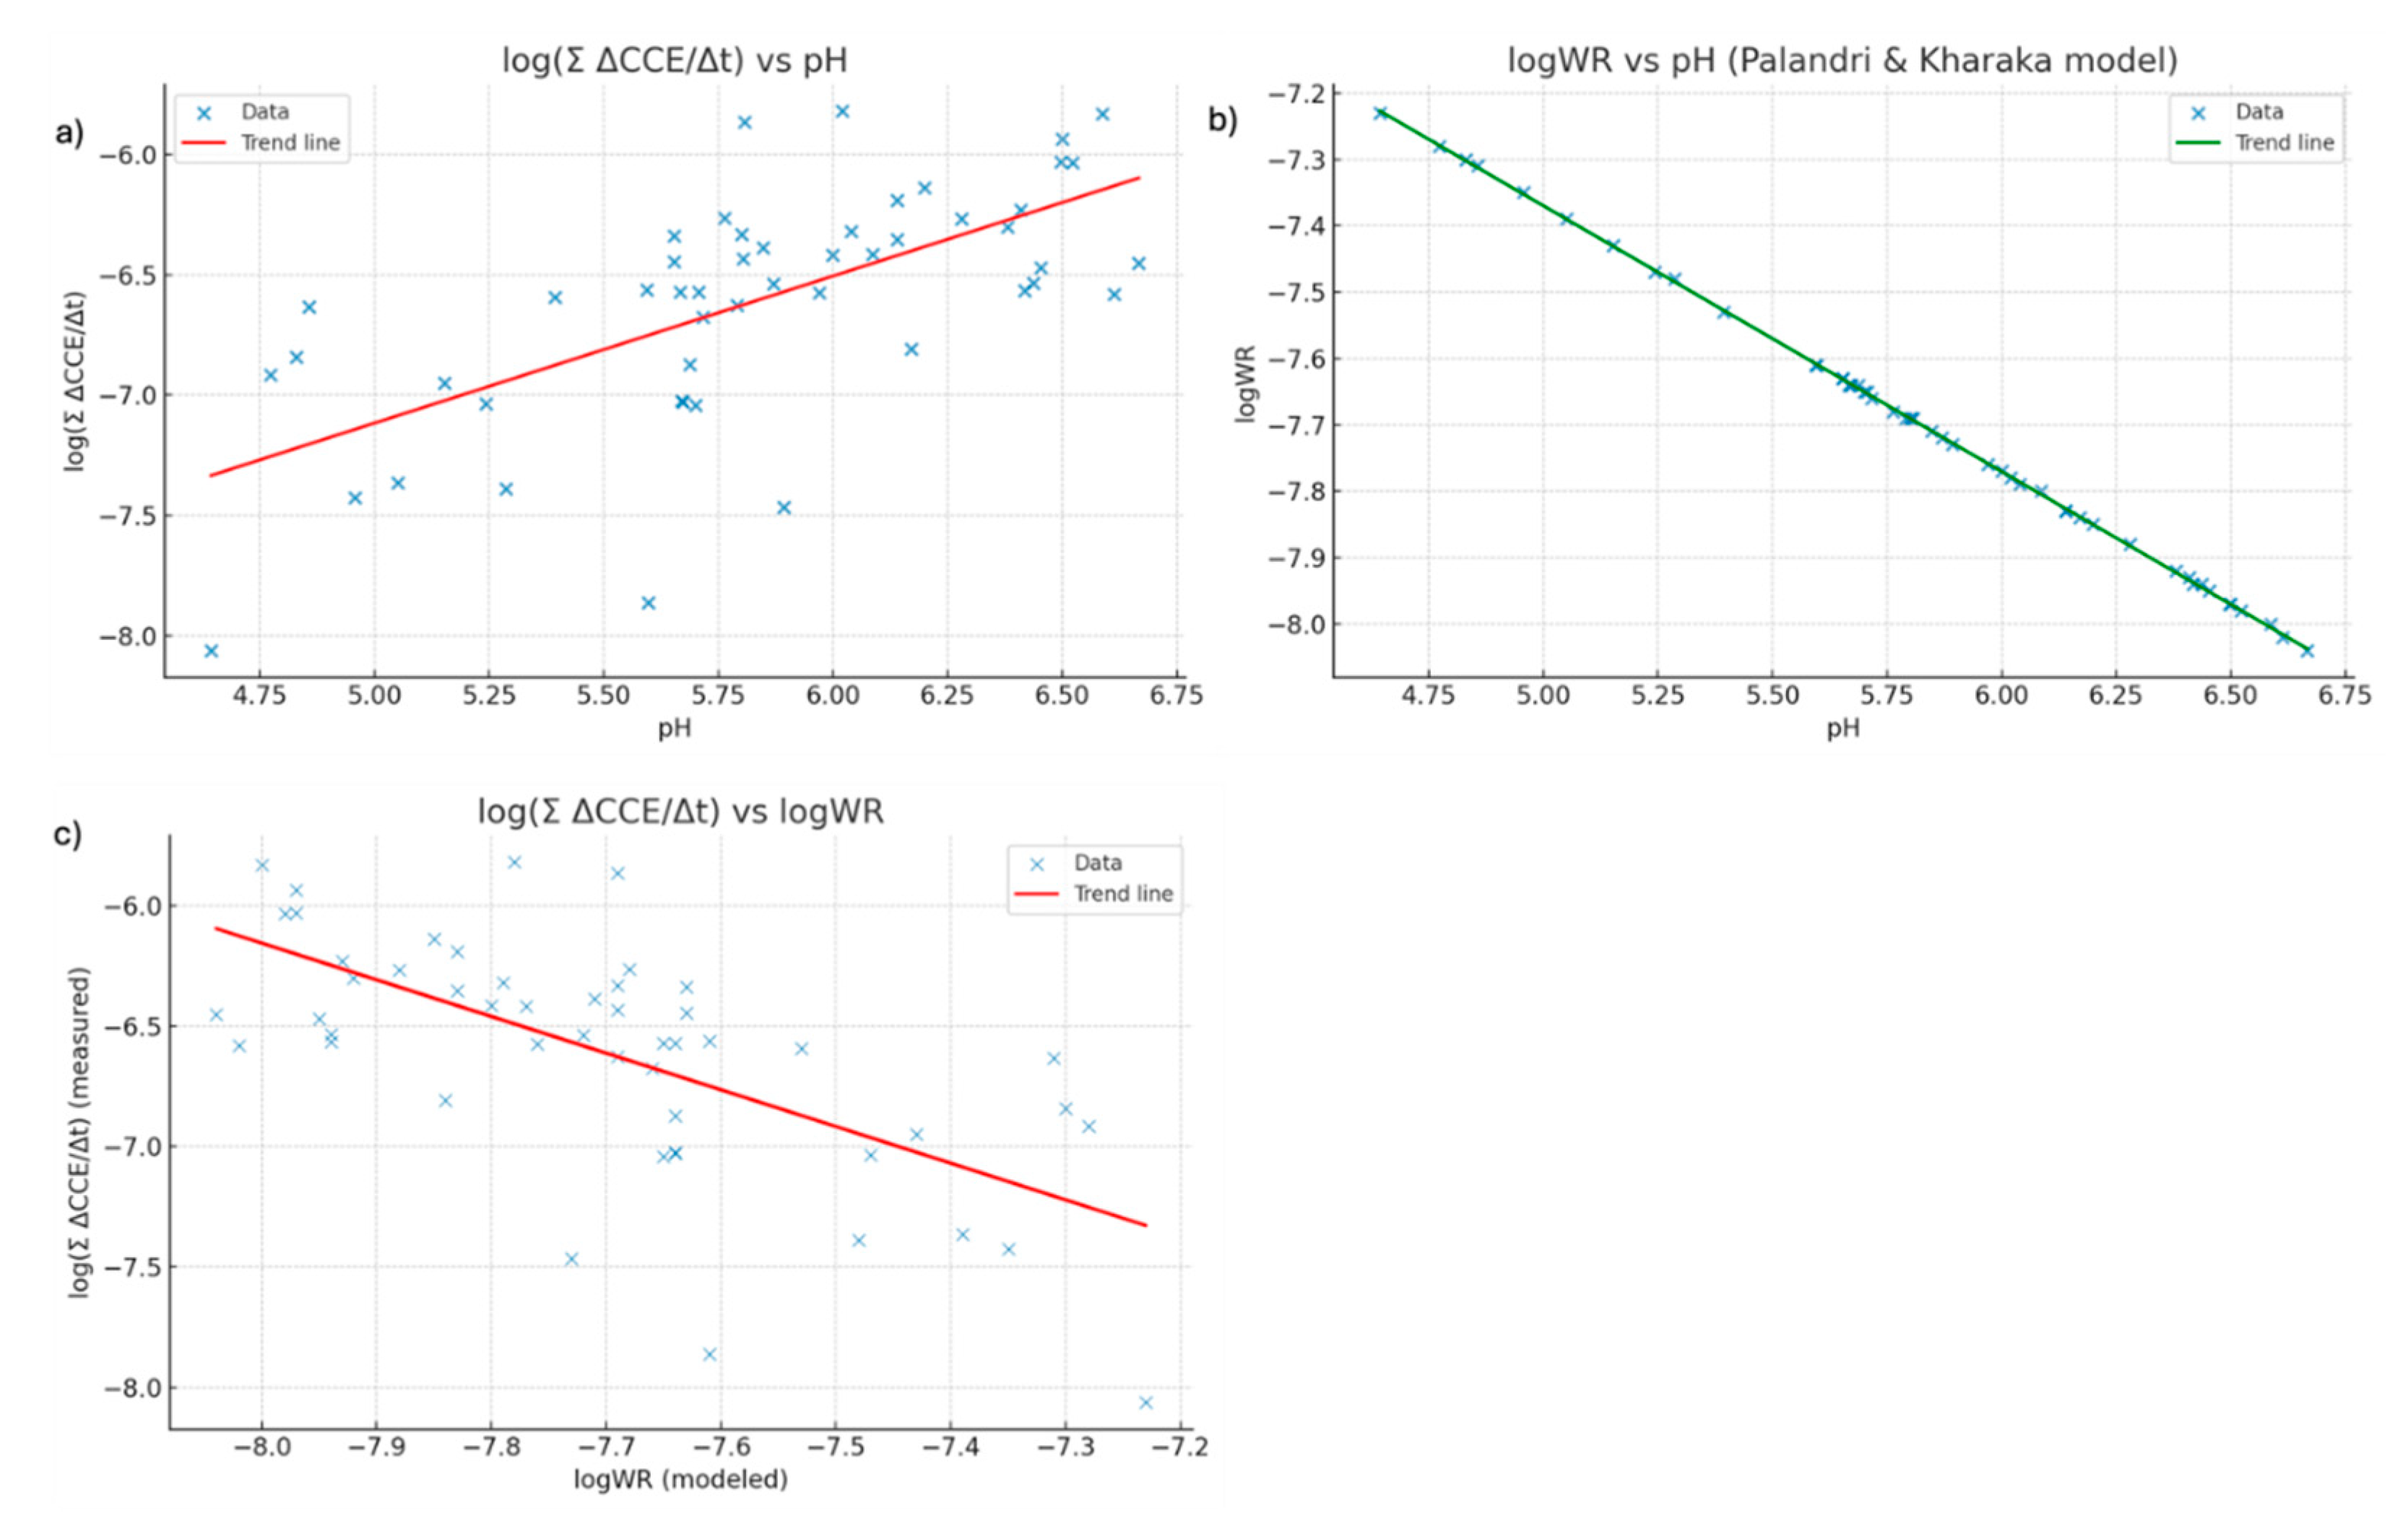
The results in Table 6 and Figure 4 show that the modeled weathering rate (logWR) displays a strong negative correlation with pH (r ≈ –1), indicating that higher dissolution rates occur under more acidic conditions, a direct consequence of the pH-dependent nature of the Palandri & Kharaka [36] kinetic law. In contrast, the empirical weathering proxy derived from soil calcimetry, log (ΣΔCCE/Δt), exhibits a moderate positive correlation with pH (Pearson’s r = 0.652), suggesting that higher carbonate fluxes are associated with more alkaline conditions. This divergence reflects the fact that the two metrics capture distinct but complementary stages of the weathering–precipitation system: the kinetic model represents acid-promoted dissolution of wollastonite, whereas the calcimetry-based proxy measures net carbonate accumulation, the product of Ca2+ release via dissolution and subsequent precipitation of carbonates. Under higher pH, carbonate precipitation is favored, while low pH enhances dissolution but limits carbonate storage. The use of absolute ΔCCE values further shifts the proxy toward reflecting overall carbonate transformation intensity rather than net dissolution. In Figure 4c, the moderate negative correlation between the two indicators reinforces that phases of rapid dissolution may not coincide with periods of maximum carbonate storage, since carbonate formation also depends on factors such as carbonate saturation state, hydrology, and pCO2 that promote precipitation and limit re-dissolution. Sensitivity checks separating positive and negative CCE changes, harmonizing Δt across intervals, and accounting for declines in reactive mass and surface area confirm that these patterns are robust and that both indicators should be interpreted together, rather than interchangeably, in MRV frameworks for Enhanced Rock Weathering. Also, the distribution of points around the x = y line in Figure 4c highlights that modeled dissolution rates (log WR) and field-derived carbonate accumulation rates (log (ΣΔCCE/Δt)) respond differently to environmental conditions. While the kinetic model is primarily driven by pH and temperature, the empirical proxy also integrates hydrological effects, carbonate saturation state, and potential losses through leaching or re-dissolution. This divergence means that neither metric can serve as a direct substitute for the other in MRV frameworks for Enhanced Rock Weathering. Instead, systematic offsets and deviations from the 1:1 line underscore the need to calibrate model predictions with field observations to capture the full range of processes influencing CO2 drawdown.
3.3. The Rain Effect
The Table 7 presents log-transformed carbonate weathering fluxes, separated into dissolution (ΔCCE/Δt) dissolution) and formation (ΔCCE/Δt) formation) components, alongside cumulative precipitation in mm over the 7, 10, and 14 days prior to each sampling date for ten field plots monitored between June and October 2024. Fluxes were calculated by dividing the change in carbonate content (ΔCCE) between consecutive sampling dates by the number of days in the interval (Δt). Positive ΔCCE values were assigned to the formation column, while negative values were assigned to the dissolution column. This separation allows the dataset to distinguish between episodes of carbonate accumulation and carbonate loss. Zero values indicate no measurable flux in that direction for the given sampling interval. The data show that carbonate formation events are episodic and often coincide with periods of reduced dissolution, while dissolution peaks tend to occur independently of significant carbonate accumulation. Precipitation values vary considerably across sampling dates, with wetter periods (e.g., July) generally associated with higher carbonate flux magnitudes, suggesting that short-term moisture availability may influence both dissolution and precipitation processes in the soil. The full dataset is available in Table S5 (Supplementary Material).
The descriptive statistics for carbonate formation and dissolution fluxes (expressed as log(ΔCCE/Δt)) reveal a strongly skewed and truncated distribution (See Table 8). For both processes, the median is 0, indicating that in at least 50% of the observations, no detectable flux occurred in that direction. This suggests periods of carbon stability, where either no significant accumulation or loss of inorganic carbon was measured. The minimum values reach −8.235 for dissolution and −8.697 for formation, reflecting substantial fluxes when they do occur. However, the maximum value for both is 0, consistent with the mathematical transformation applied, where zero fluxes are retained and only positive ΔCCE/Δt values are log-transformed (resulting in negative log values).The means of −3.44 for dissolution and −3.74 for formation reflect the average magnitude of these processes, but the high standard deviations (both ~3.63–3.65) highlight significant variability across plots and sampling periods. This variability likely reflects micro-environmental differences (e.g., soil pH, moisture, mineral reactivity) and transient conditions such as rainfall. The absence of missing values (null = 0 for both variables) supports the reliability of subsequent correlation or regression analyses. Overall, these patterns suggest that carbonate dynamics in the field are intermittent, spatially variable, and possibly driven by short-term environmental fluctuations, particularly rainfall in the days preceding sampling.
The correlation analysis (Table 9) reveals a contrasting relationship between short-term rainfall and the direction of carbonate fluxes in soil. For carbonate formation (log(ΔCCE/Δt) formation), results show a moderate to strong positive correlation with cumulative rainfall over the previous 7 and 10 days (Pearson’s r = 0.45–0.46; Spearman’s ρ = 0.54; Kendall’s τ = 0.43), suggesting that increased precipitation promotes carbonate accumulation. This may be attributed to enhanced mineral dissolution and ionic transport, which facilitate carbonate precipitation in wetter conditions. The correlation is slightly weaker for the 14-day window (r = 0.34), indicating that recent rainfall exerts a stronger influence on carbonate formation than older precipitation events. In contrast, carbonate dissolution (log(ΔCCE/Δt) dissolution) shows no meaningful correlation with rainfall at any time window, with Pearson’s r values ranging from –0.11 to –0.05 and non-significant rank correlations. This suggests that dissolution may be governed by other localized factors, such as pH variability, microsite hydrology, or biological activity, rather than being directly driven by short-term moisture availability. Overall, these results highlight the asymmetry in weathering responses to rainfall: while formation of soil carbonates is sensitive to precipitation patterns, dissolution appears decoupled from them.
Figure 5.
Effect of short-term rainfall on carbonate weathering fluxes. Box-plots (with median trend-lines) showing how carbonate-formation (top row) and carbonate-dissolution (bottom row) fluxes [log (ΔCCE / Δt)] vary across six precipitation classes (0–5, 5–10, 10–15, 15–20, 20–25, 25–30, > 30 mm) calculated for the preceding 7-, 10- and 14-day windows.
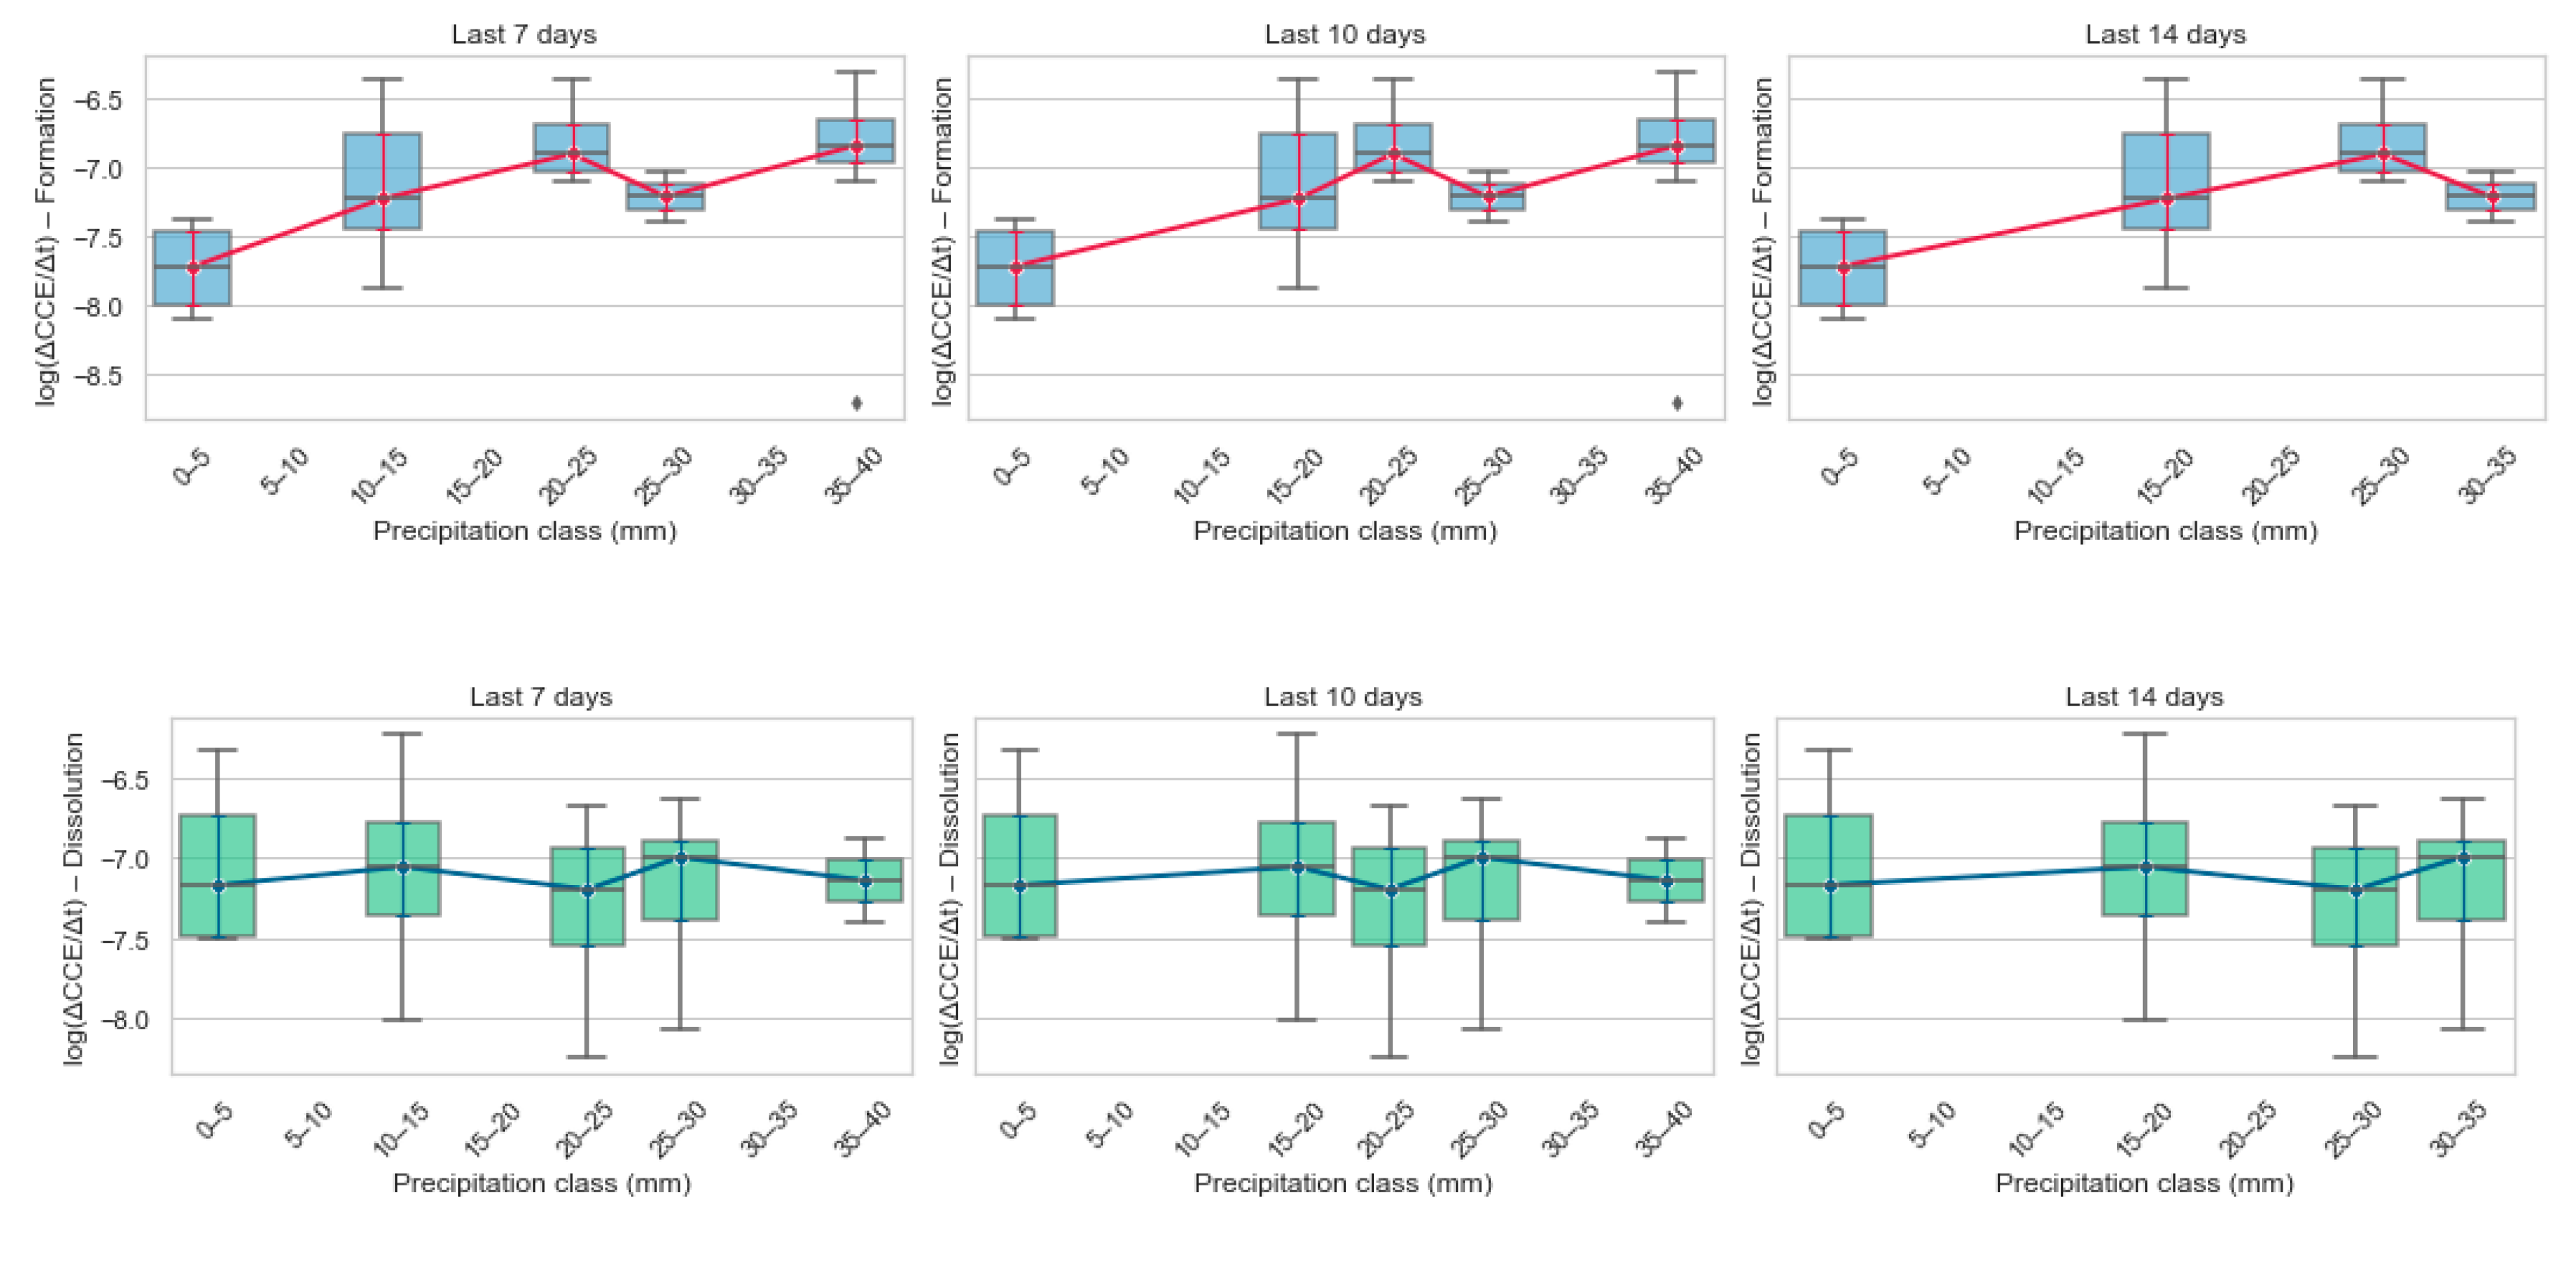
Across 5a-c panels the red-median trend line climbs steadily from the driest bin (0–5 mm) to intermediate rain classes (≈ 25–30 mm), showing that carbonate-formation flux increases as short-term rainfall rises. The effect is clearest in the 7- and 10-day windows, where the median flux strengthens by ~0.6 log units between the lowest and mid-rain bins. Beyond ~30 mm the curve flattens, suggesting that once a threshold of soil moisture is reached additional rainfall adds little further benefit, perhaps because pores become saturated and diffusion-limited, or because leaching starts to remove Ca2+/HCO3− as fast as they are produced. Box widths narrow in the mid-rain classes (15–30 mm), indicating lower plot-to-plot variability under moderate, “just-right” moisture. Variability broadens again in the driest and wettest bins, implying that both water stress and water excess generate heterogeneous micro-environments in which some plots weather efficiently while others do not. A handful of low-flux outliers (< –8 log units) occur only at the rainfall extremes, reinforcing this interpretation. Comparing windows, the 7- and 10-day plots are almost identical, whereas the 14-day window dampens the slope and raises the inter-quartile ranges. This points to recent (1–10 day) rainfall as the dominant driver of carbonate formation, with older precipitation events contributing progressively less to the short-term weathering signal. In sum, the figure supports a “Balanced threshold” view of soil moisture for enhanced weathering: too little rain, and mineral surfaces remain dry; too much, and carbonate gains are diluted or flushed. A running 7- to 10-day rainfall integral best captures the positive, yet saturating, response of carbonate formation flux to precipitation.
In contrast, the accompanying boxplots for log(ΔCCE/Δt) dissolution show a nearly flat median across all rain classes and time windows, with only a slight tendency toward less negative (i.e., weaker) dissolution at the highest rainfall bins. The wide, overlapping boxes and the rank-based correlations near zero confirm that short-term moisture is a poor predictor of carbonate loss. Instead, dissolution appears to be governed by plot-specific factors such as soil CO2 build-up, redox pulses, or hydraulic flushing events that are not captured by simple rainfall totals. Although the net impact on weathering budgets is minor relative to formation, tracking this weak, decoupled signal is still useful for closing the mass balance and flagging occasional outliers where intense storms or waterlogged conditions may transiently remobilize previously sequestered carbonates.
4. Conclusions
This study demonstrates that soil calcimetry can resolve short-term carbonate fluxes in wollastonite-amended croplands and capture rainfall-modulated weathering dynamics under real field conditions. Over a single growing season (May–October 2024), wollastonite application produced significant and sustained increases in soil pH in both Milli-Q and CaCl2 extracts (p < 0.001), while calcium carbonate equivalent (CCE) values were highly variable and showed no consistent seasonal trend, reflecting the heterogeneous nature of carbonate formation and redistribution in agricultural soils.
The calcimetry-derived proxy for weathering, log (Σ ΔCCE/Δt), correlated positively with pH (r ≈ 0.65) and captures net carbonate accumulation, whereas the kinetic dissolution model (log WR) correlated strongly and negatively with pH (≈ −1), reflecting acid-promoted dissolution. These contrasting relationships confirm that the two metrics describe complementary stages of the weathering–precipitation system and should be interpreted jointly in MRV frameworks. This distinction is critical: while log WR describes the theoretical capacity for weathering under given chemical conditions, log (Σ ΔCCE/Δt) quantifies the actual, in-situ CO2 stored as carbonates, integrating the combined effects of dissolution, transport, and precipitation. By coupling both metrics, MRV frameworks can simultaneously track the driving processes and the realized sequestration, closing a fundamental gap between modeled potential and field-measured outcomes. This joint interpretation significantly strengthens the credibility, transparency, and accuracy of carbon accounting in ERW projects.
Rainfall emerged as a key short-term modulator of carbonate formation, with cumulative precipitation over the preceding 7–10 days showing a saturating positive effect on formation flux, while dissolution was largely decoupled from rainfall and likely controlled by microsite-specific factors such as CO2 production, redox dynamics, and localized hydrology. Operationally, calcimetry offers a low-cost, direct measurement of the sequestration product, enabling flux estimates that are immediately usable for carbon crediting when paired with conservative accounting. The divergence between modeled dissolution capacity and measured carbonate storage quantifies the influence of environmental conditions, transport, saturation, and re-dissolution processes that kinetic models alone cannot capture.
These findings suggest a dynamic interplay between silicate dissolution and carbonate transformation that is modulated by rainfall. Under low to moderate rainfall, silicate weathering may proceed while carbonate formation is limited, potentially due to re-precipitation during drying or downward transport beyond the sampled layer. In contrast, high rainfall can enhance both silicate and carbonate dissolution, leading to net losses of pedogenic carbonates despite active weathering. This asymmetry underscores the need to interpret calcimetry fluxes in the context of hydrological conditions, as carbonate accumulation does not always coincide with peak weathering activity.
While this study provides a field-operational workflow for normalizing repeated CCE measurements to surface-area-based fluxes, several limitations constrain its broader applicability. These include the single-season duration, shallow sampling depth, monthly resolution, and the use of absolute ΔCCE values in some analyses, which emphasize transformation intensity but may obscure net losses. Additionally, the shallow sampling depth (20 cm) may not fully capture vertical migration or leaching of carbonates, particularly in clay-rich soils with poor drainage. Future studies should incorporate deeper profile sampling and spatially distributed measurements to better resolve microsite variability and carbonate translocation. Moreover, while calcimetry shows promise as a field-accessible proxy for carbonate fluxes, its integration into full MRV frameworks will require multi-season validation, deeper profile monitoring, and complementary methods to resolve leaching and re-dissolution dynamics. Addressing these gaps will be essential to ensure that calcimetry-based estimates of CO2 sequestration reflect the full complexity of weathering systems under variable field conditions.
Future work should extend monitoring across multiple years and depths, integrate hydrological and isotopic measurements to close the carbon balance, and refine rainfall-driven response functions through higher-frequency sampling around storm events. While calcimetry provides a valuable proxy for weathering fluxes, its integration into MRV frameworks should be complemented by other lines of evidence to ensure robust attribution and quantification of CO2 removal. This includes hydrological modeling, isotopic analysis, and conservative assumptions about carbonate stability. Overall, these findings support the use of calcimetry as a scalable, credible MRV backbone for ERW in temperate row-crop systems, capable of grounding kinetic predictions in real-world soil and weather conditions.
Supplementary Materials
The following supporting information can be downloaded at the website of this paper posted on Preprints.org. Table S1. Temporal evolution of pH (Milli-Q) across 10 field plots (May–Oct 2024). Table S2. Temporal evolution of pH (0.01 M CaCl2) across 10 field plots (May–Oct 2024). Table S3. Inorganic carbonate content (CCE, g/kg) across 10 field plots (May–Oct 2024). Table S5. Log-transformed carbonate fluxes and recent rainfall (full dataset provided as CSV). Text S1. Procedure for calculation, modeling, and rainfall analysis. Table S1. Temporal evolution of pH (Milli-Q) across 10 field plots (May–Oct 2024). Table S2. Temporal evolution of pH (0.01 M CaCl2) across 10 field plots (May–Oct 2024). Table S3. Inorganic carbonate content (CCE, g/kg) across 10 field plots (May–Oct 2024). Table S5. Log-transformed carbonate weathering fluxes (formation/dissolution) and short-term rainfall. Text S1. Procedure for Calculation, Modeling, and Rainfall Effect Analysis.
Author Contributions
Conceptualization, F.S.M.A. and R.S..; methodology, F.S.M.A.; software, F.S.M.A..; validation, R.S.; formal analysis, R.S.; investigation, F.S.M.A.; data curation, F.S.M.A.; writing—original draft preparation, F.S.M.A.; writing—review and editing, F.S.M.A.; visualization, F.S.M.A.; supervision, R.S.; project administration, R.S.; funding acquisition, R.S. All authors have read and agreed to the published version of the manuscript.
Funding
This research was funded by the 2024 Advancing Research Impact Fund (ARIF) Entrepreneurial Research Grant, which is supported by the Canada First Research Excellence Fund, through grant number FFTARI-E-2024-3.
Data Availability Statement
Dataset available on request from the authors.
Conflicts of Interest
The authors declare no conflicts of interest.
References
- Intergovernmental Panel On Climate Change (Ipcc) Climate Change 2021—The Physical Science Basis: Working Group I Contribution to the Sixth Assessment Report of the Intergovernmental Panel on Climate Change; 1st ed.; Cambridge University Press, 2023; ISBN 978-1-009-15789-6.
- Beerling, D.J.; Epihov, D.Z.; Kantola, I.B.; Masters, M.D.; Reershemius, T.; Planavsky, N.J.; Reinhard, C.T.; Jordan, J.S.; Thorne, S.J.; Weber, J.; et al. Enhanced Weathering in the US Corn Belt Delivers Carbon Removal with Agronomic Benefits. Proc. Natl. Acad. Sci. 2024, 121, e2319436121, doi:10.1073/pnas.2319436121.
- Deng, H.; Sonnenthal, E.; Arora, B.; Breunig, H.; Brodie, E.; Kleber, M.; Spycher, N.; Nico, P. The Environmental Controls on Efficiency of Enhanced Rock Weathering in Soils. Sci. Rep. 2023, 13, 9765, doi:10.1038/s41598-023-36113-4.
- Ten Berge, H.F.M.; Van Der Meer, H.G.; Steenhuizen, J.W.; Goedhart, P.W.; Knops, P.; Verhagen, J. Olivine Weathering in Soil, and Its Effects on Growth and Nutrient Uptake in Ryegrass (Lolium Perenne L.): A Pot Experiment. PLoS ONE 2012, 7, e42098, doi:10.1371/journal.pone.0042098.
- Hartmann, J.; West, A.J.; Renforth, P.; Köhler, P.; De La Rocha, C.L.; Wolf-Gladrow, D.A.; Dürr, H.H.; Scheffran, J. Enhanced Chemical Weathering as a Geoengineering Strategy to Reduce Atmospheric Carbon Dioxide, Supply Nutrients, and Mitigate Ocean Acidification. Rev. Geophys. 2013, 51, 113–149, doi:10.1002/rog.20004.
- Taylor, L.L.; Quirk, J.; Thorley, R.M.S.; Kharecha, P.A.; Hansen, J.; Ridgwell, A.; Lomas, M.R.; Banwart, S.A.; Beerling, D.J. Enhanced Weathering Strategies for Stabilizing Climate and Averting Ocean Acidification. Nat. Clim. Change 2016, 6, 402–406, doi:10.1038/nclimate2882.
- Haque, F.; Santos, R.M.; Chiang, Y.W. Optimizing Inorganic Carbon Sequestration and Crop Yield With Wollastonite Soil Amendment in a Microplot Study. Front. Plant Sci. 2020, 11, 1012, doi:10.3389/fpls.2020.01012.
- Su, C.; Kang, R.; Huang, W.; Wang, A.; Li, X.; Huang, K.; Zhou, Q.; Fang, Y. CO2 Removal with Enhanced Wollastonite Weathering in Acidic and Calcareous Soils. Soil Ecol. Lett. 2025, 7, 240273, doi:10.1007/s42832-024-0273-z.
- Khalidy, R.; Haque, F.; Chiang, Y.W.; Santos, R.M. Monitoring Pedogenic Inorganic Carbon Accumulation Due to Weathering of Amended Silicate Minerals in Agricultural Soils. J. Vis. Exp. 2021, 61996, doi:10.3791/61996.
- Swoboda, P.; Larkin, C.S.; Rodrigues, M.M.; Kang, J.; Santoro, M.; Clarkson, M.O.; Chiapini, M. Agronomic Co-Benefits of Enhanced Rock Weathering (ERW) with Basalt Applied to Sugarcane Grown on Acidic Soil in Brazil 2025.
- Holzer, I.O.; Nocco, M.A.; Houlton, B.Z. Direct Evidence for Atmospheric Carbon Dioxide Removal via Enhanced Weathering in Cropland Soil. Environ. Res. Commun. 2023, 5, 101004, doi:10.1088/2515-7620/acfd89.
- Call for Proposals: Join Milkywire’s Climate Transformation Fund 2025 Available online: https://www.milkywire.com/impact-funds/climate-transformation-fund/call-for-proposals/open-call-2025 (accessed on 29 August 2025).
- Measuring Carbon Removal: Inside UNDO’s Sentinel Sites. UNDO Carbon.
- Launching the Community Enhanced Rock Weathering Quantification Standard Process Available online: https://cascadeclimate.org/blog/introducing-the-cqs (accessed on 30 August 2025).
- Puro.Earth to Revise Enhanced Rock Weathering Methodology | Website (Puro.Earth) Available online: https://puro.earth/our-blog/puroearth-to-revise-enhanced-rock-weathering-methodology (accessed on 29 August 2025).
- Enhanced Weathering in Agriculture — Isometric Available online: https://registry.isometric.com/protocol/enhanced-weathering-agriculture (accessed on 30 August 2025).
- Hasemer, H.; Borevitz, J.; Buss, W. Measuring Enhanced Weathering: Inorganic Carbon-Based Approaches May Be Required to Complement Cation-Based Approaches. Front. Clim. 2024, 6, 1352825, doi:10.3389/fclim.2024.1352825.
- Renforth, P.; Pogge Von Strandmann, P.A.E.; Henderson, G.M. The Dissolution of Olivine Added to Soil: Implications for Enhanced Weathering. Appl. Geochem. 2015, 61, 109–118, doi:10.1016/j.apgeochem.2015.05.016.
- Reershemius, T.; Kelland, M.E.; Jordan, J.S.; Davis, I.R.; D’Ascanio, R.; Kalderon-Asael, B.; Asael, D.; Suhrhoff, T.J.; Epihov, D.Z.; Beerling, D.J.; et al. Initial Validation of a Soil-Based Mass-Balance Approach for Empirical Monitoring of Enhanced Rock Weathering Rates. Environ. Sci. Technol. 2023, 57, 19497–19507, doi:10.1021/acs.est.3c03609.
- Dietzen, C.; Harrison, R.; Michelsen-Correa, S. Effectiveness of Enhanced Mineral Weathering as a Carbon Sequestration Tool and Alternative to Agricultural Lime: An Incubation Experiment. Int. J. Greenh. Gas Control 2018, 74, 251–258, doi:10.1016/j.ijggc.2018.05.007.
- Andrews, M.G.; Taylor, L.L. Combating Climate Change Through Enhanced Weathering of Agricultural Soils. Elements 2019, 15, 253–258, doi:10.2138/gselements.15.4.253.
- Silva, J.M.P.; Bomio, M.R.D.; Motta, F.V.; Santos, R.M. Assessment of Calcimetry as a Reliable Method for Monitoring Soil Inorganic Carbon Stocks. ACS Agric. Sci. Technol. 2024, 4, 781–790, doi:10.1021/acsagscitech.4c00088.
- Beerling, D.J.; Kantzas, E.P.; Lomas, M.R.; Wade, P.; Eufrasio, R.M.; Renforth, P.; Sarkar, B.; Andrews, M.G.; James, R.H.; Pearce, C.R.; et al. Potential for Large-Scale CO2 Removal via Enhanced Rock Weathering with Croplands. Nature 2020, 583, 242–248, doi:10.1038/s41586-020-2448-9.
- Amann, T.; Hartmann, J.; Struyf, E.; De Oliveira Garcia, W.; Fischer, E.K.; Janssens, I.; Meire, P.; Schoelynck, J. Enhanced Weathering and Related Element Fluxes—a Cropland Mesocosm Approach. Biogeosciences 2020, 17, 103–119, doi:10.5194/bg-17-103-2020.
- Kelland, M.E.; Wade, P.W.; Lewis, A.L.; Taylor, L.L.; Sarkar, B.; Andrews, M.G.; Lomas, M.R.; Cotton, T.E.A.; Kemp, S.J.; James, R.H.; et al. Increased Yield and CO2 Sequestration Potential with the C4 Cereal Sorghum Bicolor Cultivated in Basaltic Rock Dust-amended Agricultural Soil. Glob. Change Biol. 2020, 26, 3658–3676, doi:10.1111/gcb.15089.
- Iff, N.; Renforth, P.; Pogge Von Strandmann, P.A.E. The Dissolution of Olivine Added to Soil at 32 °C: The Fate of Weathering Products and Its Implications for Enhanced Weathering at Different Temperatures. Front. Clim. 2024, 6, 1252210, doi:10.3389/fclim.2024.1252210.
- Khalidy, R.; Haque, F.; Chiang, Y.W.; Santos, R.M. Tracking Pedogenic Carbonate Formation and Alkalinity Migration in Agricultural Soils Amended with Crushed Wollastonite Ore—Evidence from Field Trials in Southwestern Ontario. Geoderma Reg. 2025, 40, e00918, doi:10.1016/j.geodrs.2025.e00918.
- Haque, F.; Santos, R.M.; Dutta, A.; Thimmanagari, M.; Chiang, Y.W. Co-Benefits of Wollastonite Weathering in Agriculture: CO2 Sequestration and Promoted Plant Growth. ACS Omega 2019, 4, 1425–1433, doi:10.1021/acsomega.8b02477.
- Canada, A. and A.-F. The Soils of the Regional Municipality of Niagara (Volume 1 and 2) Available online: https://sis.agr.gc.ca/cansis/publications/surveys/on/on60/index.html (accessed on 29 August 2025).
- Manning, D.A.C. Biological Enhancement of Soil Carbonate Precipitation: Passive Removal of Atmospheric CO2. Mineral. Mag. 2008, 72, 639–649, doi:10.1180/minmag.2008.072.2.639.
- ISO 10390:2005 Available online: https://www.iso.org/standard/40879.html (accessed on 29 August 2025).
- ISO 11464:2006 Available online: https://www.iso.org/standard/37718.html (accessed on 29 August 2025).
- ISO 11465:1993 Available online: https://www.iso.org/standard/20886.html (accessed on 29 August 2025).
- ISO 10693:1995 Available online: https://www.iso.org/standard/18781.html (accessed on 29 August 2025).
- Chen, A.; Chen, Z.; Qiu, Z.; Lin, B.-L. Experimentally-Calibrated Estimation of CO2 Removal Potentials of Enhanced Weathering. Sci. Total Environ. 2023, 900, 165766, doi:10.1016/j.scitotenv.2023.165766.
- A Compilation of Rate Parameters of Water-Mineral Interaction Kinetics for Application to Geochemical Modeling Available online: https://pubs.usgs.gov/of/2004/1068/ (accessed on 29 August 2025).
- Huijgen, W.J.J.; Witkamp, G.-J.; Comans, R.N.J. Mechanisms of Aqueous Wollastonite Carbonation as a Possible CO2 Sequestration Process. Chem. Eng. Sci. 2006, 61, 4242–4251, doi:10.1016/j.ces.2006.01.048.
- Cipolla, G.; Calabrese, S.; Noto, L.V.; Porporato, A. The Role of Hydrology on Enhanced Weathering for Carbon Sequestration II. From Hydroclimatic Scenarios to Carbon-Sequestration Efficiencies. Adv. Water Resour. 2021, 154, 103949, doi:10.1016/j.advwatres.2021.103949.
- White, A.F.; Brantley, S.L. The Effect of Time on the Weathering of Silicate Minerals: Why Do Weathering Rates Differ in the Laboratory and Field? Chem. Geol. 2003, 202, 479–506, doi:10.1016/j.chemgeo.2003.03.001.
- Schuiling, R.D.; Krijgsman, P. Enhanced Weathering: An Effective and Cheap Tool to Sequester Co2. Clim. Change 2006, 74, 349–354, doi:10.1007/s10584-005-3485-y.
- Cho, Y.; Driscoll, C.T.; Blum, J.D. The Effects of a Whole-Watershed Calcium Addition on the Chemistry of Stream Storm Events at the Hubbard Brook Experimental Forest in NH, USA. Sci. Total Environ. 2009, 407, 5392–5401, doi:10.1016/j.scitotenv.2009.06.030.
- Stewart, A.J.; Halabisky, M.; Babcock, C.; Butman, D.E.; D’Amore, D.V.; Moskal, L.M. Revealing the Hidden Carbon in Forested Wetland Soils. Nat. Commun. 2024, 15, 726, doi:10.1038/s41467-024-44888-x.
- Li, H.; Tang, B.; Lehmann, A.; Rongstock, R.; Zhu, Y.; Rillig, M.C. The Dissimilarity between Multiple Management Practices Drives the Impact on Soil Properties and Functions. Soil Ecol. Lett. 2025, 7, 240278, doi:10.1007/s42832-024-0278-7.
- Schön, W.; Mittermayr, F.; Leis, A.; Mischak, I.; Dietzel, M. Temporal and Spatial Variability of Chemical and Isotopic Composition of Soil Solutions from Cambisols—Field Study and Experiments. Sci. Total Environ. 2016, 572, 1066–1079, doi:10.1016/j.scitotenv.2016.08.015.
- Larkin, C.S.; Andrews, M.G.; Pearce, C.R.; Yeong, K.L.; Beerling, D.J.; Bellamy, J.; Benedick, S.; Freckleton, R.P.; Goring-Harford, H.; Sadekar, S.; et al. Quantification of CO2 Removal in a Large-Scale Enhanced Weathering Field Trial on an Oil Palm Plantation in Sabah, Malaysia. Front. Clim. 2022, 4, 959229, doi:10.3389/fclim.2022.959229.
- Kaufhold, S.; Emmerich, K.; Dohrmann, R.; Steudel, A.; Ufer, K. Comparison of Methods for Distinguishing Sodium Carbonate Activated from Natural Sodium Bentonites. Appl. Clay Sci. 2013, 86, 23–37, doi:10.1016/j.clay.2013.09.014.
- Schaffer, Z.R.; Rausis, K.; Power, I.M.; Paulo, C. Enhanced Weathering of Kimberlite Residues in a Field Experiment: Implications for Carbon Removal Quantification and Mine Waste Valorization. Front. Clim. 2025, 7, 1592626, doi:10.3389/fclim.2025.1592626.
Figure 2.
Workflow for field-scale validation of wollastonite-induced weathering rates.


Table 1.
Summary of average soil pH and calcium carbonate equivalent (CCE) over time and associated statistical tests.
Table 1.
Summary of average soil pH and calcium carbonate equivalent (CCE) over time and associated statistical tests.
| Parameter | Mean ± SD | Min | Max | One-way ANOVA (p-value) | Pearson r (vs CCE) | Pearson p-value | Wilcoxon (May vs Oct) |
| pH (Milli-Q) | 6.169 ± 0.147 | 5.925 | 6.446 | sig(p<0.001) | 0.420 | sig(p<0.001) | |
| pH (CaCl2) | 5.726 ± 0.219 | 5.427 | 6.170 | sig(p<0.001) | 0.470 | sig(p<0.001) | |
| CCE (g/kg) | 1.321 ± 0.788 | 0.365 | 2.636 | not sig (p=0.201) | not sig (p=1) |
Table 2.
Monthly changes in soil inorganic carbon (ΔCCE, g/kg) and cumulative sum over time across 10 field plots.
Table 2.
Monthly changes in soil inorganic carbon (ΔCCE, g/kg) and cumulative sum over time across 10 field plots.
| ΔCCE | |ΔCCE| | Σ |ΔCCE| | Δt(s) | |||||||||||||
| Plot | t1 | t2 | t3 | t4 | t5 | t1 | t2 | t3 | t4 | t5 | t1 | t2 | t3 | t4 | t5 | |
| 1 | 0.438 | -0.321 | 0.782 | -1.005 | 0.352 | 0.438 | 0.321 | 0.782 | 1.005 | 0.352 | 0.438 | 0.759 | 1.541 | 2.547 | 2.899 | |
| 2 | -2.491 | 1.184 | 0.949 | 4.030 | -3.935 | 2.491 | 1.184 | 0.949 | 4.030 | 3.935 | 2.491 | 3.675 | 4.623 | 8.653 | 12.588 | 3369600 |
| 3 | -1.540 | 0.644 | 1.623 | -0.677 | 0.144 | 1.540 | 0.644 | 1.623 | 0.677 | 0.144 | 1.540 | 2.184 | 3.807 | 4.484 | 4.628 | 2505600 |
| 4 | -1.298 | 1.571 | 4.327 | -5.564 | 0.185 | 1.298 | 1.571 | 4.327 | 5.564 | 0.185 | 1.298 | 2.869 | 7.196 | 12.760 | 12.945 | 3110400 |
| 5 | -0.403 | 3.950 | -2.063 | 2.320 | -1.161 | 0.403 | 3.950 | 2.063 | 2.320 | 1.161 | 0.403 | 4.353 | 6.415 | 8.735 | 9.896 | 2937600 |
| 6 | -0.463 | 2.589 | -1.338 | 0.287 | 0.342 | 0.463 | 2.589 | 1.338 | 0.287 | 0.342 | 0.463 | 3.052 | 4.389 | 4.676 | 5.018 | 2678400 |
| 7 | -0.974 | 1.118 | -0.547 | -0.093 | -0.287 | 0.974 | 1.118 | 0.547 | 0.093 | 0.287 | 0.974 | 2.092 | 2.639 | 2.732 | 3.019 | |
| 8 | -0.093 | 0.016 | -0.228 | 0.539 | -0.267 | 0.093 | 0.016 | 0.228 | 0.539 | 0.267 | 0.093 | 0.109 | 0.338 | 0.876 | 1.143 | |
| 9 | 0.990 | -1.042 | -0.058 | 0.124 | 0.071 | 0.990 | 1.042 | 0.058 | 0.124 | 0.071 | 0.990 | 2.032 | 2.089 | 2.214 | 2.284 | |
| 10 | -1.202 | 0.946 | -0.727 | 0.568 | 0.068 | 1.202 | 0.946 | 0.727 | 0.568 | 0.068 | 1.202 | 2.148 | 2.875 | 3.443 | 3.510 | |
Table 3.
Surface-area-normalized weathering flux (ΣΔCCE/Δt).
| Σ ΔCCE/Δt (g/kg/s) | Σ ΔCCE/Δt (mol/m2/s) | |||||||||
| Plot | t1 | t2 | t3 | t4 | t5 | t1 | t2 | t3 | t4 | t5 |
| 1 | 1.30E-07 | 3.03E-07 | 4.96E-07 | 8.67E-07 | 1.08E-06 | 4.08E-08 | 9.51E-08 | 1.56E-07 | 2.72E-07 | 3.40E-07 |
| 2 | 7.39E-07 | 1.47E-06 | 1.49E-06 | 2.95E-06 | 4.70E-06 | 2.32E-07 | 4.60E-07 | 4.67E-07 | 9.25E-07 | 1.48E-06 |
| 3 | 4.57E-07 | 8.72E-07 | 1.22E-06 | 1.53E-06 | 1.73E-06 | 1.43E-07 | 2.74E-07 | 3.84E-07 | 4.79E-07 | 5.42E-07 |
| 4 | 3.85E-07 | 1.15E-06 | 2.31E-06 | 4.34E-06 | 4.83E-06 | 1.21E-07 | 3.59E-07 | 7.26E-07 | 1.36E-06 | 1.52E-06 |
| 5 | 1.19E-07 | 1.74E-06 | 2.06E-06 | 2.97E-06 | 3.69E-06 | 3.75E-08 | 5.45E-07 | 6.47E-07 | 9.33E-07 | 1.16E-06 |
| 6 | 1.37E-07 | 1.22E-06 | 1.41E-06 | 1.59E-06 | 1.87E-06 | 4.31E-08 | 3.82E-07 | 4.43E-07 | 5.00E-07 | 5.88E-07 |
| 7 | 2.89E-07 | 8.35E-07 | 8.48E-07 | 9.30E-07 | 1.13E-06 | 9.08E-08 | 2.62E-07 | 2.66E-07 | 2.92E-07 | 3.54E-07 |
| 8 | 2.77E-08 | 4.37E-08 | 1.09E-07 | 2.98E-07 | 4.27E-07 | 8.70E-09 | 1.37E-08 | 3.41E-08 | 9.37E-08 | 1.34E-07 |
| 9 | 2.94E-07 | 8.11E-07 | 6.72E-07 | 7.54E-07 | 8.53E-07 | 9.22E-08 | 2.55E-07 | 2.11E-07 | 2.37E-07 | 2.68E-07 |
| 10 | 3.57E-07 | 8.57E-07 | 9.24E-07 | 1.17E-06 | 1.31E-06 | 1.12E-07 | 2.69E-07 | 2.90E-07 | 3.68E-07 | 4.11E-07 |
Note on weathering flux calculation: The empirical weathering rate in mol m−2 s−1 was estimated using Equation (5), where: SSA = specific surface area of wollastonite = 0.01146 m2/g; Mass ₍wollastonite₎ = applied mass per area = 718 g/m2; ρ₍soil₎ = soil bulk density = 1500 kg/m3; Depth = soil sampling depth = 0.2 m, M ₍wollastonite₎ = molar mass of wollastonite = 116.15 g/mol; Δ[CaCO3]/Δt = calcimetry-based carbonate accumulation rate in g/kg/s.
Table 4.
Log-transformed surface-area-normalized weathering flux [log10(ΣΔCCE/Δt)] across five intervals.
Table 4.
Log-transformed surface-area-normalized weathering flux [log10(ΣΔCCE/Δt)] across five intervals.
|
log (Σ ΔCCE/Δt) |
|||||
| Plot | t1 | t2 | t3 | t4 | t5 |
| 1 | -7.390 | -7.022 | -6.808 | -6.565 | -6.469 |
| 2 | -6.634 | -6.337 | -6.331 | -6.034 | -5.831 |
| 3 | -6.843 | -6.563 | -6.415 | -6.320 | -6.266 |
| 4 | -6.917 | -6.444 | -6.139 | -5.865 | -5.819 |
| 5 | -7.426 | -6.263 | -6.189 | -6.030 | -5.936 |
| 6 | -7.365 | -6.418 | -6.354 | -6.301 | -6.231 |
| 7 | -7.042 | -6.582 | -6.575 | -6.535 | -6.451 |
| 8 | -8.061 | -7.863 | -7.467 | -7.028 | -6.873 |
| 9 | -7.035 | -6.594 | -6.676 | -6.626 | -6.572 |
| 10 | -6.951 | -6.570 | -6.537 | -6.434 | -6.386 |
Table 5.
Dataset used to compare measured soil pH, the empirical weathering rate of wollastonite derived from Palandri & Kharaka’s kinetic model (log WR), and the proxy weathering rate measured via calcimetry (log (ΣΔCCE/Δt)).
Table 5.
Dataset used to compare measured soil pH, the empirical weathering rate of wollastonite derived from Palandri & Kharaka’s kinetic model (log WR), and the proxy weathering rate measured via calcimetry (log (ΣΔCCE/Δt)).
|
WR (mol/m2/s) |
Log WR | A (mol·m−2·s−1) | Log A |
E kJ·mol−1 |
nH (dimensionless) |
pH | pH date | plot |
Log K (mol·m−2·s−1) |
T(K) | Log (Σ ΔCCE/Δt) |
| 3.28E-08 | -7.48 | 67.62 | 4.21 | 54.7 | 0.4 | 5.287 | t1 | 1 | -5.37 | 298 | -7.390 |
| 4.87E-08 | -7.31 | 67.62 | 4.21 | 54.7 | 0.4 | 4.857 | t1 | 2 | -5.37 | 298 | -6.634 |
| 4.99E-08 | -7.30 | 67.62 | 4.21 | 54.7 | 0.4 | 4.830 | t1 | 3 | -5.37 | 298 | -6.843 |
Table 6.
Statistical relationships among modeled weathering rates (log WR), an empirical weathering proxy derived from soil calcimetry (log (Σ ΔCCE/Δt)), and measured soil pH.
Table 6.
Statistical relationships among modeled weathering rates (log WR), an empirical weathering proxy derived from soil calcimetry (log (Σ ΔCCE/Δt)), and measured soil pH.
| Comparison | Pearson’s r | Spearman ρ | Kendall’s τ (tau) | Regression Slope | R2 |
| log (Σ ΔCCE/Δt) vs pH | 0.652 | 0.639 | 0.471 | 0.611 | 0.425 |
| Log WR vs pH | -0.9998 | -1 | -1 | -0.4 | 0.9998 |
| log (Σ ΔCCE/Δt) vs log WR | -0.651 | -0.641 | -0.473 |
Table 7.
log-transformed carbonate weathering fluxes (log(ΔCCE/Δt)) for both dissolution and formation processes.
Table 7.
log-transformed carbonate weathering fluxes (log(ΔCCE/Δt)) for both dissolution and formation processes.
| pH date | plot | log(ΔCCE/Δt) dissolution | log(ΔCCE/Δt) formation |
precip_d7 (mm) |
precip_d10 (mm) |
precip_d14 (mm) |
| 2024-06-22 | 9 | 0.000 | -7.035 | 27.4 | 27.4 | 33 |
| 2024-06-22 | 10 | -6.951 | 0 | 27.4 | 27.4 | 33 |
| 2024-07-21 | 1 | -7.395 | -6.829 | 36.6 | 36.6 | 80 |
| 2024-07-21 | 2 | 0.000 | -7.093 | 36.6 | 36.6 | 80 |
| 2024-07-21 | 3 | 0.000 | -6.706 | 36.6 | 36.6 | 80 |
| 2024-10-30 | 10 | 0.000 | -8.100 | 0.9 | 3.9 | 3.9 |
Table 8.
Descriptive statistics show distinct patterns between carbonate dissolution and formation fluxes.
Table 8.
Descriptive statistics show distinct patterns between carbonate dissolution and formation fluxes.
| Statistic | log(ΔCCE/Δt) dissolution | log(ΔCCE/Δt) formation |
| Count | 50 | 50 |
| Mean | -3.437 | -3.736 |
| Std Dev | 3.63 | 3.651 |
| Min | -8.235 | -8.697 |
| 25% | -7.024 | -7.101 |
| 50% | 0 | -6.333 |
| 75% | 0 | 0 |
| Max | 0 | 0 |
| Nulls | 0 | 0 |
Table 9.
Pearson, Spearman, and Kendall correlation coefficients between cumulative rainfall (in the 7, 10, and 14 days prior to sampling) and log-transformed carbonate weathering fluxes.
Table 9.
Pearson, Spearman, and Kendall correlation coefficients between cumulative rainfall (in the 7, 10, and 14 days prior to sampling) and log-transformed carbonate weathering fluxes.
| Time Window (days) | Variable | Pearson’s r | Spearman’s ρ | Kendall’s τ |
| Precip_d7 | log(ΔCCE/Δt) formation | 0.454 | 0.536 | 0.433 |
| Precip_d7 | log(ΔCCE/Δt) dissolution | -0.108 | -0.008 | -0.008 |
| Precip_d10 | log(ΔCCE/Δt) formation | 0.461 | 0.536 | 0.433 |
| Precip_d10 | log(ΔCCE/Δt) dissolution | -0.099 | -0.008 | -0.008 |
| Precip_d14 | log(ΔCCE/Δt) formation | 0.343 | 0.536 | 0.433 |
| Precip_d14 | log(ΔCCE/Δt) dissolution | -0.052 | -0.008 | -0.008 |
Disclaimer/Publisher’s Note: The statements, opinions and data contained in all publications are solely those of the individual author(s) and contributor(s) and not of MDPI and/or the editor(s). MDPI and/or the editor(s) disclaim responsibility for any injury to people or property resulting from any ideas, methods, instructions or products referred to in the content. |
© 2025 by the authors. Licensee MDPI, Basel, Switzerland. This article is an open access article distributed under the terms and conditions of the Creative Commons Attribution (CC BY) license (http://creativecommons.org/licenses/by/4.0/).
Copyright: This open access article is published under a Creative Commons CC BY 4.0 license, which permit the free download, distribution, and reuse, provided that the author and preprint are cited in any reuse.


