Preprint
Article

This version is not peer-reviewed.

Evolutionary Patterns of Microsatellite Distribution in Cricket Genomes: Insights from Comparative Genomics of Five Gryllidae Species

A peer-reviewed article of this preprint also exists.

Submitted:

13 February 2026

Posted:

14 February 2026

You are already at the latest version

Abstract

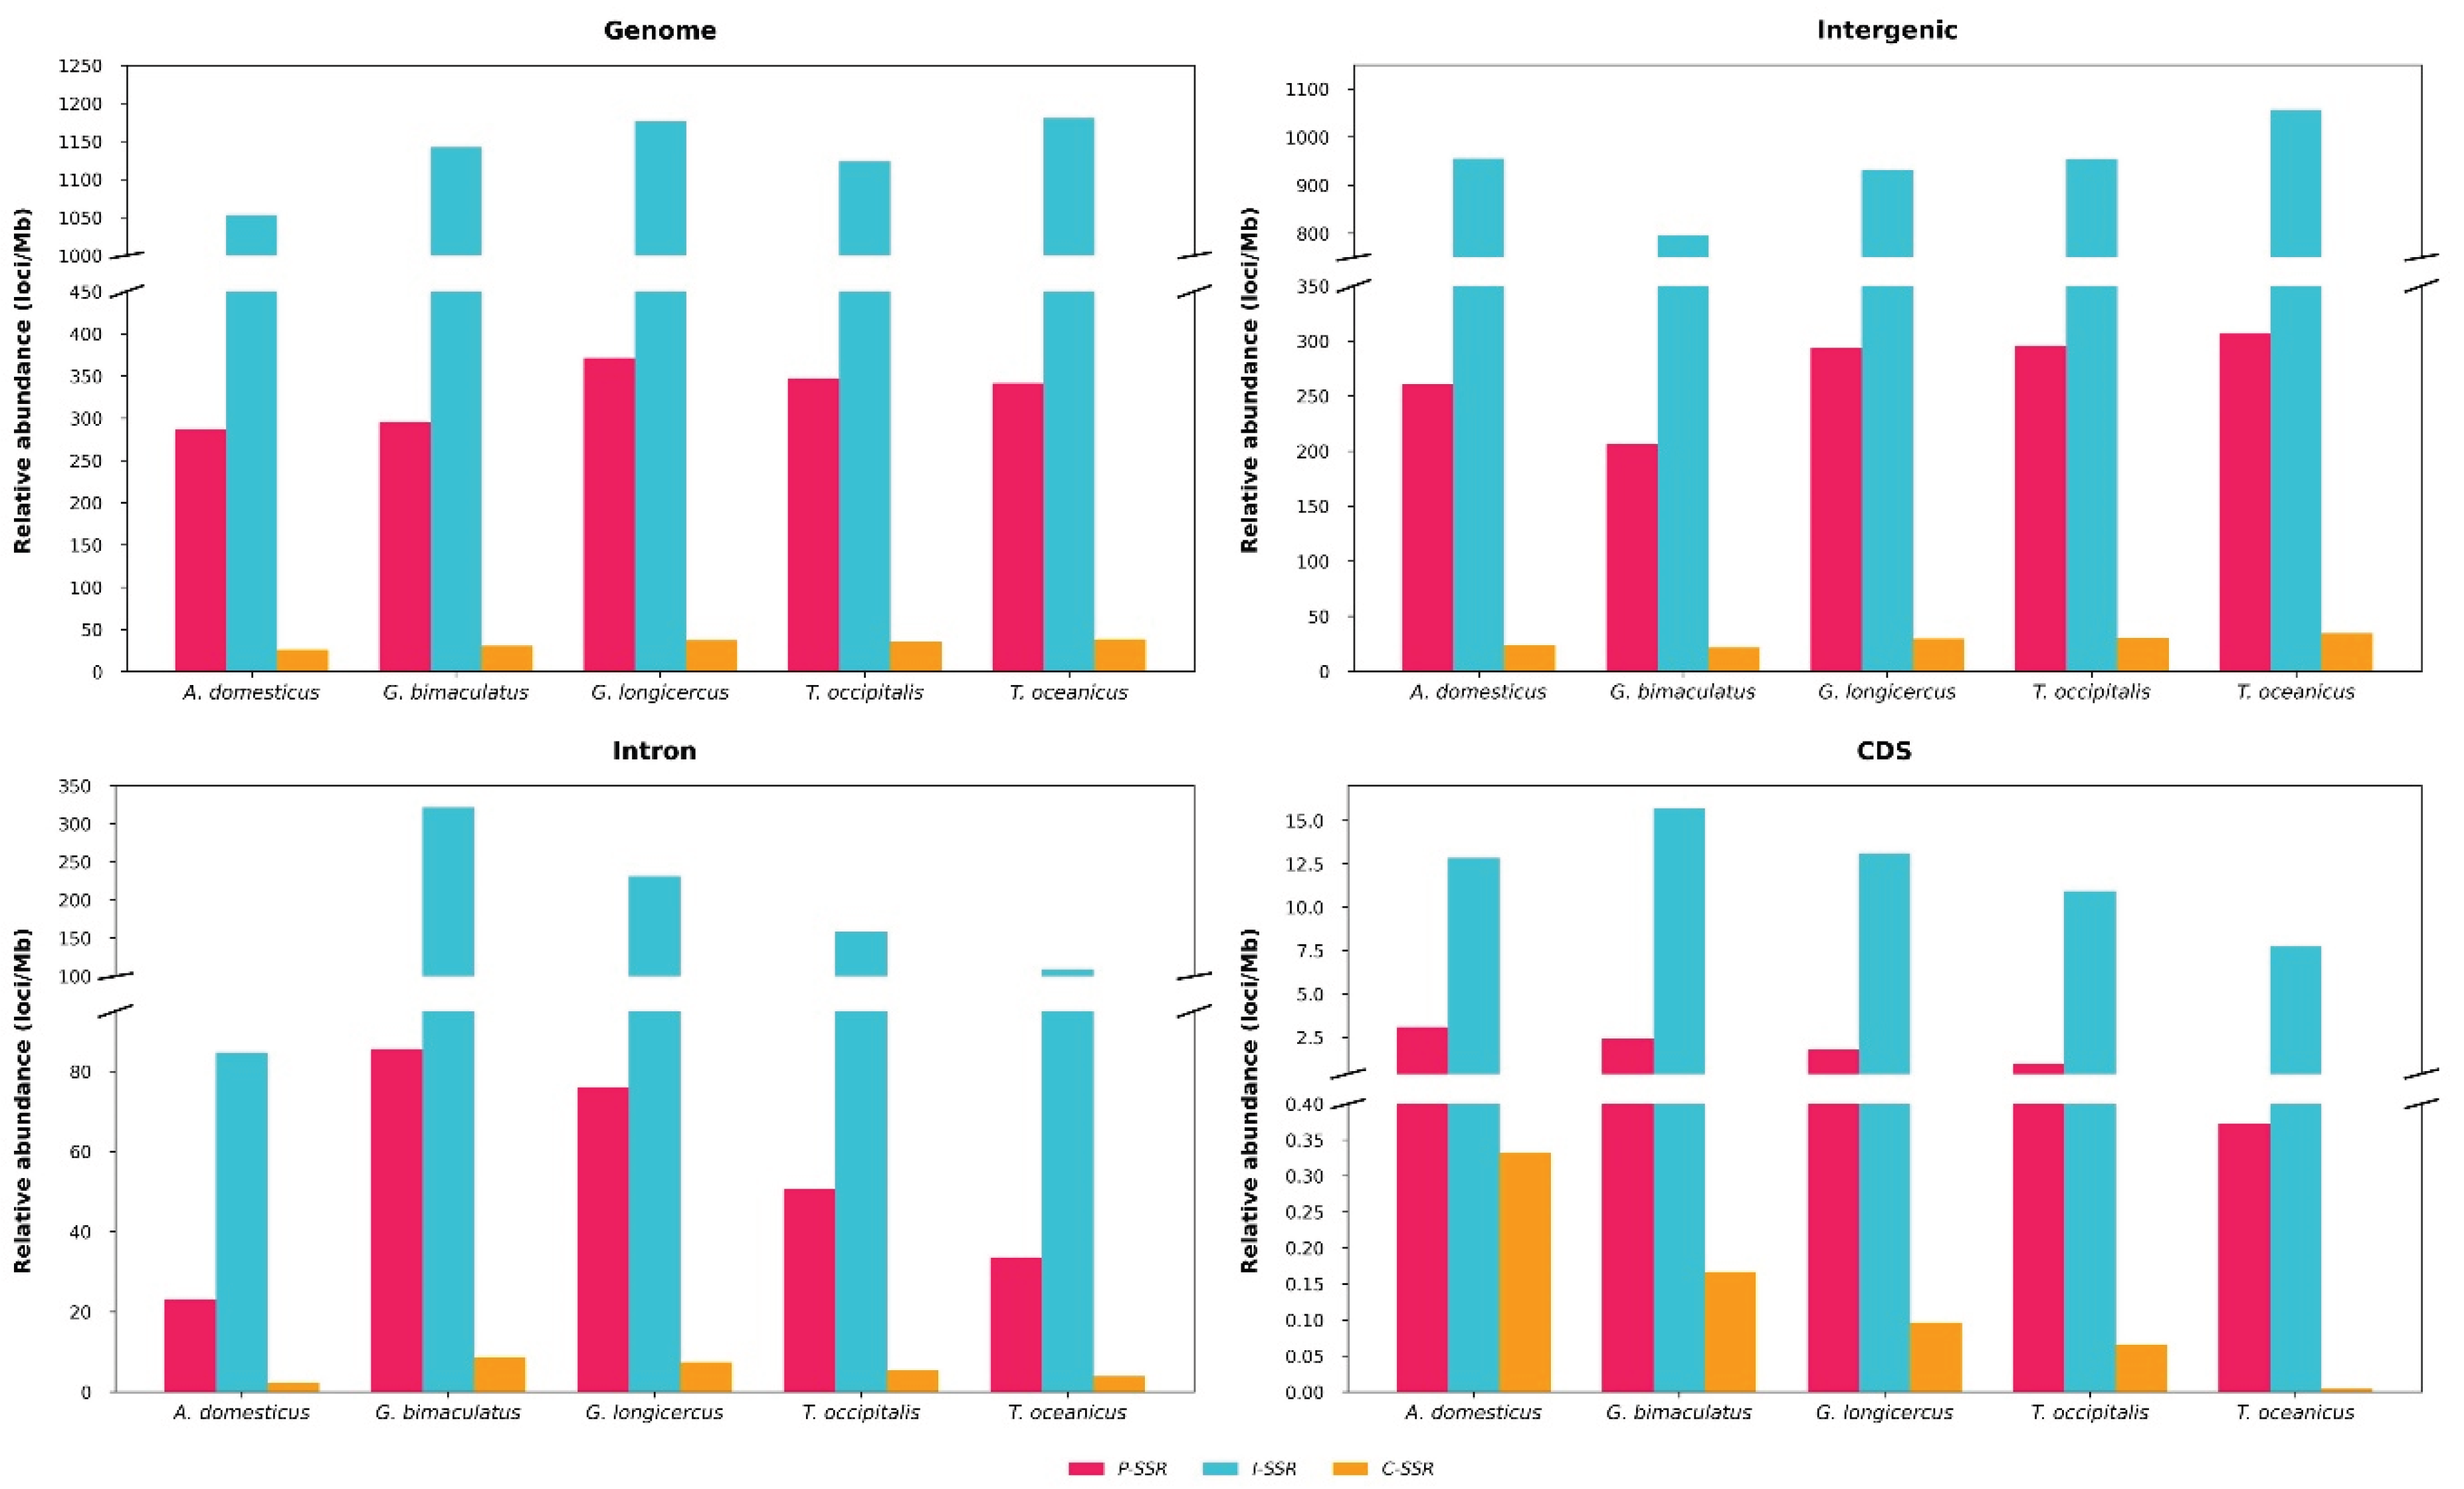
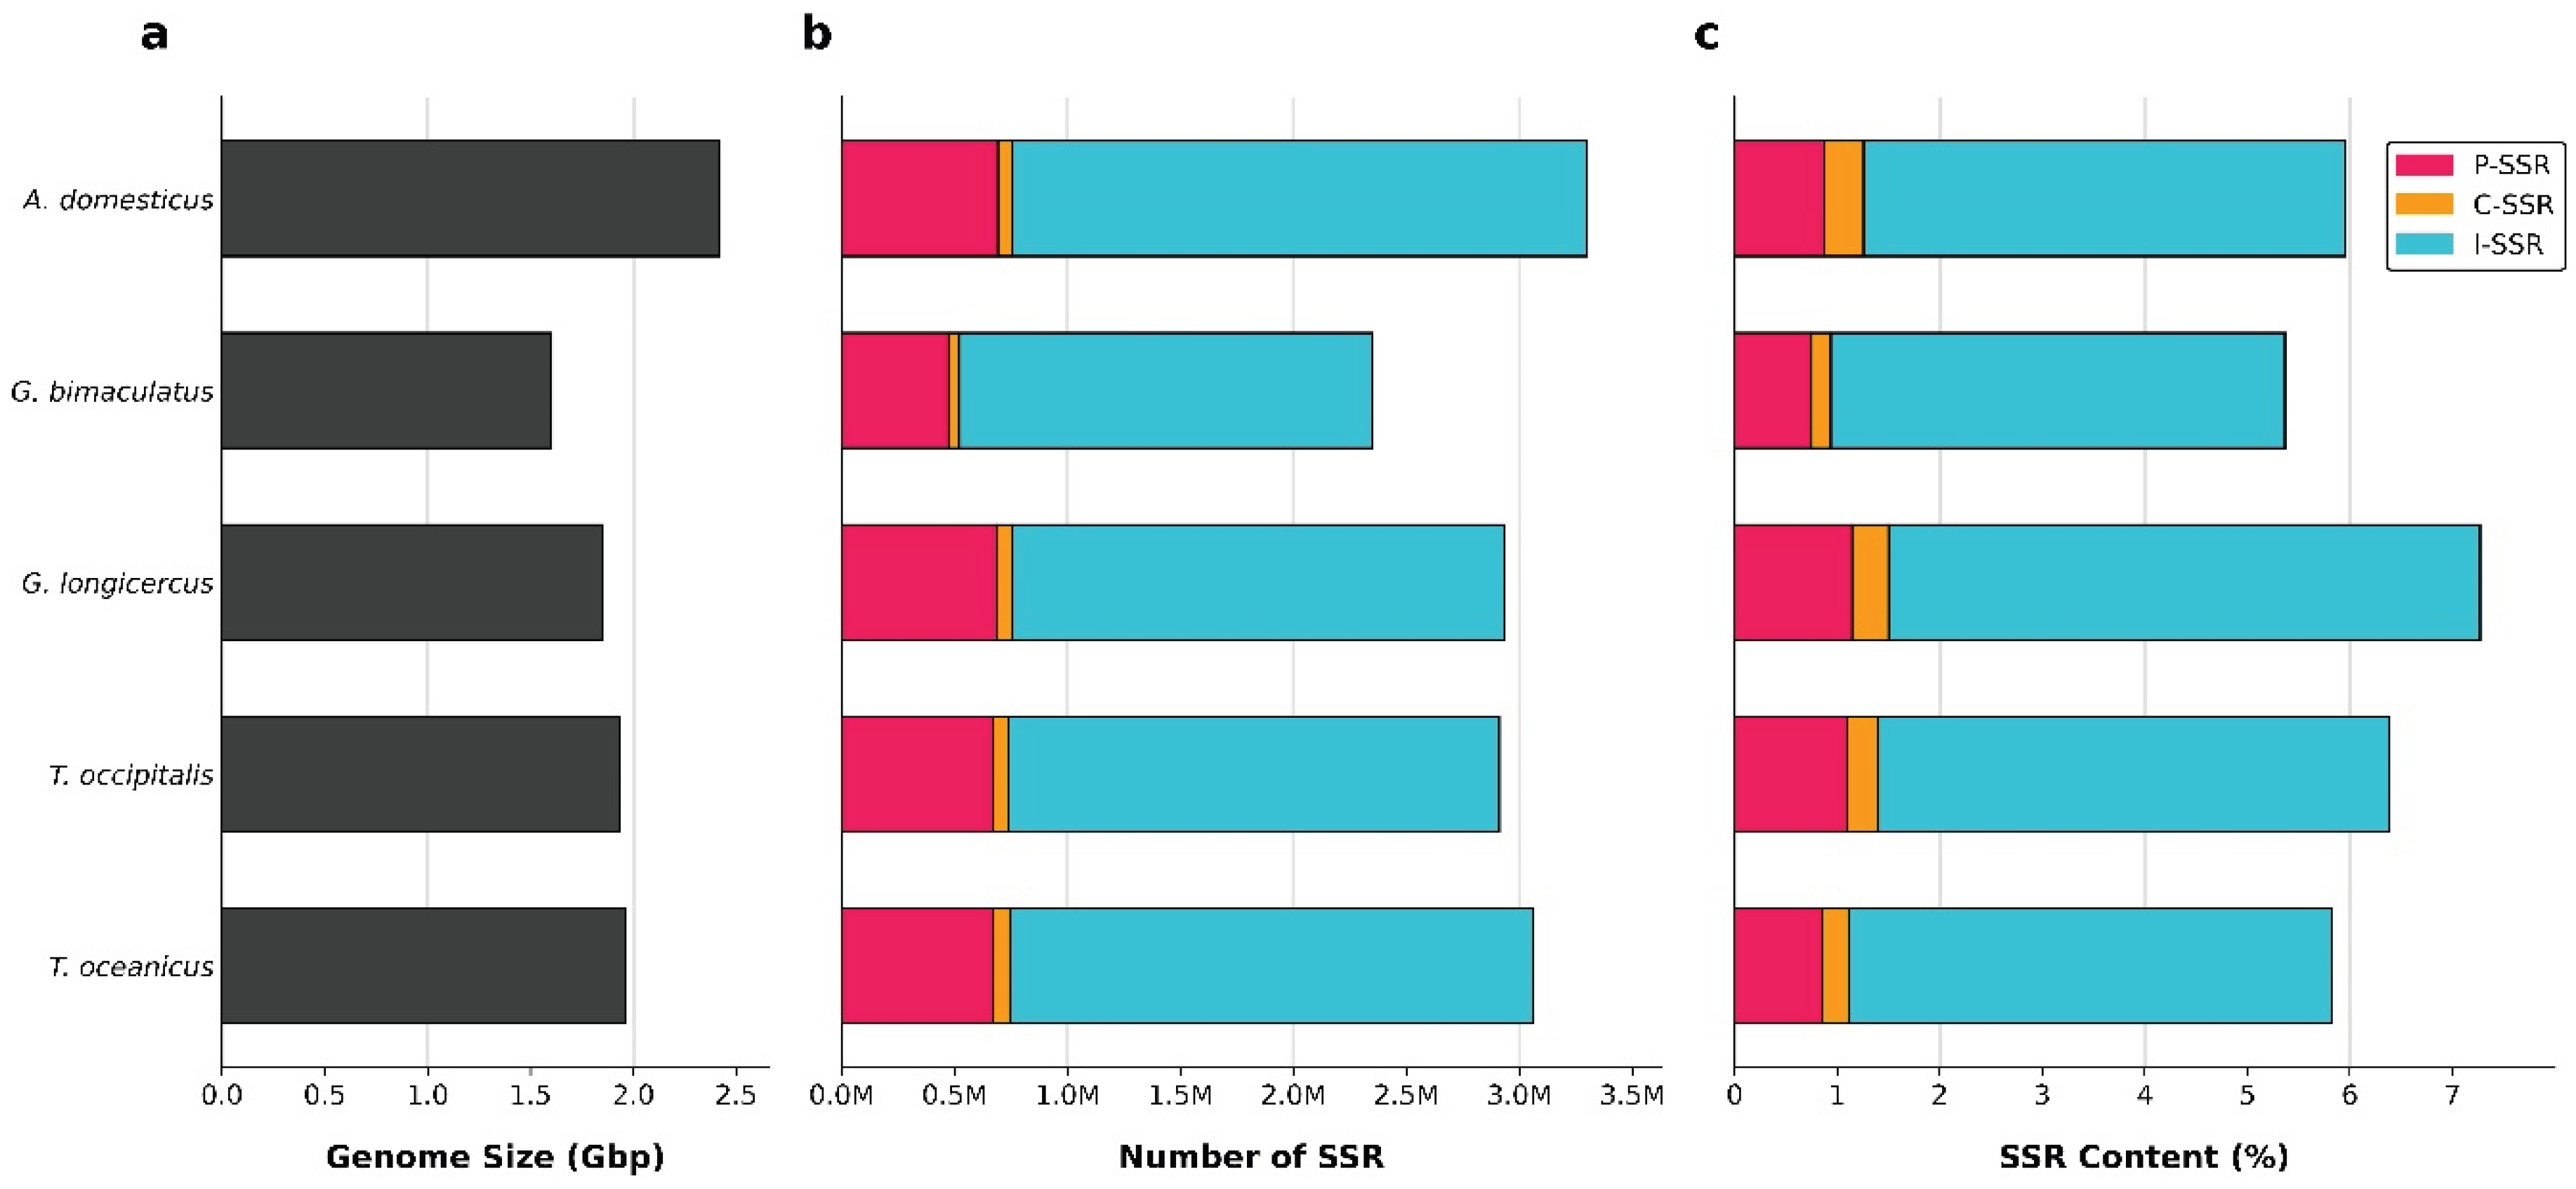
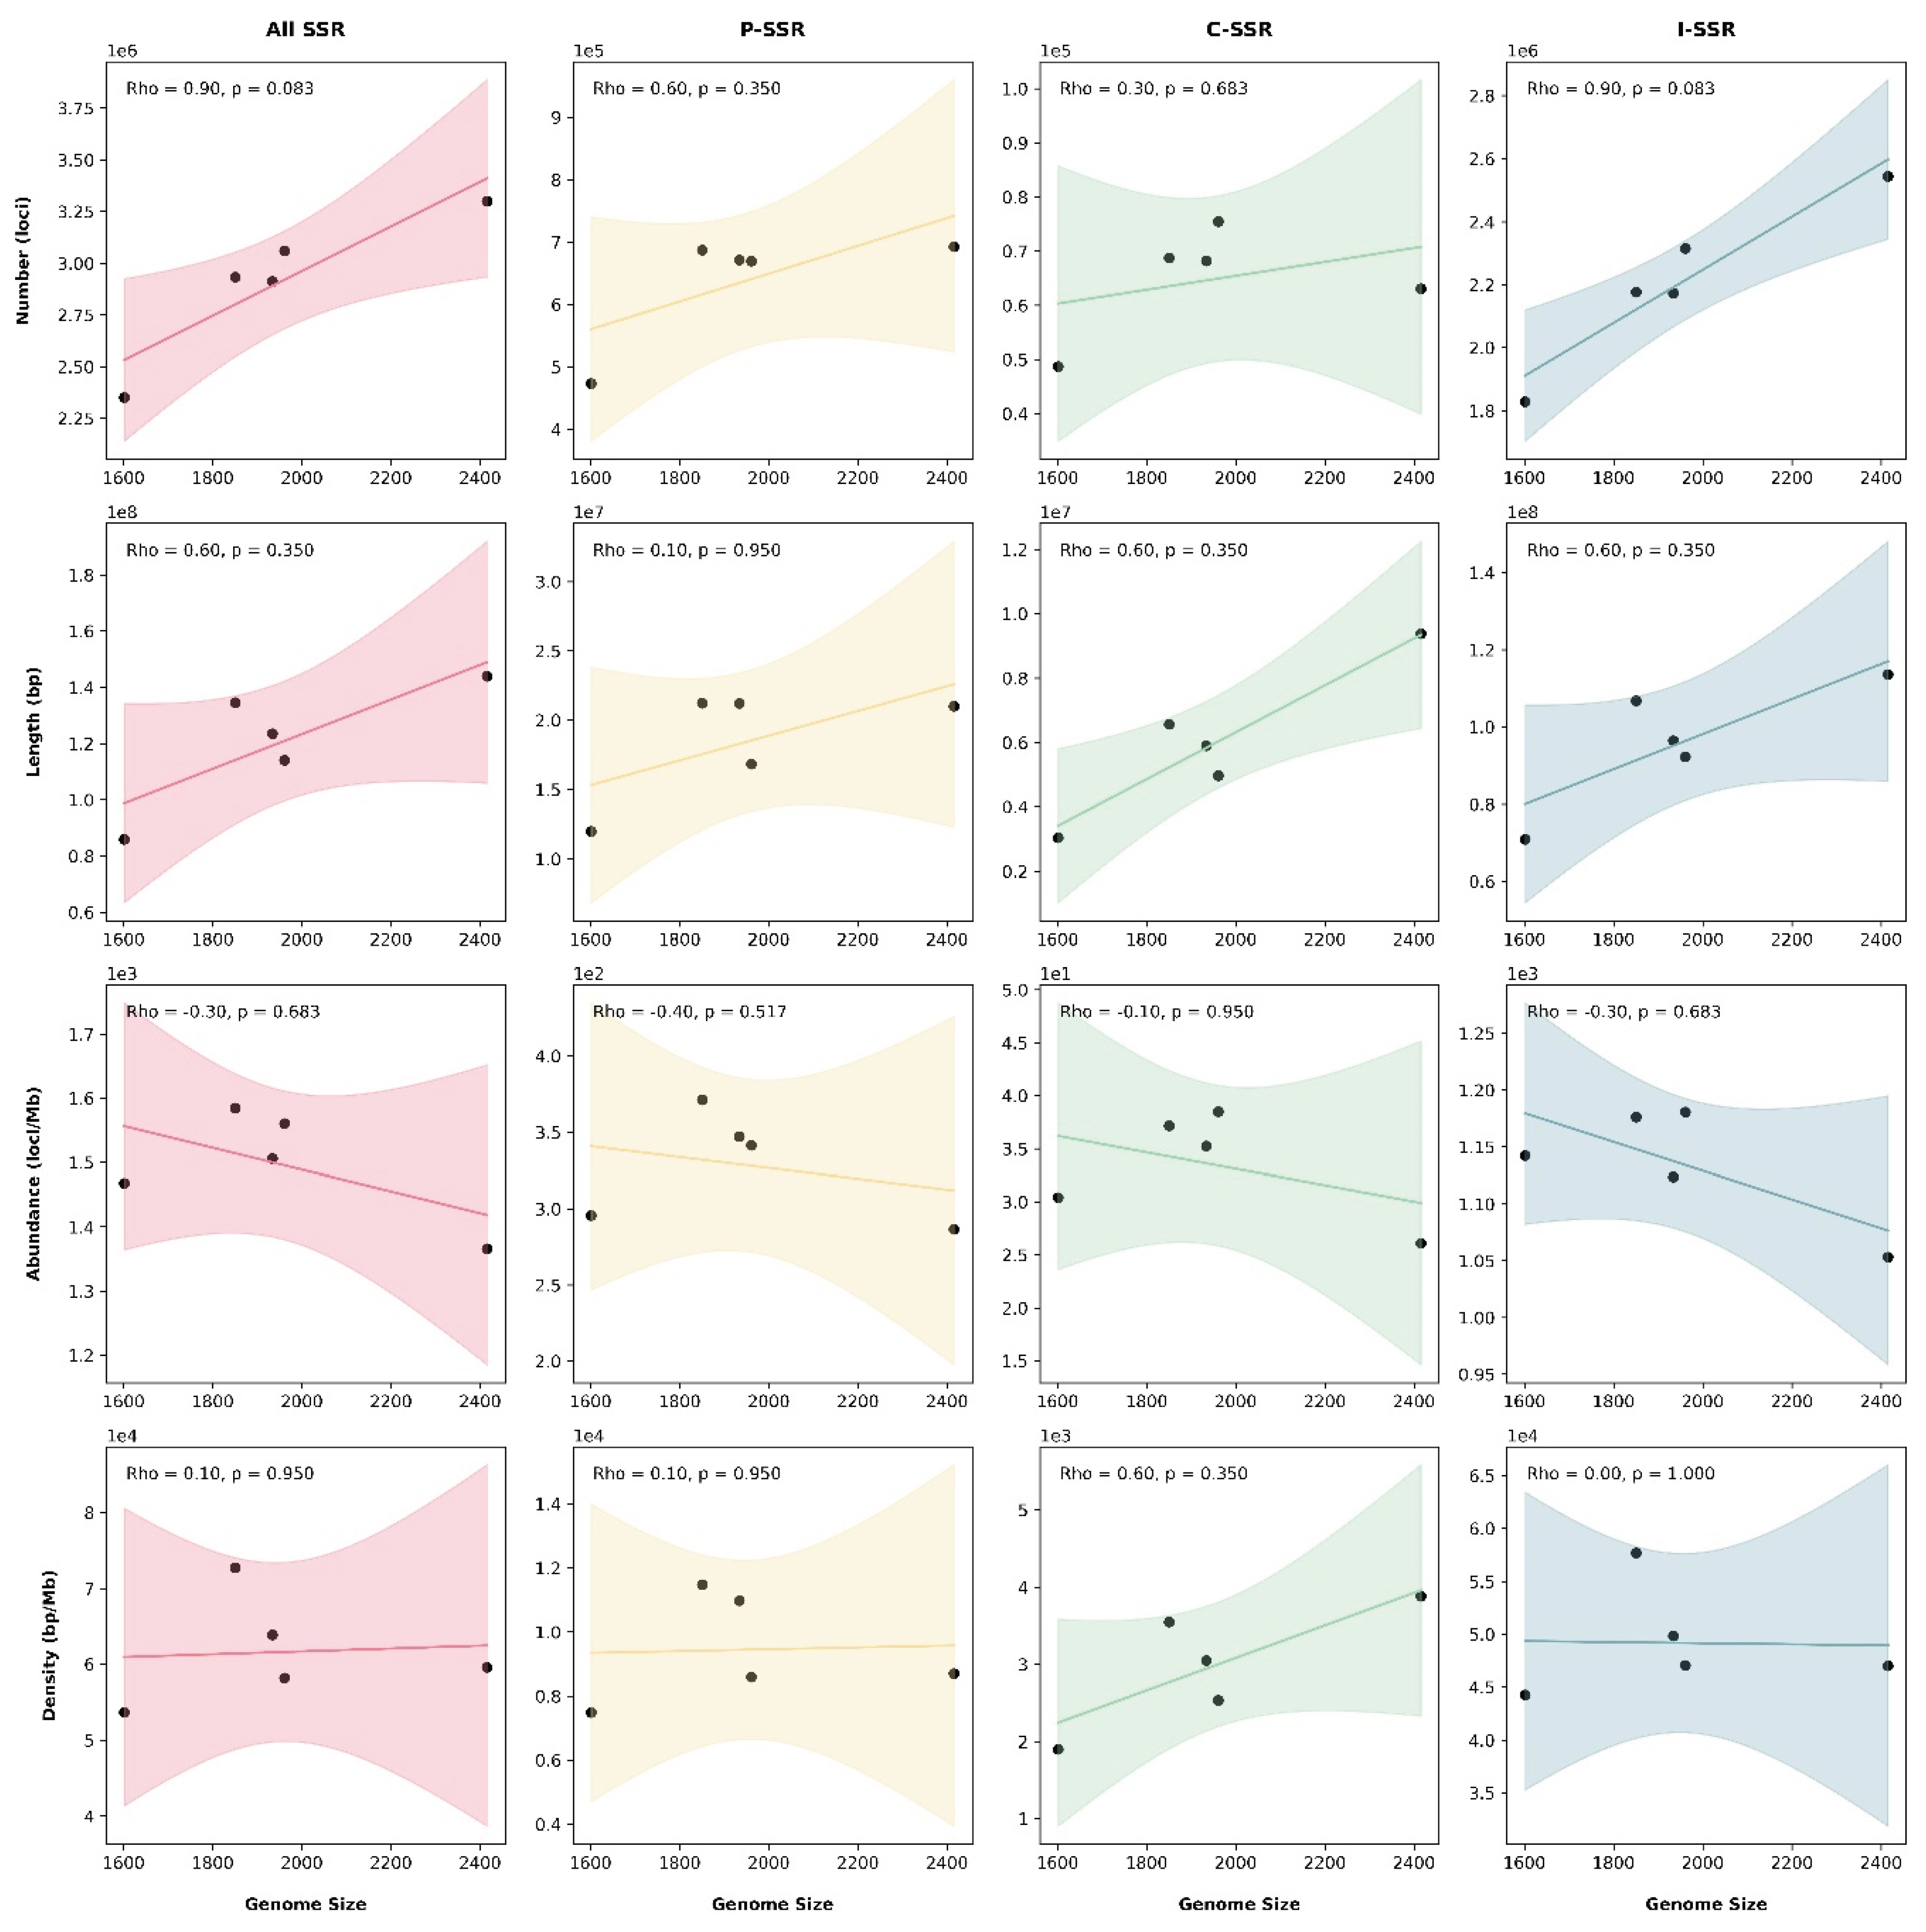
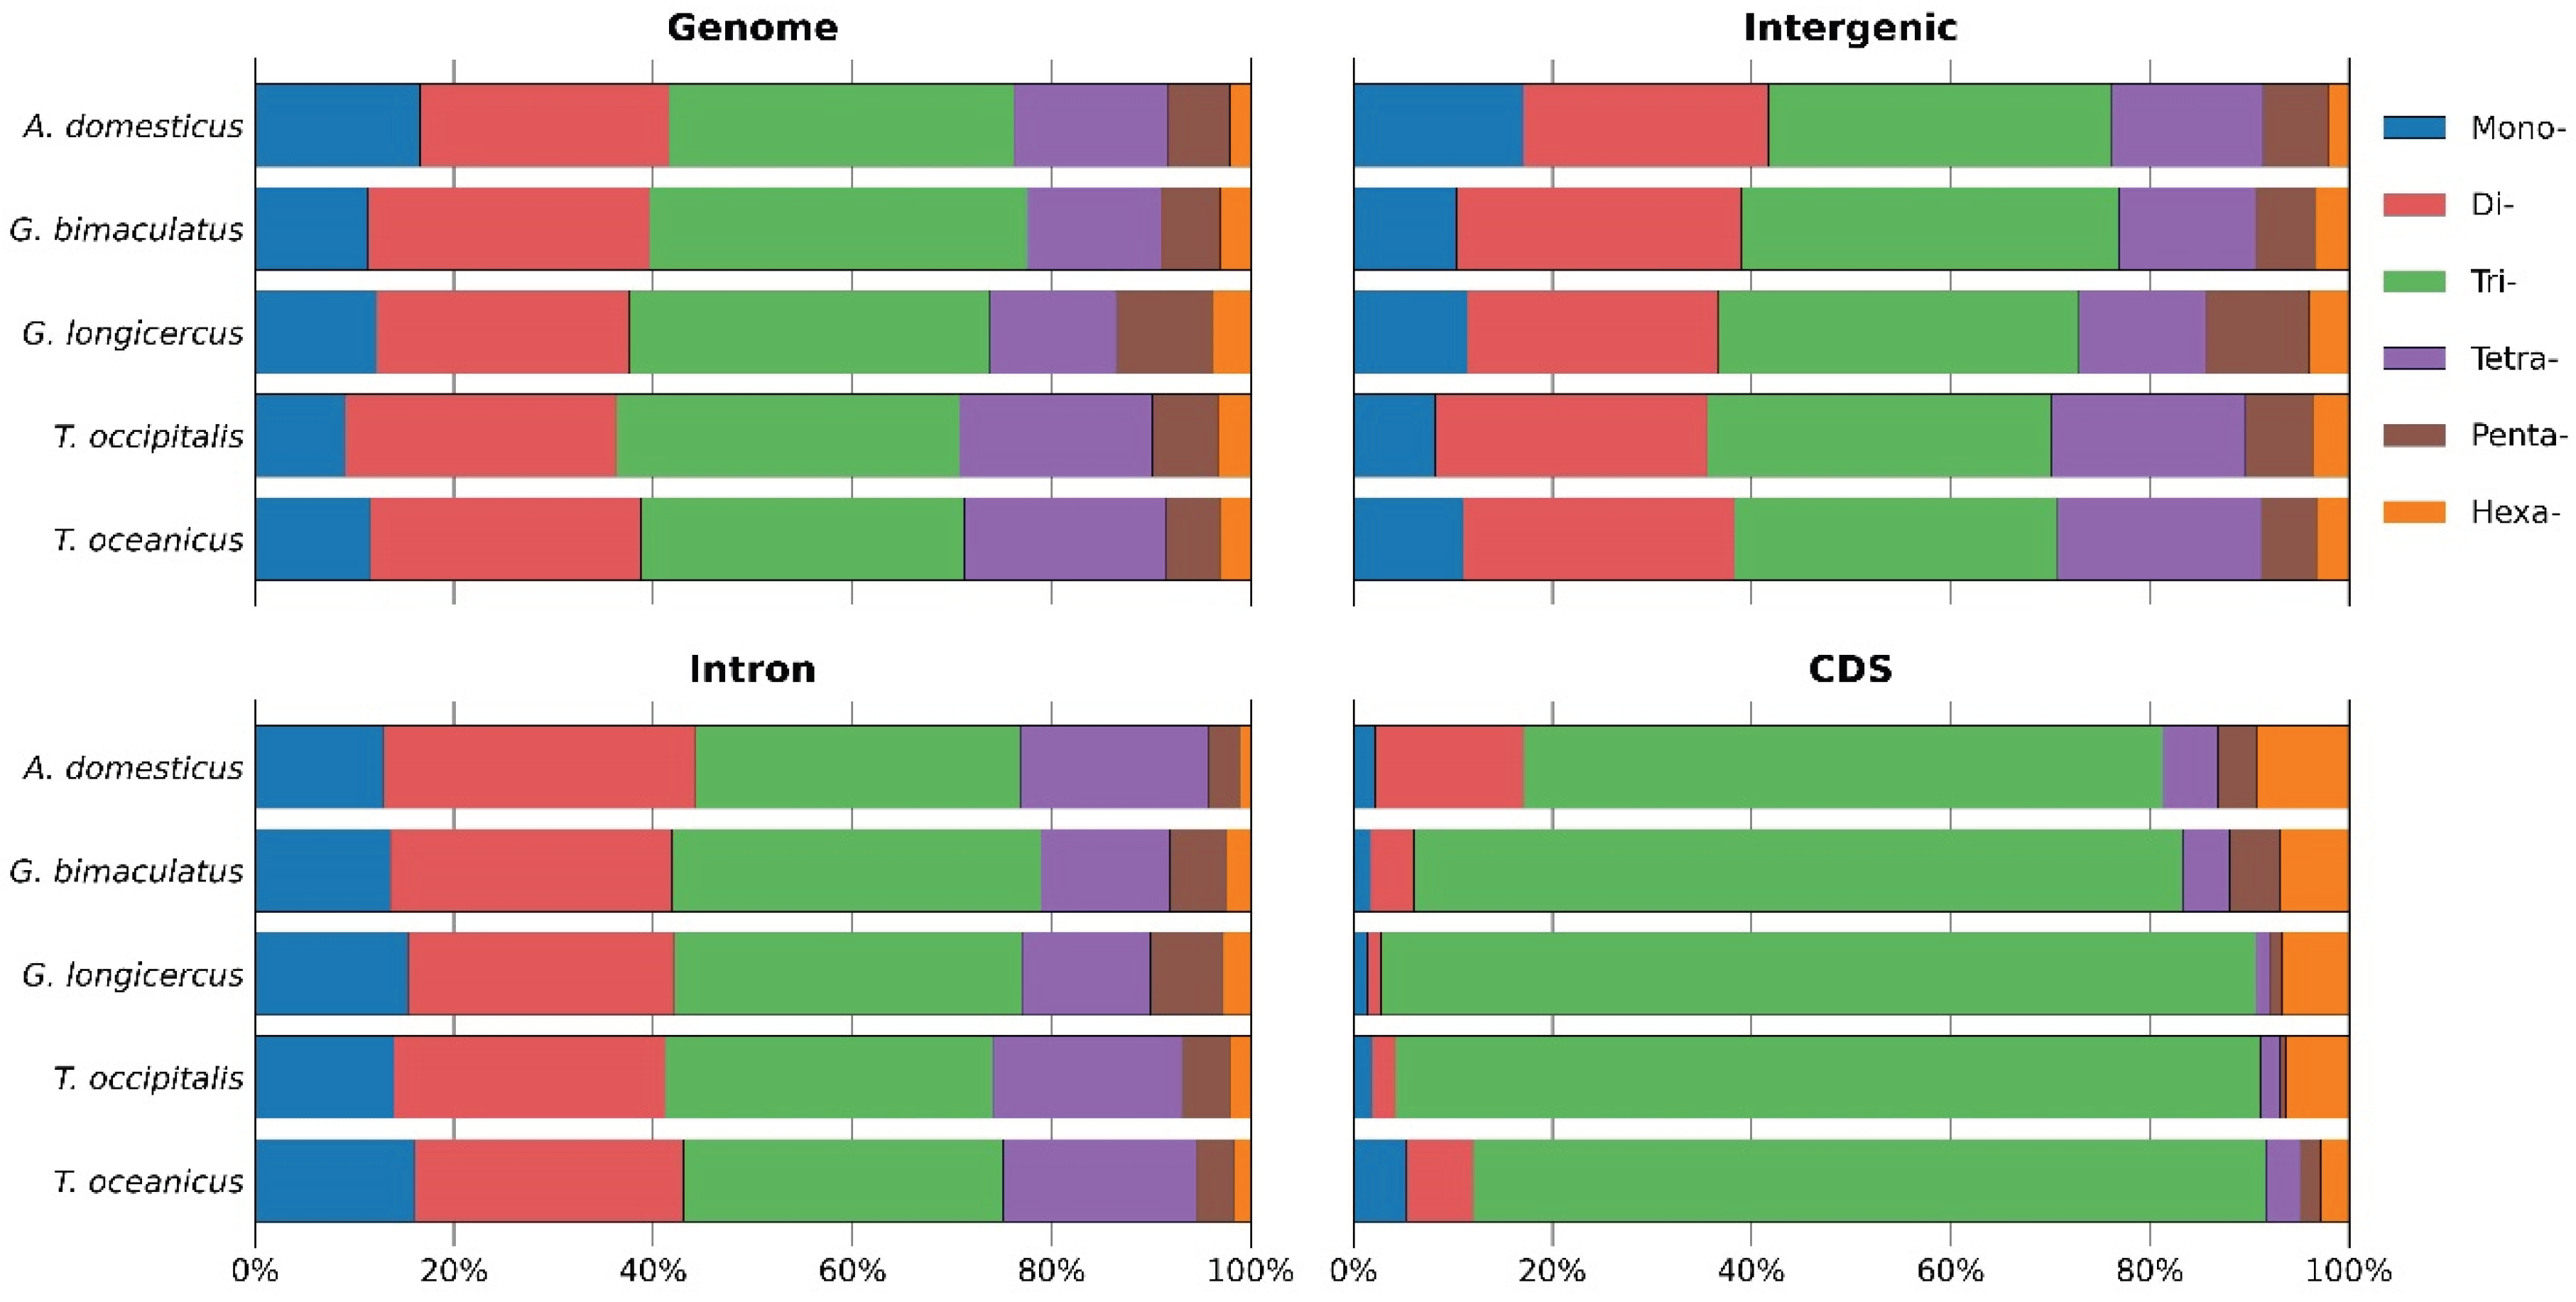
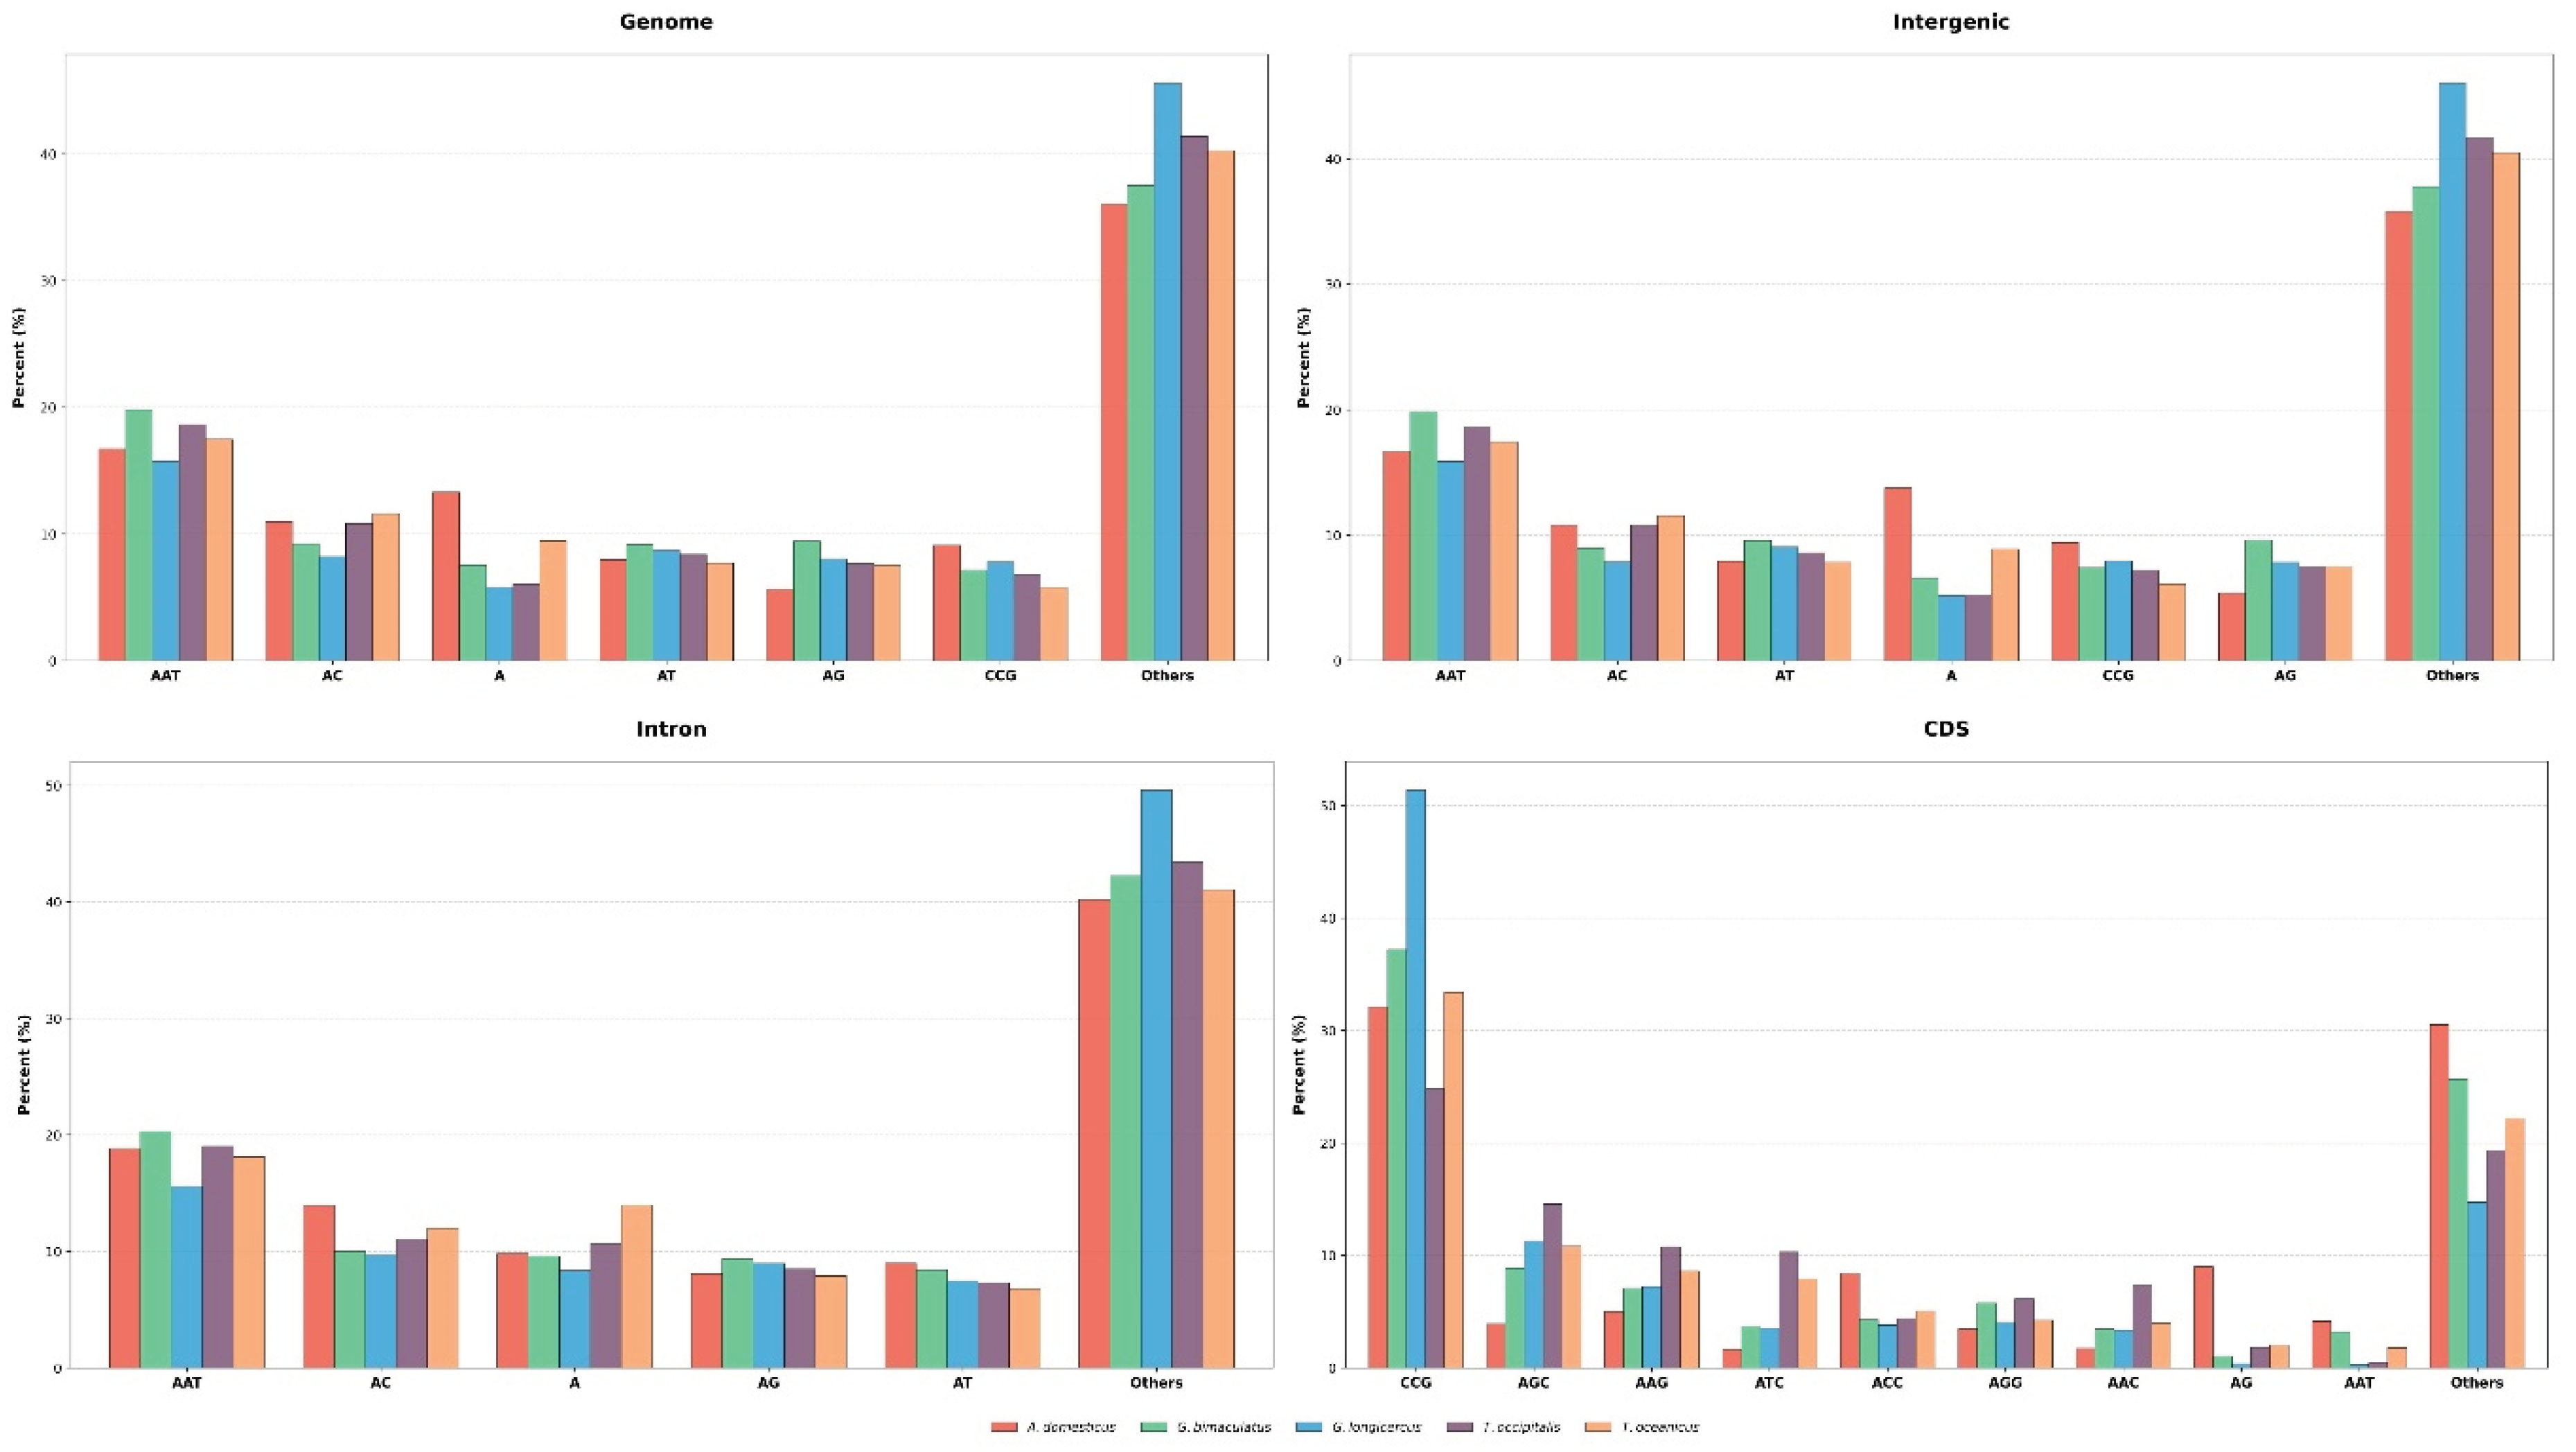
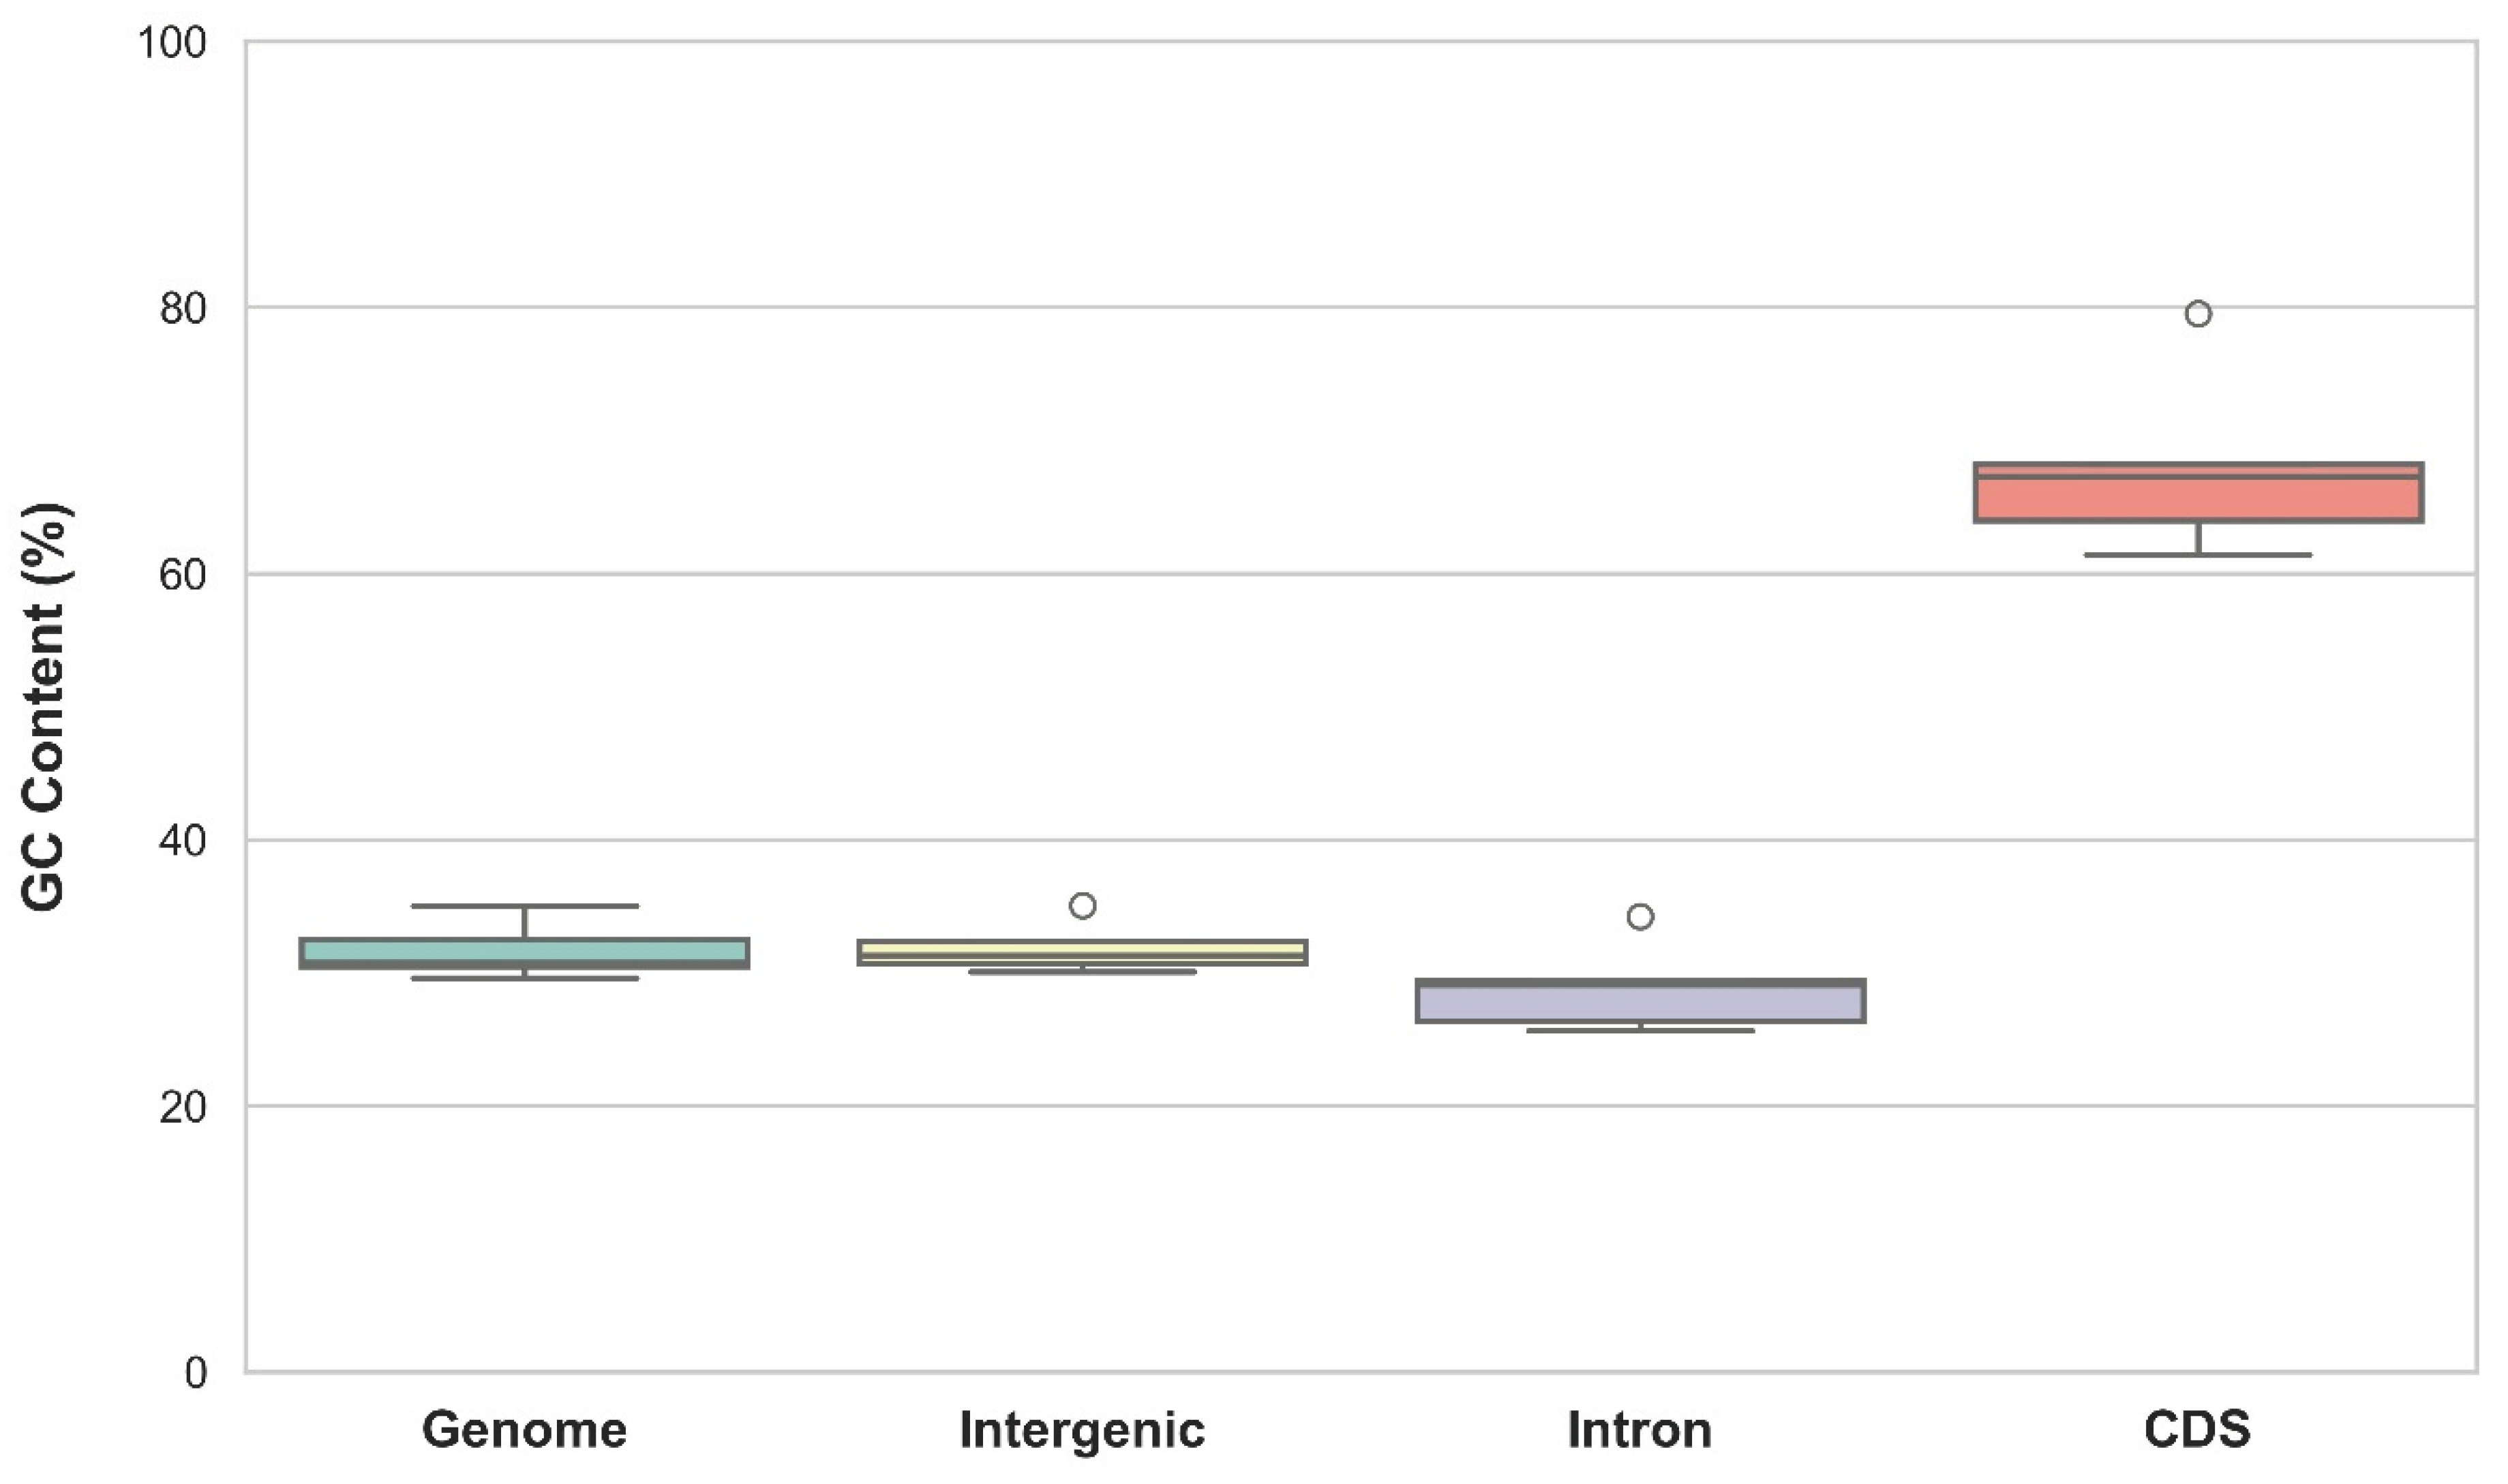
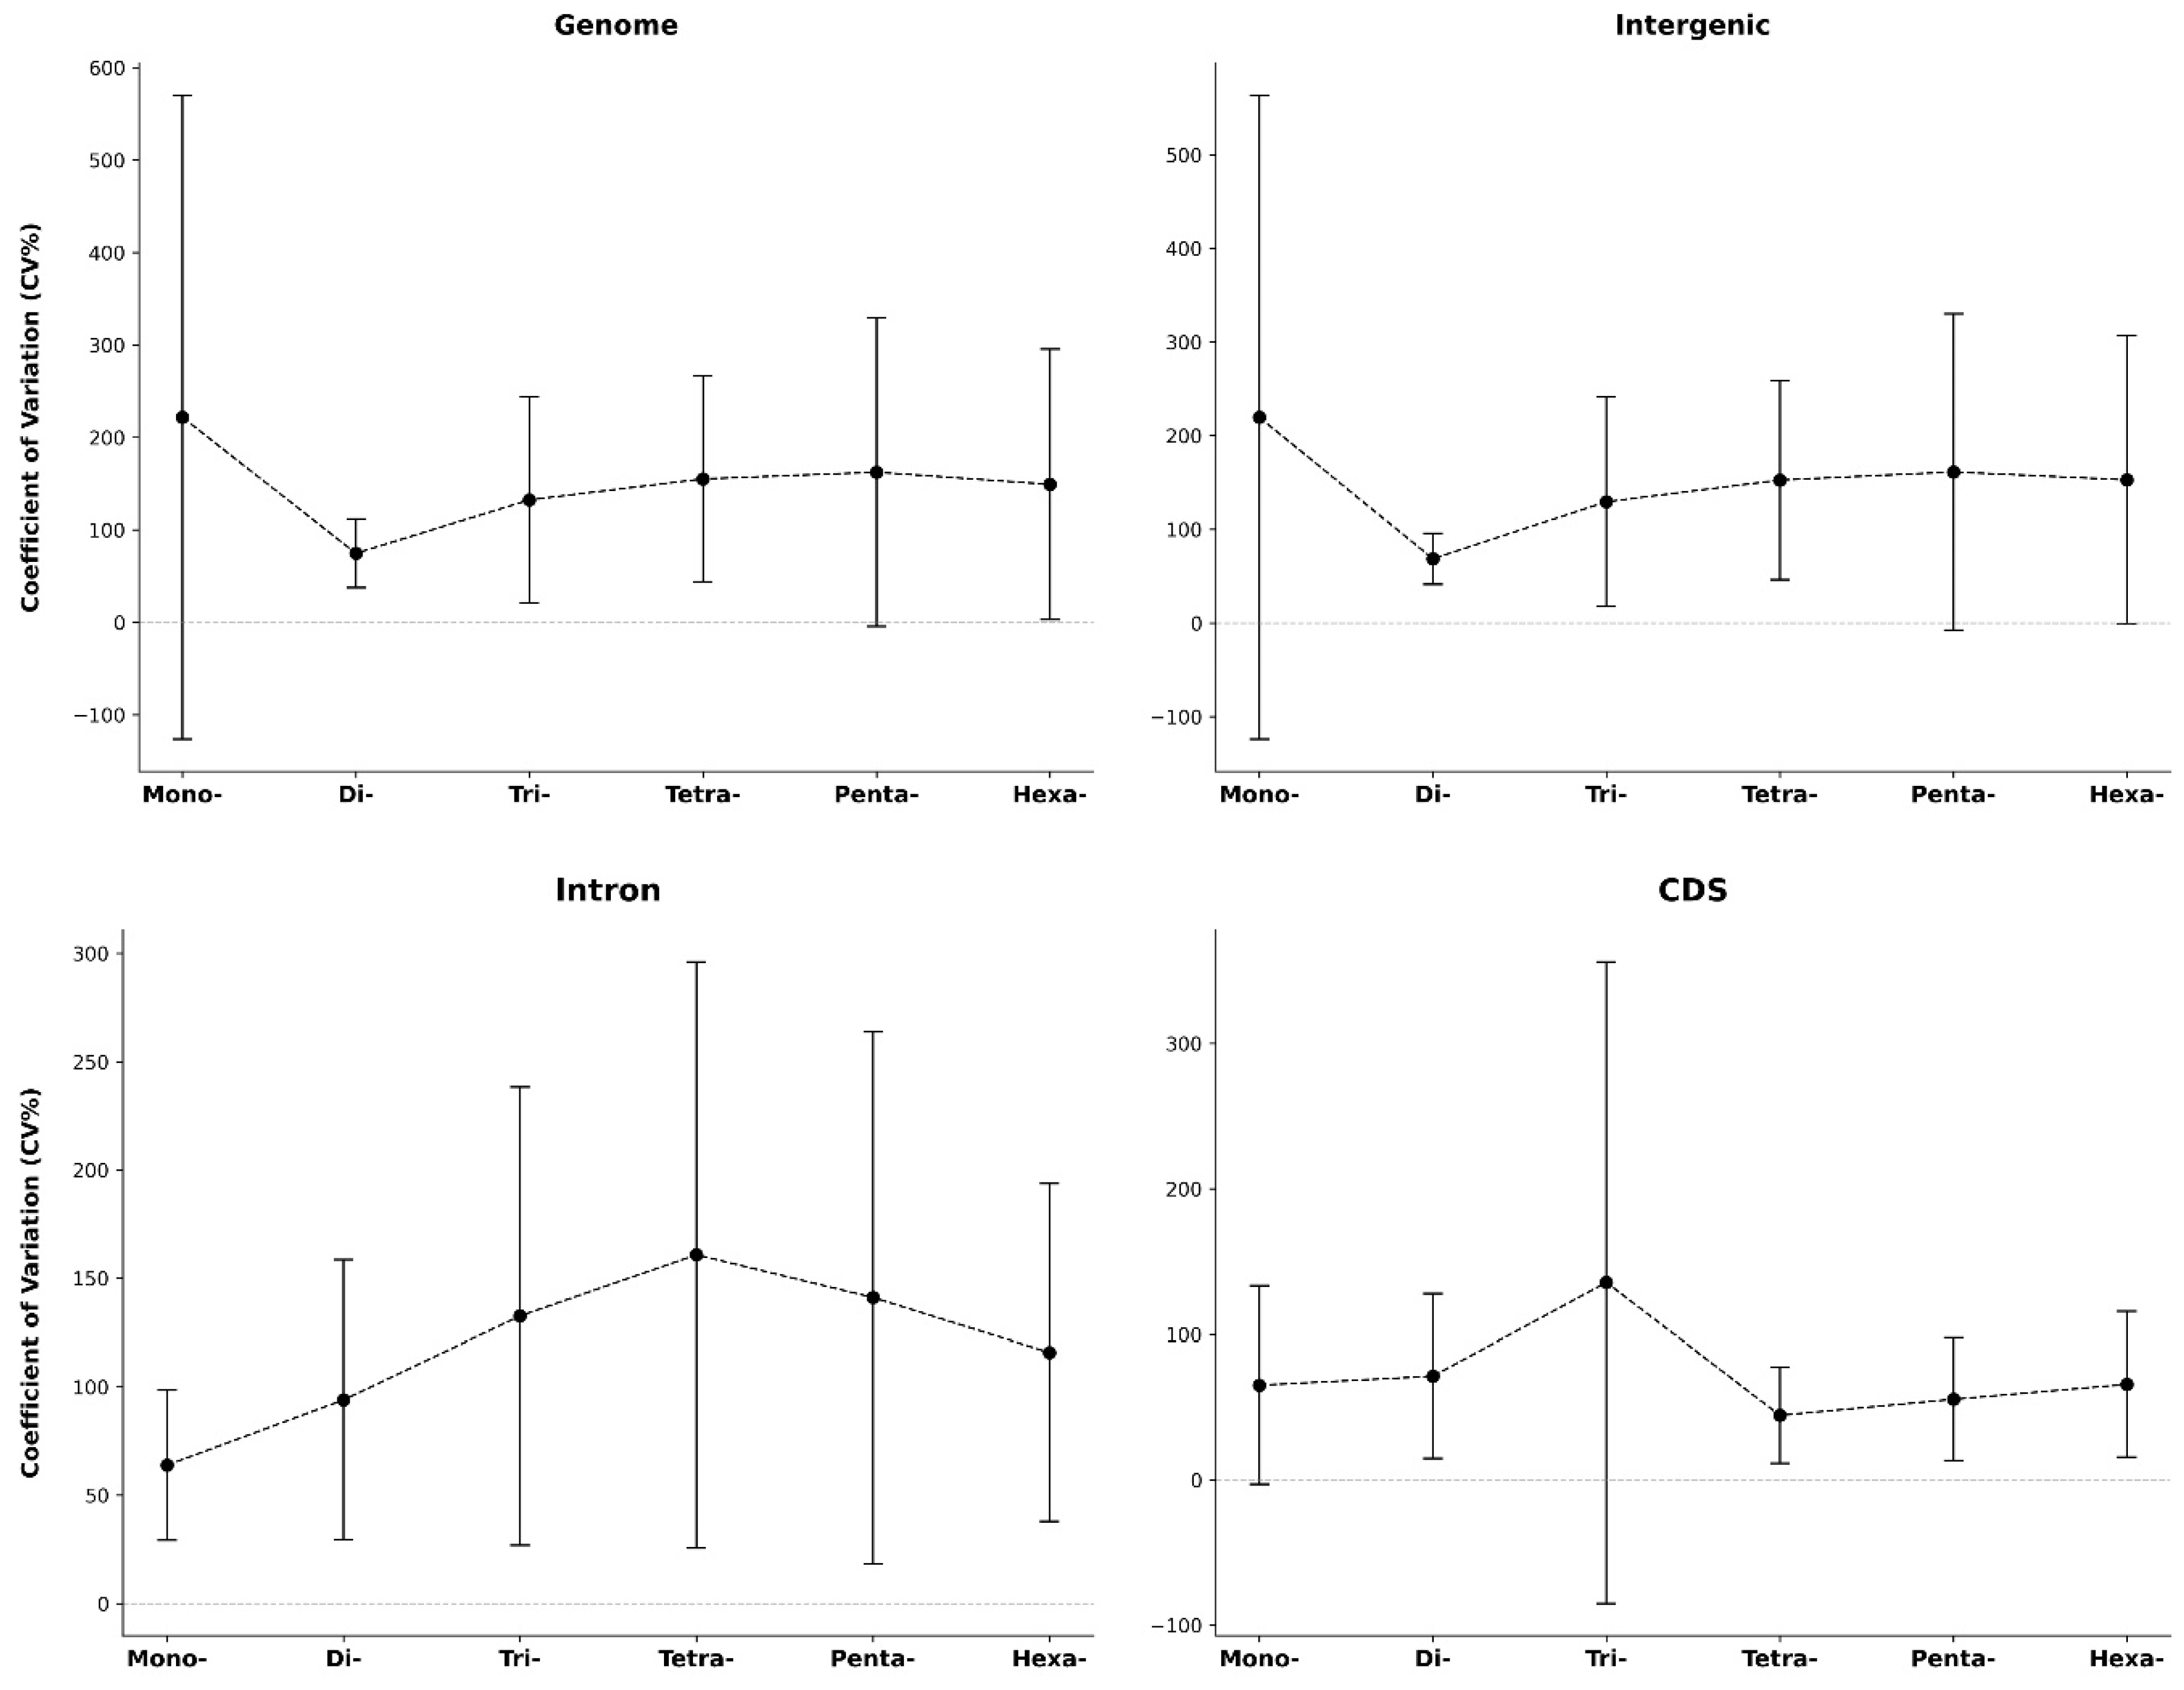
Microsatellites or simple sequence repeats (SSRs) are valuable markers for understanding genome structure, function, and evolution. However, their distribution and characteristics remain largely unexplored in cricket species. We conducted a genome-wide identification and analysis of SSRs (P-SSRs, C-SSRs, and I-SSRs) across five cricket genomes. The total number of SSRs ranged from 2,350,765 to 3,299,527, representing 5.37%–7.27% of the genomes. Abundance followed the pattern I-SSRs > P-SSRs > C-SSRs across genomic regions (genome, intergenic, intronic, and CDSs). The total SSR number showed a strong but statistically non-significant positive correlation with genome size, whereas SSR length, abundance, and density showed no correlation. Trinucleotide repeats were consistently the most common P-SSR type. The (AAT)n motif predominated in genome, intergenic, and intron regions, while (CCG)n was most frequent in CDSs. Consequently, AT-rich repeats dominated non-coding regions, whereas GC-rich repeats were enriched in CDSs. Coefficient of variation (CV) analysis of repeat copy numbers (RCN) revealed distinct trends in P-SSR distribution across regions and species. Functional annotation of CDSs containing P-SSRs indicated involvement in binding, signal transduction, and transcription. This study represents, to our knowledge, the first comprehensive family-level comparative analysis of SSRs in crickets, providing new insights into their genomic architecture.

Keywords: 
;  ;  ;  ;  

1. Introduction

Understanding the architecture of eukaryotic genomes requires examining not just protein-coding sequences, but also the repetitive elements that constitute large portions of genomic DNA. Among these repetitive sequences, simple sequence repeats (SSRs) also called microsatellites or short tandem repeats (STRs) represent a particularly important class of genomic elements. SSRs are DNA sequences composed of short nucleotide motifs (1–6 base pairs) repeated in tandem throughout the genome [1], distributed ubiquitously in both protein-coding and noncoding regions across prokaryotes and eukaryotes. What makes SSRs biologically significant is not merely their prevalence, but their remarkable mutational dynamics. SSRs experience mutation rates substantially higher than other genomic sequences (10⁻² to 10⁻⁶ per locus per generation), driven by replication slippage, unequal crossing-over, gene conversion, and indel mutations [2]. This elevated mutation rate generates extensive polymorphism and hypervariability at SSR loci, a property that has made them invaluable as genetic markers in population genetics, genetic mapping, forensic analysis, paternity testing, molecular breeding, and biodiversity conservation [3]. However, the significance of SSRs extends far beyond their utility as neutral polymorphic markers. Emerging evidence reveals that SSRs embedded within protein-coding sequences exert functional effects on gene regulation, transcription dynamics, and protein biochemistry [4,5]. Moreover, microsatellite instability and expansion have been linked to human diseases including neurodegenerative disorders and various cancers [6,7], indicating that understanding SSR biology has direct relevance to human health. Despite their importance across multiple biological contexts, comprehensive genome-wide characterization of SSRs remains lacking in many insect taxa, particularly those with significant ecological or economic importance.
Crickets (Gryllidae), commonly known as true crickets, represent a diverse insect group within the order Orthoptera, suborder Ensifera. They are found in a wide range of terrestrial habitats worldwide [8]. As research models, crickets have contributed valuable insights to developmental biology [9], neuroscience [10], evolutionary genetics [11], and the study of biological rhythms [12]. Beyond fundamental research, crickets are increasingly recognized for their remarkable potential to address global protein security challenges. With rapidly expanding human populations projected to demand sustainable protein sources by 2050, crickets present an attractive alternative to conventional livestock: they demonstrate high growth efficiency, thrive in dense rearing systems, possess omnivorous feeding habits, and efficiently bioconvert agricultural wastes into nutrient-dense biomass [13,14]. Cricket farming already generates rich nutrient profiles valued as both direct human food sources and animal feed [15,16]. However, optimizing cricket production for sustainable agriculture requires a detailed understanding of their genomic architecture, knowledge that has been inaccessible until recently due to the scarcity of high-quality reference genome assemblies for cricket species [8].
The recent availability of whole-genome sequences for multiple cricket species has fundamentally changed what genomic questions we can now address. Over the past decade, advances in long-read sequencing technologies, improved assembly algorithms, and increased research investment have made comprehensive genome-wide characterization feasible for previously intractable organismal groups [17,18]. These technological advances have enabled more efficient and cost-effective microsatellite isolation compared to traditional labour-intensive approaches [19], permitting comprehensive surveys across diverse eukaryotic genomes that reveal important evolutionary and functional insights [17,20]. Comparative genomic studies across insects, vertebrates, and plants have begun revealing universal principles governing SSR organization: positive correlations between genome size and microsatellite abundance emerge in beetles [21] and other taxa, while family-level motif conservation patterns appear across diverse insect groups [22]. Remarkably, SSR characteristics show sufficient conservation across taxa to enable successful cross-species marker development in reptiles and plants [23,24]. Yet these comparative studies simultaneously reveal taxon-specific characteristics unique patterns reflecting distinct evolutionary pressures and genomic constraints operating within different lineages. This striking combination of conserved principles and lineage-specific variation underscores a critical knowledge gap, while beetles [21], birds [25,26], reptiles [27], and mammals [28] have been systematically characterized for their SSR landscapes, Orthoptera and particularly the family Gryllidae remains almost entirely unexplored at the genomic level. For a group as biologically important and economically promising as crickets, this knowledge gap represents a significant lost opportunity for both evolutionary understanding and applied breeding applications.
To fill this critical gap, we conducted the first comprehensive genome-wide characterization of simple sequence repeats across five cricket species representing major lineages within the family Gryllidae. Our analysis was structured around five interconnected research questions that build progressively in complexity: Do the numbers of microsatellites correlate with genome size? Are the most prevalent microsatellite types and motifs conserved across species or lineage-specific? Are microsatellites distributed differently across various genomic regions? Do repeat copy number and GC content of microsatellites vary among genomic regions? Do certain functional gene categories preferentially harbour microsatellites? Our results reveal both conserved patterns consistent with broader insect evolution and cricket-specific characteristics including distinct distribution patterns across genomic compartments and functional enrichment in genes involved in binding, signal transduction, and transcription. By providing the first comprehensive family-level perspective on microsatellite organization in Orthoptera, this work generates essential genomic resources applicable to evolutionary studies, population genetics, and the advancement of sustainable cricket-based protein production systems for global food security.

2. Materials and Methods

2.1. Sources of Genomic Dataset

For this study, species were chosen based on the availability of public genome assemblies at the time of the survey (as of 3 July 2024). Whole-genome sequences and corresponding annotation files for five cricket species in the family Gryllidae, including Acheta domesticus, Gryllus bimaculatus, Gryllus longicercus, Teleogryllus occipitalis, Teleogryllus oceanicus were compiled from multiple sources. Genome sequences were obtained in FASTA format and annotation files in GFF/GTF format, primarily from the National Center for Biotechnology Information (NCBI) and supplemented with data from published studies and obtained directly from the author. Specific genomic regions, including coding sequences (CDSs), introns, and intergenic regions, were defined and extracted using the coordinate information provided in the annotation files. The details and sources of the cricket genome data are listed in Supplementary Table S1.

2.2. Microsatellites Identification, Classification, and Localization

Microsatellites were identified and localized using Krait Version 1.5.1 [29] from genome sequences of crickets and their genome annotation. They were identified and classified into perfect SSRs (P-SSRs), compound SSRs (C-SSRs), and imperfect SSRs (I-SSRs). We identified P-SSRs with motifs of 1–6 bp, requiring minimum repeat numbers of 12 (mono-), 7 (di-), 5 (tri-), and 4 (tetra-, penta-, and hexa-nucleotide) [21]. Other parameters in Krait were set to default. Repeats with unit patterns being circular permutations and/or reverse complements were categorized as one SSR type. For example, an AGC pattern containing AGC, GCA, CAG, GCT, TGC, and CTG [30]. The total possible permutations of SSR motifs 1–6 bp in length were divided into 501 stand motif types (2 monomeric, 4 dimeric, 10 trimeric, 33 tetrameric, 102 pentameric, and 350 hexameric) [31,32]. The genome annotation files were used to map the relative positions of these SSRs within intergenic, introns, and CDSs using Krait. However, in most annotation files of cricket genomes, exon and CDS coordinates were entirely identical. We excluded exons and retained CDSs to avoid redundancy.

2.3. Microsatellite Attributes Calculation

We used two metrics for normalizing the SSR frequency to reduce bias from differences in genome size among cricket species: relative abundance and relative density. Relative abundance was defined as the number of microsatellite loci per megabase pair (loci/Mb) of genome sequence, calculated by dividing the total number of microsatellites by the genome size. Relative density was defined as the total microsatellite length in base pairs per megabase pair (bp/Mb) of genome sequence, calculated by dividing the cumulative length of all microsatellites by genome size. P-SSR sequences of cricket species were exported in FASTA format from Krait and analysed to calculate overall GC composition across different genomic regions and P-SSR types using TBtools-II [33]. Additionally, repeat copy numbers (RCN) were converted to repeat lengths and classified into 10 categories: 12–20, 21–30, 31–40, 41–50, 51–60, 61–70, 71–80, 81–90, 91–100, and >100 bp [34]. To analyse variation in repeat copy numbers (RCN) among SSR types and genomic regions, we adapted and extended the method described by Qi et al. [35] given in Supplementary file 1.

2.4. Functional Analysis of CDSs Containing P-SSRs

CDS sequences containing P-SSRs were exported in FASTA format from Krait. These sequences were imported into Galaxy Europe [36] and aligned against the NCBI non-redundant (nr) and SWISS-PROT protein databases. Both databases were downloaded from the NCBI FTP site (https://ftp.ncbi.nlm.nih.gov/blast/db/FASTA/, last updated February 2024) into Galaxy and formatted using Diamond makedb (Galaxy Version 2.0.15+galaxy0). These custom databases were subsequently used for sequence alignments with BLASTX mode in DIAMOND (Galaxy Version 2.0.15+galaxy0) [37], applying a maximum target sequence setting of 1 and an E-value cutoff of 1E-5 [28]. The outputs were generated in blast XML format. BLAST results in blast XML format were imported into Blast2GO Version 6.0.3 [38] for GO term mapping and GO annotation. The sequences with GO numbers were transferred to WEGO Version 2.0 for GO classification [39]. For KEGG analysis, the BLAST results in blast XML format were converted to tabular format using the BLAST XML to Tabular tool (Galaxy Version 2.14.1+galaxy2), and then converted to FASTA format using the Tabular-to-FASTA tool (Galaxy Version 1.1.1). The protein sequences were submitted to GhostKOALA Version 3.1 for KEGG annotation, identifying KEGG Orthology (KO) numbers to enable KEGG pathway mapping [40]. In parallel, eggNOG Mapper Version 5.0.2 (Galaxy Version 2.1.8+galaxy4) was used to annotate Clusters of Orthologous Genes (COGs) and to classify proteins into their functional COG categories [41].

2.5. Statistical Analysis

The data analyses were performed using custom Python scripts leveraging the scipy.stats module of the SciPy library. Spearman’s rank correlation tests were conducted to determine the relationships between genome size and SSR variables, including number, length, relative abundance, and relative density.

3. Results

3.1. Global Characteristics of Microsatellites in Cricket Genomes

The total number of SSRs (including P-SSRs, C-SSRs, and I-SSRs), ranging from 2,350,765 to 3,299,527, were identified in cricket genomes. The overall relative abundance of SSRs ranged from 1365.93 loci/MB in A. domesticus to 1584.53 loci/MB in G. longicercus. The relative density of SSRs ranged from 53658.60 bp/Mb in G. bimaculatus to 72707.59 bp/Mb in G. longicercus. Among all SSR categories, imperfect SSRs (I-SSRs) were the predominant class across genome, intergenic, intron, and CDS regions in all terms (Figure 1). At the genomic scale, I-SSRs constituted the largest proportion in terms of length, ranging from 78.04% to 82.51%, followed by perfect SSRs (P-SSRs) at 13.95% to 17.18%, and compound SSRs (C-SSRs) at 3.54% to 6.51%. SSRs collectively occupied 5.37-7.27% of the cricket genomes (Figure 2), with notably uneven distribution across genomic regions. The abundance of microsatellites (P-SSRs, C-SSRs, and I-SSRs) was high in introns but lower in CDSs. The details of number, length, abundance, density, and portion of three categories of SSRs across genomic regions in cricket genomes are shown in Supplementary Table S2.
The total number of SSRs did not exhibit a statistically significant correlation with genome size (Spearman’s rho = 0.90, P = 0.083). Similarly, no significant correlations were observed between genome size and the number of SSRs in specific categories (P-SSRs, C-SSRs, and I-SSRs). Furthermore, we found no significant correlation between genome size and other SSR metrics, including total length, relative abundance, and relative density (Figure 3). With initial overview on overall SSR landscape in cricket genomes, we next examined the specific distribution patterns of perfect SSRs (P-SSRs), which serve as the most informative markers for comparative and functional analyses.

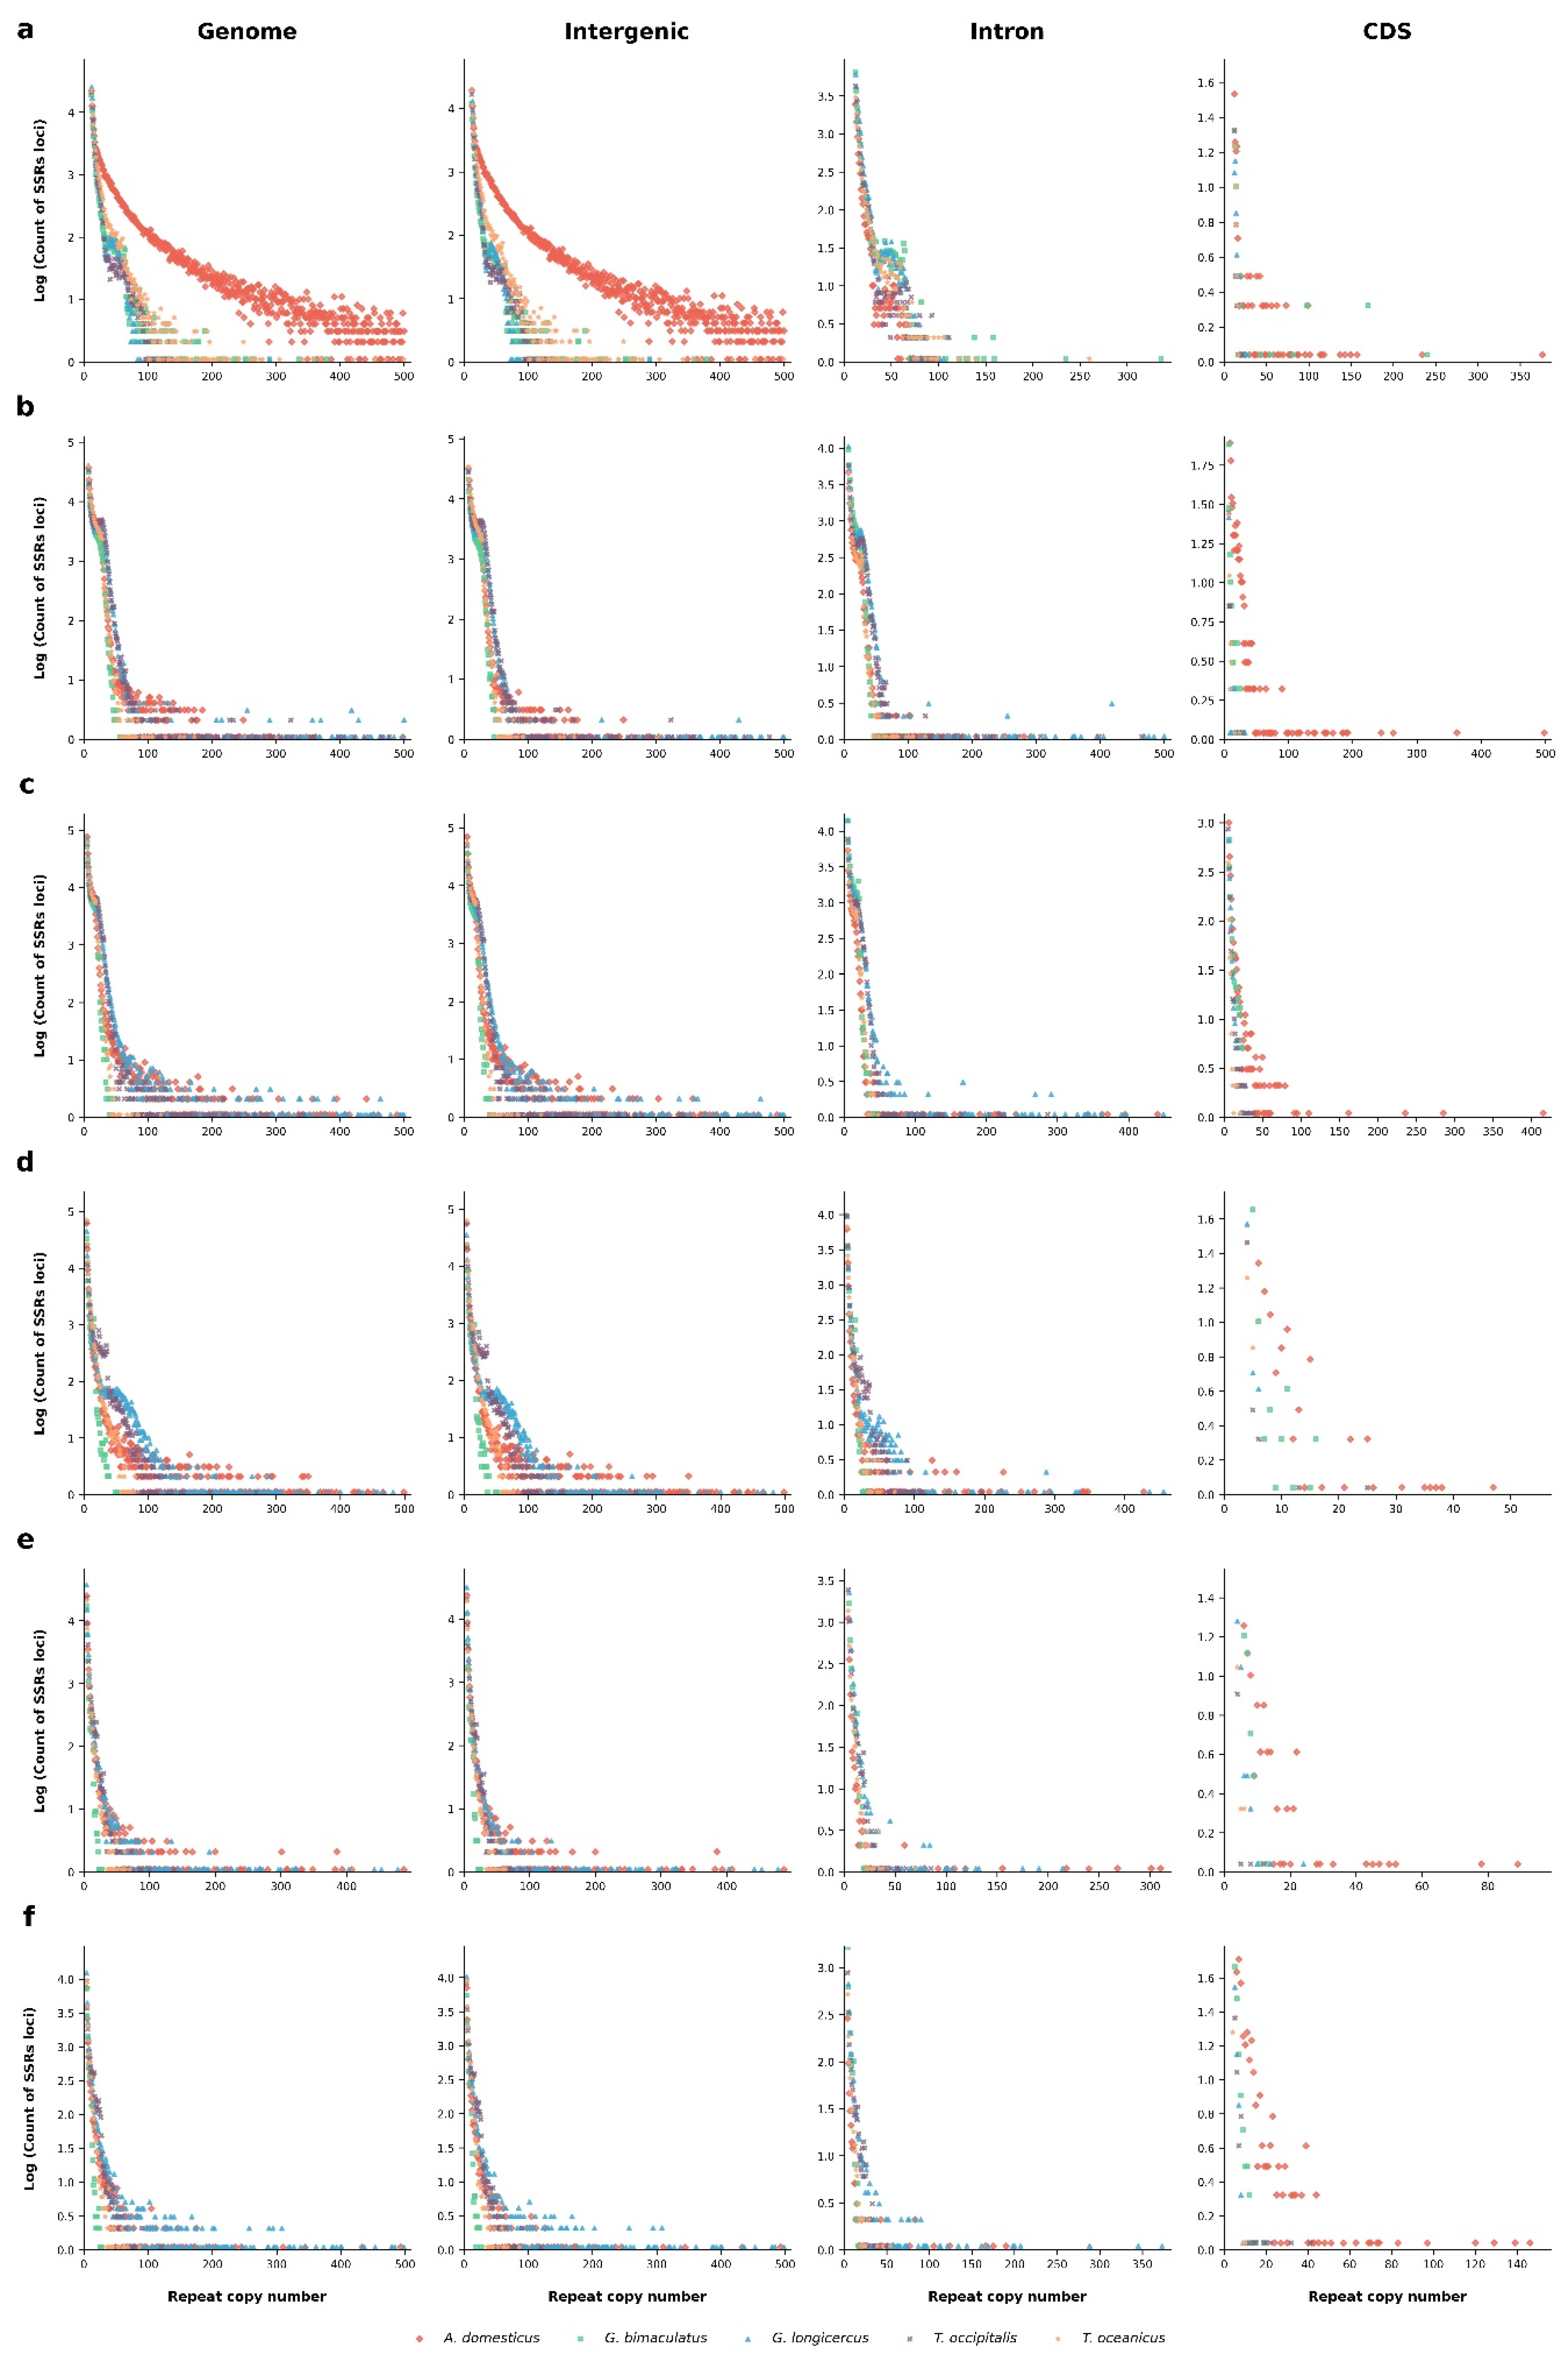
3.2. Distribution Patterns of P-SSRs in Cricket Genomes

The results demonstrated that the most abundant P-SSR types were highly consistent. Trinucleotide repeats were the most common P-SSRs in all cricket genomes (32.46%- 37.95%), followed by di- (25.04%- 28.26%), tetra (12.69%-20.28%), mono- (9.05%- 16.57%), penta- (5.49%- 9.76%), and hexanucleotide repeats (2.1%- 3.72%) (Figure 4). Only A. domesticus that showed mono- higher than tetranucleotide P-SSRs (see Supplementary Table S3). This pattern held across genome-wide and intergenic regions, but shifted dramatically in coding sequences, where trinucleotide repeats comprised 64.19%- 87.89% of all P-SSRs. The patterns of abundant P-SSR types in CDSs also changed, following di- or hexa- > mono-, tetra-, pentanucleotide repeats, although the exact pattern varied among species (Supplementary Table S3). The number, length, abundance, density, and GC content of six types of P-SSRs in genomes are shown in Supplementary Table S4. This compositional shift reflects the distinct selective pressures operating in protein-coding versus non-coding genomic compartments.
Motif analysis revealed compositional differences between genomic regions. Among all motifs across P-SSR types (mono- to hexanucleotides), the (AAT)n motif was constantly predominant in the genomes (15.75%-19.8%), intergenic (15.89%-19.84%), and introns (15.57%-20.29%). However, the next predominant motifs were ambiguous between (AC)n, (A)n, (AG)n, (AT)n in cricket species. Interestingly, the (CCG)n was extremely predominant in all cricket genomes in CDSs (24.79%-51.37%). More interestingly, the next predominant motifs were constantly trinucleotide repeats, such as (AGC)n, (AAG)n, (ACC)n, (ATC)n, excepting A. domesticus which showed (AG)n (Figure 5 and Supplementary Table S5).
Upon examination of microsatellites by SSR types, (A)n mononucleotide motif was the most abundant in genomes, intergenic regions, and introns, except in G. longicercus, where the (C)n motif existed in both the genome and intergenic regions. In CDSs of G. longicercus and A. domesticus, (C)n was also predominant. For dinucleotide repeats, the (AC)n, (AG)n, and (AT)n motifs were most prevalent in the genome and intergenic regions, with (AC)n being the dominant motif in introns. In CDSs, the predominant dinucleotide motifs were (AC)n, (AG)n, and (CG)n. Among trinucleotide repeats, the (AAT)n motif was most abundant in the genome, intergenic regions, and introns, while the (CCG)n motif dominated in CDSs. The (AAAT)n motif was consistently abundant in the genome, intergenic regions, and introns. In contrast, CDSs showed a variety of predominant motifs, including (AAAG)n, (AGGC)n, (CCCG)n, and (AAAT)n. The (CCCG)n motif was consistently the most abundant pentanucleotide repeat in the genome, intergenic regions, and introns, whereas CDSs predominantly featured (AAGAG)n, (CCGCG)n, and (ATCTC)n. For hexanucleotide repeats, (ACCGCC)n and (AGGGCG)n were the most common motifs in the genome, intergenic regions, and introns. However, in CDSs, the profile changed to include (ACCGCC)n, (AAGTCG)n, (CCCCCG)n, (AGCAGG)n, and (CCCGCG)n (see Supplementary Table S6). The distinct motif preferences observed between genomic regions suggested underlying differences in nucleotide composition. To quantify this pattern, we analysed GC content across P-SSR types and genomic regions.

3.3. GC Content of P-SSRs in Different Genomic Regions of Cricket Genomes

To accurately assess P-SSR composition, we calculated GC content from repeat sequences alone (excluding flanking regions). This analysis revealed dramatic compositional differences across genomic regions. Across the examined cricket genomes, the total GC content of P-SSRs (29.61%–35.03%) was relatively low compared to the whole-genome sequences (39.45%–40.32%). However, the GC content in CDS regions (61.42%–79.55%) was considerably higher than in intron (25.64%–34.24%) and intergenic regions (30.07%–35.06%) (Figure 6). When analysed by types of SSRs (mono- to hexanucleotide repeats), genomic GC content varied widely, ranging from 14.83%–47.68% in mononucleotides up to 65.82%–76.47% in pentanucleotides (see Supplementary Figure S1 and Supplementary Table S7). The results indicated that penta- and hexanucleotide P-SSRs consistently exhibited higher GC contents than other P-SSR types across all genomic regions. Specifically, most pentanucleotide P-SSRs exhibited slightly higher GC contents than hexanucleotide P-SSRs across most examined regions. In contrast, the lowest GC contents in non-coding sequences were found in mono-, di-, or trinucleotide P-SSRs, depending on the species. For instance, mononucleotide P-SSRs were lowest in A. domesticus, whereas trinucleotide P-SSRs were lowest in T. occipitalis. Interestingly, a distinct compositional shift occurred in coding sequences. While mono- to trinucleotide repeats maintained low GC levels in intergenic and intron regions, CDSs displayed a sharp increase in GC content for these types. Most notably, CDS trinucleotide repeats reached GC levels of 61.46% to 79.05%, more than double the values observed in intergenic and introns.

3.4. Analysis of the Coefficient of Variability (CV) of P-SSRs

The distribution of P-SSRs based on repeat copy numbers (RCNs) across different P-SSR types in the cricket genomes is illustrated in Figure 7. Overall, the scatter plots showed that the number of SSR loci progressively decreased as the RCN increased. When comparing the number of RCNs in the same type across genomic regions, P-SSRs loci located in CDS regions mostly exhibited lower count than those found in intergenic and intron regions for SSRs of the same types. To better assess this distribution, we categorized the repeat lengths into 10 groups (see supplementary Table S8). Our analysis revealed that lower repeat length groups were predominantly represented across all genomic regions. For example, mononucleotide P-SSRs with lengths ranging from 12 to 20 copies accounted for approximately 55.15% to 91.27% of all mononucleotide SSRs in the examined genomes. Interestingly, A. domesticus exhibited an exceptionally high maximum RCN, with a mononucleotide P-SSR reaching 66,394 copies. In contrast, the highest RCNs observed in the other cricket species ranged from 142 to 2,826 copies. Additionally, a similar trend was observed in trinucleotide P-SSRs within the CDS regions, where A. domesticus had a maximum RCN of 1,957, while other species ranged from 21 to 38 (see supplementary Table S9).
To further assess the variation in repeat lengths, we calculated the coefficient of variation (CV) of repeat copy numbers (RCNs) for each P-SSR type, revealing species-specific differences in microsatellite length variability (see Supplementary Table S10 and Supplementary Figure S2). For example, the CV of mononucleotide repeats ranged broadly from 42.83% in G. longicercus to 842.61% in A. domesticus. The average and standard deviation of CVs for mono- to hexanucleotide P-SSRs across different genomic regions are presented in Figure 8. The trend lines for the genome and intergenic regions exhibited similar patterns, while distinct variation trends were observed in intron and CDS regions. Specifically, the highest CVs were associated with mononucleotide repeats in the genome and intergenic regions, tetranucleotide repeats in introns, and trinucleotide repeats in CDS regions. To understand the potential biological significance of coding region microsatellites, we performed comprehensive functional annotation of genes containing P-SSRs.

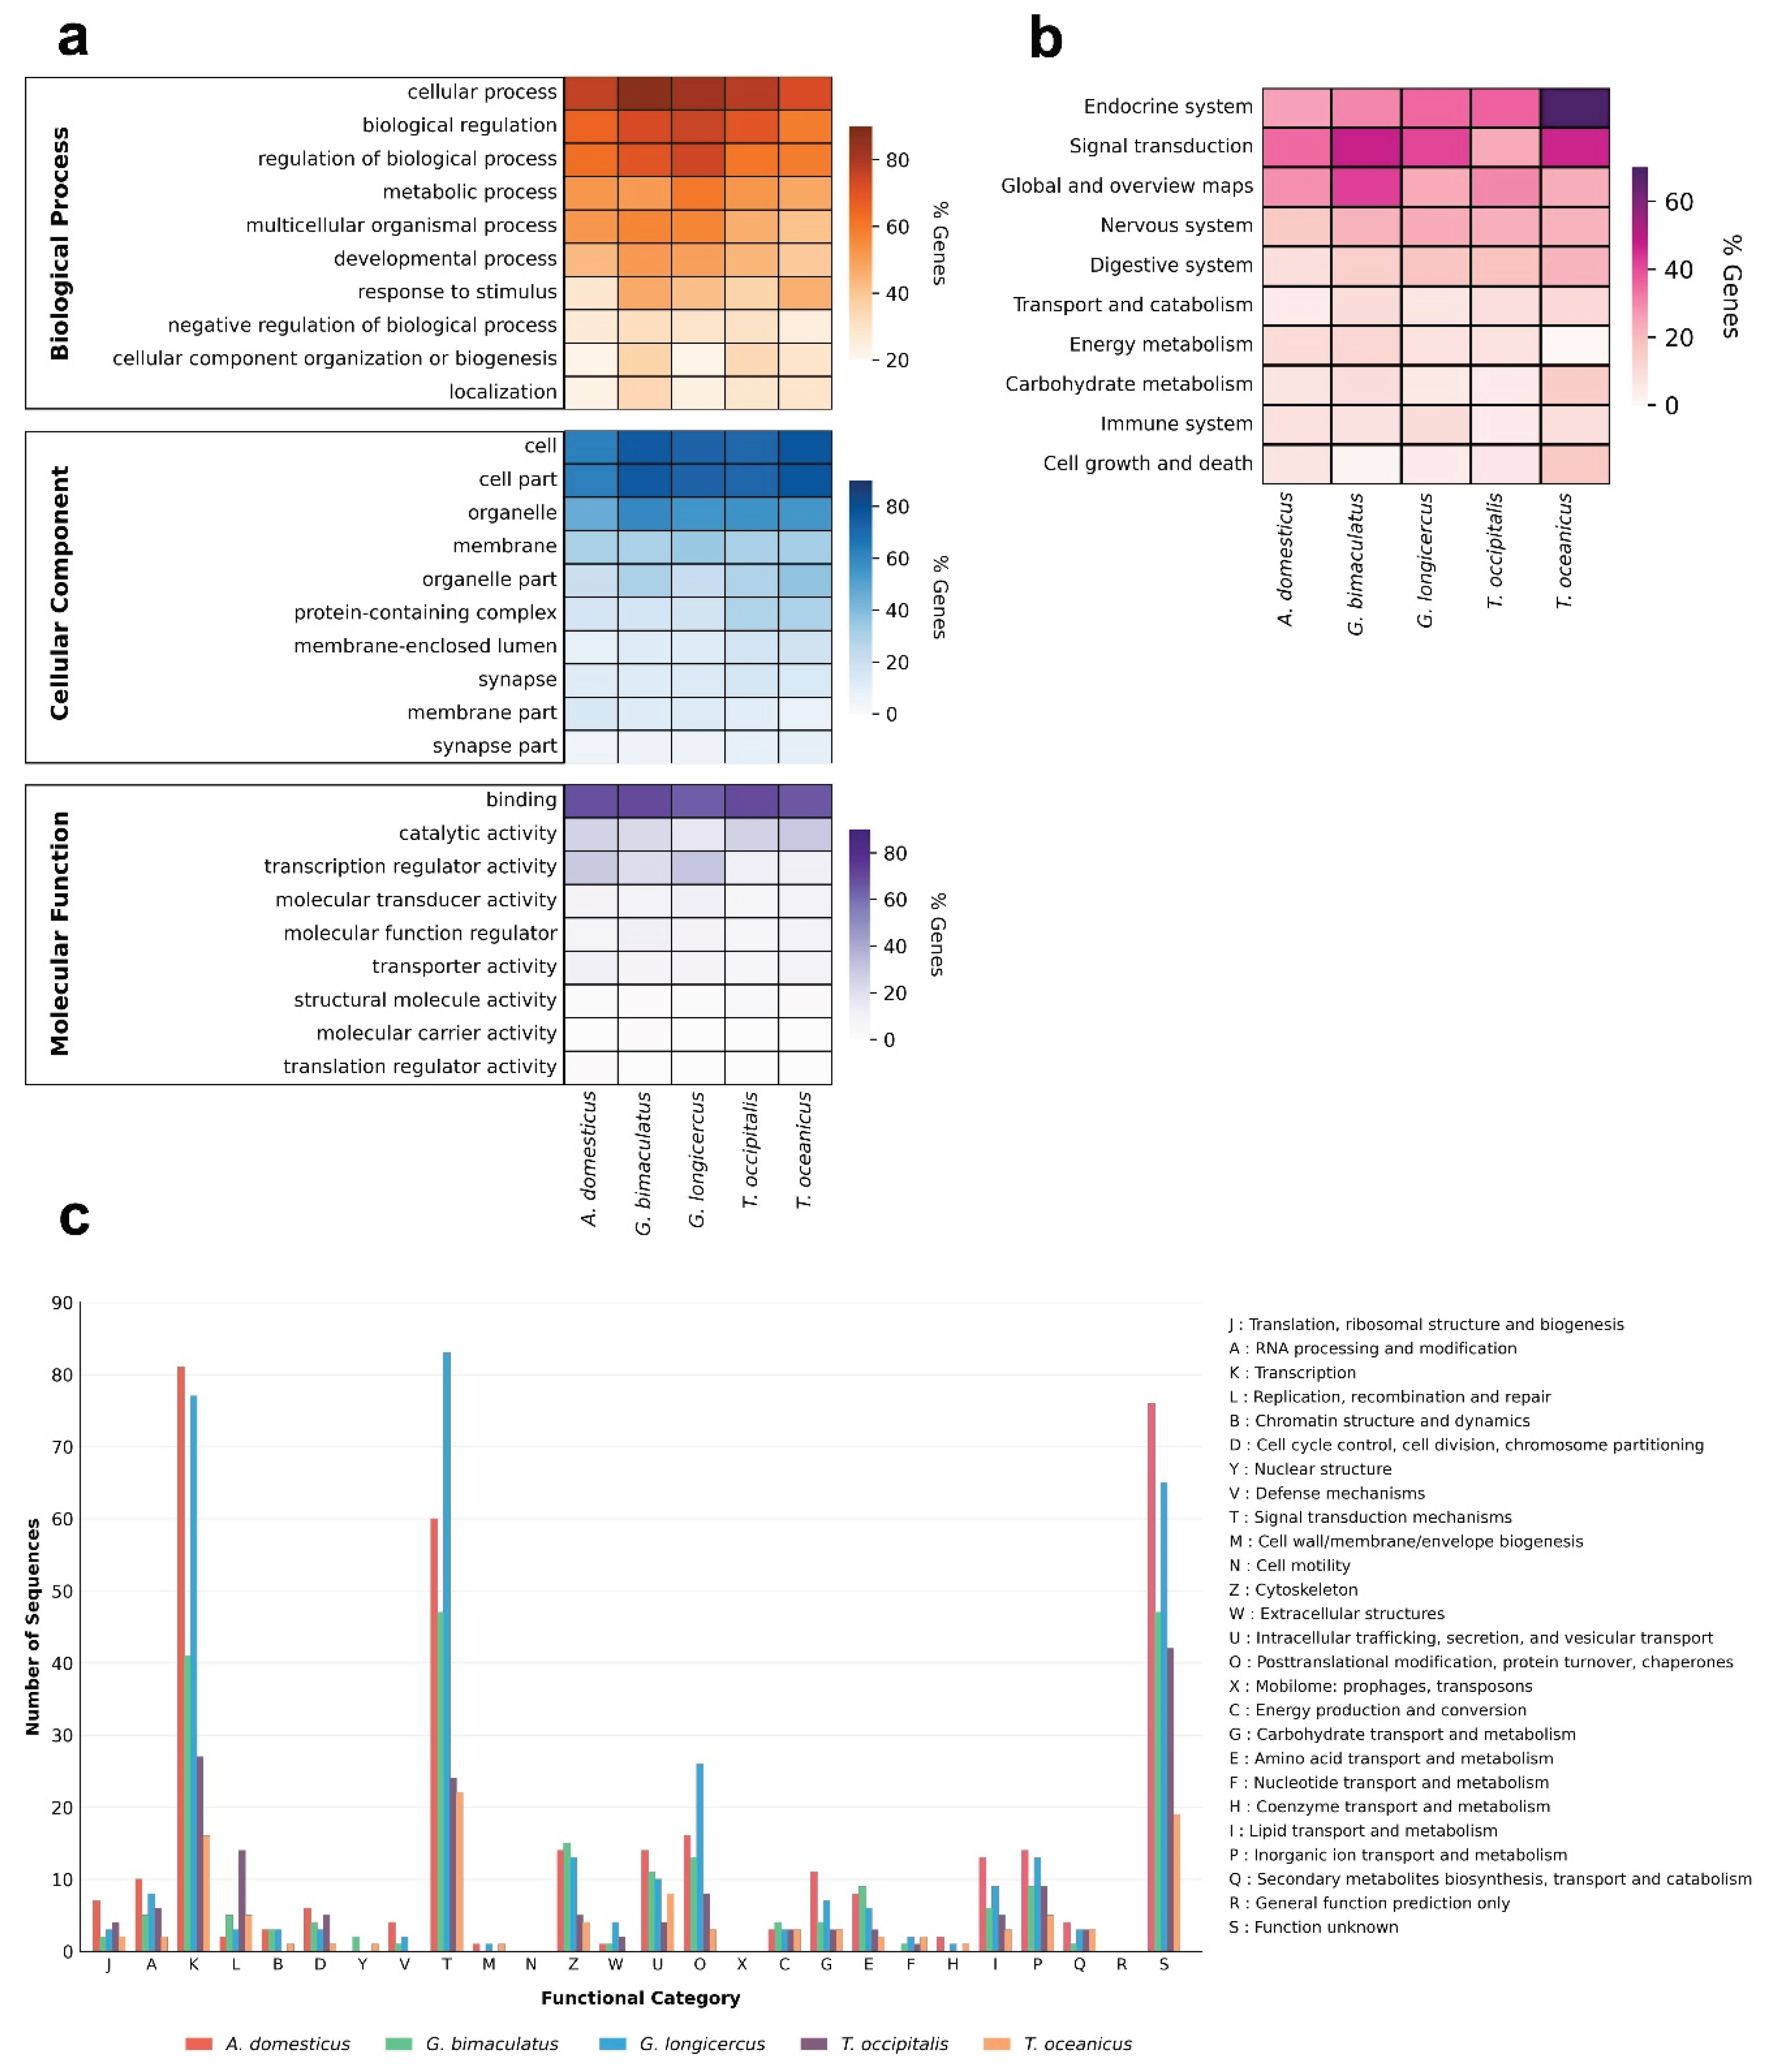
3.5. Functional Analysis of CDSs with P-SSRs in Cricket Genomes

The functional categories of the CDSs containing P-SSRs are presented in Figure 9. In total, 107 (A. domesticus), 70 (G. bimaculatus), 98 (G. longicercus), 59 (T. occipitalis), 44 (T. oceanicus) of annotated CDSs with SSRs were assigned to 264 (A. domesticus), 191 (G. bimaculatus), 255 (G. longicercus), 149 (T. occipitalis), 108 (T. oceanicus) Gene Ontology (GO) terms of known function. In the biological process group, there were 25 subgroups, among which “cellular process”, “biological regulation”, and “regulation of biological process” were the dominant functional categories involving the most genes. For the cellular component group, there were 19 subgroups, among which “cell”, “cell part”, and “organelle” were the dominant functional categories involving the most genes. Fourteen subgroups constituted the molecular function group, the “binding” was the dominant functional category involving the most genes. Kyoto Encyclopedia of Genes and Genomes (KEGG) pathway analysis demonstrated 141 (A. domesticus), 129 (G. bimaculatus), 124 (G. longicercus), 80 (T. occipitalis), 56 (T. oceanicus) of annotated CDSs with SSRs were observed KO number. These KEGG pathways were predominantly annotated to “signal transduction” of environmental information processing categories, “endocrine system” of organismal systems categories, and “Global and overview maps” of metabolism categories. Additionally, Clusters of Orthologous Genes (COGs) function classification showed “transcription” and “signal transduction mechanisms” were the dominant functional categories involving the most genes.

4. Discussion

The comprehensive characterization of microsatellites across five cricket genomes revealed several key patterns that address fundamental questions about SSR evolution and function in insects. Our findings provide the first family-level perspective on microsatellite organization in Orthoptera, revealing both conserved patterns shared with other taxa and cricket-specific characteristics that reflect unique evolutionary pressures.

4.1. The Number of Microsatellites

Our findings demonstrated similar patterns of predominant SSR classes (I-SSRs > P-SSRs > C-SSRs) in the genomes of different lineages, including beetles [21], reptiles [27], and Euarchontoglires [27], birds [25]. The high prevalence of I-SSRs contributes to the substantial overall SSR coverage in cricket genomes (5.37%-7.27%). This proportion is comparable to values found in beetles (1.69%-7.23%) [21], reptiles (2.55%–8.19%) [27], and Euarchontoglires (3.19%–9.87%) [27], but exceeds the range reported for insect genomes (0.02%–3.1%, using different criteria) [22]. I-SSRs were formed by point mutations (insertions, deletions, and substitutions) within the perfect motifs, resulting in a lower mutation rate compared to P-SSRs [42]. The prevalence of I-SSRs in cricket genomes likely serves as a structural adaptation to moderate the rapid mutational pressure of P-SSRs, thereby preventing frameshift mutations and maintaining stability within CDS [28]. Besides maintaining genomic integrity, I-SSRs function as dynamic regulatory modules. As seen in the SLC11A1 promoter, these imperfect motifs are capable of modulating chromatin structure, making protein-binding anchors that allow for control transcription [43].
Our analysis revealed a strong positive correlation between total SSR number and genome size (Spearman’s rho = 0.90), although this relationship did not reach statistical significance (P = 0.083), likely due to the limited number of species examined. Similarly, no significant correlations were observed between genome size and total SSR length, relative abundance, or relative density. These findings position crickets within a complex landscape of genomic evolution. While we observed a strong positive trend for SSR numbers, statistically significant positive correlations have been confirmed in many other animal lineages [21,27,28,44,45,46]. This suggests that while SSR expansion often associated with genome enlargement, the statistical strength of this relationship can vary depending on the taxon and sample size. Regarding SSR length, our results in crickets show no correlation with genome size and align with findings in reptiles [27], but differ from beetles and Euarchontoglires [21,28], where positive correlations were observed. Furthermore, the relationship between genome size and relative abundance or density remains highly taxon-specific. In crickets, the lack of a significant correlation indicates that SSR density and abundance do not increase proportionally as the genome expands. This pattern aligns with reports in several other lineages [21,26,28,44]. In contrast, negative correlations reported elsewhere suggest that genome expansion in some taxa dilutes SSR density rather than maintaining it [27,45,46].
Several limitations should be noted. Although previous studies employed similar criteria for SSR detection, using variations in mining tools, parameter settings, and algorithms can significantly influence the outcomes, potentially confounding the relationship between SSRs and genome size variation. In addition, genome assembly quality can also influence misidentification or inaccurate profiling of repetitive sequences, as it is affected by sequencing errors, misalignments, and insufficient coverage, which may result in gaps, assembly errors, or incomplete haplotype representation [47]. However, we believe that genome size in eukaryotes is generally more closely associated with the amount of repetitive DNA rather than the number of coding genes [28,48].

4.2. The Characteristic of P-SSRs

Having established the quantitative relationships between SSRs and genome size, we next examined whether the qualitative characteristics of microsatellites, their types, motifs, and distributions show similar patterns of conservation or divergence across cricket species. The analysis of P-SSRs provides the most informative window into these evolutionary patterns, as their precise repeat structure allows for detailed comparative analysis.
The consistent dominance of trinucleotide repeats across all cricket genomes (32.46%-37.95%) contrasts markedly with the heterogeneity observed in beetle species, where the most abundant P-SSR types varied from monomeric to tetrameric repeats [21]. This conservation suggests that cricket genomes may have experienced similar evolutionary pressures that favor trinucleotide repeat accumulation, representing a potential family-level characteristic within Gryllidae. In different criteria, mono- to trinucleotide SSRs are dominant in mosquitoes [49], and di- and trinucleotide in insects [22]. At this point, heterogeneity in the most abundant P-SSRs has been suggested as a common characteristic among insects [21]. In contrast, our results demonstrate that distribution patterns of cricket genomes are probably conserved within the family. Likewise, mononucleotide SSRs are frequently reported as the most abundant type in mammals; including Euarchontoglires and primates (except some rodents and lagomorphs) [28,50], yak [51], camelids [45], macaques [46], forest musk deer [52], most bird species [25], reptiles (except squamates) [27]. However, we cannot explicitly conclude that trinucleotide is the most abundant in all cricket species due to most cricket genomes have not been sequenced, and limitation of sample size. In cricket CDS, identically, trinucleotide SSRs were predominant SSR type corresponding to a widely observed characteristic across diverse animal taxa [21,27,28,35,45,52]. These findings provide evidence that trinucleotide SSRs are preferentially maintained in coding sequences (CDSs), likely due to selective pressure against non-trimeric repeats that can induce frameshift mutations [53]. Moreover, the differing proportion of trinucleotide repeats between CDSs and other genomic regions of crickets highlights the role of selective pressure in preserving protein-coding integrity and potentially facilitating adaptive evolution.
Beyond repeat type preferences, the distribution of specific motifs across different genomic regions reveals the relation between mutational processes and selective constraints that shape microsatellite landscapes. The striking contrast between (AAT)n dominance in non-coding regions and (CCG)n prevalence in coding sequences reflects the fundamental dichotomy in selective pressures operating across genomic compartments. This regional specialization extends beyond simple motif preferences to encompass broader compositional and structural characteristics that distinguish coding from non-coding microsatellites. Our findings correspond to previous suggestions that most SSRs motif in insect genomes consist of AT-rich bases [22], and SSRs preferred (A/T)n to (G/C)n in the Eukaryotic genomes [54]. Such common can be seen from the predominance of (A/T)n motifs in mononucleotide SSRs across various species [25,44,45,49,50,51]. In CDSs, (CCG)n motif consistently predominated in cricket species. Remarkably, (CCG)n was often frequent motif in many animal taxa [21,27,28,52]. Our results support that the distribution of SSR motifs in different genomic regions is non-random (especially in the CDS), including some bias towards specific nucleotide motifs in different genomic regions [21,55]. The observed motif preference suggests that the expansion of these SSRs is not merely a result of biased mutation pressure, but rather a product of positive selection for their functional roles in protein architecture. The high abundance of trinucleotide repeats (especially, CCG, CGC, CGG, GCC, GCG, GGC) in CDSs is likely driven by the proteomic requirement for specific amino acid homopolymers. Codon mapping indicates that these motifs translate directly into Poly-Proline (CCG), Poly-Alanine (GCC, GCG), Poly-Glycine (GGC), and Poly-Arginine (CGC, CGG). Biologically, these repeats serve distinct architectural functions: Poly-Proline tracts serve as rigid docking sites for signalling complexes [56]; Poly-Alanine domains can modulate transcriptional activity through specific protein–protein and protein–DNA interactions [57,58]; Poly-Glycine provides flexible linkers for multi-domain protein function [59]; and Poly-Arginine tracts suggest a role in facilitating stabilize RNA-protein interactions and liquid-liquid phase separation, mechanisms essential for cellular organization and gene regulation [60]. To explore this functional connection, we conducted additional codon-usage analysis on CDSs containing SSRs (excluding flanking regions). This analysis revealed that alanine (Ala) and arginine (Arg) were consistently the more predominant than any other amino acids across all cricket species (see Supplementary Table S11 and Supplementary Figure S4).
The contrasting SSR motif compositions of cricket genomes are reflected in GC content, which is lower in intergenic or intron compared to CDSs, consistent with previous studies in most eukaryotic genomes [21,25,27,35,45,52,61]. The low GC content of P-SSRs in non-coding regions has been suggested to be due to Poly(A) repeats may occur from mRNA insertions and the activity of AT-rich elements like retrotransposons and pseudogenes [25,62,63,64]. One key mechanism behind the prevalence of AT-rich repeats might be the deamination of methylated cytosines (C-to-T mutations), which converts GC base pairs into AT base pairs [49,65]. Furthermore, the relatively low melting temperature of AT-rich regions facilitates strand separation during DNA replication, increasing the likelihood of replication slippage and further amplifying AT content over time [50,61]. GC-rich SSRs are often more abundant in coding regions (CDSs) than in non-coding regions, which caused by the abundance of (CCG)n motifs. This is another piece of evidence indicating CDSs had strong selective pressure from other regions. The motif preferences observed across genomic regions suggested underlying compositional differences that warranted quantitative analysis. GC content analysis provided a direct measure of these compositional shifts and their potential functional significance.
Our analysis of P-SSR composition revealed that penta- and hexanucleotide motifs consistently possessed higher GC contents than other P-SSR types. This pattern aligns with observations in beetles [21] and birds [25], where penta- and hexanucleotide repeats were also identified as having the highest GC contents among all P-SSR types. Similarly, hexanucleotide P-SSRs have been reported to hold the highest GC content in some Euarchontoglires [28] and reptiles [27]. However, this trend is not universal across all taxa. The highest GC content is found in trinucleotide repeats in bovids [44], and mosquitoes [49], whereas dinucleotide repeats exhibit the highest values in some Euarchontoglires [28], macaques [46], and camelids [45]. In contrast to the consistency observed for the highest GC values, there was no consensus for the lowest GC content in crickets, which varied among mono-, di-, and trinucleotides. This differs from many other animal lineages, where mononucleotide P-SSRs typically show the lowest GC content [21,25,28,44,45,46]. However, exceptions occur in reptiles [27] and certain birds [25], which exhibit the lowest GC content in tetranucleotide and dinucleotide repeats, respectively. While we found a clear consensus for the highest GC values in P-SSR types (penta- and hexa-) across all cricket species, the patterns for the lowest GC values remained variable. This lack of a uniform minimum P-SSR types suggests that while the expansion of long GC-rich P-SSR types is a conserved feature, the selective constraints on shorter P-SSR types (mono- through trinucleotides) are likely evolving independently across different cricket species. The compositional differences revealed by GC content analysis reflect deeper structural variability in microsatellite organization. To quantify this variability and its potential evolutionary implications, we examined repeat copy number distributions and their coefficient of variation across genomic regions and cricket species.
As expected, our results revealed that the frequency of P-SSRs decreased with increasing RCNs, consistent with previous studies in various animal genomes [21,25,28,30,35,45,46,52]. This trend reflects a general preference for shorter repeat length in base pairs as observed in mosquitoes [49]. Additionally, P-SSRs located in coding regions generally exhibited lower RCNs compared to those in introns and the overall genome, suggesting greater microsatellite variability in noncoding regions. Interestingly, A. domesticus exhibited exceptionally high RCNs compared to the other cricket species. The genome harboured a mononucleotide P-SSR with up to 66,394 copies and a trinucleotide P-SSR with 1,957 copies in CDS regions, both values being significantly higher than those observed in the other crickets. Such anomalies are rare and may result from imperfections in genome assembly or annotation quality, rather than representing true biological features.
As a result, we conducted a CV analysis for each cricket species and additionally excluded the A. domesticus genome from the calculation of average CV values (see Supplementary Figure S3). This exclusion had a notable impact on the overall statistics, particularly evident in the marked reduction in both the mean and standard deviation of mononucleotide P-SSRs in the whole genome and trinucleotide P-SSRs in CDS regions. Although similar patterns in CVs have been previously reported in bovids [35], our analysis revealed the large interspecific variation of RCN patterns, consistent with observations in beetles [21], birds [25], and Euarchontoglires [28]. One possible explanation is that the CVs of RCNs for P-SSRs may be taxon-specific [21]. However, other factors such as sampling strategies, sample sizes, and especially the quality and level of genome assembly could also considerably influence these patterns. Interspecific differences in the CVs of P-SSRs may generate functional variability and could reflect fundamental genomic and regulatory differences among organisms [28]. Previous study has shown that SSR expansions can influence complex traits, such as height and intelligence in humans, through modulation of proximal gene expression [66]. Furthermore, a recent study in Pacific white shrimp demonstrated that the variation in SSR copy numbers within the cytokinesis protein 7-like gene can modulate its expression, contributing to differences in body weight [67]. The distinct structural and compositional characteristics of microsatellites in coding regions suggest potential functional roles that extend beyond their utility as neutral markers. To explore this functional dimension, we conducted comprehensive annotation of genes harbouring coding region P-SSRs.

4.3. Potential Function of CDSs Containing P-SSRs

The functional annotation of SSR-containing genes revealed a preferential distribution across biological processes, suggesting that microsatellites within coding regions may contribute to specific cellular functions rather than representing neutral evolutionary debris. GO analysis demonstrated that CDS harbouring P-SSRs were predominantly associated with genes involved in cell, organelle, cellular process, biological regulation, regulation of biological process, and binding. These findings are consistent with previous studies [21,23,30,68], suggesting that they play a role in cellular activities, cellular structures, regulatory mechanisms, and interactions with molecules like DNA, RNA, or various proteins [69]. Additionally, KEGG pathway annotation revealed that CDS containing P-SSRs are involved in signal transduction, endocrine system, and global metabolic processes, corresponding to previous finding [23]. These functions suggest roles in broad metabolic regulation, hormone production and secretion, as well as signal transmission involved in biological responses such as growth, development, and immunity [70]. The result from COGs analysis supports such GO and KEGG analysis, particularly highlighting categories in transcription and signal transduction mechanisms. These involve the process of transcribing DNA into RNA and cellular signalling pathways that enable cells to detect and respond to stimuli [71].
Overall, genes harbouring coding SSRs in our study are predominantly involved in regulatory and signalling functions. This pattern is consistent with the broad consensus that microsatellites within coding regions can mediate protein-protein interactions by encoding unstructured, hydrophilic loops that protrude from the protein surface and function as interaction domains [72]. Previous research has shown that CAG repeats encoding polyglutamine can contribute to transcriptional control, phosphatidylinositol signalling, protein degradation, and chromatin remodelling [73]. In addition, SSR-encoded threonine–glycine (Thr-Gly) repeats within the period clock gene of Drosophila melanogaster help maintain circadian periodicity across different temperatures [74,75]. However, the molecular mechanisms by which many other SSR-encoded repeats influence protein function remain unclear in many species. While the current evidence is predictive and has not been experimentally validated, computational surveys across diverse taxa hint that coding SSRs in cricket might similarly influence environmental adaptation in beetles and snow leopard [21,30], and selective synthesis of specific proteins in reptiles and Euarchontoglires [27,28]. In Gryllidae, the over-representation of SSR-containing genes in signalling and endocrine pathways is particularly noteworthy given ongoing efforts to domesticate and improve crickets as both model organisms and edible insects. These genes represent promising candidates for future work linking microsatellite variation to traits such as growth efficiency, feed conversion, and stress resilience, traits that are central to the sustainable use of crickets in food and feed production.
The patterns observed in cricket microsatellites reflect a complex interplay between universal evolutionary forces and taxon-specific constraints. The consistent trinucleotide dominance and specific motif preferences suggest cricket-specific evolutionary trajectories. Several important limitations shape the interpretation of our findings, while representing the best available genomic resources for Gryllidae, limits our ability to generalize patterns across the entire cricket family. Additionally, variation in genome assembly quality, particularly the exceptional repeat copy numbers observed in A. domesticus, limits the ongoing challenges in accurately characterizing repetitive elements through current sequencing technologies. These findings highlight the importance of family-level studies in understanding how microsatellite evolution varies across taxonomic scales, particularly in economically and ecologically important insect groups.

5. Conclusions

This comprehensive genome-wide survey represents the first family-level characterization of microsatellites in crickets, providing both immediate insights into Gryllidae genome organization and a foundation for future comparative studies in Orthoptera. While total SSR numbers showed a strong positive trend with genome size (Spearman's rho = 0.90, P = 0.083), this relationship did not reach statistical significance, likely due to the limited sample size. The most abundant SSR types and motifs were largely conserved at the family level, consistent with patterns observed in other insects. Microsatellites were predominantly distributed in non-coding regions, with distinct patterns compared to coding regions. Functional enrichment of SSR-containing genes in binding, signal transduction, and transcription pathways supports the hypothesis that coding microsatellites are not merely neutral markers but functional elements contributing to regulatory flexibility and adaptive evolution. Future research should prioritize linking specific SSR variants to quantitative traits, validating their regulatory impacts through functional genomics, and leveraging marker-assisted selection to accelerate the domestication and optimization of cricket strains for both research and sustainable agriculture.

Supplementary Materials

Supplementary Materials: The following supporting information can be downloaded at the website of this paper posted on Preprints.org. Figure S1: the GC content (%) of Mono- to Hexanucleotide P-SSR across genomic regions in the cricket genomes; Figure S2: coefficient of variation (CV) analysis of RCNs of P-SSRs across genomic regions in species-specific patterns of crickets; Figure S3: coefficient of variation (CV) analysis of RCNs of P-SSRs across genomic regions in four cricket species (excluding A. domesticus); Figure S4: total codon usage of P-SSRs within CDSs (excluding flanking sequences) in five cricket species (a) A. domesticus, (b) G. bimaculatus, (c) G. longicercus, (d) T. occipitalis, (e) T. oceanicus; Table S1: genome information of five cricket species; Table S2: the number, length, abundance, density, and portion of three categories of SSR (P-SSR, C-SSR, and I-SSR) across genomic regions in cricket genomes; Table S3: the abundance ratio (in percentage) of Mono- to Hexa nucleotide P-SSR in the cricket genomes; Table S4: the number, length, abundance, density, and GC content of six types of P-SSR in genomes; Table S5: the most abundant P-SSR motifs across genomic regions; Table S6: the most abundance of SSR motifs in different SSR types (the percentages were calculated each SSR type); Table S7: the GC content (%) of Mono- to Hexanucleotide P-SSR in the cricket genomes; Table S8: repeat length categories (in base pairs) of distinct P-SSR types across genomes of cricket species; Table S9: the maximum RCNs of P-SSR in cricket genomes across genomic regions; Table S10: coefficient of variation (CV), mean, and standard deviation analysis of RCNs of P-SSRs across genomic regions in cricket species.; Table S11: frequency, total usage, relative usage values of codon on CDSs containing SSRs in five cricket species; file S1: calculating variation in repeat copy numbers (RCN) among SSR types and genomic regions.

Author Contributions

Conceptualization, K.P. and Y.M.G.; methodology, K.P., Y.M.G., and S.H.; validation, Y.M.G. and S.H.; formal analysis, K.P.; investigation, Y.M.G. and S.H.; data curation, K.P.; writing—original draft preparation, K.P.; writing—review and editing, Y.M.G. and S.H.; visualization, K.P.; supervision, Y.M.G.; project administration, Y.M.G. and S.H.; funding acquisition, Y.M.G. and S.H. All authors have read and agreed to the published version of the manuscript.

Funding

This research was supported by the Department of Biology, Faculty of Science, Naresuan University, Thailand (Grant No. R2568B018) and partially supported by the Global and Frontier Research University Fund, Naresuan University (Grant No. R2566C051).

Data Availability Statement

The original contributions presented in this study are included in the article/Supplementary Materials. Further inquiries can be directed to the corresponding author.

Acknowledgments

We would like to thank our fellow lab members at Department of Biology, Faculty of Science, Naresuan University for their collaboration and assistance with various aspects of the research. We are also grateful to Associate Professor Dr. Kosuke Kataoka and team for advice and support in cricket genomic data, and Assistant Professor Dr. Sompop Pinit for his guidance on the functional analysis.

Conflicts of Interest

The authors declare no competing interests.

References

  1. Tóth, G.; Gáspári, Z.; Jurka, J. Microsatellites in different eukaryotic genomes: survey and analysis. Genome Res. 2000, 10, 967–981. [Google Scholar] [CrossRef]
  2. Bhargava, A.; Fuentes, F.F. Mutational Dynamics of Microsatellites. Mol. Biotechnol. 2010, 44, 250–266. [Google Scholar] [CrossRef]
  3. Chistiakov, D.A.; Hellemans, B.; Volckaert, F.A.M. Microsatellites and their genomic distribution, evolution, function and applications: A review with special reference to fish genetics. Aquaculture 2006, 255, 1–29. [Google Scholar] [CrossRef]
  4. Li, Y.C.; Korol, A.B.; Fahima, T.; Beiles, A.; Nevo, E. Microsatellites: genomic distribution, putative functions and mutational mechanisms: a review. Mol. Ecol. 2002, 11, 2453–2465. [Google Scholar] [CrossRef] [PubMed]
  5. Li, Y.-C.; Korol, A.B.; Fahima, T.; Nevo, E. Microsatellites Within Genes: Structure, Function, and Evolution. Mol. Biol. Evol. 2004, 21, 991–1007. [Google Scholar] [CrossRef] [PubMed]
  6. Brouwer, J.R.; Willemsen, R.; Oostra, B.A. Microsatellite repeat instability and neurological disease. Bioessays 2009, 31, 71–83. [Google Scholar] [CrossRef] [PubMed]
  7. Gelsomino, F.; Barbolini, M.; Spallanzani, A.; Pugliese, G.; Cascinu, S. The evolving role of microsatellite instability in colorectal cancer: A review. Cancer Treat. Rev. 2016, 51, 19–26. [Google Scholar] [CrossRef]
  8. Kataoka, K.; Togawa, Y.; Sanno, R.; Asahi, T.; Yura, K. Dissecting cricket genomes for the advancement of entomology and entomophagy. Biophys. Rev. 2022, 14, 75–97. [Google Scholar] [CrossRef]
  9. Donoughe, S.; Extavour, C.G. Embryonic development of the cricket Gryllus bimaculatus. Dev. Biol. 2016, 411, 140–156. [Google Scholar] [CrossRef]
  10. Cayre, M.; Scotto-Lomassese, S.; Malaterre, J.; Strambi, C.; Strambi, A. Understanding the Regulation and Function of Adult Neurogenesis: Contribution from an Insect Model, the House Cricket. Chem. Senses 2007, 32, 385–395. [Google Scholar] [CrossRef]
  11. Pascoal, S.; Cezard, T.; Eik-Nes, A.; Gharbi, K.; Majewska, J.; Payne, E.; Ritchie, Michael G.; Zuk, M.; Bailey, Nathan W. Rapid Convergent Evolution in Wild Crickets. Curr. Biol. 2014, 24, 1369–1374. [Google Scholar] [CrossRef]
  12. Moriyama, Y.; Sakamoto, T.; Karpova, S.G.; Matsumoto, A.; Noji, S.; Tomioka, K. RNA Interference of the Clock Gene period Disrupts Circadian Rhythms in the Cricket Gryllus bimaculatus. J. Biol. Rhythms 2008, 23, 308–318. [Google Scholar] [CrossRef]
  13. Mitchaothai, J.; Grabowski, N.T.; Lertpatarakomol, R.; Trairatapiwan, T.; Chhay, T.; Keo, S.; Lukkananukool, A. Production Performance and Nutrient Conversion Efficiency of Field Cricket (Gryllus bimaculatus) in Mass-Rearing Conditions. Animals 2022, 12, 2263. [Google Scholar] [CrossRef]
  14. Akiyama, D.; Kaewplik, T.; Fujisawa, T.; Kurosu, T.; Sasaki, Y. Crickets (Gryllus Bimaculatus) using food waste usefulness of self-selection feed design method through each growth stage. J. Insects Food Feed 2023, 10, 247–258. [Google Scholar] [CrossRef]
  15. Magara, H.J.O.; Niassy, S.; Ayieko, M.A.; Mukundamago, M.; Egonyu, J.P.; Tanga, C.M.; Kimathi, E.K.; Ongere, J.O.; Fiaboe, K.K.M.; Hugel, S.; et al. Edible Crickets (Orthoptera) Around the World: Distribution, Nutritional Value, and Other Benefits—A Review. Front. Nutr. 2021, 7. [Google Scholar] [CrossRef]
  16. Tang, C.; Yang, D.; Liao, H.; Sun, H.; Liu, C.; Wei, L.; Li, F. Edible insects as a food source: a review. Food Prod. Process. Nutr. 2019, 1, 8. [Google Scholar] [CrossRef]
  17. Sharma, P.C.; Grover, A.; Kahl, G. Mining microsatellites in eukaryotic genomes. Trends Biotechnol. 2007, 25, 490–498. [Google Scholar] [CrossRef] [PubMed]
  18. Merkel, A.; Gemmell, N. Detecting short tandem repeats from genome data: opening the software black box. Briefings in Bioinformatics 2008, 9, 355–366. [Google Scholar] [CrossRef]
  19. Grover, A.; Aishwarya, V.; Sharma, P.C. Searching microsatellites in DNA sequences: approaches used and tools developed. Physiol. Mol. Biol. Plants 2012, 18, 11–19. [Google Scholar] [CrossRef]
  20. Srivastava, S.; Avvaru, A.K.; Sowpati, D.T.; Mishra, R.K. Patterns of microsatellite distribution across eukaryotic genomes. BMC Genomics 2019, 20, 153. [Google Scholar] [CrossRef]
  21. Song, X.; Yang, T.; Yan, X.; Zheng, F.; Xu, X.; Zhou, C. Comparison of microsatellite distribution patterns in twenty-nine beetle genomes. Gene 2020, 757, 144919. [Google Scholar] [CrossRef]
  22. Ding, S.; Wang, S.; He, K.; Jiang, M.; Li, F. Large-scale analysis reveals that the genome features of simple sequence repeats are generally conserved at the family level in insects. BMC Genomics 2017, 18, 848. [Google Scholar] [CrossRef]
  23. Liu, W.; Xu, Y.; Li, Z.; Fan, J.; Yang, Y. Genome-wide mining of microsatellites in king cobra (Ophiophagus hannah) and cross-species development of tetranucleotide SSR markers in Chinese cobra (Naja atra). Mol. Biol. Rep. 2019, 46, 6087–6098. [Google Scholar] [CrossRef] [PubMed]
  24. Wang, X.; Yang, S.; Chen, Y.; Zhang, S.; Zhao, Q.; Li, M.; Gao, Y.; Yang, L.; Bennetzen, J.L. Comparative genome-wide characterization leading to simple sequence repeat marker development for Nicotiana. BMC Genomics 2018, 19, 500. [Google Scholar] [CrossRef]
  25. Feng, K.; Zhou, C.; Wang, L.; Zhang, C.; Yang, Z.; Hu, Z.; Yue, B.; Wu, Y. Comprehensive Comparative Analysis Sheds Light on the Patterns of Microsatellite Distribution across Birds Based on the Chromosome-Level Genomes. Animals 2023, 13, 655. [Google Scholar] [CrossRef]
  26. Huang, J.; Li, W.; Jian, Z.; Yue, B.; Yan, Y. Genome-wide distribution and organization of microsatellites in six species of birds. Biochem. Syst. Ecol. 2016, 67, 95–102. [Google Scholar] [CrossRef]
  27. Zhong, H.; Shao, X.; Cao, J.; Huang, J.; Wang, J.; Yang, N.; Yuan, B. Comparison of the Distribution Patterns of Microsatellites Across the Genomes of Reptiles. Ecol. Evol. 2024, 14, e70458. [Google Scholar] [CrossRef]
  28. Song, X.; Yang, T.; Zhang, X.; Yuan, Y.; Yan, X.; Wei, Y.; Zhang, J.; Zhou, C. Comparison of the Microsatellite Distribution Patterns in the Genomes of Euarchontoglires at the Taxonomic Level. Front. Genet. 2021, 12. [Google Scholar] [CrossRef]
  29. Du, L.; Zhang, C.; Liu, Q.; Zhang, X.; Yue, B. Krait: an ultrafast tool for genome-wide survey of microsatellites and primer design. Bioinformatics 2017, 34, 681–683. [Google Scholar] [CrossRef] [PubMed]
  30. Zhou, C.; Li, F.; Wen, Q.; Price, M.; Yang, N.; Yue, B. Characterization of microsatellites in the endangered snow leopard based on the chromosome-level genome. Mammal Res. 2021, 66, 385–398. [Google Scholar] [CrossRef]
  31. Jiang, Q.; Li, Q.; Yu, H.; Kong, L. Genome-Wide Analysis of Simple Sequence Repeats in Marine Animals—a Comparative Approach. Mar. Biotechnol. 2014, 16, 604–619. [Google Scholar] [CrossRef]
  32. Jurka, J.; Pethiyagoda, C. Simple repetitive DNA sequences from primates: compilation and analysis. J. Mol. Evol. 1995, 40, 120–126. [Google Scholar] [CrossRef]
  33. Chen, C.; Wu, Y.; Li, J.; Wang, X.; Zeng, Z.; Xu, J.; Liu, Y.; Feng, J.; Chen, H.; He, Y.; et al. TBtools-II: A “one for all, all for one” bioinformatics platform for biological big-data mining. Mol. Plant 2023, 16, 1733–1742. [Google Scholar] [CrossRef]
  34. Zhao, H.; Yang, L.; Peng, Z.; Sun, H.; Yue, X.; Lou, Y.; Dong, L.; Wang, L.; Gao, Z. Developing genome-wide microsatellite markers of bamboo and their applications on molecular marker assisted taxonomy for accessions in the genus Phyllostachys. Sci. Rep. 2015, 5, 8018. [Google Scholar] [CrossRef]
  35. Qi, W.-H.; Jiang, X.-M.; Yan, C.-C.; Zhang, W.-Q.; Xiao, G.-S.; Yue, B.-S.; Zhou, C.-Q. Distribution patterns and variation analysis of simple sequence repeats in different genomic regions of bovid genomes. Sci. Rep. 2018, 8, 14407. [Google Scholar] [CrossRef] [PubMed]
  36. The Galaxy Community. The Galaxy platform for accessible, reproducible, and collaborative data analyses: 2024 update. Nucleic Acids Res. 2024, 52, W83–W94. [Google Scholar] [CrossRef]
  37. Buchfink, B.; Xie, C.; Huson, D.H. Fast and sensitive protein alignment using DIAMOND. Nat. Methods 2015, 12, 59–60. [Google Scholar] [CrossRef]
  38. Conesa, A.; Götz, S.; García-Gómez, J.M.; Terol, J.; Talón, M.; Robles, M. Blast2GO: a universal tool for annotation, visualization and analysis in functional genomics research. Bioinformatics 2005, 21, 3674–3676. [Google Scholar] [CrossRef]
  39. Ye, J.; Zhang, Y.; Cui, H.; Liu, J.; Wu, Y.; Cheng, Y.; Xu, H.; Huang, X.; Li, S.; Zhou, A.; et al. WEGO 2.0: a web tool for analyzing and plotting GO annotations, 2018 update. Nucleic Acids Res. 2018, 46, W71–W75. [Google Scholar] [CrossRef] [PubMed]
  40. Kanehisa, M.; Sato, Y.; Morishima, K. BlastKOALA and GhostKOALA: KEGG Tools for Functional Characterization of Genome and Metagenome Sequences. J. Mol. Biol. 2016, 428, 726–731. [Google Scholar] [CrossRef] [PubMed]
  41. Cantalapiedra, C.P.; Hernández-Plaza, A.; Letunic, I.; Bork, P.; Huerta-Cepas, J. eggNOG-mapper v2: Functional Annotation, Orthology Assignments, and Domain Prediction at the Metagenomic Scale. Mol. Biol. Evol. 2021, 38, 5825–5829. [Google Scholar] [CrossRef] [PubMed]
  42. Sainudiin, R.; Durrett, R.T.; Aquadro, C.F.; Nielsen, R. Microsatellite mutation models: insights from a comparison of humans and chimpanzees. Genetics 2004, 168, 383–395. [Google Scholar] [CrossRef] [PubMed]
  43. Bagshaw, A.T.M. Functional Mechanisms of Microsatellite DNA in Eukaryotic Genomes. Genome Biol. Evol. 2017, 9, 2428–2443. [Google Scholar] [CrossRef]
  44. Qi, W.-H.; Jiang, X.-M.; Du, L.-M.; Xiao, G.-S.; Hu, T.-Z.; Yue, B.-S.; Quan, Q.-M. Genome-wide survey and analysis of microsatellite sequences in bovid species. PLoS One 2015, 10, e0133667. [Google Scholar] [CrossRef]
  45. Manee, M.M.; Algarni, A.T.; Alharbi, S.N.; Al-Shomrani, B.M.; Ibrahim, M.A.; Binghadir, S.A.; Al-Fageeh, M.B. Genome-wide characterization and analysis of microsatellite sequences in camelid species. Mammal Res. 2020, 65, 359–373. [Google Scholar] [CrossRef]
  46. Liu, S.; Hou, W.; Sun, T.; Xu, Y.; Li, P.; Yue, B.; Fan, Z.; Li, J. Genome-wide mining and comparative analysis of microsatellites in three macaque species. Mol. Genet. Genomics 2017, 292, 537–550. [Google Scholar] [CrossRef]
  47. Zuo, B.; Nneji, L.M.; Sun, Y.-B. Comparative genomics reveals insights into anuran genome size evolution. BMC Genomics 2023, 24, 379. [Google Scholar] [CrossRef]
  48. Blommaert, J.; Riss, S.; Hecox-Lea, B.; Mark Welch, D.B.; Stelzer, C.P. Small, but surprisingly repetitive genomes: transposon expansion and not polyploidy has driven a doubling in genome size in a metazoan species complex. BMC Genomics 2019, 20, 466. [Google Scholar] [CrossRef]
  49. Wang, X.T.; Zhang, Y.J.; Qiao, L.; Chen, B. Comparative analyses of simple sequence repeats (SSRs) in 23 mosquito species genomes: identification, characterization and distribution (Diptera: Culicidae). Insect Sci. 2019, 26, 607–619. [Google Scholar] [CrossRef]
  50. Xu, Y.; Li, W.; Hu, Z.; Zeng, T.; Shen, Y.; Liu, S.; Zhang, X.; Li, J.; Yue, B. Genome-wide mining of perfect microsatellites and tetranucleotide orthologous microsatellites estimates in six primate species. Gene 2018, 643, 124–132. [Google Scholar] [CrossRef]
  51. Ma, Z. Genome-wide characterization of perfect microsatellites in yak (Bos grunniens). Genetica 2015, 143, 515–520. [Google Scholar] [CrossRef]
  52. Qi, W.H.; Lu, T.; Zheng, C.L.; Jiang, X.M.; Jie, H.; Zhang, X.Y.; Yue, B.S.; Zhao, G.J. Distribution patterns of microsatellites and development of its marker in different genomic regions of forest musk deer genome based on high throughput sequencing. Aging (Albany NY) 2020, 12, 4445–4462. [Google Scholar] [CrossRef] [PubMed]
  53. Metzgar, D.; Bytof, J.; Wills, C. Selection against frameshift mutations limits microsatellite expansion in coding DNA. Genome Res. 2000, 10, 72–80. [Google Scholar]
  54. Katti, M.V.; Ranjekar, P.K.; Gupta, V.S. Differential distribution of simple sequence repeats in eukaryotic genome sequences. Mol. Biol. Evol. 2001, 18, 1161–1167. [Google Scholar] [CrossRef]
  55. Mayer, C.; Leese, F.; Tollrian, R. Genome-wide analysis of tandem repeats in Daphnia pulex - a comparative approach. BMC Genomics 2010, 11, 277. [Google Scholar] [CrossRef]
  56. Umumararungu, T.; Gahamanyi, N.; Mukiza, J.; Habarurema, G.; Katandula, J.; Rugamba, A.; Kagisha, V. Proline, a unique amino acid whose polymer, polyproline II helix, and its analogues are involved in many biological processes: a review. Amino Acids 2024, 56, 50. [Google Scholar] [CrossRef] [PubMed]
  57. Lynch, V.J.; Wagner, G.P. Cooption of polyalanine tract into a repressor domain in the mammalian transcription factor HoxA11. J. Exp. Zool. B Mol. Dev. Evol. 2023, 340, 486–495. [Google Scholar] [CrossRef]
  58. Pirone, L.; Caldinelli, L.; Di Lascio, S.; Di Girolamo, R.; Di Gaetano, S.; Fornasari, D.; Pollegioni, L.; Benfante, R.; Pedone, E. Molecular insights into the role of the polyalanine region in mediating PHOX2B aggregation. FEBS J. 2019, 286, 2505–2521. [Google Scholar] [CrossRef] [PubMed]
  59. Reddy Chichili, V.P.; Kumar, V.; Sivaraman, J. Linkers in the structural biology of protein–protein interactions. Protein Sci. 2013, 22, 153–167. [Google Scholar] [CrossRef]
  60. Paloni, M.; Bussi, G.; Barducci, A. Arginine multivalency stabilizes protein/RNA condensates. Protein Sci. 2021, 30, 1418–1426. [Google Scholar] [CrossRef]
  61. Qi, W.H.; Yan, C.C.; Li, W.J.; Jiang, X.M.; Li, G.Z.; Zhang, X.Y.; Hu, T.Z.; Li, J.; Yue, B.S. Distinct patterns of simple sequence repeats and GC distribution in intragenic and intergenic regions of primate genomes. Aging (Albany NY) 2016, 8, 2635–2654. [Google Scholar] [CrossRef]
  62. Kaessmann, H.; Vinckenbosch, N.; Long, M. RNA-based gene duplication: mechanistic and evolutionary insights. Nat. Rev. Genet. 2009, 10, 19–31. [Google Scholar] [CrossRef]
  63. Grandi, F.C.; An, W. Non-LTR retrotransposons and microsatellites. Mob. Genet. Elements 2013, 3, e25674. [Google Scholar] [CrossRef]
  64. Pavlícek, A.; Paces, J.; Elleder, D.; Hejnar, J. Processed pseudogenes of human endogenous retroviruses generated by LINEs: their integration, stability, and distribution. Genome Res. 2002, 12, 391–399. [Google Scholar] [CrossRef]
  65. Schorderet, D.F.; Gartler, S.M. Analysis of CpG suppression in methylated and nonmethylated species. Proc. Natl. Acad. Sci. U. S. A 1992, 89, 957–961. [Google Scholar] [CrossRef]
  66. Fotsing, S.F.; Margoliash, J.; Wang, C.; Saini, S.; Yanicky, R.; Shleizer-Burko, S.; Goren, A.; Gymrek, M. The impact of short tandem repeat variation on gene expression. Nat. Genet. 2019, 51, 1652–1659. [Google Scholar] [CrossRef]
  67. Zhou, H.; Qiang, G.; Xia, Y.; Tan, J.; Fu, Q.; Luo, K.; Meng, X.; Chen, B.; Chen, M.; Sui, J.; et al. Copy Number Variations in Short Tandem Repeats Modulate Growth Traits in Penaeid Shrimp Through Neighboring Gene Regulation. Animals 2025, 15, 262. [Google Scholar] [CrossRef] [PubMed]
  68. Peng, C.; Luo, C.; Xiang, G.; Huang, J.; Shao, L.; Huang, H.; Fan, S. Genome-Wide Microsatellites in Acanthopagrus latus: Development, Distribution, Characterization, and Polymorphism. Animals 2024, 14, 3709. [Google Scholar] [CrossRef] [PubMed]
  69. Binns, D.; Dimmer, E.; Huntley, R.; Barrell, D.; O'Donovan, C.; Apweiler, R. QuickGO: a web-based tool for Gene Ontology searching. Bioinformatics 2009, 25, 3045–3046. [Google Scholar] [CrossRef] [PubMed]
  70. Kanehisa, M.; Goto, S. KEGG: Kyoto Encyclopedia of Genes and Genomes. Nucleic Acids Res. 2000, 28, 27–30. [Google Scholar] [CrossRef]
  71. Galperin, M.Y.; Vera Alvarez, R.; Karamycheva, S.; Makarova, K.S.; Wolf, Yuri I.; Landsman, D.; Koonin, E.V. COG database update 2024. Nucleic Acids Res. 2024, 53, D356–D363. [Google Scholar] [CrossRef]
  72. Gemayel, R.; Vinces, M.D.; Legendre, M.; Verstrepen, K.J. Variable Tandem Repeats Accelerate Evolution of Coding and Regulatory Sequences. Annu. Rev. Genet. 2010, 44, 445–477. [Google Scholar] [CrossRef] [PubMed]
  73. Wright, S.E.; Todd, P.K. Native functions of short tandem repeats. eLife 2023, 12, e84043. [Google Scholar] [CrossRef] [PubMed]
  74. Sawyer, L.A.; Hennessy, J.M.; Peixoto, A.A.; Rosato, E.; Parkinson, H.; Costa, R.; Kyriacou, C.P. Natural Variation in a Drosophila Clock Gene and Temperature Compensation. Science 1997, 278, 2117–2120. [Google Scholar] [CrossRef] [PubMed]
  75. Verbiest, M.; Maksimov, M.; Jin, Y.; Anisimova, M.; Gymrek, M.; Bilgin Sonay, T. Mutation and selection processes regulating short tandem repeats give rise to genetic and phenotypic diversity across species. J. Evol. Biol. 2023, 36, 321–336. [Google Scholar] [CrossRef]
Figure 1. The relative abundance of SSR categories (P-SSR, C-SSR, and I-SSR) across genomic regions of five cricket species.
Preprints 198821 g001
Figure 2. SSR content and genome size in five cricket species. (a) Genome size of each cricket species (Gbp); (b) Total number of SSRs, including P-SSR, C-SSR, and I-SSR, in each species; (c) Proportion of SSRs (%) in the genome of each species.
Preprints 198821 g002
Figure 3. The correlation between genomes sizes and SSR categories in terms of number (loci), length (bp), abundance (loci/Mb), and density (bp/Mb).
Preprints 198821 g003
Figure 4. The abundance ratio (%) of mono- to hexanucleotide P-SSRs across genomic regions in cricket species.
Preprints 198821 g004
Figure 5. The top of most abundant P-SSR motifs (%) across genomic regions in cricket species.
Preprints 198821 g005
Figure 6. GC content (%) of P-SSRs across genomic regions in five cricket genomes.
Preprints 198821 g006
Figure 7. Repeat copy number (RCN) of P-SSRs across genomic regions in five cricket species: (a) mononucleotide, (b) dinucleotide, (c) trinucleotide, (d) tetranucleotide, (e) pentanucleotide, and (f) hexanucleotide.
Preprints 198821 g007
Figure 8. Coefficient of variation (CV) analysis of RCNs of P-SSRs across genomic regions in five cricket species.
Preprints 198821 g008
Figure 9. The functional analysis of CDSs with P-SSRs in the cricket genomes based on database: (a) Gene Ontology (GO); (b) Kyoto Encyclopedia of Genes and Genomes (KEGG); (c) Clusters of Orthologous Genes (COG).
Preprints 198821 g009
Disclaimer/Publisher’s Note: The statements, opinions and data contained in all publications are solely those of the individual author(s) and contributor(s) and not of MDPI and/or the editor(s). MDPI and/or the editor(s) disclaim responsibility for any injury to people or property resulting from any ideas, methods, instructions or products referred to in the content.
Copyright: This open access article is published under a Creative Commons CC BY 4.0 license, which permit the free download, distribution, and reuse, provided that the author and preprint are cited in any reuse.
Prerpints.org logo

Preprints.org is a free preprint server supported by MDPI in Basel, Switzerland.

Subscribe

Disclaimer

Terms of Use

Privacy Policy

Privacy Settings

© 2026 MDPI (Basel, Switzerland) unless otherwise stated