Submitted:
15 June 2023
Posted:
16 June 2023
You are already at the latest version
Abstract
DNA markers have high occurrence and mutation rates and are generally located around the controlling regions of some tissue-specific genes and housekeeping genes that can change the expression pattern. Microsatellites and CpG islands are stretches of DNA with repeats and are known to influence gene expression. Microsatellites are more prone to mutations than the rest of the genomic DNA which allows the straightforward genomic nucleotide evolutionary transformation rate in different species. In the present study, these DNA markers are mined and an in-silico comparison was carried out to understand their occurrence pattern and distribution frequency in sex chromosomes (X and Y) of 12 different animal species using Perl and R programming pipelines. It was found that female-dominant X chromosomes had higher occurrence and distribution frequencies for these DNA markers than that of male-dominant sex chromosome i.e. Y which means that the former has a higher number of the evolutionary sites. The density of DNA markers however, showed remarkable variation for different animal species The results obtained need validation through wet-lab experimentation. Tri- and hexa-nucleotide repeats are more abundant in exons, whereas other repeats are more abundant in non-coding regions.
Keywords:
Microsatellite
; CpG island
; sex chromosomes
; DNA markers
Introduction
In mammals, the sex chromosomes are generally dimorphic. The X chromosomes are usually of large size and gene-rich while Y chromosomes are comparatively of smaller in size and heterochromatic in nature and are almost completely different but they at small homologous region (pseudo autosomal region) they paired with each other. Genetic markers such as CpG and microsatellites plays important role in evolution of sex chromosomes. Many biological processes significantly affect the functionality of DNA. One such process is methylation that is involved in X-chromosome inactivation (XCI) especially at promoter-proximal regions that are enriched with CpG islands (Duncan et al., 2018). The Y chromosome accumulates repeat sequences that are epigenetically repressed, results an epigenetic dispute with Y gene expression and hence possible accelerates the Y chromosome degeneration. Ageing causes the loss of Y heterochromatin, which activates transposable elements and reduces male lifespan. In placental mammals namely eutherians and marsupials X chromosome inactivation has evolved via two different non-coding RNA molecules (Muyle et al., 2021). SSRs, also known as microsatellites, are highly variable genetic markers that may be used for a number of purposes in genetic analysis, such as genetic mapping, population structure and gene flow analysis, conservation unit identification, and kinship analysis (Wanget al., 2022). Microsatellites are composed of short sequence motifs that are repeated in tandem. These sequence motifs are of short length usually between one and six base pairs. In silico nucleotide sequence analysis methods (Sanger or high-throughput sequencing) could detect microsatellites. Based on the motif repeat length the tandemly repetitive DNA is classified into major three classes (Tautz and Renz 1984): (i) satellite DNA with repeat units up to 300 base pairs (bp), (ii) minisatellite DNA with a repeat unit of 9-100 bp and (iii) microsatellites or simple sequence repeats (SSR) of 1-6 bp length. In e eukaryotic genome SSRs generously occur all ova er in random fashion. These are multi-allelic with large variations in repeat numbers among different individuals (Saghai-Maroof et al., 1994). While lengthy stretches of satellite DNA may be found on every chromosome in a genome, the absence of recombination between the X and Y chromosomes (and the Z and W chromosomes in other species) has obvious repercussions, with satellite buildup on the Y/W chromosome being the most prevalent (Cechova and Miga 2022).
Similarly CpG islands have a critical role in gene silencing, chromosomal inactivation and various other biological processes. The DNA methyltransferase (DNMT) family, namely DNMT3A, 3B, and DNMT1, catalyses and maintains DNA methylation at CpG sites (Shyamala et al., 2022). In mammals, the chemical covalent attachment of a methyl group to the C5 position of the cytosine ring results in methylation, this modified residue is dispersed throughout the majority of the genome including gene bodies, endogenous repeats, and transposable elements and results in transcription repression (Zhao et al., 2009). Methylated cytosine base instantly undergoes deamination to thymine and results in the underrepresentation of CpG ( in human genome 21% of that expected ) (Lander et al., 2001). Although changes in DNA methylation are linked to ageing, little attention has been paid to the sex chromosomes, which might be biological factors to the observed sexual dimorphism (Kananen and Marttila 2021).The nonmethylated DNA sequences called CpG islands (CGIs) elevate G + C content and little CpG suppression (Cooper et al., 1983). These unmethylated sequences are approximately 1 kb in length and flap around the 60-70% promoter regions of all human genes (Bird et al., 1985 and Larsen et al., 1992). In organisms like Drosophila melanogaster, Caenorhabditis elegans and the Saccharomyces cerevisiae the CGI is difficult to detect because the whole genome is CGI like with minor or no DNA methylation. Diversity of plant genomes is highly methylated and various nonmethylated CGI-like genomic fraction is also detected (Antequera and Bird 1999). In some organisms regardless of the presence of DNA methylation the nonmethylated DNA is enhanced for transcribed sequences (Kapila et al., 2016).
In 1987 Gardiner-Garden and Frommer propsed the first accepted definition of a CpG island (Gardiner and, Frommer 1987) as being an DNA stretch of at least 200-bp with a minimum content of C’s and G’s of 50% and a ratio between the observed and expected frequency of CpG of 0.6. This ratio is provided by:ratio = fCpG/fCfG = S*CpG/Nc*Ng where S is the sequence length, Ncpg, Nc and Ng show the amount of C's, G's and CpG's found, respectively (Samuelsson 2010). These thresholds were obtained before the mammalian genome sequencing; thus, it included many sequences that are not necessarily related with gene controlling regions but rather are connected with intra genomic parasites. After studies on human genomic sequences of human chromosomes 21 and 22, a new threshold definition arises based on certain number of genomes to look into the characteristics of CpG islands. According to which it was proposed that the length of DNA stretches is longer than 500 bp with a value of C + G equal to or greater than 55% and ratio of observed and expected CpG greater than 0.65 (Takai and Jones 2002). This definition eliminated most of Alu-repetitive sequence elements which are rich in C's and G's that can be confused with CpG islands. This parameter definition can still be applied to many other organisms, providing an approximate feedback. Most of the algorithm programs for CpG islands prediction are centered on calculating the ratio between observed and expected CpG and C + G content, as mentioned above, which is a determine by static method Another method can be done by applying Hidden Markov chain concept, which is a heuristic approach.
Both SSRs and CpG islands are present in most of the organisms and are key elements in structural organization of genomes and their function and may be related with disease states, their systematic analysis has not been reported. In coding regions at certain locations few repeats are preferred and are often predominant like triplet SSRs are predominant, however the reason behind this observation is not clear (Zhao and Han 2009). The study of repeat density and its distribution pattern in the genome is expected to help in understanding their significance. The accumulating evidences suggested that SSRs plays role in gene expression regulation(Kunzler et al., 1995 and Moxon and Wills 1999).In the present study, in silico mining of the nucleotide motifs (SSR regions and CpG islands)has been targeted in the entire genome to explore the evolutionary relics of sex-chromosome constitute in divergent species of animals. The accessibility of complete genome sequences for many organisms through nucleotide databases has made it possible to carry out genome-wide analyses. In silico comparative analysis of DNA markers may be helpful in understanding their role and abundance in the coding, as well as non-coding, regions of the genome may give us some clue to the function of SSRs in gene regulation.
Material and Methods
Downloading the Nucleotide Sequences
The nucleotide sequences of sex-chromosomes of twelve selected mammalian species, namely, Gallus gallus, Meleagris gallopavo, Anopheles gambie, Drosophila melanogaster, Callithrix jacchus, Chlorocebus sabaeus, Homo sapiens, Pan troglodytes, Mus musculus, Rattus norvegicus, Bos taurus and Sus scrofa were downloaded in the Fasta format from the nucleotide database of National Center for Biotechnology Information (https://www.ncbi.nlm.nih.gov/genome). The downloaded sex chromosomes were classified into five groups according to their order type (Table 1).
Prediction of Microsatellites and CpG Island was done using individually and separately using different platforms both were based on Perl programming.
Microsatellite prediction
Microsatellite prediction was done with a Perl-based MISA (Microsatellite Analysis) tool accessed under (https://webblast.ipk-gatersleben.de/misa/ ). The FASTA formatted sequence data of twelve different species were downloaded for X and Y Chromosomes from the Genome database of NCBI Figure 1. Showing the flowchart of microsatellite prediction. To begin analysis MISA requires two input files: (i) a configuration file (‘MISA.ini’) and (ii) the nucleotide sequence file. The input file will be called using the MISA.pl function. The MISA output provides two output files, fast. misa and misa statistic in a proprietary format overview of detected microsatellites with their size and start-end position. Seven different types of microsatellite motif repeats (Mono-, di-, tri-, tetra-, Penta-, hexanucleotide, and complex) were mined in this research using MISA. The R programming environment was used to clean both input and output files.
CpG Island prediction
For the prediction of CpG islands, we assumed a minimum length of 200nt, the minimum content of C+G 55%, and the ratio between the frequency of observed and expected CpG sites to be at least 0.65. X and Y chromosome sequences were downloaded from the Genome database of NCBI Figure 2. Showing the flowchart of CpG island prediction. The downloaded chromosome sequences were subjected to notepad++ for further modification. Then the sequences were subjected to Perl code for predicting the statistical data. The statistical data were subjected to the R-programming environment for further cleaning and getting the predicted data.
Results:
Sex chromosomes (X & Y) were downloaded for twelve animal species and were classified into five groups according to their similarities to make a comparative microsatellite analysis (Table 1). Chromosome sequences of animals of each group were analyzed for microsatellites and CpG island prediction using a Perl script and R-programming.
Sex chromosomes of different animal species viz. species belonging to ruminants, other mammals, avians, etc were analyzed for the distribution of microsatellites and CpG island. 1-6 bp long microsatellite motifs (mono, di-, tri-, tetra-, Penta- and hexanucleotide repeats) including complex type SSRs using a computer-based MISA program (Iquebal et al., 2015). We found that the mononucleotide repeat motifs were maximum in numbers among others and the numbers of SSR count was found to decrease with an increase in repeat size. For CpG islands distribution eleven different features were identified and compared.
Microsatellite and CpG prediction in the Avian group
In the first group Avians species, Gallus gallus (red junglefowl) and Meleagris gallopavo (wild turkey) were identified. Avians have Z and W sex chromosomes instead of an X and Y system where, the female (ZW) is the heteromorphic sex, and the male (ZZ) is homomorphic (Stevens 1997). The Z chromosome is large and contains nearly all the known sex-linked genes in most avian species.
Microsatellite prediction in the Avian group (W chromosome)
MISA has predicted higher monomeric and lower hexameric SSRs in W chromosomes of Gallus gallus and Meleagris gallopavo species. Again Gallus gallus has a higher number of all types of predicted microsatellites than Meleagris gallopavoas Figure 3. Showing the number of different SSRs with respective lengths in the W-chromosome of Gallus and Meleagris gallopavo
Microsatellite prediction in the Avian group (Z chromosome)
Gallus gallus has higher numbers of all predicted SSRs based on the Z chromosome and sums to 291 while Meleagris gallopavo comparatively has only 58 SSRs. In both animal groups, monomeric SSRs weights were highest while hexameric SSRs were lowest in number. Complex SSRs were also predicted in Gallus gallus and Meleagris gallopavo and were higher in numbers at first that is 25 and 7 in numbers respectively Figure 4. Showing the number of different SSRs with respective lengths in the Z-chromosome of Gallus and Meleagris gallopavo
CpG island prediction in the Avian group (W chromosome):
Gallus gallus has a greater average island length of 569.12, Variation in island length is more as compared to Meleagris gallopavo. Table 2: Showing the final parameters of CpG island in W-chromosome of Gallus gallus and Meleagris gallopavo. Average G+C concentration is close to each other. In Gallus gallus, it is 51.97 and in the case of the Meleagris gallopavo value is 50.5. The value of the CpG concentration of Gallus gallus is 4.7 and in the case of Meleagris gallopavo, it is 5.25. It means there is a small difference in the value of all the two species. The average ratio (Observed CpG/Expected CpG) is 0.72 in Gallus gallus and 0.9 in Meleagris gallopavo. It means the value of the average ratio of Gallus gallus is greater than the value of Meleagris gallopavo. We have got the minimum island length which is the same in all the specie which is 500. The maximum island length value of Gallus gallus is 5230 and in the case of Meleagris gallopavo, it is 1653. It means Gallus gallus has a maximum island length as compared to Meleagris gallopavo.
CpG island prediction in the Avian group (Z chromosome):
Gallus gallus has a greater average island length of 743.57, Variation in island length is more as compared to Meleagris gallopavo Table 3: Showing the final parameters of CpG island in Z-chromosome of Gallus gallus and Meleagris gallopavo. Average G+C concentration is close to each other in all the species. In Gallus gallus, it is 55.3 and in the case of the Meleagris gallopavo value is 51.74. The value of average CpG concentration in Gallus gallusis 5.76 and the case of Meleagris gallopavo, it is5is 5.26t means there is a small difference in the value of the two species. The average ratio (Observed CpG/Expected CpG) is 0.81 in the case of Meleagris gallopavo, and 0.76 in Gallus gallus. It means the value of the average ratio of Meleagris gallopavo is greater than the value of Gallus gallus. We have got the minimum island length which is the same in all the specie which is 500. The maximum island length value of Gallus gallusis 6949 and in the case of Meleagris gallopavo that is 2330. It means Gallus gallus has a maximum island length as compared to Meleagris gallopavo.
Microsatellite and CpG prediction in the insect group
Insects are found in almost all freshwater and terrestrial habitats. The diversity at this taxonomic level coordinated by a variety of insect model systems and sex-determining mechanisms provides an important insight into the biology and mechanisms of sex determination. For instance, research in the species Drosophila melanogaster has involved molecular pathways and identification of the genes in sex determination Blackmon et al., (2017).In the second group Insect species Anopheles gambiae (mosquitoes), and Drosophila melanogaster ( fruit fly) were identified. The huge diversity of sex chromosome systems from the male heterogametic XY system in Drosophila to ZW systems in Lepidoptera or mobile genes determining sex as found in the house flies suggests that insects can be a unique model system to study numerous functional and evolutionary aspects.
Microsatellite Prediction in the insect group(X chromosomes)
X- chromosomes of Anopheles gambie and Drosophila melanogaster are closer in size. Anopheles gambie has a smaller sized X chromosome than Drosophila melanogaster but comparatively contains a large number of SSRs. Mono, tetra, Penta, and Hexatype SSRs were reported higher in numbers in Drosophila melanogaster while di, tri, and complex type motifs were maximum in Anopheles gambie Figure 5. Showing the number of different SSRs with respective lengths in the X-chromosome of Anopheles gambie and Drosophila melanogaster.
Microsatellite Prediction in the insect group ( Y chromosomes)
Surprisingly, Anopheles gambie has only mononucleotide repeat motifs. All types of microsatellites were present in Drosophila melanogaster but they were found to be fewer in numbers Figure 6. Showing the number of different SSRs with respective lengths in the Y-chromosome of Anopheles gambie and Drosophila melanogaster.
CpG Island prediction in Insect group (X chromosomes)
The average island length of Anopheles gambiae in the X-chromosome is 634.24 and Drosophila melanogaster has an average island length of 619.42 which means Anopheles gambiae has a greater average island length as compared to Drosophila melanogaster. Average G+C concentration is close to each other in both species. In the X-chromosome of Drosophila melanogaster, the value is 50.69 and in the case of Anopheles gambiae value is 50.46. The average CpG concentration is close to each other as shown in Table 1. The value of average CpG concentration in Anopheles gambiae is 6.5 and in the case of Drosophila melanogaster, it is 5.64. It means there is a small difference in the value of both species. The average ratio (Observed CpG/Expected CpG) is 1.03 in Anopheles gambiae and in the case of Drosophila melanogaster, it is 0.89. It means the value of the average ratio of Anopheles gambiae is greater than the value of Drosophila melanogaster Table 4- Showing the final parameters of CpG island in X-chromosome of Anopheles gambiae and Drosophila melanogaster. We have got the minimum island length which is the same in both species. Both species have a similar value which is 500. The maximum island length value of Drosophila melanogaster is 7881 and in the case of Anopheles gambiae that is 9249. It means Anopheles gambiae has a maximum island length as compared to Drosophila melanogaster.
CpG Island prediction in Insect group (Y chromosomes)
The average island length of Anopheles gambiae in the Y-chromosome is 535 and Drosophila melanogaster has an average island length of 601.02 which means Drosophila melanogaster has a greater average island length as compared to Anopheles gambiaeas. Average G+C concentration is close to each other in both species. In the Y-chromosome of Drosophila melanogaster, the value is 50.37 and in the case of Anopheles gambiae value is 50.41. The average CpG concentration is close to each other. The value of the average CpG concentration in Anopheles gambiae is 6.07 and in the case of Drosophila melanogaster, it is 5.73. The average ratio (Observed CpG/Expected CpG) is 0.97 in Anopheles gambiae and in the case of Drosophila melanogaster, it is 0.91. It means the value of the average ratio of Anopheles gambiae is greater than the value of Drosophila melanogaster. We have got the minimum island length which is the same in both species Table 5- Showing the final parameters of CpG island in Y-chromosome of Anopheles gambiae and Drosophila melanogaster. Both species have a similar value which is 500. The maximum island length value of Drosophila melanogaster is 7406 and in the case of Anopheles gambiae that is 603. It means Drosophila melanogaster has a maximum island length as compared to Anopheles gambiae.
Microsatellite and CpG prediction in Primates
In the third group of primates Callithrix jacchus (New World monkey), Pan troglodytes(Chimpanzee), Homo sapiens(Humans), and Chlorocebus sabaeus(Green monkey)were identified. Mammalian X-chromosomes are mainly euchromatic. It has a similar structure and size among species whereas Y-chromosomes are much smaller than X-chromosomes (Graves et al., 2006). It accumulated male-specific genes and genes that are involved in sex determination. During meiosis, the pseudo autosomal region (PAR) is conserved on X and Y and pairing occurs. Most mammals have a single pseudo autosomal region (PAR) region but the human sex chromosome with a second PAR at the distal ends of the X and Y-chromosomes. The PAR plays an important role in normal sexual development and loss of the PAR is associated with male sterility in humans (Hughes et al., 2005). Even though it’s a critical role in disease and fertility, PAR is one of the well-characterized parts of mammalian genomes. The pseudo autosomal and male-specific genes are harbored by the mammalian Y-chromosome which is one of the smallest chromosomes in the genome. The structure, function, and evolution of mammalian sex chromosomes, particularly the Y-chromosome, are still poorly understood because few species have high-quality sex-chromosome assemblies.
The primates group comprises four animal species with different sizes of X and Y chromosomes. All these contain a different number of distinct microsatellite motifs.
Microsatellite prediction in Primates (X chromosomes)
X-chromosomes of animals belonging to this group have comparable sizes. All of them have a higher number of mono nucleotide repeat motifs. Homo sapiens among all these animal species contains the highest number of all types of SSRs. Both the X and Y chromosomes of Homo sapiens contain a higher number of monotypes and total SSRs than other group members Figure 7. Showing the number of different SSRs with respective lengths in the X-chromosome of Callithrix jacchus, Chlorocebus sabaeus, Homosapiens, and Pan troglodytes.
Microsatellite prediction in Primates (Y chromosomes)
A comparable number of microsatellite motifs was found in Y-chromosomes irrespective of their chromosome sizes. The total number of microsatellites of different types follow decreasing order in the range of Mono>di>tri>tetra>penta>hexa with mononucleotide repeat motifs to have hit the highest numbers. Complex-type SSRs are comparable in numbers in Chlorocebus sabaeus (7766) and Homo sapiens (7932) Callithrix jacchusus contains the lowest number of complex SSRs among all the other group members whilst Homo sapiens tops the list Figure 8. Showing the number of different SSRs with respective lengths in the Y-chromosome of Callithrix jacchus, Chlorocebus sabaeus, Homosapiens, and Pan troglodytes.
CpG island prediction in Primates(X chromosomes)
Callithrix jacchus has a greater average island length of 634.76, Variation in island length is more as compared to Chlorocebuss abaeus, Homo sapiens, and Pan troglodytes. Average G+C concentration is close to each other in all the species. In Callithrix jacchus the value is55.66, In Chlorocebus sabaeusit is55.1, Homo sapiens it is 55.68 and in the case of the Pan troglodytes value is 54.53 Table 6 – Showing the final parameters of CpG island in X-chromosome of primates Callithrix jacchus( New World monkey), Pan troglodytes (Chimpanzee), Homosapiens (Humans), and Chlorocebus sabaeus(Green monkey). The value of average CpG concentration in Callithrix jacchus is 5.38, in Chlorocebus sabaeusit is 5.26, Homo sapiens it is 5.32 and in the case of the Pan troglodytes value is 5.24. It means there is a small difference in the value of all three species. The average ratio (ObservedCpG/Expected CpG) is 0.7 in the case of Callithrix jacchus, 0.7 in Chlorocebuss abaeus, 0.7 in Homo sapiens, and 0.72 in Pan troglodytes. It means the value of the average ratio of Pan troglodytes gis reater than the value of Chlorocebuss abaeus, Homo sapiens, and Callithrix jacchuss. We have got the minimum island length which is the same in all the specie which is 500. The maximum island length value of Callithrix jacchusis 4007, in Chlorocebuss abaeus, it is4473, 4472 in Homo sapins and the case of Patroglodytes is 2991. It means in Chlorocebus sabaeus has a maximum island length as compared to other species.
CpG island prediction in Primates(Y chromosomes)
Callithrix jacchus has a greater average island length of 643.37, Variation in island length is more as compared to Chlorocebus sabaeus, Homo sapiens, and Pan troglodytes. Average G+C concentration is close to each other in all the species. In Callithrix jacchus the value is 56.92, In Chlorocebus sabaeus it is 52.07, Homo sapiens it is 53.89and in the case of the Pan troglodytes value is 55.66. The value of average CpG concentration in Callithrix jacchusis5.58, in Chlorocebus sabaeus it is 4.78, Homo sapiens it is 4.89, and in the case of the Pan troglodytes value is 5.29. It means there is a small difference in the value of the three species. The average ratio (Observed CpG/Expected CpG) is 0.7 in the case of Callithrix jacchus,0.72 in Chlorocebus sabaeus, 0.71 in Homo sapiens, and 0.69 in Pan troglodytes. It means the value of the average ratio of Chlorocebus sabaeus is greater than the value of Pan troglodytes, Homo sapiens, Callithrix jacchus. We have got the minimum island length which is the same in all the specie which is 500. The maximum island length value of Callithrix jacchus is 3242, in Chlorocebus sabaeus is 1950, 3420 in Homo sapiens, and in the case of Patroglodytes is 1987 Table 7- Showing the final parameters of CpG island in Y-chromosome of primates Callithrix jacchus ( New World monkey), Pan troglodytes (Chimpanzee), Homo sapiens (Humans), and Chlorocebus sabaeus(Green monkey). It means Hosapiens has a maximum island length as compared to other species.
Microsatellite and CpG prediction in Rodents
Rodents have a cosmopolitan distribution with range extensions often associated with human movement. Rodents currently represent the most abundant mammalian order they comprise about 42% of all living mammals, and include 2277 defined species. Like in most mammals, genetic sex is determined at the time of fertilization when the X chromosome-bearing oocyte receives an X or a Y chromosome from the sperm. XX and XY individuals will normally develop into females and males, respectively, rats have 21 and mice have 20 Romanenko et al., (2012).In the fifth group Rodents, Rattus norvegicus (Brown rat), and Mus musculus ( house mouse) were identified.
Microsatellite prediction in Rodents(X chromosome)
Both these animal species have comparable X chromosome sizes and similarly, have higher monomeric and lower hexameric types of microsatellites. But Mus musculus significantly contains a five times higher number of SSRs than Rattus norvegicus Figure 9. Showing the number of different SSRs with respective lengths in the X-chromosome of Mus musculus and Rattus norvegicus.
Microsatellite prediction in Rodents(Y chromosome)
On the other side, the Y chromosome of Mus musculus is approximately 2 and half times that of Rattus norvegicus but both of them contain a comparable number of all types of SSRs. As usual monomeric SSRs are abundant and hexameric are on the lower side. Complex microsatellites form an equal weightage to that of dimeric SSRs. Overall Mus musculus contains a higher number (79146) of all types of microsatellites than Rattus norvegicus (59057) Figure 10. Showing the number of different SSRs with respective lengths in the Y-chromosome of Mus musculus and Rattus norvegicus.
CpG Island prediction in Rodents(X chromosome)
The average island length of Mus musculus in the X-chromosome is 588.17 and Rattus norvegicus has an average island length of 596.19 which means Rattus norvegicus has a greater average island length as compared to Mus musculus. Average G+C concentration is close to each other in both species. In the X-chromosome of Mus musculus, the value is 54.68 and in the case of the Rattus norvegicus value is 53.03. The average CpG concentration in Mus musculus is 5.26 and in the case of Rattus norvegicus, it is 4.94. It means there is a small difference in the value of both species. The average ratio (Observed CpG/Expected CpG) is 0.72 in Mus musculus and in the case of Rattus norvegicus it is0.73. It means the value of the average ratio of Rattus norvegicus is greater than the value of Mus musculus. We have got the minimum island length which is the same in both species. Both species have a similar value which is 500. The maximum island length value of Mus musculus is 3476 and in the case of Rattus norvegicus that is 4484.It means Rattus norvegicus has a maximum island length as compared to Mus musculus Table 8- Showing the final parameters of CpG island in X-chromosome of Rodents Rattus norvegicus and Mus musculus.
CpG Island prediction in Rodents(Y chromosome)
The average island length of Mus musculus the Y-chromosome is 548.88 and Rattus norvegicus is 560.46 which means Rattus norvegicus has a greater average island length as compared to Mus musculus. Average G+C concentration is close to each other in both species52.2 and 52.7 in Mus musculus, and Rattus norvegicus respectively. The average CpG concentration is close to each other. The value of average CpG concentration in Mus musculus is4.79 and the case of Rattus norvegicus, it is 4.73. It means there is a small difference in the value of both species. The average ratio (Observed CpG/Expected CpG) is 0.71 in Mus musculus in the case of Rattus norvegicus, it is 0.7. It means the value of the average ratio of Mus musculus is greater than the value of Rattus norvegicus. We have got the minimum island length which is the same in both species. Both species have a similar value which is 500. The maximum island length value of Mus musculus is 1568 and in the case of Rattus norvegicus that is1059.It means Mus musculus has a maximum island length as compared to Rattus norvegicus, Table 9 Showing the Final parameters of CpG island in Y-chromosome of Rodents Rattus norvegicus and Mus musculus.
Microsatellite and CpG prediction in even-toed ungulates
In another group comprised of Bos taurus and Sus scrofa, both these species have large-sized X chromosomes with a proportionately higher number of microsatellites than Y chromosomes.
Microsatellite prediction in Even-toed ungulates (X chromosome)
Different type nucleotide repeats were exceptionally higher in numbers in the Y chromosome of Bos taurus, while the microsatellite repeat motifs were comparable in X chromosomes Figure 11. Showing the number of different SSRs with respective lengths in the X-chromosome of Bos taurus and Sus scrofa.
Microsatellite prediction in Even-toed ungulates (Y chromosome)
SSRs mined from Y chromosomes follow the decreasing order of several repeats in terms of mon>di>tri>tetra>penta>hexa. Complex type SSRs were considerably lower in Sus scrofa. Both the X chromosomes of both animals follow the same decreasing order of SSRs except the Penta, tetra type repeat motifs of Bos taurus and Sus scrofa respectively. The total number of SSRs and complex types of SSRs were higher in Sus scrofa than Bos taurus Figure 12. Showing the number of different SSRs with respective lengths in the Y-chromosome of Bos taurus and Sus scrofa.
CpG Island prediction in Even-toed ungulates(X chromosome)
The average island length of Bos taurus in the X-chromosome is 701.35and Sus scrofa has an average island length of 580.44 which means Bos taurus has a greater average island length as compared to Sus scrofa Table 10- Showing the final parameters of CpG island in X-chromosome of Rodents Bos taurus and Sus scrofa. Average G+C concentration is close to each other in both species. In the X-chromosome of Bos taurus, the value is 57.61 and case of the Sus scrofa value is 54.5. The average CpG concentration in Bos taurusis5.84and in the case of Sus scrofa, it is 5.13. It means there is a small difference in the value of both species. The average ratio (Observed CpG/Expected CpG) is 0.72 in Bos taurus and in the case of Sus scrofa it is0.7. It means the value of the average ratio of Bos taurus is greater than the value of Sus scrofa. We have got the minimum island length which is the same in both species. Both species have a similar value which is 500. The maximum island length value of Bos taurus is 3832 and in the case of Sus scrofa that is 5639.It means Sus scrofa has a maximum island length as compared to Bos taurus.
CpG Island prediction in Even-toed ungulates(Y chromosome)
The average island length of Bos taurus in the Y-chromosome is 545.86 and Sus scrofa has an average island length of 567.28 which means Sus scrofa has a greater average island length. In the Y-chromosome the Average G+C concentration is53.36and 53.86 in Bos taurus &Sus scrofa, respectively. The average CpG concentration in Bos taurus is 4.93 and in Sus scrofa, it is 4.96. It means there is a small difference in the value of both species. The average ratio (Observed CpG/Expected CpG) is 0.7 which is the same in both species Table 11-Showing the Final parameters of CpG island in the Y-chromosome of Rodents Bos taurus and Sus scrofa. In both the species the minimum island length value is 500. The maximum island length value of Bos taurus is 2360 and of Sus scrofa is 2650 which shows that Sus scrofa has a maximum island length as compared to Bos taurus.
Discussion
CpG islands are found almost everywhere in vertebrate genomes. Even though many tissue-specific genes lack CpG islands, it is becoming clear that they do exist in all commonly expressed genes, as well as a large number of tissue-specific genes with CpG islands can be found at the 5' or 3' ends of genes. CGIs are a fragmented but unified DNA sequence family whose members serve as genomic platforms for controlling transcription at their associated promoters. These characteristics are based on common DNA sequences traits, such as CpG richness and a higher-than-usual G+C concentration(Thomson et al., 2010).In addition, SSR sequences possess most of the desirable attributes of molecular markers, including information content, unambiguous designation of alleles, neutral selectively (although they can be subjected to hitch-hiking effects), high reproducibility, codominance, and fast and easy assaying of genotypes and therefore microsatellite markers or SSR have proved to be very useful for cultivar identification, pedigree analysis and the evaluation of genetic distance between organisms (Priolli et al., 2002) and genetic mapping (Yu et al., 2000).To date, most macropod microsatellites have been isolated using laboratory-based techniques, including standard bacteria screening and microsatellite enrichment libraries (Karagyozov et al., 1993; Hakki and Akkaya 2000). These methods can be time-consuming and unpredictable, with no guarantees of obtaining the numbers or types of markers desired. These approaches are effectively random samples of the genome and do not permit the targeting of markers from particular chromosomes, or even the identification of the chromosomes of origin of known markers. Consequently, the availability of DNA sequences is now providing unprecedented opportunities to identify novel genetic markers for use.
In the present study, 12 different animal species were organized into five groups and targeted for microsatellite and CpG mining in sex chromosomes. Microsatellite data have been analyzed by considering the simple and complex repeats. Simple repeats comprise of six classes of repeats including mono-, di-, tri-, tetra-, penta-, and hexamers. The density of each class of repeat is comparable across various genomic regions (Figure 2). However, there is often tremendous variation in density in different genomic regions among different SSR types, sometimes even in a chromosome-specific manner. Based on X- chromosomes analysis Mus musculus of primates group contains highest number of microsatellites i.e. 79146 while Meleagris gallopavo of the avian group had the least number (i.e. 58) of microsatellites. Complex microsatellites also followed same pattern of occurrence and were highest in the primates group and least in avian growing-type type SSRs were reported highest in Bos taurus of the even-toed ungulates group and lowest in Meleagris gallopavo of avian group. Based on Y chromosomes analysis Mus musculus of primates group scored highest with total of 49725 microsatellites. Anopheles gambie of insect group contained the least microsatellites with total of 4 numbers. Gallus gallus of avian group contained highest and Drosophila melanogastor of insect group contained lowest mono type microsatellites respectively. Complex type SSRs were reported highest in Mus musculus rodent group and lowest in Anopheles gambie i.e. 0.
Mining of CpG island in female dominant chromosomes revealed the highest numbers of 50388 in Anopheles gambie of the insect group and the least in Meleagris gallopavo of avian group with 83 CpG islands. Based on male dominant chromosome analysis (i.e. Y chromosome) CpG islands were found highest in gallus gallus of the avian group i.e. 4635 and least in Anopheles gambie of the insect group i.e. 3 respectively. It was concluded from this study that female dominant chromosome (i.e. X chromosome) contained highest number of both microsatellites and CpG islands as compared to male dominant Y chromosomes. It could be hypothesized that the female sex could be more prone to mutations and involved in evolution more importantly than males. Mutation rate could depend upon species type, age, sex of the individual, type of chromosome, and type of allele loci. The knowledge obtained from this study can be used to understand various aspects and functions of genome organization, for marker-assisted selection in breed improvement, characterization, conservation and DNA fingerprinting. This analysis left a few questions, for example, why some repeats are in huge numbers and others extremely rare? What is the structural and functional basis for specific SSRs' chromosome-specific differential abundance? To understand the genome-wide gene structural and functional studies other kinds of DNA sequences and repeats will be needed to be analyzed and evaluated.
Data availability
Data openly available in a public repository
This manuscript contains the following underlying data:
| S.N. | Animal Name | Accession Number (Y Chr) | URL | Accession Number (X Chr) | URL |
| 1 | Chlorocebus sabaeus (Green Monkey) | CM001940.1 | https://www.ncbi.nlm.nih.gov/nuccore/CM001940.1 | CM001951.2 | https://www.ncbi.nlm.nih.gov/nuccore/CM001951.2 |
| 2 | Homo sapiens (Human) | CM000686.2 | https://www.ncbi.nlm.nih.gov/nuccore/CM000686.2 | CM000685.2 | https://www.ncbi.nlm.nih.gov/nuccore/CM000685.2 |
| 3 | Callithrix jacchus (White-tufted-ear marmoset) | CM000879.1 | https://www.ncbi.nlm.nih.gov/nuccore/CM000879.1 | CM000878.1 | https://www.ncbi.nlm.nih.gov/nuccore/CM000878.1 |
| 4 | Rattus norvegicus (Norway rat) | CM002824.1 | https://www.ncbi.nlm.nih.gov/nuccore/CM002824.1 | CM000092.5 | https://www.ncbi.nlm.nih.gov/nuccore/CM000092.5 |
| 5 | Mus musculus (House mouse) | CM001014.2 | https://www.ncbi.nlm.nih.gov/nuccore/CM001014.2 | CM001013.2 | https://www.ncbi.nlm.nih.gov/nuccore/CM001013.2 |
| 6 | Sus scrofa (Pig) | CM001155.2 | https://www.ncbi.nlm.nih.gov/nuccore/CM001155.2 | CM000830 | https://www.ncbi.nlm.nih.gov/nuccore/CM000830 |
| 7 | Anopheles gambiae (Mosquito) | KJ608153.1 | https://www.ncbi.nlm.nih.gov/nuccore/KJ608153.1 | CM000360.1 | https://www.ncbi.nlm.nih.gov/nuccore/CM000360.1 |
| 8 | Bos Taurus (Cow) | CM001061.2 | https://www.ncbi.nlm.nih.gov/nuccore/CM001061.2 | GK000030.2 | https://www.ncbi.nlm.nih.gov/nuccore/GK000030.2 |
| 9 | Pan troglodytis (Common chimpanzee) | NC_006492.3 | https://www.ncbi.nlm.nih.gov/nuccore/NC_006492.3 | CM000336.2 | https://www.ncbi.nlm.nih.gov/nuccore/CM000336.2 |
| 10 | Gallus gallus (Chicken) | CM000122.3 (Z) | https://www.ncbi.nlm.nih.gov/nuccore/CM000122.3 | CM000121.3 (W) | https://www.ncbi.nlm.nih.gov/nuccore/CM000121.3 |
| 11 | Meleagris gallopavo (Wild turkey) | CM000993.2 (Z) | https://www.ncbi.nlm.nih.gov/nuccore/CM000993.2 | CM000992.2 (W) | https://www.ncbi.nlm.nih.gov/nuccore/CM000992.2 |
| 12 | Drosophila melanogaster (Fruit fly) | CP007106.1 | https://www.ncbi.nlm.nih.gov/nuccore/CP007106.1 | AE014298.5 | https://www.ncbi.nlm.nih.gov/nuccore/AE014298.5 |
References
- Antequera, F. (2003). Structure, function and evolution of CpG island promoters. Cellular and Molecular Life Sciences. 60(8): 1647-1658. [CrossRef]
- Antequera, F., & Bird, A. (1999). CpG islands as genomic footprints of promoters that are associated with replication origins. Current Biology. 9(17): R661-R667. [CrossRef]
- Bird A, Taggart M, Frommer M, Miller O J and Macleod D. (1985). A fraction of the mouse genome that is derived from islands of nonmethylated, CpGrich DNA. Cell 40(1): 9199. [CrossRef]
- Blackmon, H., Ross, L., &Bachtrog, D. (2017). Sex determination, sex chromosomes, and karyotype evolution in insects. Journal of Heredity. 108(1):78-93. [CrossRef]
- Borstnik B, Pumpernik D. (2002). Tandem repeats in protein coding regions of primate genes (2002). Genome Res. 12:909-915. [CrossRef]
- Cechova, M., & Miga, K. H. (2022, May). Satellite DNAs and human sex chromosome variation. In Seminars in Cell & Developmental Biology. Academic Press. [CrossRef]
- Cooper D N, Taggart M H and Bird A P. (1983). Unmethlated domains in vertebrate DNA. Nucleic acids research. 11(3): 647658. [CrossRef]
- Duncan, C. G., Grimm, S. A., Morgan, D. L., Bushel, P. R., Bennett, B. D., Roberts, J. D., & Wade, P. A. (2018). Dosage compensation and DNA methylation landscape of the X chromosome in mouse liver. Scientific reports. 8(1):1-17. [CrossRef]
- Gardiner-Garden, M., & Frommer, M. (1987). CpG islands in vertebrate genomes. Journal of molecular biology. 196(2):261-282. [CrossRef]
- Graves, J. A. M. (2006). Sex chromosome specialization and degeneration in mammals. Cell. 124(5) :901-914. [CrossRef]
- Hakki EE, Akkaya MS. (2000). Microsatellite isolation using amplified fragment lengthpolymorphism markers: no cloning, no screening. Molecular Ecology.9:2152-2154. [CrossRef]
- Hughes, J. F., Skaletsky, H., Pyntikova, T., Minx, P. J., Graves, T., Rozen, S.,& Page, D. C. (2005). Conservation of Y-linked genes during human evolution revealed by comparative sequencing in chimpanzee. Nature. 437(7055):100-103. [CrossRef]
- Kananen, L., & Marttila, S. (2021). Ageing-associated changes in DNA methylation in X and Y chromosomes. Epigenetics & chromatin. 14(1): 1-10. [CrossRef]
- Kapila N, Sharma A, Kishore A, Sodhi M, Tripathi P K, Mohanty A K and Mukesh M. (2016). Impact of heat stress on cellular and transcriptional adaptation of mammary epithelial cells in swine (Sus scrofa). PloS one. 11(9): e0157237. [CrossRef]
- Karagyozov L, Kalcheva ID, Chapman VM. (1993). Construction of random small-insertgenomic libraries highly enriched for simple sequence repeats. Nucleic Acids Research. 21:3911- 3912. [CrossRef]
- Kunzler P, Matsuo K, Schaffner W: Pathological, physiological, and evolutionary aspects of short unstable DNA repeats in the human genome. (1995). BiolChem Hoppe Seyler. 4:201-211.
- Lander E S, Linton L M, Birren B, Nusbaum C, Zody M C, Baldwin J and Proctor M J. (2001). Initial sequencing and analysis of the human genome.67: 209 213. [CrossRef]
- Larsen F, Gundersen G, Lopez R and Prydz H. (1992). CpG islands as gene markers in the human genome. Genomics. 13(4): 10951107. [CrossRef]
- Moxon ER, Wills C: DNA microsatellites: agents of evolution? (1999)Sci Am, 280:94-99. [CrossRef]
- Muyle, A., Bachtrog, D., Marais, G. A., & Turner, J. M. (2021). Epigenetics drive the evolution of sex chromosomes in animals and plants. Philosophical Transactions of the Royal Society B. 376(1826):20200124. [CrossRef]
- Okano M, Bell DW, Haber DA, Li E. (1999). DNA methyltransferases Dnmt3a and Dnmt3b are essential for de novo methylation and mammalian development. Cell. 99: 247–257. [CrossRef]
- Priolli RHG, Mendes-Junior CT, Arantes NE and Contel EPB. (2002). Characterization of Brazilian soybean cultivars using microsatellite markers. Genet Mol Biol. 25:185-193. [CrossRef]
- Robinson, P. N. et al. 2004. “Gene-Ontology analysis reveals association of tissue specific 5’ CpG-island genes with development and embryogenesis.” Human Molecular Genetics. 1969-78. [CrossRef]
- Romanenko, S. A., Perelman, P. L., Trifonov, V. A., &Graphodatsky, A. S. (2012). Chromosomal evolution in Rodentia. Heredity.108(1): 4-16. [CrossRef]
- Saghai-Maroof MA, Biyashev RM, Yang GP, Zang Q and Allard RW. (1994).Extraordinarily polymorphic microsatellites DNA in barley species diversity, chromosomal locations, and population dynamics. ProcNatlAcadSci USA.91:5466-6470. [CrossRef]
- Samuelsson T. (2010). Group project for Sequence Bioinformatics course. Chalmers University of Technology. [online]. Available at: http://bio.lundberg.gu.se/courses/ht10/bio2/group_projects_2010.pdf.
- Shyamala, N., Kongettira, C. L., Puranam, K., Kupsal, K., Kummari, R., Padala, C., & Hanumanth, S. R. (2022). In silico identification of single nucleotide variations at CpG sites regulating CpG island existence and size. Scientific reports. 12(1):1-17. [CrossRef]
- Stevens, L. (1997). Sex chromosomes and sex determining mechanisms in birds. Science Progress. 80:197-216.
- Takai, D., and Peter Jones. (2002). “Comprehensive analysis of CpG islands in human chromosomes 21 and 22.” PNAS. [CrossRef]
- Tautz D and Renz M. (1984). Simple sequence repeats are ubiquitous repetitive components of eukaryotic genomes. Nucl Acids Res. 12:4127-4137. [CrossRef]
- Thomson, J. P., Skene, P. J., Selfridge, J., Clouaire, T., Guy, J., Webb, S., & Bird, A. (2010). CpG islands influence chromatin structure via the CpG-binding protein Cfp1. Nature. 464(7291): 1082-1086. [CrossRef]
- Wang, H., Gao, S., Liu, Y., Wang, P., Zhang, Z., & Chen, D. (2022). A pipeline for effectively developing highly polymorphic simple sequence repeats markers based on multi-sample genomic data. Ecology and evolution.12(3):e8705. [CrossRef]
- Yu K, Park J, Poysa V and Gepts P. (2000). Integration of Simple Sequence Repeats (SSR) markers into a molecular linkage map of common bean (Phaseolus vulgaris). J Hered. 91:429-434. [CrossRef]
- Zhao, Z., & Han, L. (2009). CpG islands: algorithms and applications in methylation studies. Biochemical and biophysical research communications. 382(4):643645. [CrossRef]
Figure 1.
Flowchart showing the Microsatellites prediction from X & Y chromosomes of 12 different species.
Figure 1.
Flowchart showing the Microsatellites prediction from X & Y chromosomes of 12 different species.
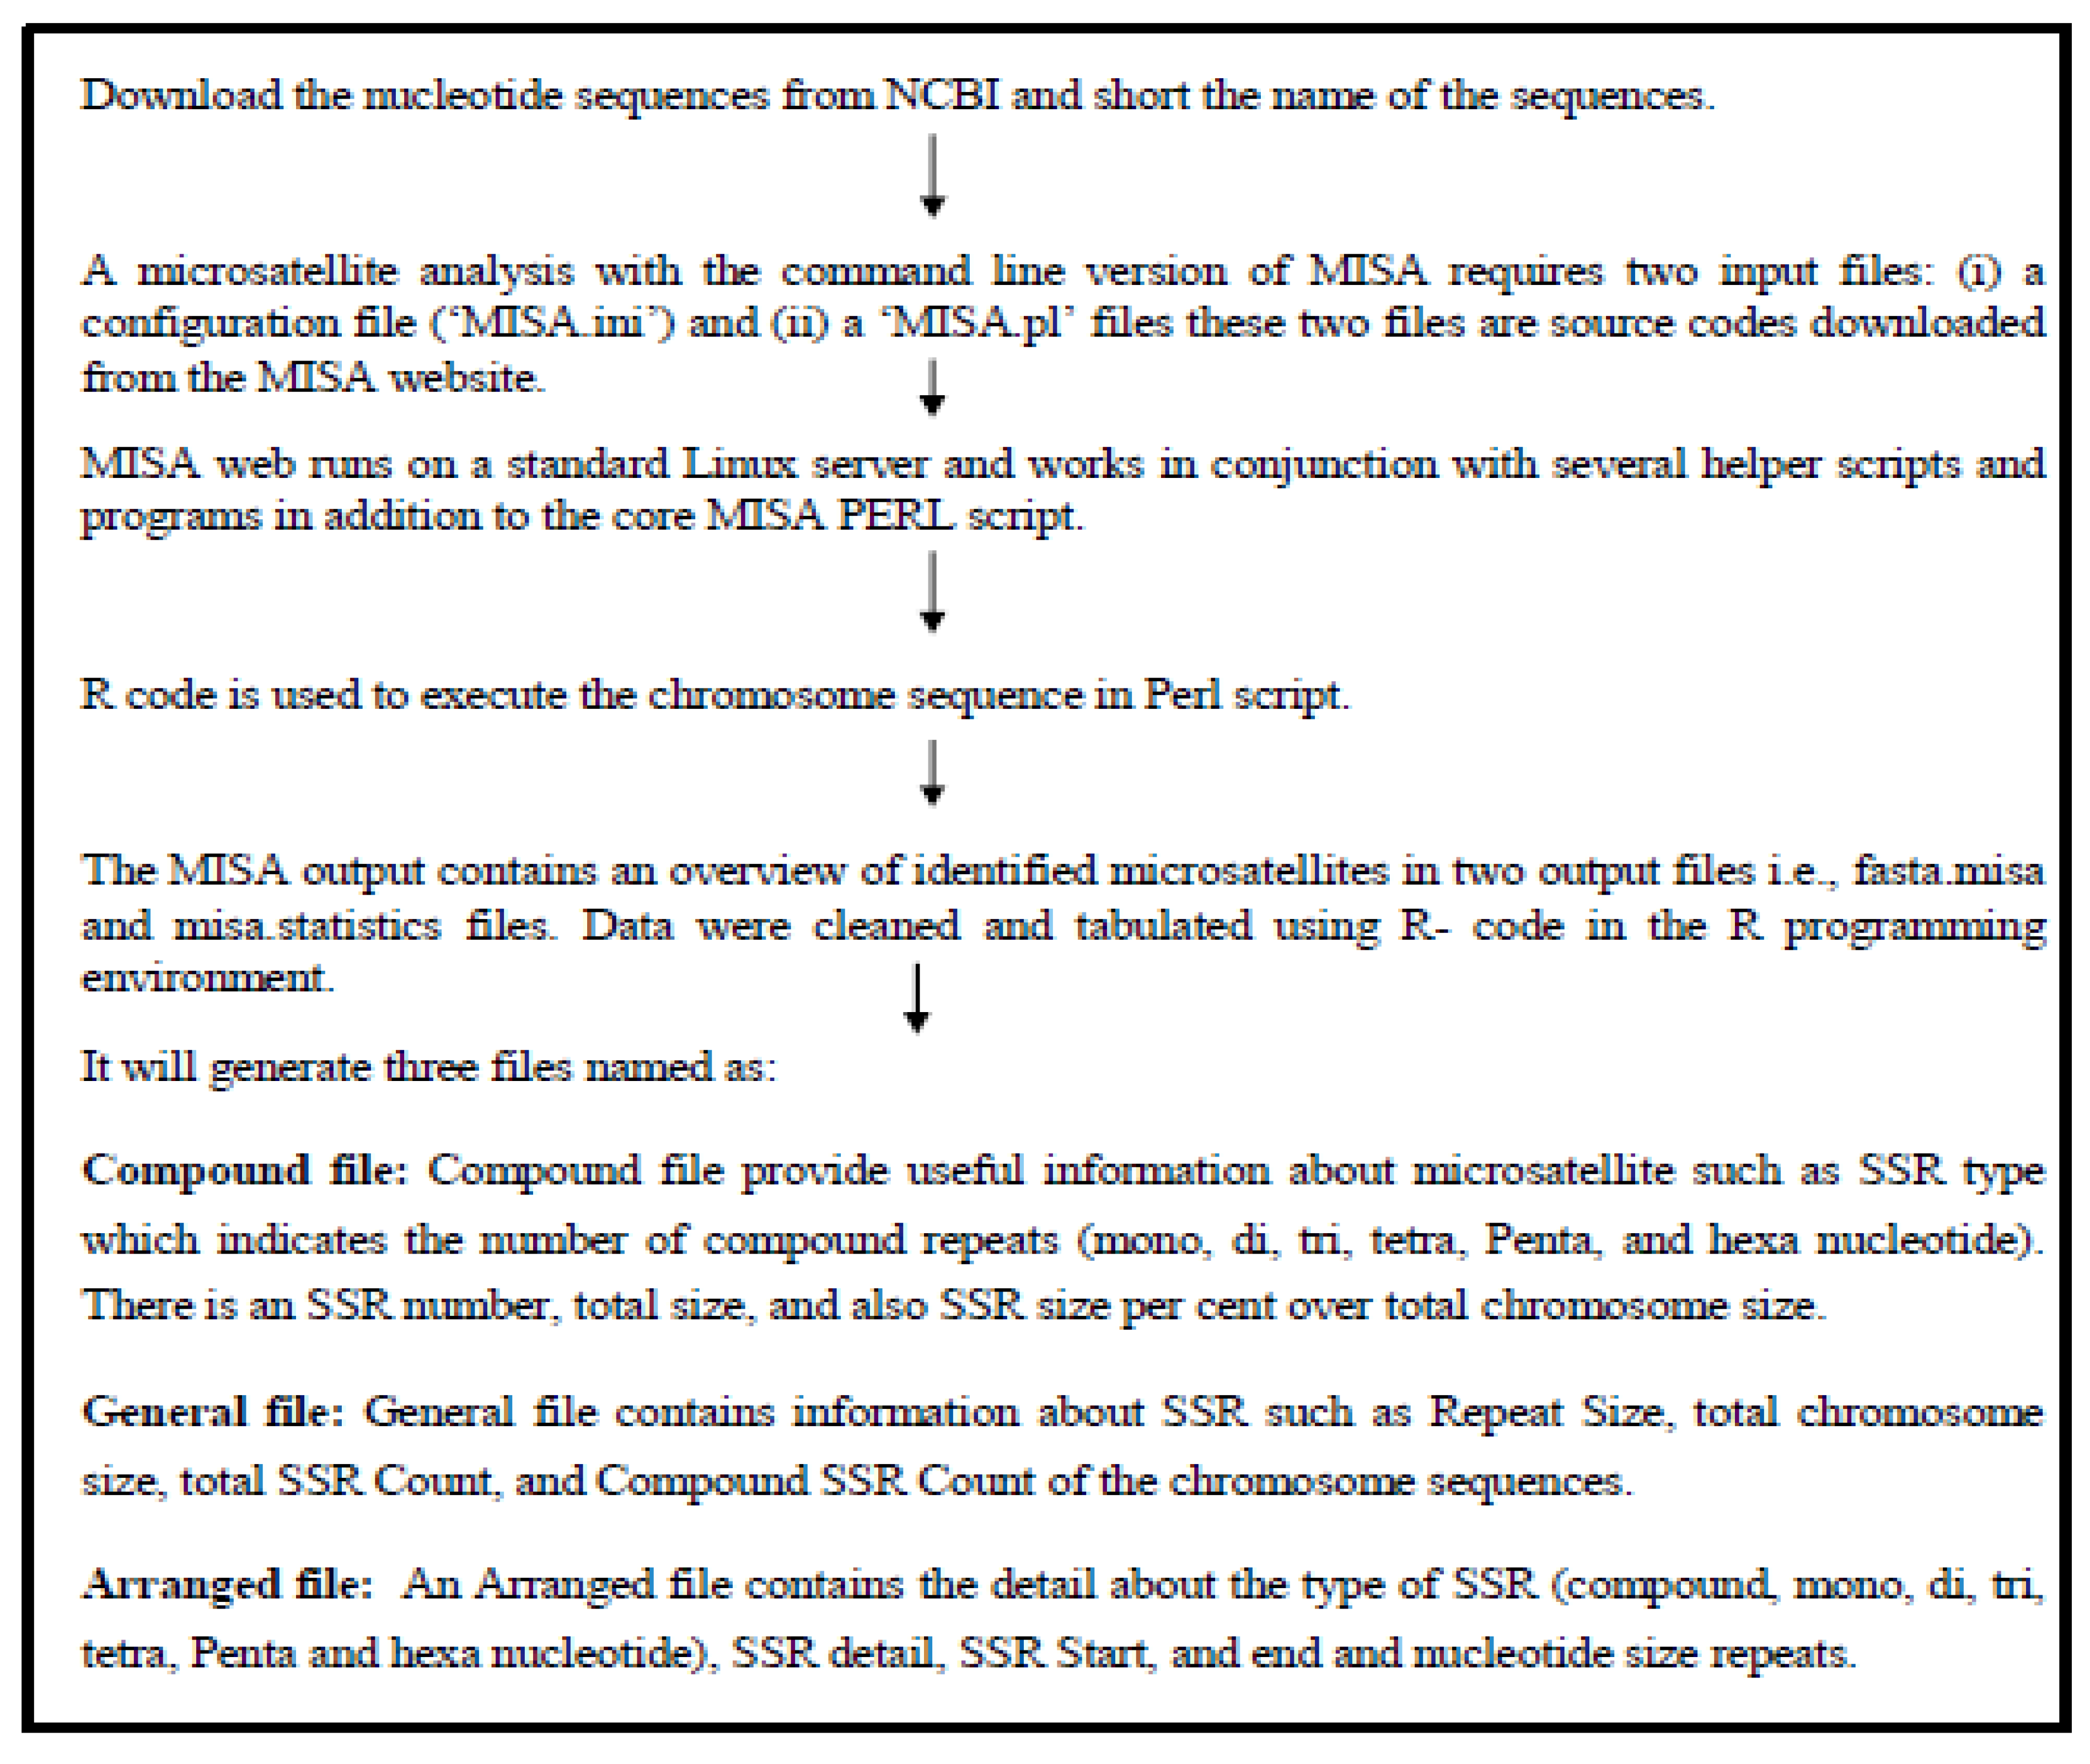
Figure 2.
Flowchart showing the CpG Island prediction from X & Y chromosomes of 12 different species.
Figure 2.
Flowchart showing the CpG Island prediction from X & Y chromosomes of 12 different species.
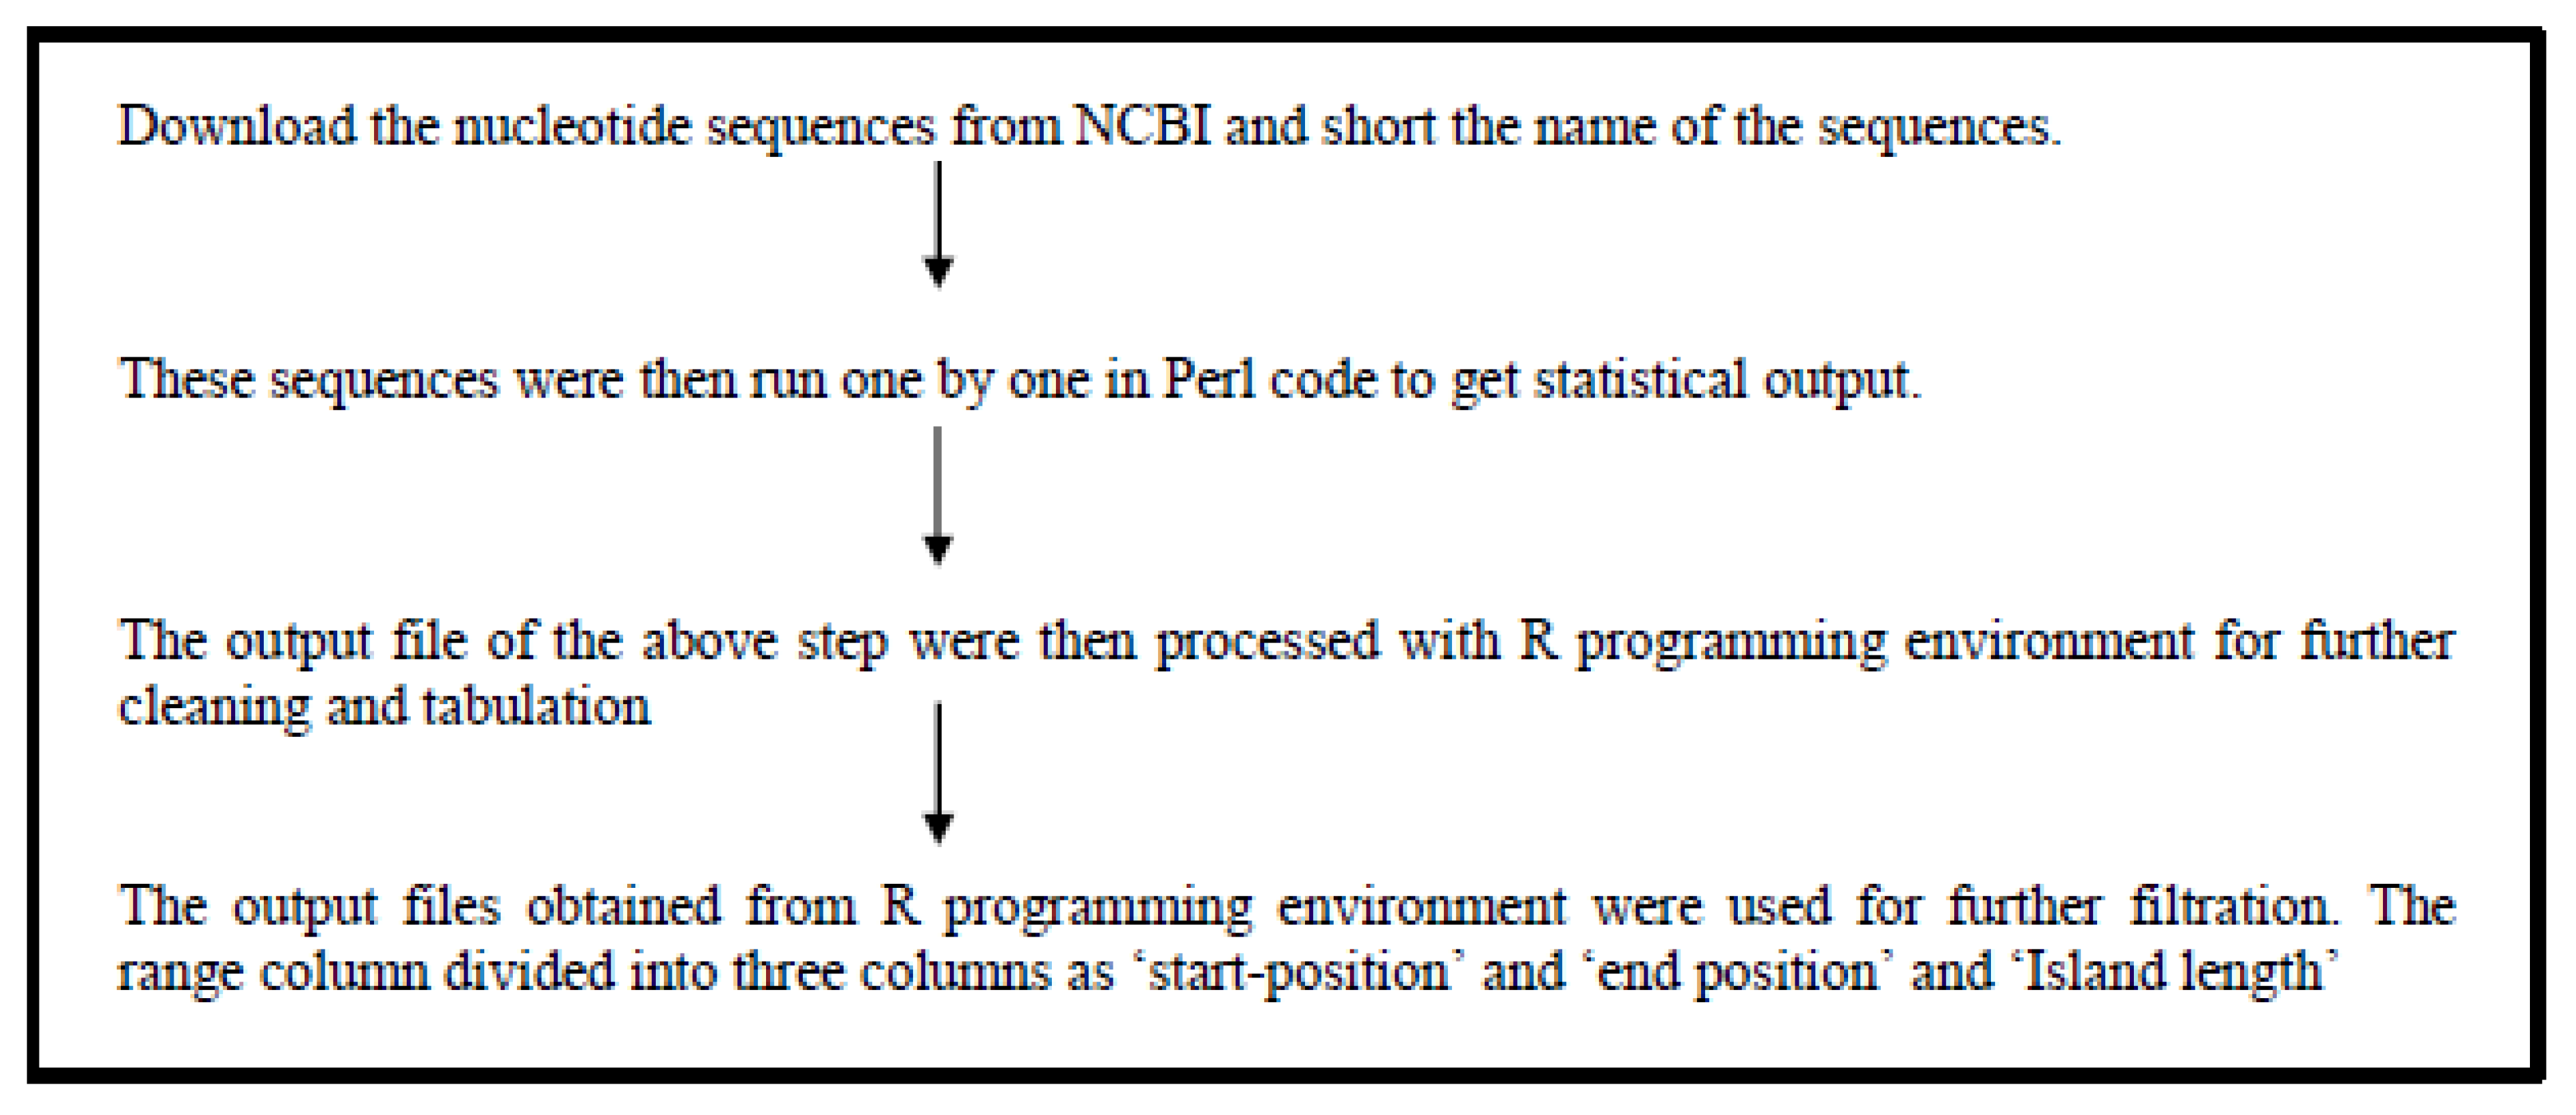
Figure 3.
Number of different SSRs with respective length in W-chromosome of Gallus and Meleagris gallopavo.
Figure 3.
Number of different SSRs with respective length in W-chromosome of Gallus and Meleagris gallopavo.
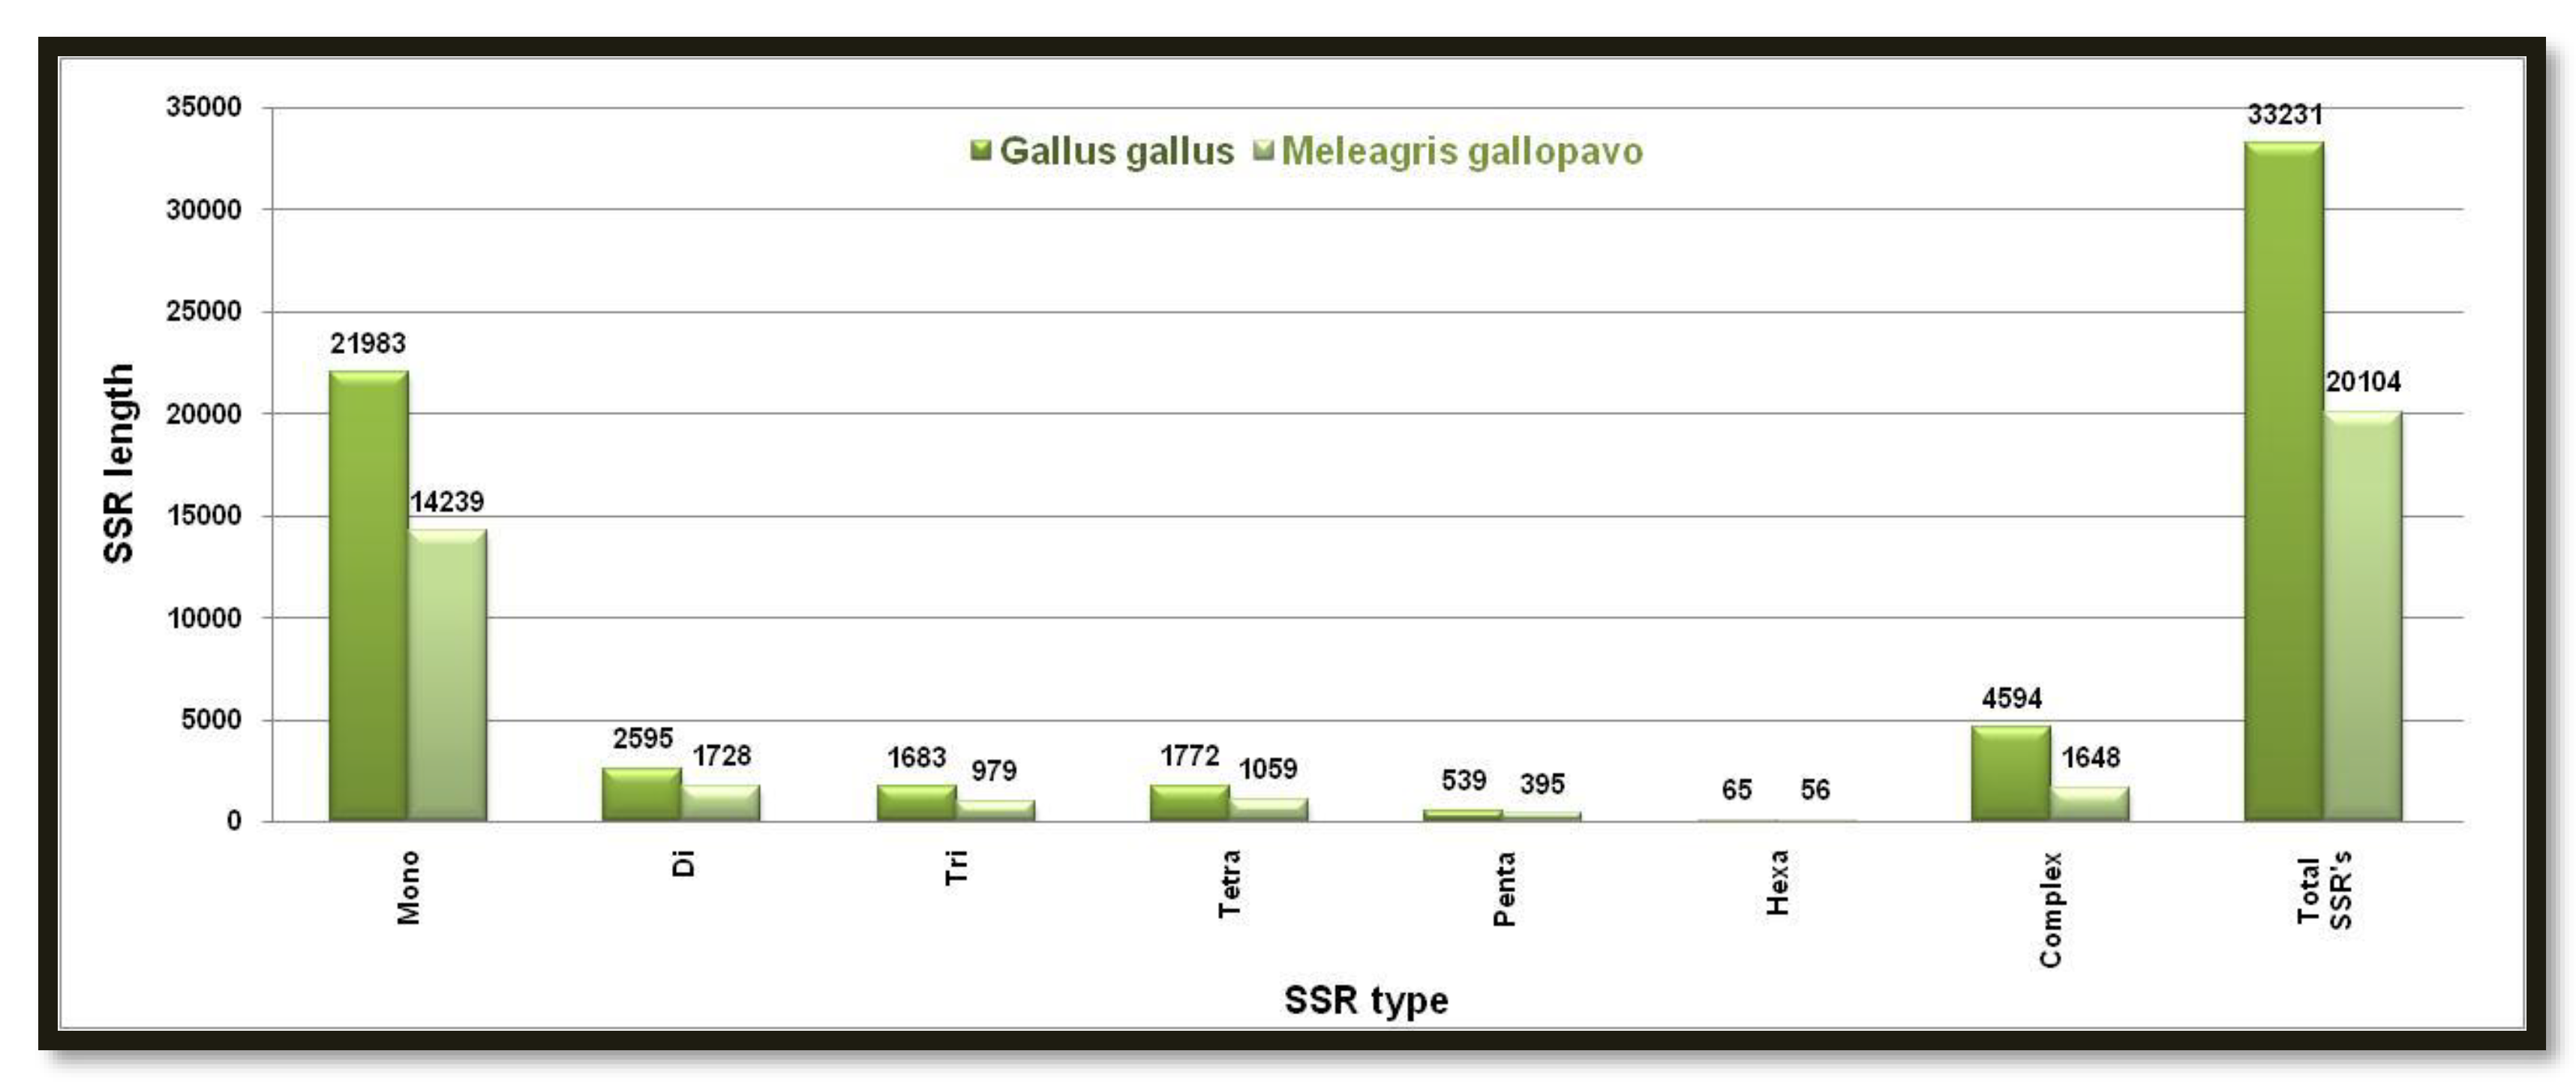
Figure 4.
Number of different SSRs with respective lengths in Z-chromosome of Gallus and Meleagris gallopavo.
Figure 4.
Number of different SSRs with respective lengths in Z-chromosome of Gallus and Meleagris gallopavo.
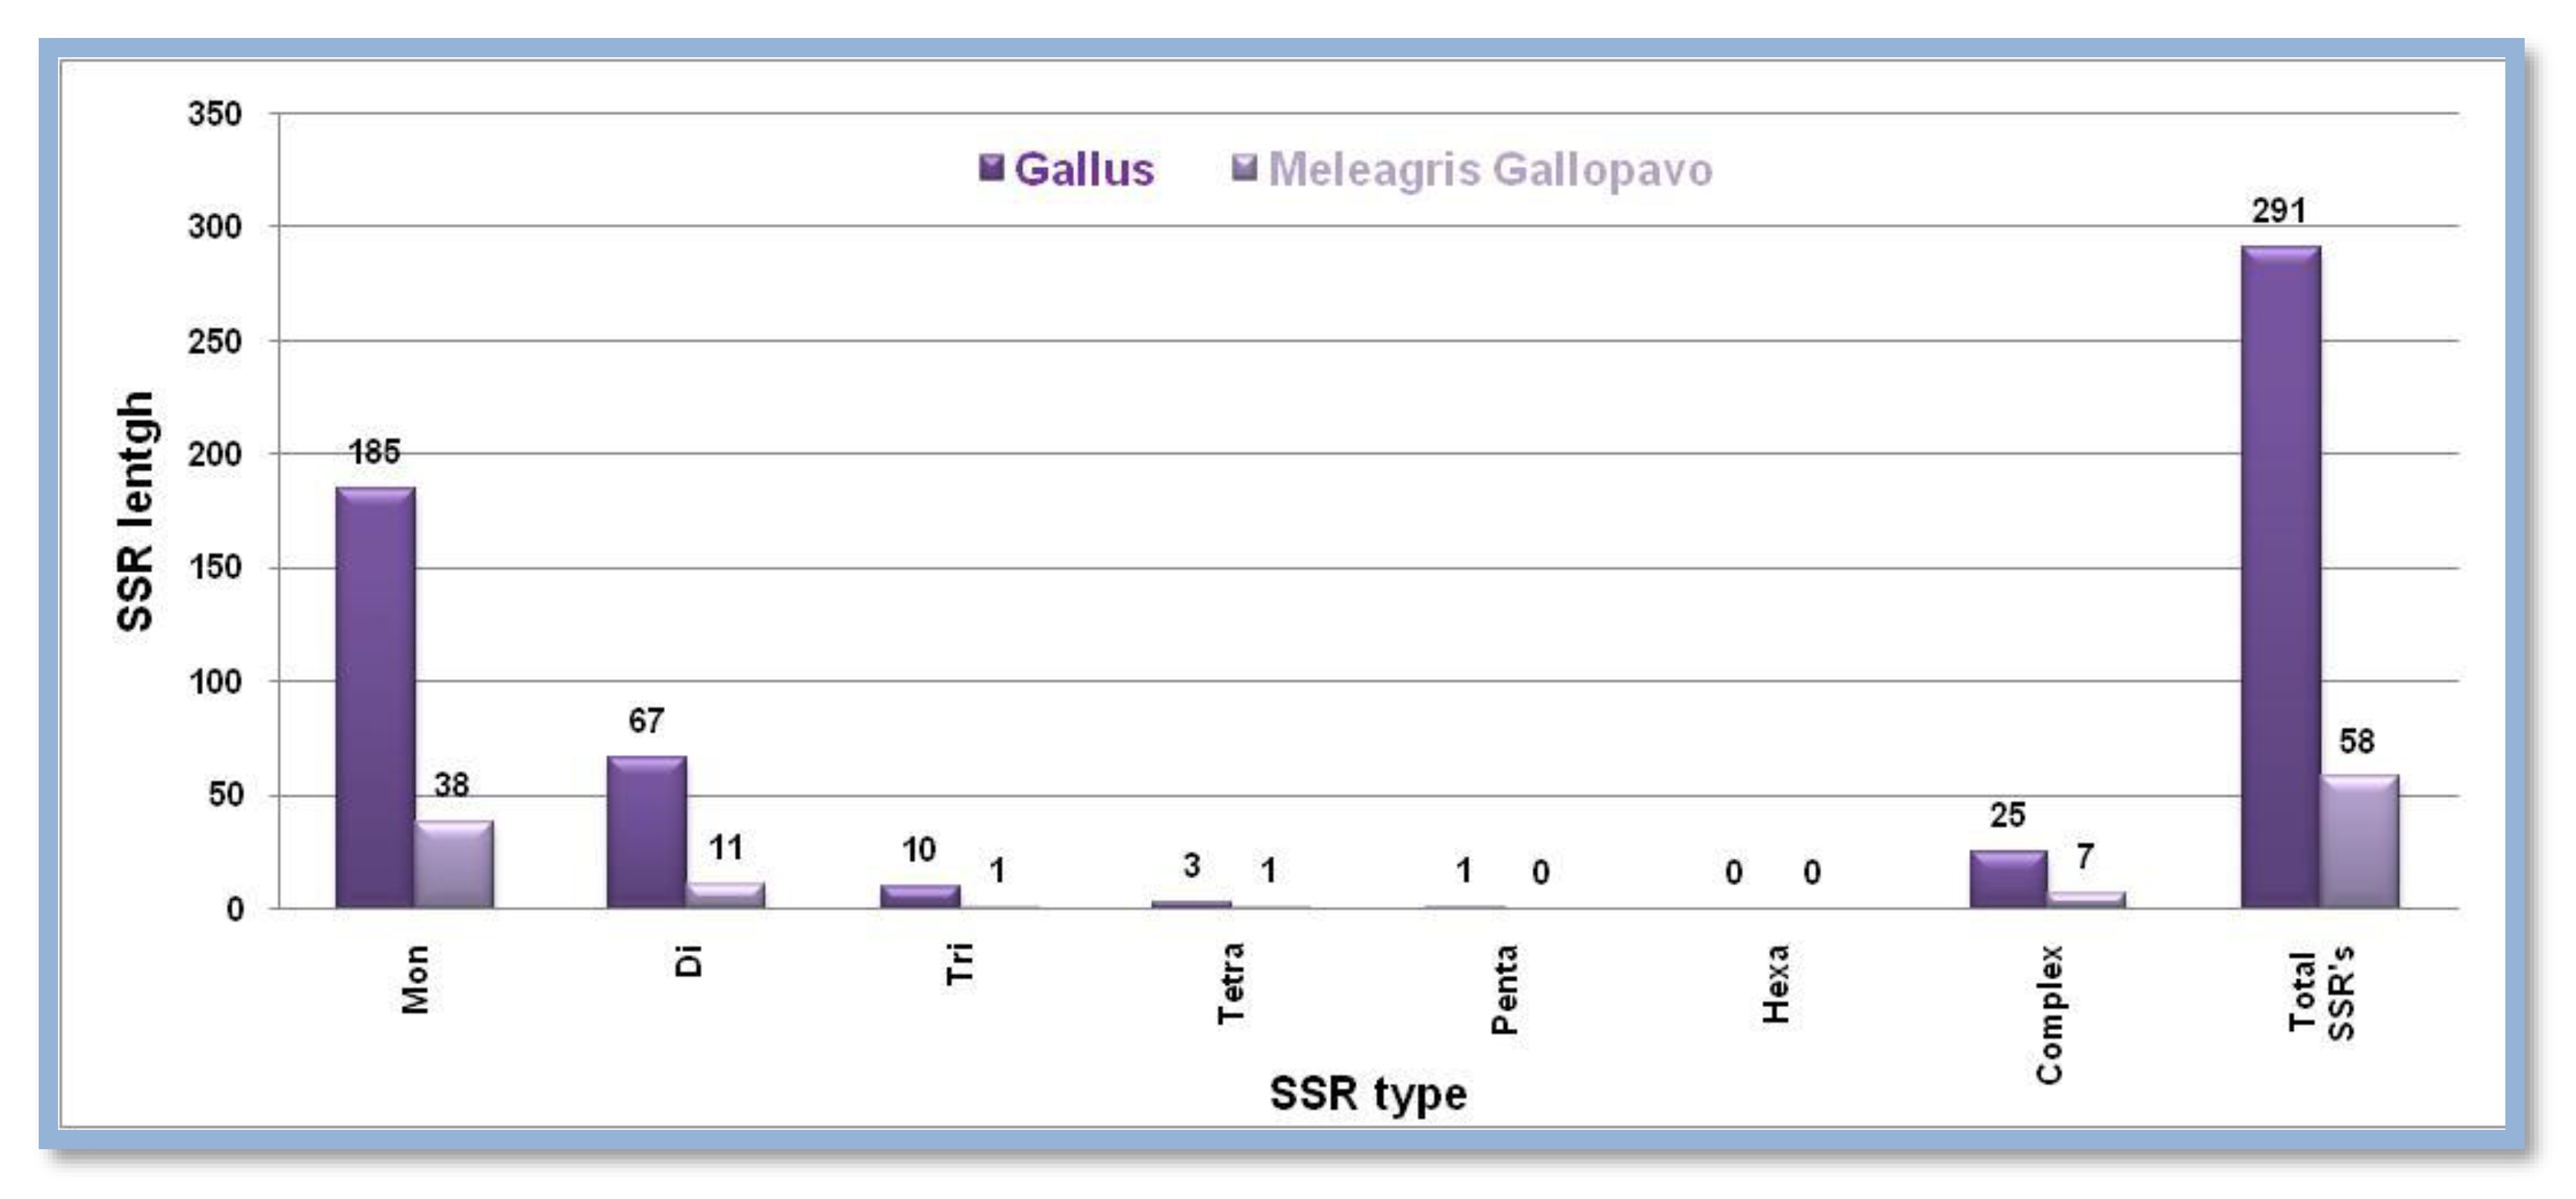
Figure 5.
The number of different SSRs with respective lengths in the X-chromosome of Anopheles gambie and Drosophila melanogaster.
Figure 5.
The number of different SSRs with respective lengths in the X-chromosome of Anopheles gambie and Drosophila melanogaster.
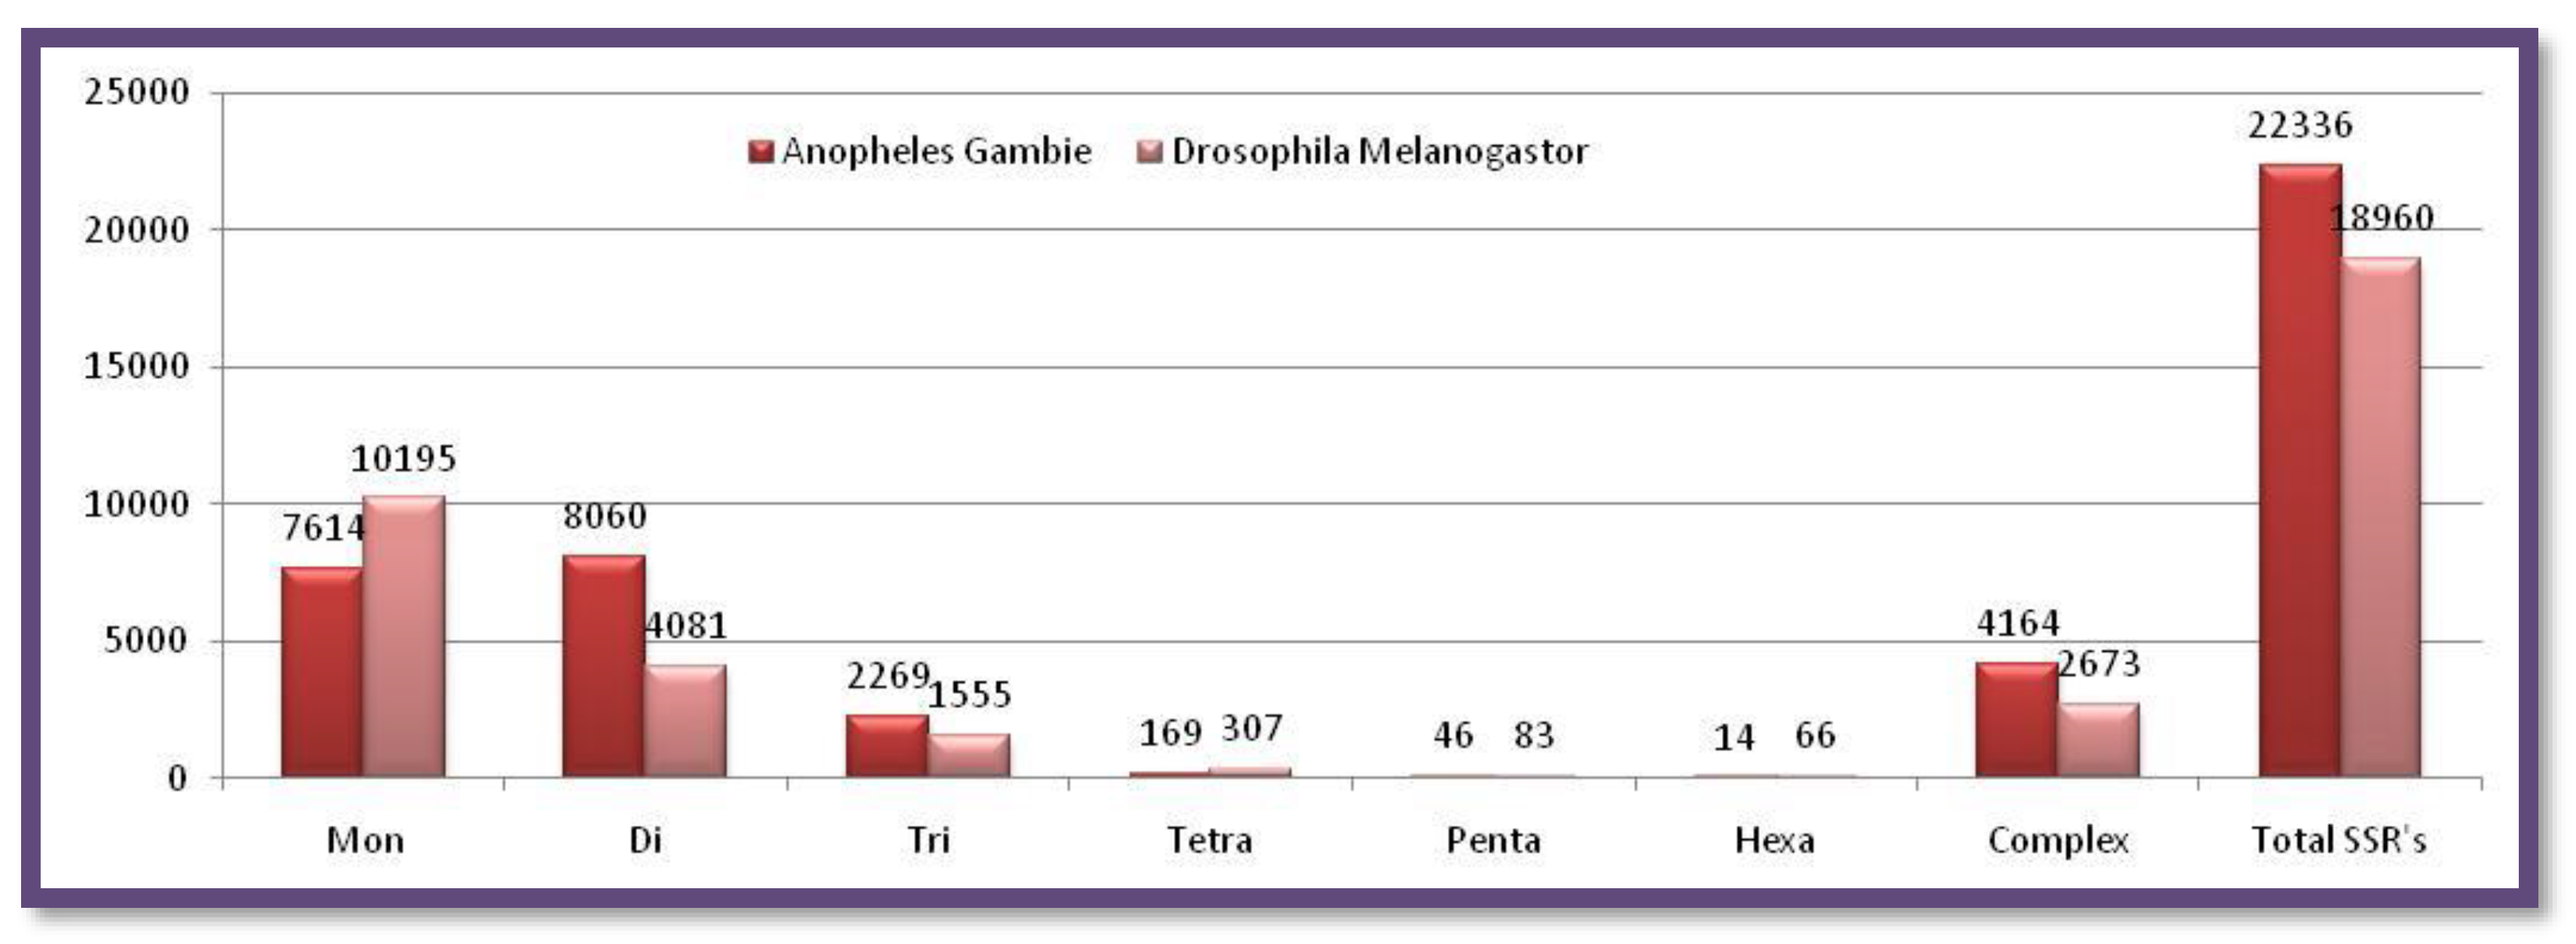
Figure 6.
The number of different SSRs with respective lengths in the Y-chromosome of Anopheles gambieandDrosophila melanogaster.
Figure 6.
The number of different SSRs with respective lengths in the Y-chromosome of Anopheles gambieandDrosophila melanogaster.
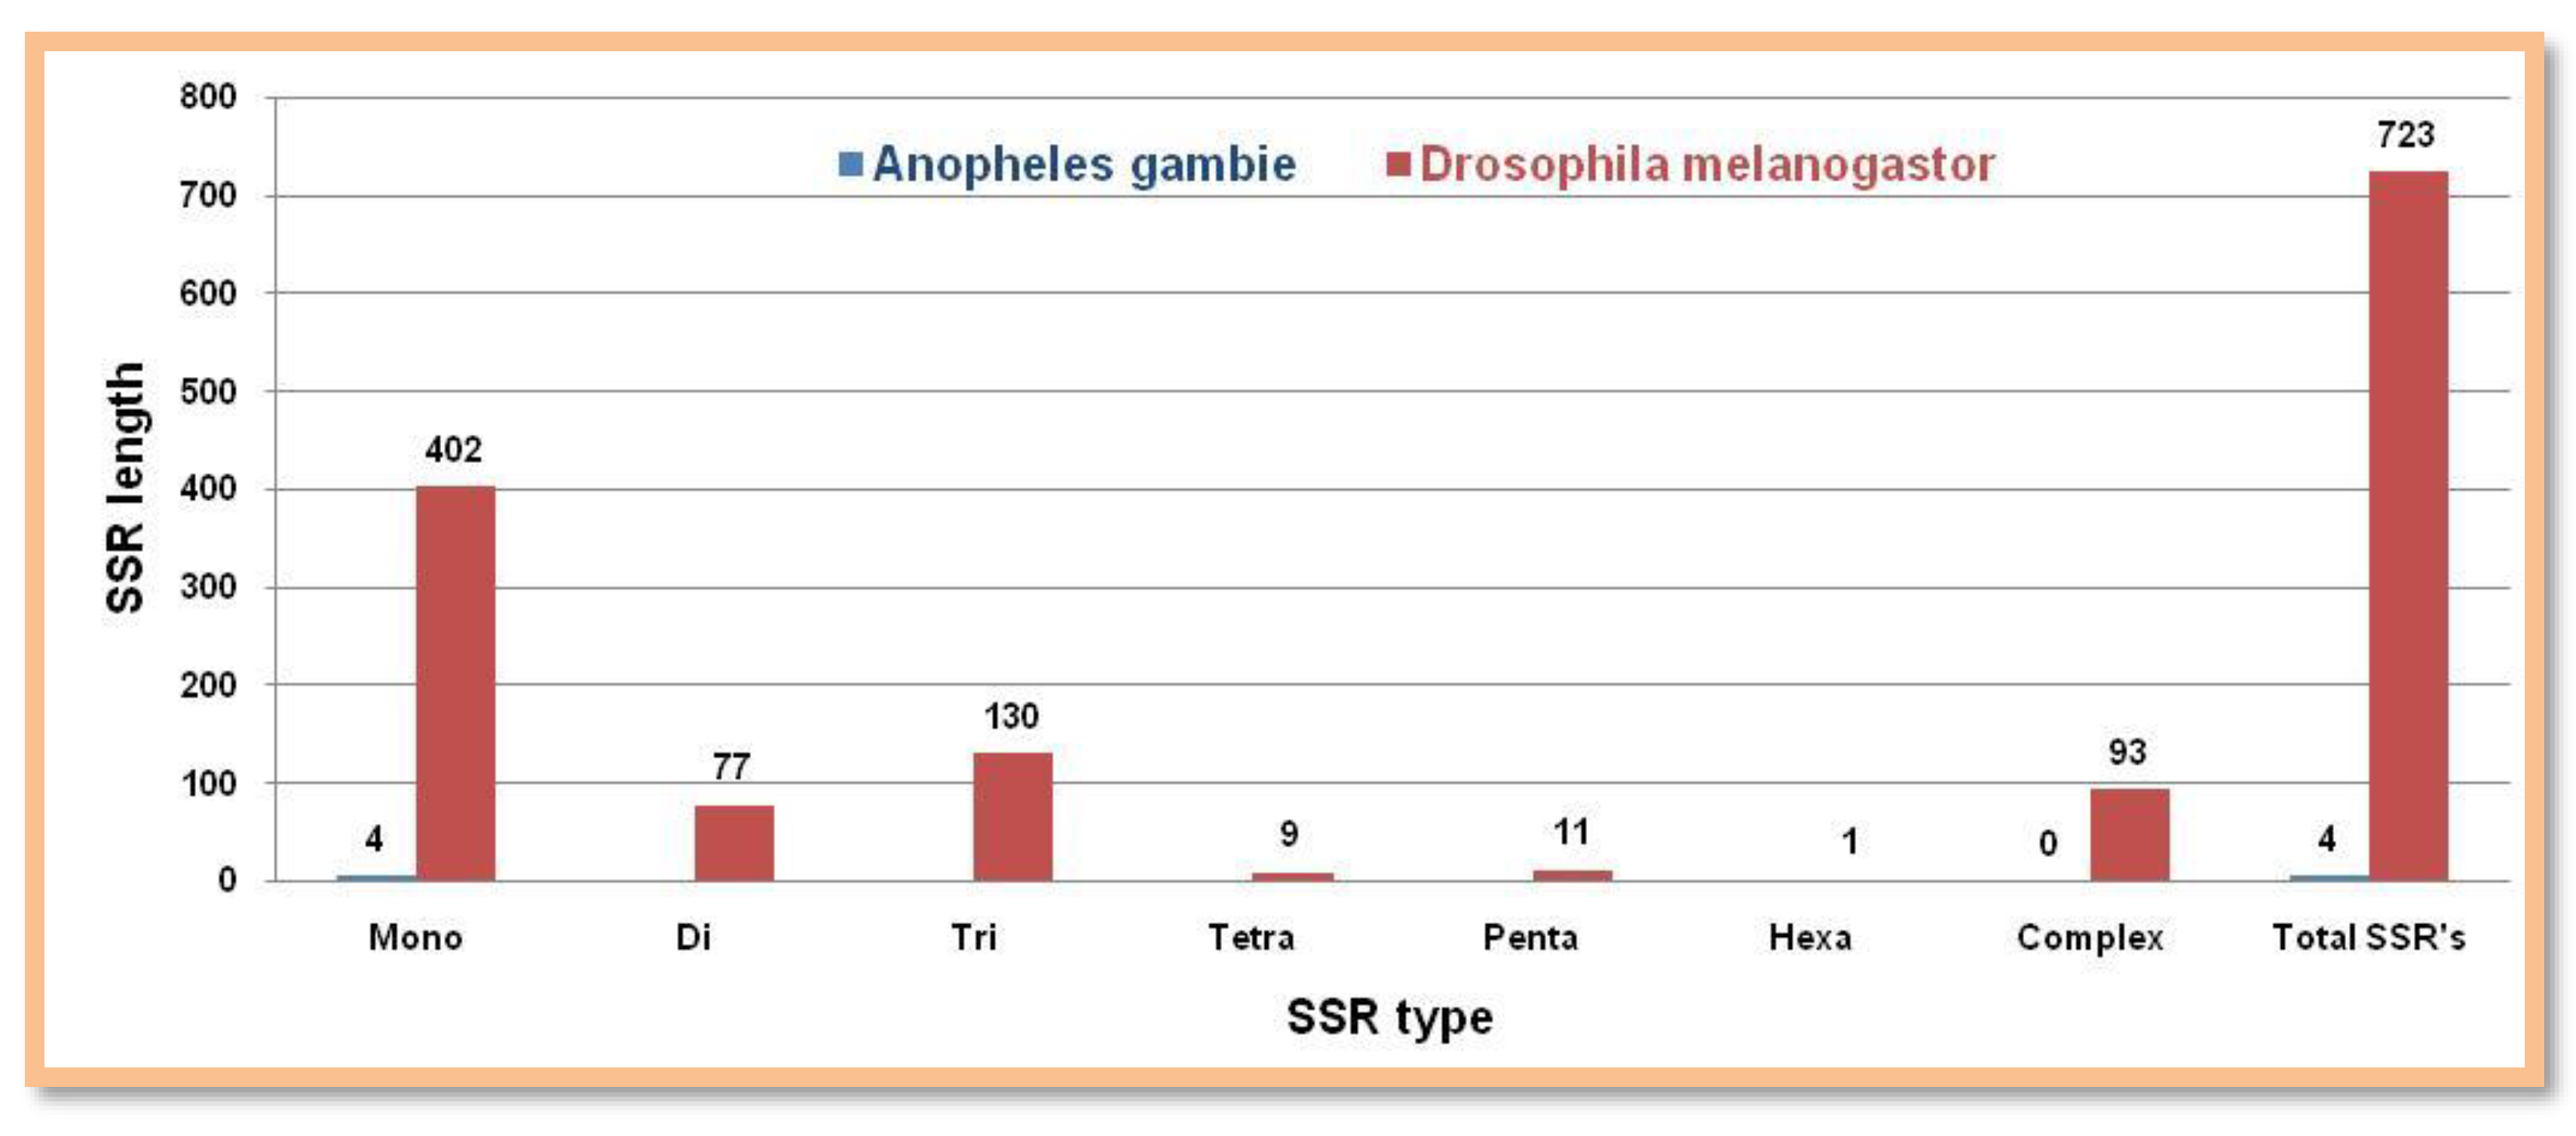
Figure 7.
Number of different SSRs with respective lengths in X-chromosome of Callithrix jacchus, Chlorocebus sabaeus, Homosapiens, and Pan troglodytes.
Figure 7.
Number of different SSRs with respective lengths in X-chromosome of Callithrix jacchus, Chlorocebus sabaeus, Homosapiens, and Pan troglodytes.
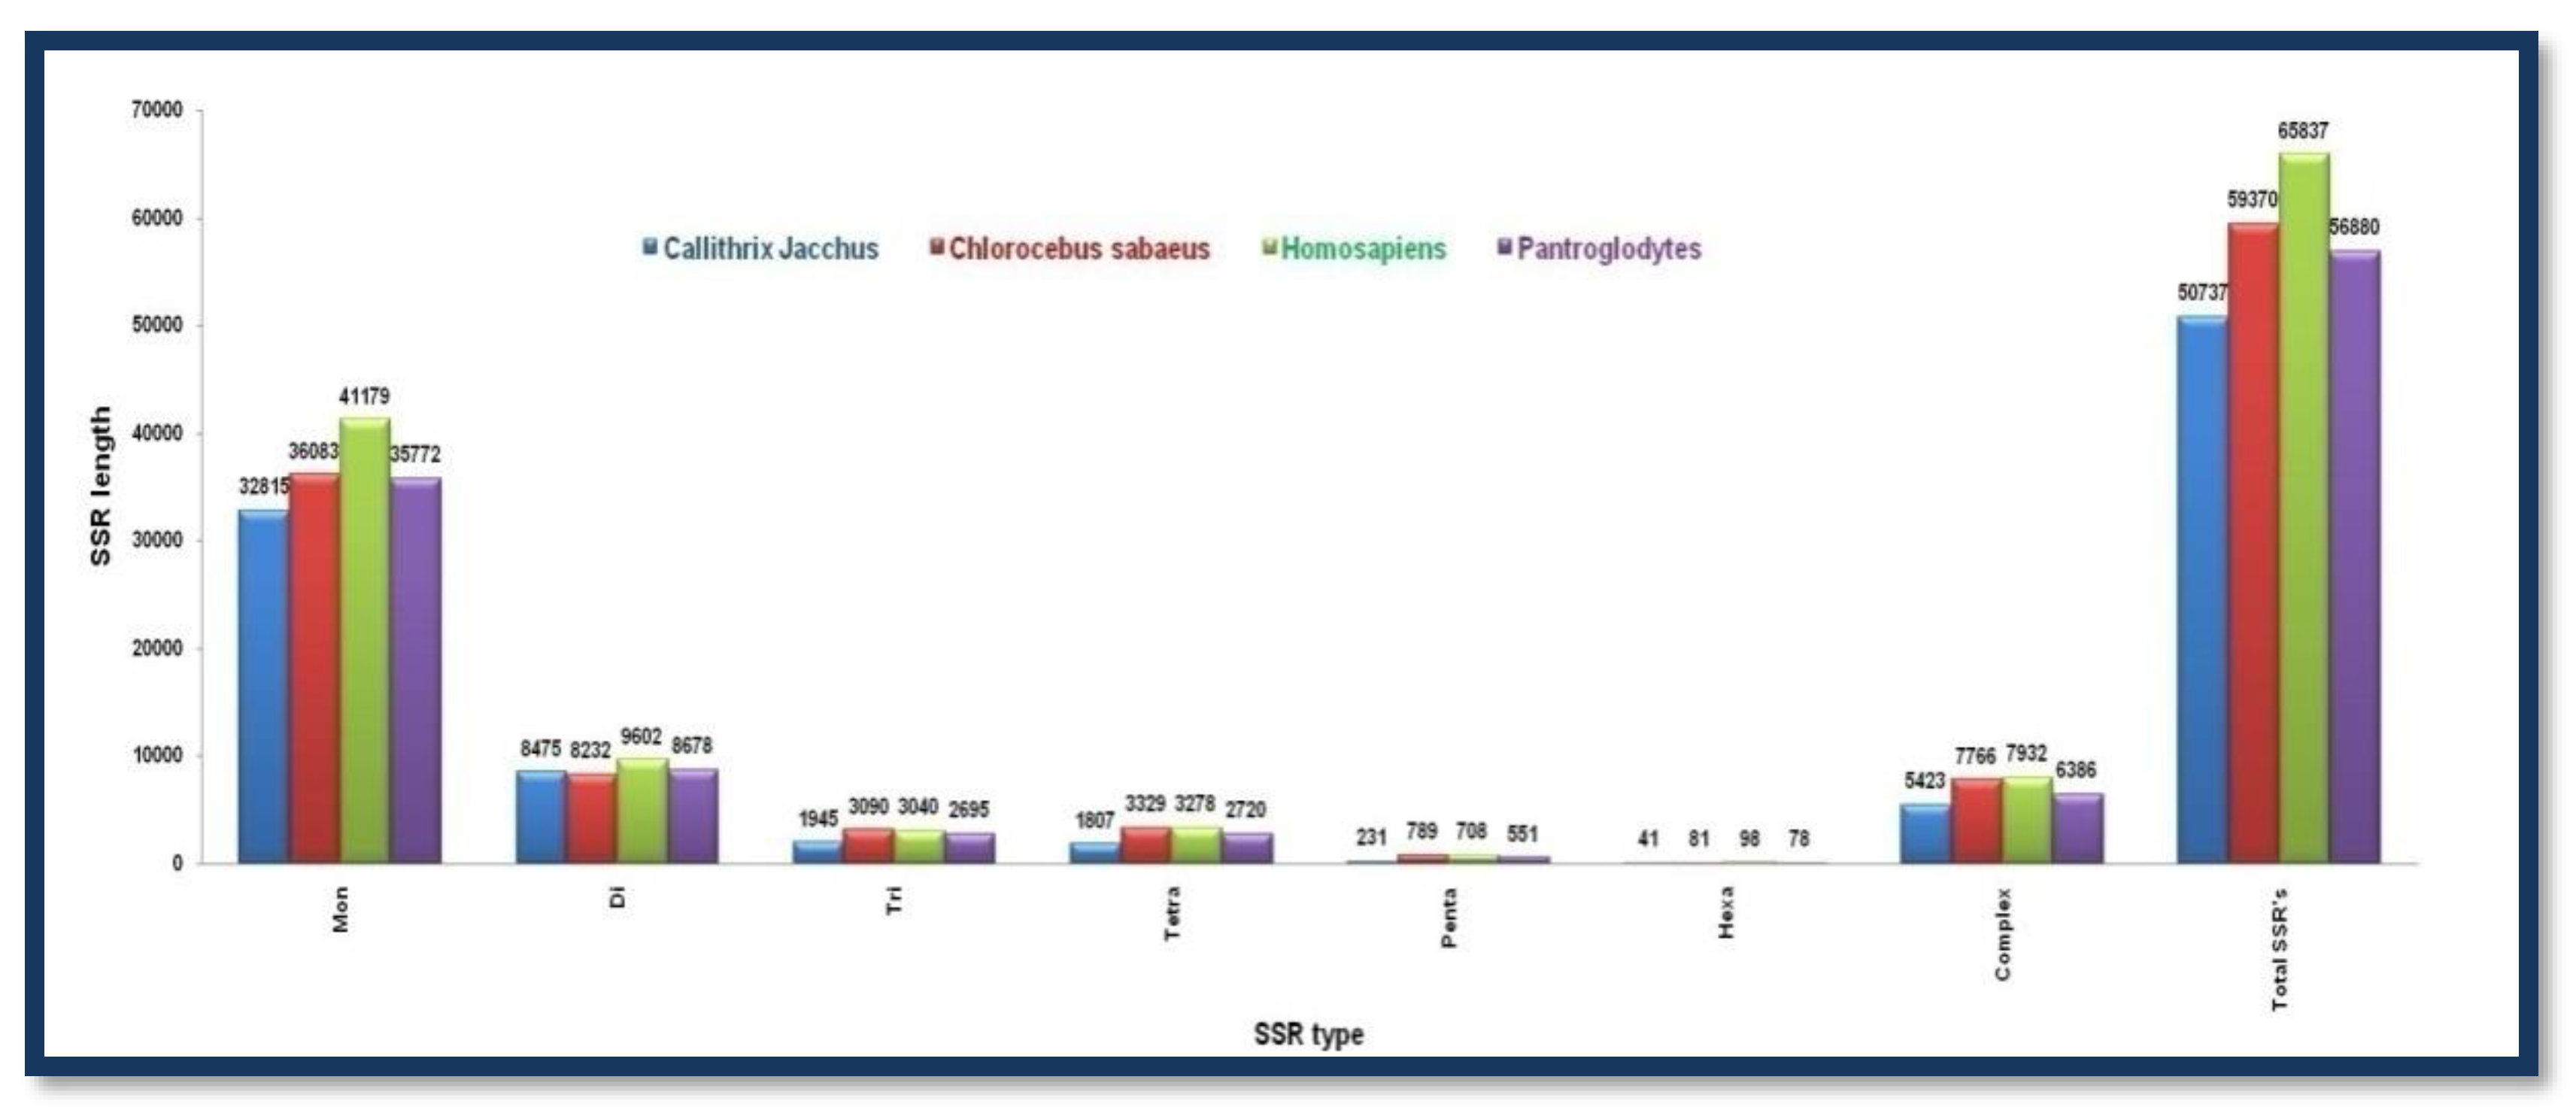
Figure 8.
The number of different SSRs with respective lengths in the Y-chromosome of Callithrix jacchus, Chlorocebus sabaeus, Homosapiens, and Pan troglodytes.
Figure 8.
The number of different SSRs with respective lengths in the Y-chromosome of Callithrix jacchus, Chlorocebus sabaeus, Homosapiens, and Pan troglodytes.
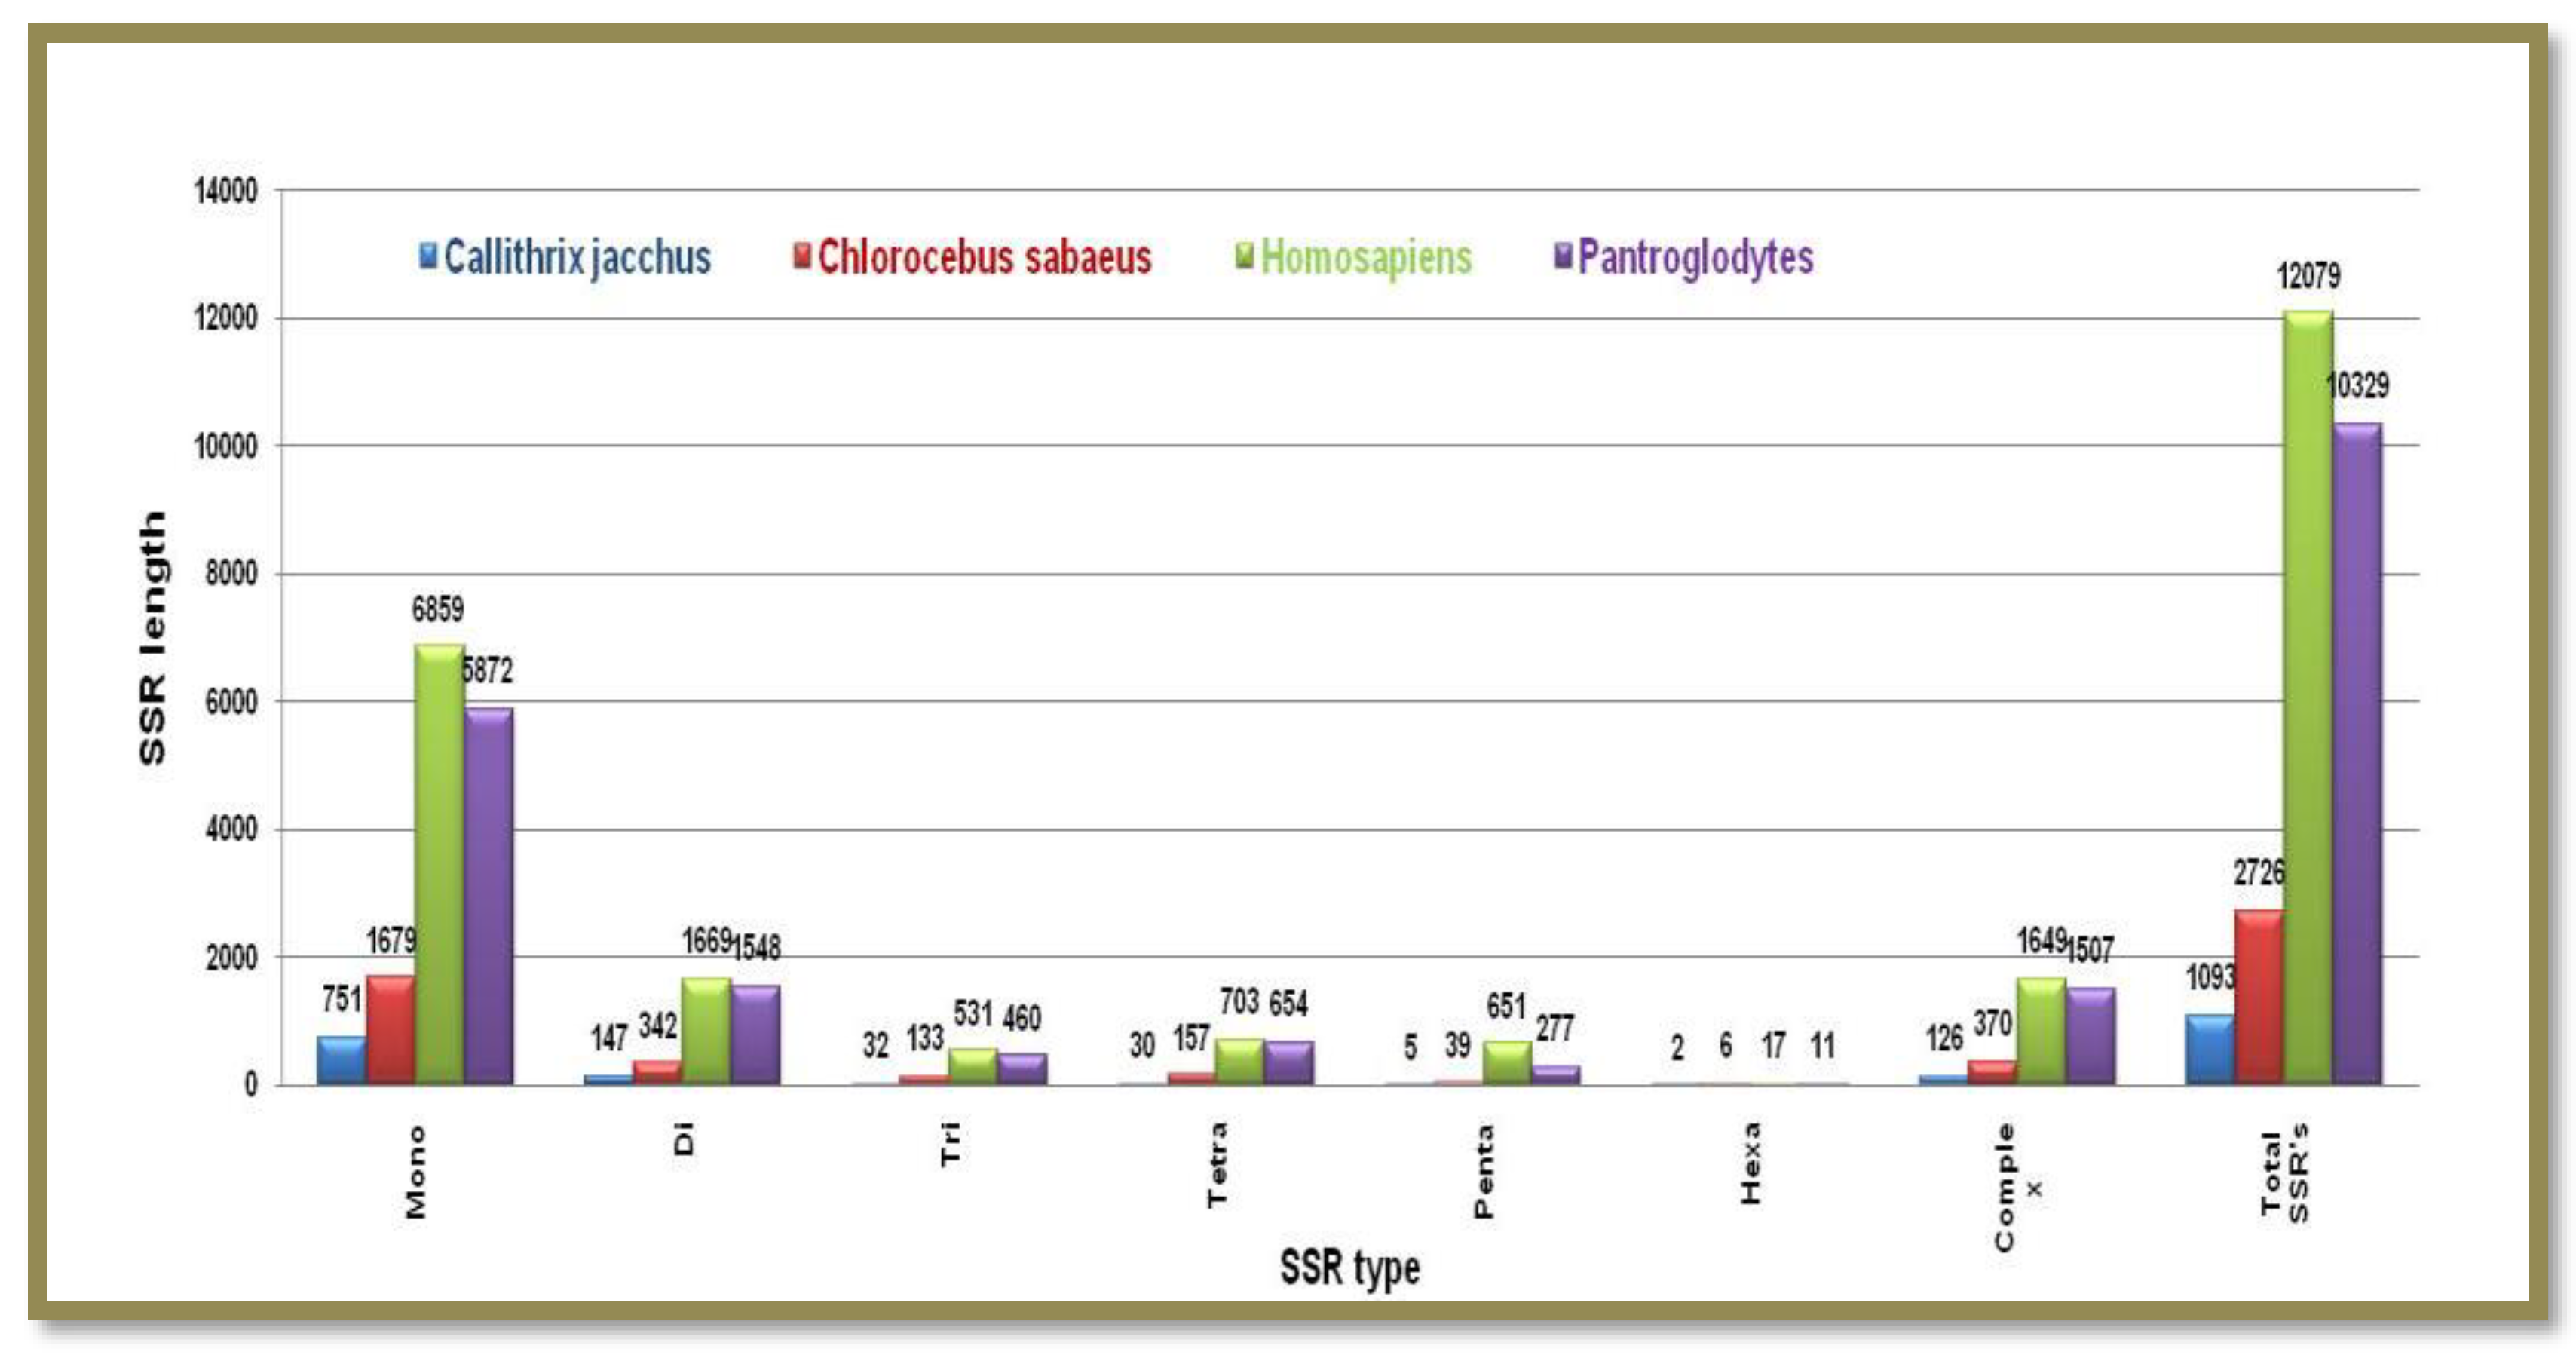
Figure 9.
The number of different SSRs with respective lengths in the X-chromosome of Mus musculus and Rattus norvegicus.
Figure 9.
The number of different SSRs with respective lengths in the X-chromosome of Mus musculus and Rattus norvegicus.
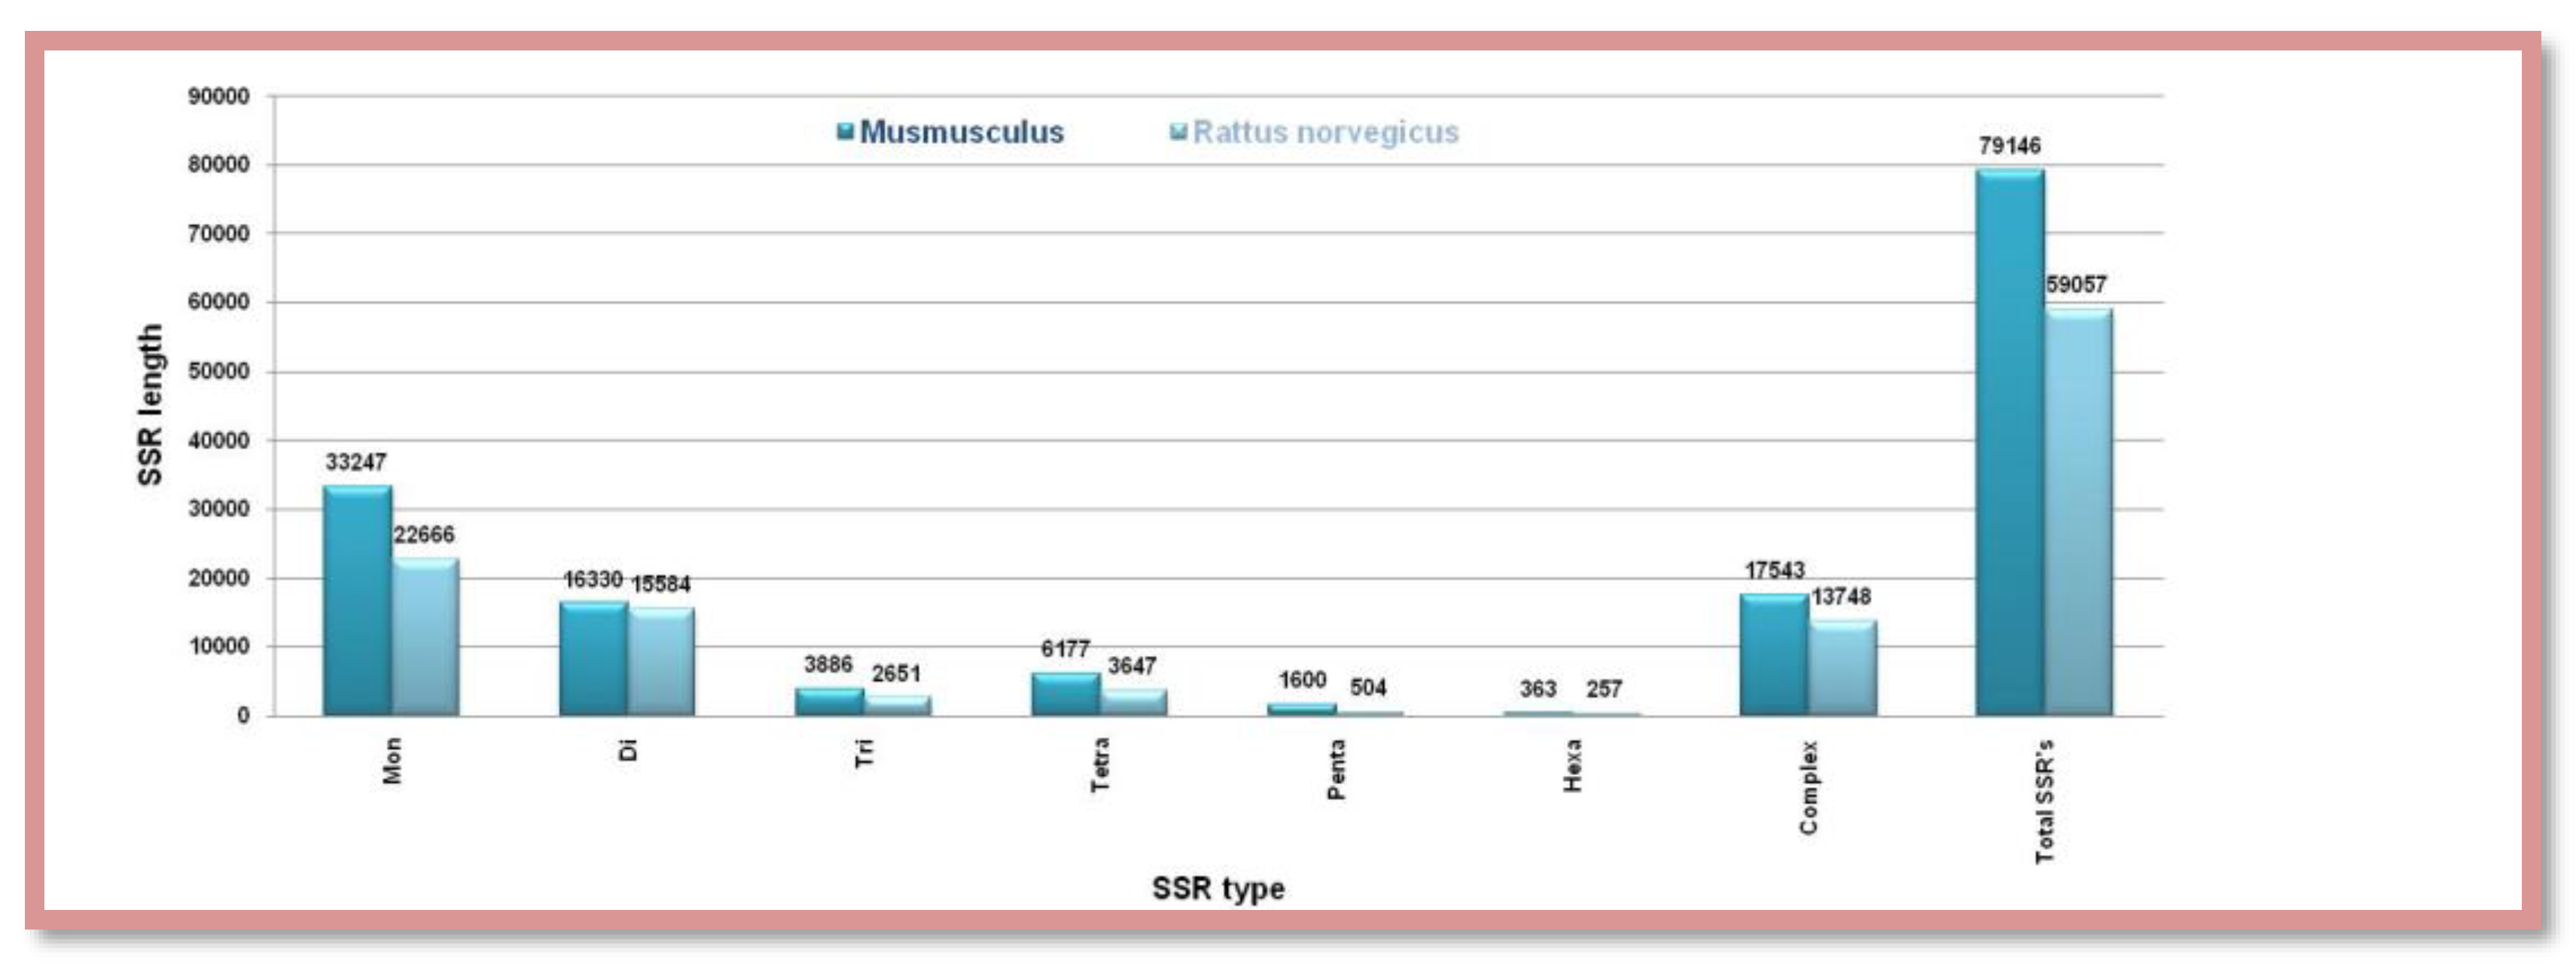
Figure 10.
The number of different SSRs with respective lengths in the Y-chromosome of Mus musculus and Rattus norvegicus.
Figure 10.
The number of different SSRs with respective lengths in the Y-chromosome of Mus musculus and Rattus norvegicus.
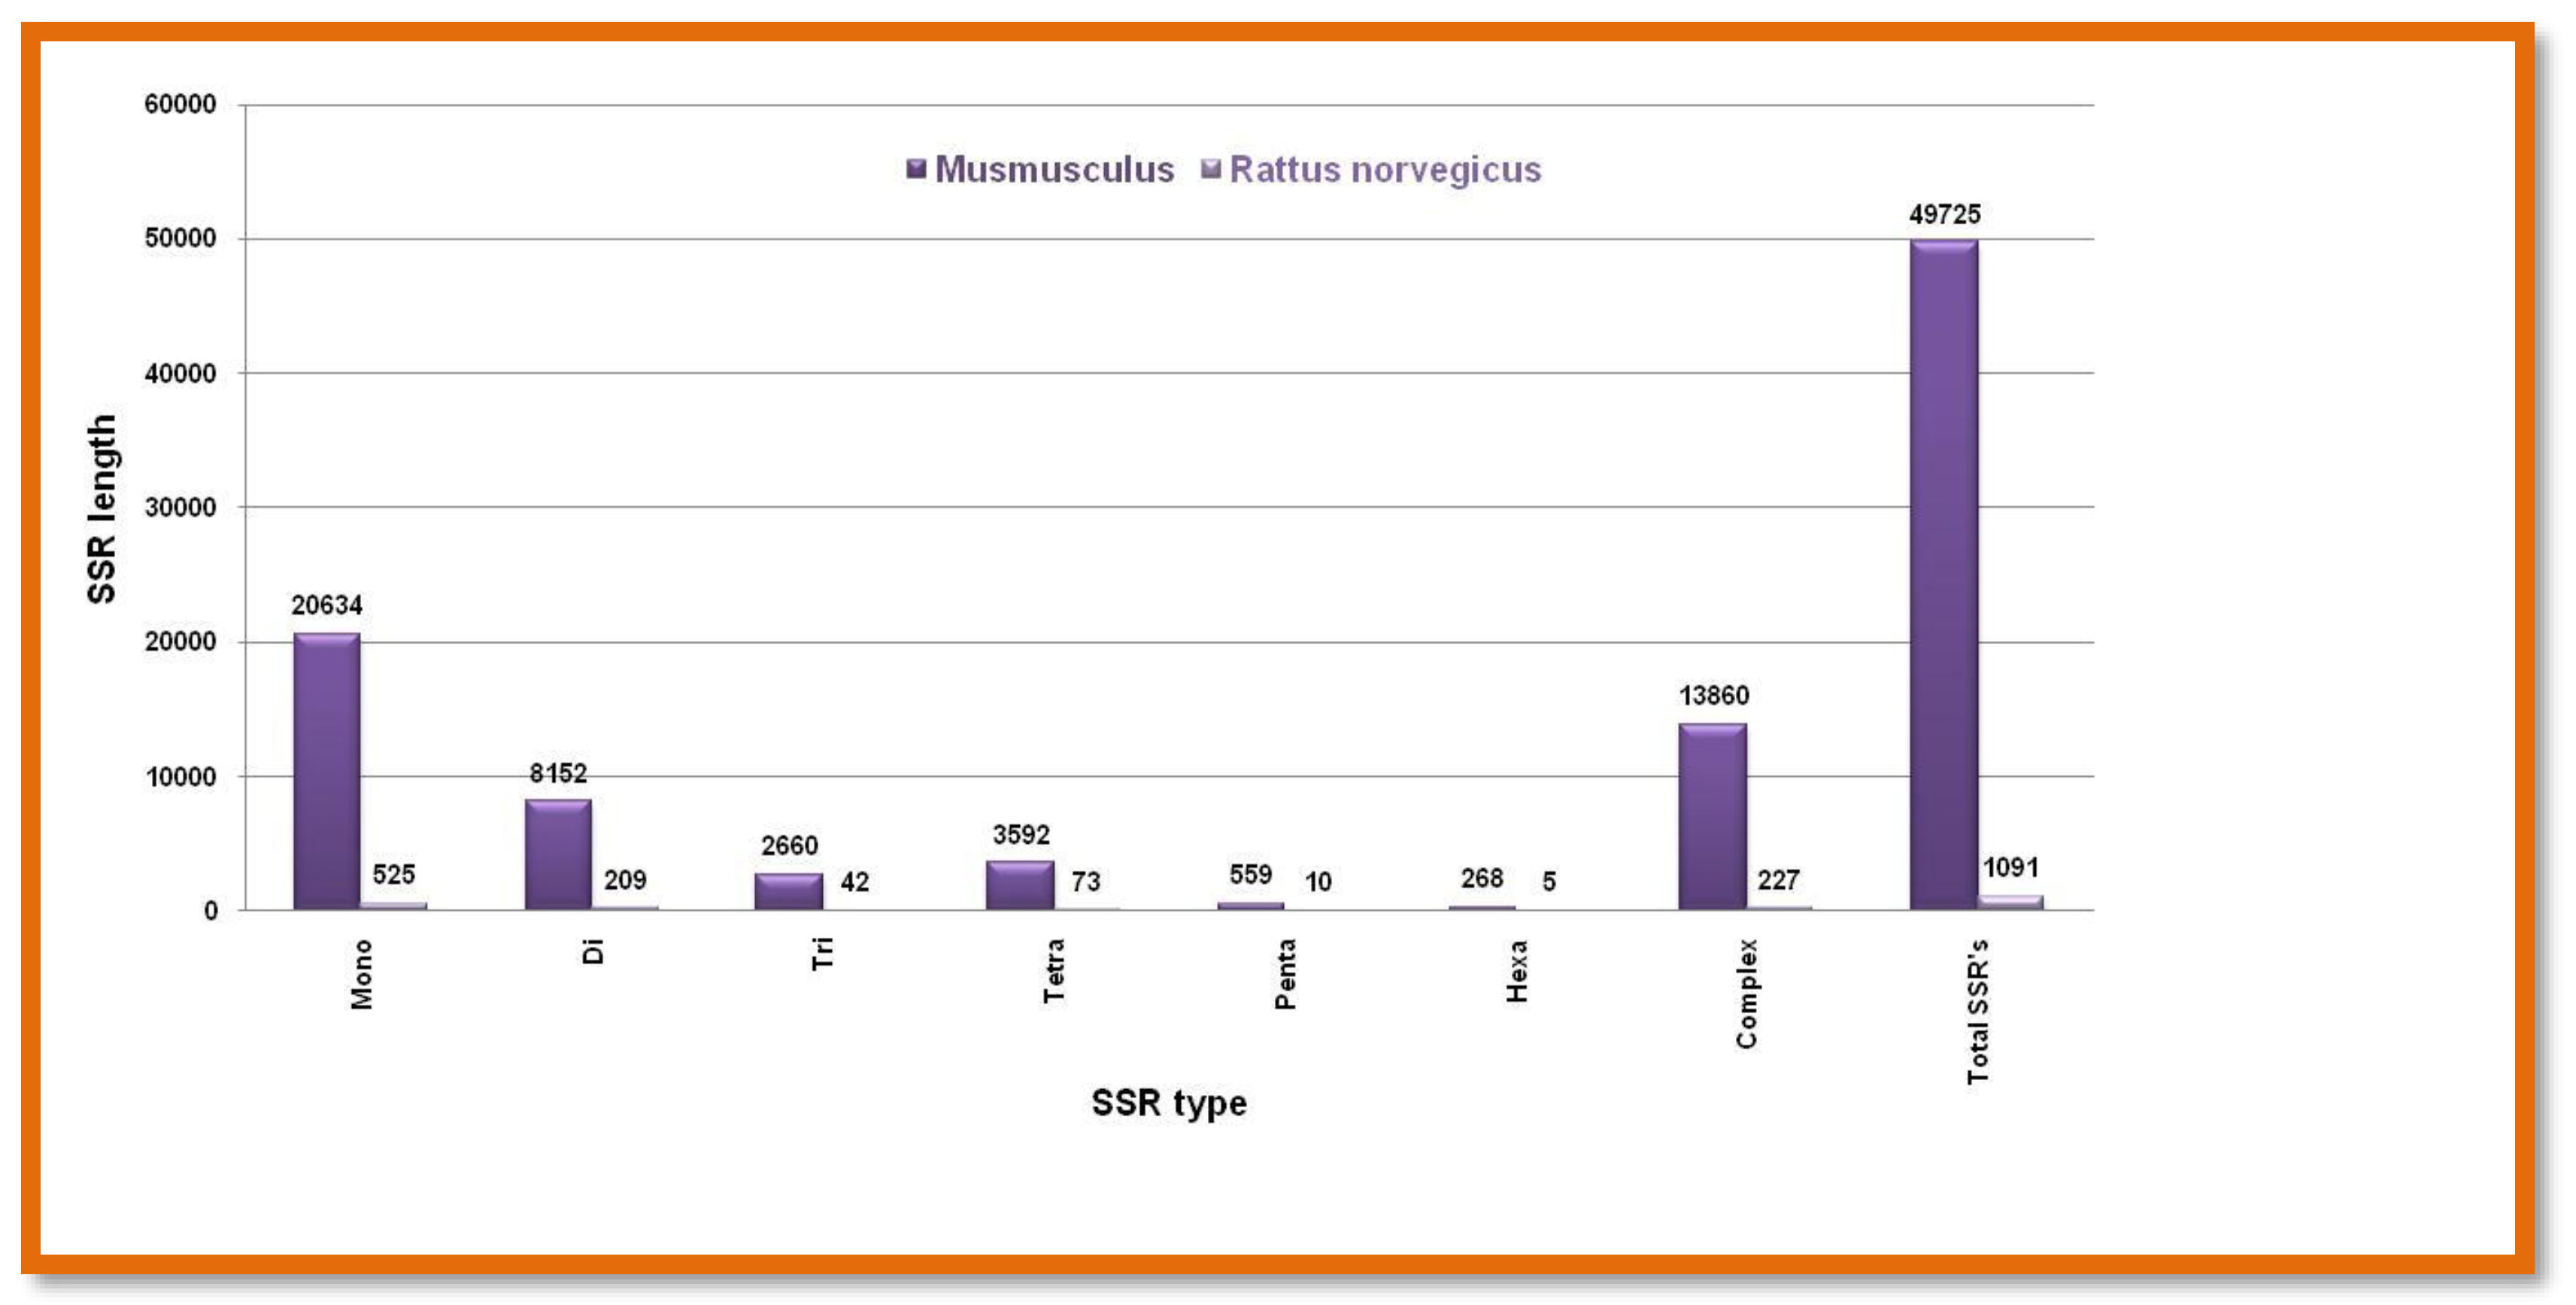
Figure 11.
The number of different SSRs with respective lengths in the X-chromosome of Bos taurus and Sus scrofa.
Figure 11.
The number of different SSRs with respective lengths in the X-chromosome of Bos taurus and Sus scrofa.
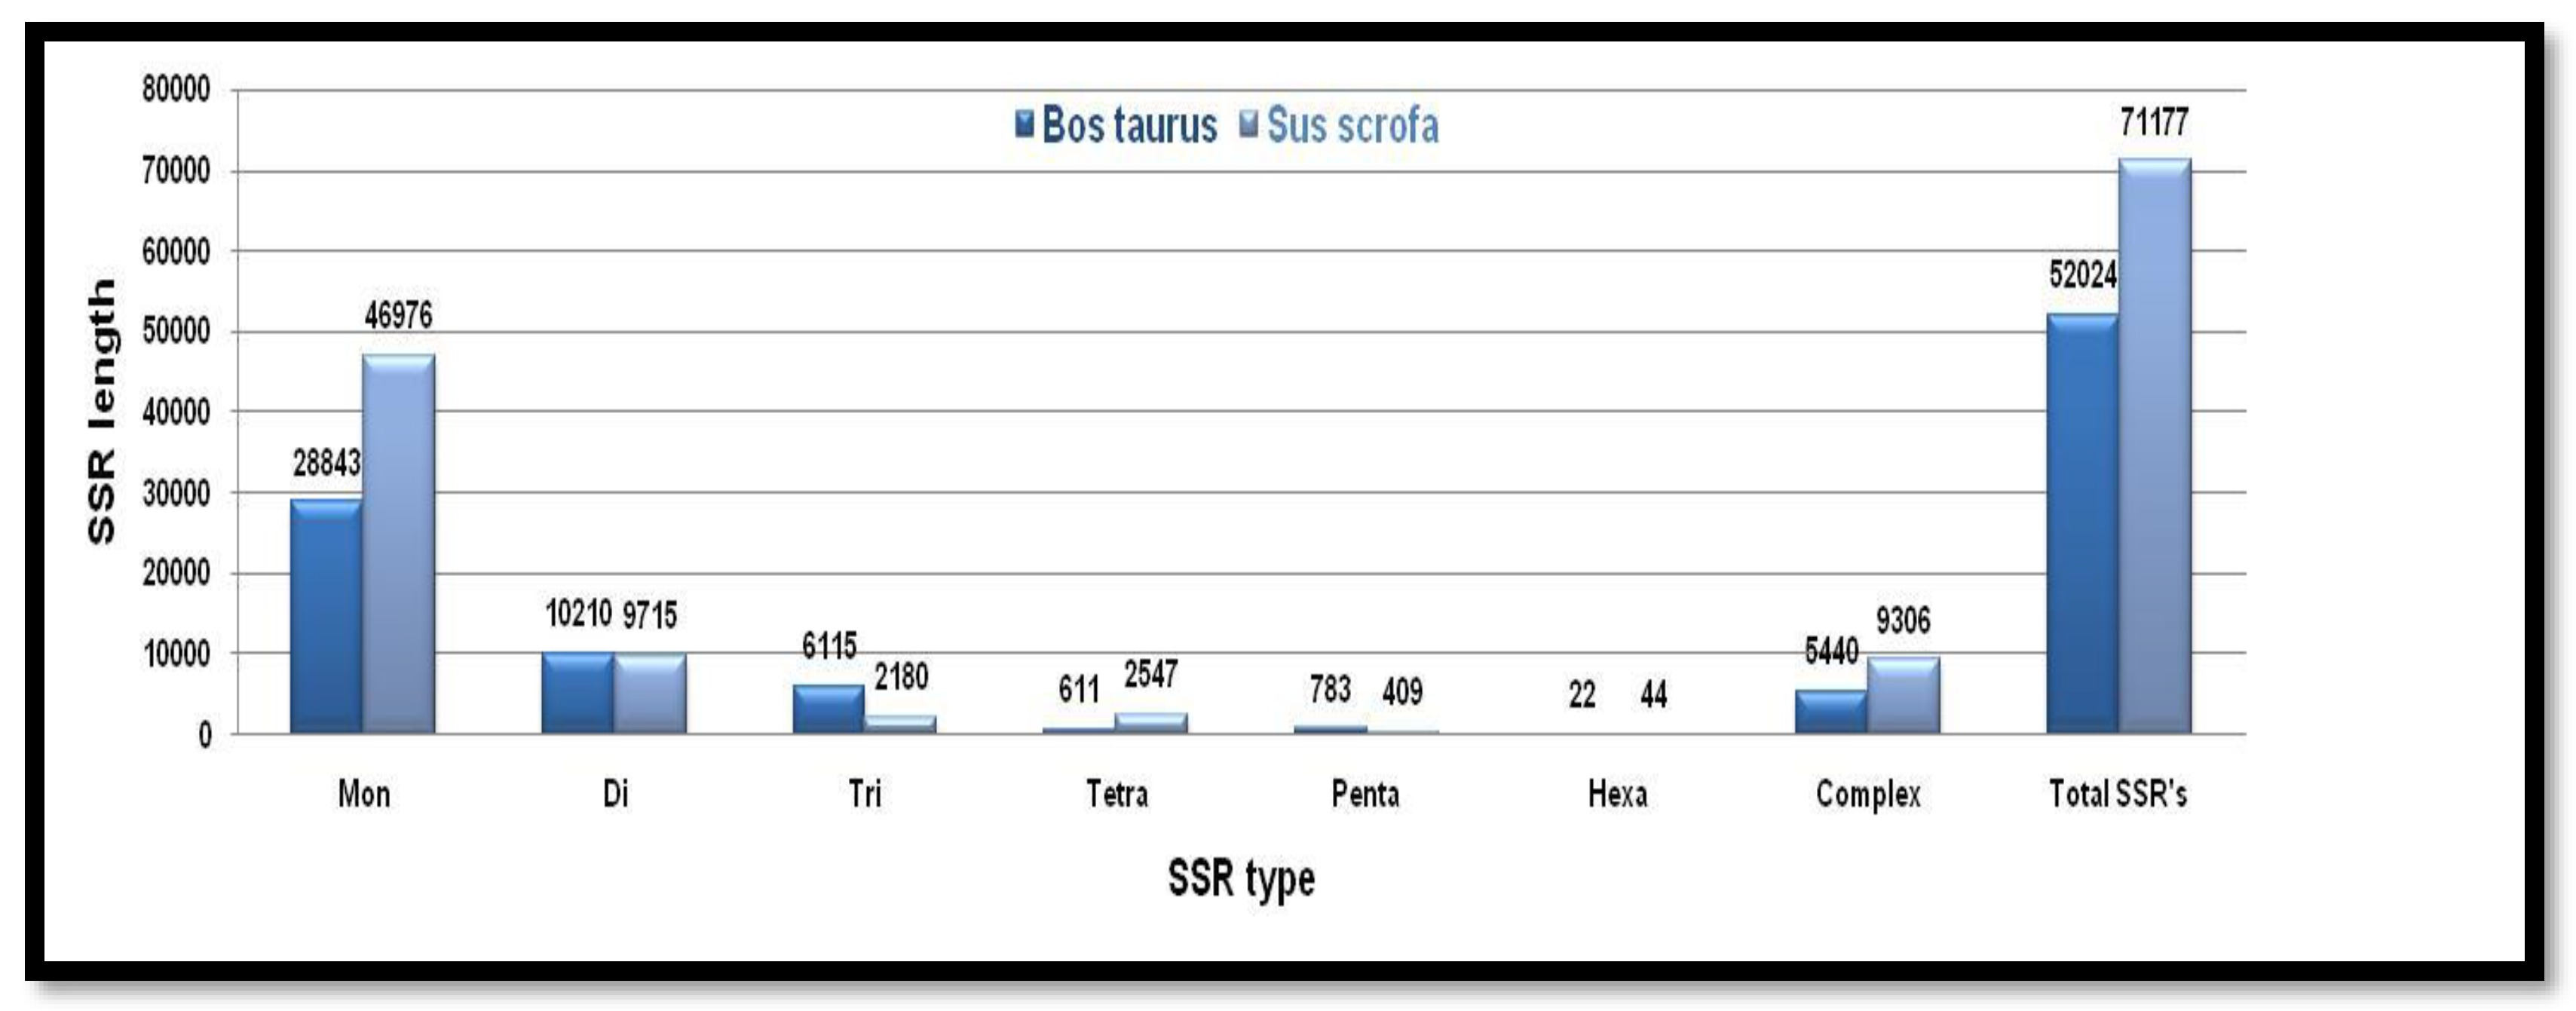
Figure 12.
The number of different SSRs with respective lengths in the Y-chromosome of Bos taurus and Sus scrofa.
Figure 12.
The number of different SSRs with respective lengths in the Y-chromosome of Bos taurus and Sus scrofa.
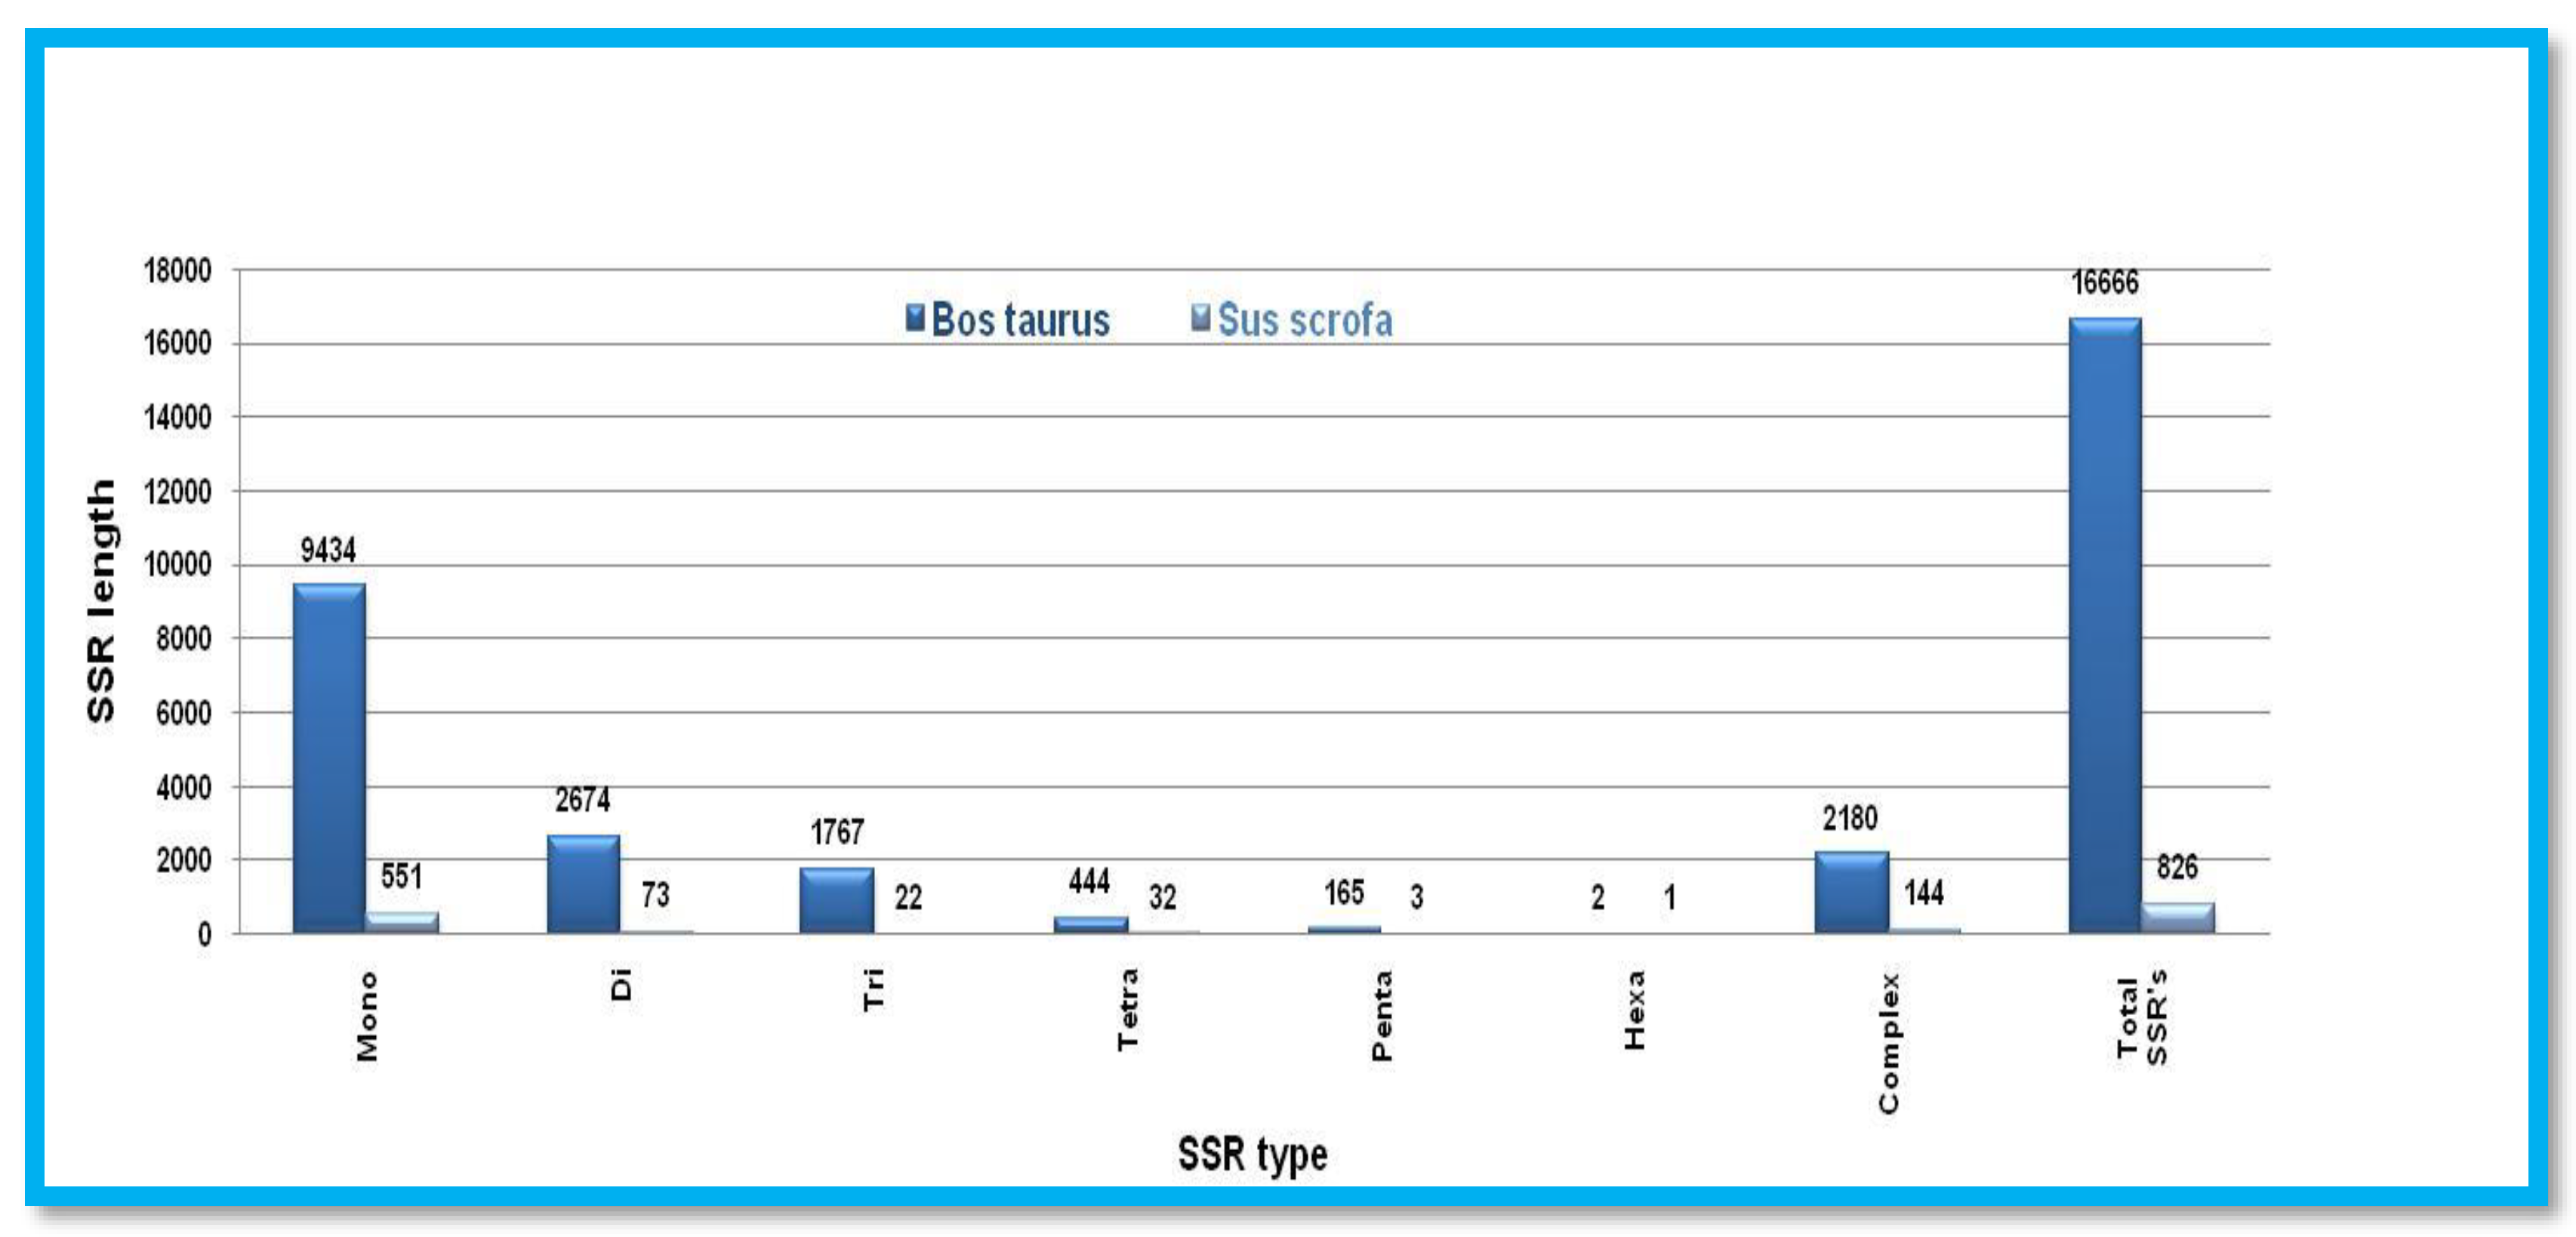

Table 1.
Twelve animal species downloaded for prediction of microsatellite and CpG island prediction.
Table 1.
Twelve animal species downloaded for prediction of microsatellite and CpG island prediction.
| S.No. | Animal species | Common Name | Group | Order | Y_chr size* | X_chr size** |
|---|---|---|---|---|---|---|
| 1. | Gallus gallus | Red junglefowl | Avian | Galliformes | 82363669$ | 1248174$$ |
| Meleagris gallopavo | Wild turkey | Galliformes | 68461266$ | 260627$$ | ||
| 2. | Anopheles gambiae | Mosquitoes | Insects | Diptera | 10,429 | 24393108 |
| Drosophila melanogaster | Fruit fly | Diptera | 3667352 | 23542271 | ||
| 3. | Callithrix jacchus | New World monkey | Primates | Primates | 2,853,901 | 142,054,208 |
| Chlorocebus sabaeus | Green monkey | Primates | 6181219 | 130038232 | ||
| Homo sapiens | Humans | Primates | 57,227,415 | 156040895 | ||
| Pan troglodytes | Chimpanzee | Primates | 263,42,871 | 156848144 | ||
| 4. | Mus musculus | House mouse | Rodents | Rodentia | 91,744,698 | 171,031,299 |
| Rattus norvegicus | Brown rat | Rodentia | 3,310,458 | 159,970,021 | ||
| 5. | Bos taurus | Cattle | Even-toed ungulates | Artiodactyla | 433,00,181 | 148823899 |
| Sus scrofa | Wild boars | Artiodactyla | 1,637,716 | 144,288,218 |
*Y Chromosome size. ** X Chromosome Size. $ W Chromosome size. $$ Z Chromosome Size.
Table 2.
Final parameters of CpG island in W-chromosome of Gallus gallus and Meleagris gallopavo.
| Features | Gallus gallus | Meleagris gallopavo |
|---|---|---|
| Average Island Length | 569.12 | 564.88 |
| The standard error (Island Length) | 4.38 | 17.82 |
| Island Number | 2433 | 83.00 |
| Average G+ C percent | 51.97 | 50.5 |
| Standard error G+ C percent | 0.06 | 0.14 |
| Average CpG percent | 4.7 | 5.25 |
| Standard error CpG percent | 0.01 | 0.12 |
| Average Ratio | 0.72 | 0.9 |
| Standard error Ratio | 0.00 | 0.03 |
| Minimum Island length | 500.00 | 500.00 |
| Maximum Island length | 5230.00 | 1653.00 |
Table 3.
Final parameters of CpG island in Z-chromosome of Gallus gallus and Meleagris gallopavo.
| Features |
Gallus gallus |
Meleagris gallopavo |
|---|---|---|
| Average Island Length | 743.57 | 630.51 |
| The standard error (Island Length) | 7.1 | 5.63 |
| Island Number | 4635.00 | 1799.00 |
| Average G+ C percent | 55.3 | 51.74 |
| Standard error G+ C percent | 0.08 | 0.08 |
| Average CpG percent | 5.76 | 5.26 |
| Standard error CpG percent | 0.02 | 0.02 |
| Average Ratio | 0.76 | 0.81 |
| Standard error Ratio | 0.00 | 0.00 |
| Minimum Island length | 500.00 | 500.00 |
| Maximum Island length | 6949.00 | 2330.00 |
Table 4.
Final parameters of CpG island in X-chromosome of Anopheles gambiae and Drosophila melanogaster.
Table 4.
Final parameters of CpG island in X-chromosome of Anopheles gambiae and Drosophila melanogaster.
| Features |
Anopheles gambiae |
Drosophila melanogaster |
|---|---|---|
| Average Island Length | 634.24 | 619.42 |
| The standard error (Island Length) | 1.78 | 1.94 |
| Island Number | 50388.00 | 31613.00 |
| Average G+ C percent | 50.46 | 50.69 |
| Standard error G+ C percent | 0.01 | 0.01 |
| Average CpG percent | 6.5 | 5.64 |
| Standard error CpG percent | 0.01 | 0.01 |
| Average Ratio | 1.03 | 0.89 |
| Standard error Ratio | 0.00 | 0.00 |
| Minimum Island length | 500.00 | 500.00 |
| Maximum Island length | 9249.00 | 7881.00 |
Table 5.
Final parameters of CpG island in Y-chromosome of Anopheles gambiae and Drosophila melanogaster.
Table 5.
Final parameters of CpG island in Y-chromosome of Anopheles gambiae and Drosophila melanogaster.
| Features |
Anopheles gambiae |
Drosophila melanogaster |
|---|---|---|
| Average Island Length | 535.00 | 601.02 |
| The standard error (Island Length) | 34.00 | 7.03 |
| Island Number | 3.00 | 3270.00 |
| Average G+ C percent | 50.41 | 50.37 |
| Standard error G+ C percent | 0.21 | 0.02 |
| Average CpG percent | 6.07 | 5.73 |
| Standard error CpG percent | 0.13 | 0.02 |
| Average Ratio | 0.97 | 0.91 |
| Standard error Ratio | 0.03 | 0.00 |
| Minimum Island length | 500.00 | 500.00 |
| Maximum Island length | 603.00 | 7406.00 |
Table 6.
Final parameters of CpG island in X-chromosome of primates Callithrix jacchus( New World monkey), Pan troglodytes (Chimpanzee), Homosapiens (Humans), and Chlorocebus sabaeus(Green monkey).
Table 6.
Final parameters of CpG island in X-chromosome of primates Callithrix jacchus( New World monkey), Pan troglodytes (Chimpanzee), Homosapiens (Humans), and Chlorocebus sabaeus(Green monkey).
| Features | Callithrix jacchus |
Chlorocebus sabaeus |
Homo sapiens |
Pan troglodytes |
|---|---|---|---|---|
| Average Island Length | 634.76 |
628.83 | 611.57 | 608.97 |
| The standard error (Island Length) | 4.3 | 4.93 |
3.62 | 3.8 |
| Island Number | 4426.00 |
4232.00 |
6770.00 | 4379.00 |
| Average G+ C percent | 55.66 | 55.17 | 55.68 | 54.53 |
| Standard error G+ C percent | 0.09 | 0.1 | 0.08 | 0.09 |
| Average CpG percent | 5.38 | 5.26 | 5.32 | 5.24 |
| Standard error CpG percent | 0.02 | 0.02 | 0.02 | 0.02 |
| Average Ratio | 0.7 | 0.7 | 0.7 | 0.72 |
| Standard error Ratio | 0.00 | 0.00 | 0.00 | 0.00 |
| Minimum Island length | 500.00 | 500.00 | 500.00 | 500.00 |
| Maximum Island length | 4007.00 | 4473.00 | 4472.00 | 2991.00 |
Table 7.
Final parameters of CpG island in Y-chromosome of primates Callithrix jacchus ( New World monkey), Pan troglodytes (Chimpanzee), Homo sapiens (Humans), and Chlorocebus sabaeus(Green monkey).
Table 7.
Final parameters of CpG island in Y-chromosome of primates Callithrix jacchus ( New World monkey), Pan troglodytes (Chimpanzee), Homo sapiens (Humans), and Chlorocebus sabaeus(Green monkey).
| Features |
Callithrix jacchus |
Chlorocebus sabaeus |
Homo sapiens |
Pan troglodytes |
|---|---|---|---|---|
| Average Island Length | 643.37 | 559.51 | 569.93 | 570.2 |
| The standard error (Island Length) | 20.72 | 10.69 | 5.41 | 6.38 |
| Island Number | 268.00 | 257.00 | 1756.00 | 997.00 |
| Average G+ C percent | 56.92 | 52.07 | 53.89 | 55.66 |
| Standard error G+ C percent | 0.39 | 0.24 | 0.14 | 0.19 |
| Average CpG percent | 5.58 | 4.78 | 4.89 | 5.29 |
| Standard error CpG percent | 0.08 | 0.05 | 0.03 | 0.04 |
| Average Ratio | 0.7 | 0.72 | 0.71 | 0.69 |
| Standard error Ratio | 0.00 | 0.01 | 0.00 | 0.00 |
| Minimum Island length | 500.00 | 500.00 | 500.00 | 500.00 |
| Maximum Island length | 3242.00 |
1950.00 | 3420.00 | 1987.00 |
Table 8.
Final parameters of CpG island in X-chromosome of Rodents Rattus norvegicus and Mus musculus.
Table 8.
Final parameters of CpG island in X-chromosome of Rodents Rattus norvegicus and Mus musculus.
| Features | Mus musculus | Rattus norvegicus |
|---|---|---|
| Average Island Length | 588.17 | 596.19 |
| The standard error (Island Length) | 3.46 | 3.68 |
| Island Number | 4545.00 | 4465.00 |
| Average G+ C percent | 54.68 | 53.03 |
| Standard error G+ C percent | 0.09 | 0.07 |
| Average CpG percent | 5.26 | 4.94 |
| Standard error CpG percent | 0.02 | 0.01 |
| Average Ratio | 0.72 | 0.73 |
| Standard error Ratio | 0.00 | 0.00 |
| Minimum Island length | 500.00 | 500.00 |
| Maximum Island length | 3476.00 | 4484.00 |
Table 9.
Final parameters of CpG island in Y-chromosome of Rodents Rattus norvegicus and Mus musculus.
Table 9.
Final parameters of CpG island in Y-chromosome of Rodents Rattus norvegicus and Mus musculus.
| Features | Mus musculus | Rattus norvegicus |
|---|---|---|
| Average Island Length | 548.88 | 560.46 |
| The standard error (Island Length) | 3.39 | 12.67 |
| Island Number | 1516.00 | 110.00 |
| Average G+ C percent | 52.21 | 52.7 |
| Standard error G+ Cpercent | 0.11 | 0.37 |
| Average CpG percent | 4.79 | 4.73 |
| Standard error CpG percent | 0.02 | 0.06 |
| Average Ratio | 0.71 | 0.7 |
| Standard error Ratio | 0.00 | 0.01 |
| Minimum Island length | 500.00 | 500.00 |
| Maximum Island length | 1568.00 | 1059.00 |
Table 10.
Final parameters of CpG island in X-chromosome of Rodents Bos taurus and Sus scrofa.
| Features | Bos taurus | Sus scrofa |
|---|---|---|
| Average Island Length | 701.35 | 580.44 |
| Standard error (Island Length) | 10.07 | 2.02 |
| Island Number | 1516.00 | 13539.00 |
| Average G+ C percent | 57.61 | 54.5 |
| Standard error G+C percent | 0.15 | 0.05 |
| Average CpG percent | 5.84 | 5.13 |
| Standard error CpG percent | 0.03 | 0.01 |
| Average Ratio | 0.72 | 0.7 |
| Standard error Ratio | 0.00 | 0.00 |
| Minimum Island length | 500.00 | 500.00 |
| Maximum Island length | 3832.00 | 5639.00 |
Table 11.
Final parameters of CpG island in Y-chromosome of Rodents Bos taurus and Sus scrofa.
| Features | Bos taurus | Sus scrofa |
|---|---|---|
| Average Island Length | 545.86 | 567.28 |
| Standard error (Island Length) | 2.92 | 4.55 |
| Island Number | 1994.00 | 1820.00 |
| Average G+ C percent | 53.36 | 53.86 |
| Standard error G+ C percent | 0.1 | 0.11 |
| Average CpG percent | 4.93 | 4.96 |
| Standard error CpG percent | 0.02 | 0.02 |
| Average Ratio | 0.7 | 0.7 |
| Standard error Ratio | 0.00 | 0.00 |
| Minimum Island length | 500.00 | 500.00 |
| Maximum Island length | 2360.00 | 2650.00 |
Disclaimer/Publisher’s Note: The statements, opinions and data contained in all publications are solely those of the individual author(s) and contributor(s) and not of MDPI and/or the editor(s). MDPI and/or the editor(s) disclaim responsibility for any injury to people or property resulting from any ideas, methods, instructions or products referred to in the content. |
© 2023 by the authors. Licensee MDPI, Basel, Switzerland. This article is an open access article distributed under the terms and conditions of the Creative Commons Attribution (CC BY) license (http://creativecommons.org/licenses/by/4.0/).
Copyright: This open access article is published under a Creative Commons CC BY 4.0 license, which permit the free download, distribution, and reuse, provided that the author and preprint are cited in any reuse.


