
Submitted:
12 February 2026
Posted:
13 February 2026
You are already at the latest version
Abstract
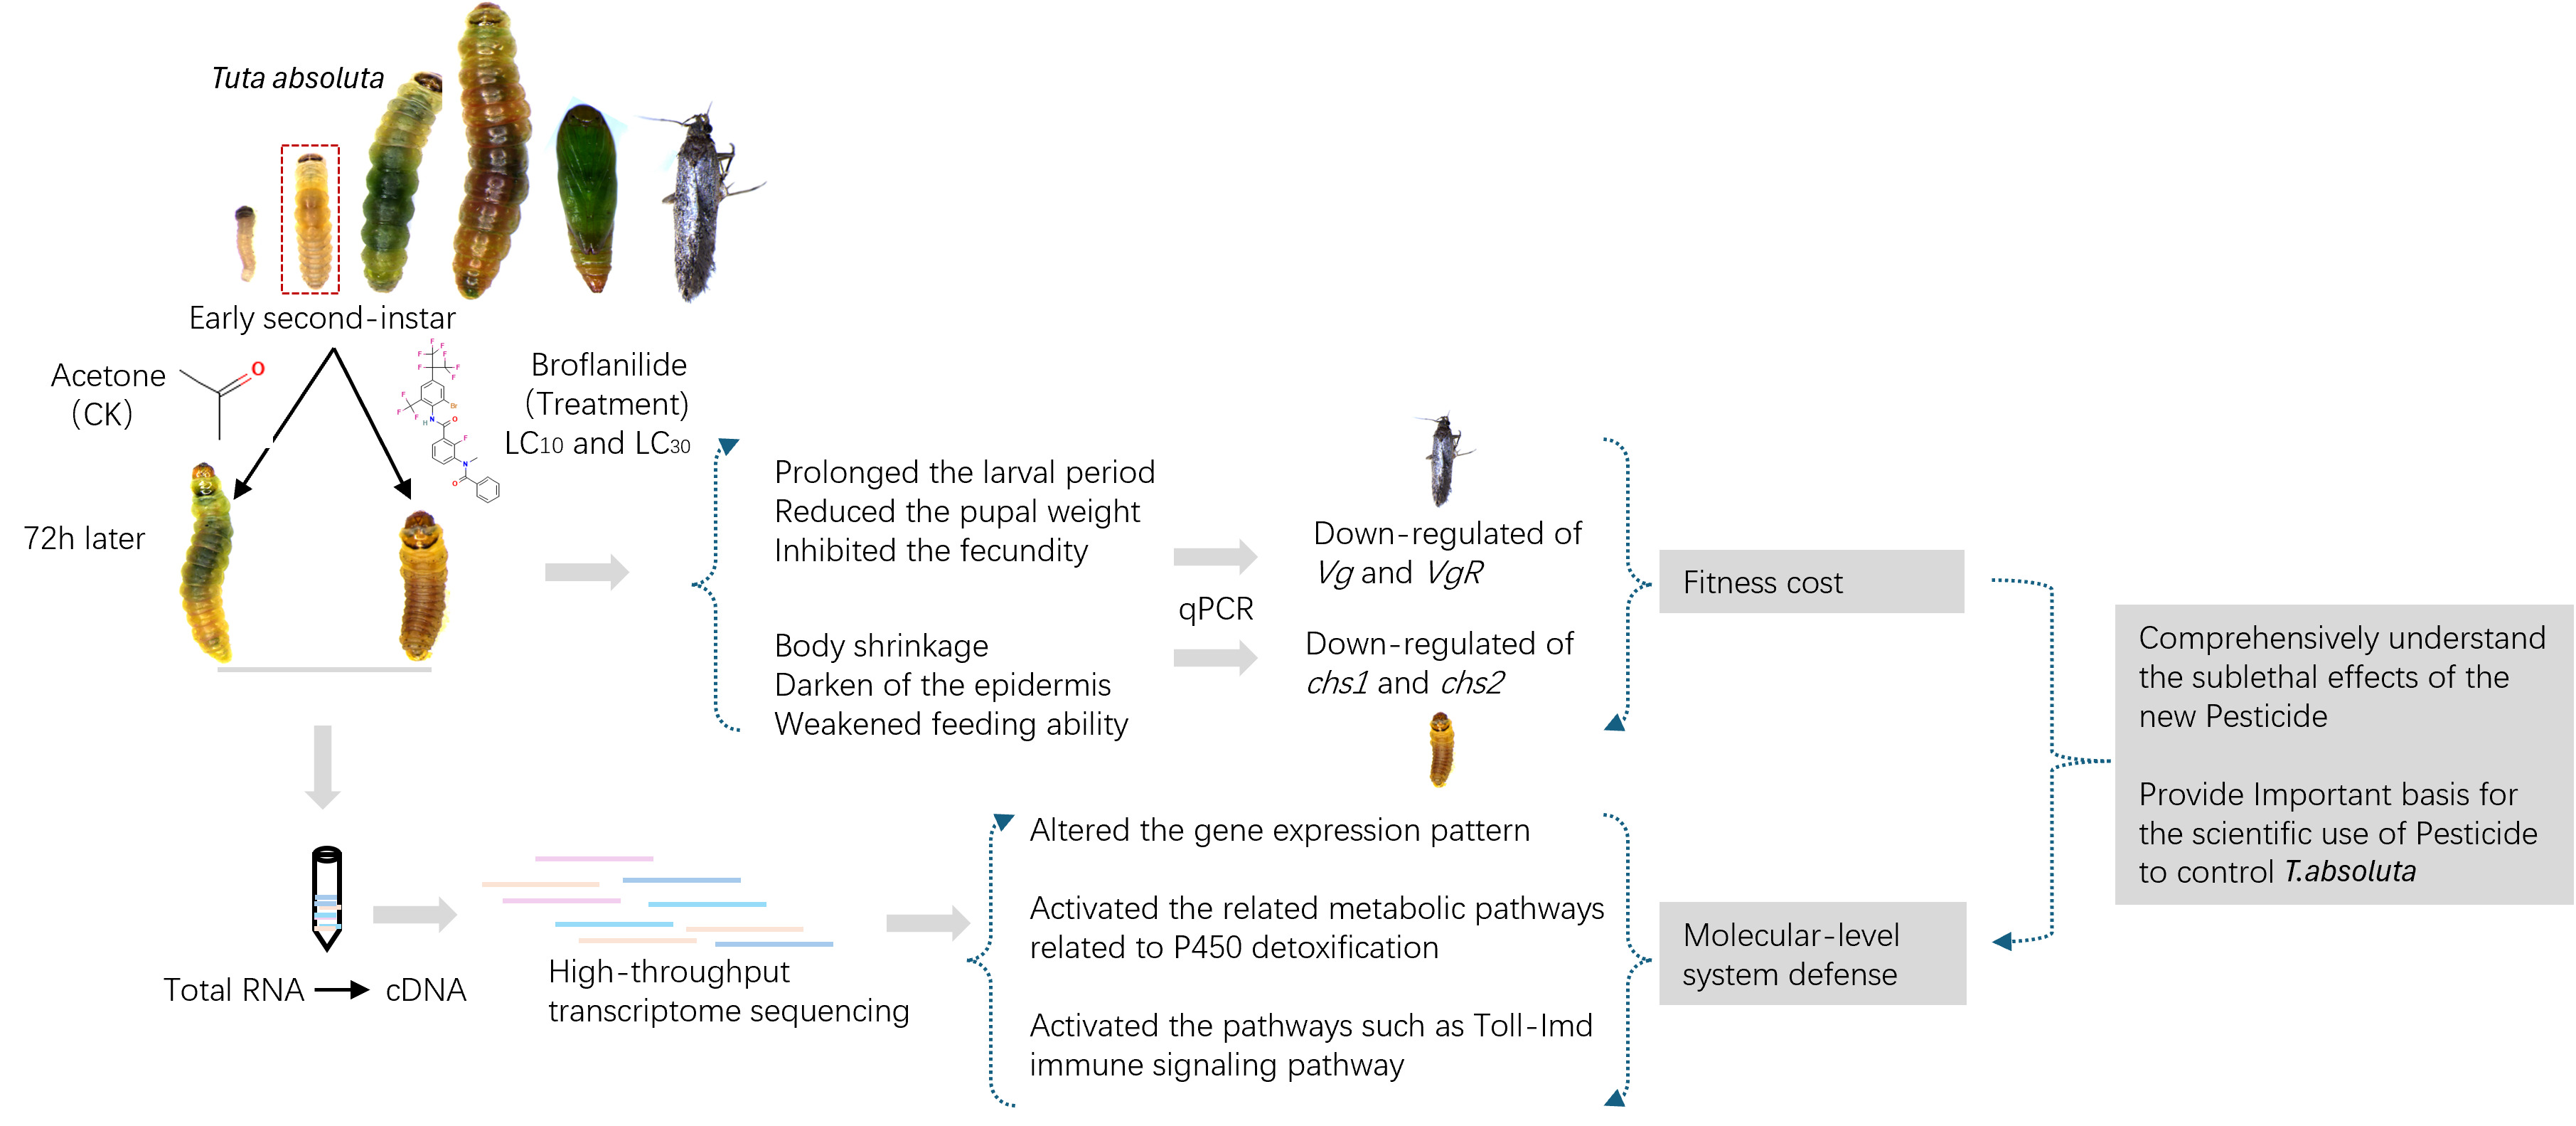
The tomato leaf miner (Tuta absoluta) poses a significant threat to global tomato production. However, environmentally sustainable management strategies for this pest, as well as its mechanisms of insecticide resistance, remain insufficiently understood. This study employed the leaf immersion method to conduct bioassays on the early second-instar larvae of the T.absoluta to evaluate physiological responses to sublethal concentrations of the novel amide insecticide broflanilide. Subsequently, high-throughput transcriptome sequencing was performed to investigate changes in gene expression and metabolic pathways. Bioassay results determined the larval sublethal concentrations of broflanilide to be 0.136 mg/L (LC₁₀) and 0.210 mg/L (LC₃₀). Sublethal exposure significantly prolonged the larval period, reduced pupal weight, and inhibited fecundity of female adults. Transcriptomic and qPCR analyses revealed that, compared with the control (CK), expression of the vitellogenin gene Vg decreased by 15.99% and 30.27% under LC₁₀ and LC₃₀ treatments, respectively, while its receptor gene VgR decreased by 11.56% and 24.49%. Similarly, expression of chitin synthase genes chs1 and chs2 declined by 13.56% and 30.17% (chs1), and 7.85% and 19.45% (chs2), respectively. Gene expression analysis elucidated how sublethal insecticides treatment impact larval development and fecundity. Furthermore, the study revealed upregulation of cytochrome P450-mediated detoxification pathways and Toll/Imd immune signaling pathways under broflanilide stress, indicating activation of a coordinated defense response in T. absoluta. Sublethal broflanilide exposure modulated larval gene expression to balance growth, development, and stress adaptation. Such exposure exerts selective pressure on susceptible populations, potentially driving adaptive shifts in detoxification metabolism and contributing to the development of field resistance. These findings advance our understanding of the sublethal effects of novel insecticides and provide valuable insights for insecticide deployment strategies and resistance management.
Keywords:
broflanilide
; Tuta absoluta
; sublethal effects
; chitin synthase
; vitellogenin
1. Introduction
The tomato leaf miner, Tuta absoluta (Meyrick) (Lepidoptera: Gelechiidae) is an invasive agricultural pest native to South America. It has now spread beyond its native range, infesting more than 110 countries and regions worldwide, and continues to threaten global tomato production (Xue et al., 2025). This pest has a narrow host range, mainly attacking plants in the family Solanaceae, and exhibits a high reproductive capacity—a single female can lay up to 260 eggs. Its short life cycle, overlapping generations, and the cryptic leaf-mining habit of the larvae often lead to severe but inconspicuous damage. T.absoluta is prone to outbreaks in both greenhouse and open-field environments, frequently causing tomato yield losses of 50–100%, which has led to its designation as the most destructive tomato pests (Silva et al., 2011). Since its initial incursion into Yili, Xinjiang, China in 2017, the pest has rapidly spread eastward and southward, now occurring in nearly 20 provinces, autonomous regions, and municipalities across China. This expansion poses a serious biosecurity challenge to both protected and open-field tomato cropping systems (Xue et al., 2025). The larvae mine into leaves, stems, and fruits, directly reducing photosynthetic area and causing fruit scarring. Moreover, the mining galleries provide entry sites for secondary infections by pathogens such as Botrytis cinerea, further reducing the marketability of the fruit. Initially, chemical control was the primary emergency strategy used to limit its rapid spread (Qu et al., 2024). However, this approach has raised significant concerns regarding environmental safety, pesticide residues, and the evolution of insecticide resistance (Roditakis et al., 2015).
Chemical control has long played a vital role in rapidly suppressing pest populations and reducing economic losses. Nevertheless, overreliance on and misuse of chemical insecticides have led to widespread resistance in T.absoluta to multiple classes of insecticides globally, creating a detrimental cycle of “application–resistance–increased application.” Documented resistance mechanisms span several chemical groups, including pyrethroids (via target-site mutations in voltage-gated sodium channels), organophosphates and carbamates (through reduced sensitivity of acetylcholinesterase), and neonicotinoids (Roditakis et al., 2015; Silva et al., 2011). Notably, resistance has also emerged in recent years to diamide insecticides (IRAC Group 28, e.g., chlorantraniliprole)—compounds widely adopted worldwide and often regarded as premium insecticides—in field populations across China, South America, and Europe. Monitoring in northern China has identified populations with moderate resistance to chlorantraniliprole and flubendiamide, with resistance ratios reaching several tens in some regions (Roditakis et al., 2015). The evolution of insecticide resistance substantially increases control costs and undermines the effectiveness of integrated pest management, highlighting an urgent need for novel insecticides with distinct modes of action.
Broflanilide, a novel meta-diamide compound commercialized in 2019, provides a new option for resistance management. It is classified by IRAC as Group 30, targeting the γ-aminobutyric acid (GABA)-gated chloride channel in the insect central nervous system (Ahmed et al., 2025). Unlike Group 28 diamides that act on ryanodine receptors, broflanilide functions as an allosteric modulator of the GABA receptor. It binds specifically to the transmembrane domain of the RDL subunit, causing prolonged opening of the chloride channel, disruption of neurotransmission, and ultimately insect paralysis and death. This distinct mode of action confers no cross resistance to currently widely used insecticides. In laboratory bioassays, broflanilide shows high efficacy against various pests that have developed resistance to chlorantraniliprole, flufenoxuron, and other insecticides, including T. absoluta. Therefore, broflanilide is considered a key component in insecticide rotation programs, with significant strategic value for delaying resistance evolution and extending the functional lifespan of the molecule (Qu et al., 2024; Sun et al., 2022).
A thorough risk assessment and scientific evaluation of a novel insecticide must encompass more than its acute lethal toxicity. In complex field scenarios, pest populations are often subjected to sublethal insecticide concentrations due to uneven spray deposition, photodegradation, hydrolysis, dilution from plant growth, and pest avoidance behavior (Ju et al., 2023). Sublethal concentrations are defined as doses that do not cause direct mortality but are sufficient to impair normal physiological, behavioral, developmental, or reproductive functions (Shi et al., 2023). Extensive studies have shown that sublethal effects can act as a “double-edged sword” in pest population dynamics: on one hand, they can suppress population growth by prolonging development, reducing fecundity, and compromising flight and foraging activity, thereby providing supplemental control benefits (Guedes et al., 2019). Previous work has confirmed that sublethal exposures of broflanilide significantly affect the growth, development, and reproductive parameters of both parental and offspring T. absoluta (Qu et al., 2024). Sublethal stress represents a potent selective pressure that can induce various insect responses, including enhanced detoxification, stress tolerance, and behavioral adaptations (Kumar et al., 2024). When such responses involve the upregulation or modification of resistance-related genes, they may accelerate the selection and spread of resistant genotypes in the field. Therefore, a comprehensive understanding of the physiological impacts of sublethal concentrations and their molecular basis is essential for accurately assessing the ecological risks of insecticides, predicting resistance evolution, and developing targeted resistance management strategies.
Current research on the sublethal effects of broflanilide on T. absoluta has primarily focused on documenting phenotypic outcomes, with limited investigation into the underlying molecular response mechanisms. The insect’s response to insecticide stress involves a complex biological process, requiring the coordinated regulation of multiple genes and pathways. Key defense mechanisms include the upregulation of phase I and phase II detoxification enzymes—such as cytochrome P450 monooxygenases (CYPs), glutathione S-transferases (GSTs), and carboxylesterases (CarEs)—which metabolize xenobiotic compounds (Xia et al., 2022). Additionally, pathways related to chitin synthesis, cuticle development, glycolipid metabolism (which supplies energy under stress), and innate immune and stress-response signaling (e.g., Toll, Imd, and MAPK pathways) are often prominently activated (Sun et al., 2025). The dynamic modulation of these pathways collectively shapes the physiological resilience of insects under stress. However, how sublethal broflanilide exposure reprograms the genome-wide gene expression network in T. absoluta remains poorly understood.
This study systematically evaluated the physiological effects—including growth, survival, and fecundity—of sublethal concentrations (LC₁₀ and LC₃₀) of broflanilide on susceptible strains of second-instar T. absoluta larvae. By integrating standardized bioassays with high throughput transcriptome sequencing, we provided the first genome wide transcriptional profile of T.absoluta under sublethal broflanilide exposure. Through analysis of differentially expressed genes (DEGs), weighted gene co expression network analysis (WGCNA), and multi-level functional enrichment, we identified key gene clusters and biological pathways significantly altered by sublethal stress. Special emphasis was placed on gene sets involved in detoxification (e.g., P450 enzymes), cuticle development (e.g., chitin synthesis), energy metabolism, and reproduction regulation. Core candidate genes were further validated using qRT PCR. Our findings not only deepen the molecular understanding of broflanilide’s sublethal effects on T. absoluta, but also provide a scientific basis for assessing its ecological risk in the field and its potential for sustainable pest control. Moreover, the key response genes and pathways identified here may serve as potential biomarkers. This study aims to offer critical targets and a theoretical foundation for forecasting the risk of resistance evolution to broflanilide in T. absoluta, and for designing proactive resistance management tactics—such as molecular detection guided insecticide rotation—thereby supporting the sustainable integrated management of this invasive pest.
2. Materials and Methods
T. absoluta Strain and Insecticides
The susceptible strain (SS) of T.absoluta used in this study was originally collected from a tomato field in Luoyang, Henan Province, China, in April 2022. This strain has been maintained in the laboratory for over 30 generations without exposure to any insecticides, reared on fresh tomato plants (cultivar ‘Provence’). Insects were kept under controlled conditions: temperature 27 ± 1 °C, relative humidity 65 ± 5%, and a photoperiod of 16 h light: 8 h dark. Broflanilide (purity 98%; CAS 1207727-04-5) was purchased from Mitsui Chemicals Agro, Inc. (Japan)
Bioassay
To synchronize the developmental stage of T. absoluta larvae, adults were allowed to oviposit on tomato plants for 12 h; the plants bearing eggs were then transferred to clean cages (Figure S1A). The toxicity of broflanilide to early second-instar larvae was evaluated using a leaf-dip bioassay following a previously described protocol (Roditakis et al., 2013). Briefly, fresh tomato leaves were dipped for 15 s in a series of broflanilide solutions (0.4, 0.32, 0.256, 0.2048, and 0.1024 mg/L), air-dried, and placed on moist filter paper in Petri dishes. Each concentration was replicated three times, with 20 larvae per replicate; an acetone solution served as the control. All bioassays were conducted under controlled laboratory conditions (27 ± 1 °C, 65 ± 5% RH, 16L:8D photoperiod). Mortality was recorded 72 h after treatment; larvae that showed no coordinated movement upon gentle probing were considered dead. Larval growth and development were observed under a fluorescence stereomicroscope (Olympus SZ X7, Japan), and body lengths were photographed and measured. Data were processed using Microsoft Excel, and the Sub-lethal concentration (LC₁₀ and LC₃₀), were calculated with Poloplus software.
For sublethal effect assessment, 200 second-instar larvae were exposed to LC₁₀ or LC₃₀ concentrations of broflanilide, with acetone as the control. Mortality was checked after 72 h, and surviving individuals were monitored daily until adult emergence. Developmental parameters, including larval duration, pupal weight, pupal period, and emergence rate, were recorded. To evaluate fecundity, male and female adults that emerged within a 2 days window were paired and placed in an oviposition setup. A cylindrical floral water tube (1 cm × 4 cm) was fixed to the bottom of a disposable round transparent plastic container (17 cm × 11.5 cm × 9.5 cm). The tube was filled with fresh tap water, and a 7 cm tomato branch with leaves was inserted. A 6 cm × 6 cm piece of tissue paper was placed inside the container; half of the paper was sprayed with 10% sucrose solution and the other half with deionized water to provide nutrition and moisture for the adults (Figure S1B). Data were analyzed with GraphPad Prism 8.0, and statistical significance was determined using the chi square test (p < 0.05).
RNA Extraction and Transcriptome Sequencing
Total RNA was extracted from larvae exposed to sublethal concentrations (LC₁₀, LC₃₀) and from control larvae after 72 h of treatment, using the TRIzol reagent (Total RNA Extractor, Sangon Biotech, Shanghai, China) according to the manufacturer’s protocol. RNA quality and concentration were measured with a Qubit 2.0 Fluorometer (Invitrogen, USA). Only samples with RNA integrity number (RIN) ≥ 6.0 were used for subsequent library preparation. mRNA was enriched from total RNA using oligo(dT) beads and then randomly fragmented via divalent cation mediated cleavage. First strand cDNA synthesis was performed using random hexamer primers, followed by second strand synthesis to generate double stranded cDNA. After purification, the cDNA fragments were subjected to end repair, A tailing, and ligation of Illumina sequencing adapters. Size selection was carried out to retain fragments of the desired length, followed by PCR amplification and final purification to obtain the sequencing library.
Library concentration and fragment size distribution were assessed using a Bioanalyzer 2100 (Agilent Technologies). Libraries were pooled based on effective concentration and sequenced on an Illumina NovaSeq 6000 platform (Sangon Biotech, Shanghai, China) in paired end 150 bp (PE150) mode. During sequencing, fluorescently labeled dNTPs, DNA polymerase, and sequencing primers were introduced into the flow cell. Fluorescence signals emitted upon nucleotide incorporation were captured and converted into base calls, yielding the raw sequence data for subsequent analysis.
Transcriptome Data Quality Control and Analysis
Raw sequencing reads were quality-checked with FastQC and subsequently processed using fastp to obtain high-quality clean reads. Clean reads were aligned to the Tuta absoluta reference genome (InsectBase 2.0) with HISAT2, and mapping statistics were summarized. Gene expression levels were quantified using featureCounts based on existing gene annotations. To examine sample relationships, distances between samples were calculated with the “vegan” R package, followed by hierarchical clustering using “hclust” to visualize overall expression profile similarities. Venn diagrams generated with the “VennDiagram” R package illustrated shared and unique expressed genes across sample groups. Expression pattern clustering was performed using the “Mfuzz” package. Weighted gene co expression network analysis (WGCNA) was applied to identify co expressed gene modules. Differentially expressed genes (DEGs) were identified with DESeq2 using thresholds of |log₂FC| > 1 and FDR < 0.01, and results were visualized accordingly. Overlaps among DEG sets were summarized using Venn diagrams. Functional enrichment analyses were conducted as follows: Gene Ontology (GO) terms were analyzed with topGO, KEGG pathway enrichment was performed using clusterProfiler, and gene set enrichment analysis (GSEA) was carried out to further characterize expression patterns.
The Expression Levels of Genes Related to Fecundity and Epidermal Development Using the qPCR
To validate transcriptomic findings, the expression levels of genes associated with fecundity (Vg and VgR, encoding vitellogenin and its receptor) and cuticle development (chs1 and chs2, encoding chitin synthases) were quantified by qPCR. EF1α and RPL5 were used as internal reference genes. Total RNA was extracted from three biological replicates, each consisting of 5-day-old adult insects. Vg and VgR expression were analyzed using adult-derived RNA, whereas chs1 and chs2 expression was assessed using larval RNA to maintain consistency with the transcriptome sampling stage. Gene-specific primers (Table S1) were adopted from previously published studies. Each 20 μL qPCR reaction contained 10 μL of 2× SYBR Green Master Mix (YEASEN Biotechnology Co., Ltd., Shanghai, China), 1 μL each of forward and reverse primer (10 μmol/L), 2 μL of cDNA template, and 6 μL of ddH₂O. The thermal cycling protocol was as follows: 95 °C for 5 min; 35 cycles of 94 °C for 30 s, 60 °C for 30 s, and 72 °C for 30 s; fluorescence signal acquisition was performed at the end of each 60 °C annealing step. Gene expression was calculated using the 2−ΔΔCt method (Livak et al., 2012). Statistical significance was determined and figures were generated using GraphPad Prism 8.0
3. Results
3.1. The Virulence Effect of Sublethal Concentration of Broflanilide on T. absoluta
Bioassay results demonstrated that exposure to broflanilide at different concentrations adversely affected the growth and development of T. absoluta. At higher concentrations, larval development was markedly inhibited, accompanied by body shrinkage, cuticular darkening, and reduced feeding activity. In contrast, larvae in the control group developed normally, with feeding scars expanding as they grew. After 72 h of treatment, the mean body lengths of larvae under the tested concentrations were 1.7, 2.0, 2.5, 3.0, 3.5, and 3.7 mm (control), respectively (Figure 1A-F). Lower insecticide concentrations resulted in greater plant damage and larger feeding areas (Figure 1G-L).
Sublethal concentrations (LC₁₀ and LC₃₀) also negatively influenced larval development and subsequent reproductive traits. Compared with the control, both LC₁₀ and LC₃₀ treatments significantly prolonged the larval duration. Pupal weight decreased following sublethal exposure, with female pupae being more affected. While male pupal weight was significantly reduced only under LC₃₀ treatment, the pupal period was significantly extended for both sexes, leading to a notable decrease in adult emergence rate. Fecundity of female adults was significantly reduced in both treatment groups relative to the control, though no significant difference was observed between LC₁₀ and LC₃₀. Furthermore, sublethal exposure significantly shortened adult longevity in both females and males, with no significant difference between the two treatment levels (chi square test, P < 0.05; Table 1).
3.2. Quality Control Analysis of Transcriptome Data
Transcriptome sequencing generated clean read counts ranging from 55,909,722 to 74,948,656 for the LC₁₀ treatment group, 64,484,120 to 79,274,760 for the LC₃₀ treatment group, and 67,652,630 to 75,333,706 for the control group (Table S1). The corresponding Q30 values were 97.72%–97.91%, 97.79%–97.95%, and 97.80%–97.84%, respectively. The GC content across all libraries ranged between 48.83%–49.46% for LC₁₀, 49.32%–50.17% for LC₃₀, and 49.28%–49.65% for the control. These metrics confirm that the sequencing data are of high quality and sufficient depth for subsequent analysis (Table S2).
3.3. The Transcriptional Level Response of T. absoluta to Sublethal Concentrations of Broflanilide
Following normalization of the transcriptome data, hierarchical clustering was performed to evaluate biological repeatability and sample similarity based on global gene expression profiles. The resulting dendrogram showed that the four replicates within each treatment clustered closely together. The LC₃₀ and LC₁₀ groups exhibited the highest similarity, followed by the control group (CK) (Figure 2A). Principal component analysis (PCA) indicated that the first two principal components (PC1 and PC2) explained 43.22% and 15.55% of the total variance, respectively. Samples from the LC₁₀, LC₃₀, and CK groups formed distinct, well separated clusters, confirming strong reproducibility and a robust experimental design (Figure 2B).
Analysis of expressed genes revealed totals of 15,440, 15,392, and 15,210 genes in the LC₁₀, LC₃₀, and CK groups, respectively. Among these, 14,792 genes were commonly expressed across all groups, while 237, 187, and 122 genes were uniquely expressed in LC₁₀, LC₃₀, and CK, respectively (Figure 2C). Differential expression analysis identified 782 and 416 differentially expressed genes (DEGs) in the LC₁₀ vs. CK and LC₃₀ vs. CK comparisons, respectively. Of these, 601 and 235 DEGs were specific to LC₁₀ and LC₃₀ treatments (Figure 2D). In the LC₁₀ vs. CK comparison, 539 genes were up regulated and 243 were down regulated. In the LC₃₀ vs. CK comparison, 249 genes were up regulated and 167 were down regulated (Figure 2E). Based on expression patterns, DEGs were grouped into three distinct clusters (Cluster 1–3) using k means clustering (Figure 2F-H). Weighted gene co expression network analysis (WGCNA) partitioned the DEGs into several modules (Figure 2I), among which the brown (r = 0.75) and turquoise (r = 0.72) modules showed strong positive correlations with the LC₁₀ treatment. In the LC₃₀ group, the yellow module was positively correlated with treatment (r = 0.82). In contrast, the turquoise module was negatively correlated in the control group (r = −0.81) (Figure 2J).
3.4. The Results of Functional Enrichment Analysis of Differentially Expressed Genes
To explore the physiological and metabolic implications of the differentially expressed genes (DEGs), we performed functional annotation and enrichment analyses using Gene Ontology (GO), KEGG, and Gene Set Enrichment Analysis (GSEA). GO enrichment revealed that DEGs from both LC₁₀ and LC₃₀ treatments were significantly associated with molecular functions such as structural constituent of cuticle and structural constituent of chitin-based cuticle, as well as biological processes including organic acid metabolic process, oxoacid metabolic process, carboxylic acid metabolic process, and pigment metabolic process (FDR < 0.05) (Figure 3A-B).
KEGG pathway analysis indicated that the top enriched pathways for LC₁₀ DEGs included Bile secretion, Glycolysis/Gluconeogenesis, Pentose and glucuronate interconversions, Toll and Imd signaling pathway, Ascorbate and aldarate metabolism, Antigen processing and presentation, Drug metabolism—cytochrome P450, Biosynthesis of unsaturated fatty acids, Metabolism of xenobiotics by cytochrome P450, and Steroid hormone biosynthesis. For LC₃₀, the top enriched pathways were Bile secretion, Insulin signaling pathway, AMPK signaling pathway, Metabolism of xenobiotics by cytochrome P450, Drug metabolism—cytochrome P450, Ascorbate and aldarate metabolism, Fatty acid biosynthesis, Toll and Imd signaling pathway, Histidine metabolism, and Glycosphingolipid biosynthesis—ganglio series. Notably, five pathways were commonly enriched in both treatments: Bile secretion, Toll and Imd signaling pathway, Drug metabolism—cytochrome P450, Ascorbate and aldarate metabolism, and Metabolism of xenobiotics by cytochrome P450, two of which are directly related to cytochrome P450-mediated detoxification (Figure 3C-D).
GSEA further highlighted significant enrichment of gene sets under sublethal exposure. For LC₁₀, the top enriched pathways included Valine, leucine and isoleucine degradation, Oxidative phosphorylation, Fatty acid degradation, Metabolism of xenobiotics by cytochrome P450, Ascorbate and aldarate metabolism, Drug metabolism—cytochrome P450, Steroid hormone biosynthesis, Lysine degradation, Arachidonic acid metabolism, and Glycolysis/Gluconeogenesis. In the LC₃₀ group, the top pathways were Ascorbate and aldarate metabolism, Drug metabolism—cytochrome P450, Metabolism of xenobiotics by cytochrome P450, Pentose and glucuronate interconversions, Fatty acid degradation, Valine, leucine and isoleucine degradation, Drug metabolism—other enzymes, Glutathione metabolism, Toll and Imd signaling pathway, and Ribosome biogenesis in eukaryotes. Five pathways overlapped between the two treatments: Valine, leucine and isoleucine degradation, Fatty acid degradation, Ascorbate and aldarate metabolism, Drug metabolism—cytochrome P450, and Metabolism of xenobiotics by cytochrome P450, underscoring conserved metabolic and detoxification responses to broflanilide stress (Figure 3E-F).
3.5. Sublethal Concentrations of Broflanilide Affect Epidermal Development and Fecundity by Altering Gene Expression
Bioassay results demonstrated that sublethal concentrations of broflanilide inhibited larval growth, suppressed cuticle development, and significantly reduced fecundity in T.absoluta. To explore the molecular basis of these phenotypic effects, we quantified by qPCR the expression of chitin synthase genes (chs1, chs2)—associated with cuticle formation—and vitellogenin along with its receptor genes (Vg, VgR)—linked to reproduction. Compared with the control (CK), the expression levels of Vg and VgR were significantly down regulated in both the LC₁₀ and LC₃₀ treatment groups (p < 0.001). Relative to CK, Vg expression decreased by 15.99% (LC₁₀) and 30.27% (LC₃₀), while VgR expression declined by 11.56% (LC₁₀) and 24.49% (LC₃₀). Similarly, expression of the chitin synthase genes chs1 and chs2 was significantly reduced under sublethal exposure (p < 0.001), with decreases of 13.56% and 30.17% for chs1, and 7.85% and 19.45% for chs2 in the LC₁₀ and LC₃₀ groups, respectively (Figure 4). These results suggest that sublethal broflanilide exposure modulates the expression of genes involved in larval cuticle development and female reproduction, providing a transcriptional explanation for the observed retardation of growth and reduction in fecundity in T. absoluta.
4. Discussion
Integrating bioassay and transcriptomic analyses, this study elucidates the multifaceted sublethal effects of broflanilide on T.absoluta. Our findings reveal that sublethal exposure imposes significant fitness costs, including delayed larval development and reduced fecundity, while simultaneously triggering extensive transcriptional reprogramming. These molecular responses are mechanistically linked to the observed physiological deficits, reflecting both adaptive resource reallocation and survival strategies under insecticide stress, as well as the potential for resistance evolution. This work provides an integrated physiology-to-transcriptomics perspective on the sublethal action of broflanilide, offering insights for the comprehensive management of T. absoluta.
Key phenotypic outcomes—prolonged larval duration, decreased pupal weight, and lowered female fecundity—can be interpreted through molecular mechanisms evident in the transcriptome data, establishing a coherent gene-to-trait explanatory framework. The delay in larval development and observed cuticular malformations likely originate, at least in part, from the downregulation of chitin synthesis pathways. qPCR confirmed significant suppression of two key chitin synthase genes, chs1 and chs2. Chitin serves as the primary structural component of the insect cuticle and peritrophic matrix; its impaired synthesis inevitably disrupts normal molting and cuticle remodeling (Zhou et al., 2024). This offers a molecular explanation for the reduced larval growth and extended developmental time observed in our bioassays. These results are consistent with reports in Helicoverpa armigera, where chitin synthesis inhibition leads to severe developmental defects (Li et al., 2024; Sun et al., 2025). Furthermore, KEGG enrichment analysis revealed that upstream regulatory pathways, such as “steroid hormone biosynthesis” and the “insulin signaling pathway,” were also altered. The titers of juvenile hormone and ecdysteroids are critical endocrine signals that coordinate insect growth and molting cycles (Zhang et al., 2021). Various environmental stressors are known to disturb this endocrine balance, thereby affecting development. We therefore propose that the sublethal effects of broflanilide may first perturb this higher-level regulatory network, which subsequently attenuates downstream processes such as chitin synthesis, collectively contributing to developmental retardation.
The decline in the reproductive capacity of adult insects has a clear molecular basis. Reduced expression of vitellogenin (Vg) and its receptor (VgR) genes directly impedes yolk deposition, a critical step in oogenesis (Guedes et al., 2019; Yang et al., 2024). Gene set enrichment analysis (GSEA) further revealed the activation of catabolic pathways such as “valine, leucine, and isoleucine degradation” and “fatty acid degradation,” concurrent with the down regulation of protein synthesis related pathways including “ribosome biogenesis.” This pattern indicates a substantial reallocation of energy and resources in insects under sublethal stress, whereby limited resources are redirected toward detoxification and essential maintenance metabolism at the expense of long-term growth and reproduction. Such an adaptive life history “trade off” represents a fundamental strategy of insects coping with environmental adversity (Liu et al., 2026). These observations are consistent with findings in Spodoptera frugiperda, in which insecticide stress induces similar resource allocation shifts that ultimately reduce reproductive output (Lv et al., 2025).
Transcriptomic analysis further revealed that T. absoluta mounts a multi layered molecular defense in response to sublethal broflanilide exposure. The primary response involves a pronounced up-regulation of the cytochrome P450 mediated detoxification pathway. Multiple genes associated with “drug metabolism – cytochrome P450” and “metabolism of xenobiotics by cytochrome P450” were significantly induced in both LC₁₀ and LC₃₀ treatment groups. Cytochrome P450 monooxygenases constitute a core phase I detoxification system in insects for metabolizing xenobiotics, and their rapid induction is a key molecular response to insecticide stress (Mao et al., 2007; Xia et al., 2022). Notably, the present study employed a laboratory susceptible strain under sublethal exposure. Even at concentrations that did not cause significant mortality, broflanilide acted as a selective pressure that enriched individuals with enhanced detoxification capacity. In recent years, metabolic resistance—particularly through the overexpression of P450 enzymes—has been recognized as a major mechanism enabling T. absoluta to develop resistance to various insecticides (Hu et al., 2025). For instance, cytochrome P450 genes CYP6CY3 and CYP6CY4 have been shown to confer resistance to flupyradifurone in the green peach aphid, Myzus persicae (Yuan et al., 2026). Therefore, the early induction of the P450 pathway observed here can be regarded as an initial indicator of the potential risk for the evolution of field resistance.
The detoxification response is accompanied by the activation of innate immune pathways, notably the up regulation of the Toll and Imd signaling pathways. This co activation is unlikely to be coincidental. Growing evidence indicates a sophisticated crosstalk between the insect immune system and xenobiotic metabolism networks (Li et al., 2025). For example, the Imd pathway can regulate the expression of certain cytochrome P450 genes via the transcription factor Relish, thereby mounting a coordinated defense against external stressors (Chen et al., 2025). Such a “detox immunity” coordination model may enhance short term survival under insecticide pressure but, in the long term, could accelerate the selection and fixation of resistant genotypes. Prolonged low dose exposure essentially provides a sustained “training ground” for this co adapted response, establishing a molecular foundation for metabolic resistance in populations before high level, lethal resistance emerges.
This study follows a complete research cycle—from physiological observation to molecular dissection and finally to control implications—offering insights for the sustainable management of T. absoluta. Integrated pest management strategies should seek to minimize sublethal exposure. Sublethal concentrations not only cause physiological suppression but also act as key selection pressures that prime adaptive defense mechanisms, particularly detoxification metabolism. Therefore, in field applications, it is essential to ensure precise and effective dosing, aiming for complete mortality to reduce the risk of resistance driven by sublethal residues. This requires establishing locally calibrated recommended doses based on sensitivity monitoring and optimizing application techniques to ensure thorough coverage of pest habitats. The molecular targets identified in this study can support the development of early warning tools for resistance evolution. Conventional resistance monitoring typically relies on bioassays that detect established phenotypic resistance, a process that is often retrospective. The P450 and other defense related genes that are specifically induced under sublethal stress could serve as molecular markers. By tracking the expression of these “pre resistance” markers in field populations, it may be possible to provide early warnings about selection pressure and evolutionary trajectories, enabling proactive management adjustments before phenotypic resistance becomes widespread.
Furthermore, the identified molecular vulnerabilities point to novel opportunities for multi target control strategies. Given the pivotal role of the P450 detoxification system in stress adaptation, broflanilide could be strategically combined with safe synergists (e.g., piperonyl butoxide) to disrupt critical detoxification pathways, thereby improving efficacy and reducing sublethal selection. In addition, the chitin synthesis (chs) and vitellogenin related (Vg) pathways—which are suppressed under sublethal stress—represent vulnerable nodes. Developing RNA interference (RNAi) based biopesticides that target these pathways could complement chemical modes of action. Emerging dsRNA delivery platforms using engineered microorganisms show promise for field implementation. Such a “chemical biological” integrated approach would not only enhance current control efficacy but also delay resistance evolution by attenuating population resilience.
5. Conclusions
This study integrated insect toxicology and molecular biology approaches to evaluate the sublethal effects of broflanilide on the growth, development, and reproduction of T.absoluta. Exposure to LC₁₀ and LC₃₀ significantly prolonged larval development and the pupal period, while reducing pupal weight (except for females in the LC₁₀ group), adult emergence rate, fecundity, and longevity. After 72 h of sublethal exposure, larvae exhibited stunted growth, cuticular darkening, and a shrunken morphology compared with the control (CK). Transcriptomic analysis revealed widespread changes in gene expression following LC₁₀ and LC₃₀ treatments. Specifically, qPCR confirmed the downregulation of vitellogenin (Vg) and its receptor (VgR) in adults, which aligns with the observed reduction in fecundity and suggests reproductive inhibition via suppression of oogenesis related genes. Similarly, expression of the chitin synthase genes chs1 and chs2 was significantly decreased, explaining the observed inhibition of larval cuticle development and the associated dark, shrunken phenotype. Furthermore, differentially expressed genes were enriched in several key pathways, including Toll and Imd signaling, cholesterol metabolism, antigen processing and presentation, and cytochrome P450 mediated detoxification pathways such as “Drug metabolism – cytochrome P450” and “Metabolism of xenobiotics by cytochrome P450.” By correlating physiological phenotypes with genome wide transcriptional profiles, this work systematically deciphers the cascading effects of sublethal broflanilide stress on T. absoluta, linking molecular responses to whole organism life history consequences.
Supplementary Materials
The following supporting information is available online. Table S1. Primers used for qPCR analysis. Table S2. Summary of transcriptome sequencing data quality. Figure S1. Schematic diagram of the Tuta absoluta rearing and oviposition assay setup.
Author Contributions
B.D. (Binbin Dong), Y.L. (Yalan Sun) and C.H. (Chunmeng Huang) designed the experiments and carried out the experiments, B.D. drafted the article, C.H. revised it critically for important intellectual content. X.Q. (Xiaoqian Yao) analyzed and interpreted the data and drafted the article. All authors have read and agreed to the published version of the manuscript.
Funding
The study was funded by the Doctoral Research Startup Fund of Henan University of Science and Technology.
Data Availability Statement
Data related to this study can be found in the article or supporting information; further inquiries can be directed to the corresponding author.
Conflicts of Interest
The authors declare that they have no conflicts of interest.
Abbreviations
The following abbreviations are used in this manuscript:
| T.absoluta | Tuta absoluta |
| WGCNA | Weighted gene co expression network analysis |
| DEGs | Differentially expressed genes |
| GO | Gene Ontology |
| GSEA | Gene set enrichment analysis |
| PCA | Principal component analysis |
References
- Ahmed, F. S., Çaycı, D., Erdem, E., Tunca Cosic, H., & İnak, E. (2025). Sublethal effects of broflanilide and isocycloseram on Spodoptera littoralis and associated natural enemies. Journal of Pest Science, 98(4), 2519–2530. [CrossRef]
- Chen, C., Yan, Y., Wang, J., Zhou, L., & Lu, Z. (2025). 20-Hydroxyecdysone regulates the expression of antimicrobial peptides through dorsal and relish in Helicoverpa armigera. Insect Biochemistry and Molecular Biology, 183. [CrossRef]
- Guedes, R. N. C., Roditakis, E., Campos, M. R., Haddi, K., Bielza, P., Siqueira, H. A. A., Tsagkarakou, A., Vontas, J., & Nauen, R. (2019). Insecticide resistance in the tomato pinworm Tuta absoluta: patterns, spread, mechanisms, management and outlook. In Journal of Pest Science (Vol. 92, Number 4, pp. 1329–1342). Springer Verlag. [CrossRef]
- Hu, B., Zhang, Y., Xing, Z., Chen, X., Rao, C., Liu, K., Tan, A., & Su, J. (2025). Two independent regulatory mechanisms synergistically contribute to P450-mediated insecticide resistance in a lepidopteran pest, Spodoptera exigua. BMC Biology, 23(1). [CrossRef]
- Ju, D., Liu, Y. X., Liu, X., Dewer, Y., Mota-Sanchez, D., & Yang, X. Q. (2023). Exposure to lambda-cyhalothrin and abamectin drives sublethal and transgenerational effects on the development and reproduction of Cydia pomonella. Ecotoxicology and Environmental Safety, 252. [CrossRef]
- Kumar, V., Nadarajan, S., Boddupally, D., Wang, R., Bar, E., Davidovich-Rikanati, R., Doron-Faigenboim, A., Alkan, N., Lewinsohn, E., Elad, Y., & Oren-Shamir, M. (2024). Phenylalanine treatment induces tomato resistance to Tuta absoluta via increased accumulation of benzenoid/phenylpropanoid volatiles serving as defense signals. Plant Journal, 119(1), 84–99. [CrossRef]
- Li, J., Jing, Z., Zhao, Q., Deng, K., Yu, Q., Zheng, G., Zhang, B., Wan, F., & Li, C. (2025). SePGRP-SA promotes antiviral immunity in Spodoptera exigua via Toll pathway activation. International Journal of Biological Macromolecules, 321. [CrossRef]
- Li, Zhen, Li, K., Xi, Y., Li, Zhenya, Li, X., Wei, J., An, S., & Yin, X. (2024). Sublethal concentration of beta-cypermethrin results in the mating failure of Helicoverpa armigera by inhibiting sex pheromone biosynthesis. Entomologia Generalis, 44(3), 653–662. [CrossRef]
- Liu, Z., Chen, Y., Lyu, B., Wang, S., Lu, H., Tang, J., Zhang, Q., Jiao, B., & Liu, S. (2026). Larval density-driven cannibalism shapes trade-offs among development, flight, and reproduction in Spodoptera frugiperda. Journal of Pest Science, 99(1). [CrossRef]
- Lv, W., Yan, Y., Ma, Y., Jiang, X., Deng, K., Xie, D., Cheng, Y., Liu, N., & Zhang, L. (2025). Effects of chlorantraniliprole on reproductive and migration-related traits of Spodoptera frugiperda. Entomologia Generalis, 45(1), 265–274. [CrossRef]
- Mao, Y. B., Cai, W. J., Wang, J. W., Hong, G. J., Tao, X. Y., Wang, L. J., Huang, Y. P., & Chen, X. Y. (2007). Silencing a cotton bollworm P450 monooxygenase gene by plant-mediated RNAi impairs larval tolerance of gossypol. Nature Biotechnology, 25(11), 1307–1313. [CrossRef]
- Qu, C., Chen, C. L., Li, Y. Y., Yin, Y. Q., Feng, Y. F., Wang, R., & Luo, C. (2024). Lethal, sublethal and transgenerational effects of broflanilide on Tuta absoluta. Entomologia Generalis, 44(2), 385–393. [CrossRef]
- Roditakis, E., Skarmoutsou, C., Staurakaki, M., del Rosario Martínez-Aguirre, M., García-Vidal, L., Bielza, P., Haddi, K., Rapisarda, C., Rison, J. L., Bassi, A., & Teixeira, L. A. (2013). Determination of baseline susceptibility of European populations of Tuta absoluta (Meyrick) to indoxacarb and chlorantraniliprole using a novel dip bioassay method. Pest Management Science, 69(2), 217–227. [CrossRef]
- Roditakis, E., Vasakis, E., Grispou, M., Stavrakaki, M., Nauen, R., Gravouil, M., & Bassi, A. (2015). First report of Tuta absoluta resistance to diamide insecticides. Journal of Pest Science, 88(1), 9–16. [CrossRef]
- Shi, T., Jiang, X., Cao, H., & Yu, L. (2023). Exposure to sublethal concentrations of thiacloprid insecticide modulated the expression of microRNAs in honeybees (Apis mellifera L.). Ecotoxicology and Environmental Safety, 264. [CrossRef]
- Shouyin, H. U., Feichen., ming., dai, Y., Ke., wang, Rui., dong.,zhang, Y., & ,wang, S. (n.d.). Occurrence,Pesticide Resistance, and Integrated Pest Management of the Invasive Pest Tuta absoluta. [CrossRef]
- Silva, G. A., Picanço, M. C., Bacci, L., Crespo, A. L. B., Rosado, J. F., & Guedes, R. N. C. (2011). Control failure likelihood and spatial dependence of insecticide resistance in the tomato pinworm, Tuta absoluta. Pest Management Science, 67(8), 913–920. [CrossRef]
- Sun, S., Sun, M., Du, P., Niu, H., Zhang, Z., Zhao, D., Liu, X., & Guo, H. (2025a). Protective roles of chitin synthase gene 1 in Nilaparvata lugens against Cordyceps javanica and insecticides. Pesticide Biochemistry and Physiology, 209. [CrossRef]
- Sun, X., Wei, R., Li, L., Zhu, B., Liang, P., & Gao, X. (2022). Resistance and fitness costs in diamondback moths after selection using broflanilide, a novel meta-diamide insecticide. Insect Science, 29(1), 188–198. [CrossRef]
- Ullah, F., Gul, H., Chen, L., Jinchao, W., Zhang, Z., Huang, J., Li, X., & Lu, Y. (2025). Cyantraniliprole resistance in Tuta absoluta: selection, comparative transcriptomes, and nanocarrier-mediated RNAi studies. Entomologia Generalis, 45(2), 565–575. [CrossRef]
- Xia, F., Luo, D., He, M., Wu, S., Zhao, X., & Liao, X. (2022). The development, reproduction and P450 enzyme of the white-backed planthopper, Sogatella furcifera (Hemiptera: Delphacidae) under the sublethal concentrations of clothianidin. Ecotoxicology and Environmental Safety, 246. [CrossRef]
- Xue, Y., Huang, C., Xian, X., Liu, W., Wan, F., Desneux, N., Zhang, G., & Zhang, Y. (2025). Modeling the spread patterns and climatic niche dynamics of the tomato leaf miner Tuta absoluta following its invasion of China. Journal of Pest Science, 98(4), 2417–2426. [CrossRef]
- Yang, W. J., Yan, X., Han, P., Wang, M. hui, Zhang, C., Song, J. H., Zhang, G. F., Zhang, Y. B., & Wan, F. H. (2024). Ovarian development and role of vitellogenin gene in reproduction of the tomato leaf miner Tuta absoluta. Entomologia Generalis, 44(2), 423–432. [CrossRef]
- Yuan, J., Zeng, B., Hunt, B. J., Troczka, B. J., Xiao, X., Gardner, J., Papadimitriou, F., Charamis, J., Ilias, A., Pym, A., Mavridis, K., Tshitenge, D. T., Nauen, R., Vontas, J., Margaritopoulos, J. T., Yin, X., & Bass, C. (2026). The cytochrome P450s CYP6CY3 and CYP6CY4 confer resistance to flupyradifurone in the green peach aphid Myzus persicae. Insect Biochemistry and Molecular Biology, 188. [CrossRef]
- Zhang, W., Ma, L., Liu, X., Peng, Y., Liang, G., & Xiao, H. (2021). Dissecting the roles of FTZ-F1 in larval molting and pupation, and the sublethal effects of methoxyfenozide on Helicoverpa armigera. Pest Management Science, 77(3), 1328–1338. [CrossRef]
- Zhou, Y., Zhang, Y., Xu, K., Liu, R., Liu, W., Ma, H., & Yang, W. (2024). Chitin Deacetylase 1 Gene as an Optimal RNAi-Based Target for Controlling the Tomato Leaf Miner Tuta absoluta. Insects, 15(11). [CrossRef]
Figure 1.
The description of bioassay of broflanilide to the larva of tuta absoluta. A-F. The growth and development of the second-instar larvae of t.absoluta after 72 h of treatment with different concentrations (0.4, 0.32, 0.256, 0.2048, 0.1024 mg/L and CK) of broflanilide. G-L. The damage to tomato leaves caused by the larvae of t.absoluta after 72 h of treatment with different concentrations (0.4, 0.32, 0.256, 0.2048, 0.1024 mg/L and CK) of broflanilide.
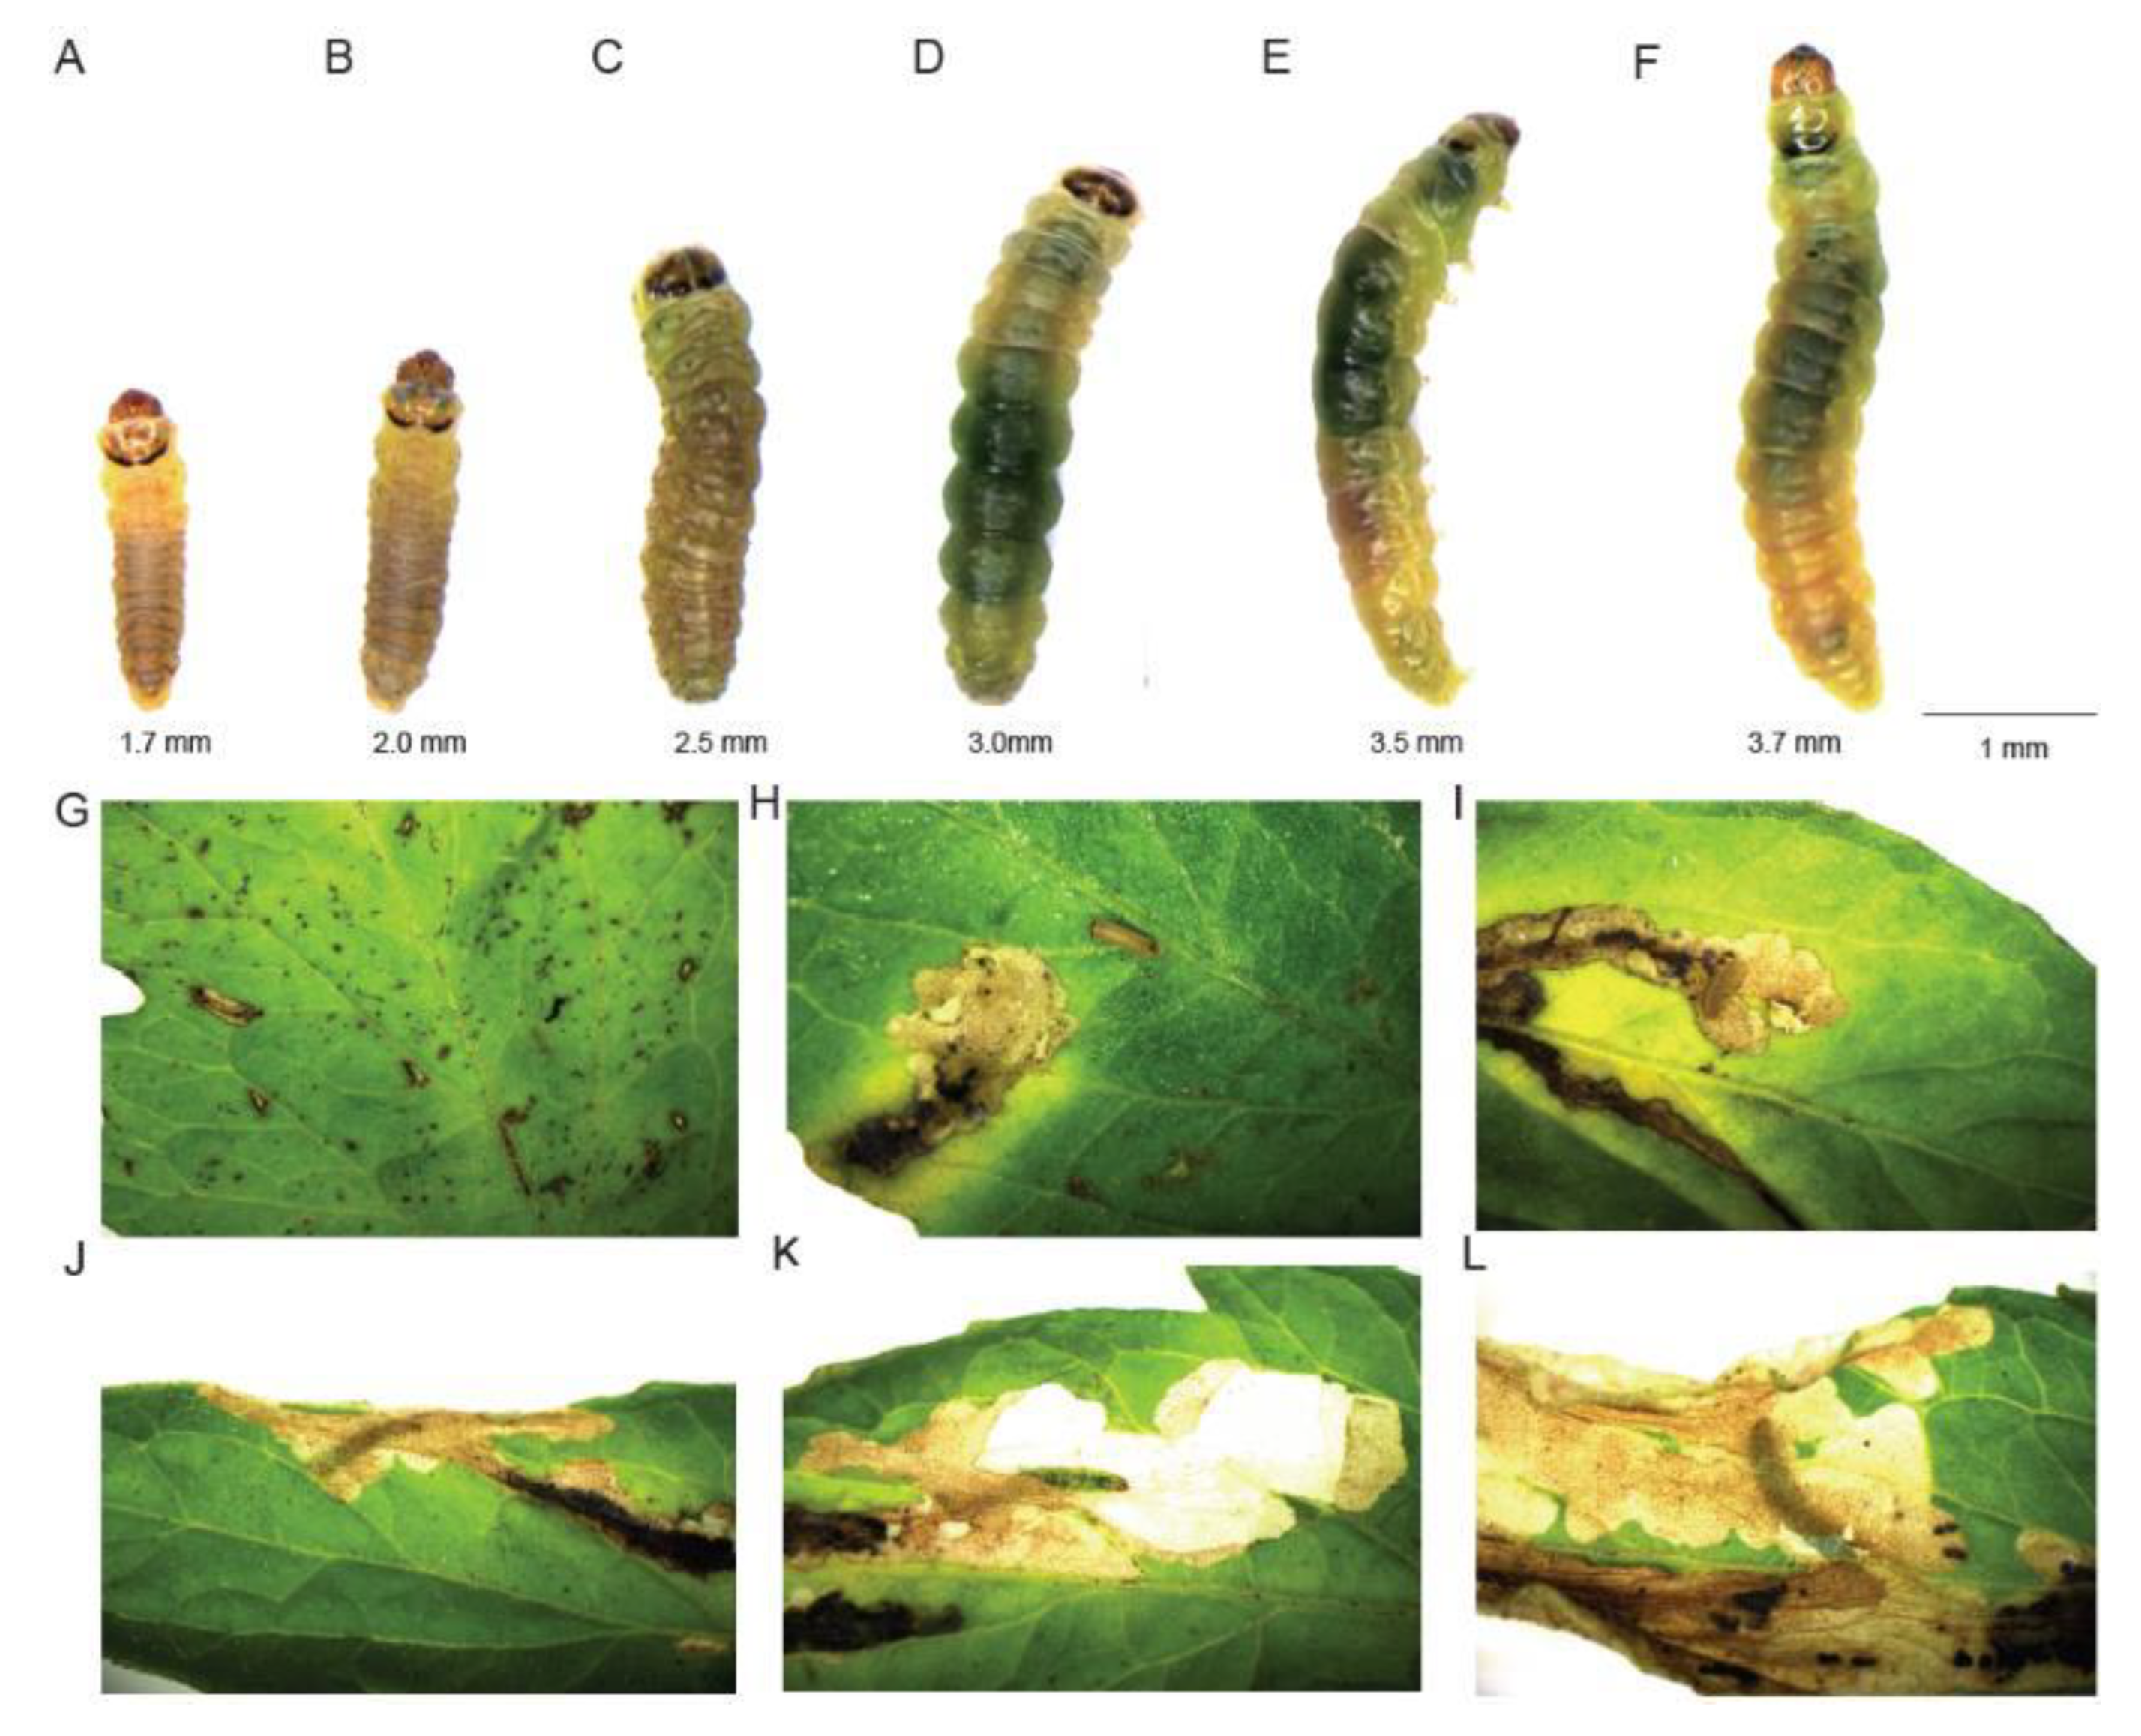
Figure 2.
Description of transcriptome data. A. Hierarchical clustering tree diagram. The branch lengths indicate the distances between samples, with closer samples reflecting greater similarity. Samples are differentiated by distinct colors corresponding to their respective groups. B. PCA (Principal Component Analysis) diagram. Points of varying colors or shapes denote sample groups under different environmental conditions. The scales on the horizontal and vertical axes represent relative distances and lack practical significance. C. Co-expression Venn diagram. Different samples are illustrated in various colors, with the numbers indicating the count of specific or shared expressed genes. The overlapping region signifies the number of expressed genes common to multiple samples, while the non-overlapping areas indicate the number of expressed genes unique to each sample. D. Venn diagram of differentially expressed genes. Distinct comparison groups are represented by different colors, with the numbers reflecting the count of differentially expressed genes that are either specific or shared. The overlapping region denotes the number of differentially expressed genes common to various comparison groups, whereas the non-overlapping areas represent the number of differentially expressed genes unique to each comparison group. E. Expression Difference Analysis Statistical Bar Chart. The horizontal axis denotes the names of the differential comparisons, while the vertical axis indicates the number of genes exhibiting up- or down-regulation differences. In this chart, blue represents down-regulation, and red signifies up-regulation. F-H. Differentially Expressed Gene Module Expression Trend Line Graph. This graph illustrates the expression trend of each sub-module. The horizontal axis represents each group, and the vertical axis reflects the standardized expression level of the gene within that group. I. Module-Level Clustering Tree Diagram. The WGCNA analysis constructs clustering trees based on the correlation of expression levels among genes, categorizing them into modules. Each color in the figure signifies that the corresponding gene on the clustering tree belongs to the same module. Genes that consistently exhibit similar expression changes during a physiological process or across different tissues may be functionally related and can thus be defined as a module. In the upper section of the tree graph, the vertical distance represents the distance between two nodes (genes), whereas the horizontal distance holds no significance. J. Heat Map of Correlation between Groups and Modules. Each row and column in the graph corresponds to a module and a group, respectively. A darker square indicates a stronger correlation, while a lighter square signifies a weaker correlation. The number within each cell reflects the correlation between the module and the sample; values closer to 1 indicate a stronger positive correlation, whereas values approaching -1 denote a stronger negative correlation. The number in parentheses represents the significance P value, with smaller values indicating greater significance.
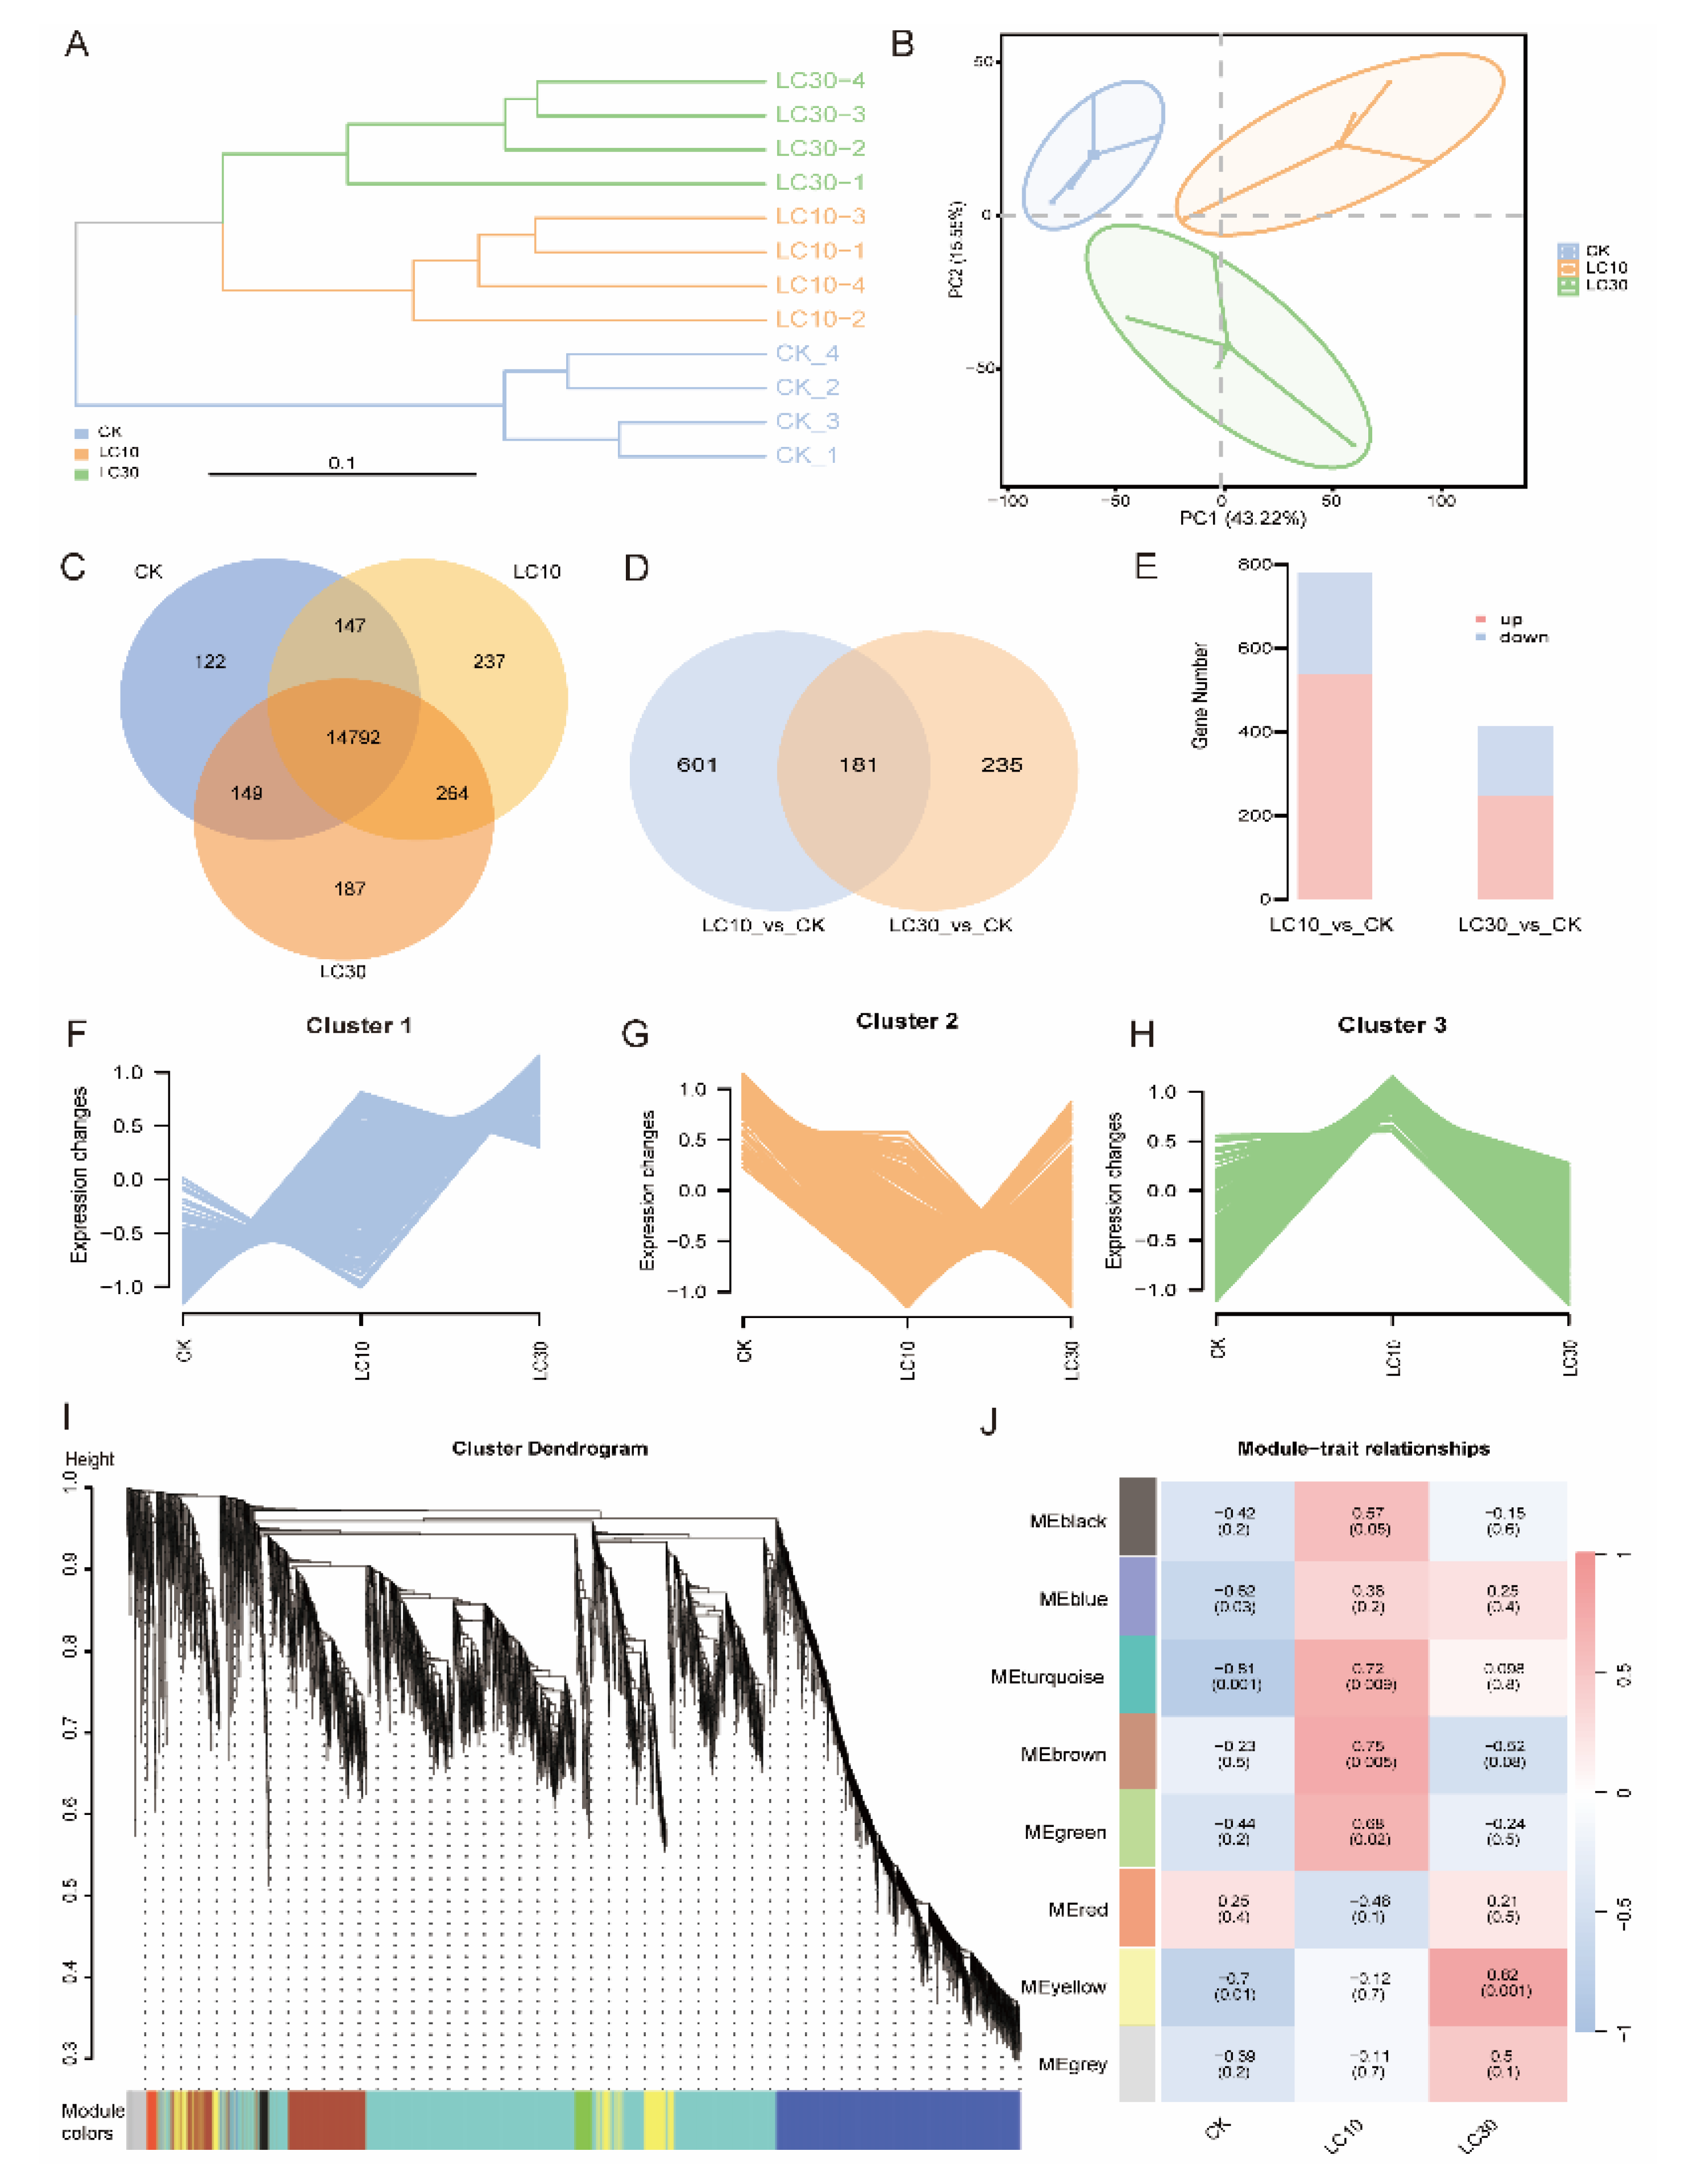
Figure 3.
Description of the functional enrichment results of transcriptome data. A-B. GO enrichment analysis of differentially expressed genes. A and B were LC10 and LC30, respectively. C-D. KEGG enrichment analysis of differentially expressed genes. C and D were LC10 and LC30, respectively. E-F. GSEA enrichment analysis of expressed genes. E and F were LC10 and LC30, respectively.
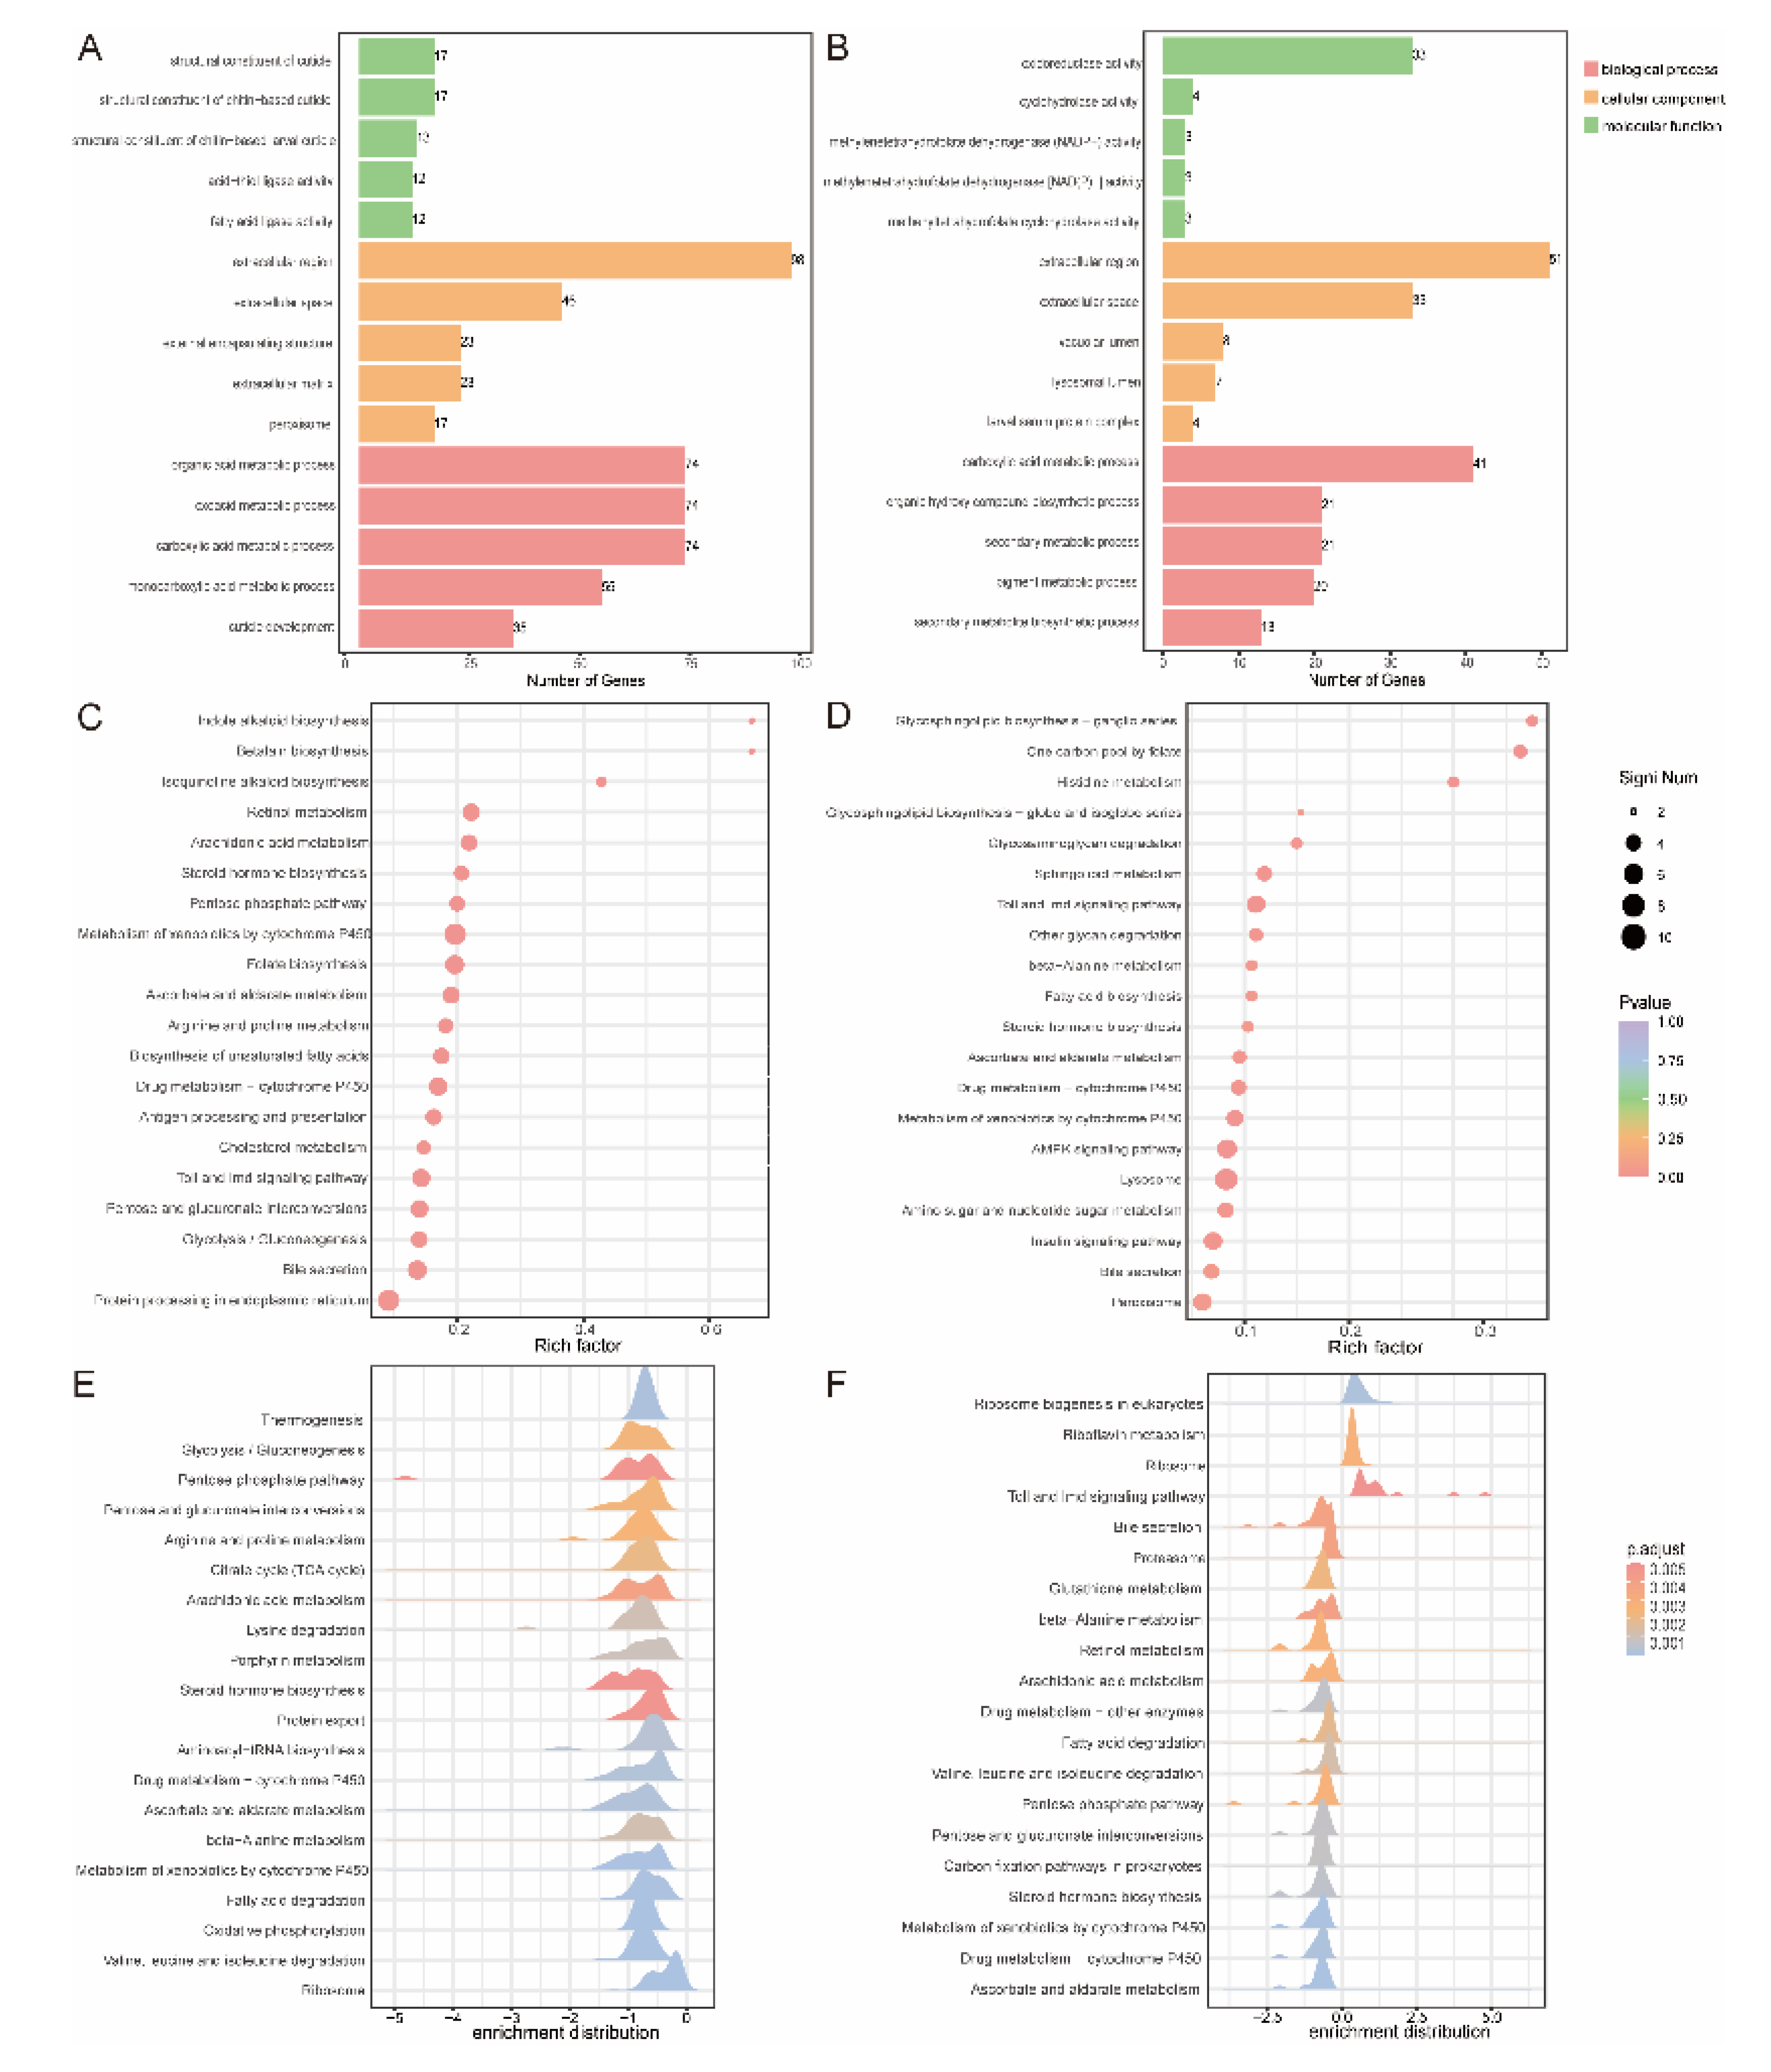
Figure 4.
qRT–PCR analysis of the expression level of Vg, VgR, chs1and chs2. A. The average values (±SD) from three biological repeats were shown. Asterisks marked significant differences from the CK, according to Student’s t-test, P < 0.01.
Figure 4.
qRT–PCR analysis of the expression level of Vg, VgR, chs1and chs2. A. The average values (±SD) from three biological repeats were shown. Asterisks marked significant differences from the CK, according to Student’s t-test, P < 0.01.
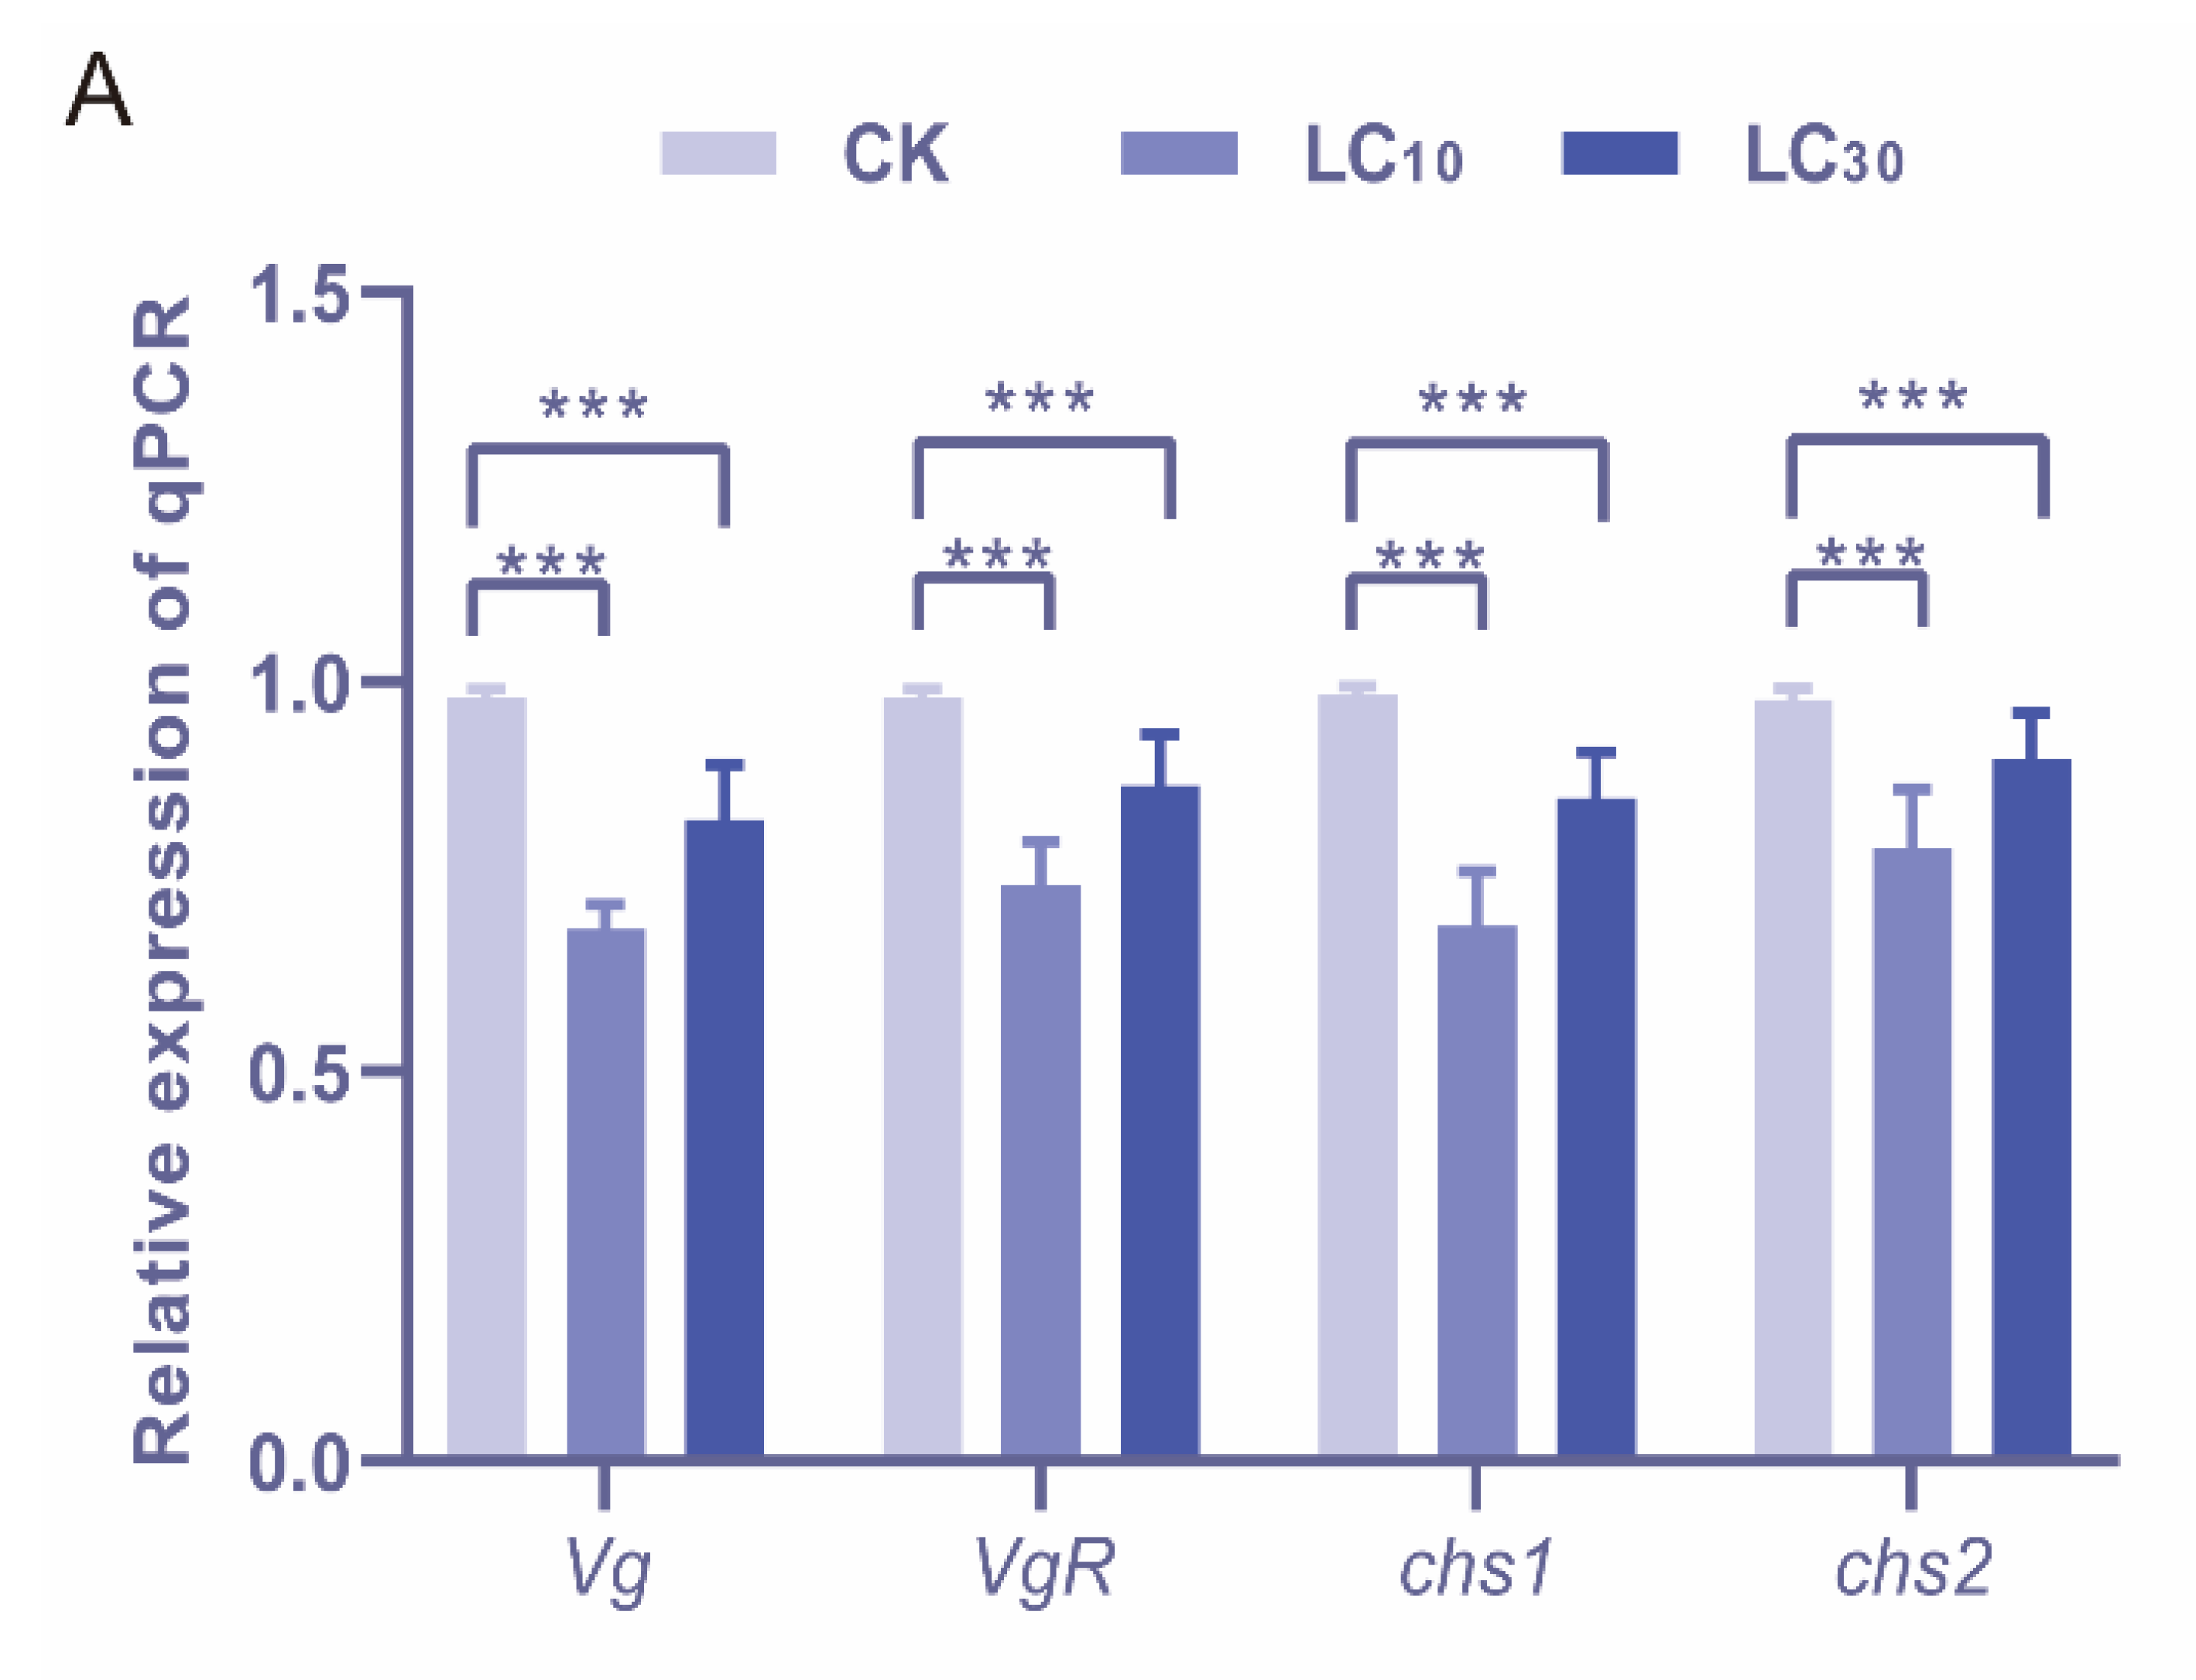

Table 1.
Biological parameters of sensitive strain of Tuta absoluta treated with broflanilide (LC10 and LC30).
Table 1.
Biological parameters of sensitive strain of Tuta absoluta treated with broflanilide (LC10 and LC30).
| Parameters | Control | LC10 | LC30 |
| Larval period(d) | 8.52±0.17 b | 8.98±0.18 a | 9.26±0.15 a |
| Pupal weight (female) (mg) | 3.22±0.05 a | 3.08±0.09 b | 2.86±0.05 c |
| Pupal weight (male) (mg) | 3.21±0.05 a | 3.15±0.09 a | 2.83±0.05 b |
| Pupal duration (female)(d) | 7.18±0.11 c | 7.92±0.12 b | 8.19±0.10 a |
| Pupal duration (male)(d) | 7.19±0.10 c | 7.98±0.12 b | 8.21±0.10 a |
| Emergence rate (female) (%) | 97.24±1.27 a | 84.18±2.65 b | 79.84±3.30 b |
| Emergence rate (male) (%) | 96.40±1.56 a | 86.24±1.98 b | 78.90±3.55 c |
| Fecundity (eggs/female) | 183.68±4.24 a | 100.58±5.09 b | 96.66±3.21 b |
| Adult longevity (female) | 8.90±0.16 a | 8.54±0.13 b | 8.44±0.10 b |
| Adult longevity (male) | 8.96±0.14 a | 8.66±0.13 b | 8.50±0.11 b |
1 Values are shown as means ± standard error (SE). Different lower-case letters in a row indicate significant differences using Chi-square test (p<0.05).
Disclaimer/Publisher’s Note: The statements, opinions and data contained in all publications are solely those of the individual author(s) and contributor(s) and not of MDPI and/or the editor(s). MDPI and/or the editor(s) disclaim responsibility for any injury to people or property resulting from any ideas, methods, instructions or products referred to in the content. |
© 2026 by the authors. Licensee MDPI, Basel, Switzerland. This article is an open access article distributed under the terms and conditions of the Creative Commons Attribution (CC BY) license (http://creativecommons.org/licenses/by/4.0/).
Copyright: This open access article is published under a Creative Commons CC BY 4.0 license, which permit the free download, distribution, and reuse, provided that the author and preprint are cited in any reuse.


