Submitted:
11 February 2026
Posted:
13 February 2026
You are already at the latest version
Abstract
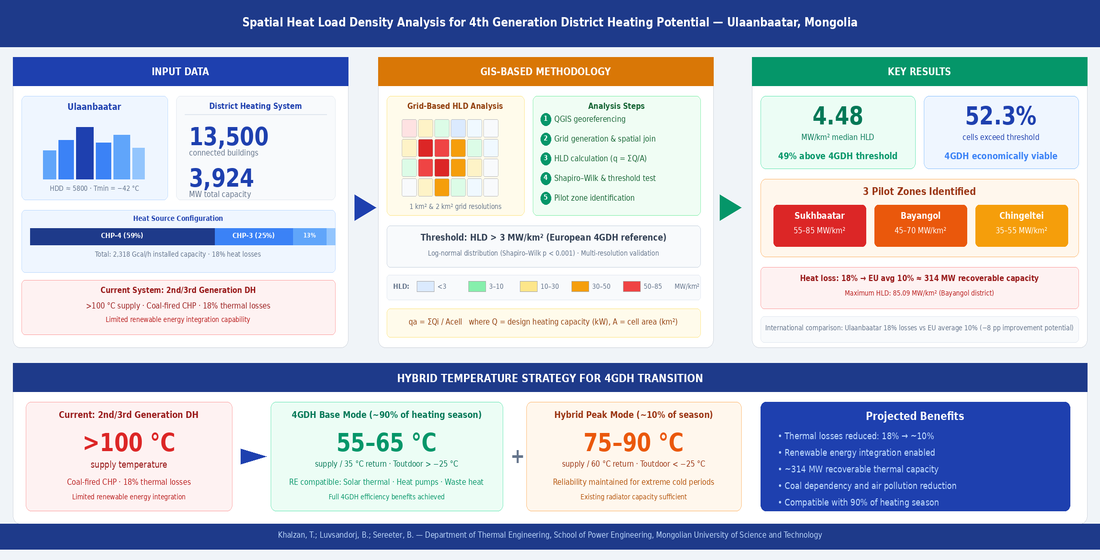
Ulaanbaatar, the capital of Mongolia, operates one of the world’s largest district heating (DH) systems in the coldest national capital (Heating Degree Days ~5800). Despite serving over 60% of the city’s 1.6 million residents, the current 3rd generation DH system suffers from high thermal losses (~17–18%) and relies on coal-fired combined heat and power plants. Transitioning to 4th generation district heating (4GDH) with lower supply temperatures could reduce these losses while enabling future low-temperature renewable energy integration. This GIS-based spatial heat load density (HLD) analysis uses operational data from the Ulaanbaatar District Heating Company, encompassing 13,500 buildings with a total connected capacity of 3,924 MW. Grid-based spatial analysis was performed at two resolutions (1 km² and 2 km²). Threshold sensitivity analysis was conducted across HLD criteria of 1–5 MW/km². Results indicate that median HLD values exceed the European reference threshold of 3 MW/km², with log-normal distributions confirmed by Shapiro–Wilk tests. Three candidate pilot zones were identified. A hybrid temperature strategy (65/35 °C above −25 °C; 90/60 °C below) further contextualizes the findings. These results suggest spatially favorable conditions for 4GDH development, providing a quantitative foundation for subsequent techno-economic feasibility studies.
Keywords:
district heating
; heat load density
; 4th generation district heating
; extreme cold climate
; spatial analysis
; GIS-based heat mapping
; threshold sensitivity analysis
; Ulaanbaatar
1. Introduction
District heating (DH) systems play a vital role in providing thermal comfort to urban populations, accounting for approximately 12% of global heat demand in the building sector [1]. As the world intensifies efforts to achieve carbon neutrality, the transformation of existing DH infrastructure toward more efficient and sustainable configurations has become a critical priority [2]. Recent comprehensive reviews have documented the state-of-the-art in 4th and 5th generation DH systems, highlighting both technological advances and remaining implementation challenges [28,29]. The concept of 4th generation district heating (4GDH), introduced by Lund et al. [3], represents a paradigm shift in DH technology, characterized by low supply temperatures (40–65 °C), integration of renewable and waste heat sources, and smart grid capabilities that enable bidirectional energy flows.
While 4GDH systems have been successfully implemented in several European cities, including Copenhagen, Denmark, and various Swedish municipalities [4,5], their applicability to regions with extreme continental climates remains largely unexplored [30]. Recent studies on China’s urban heating systems have demonstrated the risks of carbon lock-in from continued coal-CHP expansion [31], yet systematic spatial assessments for extreme cold climate cities remain scarce. This knowledge gap is particularly significant for cities in Central Asia, Siberia, and northern China, where winter temperatures can reach −40 °C or below, and heating seasons extend for 6–8 months annually [6]. The lack of comprehensive feasibility studies for such regions presents a substantial barrier to sustainable energy transition in these areas.
Ulaanbaatar, the capital of Mongolia, presents a unique and compelling case study for examining 4GDH feasibility in extreme cold climates. As the world’s coldest capital city, Ulaanbaatar experiences average January temperatures of −21 °C, with extreme lows reaching −40 °C [7]. The city’s 8-month heating season (September to May) places enormous demands on its energy infrastructure. Currently, approximately 60% of the city’s 1.6 million residents (as of 2024) are served by a centralized DH system that relies primarily on coal-fired combined heat and power (CHP) plants [8,9]. This heavy dependency on coal combustion has contributed to severe air pollution, with Ulaanbaatar frequently ranking among the world’s most polluted cities during winter months, causing significant public health concerns [10]. Recent field measurements of indoor thermal environments in Ulaanbaatar residential buildings have revealed average temperatures of 25.4 °C—exceeding design standards—with significant energy saving potential through improved building envelope performance [32]. Mongolia’s renewable energy policy framework has also been analyzed in the context of the country’s heavy dependence on coal-fired generation [33].
The existing DH system in Ulaanbaatar operates at what can be classified as 2nd generation technology, characterized by supply temperatures exceeding 100 °C, high distribution losses (approximately 18%), and limited consumer-side temperature control [11]. The infrastructure, largely inherited from the Soviet era, faces increasing challenges including aging pipelines, capacity constraints, and growing demand from rapid urbanization. These factors underscore the urgent need for modernization strategies that can improve efficiency while creating thermal conditions compatible with future low-temperature renewable energy integration.
The spatial distribution of heat demand is a fundamental factor in determining the economic viability of DH systems [12]. Heat load density—defined as the thermal energy demand per unit area (typically expressed in MW/km2 or GJ/ha)—serves as a key indicator for assessing whether centralized heating infrastructure can be economically justified compared to decentralized alternatives [13]. European studies have established that areas with heat load densities exceeding 3 MW/km2 generally support economically viable DH systems, while densities above 20 MW/km2 indicate highly favorable conditions for district heating development [14,15].
This study aims to address critical research gaps through a comprehensive spatial heat load density analysis of Ulaanbaatar’s centralized DH system. The specific objectives are: (1) to determine the spatial distribution of heat load density across Ulaanbaatar’s DH service area using GIS-based grid analysis at multiple resolutions (1 km2 and 2 km2); (2) to evaluate the statistical characteristics of the heat load density distribution and compare them with established 4GDH economic viability thresholds; (3) to identify high-density zones suitable for priority 4GDH pilot implementation; and (4) to develop recommendations for 4GDH transition strategies appropriate for extreme cold climate conditions.
2. Literature Review
2.1. Evolution of District Heating Systems
The development of district heating technology has progressed through distinct generations, each representing significant advances in efficiency, temperature levels, and system integration capabilities. First-generation systems (1880–1930) utilized steam as the heat carrier, operating at high temperatures and pressures with substantial heat losses. Second-generation systems (1930–1980) marked the transition to pressurized hot water, typically operating at temperatures above 100 °C, representing a significant improvement in distribution efficiency. Third-generation systems (1980–2020) brought further improvements through pre-insulated pipes and reduced operating temperatures (70–100 °C), enabling better integration with combined heat and power plants.
The 4th generation concept, formalized by Lund et al. [3] in 2014, envisions DH systems operating at supply temperatures of 40–65 °C, enabling direct integration of renewable and waste heat sources that would be unusable in higher-temperature systems [16]. The emerging 5th generation concept further extends this vision with bidirectional thermal grids operating at near-ambient temperatures. A recent state-of-the-art analysis by Yao et al. [28] provides a comprehensive assessment of both 4GDH and 5GDH system configurations, while Dang et al. [29] present a systematic survey of 5GDH implementations across Europe. As illustrated in Figure 1, Ulaanbaatar’s current system operates in the 2nd generation paradigm, with the proposed transition targeting 3rd/4th generation characteristics.
2.2. Heat Load Density in DH Planning
Heat load density serves as a fundamental metric in DH system planning, providing a spatial indicator of where centralized heating infrastructure can be economically justified. Persson and Werner [17] established that area heat densities exceeding 3 MW/km2 generally support economically viable DH development. Their comprehensive analysis demonstrated that approximately 50% of the EU’s heat demand is located in areas meeting this threshold, suggesting substantial potential for DH expansion even in markets with lower current penetration rates. Subsequent studies have refined these thresholds, with Nielsen and Möller [15] identifying 20 MW/km2 as indicating highly favorable conditions and 50 MW/km2 as representing priority development zones. Sánchez-García et al. [34] further advanced the understanding of effective width for district heating distribution cost assessment, while Bachmann and Kriegel [35] demonstrated that network structure and temperature spread are equally significant determinants of DH economic viability alongside linear heat density.
2.3. Cold Climate District Heating Challenges
The applicability of 4GDH concepts to cold and extreme cold climates has received increasing attention. Averfalk and Werner [19] demonstrated that low-temperature DH in Nordic climates requires careful peak load management. Nord et al. [20] found that hybrid temperature strategies can capture 80–90% of 4GDH efficiency benefits while maintaining reliability. Brand and Svendsen [21] showed that many existing radiator systems in Nordic buildings are oversized by factors of 1.3–1.5×, suggesting greater compatibility with reduced supply temperatures than nominal specifications indicate. Guelpa et al. [36] reviewed strategies and implementations for supply temperature reduction in existing DH networks operating at 80–100 °C. Østergaard et al. [37] provided a comprehensive review of low-temperature operation requirements for enabling 4GDH in existing building stock. More recently, Javanshir et al. [38] analyzed the risks of electrified district heating in Finland’s cold climate, highlighting the importance of hybrid strategies for maintaining system reliability.
2.4. GIS-Based Spatial Heat Demand Analysis
GIS methods have become standard tools for spatial heat demand assessment. Möller and Lund [13] established multi-resolution grid-based approaches for evaluating DH potential. Dochev et al. [23] demonstrated building-level data for high-resolution heat demand mapping. Chambers et al. [24] applied machine learning to improve heat demand estimation accuracy. Collectively, these studies establish that grid-based spatial analysis at 1 km2 resolution provides a robust balance between spatial detail and statistical reliability for DH planning. More recently, Manz et al. [39] performed a pan-European spatial analysis of renewable and excess heat potentials for climate-neutral district heating, while Spirito et al. [40] developed a spatially-detailed model for optimally matching heat sources and demands at large scale. Kuntuarova et al. [41] provide a comprehensive review of DH network modeling approaches and simulation tools.
3. Materials and Methods
3.1. Study Area
Ulaanbaatar is situated at approximately 47.9°N latitude and 106.9°E longitude, in a valley along the Tuul River at an elevation of approximately 1350 meters above sea level. The climate is classified as subarctic continental (Köppen climate classification: Dwc), characterized by extreme temperature variation between seasons. The mean annual temperature is −0.4 °C, with average January temperatures of −21.6 °C and minimum recorded temperatures of −42.2 °C. The heating season extends from September 15 to May 15 (approximately 8 months), with approximately 5800 heating degree days (base 18 °C), making it one of the most heating-intensive urban environments globally.
3.2. Data Sources and Heat Supply Infrastructure
The primary dataset was obtained from the Ulaanbaatar District Heating Company (UBDHK) through collaboration with the Thermal Engineering Division of the Ulaanbaatar City Governor’s Office, compiled as of April 2024. The dataset includes georeferenced heat load information for all buildings connected to the centralized district heating network, providing a comprehensive foundation for spatial analysis.

Table 1.
Summary statistics of Ulaanbaatar district heating system data.
| Parameter | Value | Unit |
|---|---|---|
| Total connected buildings | 13,500 | buildings |
| Total connected heat load | 3924 | MW |
| Average heat load per building | 290 | kW |
| Median heat load per building | 168 | kW |
| Study area (longitude range) | 106.73–107.02 | °E |
| Study area (latitude range) | 47.84–47.96 | °N |
The city’s heat supply infrastructure consists of four primary heat sources, as illustrated in Figure 2. Combined Heat and Power Plant No. 4 (CHP-4) dominates the system with 59% of total installed capacity (1373 Gcal/h), followed by CHP-3 (25%, 585 Gcal/h), Amgalan Heat-Only Boiler plant (13%, 300 Gcal/h), and the older CHP-2 (3%, 60 Gcal/h). The total installed heating capacity of 2318 Gcal/h (2696 MW) must serve a growing heat demand that has increased from 3166 Gcal/h in 2020 to 3829 Gcal/h in 2024, representing a 21% increase over five years.
Figure 3 illustrates the concerning gap between heat demand and installed capacity. The current system has been operating at capacity deficit since at least 2020, with the gap projected to widen from 1511 Gcal/h (2024) to 2782 Gcal/h by 2030 if current growth trends continue. This capacity shortage underscores the urgent need for both efficiency improvements through 4GDH transition and strategic capacity expansion.
3.3. Grid-Based Spatial Analysis Methodology
The spatial analysis employed a grid-based approach using QGIS 3.28 software, following established methodologies for heat load density mapping [14,17]. Two grid resolutions were employed to balance analytical precision with strategic planning requirements. The 1 km2 resolution (1.0 km × 1.0 km cells, 345 total cells) provides detailed spatial resolution suitable for pilot zone identification and detailed planning. The 2 km2 resolution (√2 km × √2 km ≈ 1.414 km × 1.414 km cells, 176 total cells) offers a broader perspective appropriate for strategic assessment and regional planning.
The selection of grid cell sizes was guided by three considerations: (1) Compatibility with international benchmarks: the 1 km2 resolution aligns with European reference studies by Persson and Werner [14] and Connolly et al. [2]; (2) Statistical representativeness: a preliminary analysis at 500 m × 500 m resolution yielded approximately 40% of cells containing fewer than 5 buildings, resulting in statistically unreliable estimates; the 1 km2 resolution provides 15–20 buildings per occupied cell; (3) Multi-resolution robustness: the √2 km × √2 km grid (yielding (√2)2 = 2.0 km2 cell area) evaluates sensitivity to spatial aggregation effects.
A five-step GIS processing workflow was implemented: (Step 1) Data import and coordinate reprojection from WGS84 (EPSG:4326) to UTM Zone 48N (EPSG:32648); (Step 2) Grid generation using QGIS 3.28 “Create Grid” tool; (Step 3) Point-in-polygon spatial join assigning each building to its enclosing grid cell; (Step 4) Aggregation of design heating capacities per cell to compute HLD; (Step 5) Statistical analysis including Shapiro–Wilk tests and log-transformation using Python SciPy v1.11.
Heat load density for each grid cell was calculated using Equation (1):
where qₐ (MW/km2) is the areal heat load density of grid cell a, Qᵢ (kW) is the design heating capacity of building i within cell a, and A_cell (km2) is the cell area. The design heating capacity Qᵢ represents the maximum thermal power allocated to each building under design outdoor conditions (−40 °C per Mongolian building code BNbD 41-01-11), as recorded in the UBDHK operational database. This value reflects connected thermal load rather than measured consumption; consequently, the HLD values represent upper-bound estimates of spatial heat demand.
qₐ = ΣQᵢ / A_cell
4. Results
4.1. Spatial Distribution of Heat Load Density
Figure 4 presents the spatial distribution of heat load density at 1 km2 resolution. The analysis reveals a highly concentrated pattern with distinct high-density cores in the central urban area. The maximum heat load density reaches 85.09 MW/km2, located in central Bayangol district, with secondary peaks exceeding 70 MW/km2 in Sukhbaatar district. The distribution pattern reflects the historical development of Ulaanbaatar, with Soviet-era apartment complexes concentrated in central districts creating zones of extremely high heat demand density.
The 2 km2 resolution analysis (Figure 5) reveals similar patterns with reduced peak values (maximum 74.07 MW/km2) due to spatial averaging effects. This resolution provides a clearer view of the regional structure of heat demand, identifying a central high-density corridor extending approximately 8 km from west to east through the urban core.
4.2. Statistical Characteristics and Threshold Analysis
Table 2 presents comprehensive statistical analysis results. Both distributions exhibit strong positive skewness (1.87 and 1.92), indicating a concentration of cells at lower density values with an extended tail toward high-density areas. The kurtosis values (3.42 and 3.68) slightly exceed that of a normal distribution (3.0), indicating heavier tails. The Shapiro-Wilk test confirms significant departure from normality (p < 0.001 for both resolutions), consistent with the log-normal distributions typically observed in urban heat demand patterns.
Figure 6.
Frequency distribution histograms of heat load density at (a) 1 km2 and (b) 2 km2 grid resolutions, showing the right-skewed distribution characteristic of urban heat demand patterns. Vertical lines indicate mean (red dashed), median (green solid), and 4GDH threshold of 3 MW/km2 (orange dotted).
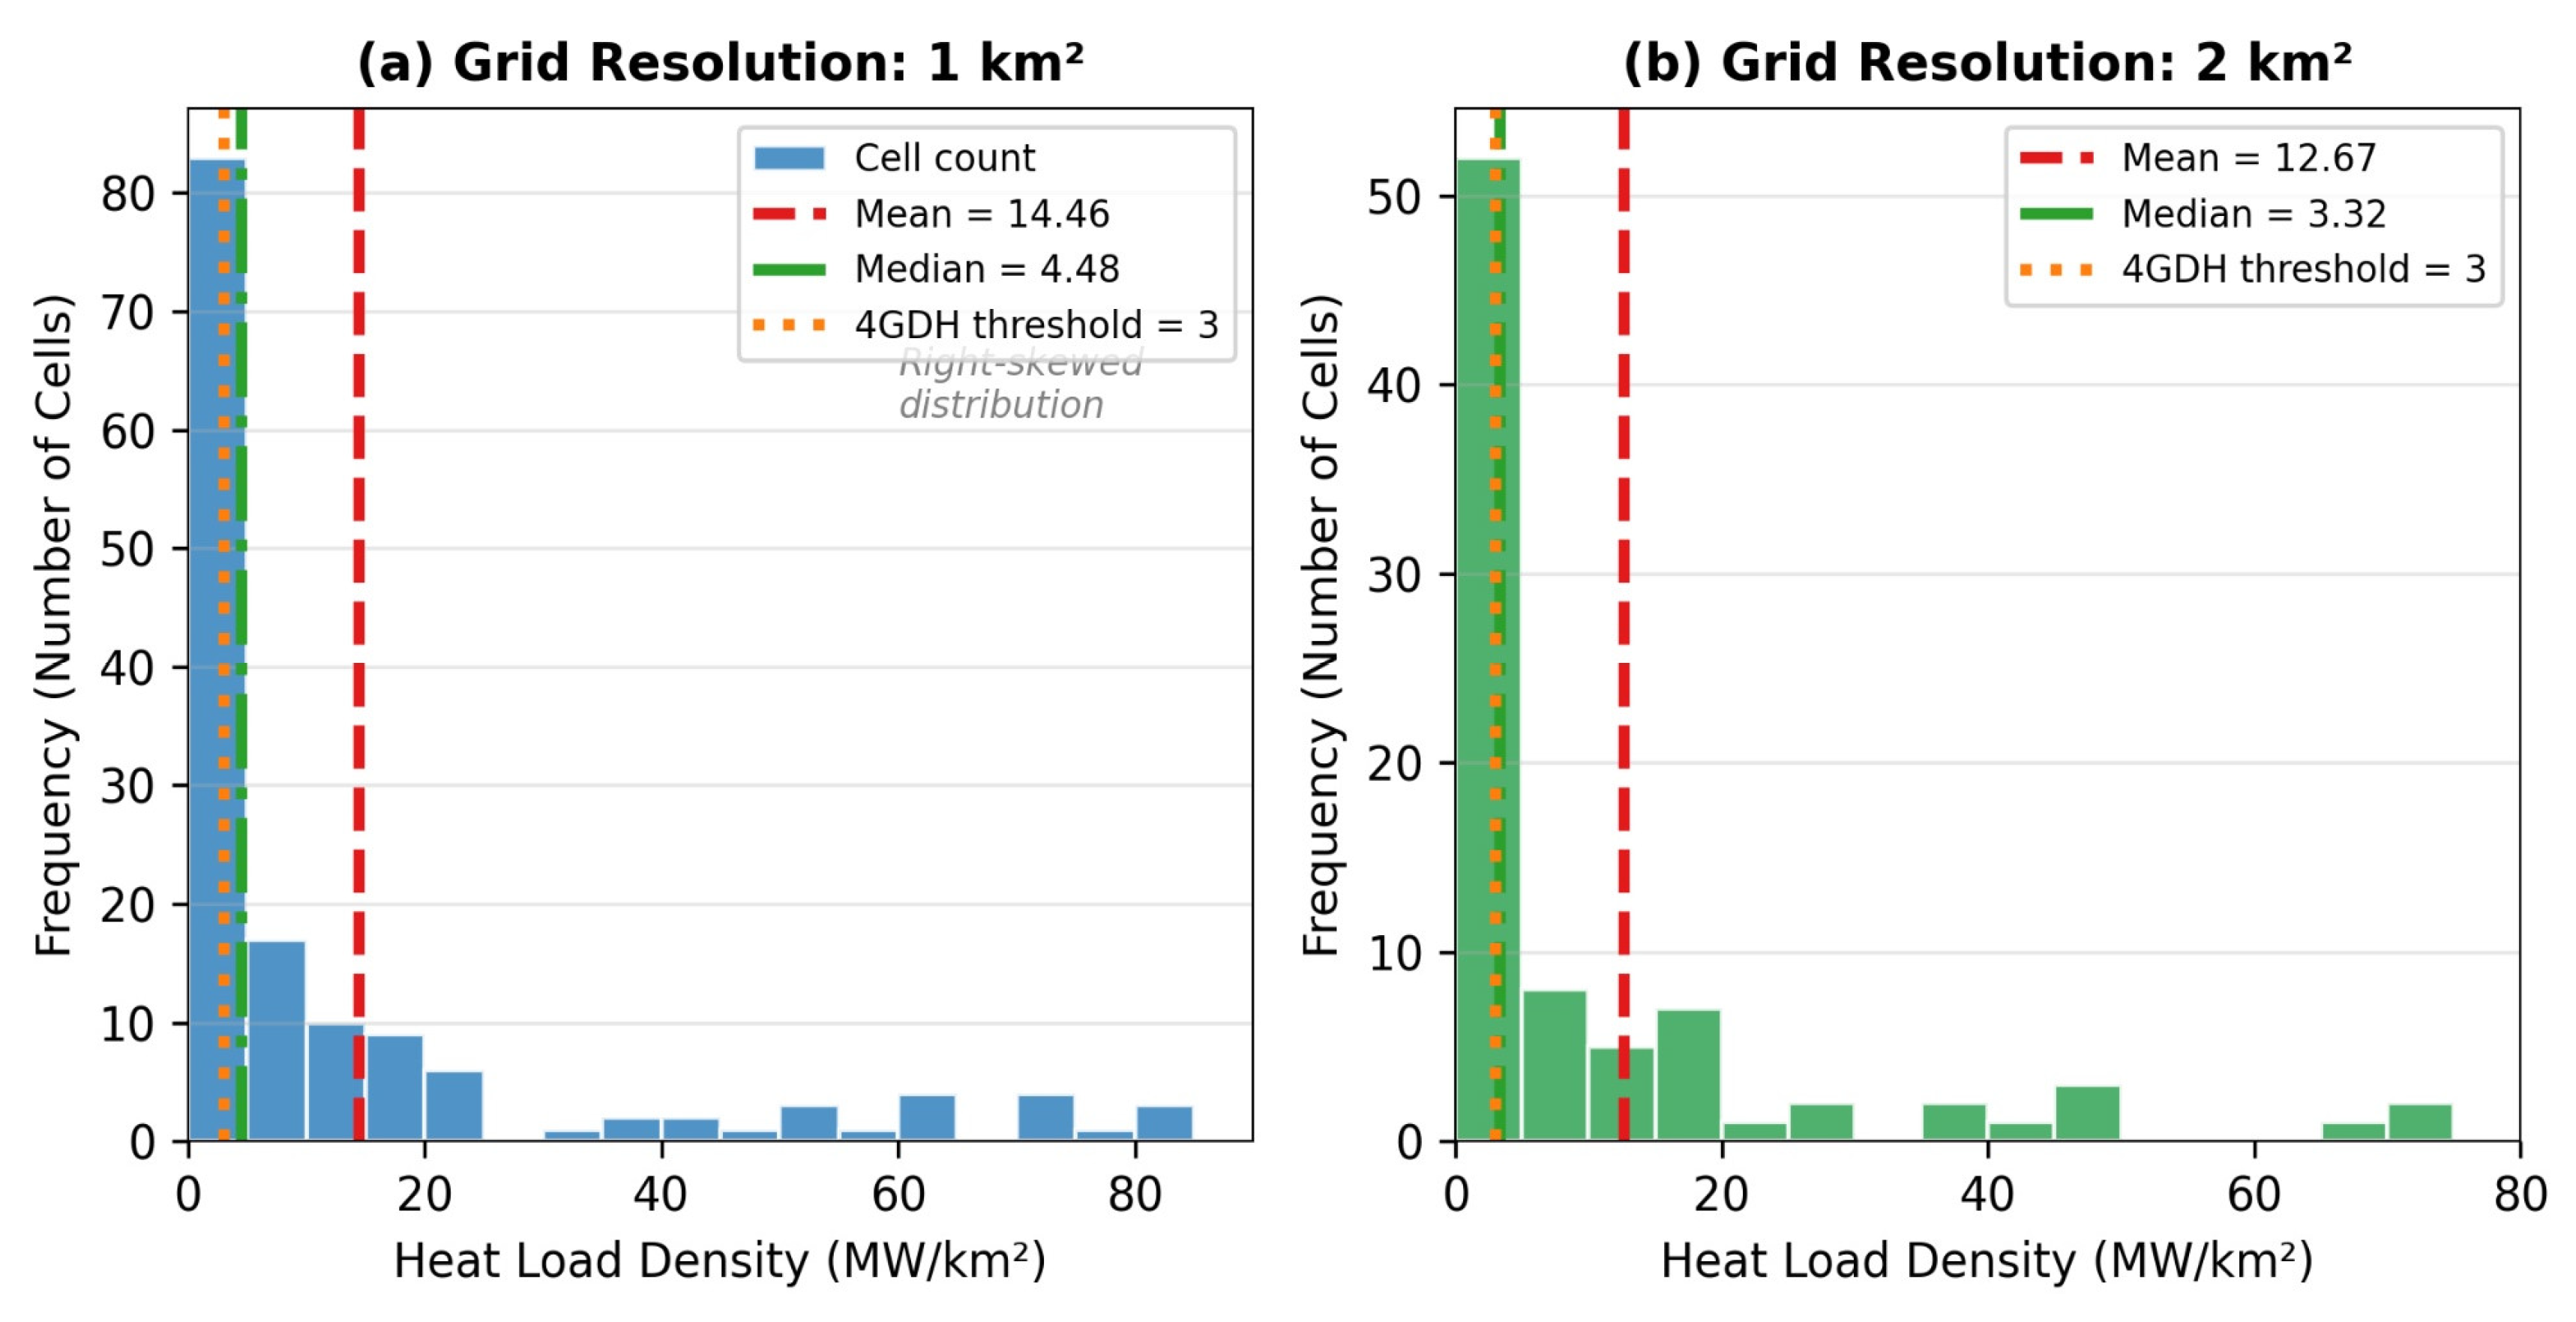
Notably, the median heat load density of 4.48 MW/km2 (at 1 km2 resolution) exceeds the European 4GDH economic viability threshold of 3 MW/km2 by 49%. At 2 km2 resolution, the median (3.32 MW/km2) still exceeds the threshold by 11%. This indicates that the majority of Ulaanbaatar’s district heating service area meets the fundamental economic viability criterion for 4GDH implementation.
Table 3.
Proportion of cells exceeding heat load density thresholds.
| Threshold (MW/km2) | Significance | 1 km2 | 2 km2 |
|---|---|---|---|
| >3 (4GDH threshold) | Economically viable | 52.3% | 47.1% |
| >10 | Favorable | 34.2% | 29.4% |
| >30 | Priority zone | 18.8% | 15.3% |
| >50 | Highly favorable | 8.1% | 5.9% |
4.3. Multi-Resolution Comparison
Figure 7 presents a side-by-side comparison of the two grid resolutions. The 1 km2 grid reveals finer spatial detail with sharper density gradients, while the 2 km2 grid provides a smoothed representation better suited for strategic planning. Both resolutions consistently identify the central urban corridor as the primary zone of high heat demand concentration, validating the robustness of the spatial analysis methodology.
4.4. International Comparison
Figure 8 positions Ulaanbaatar’s system performance within the international context. The current heat loss rate of 18% is the highest among compared systems, exceeding the European average (approximately 10%) by 8 percentage points and best-performing systems (Austria, Estonia: 5%) by 13 percentage points. This comparison highlights substantial efficiency improvement potential: reducing heat loss to the European average would recover approximately 314 MW of thermal capacity—equivalent to 12% of the current installed capacity of 2318 Gcal/h.
5. Discussion
5.1. Technical Considerations for Temperature Reduction
While the heat load density analysis indicates spatially favorable conditions for 4GDH development, several technical challenges must be addressed for successful transition in Ulaanbaatar’s extreme cold climate. The most significant constraint relates to radiator capacity in existing buildings designed for high-temperature systems.
The heat output of radiators follows the logarithmic mean temperature difference (LMTD) relationship with indoor and outdoor conditions. For a conventional system operating at 95/70 °C supply/return temperatures with 20 °C indoor temperature, the LMTD is calculated as (75−50)/ln(75/50) = 61.7 °C. For a 4GDH system operating at 55/35 °C, the LMTD reduces to (35−15)/ln(35/15) = 23.6 °C. This yields a capacity ratio of 23.6/61.7 = 38%, representing a 62% reduction in radiator heat output capacity. Chicherin [42] recently demonstrated through a case study in Omsk, Russia—a city with comparable extreme cold conditions—that a 10 °C reduction in supply temperature can yield approximately 20% reduction in heat losses and 19% lower operational costs, providing empirical support for temperature reduction strategies in extreme cold climates.
5.2. Hybrid Temperature Strategy
Given the radiator capacity constraints, a hybrid temperature strategy is proposed to balance 4GDH benefits with reliability requirements during extreme cold periods. The −25 °C threshold for temperature mode switching was selected based on detailed radiator capacity analysis. At outdoor temperatures above −25 °C, the required heating load is approximately 70% of design capacity, which can be met by oversized Soviet-era radiators even at reduced 4GDH supply temperatures.
Table 4.
Hybrid temperature operating strategy for Ulaanbaatar 4GDH implementation.
| Mode | Outdoor Temp | Supply Temp | Season Share | Benefits |
|---|---|---|---|---|
| 4GDH Base | > −25 °C | 55–65 °C | ~90% | Full 4GDH benefits |
| Hybrid Peak | < −25 °C | 75–90 °C | ~10% | Reliability maintained |
This strategy enables 4GDH operation for approximately 90% of the heating season while maintaining system reliability during the most extreme conditions that occur for approximately 10% of the heating period.
5.3. Pilot Zone Recommendations
Based on the spatial analysis results, three priority zones are recommended for phased 4GDH pilot implementation, as illustrated in Figure 9. The selection criteria include high heat density (>30 MW/km2), presence of newer building stock with better thermal performance, and existing infrastructure connectivity.
Table 5.
Detailed pilot zone specifications for phased 4GDH implementation.
| Parameter | Zone 1: Sukhbaatar | Zone 2: Bayangol | Zone 3: Chingeltei |
|---|---|---|---|
| Coordinates (°E) | 106.91–106.94 | 106.86–106.89 | 106.84–106.87 |
| Coordinates (°N) | 47.91–47.93 | 47.87–47.89 | 47.92–47.94 |
| Area (km2) | ~3.2 | ~2.8 | ~2.5 |
| Heat density (MW/km2) | 55–85 | 45–70 | 35–55 |
| Buildings | ~420 | ~380 | ~310 |
| Total load (MW) | ~185 | ~145 | ~95 |
| Priority | High | High | Medium |
5.3.1. Scope Clarification
It is important to clarify the scope of the present analysis within the broader context of 4GDH transition assessment. The spatial heat load density analysis presented here addresses one necessary but not sufficient condition for 4GDH viability: the existence of sufficiently concentrated heat demand. A comprehensive 4GDH transition assessment would additionally require: (i) techno-economic analysis; (ii) detailed hydraulic network modeling; (iii) building-level thermal compatibility assessment; (iv) renewable energy source identification and integration modeling; and (v) life cycle environmental assessment. The present study establishes the spatial foundation upon which these subsequent analyses can be built.
5.4. Implications for Renewable Energy Integration
The transition to 4GDH would significantly expand the range of renewable and waste heat sources that can contribute to Ulaanbaatar’s heat supply. At conventional supply temperatures exceeding 100 °C, renewable integration is limited to high-temperature sources such as biomass combustion. With 4GDH supply temperatures of 55–65 °C, several additional sources become technically viable, including large-scale solar thermal systems with seasonal storage, ground-source and air-source heat pumps, industrial waste heat recovery, and data center waste heat utilization.
The Drake Landing Solar Community (DLSC), a Canadian demonstration project supported by Natural Resources Canada, has demonstrated that solar thermal with borehole thermal energy storage can provide 90% of space heating demand even in climates with over 5000 heating degree days [18]. Given Ulaanbaatar’s exceptional solar radiation (averaging 2,700 kWh/m2/year), similar systems could contribute substantially to the city’s heat supply while reducing coal dependency and associated air pollution. Liu et al. [31] demonstrated that diversifying China’s urban heating systems through industrial waste heat recovery and heat pumps could reduce emissions by 26% by 2030 without new CHP construction. A systematic review of DH decarbonization strategies by Malcher et al. [43] found that 4GDH/5GDH systems can reduce carbon footprints by up to 70% compared to 3GDH configurations. The IRENA report on Mongolia’s heating sector [44] has modeled renewable energy scenarios projecting up to 93% CO2 reduction through geothermal, solar thermal, and large-scale heat pump integration.
6. Conclusions
This study provides the first comprehensive spatial heat load density analysis for 4th generation district heating (4GDH) potential assessment in Ulaanbaatar, Mongolia—the world’s coldest capital city. The analysis of 13,500 buildings representing 3924 MW of connected thermal capacity provides a robust empirical foundation for evaluating 4GDH transition potential in extreme cold climate conditions. The principal conclusions are as follows:
Spatial conditions for 4GDH development are favorable: The median heat load density of 4.48 MW/km2 at 1 km2 resolution exceeds the European reference threshold of 3 MW/km2 by 49%. Over half (52.3%) of all analyzed grid cells meet or exceed this threshold, indicating spatially favorable conditions for 4GDH development across the majority of Ulaanbaatar’s DH service area.
Spatial distribution is highly concentrated: Approximately 20% of the service area exhibits heat load densities exceeding 30 MW/km2, with peak values reaching 85 MW/km2 in central Bayangol and Sukhbaatar districts. This concentration pattern supports a phased implementation strategy beginning with high-density pilot zones.
Significant efficiency improvement potential exists: The current heat loss rate of 18% substantially exceeds the European average of 10%. Detailed network-level thermal modeling is required to quantify the recoverable thermal capacity from loss reduction, which is identified as a priority for future research.
A hybrid temperature strategy is essential: Full 4GDH operation at 55–65 °C supply temperature is feasible for approximately 90% of the heating season (outdoor temperatures above −25 °C). During extreme cold periods (approximately 10% of the season), elevated supply temperatures of 75–90 °C are required to ensure adequate heat delivery with existing radiator infrastructure.
Three pilot zones are recommended for phased implementation: Sukhbaatar Center and Bayangol Center are identified as high-priority zones with heat densities of 55–85 MW/km2, while Chingeltei represents a medium-priority expansion area. Combined, these zones encompass approximately 1110 buildings and 425 MW of heat demand.
The methodology is transferable: The GIS-based spatial analysis framework developed in this study provides a systematic approach applicable to other cold climate cities in Central Asia, Siberia, northern China, and similar regions seeking to evaluate 4GDH feasibility.
6.1. Limitations
Several limitations of this study should be acknowledged. First, the heat load data represent design heating capacities (maximum thermal power under design outdoor conditions of −40 °C) rather than metered energy consumption. As Soviet-era building design standards typically incorporate oversizing factors, the HLD values reported herein likely represent upper-bound estimates of actual spatial heat demand.
Second, no detailed analysis of the physical pipe network infrastructure was performed. Parameters critical to 4GDH transition assessment—including pipe age distribution, diameter profiles, insulation condition, and hydraulic capacity constraints—were beyond the scope of this spatial analysis.
Third, this study does not constitute a comprehensive feasibility assessment. Economic parameters such as capital investment requirements, net present value (NPV), internal rate of return (IRR), and levelized cost of heat (LCOH) were not evaluated. The term “spatially favorable conditions” used throughout this paper refers specifically to heat demand density meeting reference thresholds.
Fourth, the European reference threshold of 3 MW/km2 was developed under different climatic (HDD ≈ 2500–3500), building efficiency, and energy pricing conditions than those prevailing in Ulaanbaatar. Development of locally calibrated benchmarks incorporating Mongolian cost structures and climate parameters remains a priority for future research.
6.2. Future Research Directions
Building upon the spatial assessment framework established in this study, the following future research directions are identified: (1) Techno-economic feasibility analysis incorporating capital and operational cost modeling; (2) Building stock characterization and retrofit assessment for radiator oversizing and thermal envelope performance; (3) Dynamic thermal network simulation using TRNSYS or Modelica; (4) Renewable energy integration assessment including solar thermal, heat pump, and waste heat potential; (5) Life cycle environmental assessment comparing coal-based 3GDH versus renewable-integrated 4GDH, building upon the technology options identified by IRENA [44] and NewClimate Institute [45]; (6) Social and institutional analysis for 4GDH transition in the Mongolian context.
This research suggests that despite Ulaanbaatar’s extreme climate conditions, the spatial heat demand conditions for 4GDH development appear favorable. However, a comprehensive feasibility determination would require additional techno-economic evaluation, building-level retrofit assessment, and detailed hydraulic network analysis beyond the scope of this spatial assessment.
Author Contributions
Conceptualization, T.Kh. and B.S.; methodology, T.Kh.; software, T.Kh.; validation, T.Kh. and B.S.; formal analysis, T.Kh.; investigation, T.Kh.; resources, B.S.; data curation, T.Kh.; writing—original draft preparation, T.Kh.; writing—review and editing, B.S. and B.L.; visualization, T.Kh.; supervision, B.S.; project administration, B.S.; funding acquisition, T.Kh. and B.S. All authors have read and agreed to the published version of the manuscript.
Funding
This research was funded by the Mongolian Foundation for Science and Technology under the PhD Research Support Program.
Data Availability Statement
The building-level operational data used in this study were provided by the Ulaanbaatar District Heating Company (UBDHK) under a data sharing agreement and are not publicly available due to commercial confidentiality restrictions. Aggregated grid-level results and statistical summaries generated during this study are available from the corresponding author upon reasonable request.
Acknowledgments
The authors gratefully acknowledge the Ulaanbaatar District Heating Company (UBDHK) and the Thermal Engineering Division of the Ulaanbaatar City Governor’s Office for providing access to the district heating network data. We also thank the anonymous reviewers for their constructive comments that significantly improved this manuscript. AI-assisted tools were used for language editing and formatting of the manuscript. The authors reviewed and take full responsibility for the content.
Conflicts of Interest
The authors declare no conflict of interest. The funders had no role in the design of the study; in the collection, analyses, or interpretation of data; in the writing of the manuscript; or in the decision to publish the results.
References
- Werner, S. International review of district heating and cooling. Energy 2017, 137, 617–631. [Google Scholar] [CrossRef]
- Connolly, D.; Lund, H.; Mathiesen, B.V.; Werner, S.; Möller, B.; Persson, U.; Boermans, T.; Trier, D.; Østergaard, P.A.; Nielsen, S. Heat Roadmap Europe: Combining district heating with heat savings to decarbonise the EU energy system. Energy Policy 2014, 65, 475–489. [Google Scholar] [CrossRef]
- Lund, H.; Werner, S.; Wiltshire, R.; Svendsen, S.; Thorsen, J.E.; Hvelplund, F.; Mathiesen, B.V., 4th. Generation District Heating (4GDH): Integrating smart thermal grids into future sustainable energy systems. Energy 2014, 68, 1–11. [Google Scholar] [CrossRef]
- Lund, H.; Østergaard, P.A.; Chang, M.; Werner, S.; Svendsen, S.; Sorknæs, P.; Thorsen, J.E.; Hvelplund, F.; Mortensen, B.O.G.; Mathiesen, B.V.; et al. The status of 4th generation district heating: Research and results. Energy 2018, 164, 147–159. [Google Scholar] [CrossRef]
- Frederiksen, S.; Werner, S. District Heating and Cooling; Studentlitteratur: Lund, Sweden, 2013; ISBN 978-91-44-08530-2. [Google Scholar]
- Kristjansson, H.; Bøhm, B. Advanced and Traditional Pipe Systems: Optimum Design of Distribution and Service Pipes. In Proceedings of the 10th International Symposium on District Heating and Cooling, Hanover, Germany, 2006. [Google Scholar]
- Ganbat, G.; Han, J.Y.; Ryu, Y.H.; Baik, J.J. Characteristics of the urban heat island in a high-altitude metropolitan city, Ulaanbaatar, Mongolia. Int. J. Climatol. 2016, 36, 3346–3356. [Google Scholar] [CrossRef]
- UBDHK. Annual Technical Report 2023; (In Mongolian). Ulaanbaatar District Heating Company: Ulaanbaatar, Mongolia, 2024. [Google Scholar]
- National Statistics Office of Mongolia. Population and Housing Census of Mongolia 2020; NSO: Ulaanbaatar, Mongolia, 2021. [Google Scholar]
- Guttikunda, S.K.; Lodoysamba, S.; Bulgansaikhan, B.; Dashdondog, B. Particulate pollution in Ulaanbaatar, Mongolia. Air Qual. Atmos. Health 2013, 6, 589–601. [Google Scholar] [CrossRef]
- Enkhzhargal, Kh.; Batmunkh, S.; Batmend, L. Current Status and Development Trends of Ulaanbaatar District Heating System. Therm. Eng. J. 2022, 216, 17–24. [Google Scholar]
- Persson, U. District Heating in Future Europe: Modelling Expansion Potentials and Mapping Heat Synergy Regions. Ph.D. Thesis, Chalmers University of Technology, Gothenburg, Sweden, 2015. [Google Scholar]
- Möller, B.; Lund, H. Conversion of individual natural gas to district heating: Geographical studies of supply costs and consequences for the Danish energy system. Appl. Energy 2010, 87, 1846–1857. [Google Scholar] [CrossRef]
- Persson, U.; Werner, S. Heat distribution and the future competitiveness of district heating. Appl. Energy 2011, 88, 568–576. [Google Scholar] [CrossRef]
- Nielsen, S.; Möller, B. GIS based analysis of future district heating potential in Denmark. Energy 2013, 57, 458–468. [Google Scholar] [CrossRef]
- Buffa, S.; Cozzini, M.; D’Antoni, M.; Baratieri, M.; Fedrizzi, R. 5th generation district heating and cooling systems: A review of existing cases in Europe. Renew. Sustain. Energy Rev. 2019, 104, 504–522. [Google Scholar] [CrossRef]
- Persson, U.; Werner, S. Effective Width—The Relative Demand for District Heating Pipe Lengths in City Areas. In Proceedings of the 12th International Symposium on District Heating and Cooling, Tallinn, Estonia, 2010; pp. 128–131. [Google Scholar]
- Sibbitt, B.; McClenahan, D.; Djebbar, R.; Thornton, J.; Wong, B.; Carriere, J.; Kokko, J. The performance of a high solar fraction seasonal storage district heating system—Five years of operation. Energy Procedia 2012, 30, 856–865. [Google Scholar] [CrossRef]
- Averfalk, H.; Werner, S. Novel low temperature heat distribution technology. Energy 2020, 188, 116037. [Google Scholar] [CrossRef]
- Nord, N.; Schmidt, D.; Dagmar, A. Challenges and potentials for low-temperature district heating implementation in Norway. Energy 2021, 228, 120610. [Google Scholar] [CrossRef]
- Brand, M.; Svendsen, S. Renewable-based low-temperature district heating for existing buildings in various stages of refurbishment. Energy 2013, 62, 311–319. [Google Scholar] [CrossRef]
- Lauenburg, P. Temperature optimization in district heating systems. In Advanced District Heating and Cooling Systems; Woodhead Publishing, 2016; pp. 223–240. [Google Scholar]
- Dochev, I.; Peters, I.; Seller, H.; Schlosser, G. Analysing district heating potential with linear heat density. Energy 2020, 211, 118603. [Google Scholar]
- Chambers, J.; Narula, K.; Sulzer, M.; Patel, M.K. Mapping district heating potential under evolving thermal demand scenarios. Energy 2023, 268, 126589. [Google Scholar]
- Lund, H.; Østergaard, P.A.; Nielsen, T.B.; Werner, S.; et al. Perspectives on fourth and fifth generation district heating. Energy 2021, 227, 120520. [Google Scholar] [CrossRef]
- National Statistics Office of Mongolia. Mongolian Statistical Yearbook 2024; NSO: Ulaanbaatar, 2024. [Google Scholar]
- Stackhouse, P.W.; et al. NASA POWER: Prediction of Worldwide Energy Resource. Available online: https://power.larc.nasa.gov/ (accessed on 15 January 2025).
- Yao, S.; Wu, J.; Qadrdan, M. A state-of-the-art analysis and perspectives on the 4th/5th generation district heating and cooling systems. Renew. Sustain. Energy Rev. 2024, 202, 114729. [Google Scholar] [CrossRef]
- Dang, L.M.; Nguyen, L.Q.; Nam, J.; Nguyen, T.N.; Lee, S.; Song, H.-K.; Moon, H. Fifth generation district heating and cooling: A comprehensive survey. Energy Rep. 2024, 11, 1723–1741. [Google Scholar] [CrossRef]
- Guo, Y.; Wang, S.; Wang, J.; Zhang, T.; Ma, Z.; Jiang, S. Key district heating technologies for building energy flexibility: A review. Renew. Sustain. Energy Rev. 2024, 189, 114017. [Google Scholar] [CrossRef]
- Liu, S.; Guo, Y.; Wagner, F.; Liu, H.; Cui, R.Y.; Mauzerall, D.L. Diversifying heat sources in China’s urban district heating systems will reduce risk of carbon lock-in. Nat. Energy 2024, 9, 1021–1031. [Google Scholar] [CrossRef]
- Batsumber, Z.; He, J. Measurement of Indoor Thermal Environment and Analysis of Heating Energy Saving in Residential Buildings in Ulaanbaatar, Mongolia. Sustainability 2023, 15, 10598. [Google Scholar] [CrossRef]
- Nergui, O.; Park, S.; Cho, K. Comparative Policy Analysis of Renewable Energy Expansion in Mongolia and Other Relevant Countries. Energies 2024, 17, 5131. [Google Scholar] [CrossRef]
- Sánchez-García, L.; Averfalk, H.; Möllerström, E.; Persson, U. Understanding effective width for district heating. Energy 2023, 277, 127427. [Google Scholar] [CrossRef]
- Bachmann, M.; Kriegel, M. Assessing the heat distribution costs of linear and radial district heating networks: A methodological approach. Energy 2023, 276, 127504. [Google Scholar] [CrossRef]
- Guelpa, E.; Capone, M.; Sciacovelli, A.; Vasset, N.; Baviere, R.; Verda, V. Reduction of supply temperature in existing district heating: A review of strategies and implementations. Energy 2023, 262, 125363. [Google Scholar] [CrossRef]
- Østergaard, D.S.; Smith, K.M.; Tunzi, M.; Svendsen, S. Low-temperature operation of heating systems to enable 4th generation district heating: A review. Energy 2022, 248, 123529. [Google Scholar] [CrossRef]
- Javanshir, N.; Syri, S.; Hiltunen, P. The risks of electrified district heating in Finland’s cold climate. Renew. Sustain. Energy Rev. 2024, 202, 114652. [Google Scholar] [CrossRef]
- Manz, P.; Billerbeck, A.; Kök, A.; Fallahnejad, M.; Fleiter, T.; Kranzl, L.; Braungardt, S.; Eichhammer, W. Spatial analysis of renewable and excess heat potentials for climate-neutral district heating in Europe. Renew. Energy 2024, 224, 120111. [Google Scholar] [CrossRef]
- Spirito, G.; Dénarié, A.; Fattori, F.; Muliere, G.; Motta, M.; Persson, U. Assessing district heating potential at large scale: Presentation and application of a spatially-detailed model to optimally match heat sources and demands. Appl. Energy 2024, 372, 123844. [Google Scholar] [CrossRef]
- Kuntuarova, S.; Licklederer, T.; Huynh, T.; Zinsmeister, D.; Hamacher, T.; Perić, V. Design and simulation of district heating networks: A review of modeling approaches and tools. Energy 2024, 305, 132189. [Google Scholar] [CrossRef]
- Chicherin, S. Conversion to Fourth-Generation District Heating (4GDH): Heat Accumulation Within Building Envelopes. Energies 2025, 18, 2307. [Google Scholar] [CrossRef]
- Malcher, X.; Tenorio-Rodriguez, F.C.; Finkbeiner, M.; Gonzalez-Salazar, M. Decarbonization of district heating: A systematic review of carbon footprint and key mitigation strategies. Renew. Sustain. Energy Rev. 2025, 215, 115602. [Google Scholar] [CrossRef]
- IRENA. Renewable Energy Solutions for Heating Systems in Mongolia: Developing a Strategic Heating Plan; International Renewable Energy Agency: Abu Dhabi, UAE, 2023. Available online: https://www.irena.org/Publications/2023/Aug/Renewable-Energy-Solutions-for-Heating-Systems-in-Mongolia.
- NewClimate Institute. Transforming the Ulaanbaatar Heating Sector—Technology Options for Decarbonisation; NewClimate Institute: Cologne, Germany, 2024. Available online: https://newclimate.org/resources/publications/transforming-the-ulaanbaatar-heating-sector-technology-options-for.
Figure 1.
Evolution of district heating technologies from 1st to 4th generation (adapted from Lund et al. [3]). Note: The present study focuses exclusively on the transition from 3rd to 4th generation district heating systems, with Ulaanbaatar’s current position (2nd generation, >100 °C supply temperature) and proposed transition target toward 4GDH (55–65 °C supply temperature).
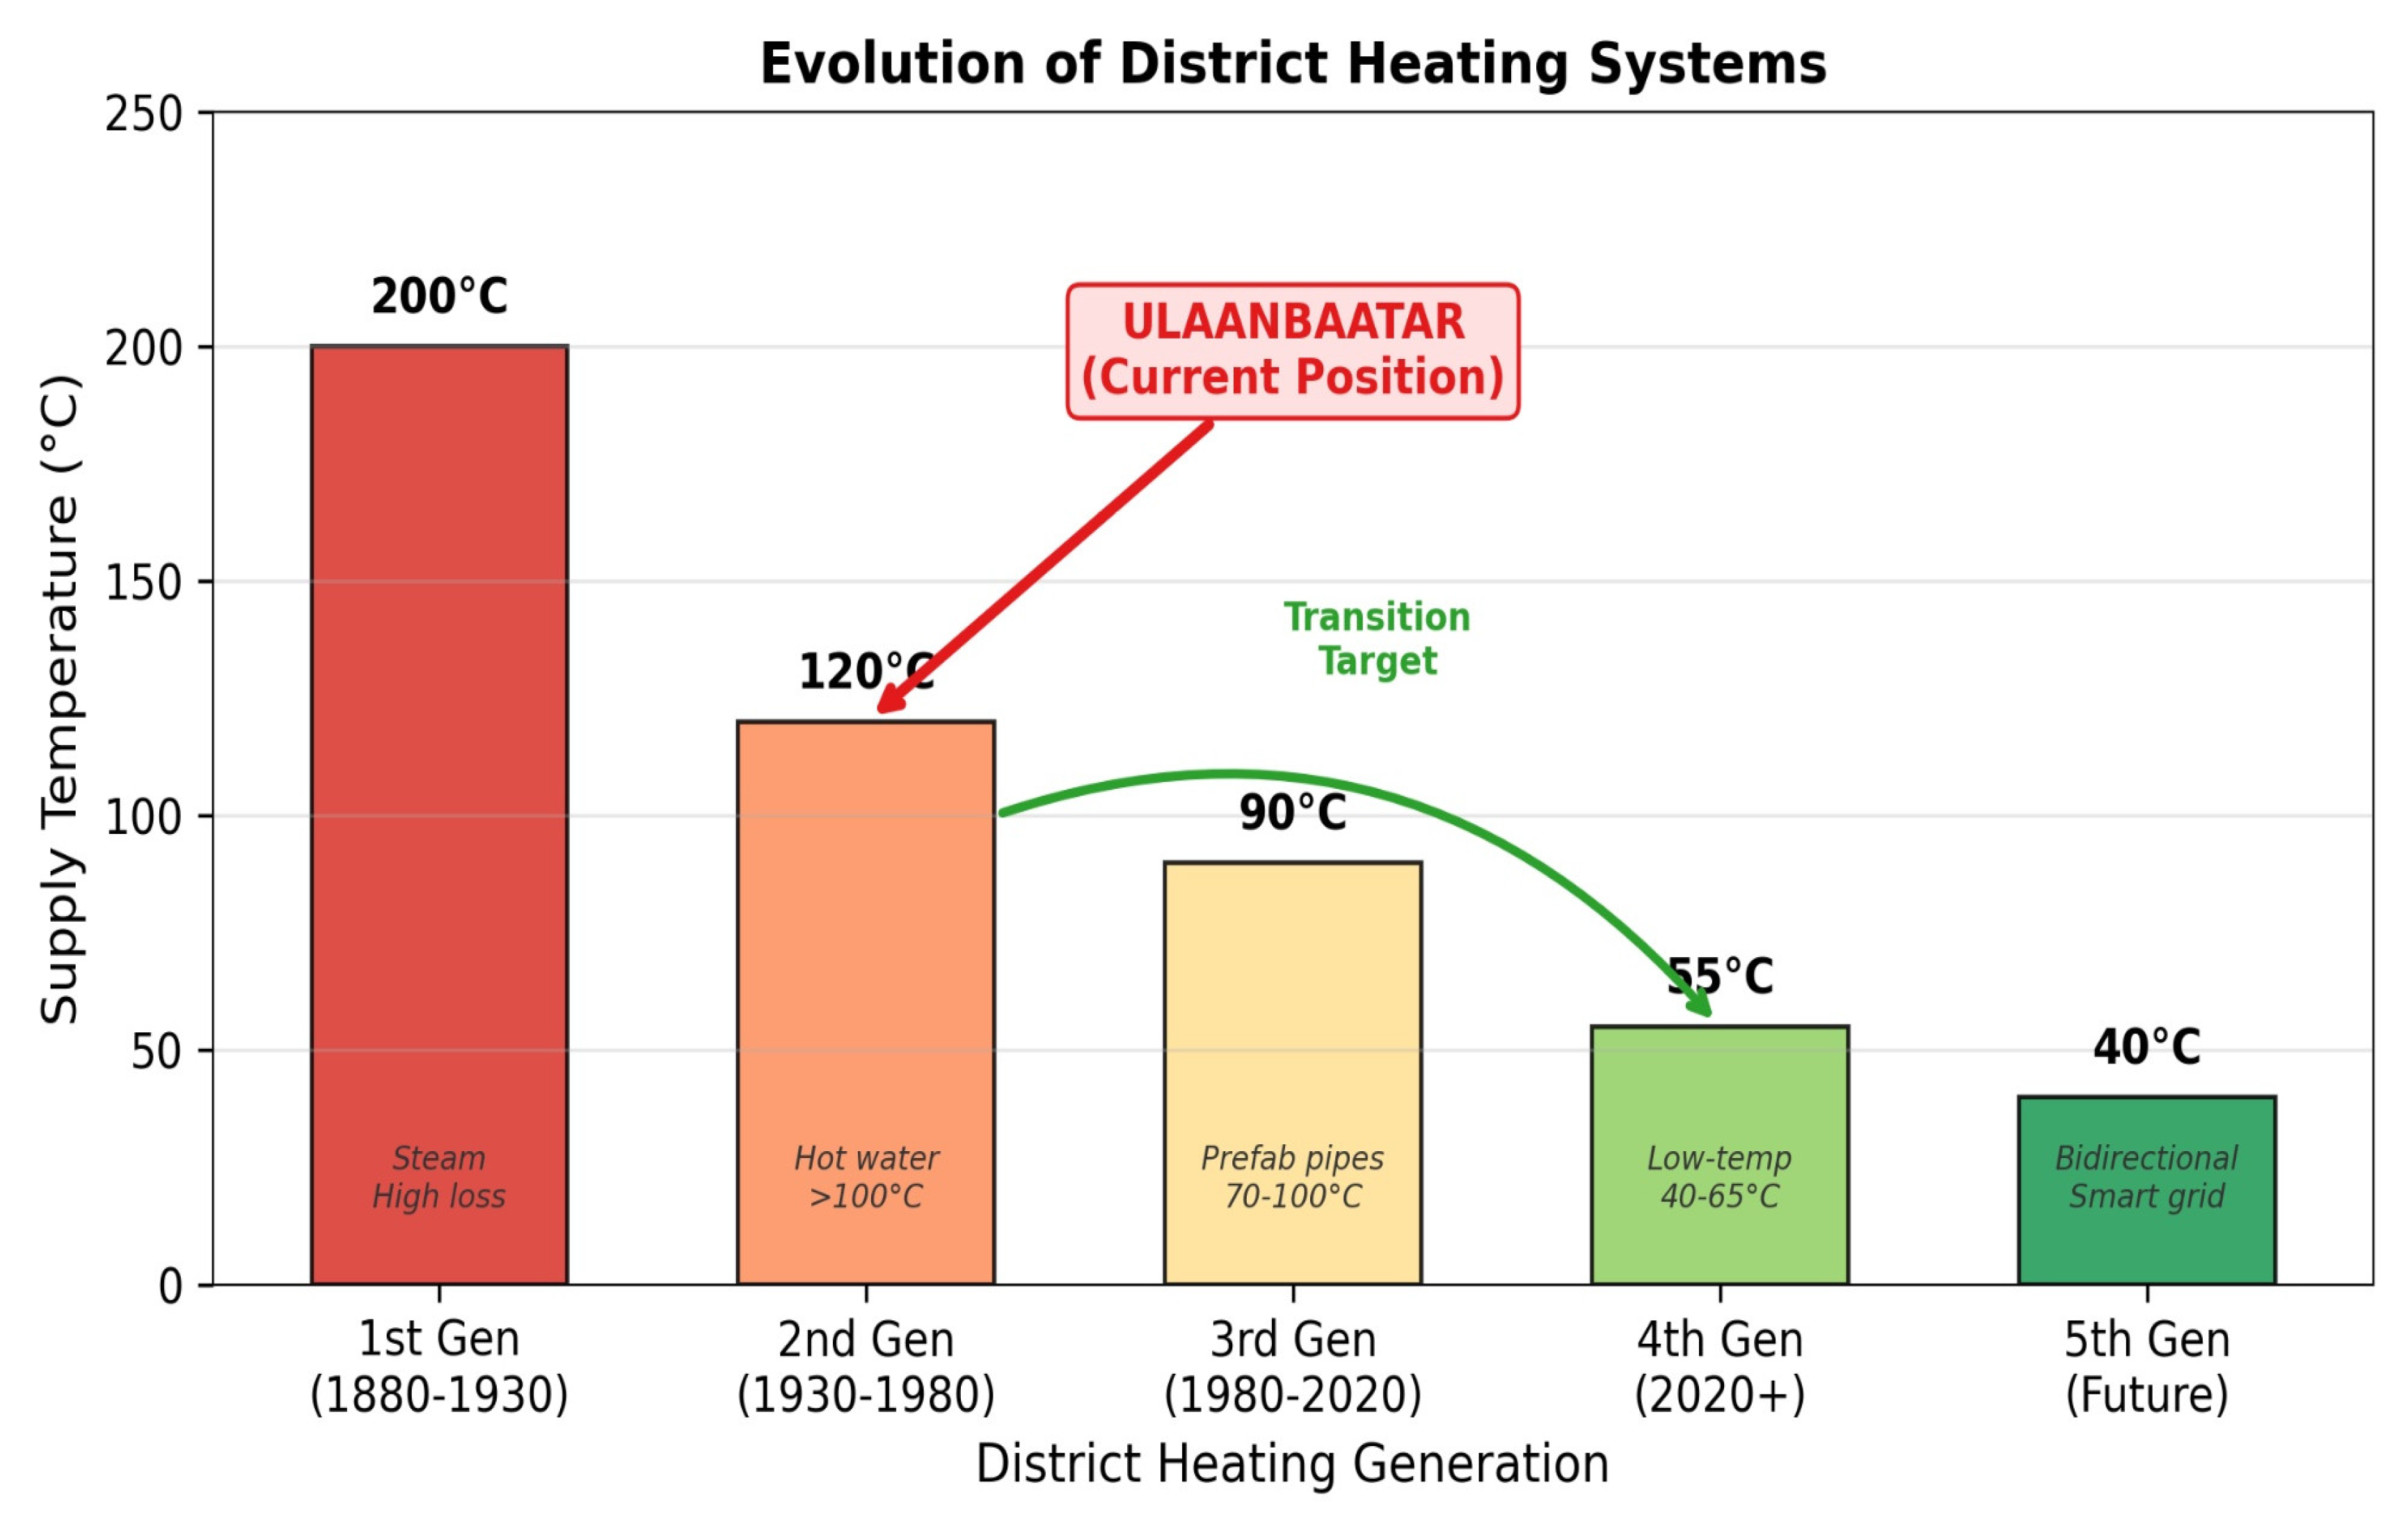
Figure 2.
Ulaanbaatar district heating system heat source configuration: (a) capacity share by source showing CHP-4 dominance (59%); (b) installed heating capacity by plant with total system capacity of 2318 Gcal/h.
Figure 2.
Ulaanbaatar district heating system heat source configuration: (a) capacity share by source showing CHP-4 dominance (59%); (b) installed heating capacity by plant with total system capacity of 2318 Gcal/h.
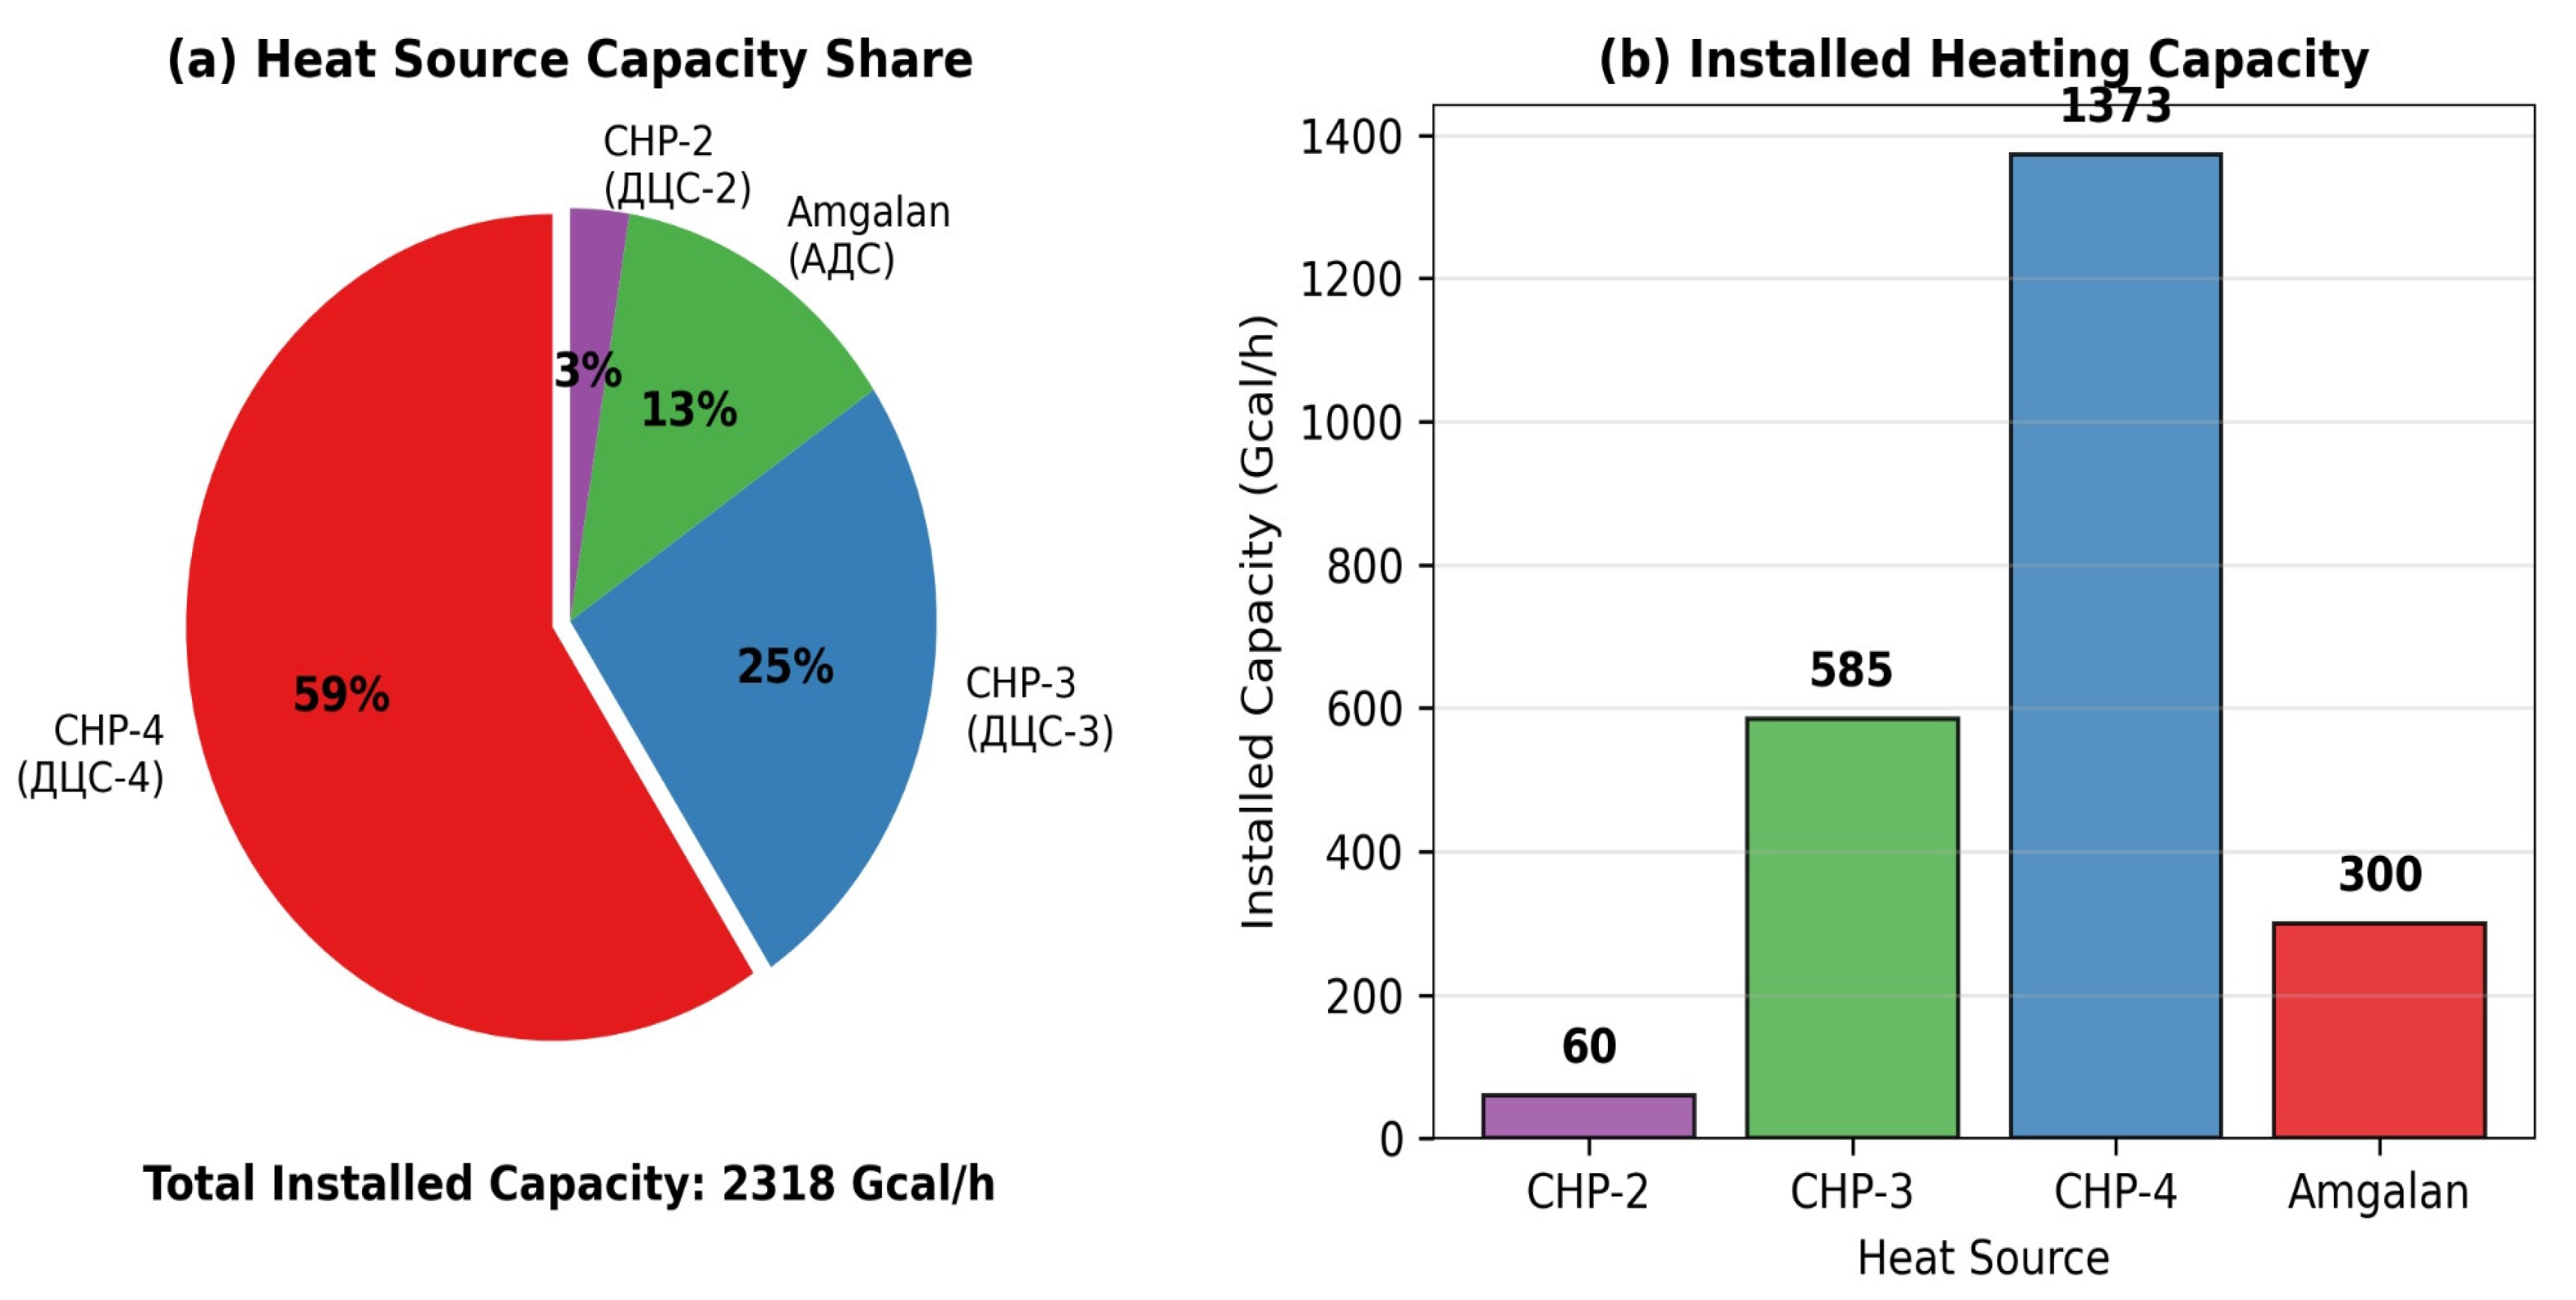
Figure 3.
Ulaanbaatar district heating load projection (2020–2030) showing historical growth (blue bars) and projected demand (orange bars) with linear trend of +195 Gcal/h per year. The current installed capacity (2318 Gcal/h, dotted line) has been insufficient since 2020.
Figure 3.
Ulaanbaatar district heating load projection (2020–2030) showing historical growth (blue bars) and projected demand (orange bars) with linear trend of +195 Gcal/h per year. The current installed capacity (2318 Gcal/h, dotted line) has been insufficient since 2020.
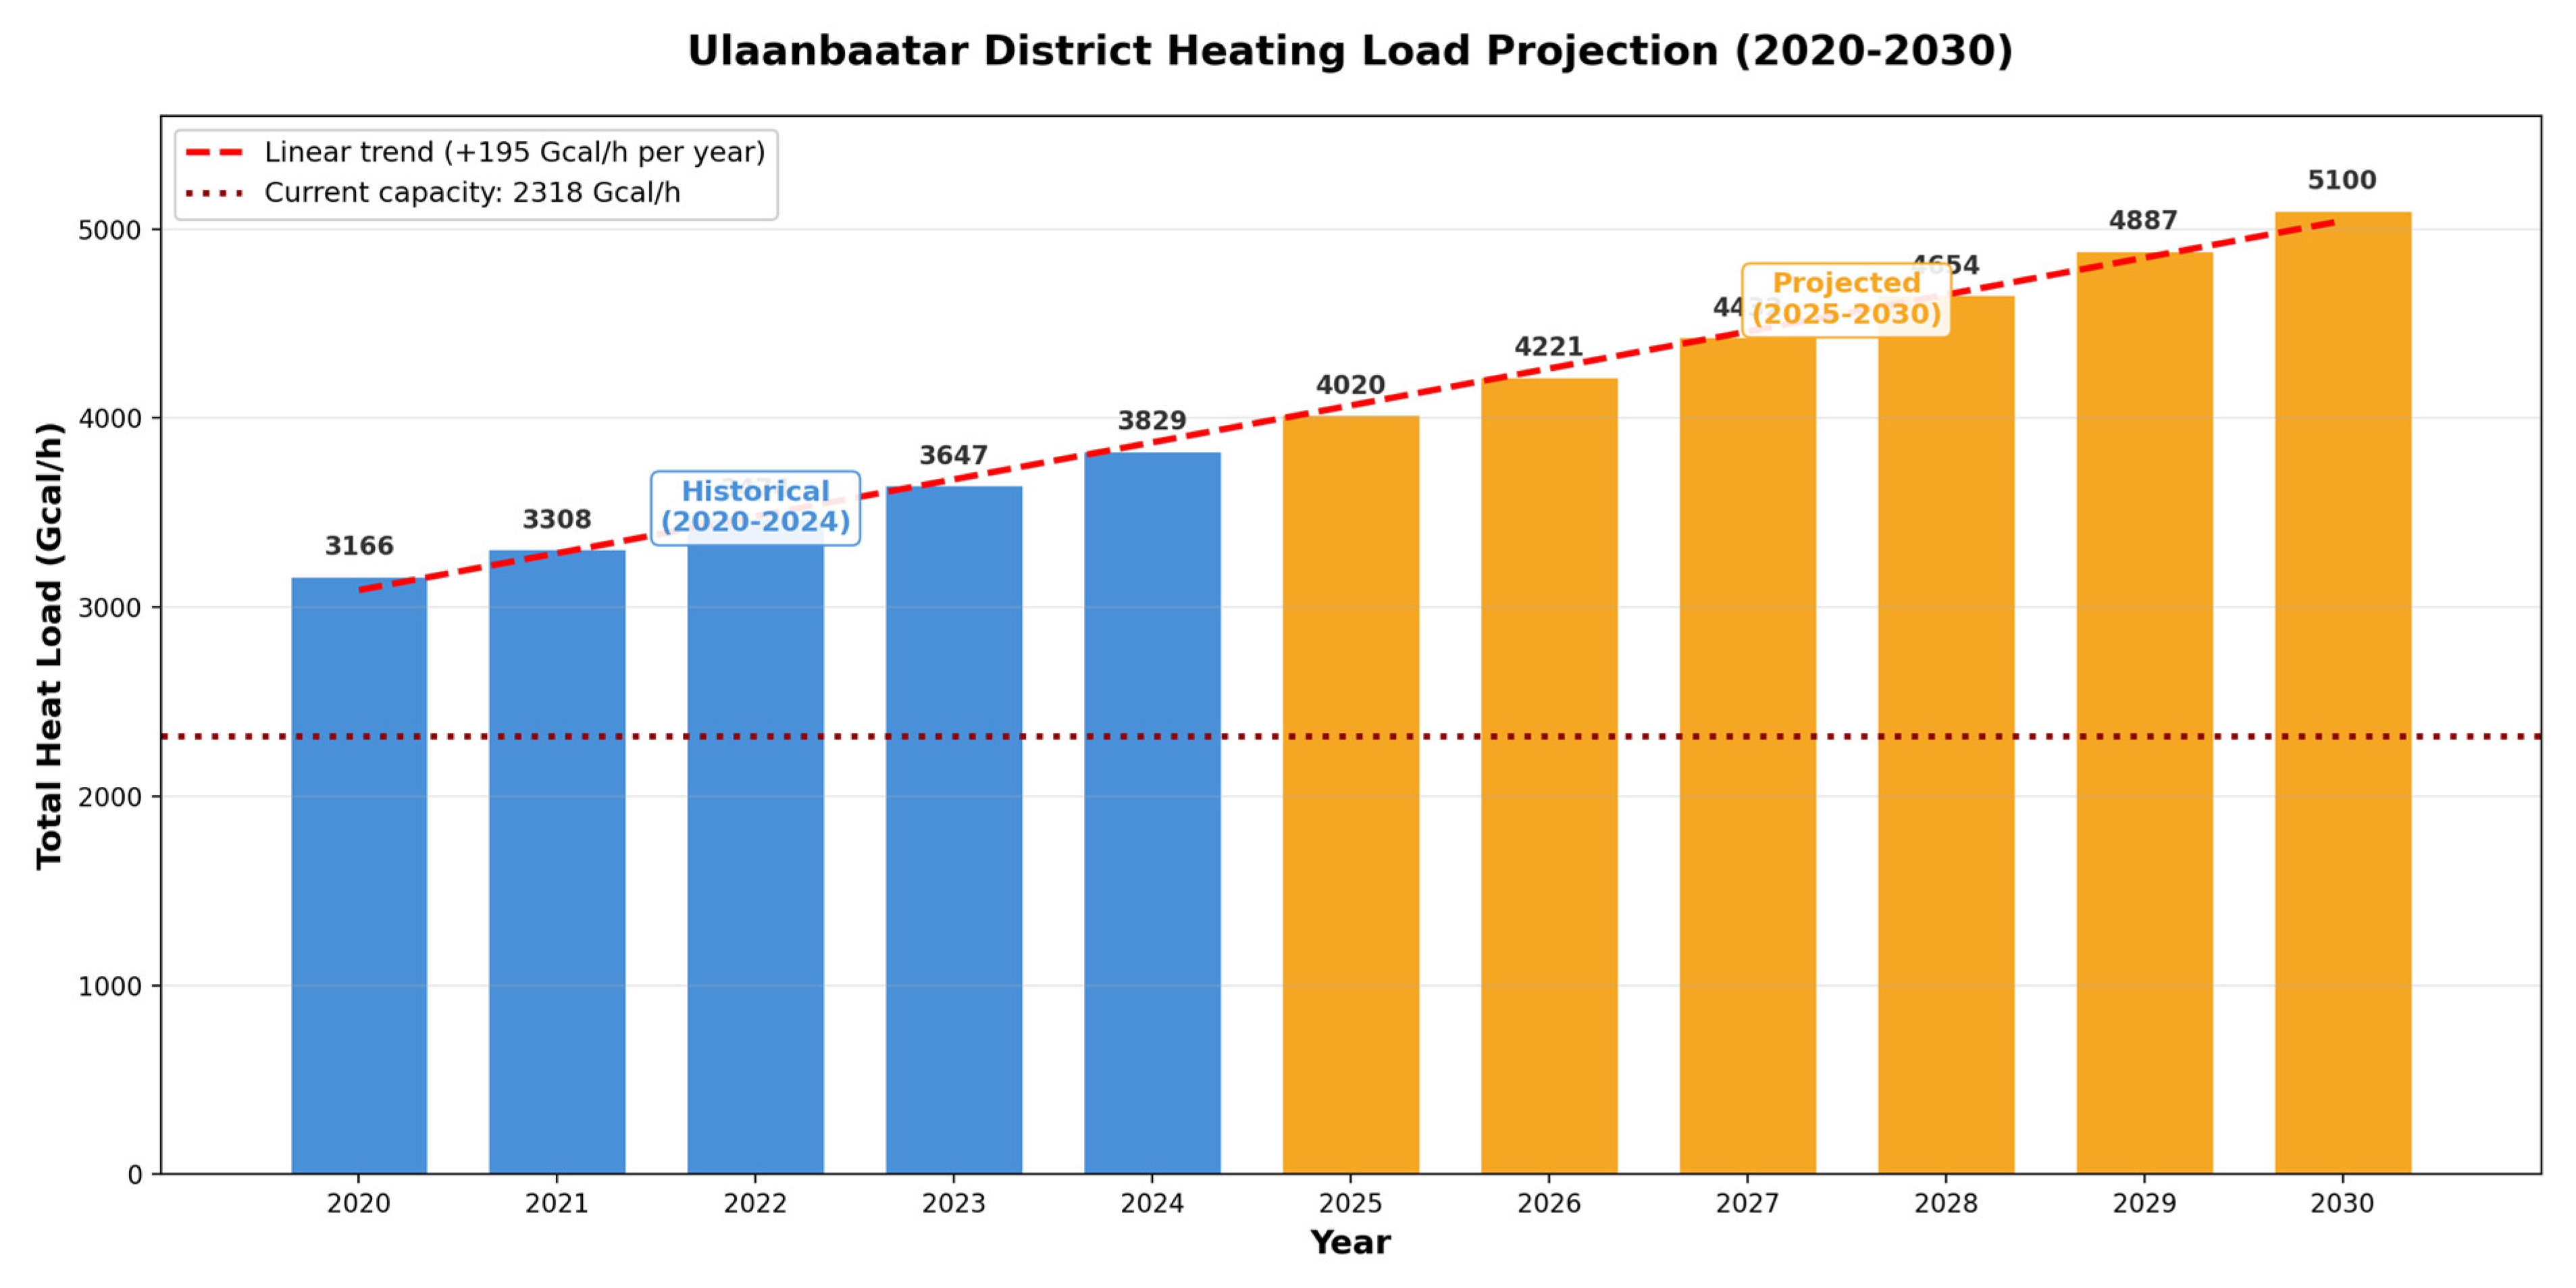
Figure 4.
Spatial distribution of heat load density at 1 km2 grid resolution across Ulaanbaatar’s district heating service area. High-density cores (>50 MW/km2) are concentrated in central Sukhbaatar, Bayangol, and parts of Chingeltei districts.
Figure 4.
Spatial distribution of heat load density at 1 km2 grid resolution across Ulaanbaatar’s district heating service area. High-density cores (>50 MW/km2) are concentrated in central Sukhbaatar, Bayangol, and parts of Chingeltei districts.
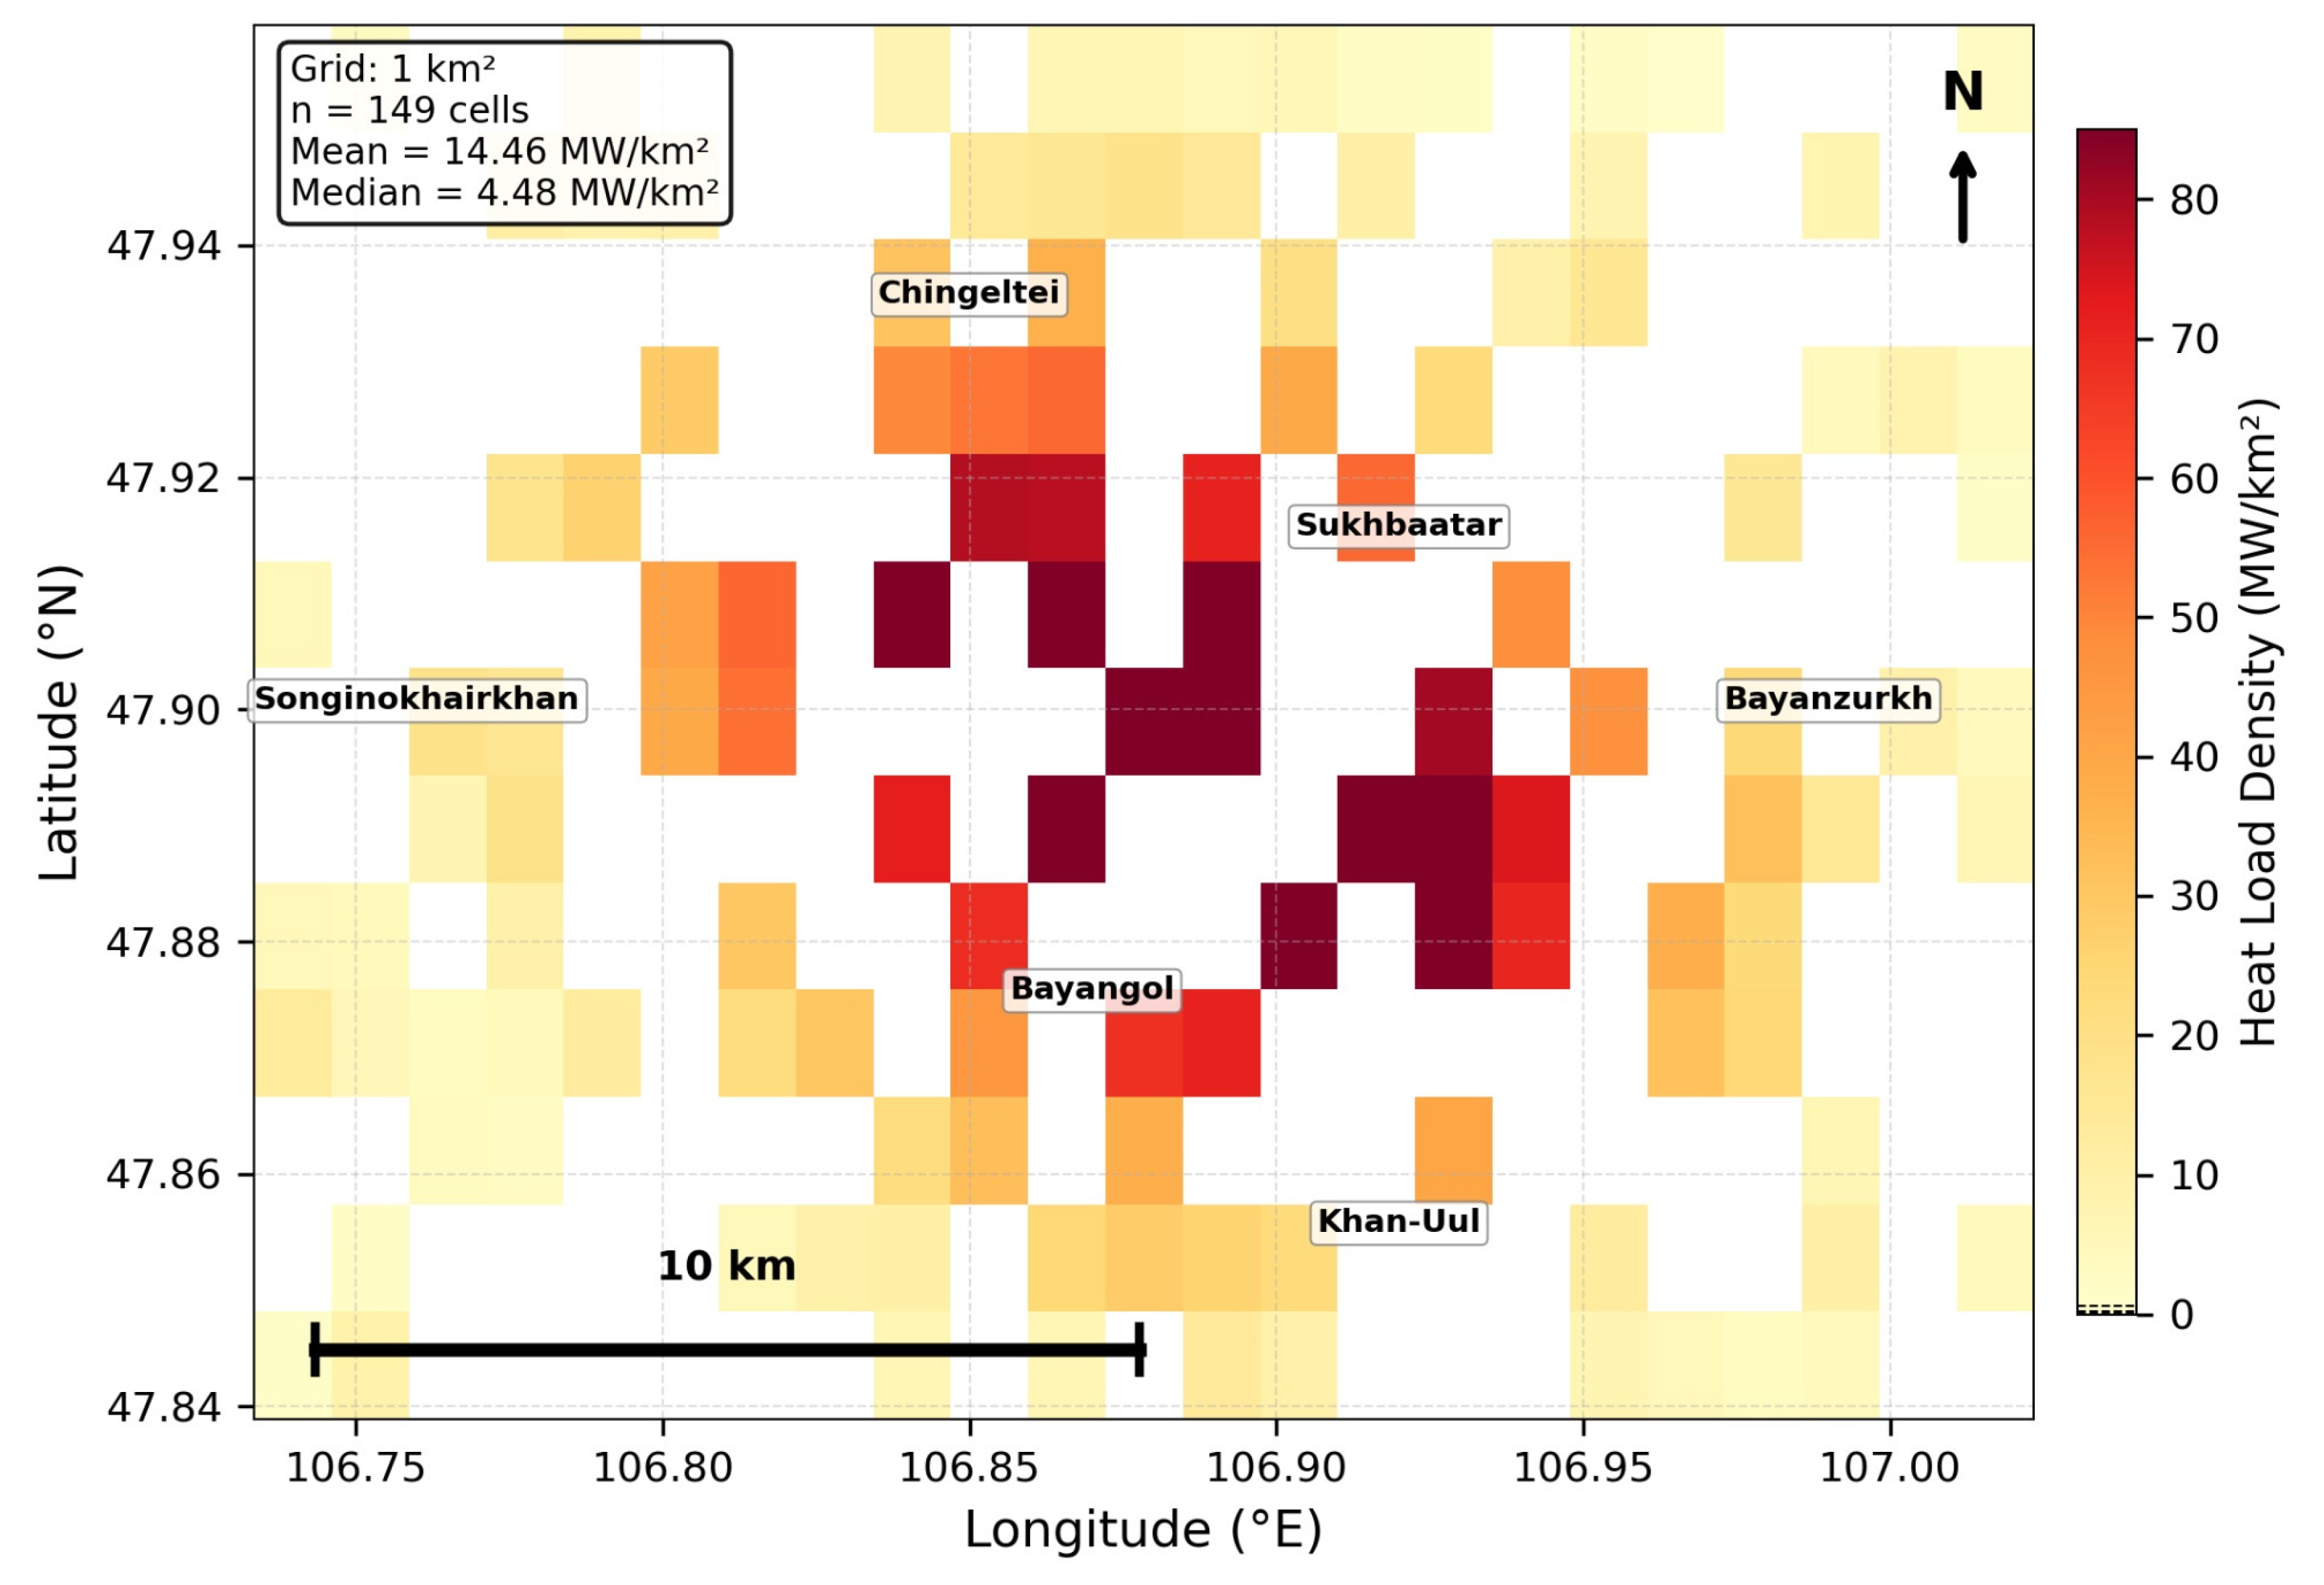
Figure 5.
Spatial distribution of heat load density at 2 km2 grid resolution, showing smoothed patterns that reveal the broader regional structure of heat demand concentration.
Figure 5.
Spatial distribution of heat load density at 2 km2 grid resolution, showing smoothed patterns that reveal the broader regional structure of heat demand concentration.
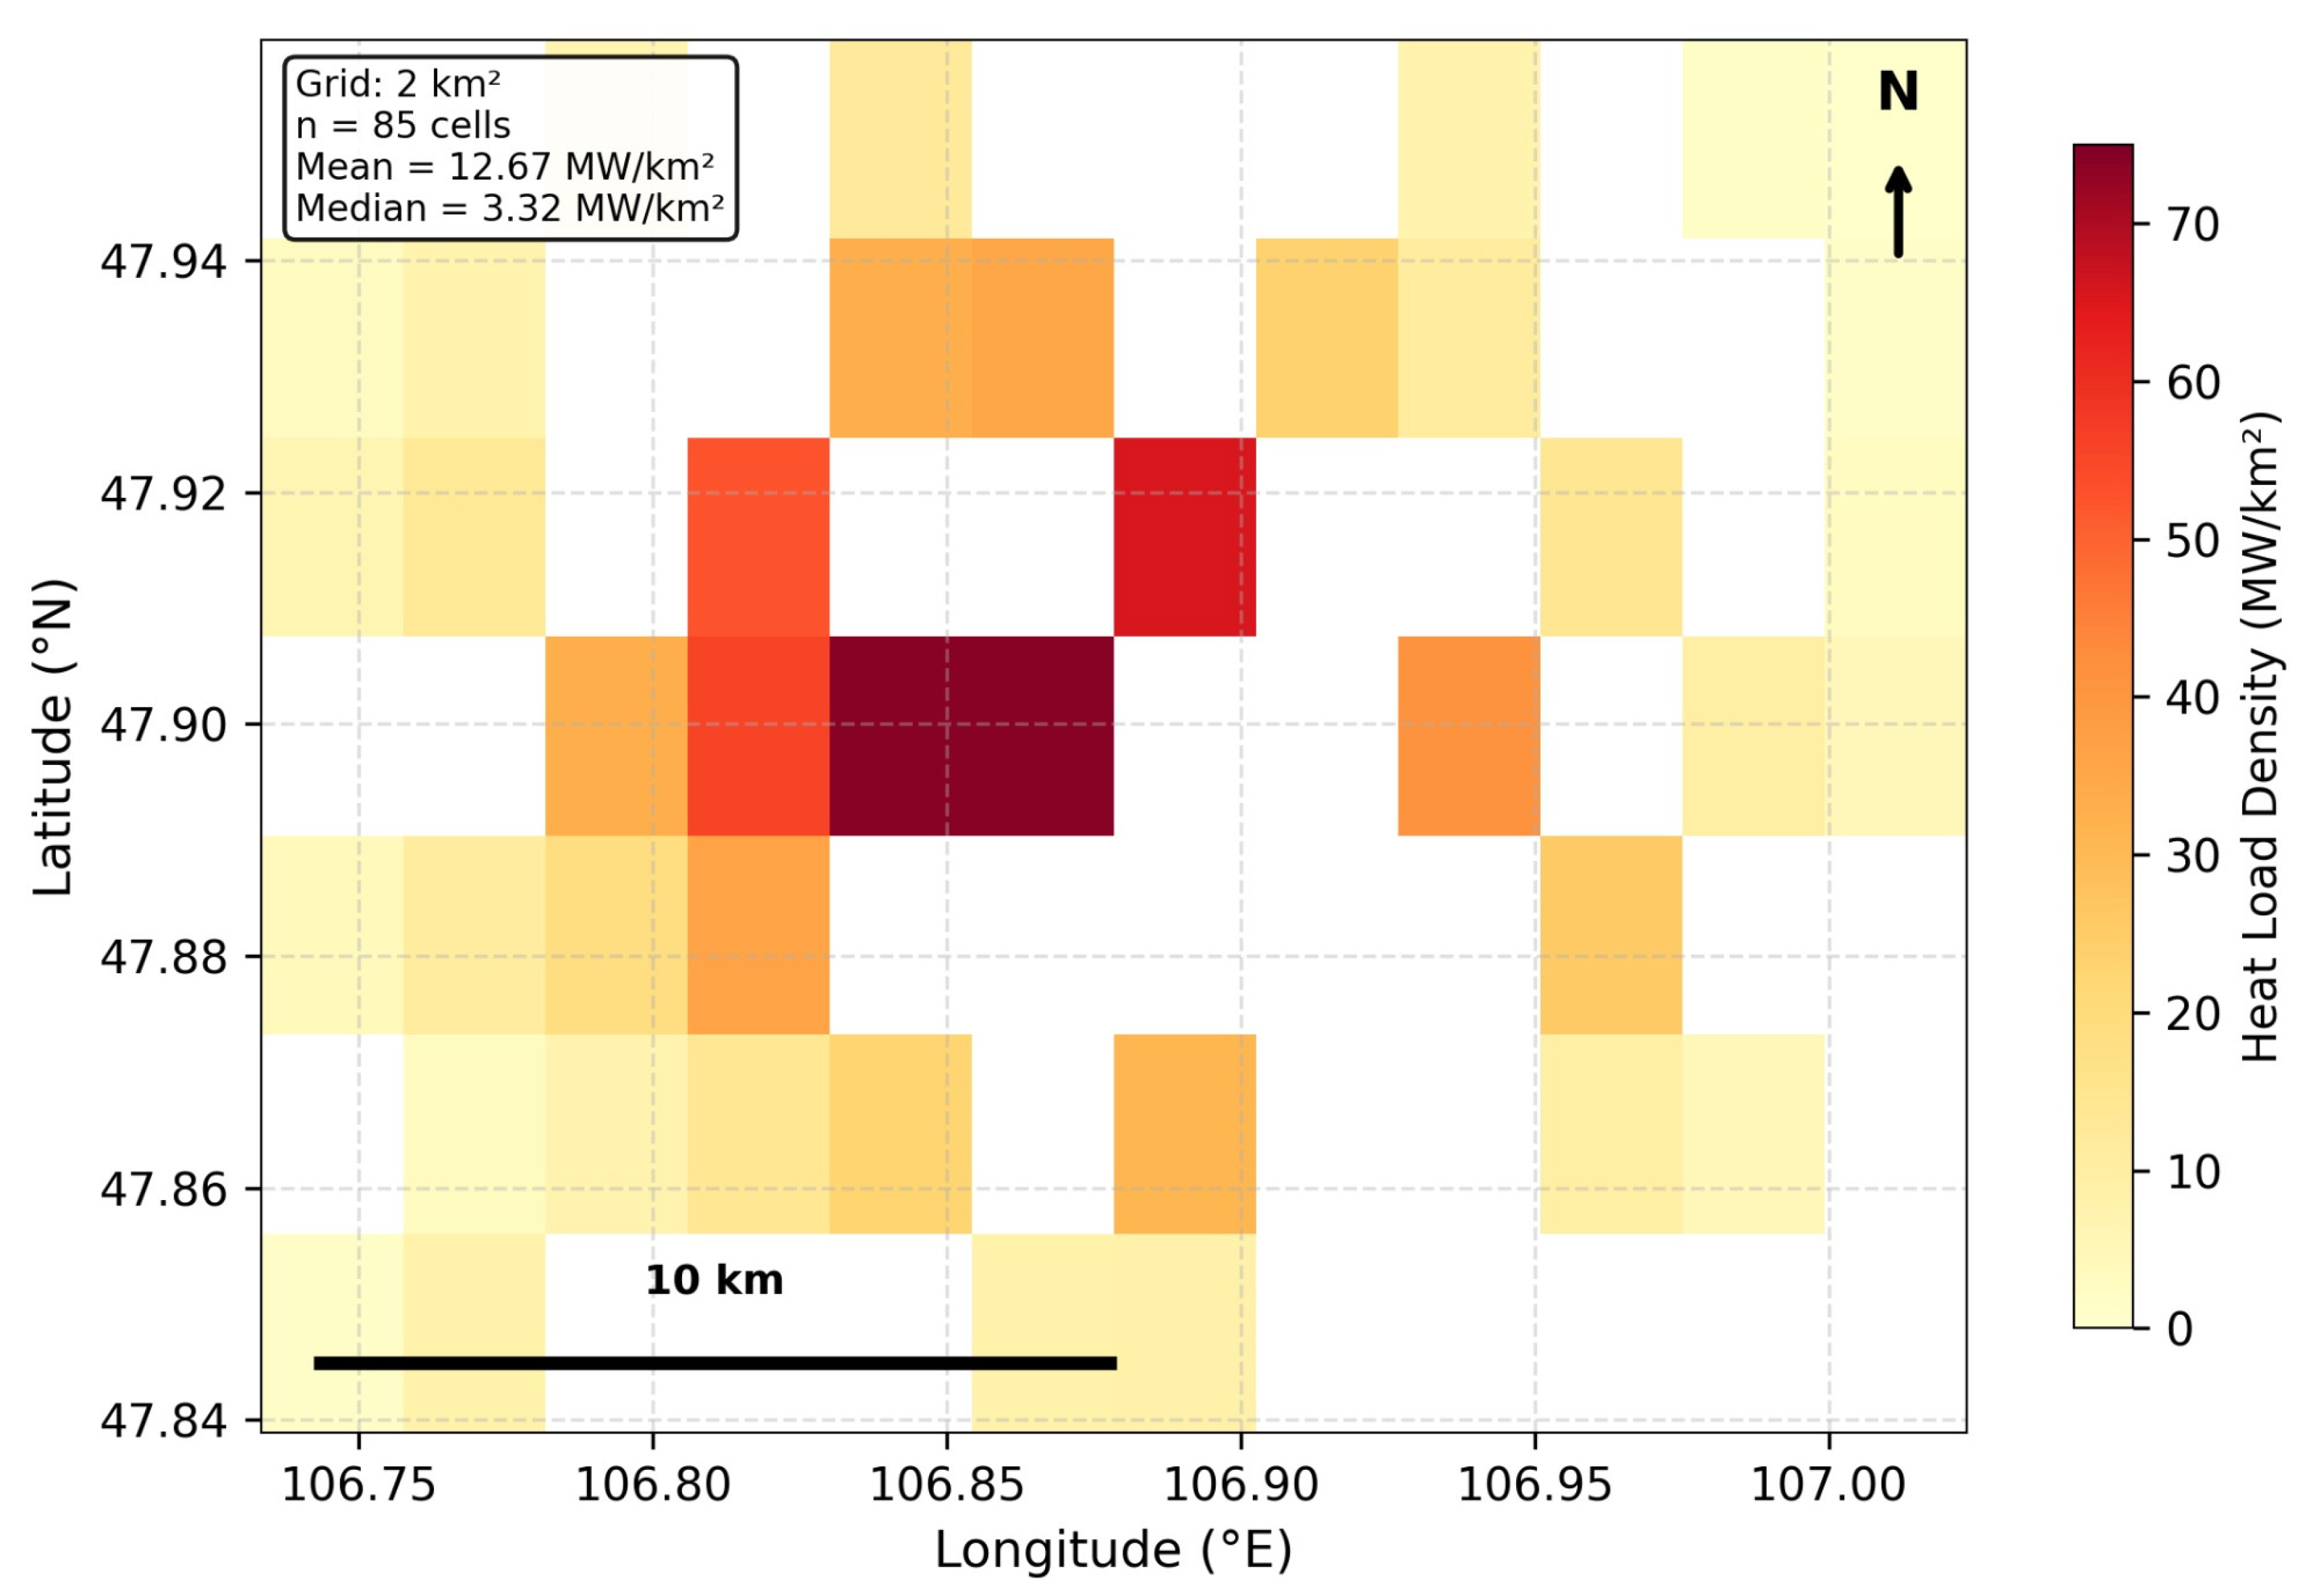
Figure 7.
Comparative analysis of heat load density distribution at 1 km2 and 2 km2 grid resolutions, demonstrating the impact of spatial aggregation on density statistics and pattern identification.
Figure 7.
Comparative analysis of heat load density distribution at 1 km2 and 2 km2 grid resolutions, demonstrating the impact of spatial aggregation on density statistics and pattern identification.
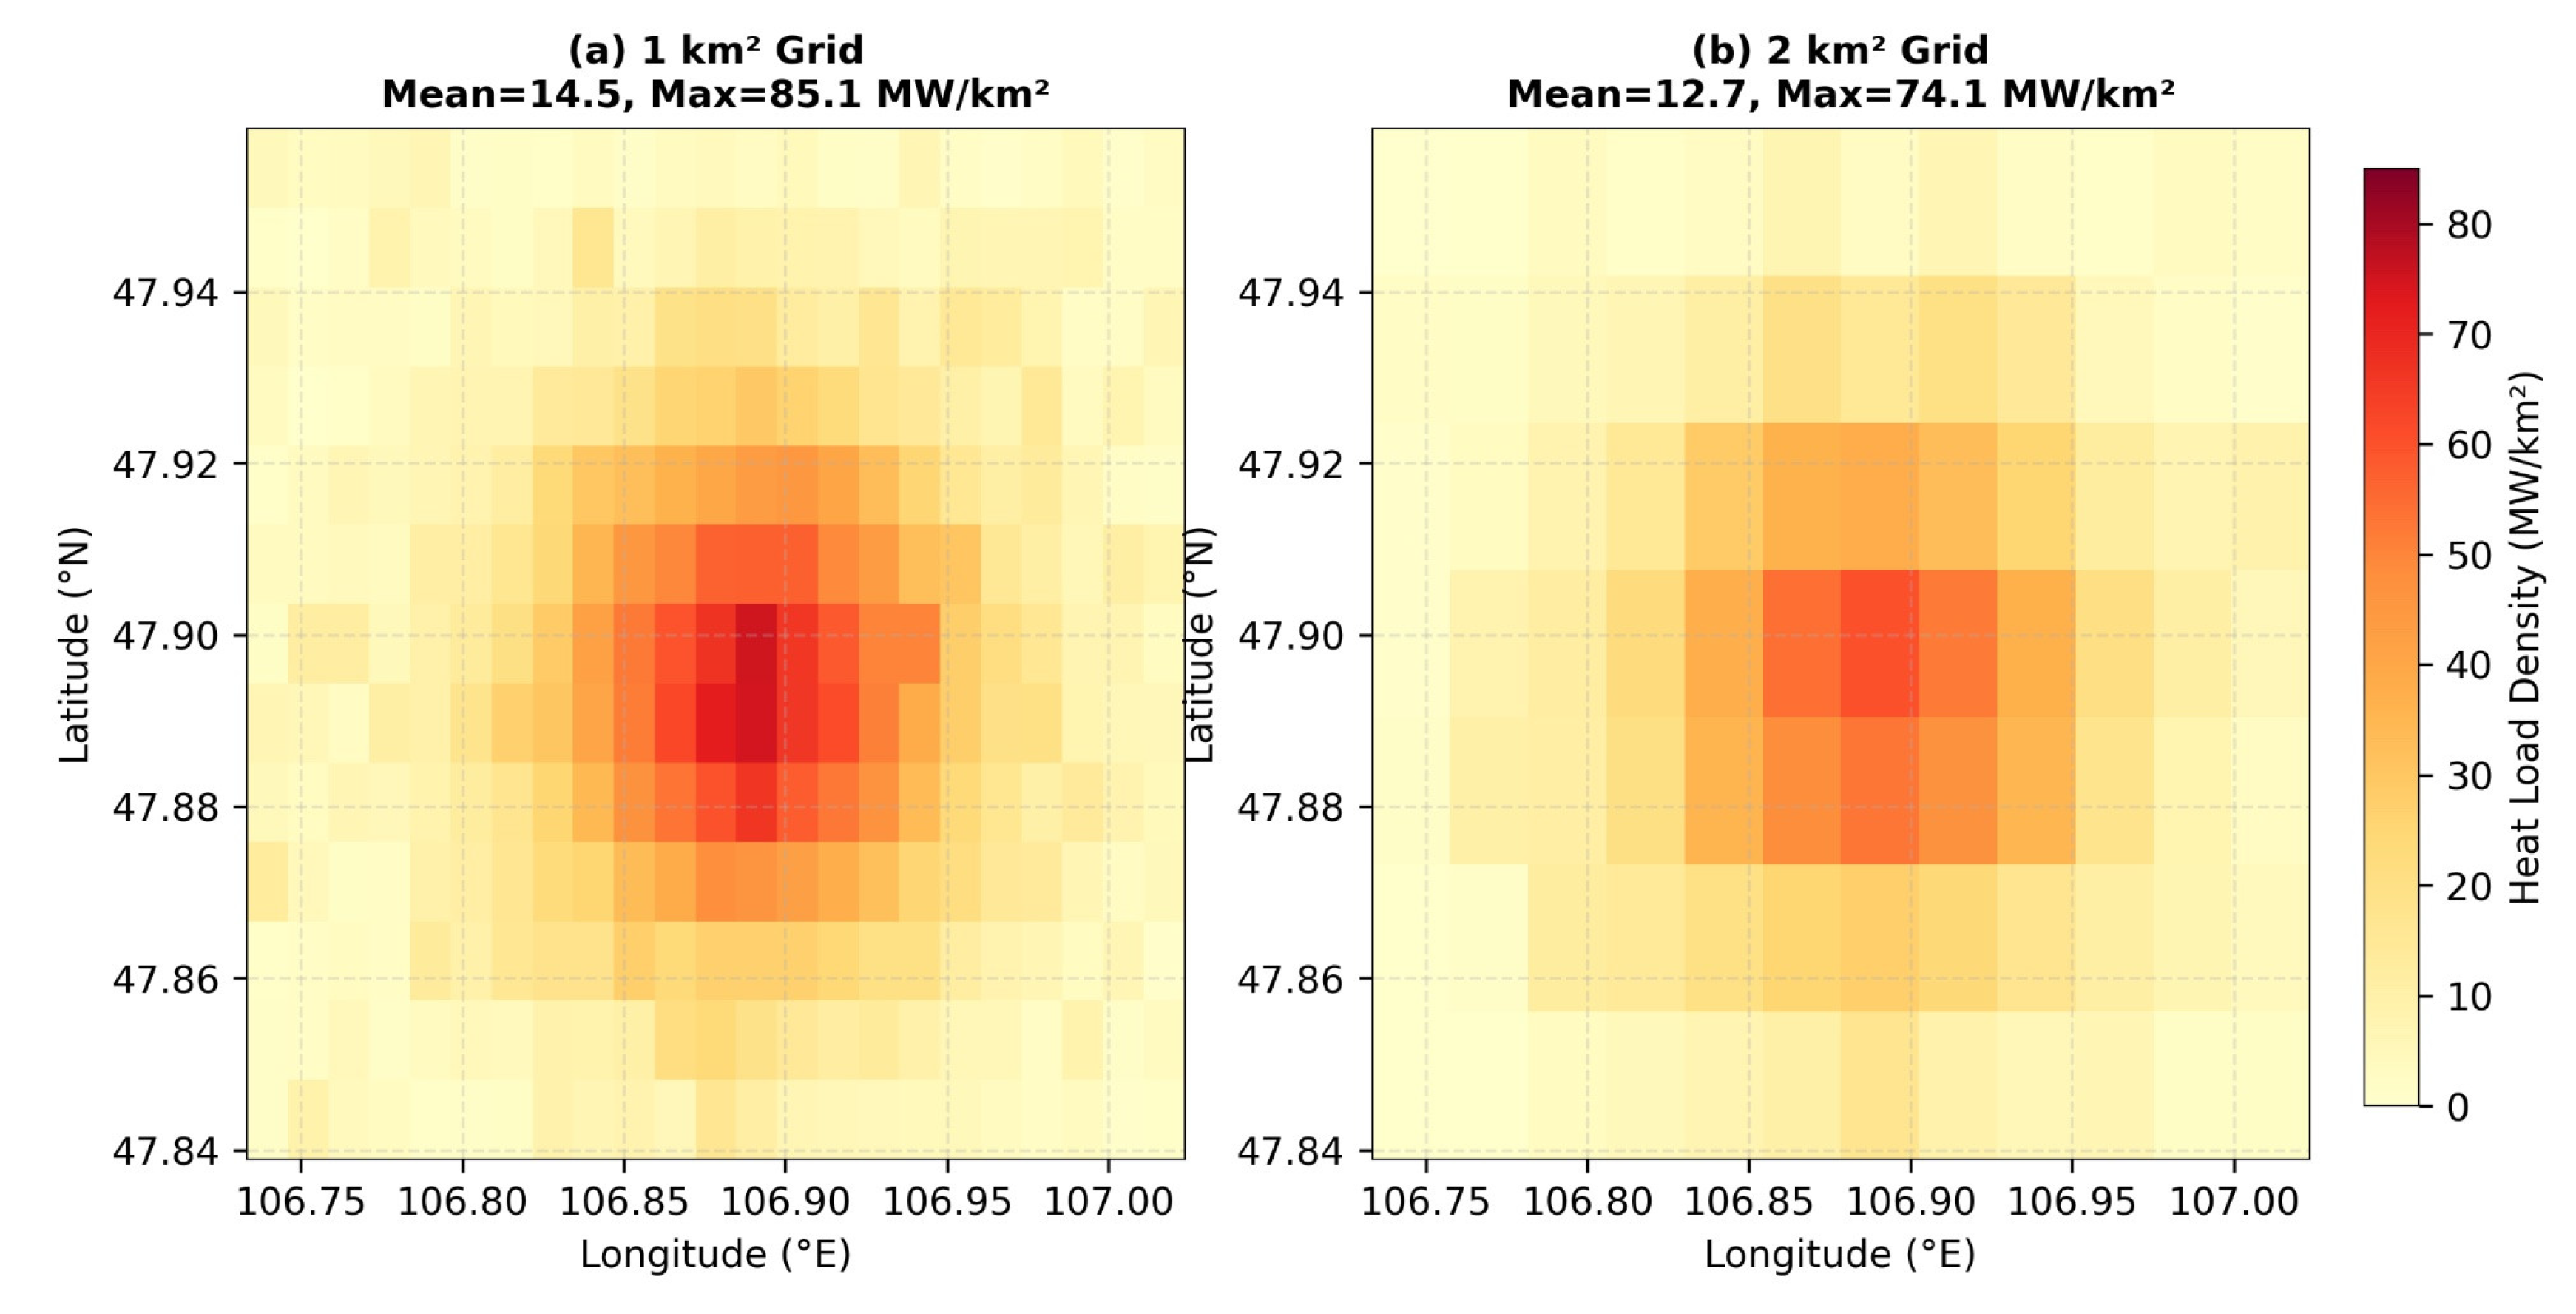
Figure 8.
International comparison of thermal distribution losses across district heating systems. Countries selected based on: (i) cold climate (HDD > 3000); (ii) 3GDH-to-4GDH transition experience; (iii) available loss data. Ulaanbaatar’s 18% loss rate exceeds the European average (~10%) by 8 percentage points, highlighting significant efficiency improvement potential through 4GDH transition.
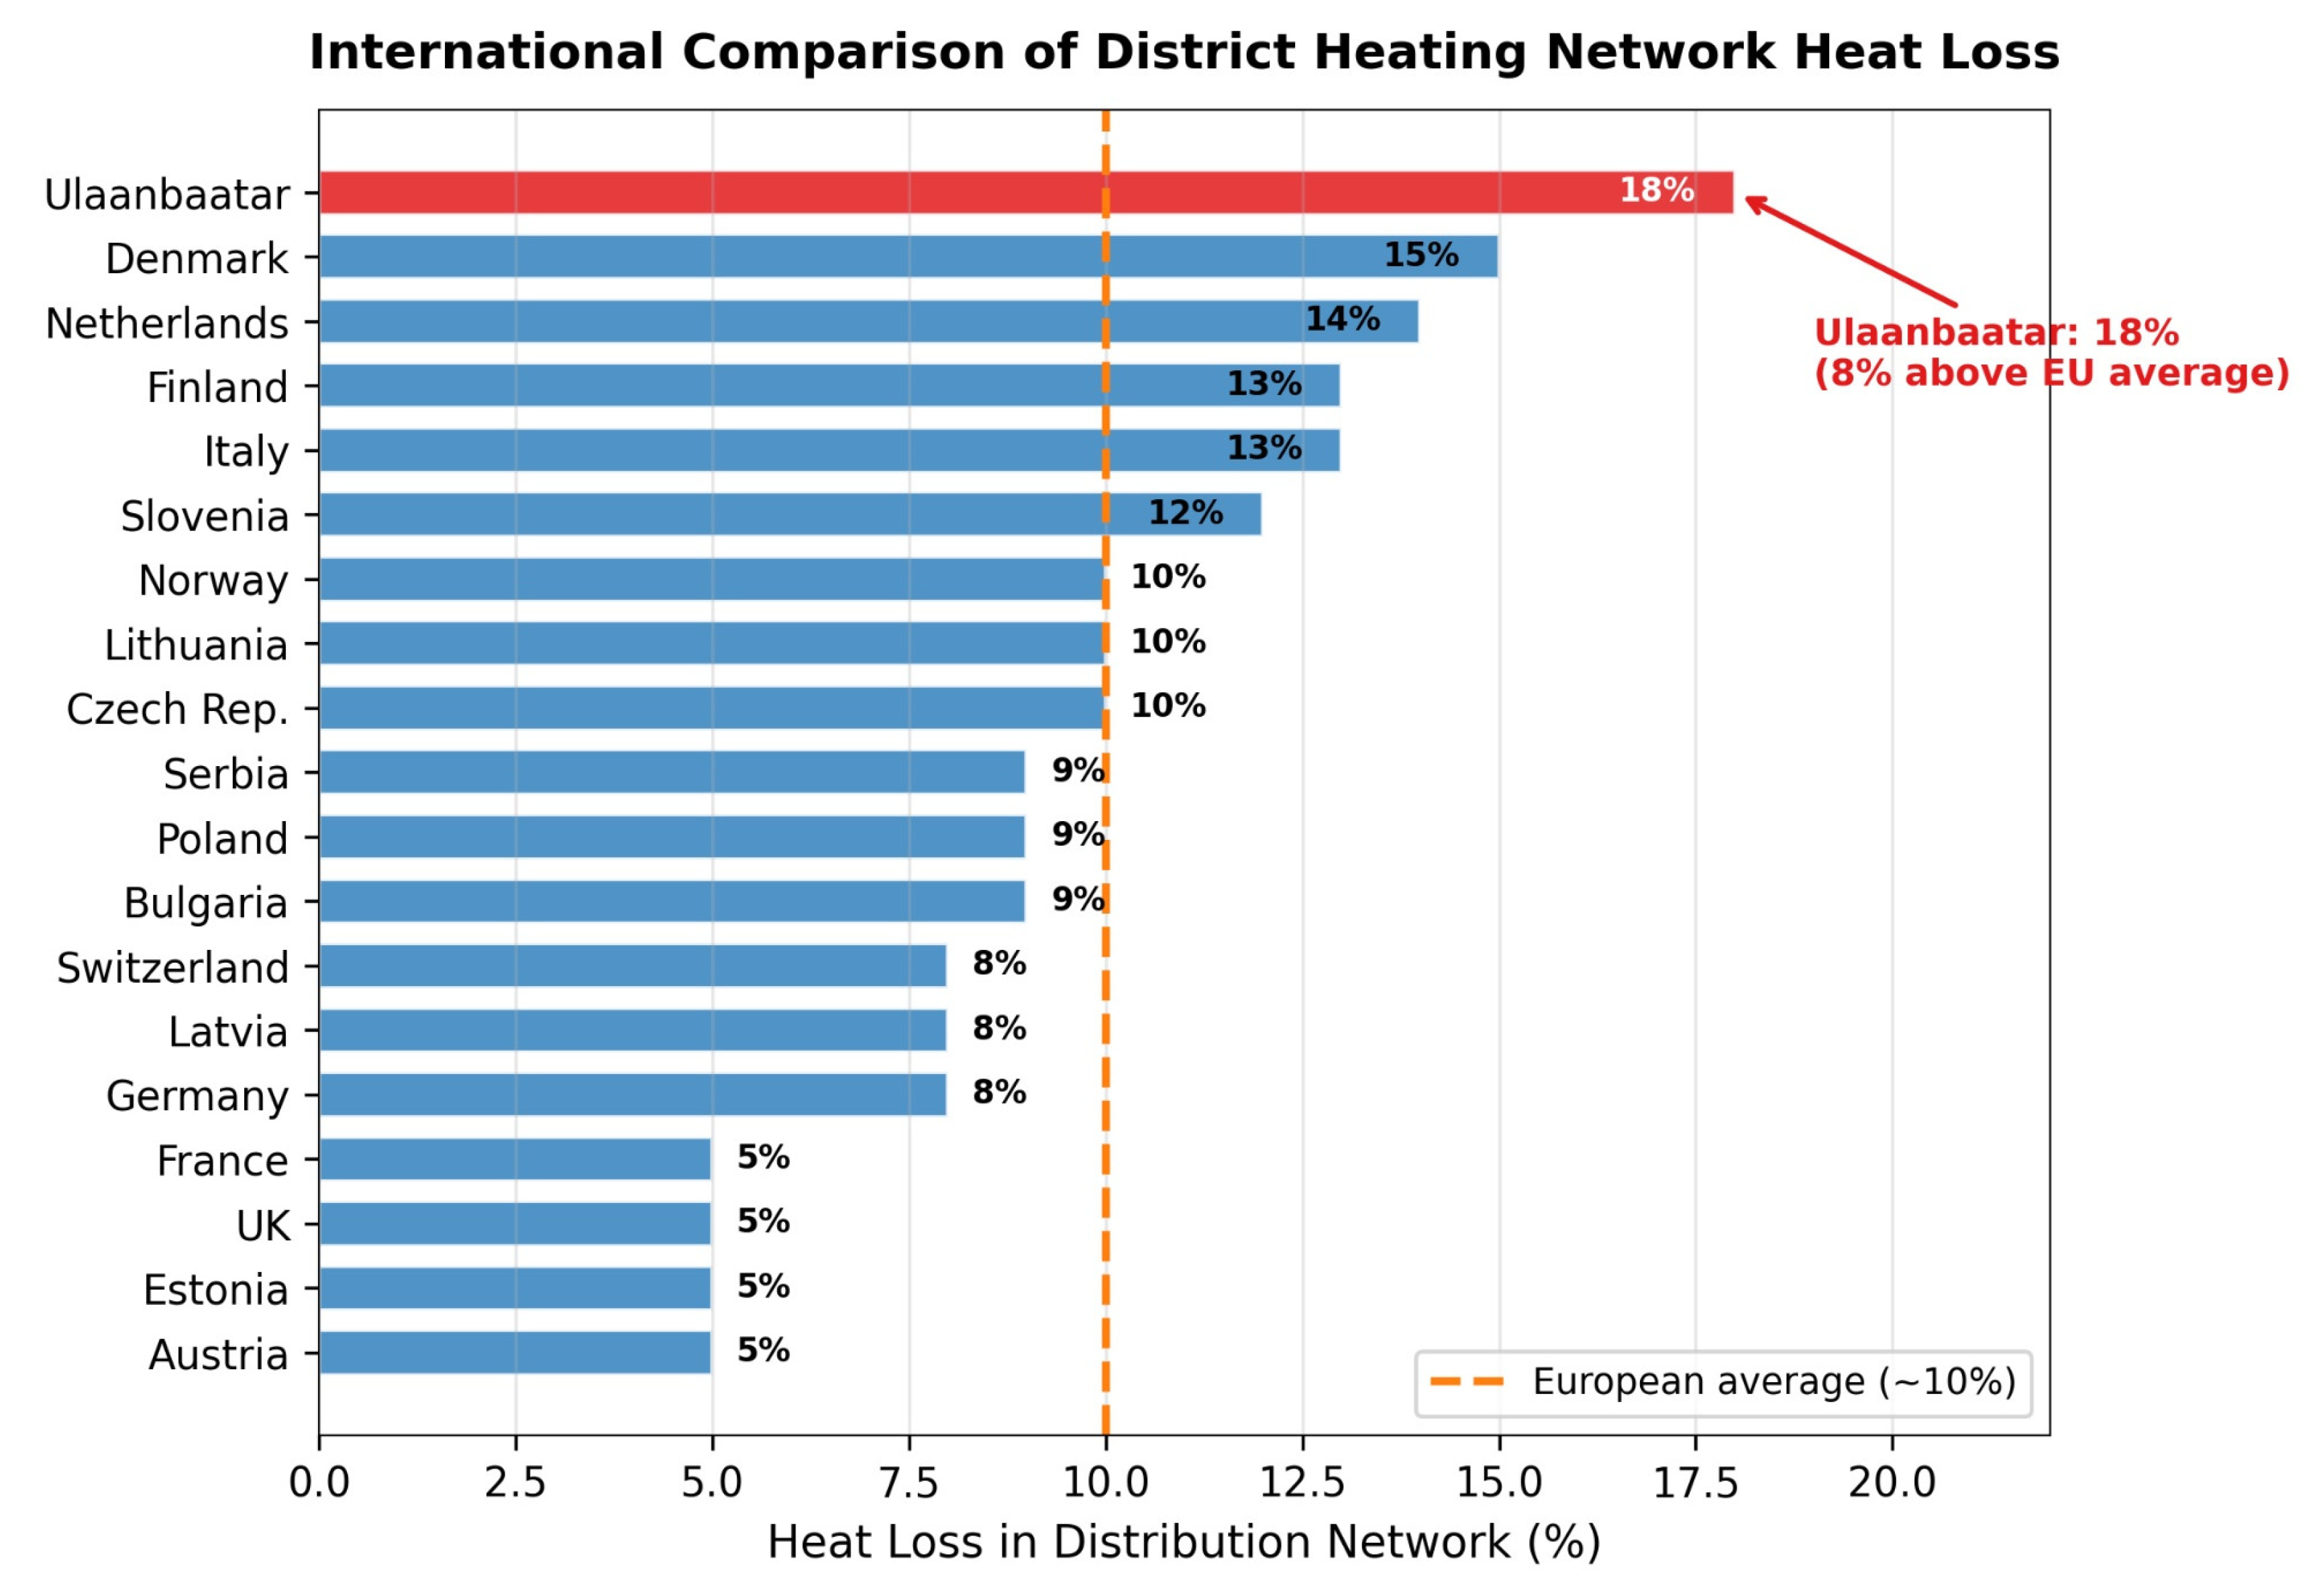
Figure 9.
Recommended pilot zones for phased 4GDH implementation in Ulaanbaatar, identified based on heat load density analysis. High-priority zones (green dashed circles) in Sukhbaatar Center and Bayangol Center exhibit heat densities >30 MW/km2, with medium-priority expansion zone (blue dashed) in Chingeltei.
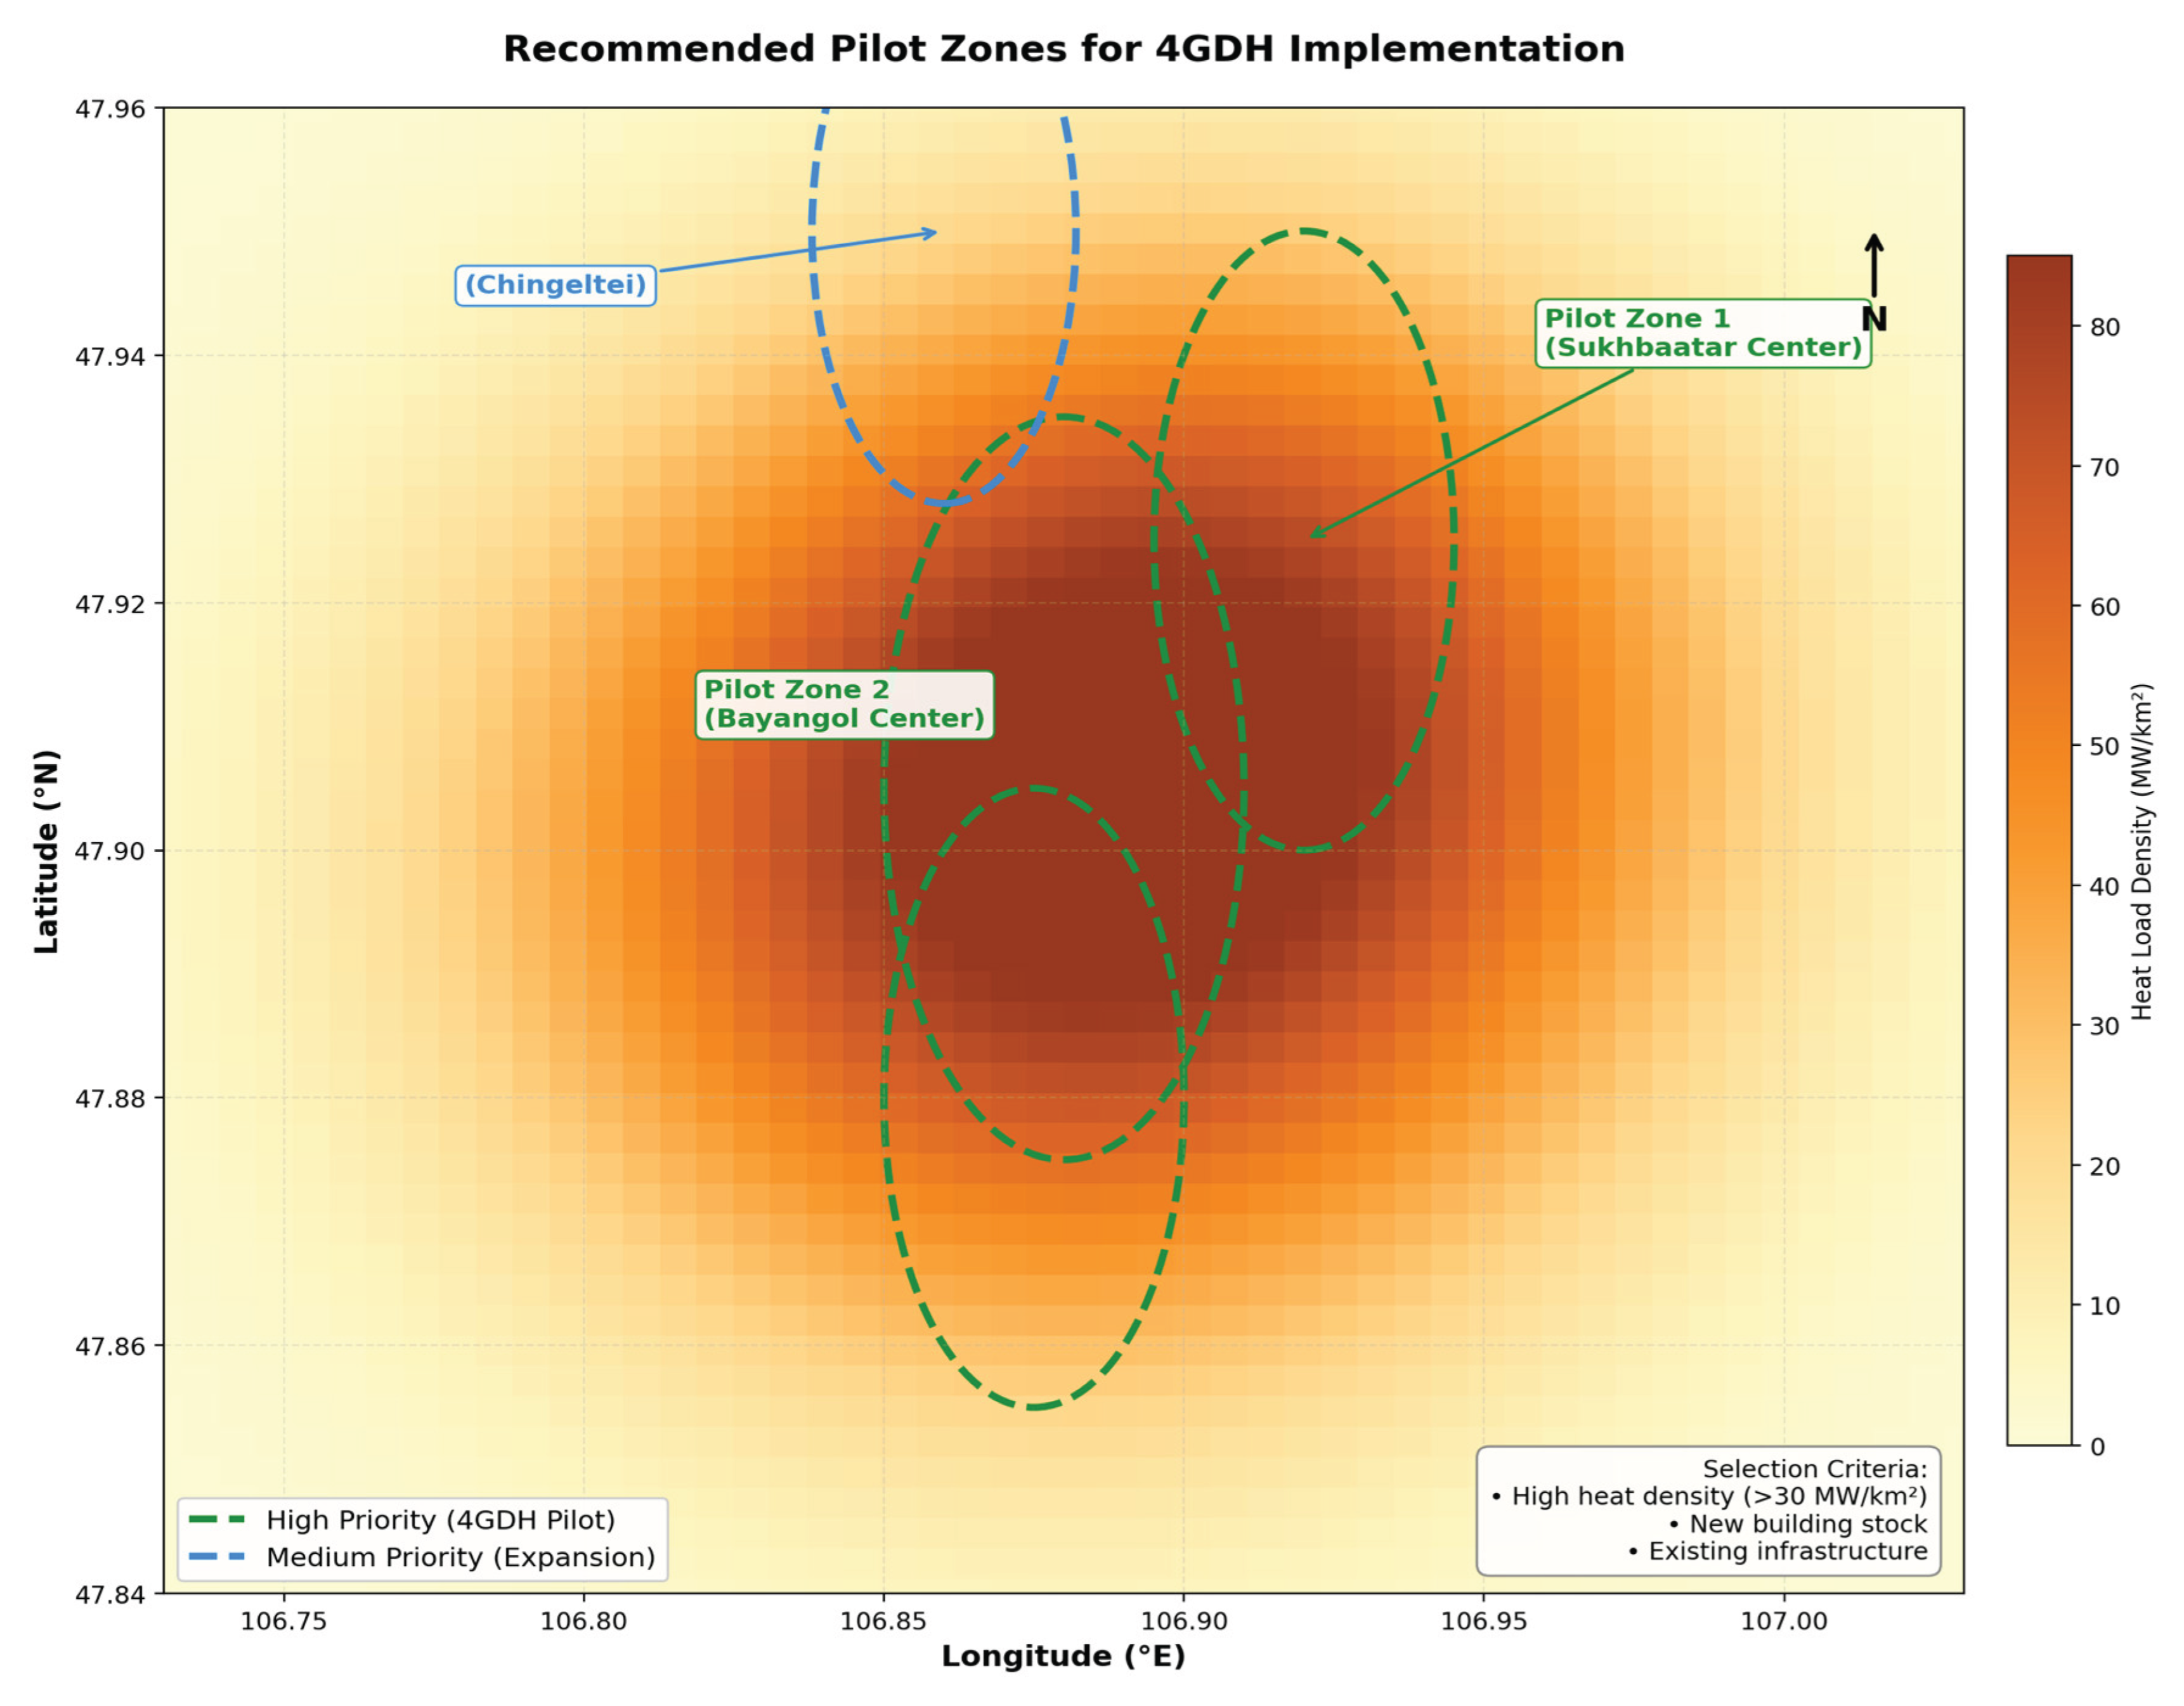
Table 2.
Extended statistical analysis results for heat load density distribution.
| Parameter | 1 km2 Grid | 2 km2 Grid |
|---|---|---|
| Cells with data (n) | 149 | 85 |
| Mean (MW/km2) | 14.46 | 12.67 |
| Median (MW/km2) | 4.48 | 3.32 |
| Maximum (MW/km2) | 85.09 | 74.07 |
| Standard deviation | 19.45 | 18.11 |
| Skewness | 1.87 | 1.92 |
| Kurtosis | 3.42 | 3.68 |
| Coefficient of variation (%) | 134.5 | 142.9 |
| Shapiro-Wilk p-value | <0.001 | <0.001 |
Disclaimer/Publisher’s Note: The statements, opinions and data contained in all publications are solely those of the individual author(s) and contributor(s) and not of MDPI and/or the editor(s). MDPI and/or the editor(s) disclaim responsibility for any injury to people or property resulting from any ideas, methods, instructions or products referred to in the content. |
© 2026 by the authors. Licensee MDPI, Basel, Switzerland. This article is an open access article distributed under the terms and conditions of the Creative Commons Attribution (CC BY) license (http://creativecommons.org/licenses/by/4.0/).
Copyright: This open access article is published under a Creative Commons CC BY 4.0 license, which permit the free download, distribution, and reuse, provided that the author and preprint are cited in any reuse.


