
Submitted:
08 November 2024
Posted:
11 November 2024
You are already at the latest version
Abstract
This paper focuses on the potential for integrating Geographic Information System (GIS) software with 5th Generation District Heating and Cooling (5GDHC) systems to promote efficient and sustainable energy management, particularly in Kazakhstan. By reviewing key literature, we identify three main areas where GIS software enhances the planning of 5GDHC systems: decision-making in the context of energy market regulations, operational data utilization, and modeling/simulations for technical design. The technical design emphasizes the role of heat pumps, Ultra-Low Temperature District Heating (ULTDH) networks, and end-user buildings. Previous research has explored various methodologies for integrating network and demand-side strategies, developing sustainable district heating and cooling (DHC) systems, and mapping urban areas suitable for DHC deployment. However, none have presented an open-source model incorporating GIS-based decision-making for designing 5GDHC systems. This study, for the first time, addresses this gap through a case study conducted in the Northern Industrial Zone of Karaganda, Kazakhstan, demonstrating how GIS-enhanced modeling can be effectively applied in a developing industry-driven economy. We outline the mathematical framework for comparing existing simulation tools and developing a custom model suited to the region's needs. Additionally, we discuss validation and calibration methods, which remain underexplored in current literature. The proposed model incorporates waste heat recovery from local sources, including nearby wastewater treatment plants, showcasing a sustainable energy solution for the industrial park. Results indicate that a well-structured 5GDHC system, supported by GIS tools, can markedly enhance energy efficiency and sustainability, presenting a scalable and adaptable approach for other regions in Kazakhstan and beyond.
Keywords:
renewables
; energy integration
; efficiency
; environmental sustainability
; district energy
; simulation
1. Introduction
The 5th Generation District Heating and Cooling (5GDHC) systems represent a transformative approach to energy management, aiming to reduce greenhouse gas emissions, enhance energy efficiency, and integrate renewable energy sources. The application of Geographic Information Systems (GIS) in planning 5GDHC systems is a novel approach that allows for spatial analysis and optimization. GIS facilitates informed decision-making by visualizing energy demand, resource availability, and infrastructure layouts. This integration is crucial for identifying optimal locations for heat pumps, storage systems, and distribution networks, thereby maximizing the efficiency and sustainability of 5GDHC systems.
The key features of the GIS software and 5GDHC concept are well presented in the literature ([1,2,3,4] and [5,6,7,8]) and, therefore, are not repeated in the present literature review.
According to them, there are 3 main aspects in planning 5GDHC systems, which can be handled by the GIS software:
- decision-making under the regulations of energy markets,
- using operational data,
- modeling/simulations, incl. technical design.
Technical design, in turn, includes focusing on the 3 main components:
- heat pumps,
- ULTDH network,
- demand side (consumer buildings).
Gudmundsson et al. [9] combine network and demand sides by showing a residential area map and a DH curve simulation. The curve represents the simultaneity factor for space heating and domestic hot water (DHW) demands. The simultaneity factor measures how much of the total heat demand is required at any given time. It is typically lower than 1.0 because not all buildings simultaneously demand heat. Although the DH network they consider is well-connected, with a high density of connections in the central part of the area, ensuring that all buildings have access to a reliable heat supply, it is hardly a 5GDHC system.
Muncan et al. [10] depict a flowchart for a proposed strategy to develop a sustainable District Heating and Cooling (DHC) system. The flowchart outlines a planning process based on factors like building energy efficiency, types of DHC technologies (fossil fuel-based, high-temperature vs low-temperature and carbon technologies, and renewable energy sources-based systems), and a regulated DHC market. However, that work does not operate with the GIS software and lacks the algorithm for developing the 5GDHC system in a particular location rather than focusing on general recommendations.
Demand side and consumer buildings are well covered by Blanco et al. [11], who show a map of Oldenburg, Germany, with various data visualizations overlaid. The data visualizations show the building age and construction type of buildings in the city. A color-coding scheme represents the building age; for instance, the oldest buildings are red, while the newest ones are green. The distribution of building ages is uneven across the city. There are older buildings in the city center, while newer buildings are in the suburbs. This suggests that the city has been growing and expanding but does not give necessary insights on the potential of deploying a 5GDHC system there.
Garbacik et al. [12] work at the system level and show a diagram of a Euros HC plant that generates electricity and heat using a combination of photovoltaic (PV) panels, heat pumps, and a borehole thermal energy storage (BTES) system. The plant is designed to meet the energy demands of the Lidzbark Warminski settlement in Poland, and the entire system falls pretty well under the definition of the 5GDHC concept. The plant employs two types of heat exchangers connected to a heat pump: air-water heat exchangers and ground-source ones. The air-water heat exchangers extract heat from the air, while the ground-source ones extract heat from the ground using a BTES system. Both first transfer energy to the water buffer tank after boosting the temperature level in a heat pump. The water tank stores heated water from the heat pumps. This heated water is then used for space heating (SH) and domestic hot water (DHW) needs. The BTES system consists of 300 boreholes drilled into the ground to a depth of 150 m. These boreholes are filled with water, which is a heat storage medium. The ground-source heat pumps extract heat from the water in the boreholes when heating is needed, and they store excess heat from the air-water heat exchangers in the boreholes when cooling is needed. As mentioned, the plant is connected to 1300 kW of local PV panels – this electricity is fed into the grid or used to power the heat pumps. The limitations of that research include a lack of attention on the demand side (consumer buildings). In particular, it is unclear what supply temperatures and regulation methods the buildings use to cover their peak heat demand of 2 MW.
Kuntuarova et al. [13] compare different existing models for DH systems based on their validation methods, software, contributions, and applications. The models are classified into three categories: steady-state, quasi-dynamic, and dynamic.
Steady-state models assume that the system parameters do not change between the projected time steps. This can be a good approximation for systems operating in almost constant conditions that are slowly changing over time. However, it is not a good approximation for systems that experience transient changes in load, such as energy systems employing transient behavior and thermal inertia.
Quasi-dynamic models are a compromise between steady-state and dynamic models. They assume that the system is in a steady state most of the time, but they can also account for transient changes in load. This makes them a good choice for district heating systems that experience transient load changes.
Dynamic models are the most complex of the three types. They can account for all of a DH system's complexities, including transient changes in load, heat losses, and pump efficiencies. This makes them the most accurate model type but computationally expensive to run.
For dynamic models, Boghetti et al. [14] show three graphs comparing the outlet temperature obtained from simulations to measured data. The graphs are labeled "a", "b", and "c", and each shows a different time interval.
Graph a shows the outlet temperature of the different models compared to measured data from 0 to 1800 s (30 min). The model temperature is generally slightly lower than the measured temperature but follows the same trend. Considering the sensor tolerance, the shaded area around the measured data indicates the measurement range.
Graph b shows the outlet temperature of the models compared to measured data from 750 to 850 s (12.5 to 14.2 min). Again, the model temperature is slightly lower than the measured temperature, but the difference is smaller than in Graph A. The two temperatures are almost identical at the end of the time interval.
Graph c shows the outlet temperature of the models compared to measured data from 1500 to 1800 s (25 to 30 min). The model temperature is slightly lower than the measured temperature again, but the difference is smaller than in graph b. The two temperatures are almost identical for most of the time interval.
However, Boghetti et al. [14] show that the time step affects the simulated outlet temperature. The model temperature is generally more accurate when the time step is smaller. They also show that the chosen simulation software also affects the outlet temperature of the aerial pipe. For instance, the Dymola software produces the most accurate results, followed by IDA-Ice, PyDHN, Simulink-Carnot, TRNSYS-709cc, and TRNSYS-604.
The validation methods used to assess the accuracy of the models are also important. The most common validation methods are:
- comparison with experimental data: This method compares the model results with data collected from a real DH system.
- comparison with other models: This method involves comparing the model results with the results of other models that are known to be accurate.
- sensitivity analysis: This method involves changing the model's input parameters and observing how the output changes.
There are many different software packages available for DH system modeling. Some of the most popular packages include:
- Dymola is general-purpose modeling and simulation software that can implement a wide variety of models, including district heating system models.
- Modelica is another general-purpose modeling and simulation software that can be used to implement district heating system models.
- Sincal is a specialized software package for modeling DH systems.
- sisHyd is another specialized software package for modeling DH systems.
Lagoeiro et al. [15] show a map of the Riga, Latvia suburbs, with a district heating (DH) network sketched next to the wastewater treatment plant (WWTP) in Daugavgrīva. This WWTP generates a significant amount of waste heat, which could be used to generate additional heat for the DH network. This would help to reduce the reliance on fossil fuels and lower emissions. The DH network now transports hot water from a central heat-only boiler plant to individual buildings with up to 36 GWh of annual heat demand. The boiler house is currently fueled by wood chips (2 x 9 MW boilers) and natural gas (17 MW boiler). However, the potential for using other renewable energy sources to generate heat for the DH network was not considered. This might include solar thermal, geothermal, and biomass energy. Moreover, the existing DH network should be first modernized to improve its efficiency and reduce heat losses. The price of heat should be set at a level that is attractive to consumers but was not discussed. Last but not least, this system is not entirely in line with the requirement of the 5GDHC concept, as old infrastructure is not decommissioned. Instead, the old high-temperature boiler plant stays in operation.
Zouloumis et al. [16] investigate factors affecting the heat exchanger's effectiveness (represented by ε) and its impact on overall heating performance. In particular, they study the efficiency of heat exchangers in transferring heat between a primary and secondary fluid in a heating system. However, their model is related to radiator temperatures and is used to analyze the influence of radiator design or operating conditions on the radiator's output temperature and heating power (represented by Qrad and To,cons). These findings cannot be directly transferred to 5GDHC systems, which typically include booster heat pumps at building substations.
N. Terry and R. Galvin [17] compare the energy efficiency of different heat pump setback strategies. That is essential but not the only feature of the 5GDHC concept.
The literature review indicates that no open-source model for GIS-informed decision-making and design of a 5GDHC system is available. This paper aims to summarize the main features of such a model using the case study in Kazakhstan as an example. The novelty and the contribution to the pool of knowledge is listing these features and forming the necessary mathematical grounds so that different simulation tools can be compared and a tailor-made model can be developed. To the best of the author’s knowledge, some points (e.g., how to validate and calibrate such a model) have never been discussed in the literature before.
2. Materials and Methods
The heat exchanger is installed when the building's substation is connected indirectly to the DH network. The 5GDHC systems are typically connected indirectly. The network side is then the primary conduit, and the building (space heating/cooling) side is the secondary conduit.
Actual heat transfer Qac [W] can be calculated according to [16]:
where ϵ is the effectiveness of the heat exchanger [-],
- Qmax design (peak) heat transfer rate [W].
Outlet temperature of the primary fluid To,pr [°C]:
where Ti,pr is the inlet temperature of the primary fluid [°C],
- Cpr volumetric heat capacity of the primary fluid [W/(m³·°C)].
Outlet temperature of the secondary fluid To,sec [°C]:
where Ti,sec is the inlet temperature of the secondary fluid [°C],
- Csec specific heat capacity of the secondary fluid [J/(kg·°C)].
Radiator heating power Qrad [W] can be used to calculate the necessary inlet temperature of the radiator (secondary supply temperature) and to connect it to the Thermal comfort percentage (TCP):
where To,cons is the outlet temperature of the radiator [°C],
- Ti,cons inlet temperature of the radiator [°C],
- Msec mass flow rate of the secondary fluid [kg/s],
- Csec specific heat capacity of the secondary fluid [J/(kg·°C)].
TCP indicator [%] is expressed as the following ratio:
where Ncom is the number of occupants feeling comfortable [-],
- Nocc total number of occupants [-].
To maintain the desired TCP, the following scenarios were considered (adopted from [17]):
- scenario #1: setback 12 °C, supply 55 °C: this is the baseline strategy, in which the thermostat is set back to 12 °C during unoccupied hours, and the supply temperature is set to 55 °C.
- scenario #2: setback 16 °C, supply 55 °C: this strategy sets the thermostat back to 16 °C during unoccupied hours, and the supply temperature is still set to 55 °C.
- scenario #3: setback 18 °C, supply 55 °C: this strategy sets the thermostat back to 18 °C during unoccupied hours, and the supply temperature is still set to 55 °C.
- scenario #4: setback 18 °C, supply 45 °C: this strategy sets the thermostat back to 18 °C during unoccupied hours, and the supply temperature is reduced to 45 °C.
This is because reducing the supply temperature allows the heat pump to operate more efficiently. However, it is important to note that this strategy may not be practical for all homes. If the radiators in the home are not oversized, they may not be able to provide enough heat at a lower supply temperature. In this case, a different setback strategy may be more appropriate.
There are 3 additional factors to consider when choosing a heat pump setback strategy:
- the climate in the studied area: if the building is located in a cold climate, it might be necessary to set the thermostat back to a higher temperature than those in a milder climate.
- the envelope insulation: a lower setback temperature might be enough if the building is considered well-insulated.
- the personal comfort level of occupants: some people are more comfortable with a colder/warmer indoor climate than others.
The model can be later calibrated if operational data is made available for any of the parameters (e.g., indoor temperature measurements from loggers or secondary supply temperatures from the sensors) after the stakeholder engagement process. It can be done by introducing the correction factors (as in [18]) to minimize one/several of the following model accuracy (error) metrics (adopted from [19]):
Mean Absolute Error (MAE) [-]:
where N is the total number of data points [-],
- yi measured value of the i-th data point [e.g., W],
- simulated value of the i-th data point [e.g., W].
Median Absolute Deviation (MAD) [e.g., W] is:
Coefficient of Variation of Root Mean Squared Error (CVRMSE) [%]:
3. Case Study
The business park in the Northern Industrial Zone (Karaganda, Kazakhstan) is considered a promising location for a 5GDHC system. This location includes 7 buildings with waste heat (Table 1) and 4 WWTPs nearby (Figure 1).
For three additional factors critical when choosing a heat pump setback strategy, the following assumptions were set:
- the climate in the studied area: Kazakhstan has a temperate maritime climate characterized by moderate temperatures, prevailing southerly to westerly winds, abundant cloud cover, and frequent precipitation.
- the envelope insulation: 7 scenarios from A to E (Figure 2).
- the indoor temperature is set to 18°C in summer and 20°C in winter.
The lower acceptable threshold for TCP was set at 80%. In the case of an office building with 10 employees, that means that at least 8 occupants should be comfortable.
4. Results and Discussion
Figure 3 shows the layout of the 5GDHC network, with the number of connections to each building indicated.
The connections are concentrated in the central part of the area, where the building density is highest. As Gudmundsson et al. [9] pointed out, the simultaneity of energy demands might be especially important for dense areas. Therefore, the first guess is that simultaneity is important for this part of the district energy system. Generally, the simultaneity factor for SH is higher than that for DHW. This is because SH is more sensitive to outdoor temperatures, so the demand for SH is likelier to peak on cold days. The simultaneity factor for SH and DHW decreases with the number of connections. This is because the more buildings, the higher the chances of sporadic behavior when SH and DHW consumption of different users do not overlap. Since this particular case study is an industrial park environment comprising garages, workshops, and offices with no or negligible DHW demand, only SH should be considered. The specific values of the simultaneity factor will vary depending on several factors, including the climate, the type of buildings in the area, and the occupants' behavior.
In Figure 3, the construction type in the Northern Industrial Zone industrial park is represented by a different color-coding scheme. Single-family homes are shown in grey, office buildings are shown in pink, and agricultural zones are shown in yellow/green. The distribution of buildings is uneven across the industrial zone: larger buildings are in the newer outer areas (Eastern and Northern), and smaller buildings are in the zone center.
The 5GDHC is expected to be highly efficient and sustainable. PV panels on the roofs of large buildings or those occupying agricultural fields nearby can generate clean electricity without emissions, and heat pumps will use renewable energy sources (solar and geothermal) to provide heating and cooling. The seasonal thermal energy storage system will further improve efficiency by storing excess energy when available and using it when needed. However, the expansion of this industrial zone and construction of thermal energy storage is limited because the industrial park is confined to residential, densely populated areas (in grey). Nevertheless, the 5GDHC in the Northern Industrial Zone (Kazakhstan) is a well-designed and sustainable project expected to provide clean energy to the community for many years.
The 5GDHC system also provides cooling in the summer. This would require having radiators that can work with the chilled water (e.g., fan convectors). District energy is a more sustainable and efficient way to provide heat than individual boilers. It can use a broader range of fuels, including renewable sources, and reduce energy losses.
Waste heat from the WWTP is one of the possible renewable energy sources, so using it for district heating would help reduce greenhouse gas emissions and other pollutants. Waste heat from the WWTP can further improve the city's overall energy efficiency by decreasing the need for fossil fuels to generate heat for the DH network, improving energy security, and reducing heating costs.
However, the availability of the waste heat from the WWTP should be carefully assessed before integrating it into the DH network. Such a project requires installing new pipes and heat exchangers, bringing additional costs for operating and maintaining the system. Moreover, specific technical challenges must be addressed when using waste heat from the WWTP for 5GDHC, e.g., choosing the optimal supply temperature to ensure efficient transportation via the network. Eventually, local stakeholders may be concerned about using waste heat from the WWTP to heat houses and business premises. This concern may be related to the perception that waste heat is dirty or unsafe. Addressing these concerns through public education and outreach would be necessary.
To compare, Garbacik et al. [12] present a solar-assisted heat pump plant designed to provide up to 2 MW of heating. Its BTES system has a storage capacity of 1.2 GWh. The Lidzbark Warminski (Poland) plant is located in an area with a higher solar insolation rate than elsewhere in Kazakhstan. This makes it more suitable for solar technologies. Moreover, it is by default connected to the grid, which allows it to sell excess electricity to the utility company. This can help offset the plant's cost and make it more economically viable. Last but not least, there are better funding conditions as the Polish government provides several incentives for solar power projects, which can help make them more affordable and attractive to investors.
In [10], the feasibility assessment process starts with assessing the increase in energy efficiency in the building sector, i.e., on the demand side rather than the system/network side. It then diverges into two paths depending on the presence of a regulated DHC market. Without a regulated DHC market, the flowchart suggests moving directly towards a future sustainable DHC system. If there is a regulated DHC market, the flowchart considers different technological improvements and regulatory approaches based on three factors: i) environmental factors like the adoption of low-temperature and carbon technologies (such as renewable energy sources) in the DHC system, ii) improvement or application of regulations on DH pricing, and iii) improvement or application of regulations on thermal performance agreements. Muncan et al. [10] conclude that regardless of the presence of a regulated DHC market, the goal is to move towards a future sustainable DHC system. The present research has challenged this conclusion as the only system configuration with favorable feasibility study results is to be delivered for later design and engineering stages.
To compare, the TCP formula suggested by Zouloumis et al. [16] presents the relationship between heat transfer calculations and occupant thermal comfort within a building. They explored how adjustments to the heating system based on these formulas improve the percentage of occupants feeling comfortable (TCP).
Kuntuarova et al. [13] summarize the contributions of the different models mentioned in the Introduction section. Some of the key contributions include:
- new open-source pipeline models for thermal networks ease access to modeling DH systems for engineers.
- analyzing the thermodynamic behavior of bidirectional DHC networks improves the design and operation of DH systems.
- quasi-dynamic models that reflect the dynamics of DH systems and consider variable mass flow and multiple energy sources make the models more accurate and useful for a wider range of applications, especially 5GDHC systems.
- compact models for fast thermal transient processes enable real-time simulating DH systems.
- new numerical approaches to model the heat transmission over long pipes improve the accuracy of DH system models.
- new methods for solving large-scale DH system models allow more complex DH systems to be simulated.
Kuntuarova et al. [13] also summarize the applications of the different models:
- designing new DH systems that are more efficient and reliable than existing DH.
- optimizing the operation of existing DH systems, improving their efficiency and reliability.
- planning for future DH systems to meet the energy community's needs.
Based on that, the checklist for the model to be developed for this particular case study is presented in Table 2.
5. Conclusions
The research presented in this paper holds significant relevance in modern energy systems, particularly in addressing the pressing need for sustainable and efficient heating and cooling solutions. This research provides a valuable overview of the different models that are available for DH system modeling. The choice of model will depend on the specific application and the available data. However, all of the models should be accurate and reliable enough.
Using renewable energy sources to generate heat for DH is integral to transitioning to a low-carbon economy. This study contributes to the broader academic and practical discourse in 5 key ways:
1. comprehensive review and gap identification: the literature review conducted in this research identifies significant gaps in existing studies, particularly the lack of open-source models for GIS-informed decision-making and design of 5GDHC systems. This paper addresses a critical need in the field by summarizing key features and forming the mathematical foundations for such models. This contribution advances academic knowledge and provides practical tools for engineers and planners.
2. case study application: the Northern Industrial Zone business park case study in Kazakhstan exemplifies the proposed model's practical application. This real-world example demonstrates how the model can be used to design and optimize a 5GDHC system, considering factors such as local energy resources, building types, and climate conditions. The findings from this case study offer valuable insights for similar industrial parks and urban areas globally, promoting the wider adoption of 5GDHC systems.
3. environmental and economic benefits: the proposed model contributes significant environmental benefits by enhancing the efficiency of district heating and cooling systems and integrating renewable energy sources. Reduced reliance on fossil fuels and lower greenhouse gas emissions align with global climate goals and sustainable development targets. Additionally, the optimized design of 5GDHC systems can lead to cost savings for energy providers and consumers, making these systems economically viable and attractive.
4. advancement of energy system modeling: the research advances the field of energy system modeling by proposing a comprehensive framework that can be calibrated and validated using operational data. This approach ensures the models are accurate and reliable, leading to better predictions and performance assessments. The inclusion of various validation metrics and sensitivity analyses further strengthens the robustness of the proposed model.
5. policy and regulatory implications: this research's findings have implications for energy policy and regulation. By demonstrating the feasibility and benefits of 5GDHC systems, the study provides evidence that can inform policy decisions and support the development of regulations that encourage the adoption of sustainable energy solutions. Policymakers can leverage this research to create frameworks that facilitate the deployment of advanced district heating and cooling systems.
Another conclusion is that a DH system should be well-designed and able to meet the community's heating and cooling demands. Using waste heat for the 5GDHC system can provide several environmental and economic benefits, such as reducing emissions and improving energy efficiency. However, some challenges must be overcome to make this a reality. In summary, this research is highly relevant to the ongoing efforts to transition to sustainable energy systems. By addressing the gaps in existing studies, proposing a novel model, and providing a practical case study, the paper contributes to the advancement of 5GDHC systems. The environmental, economic, and policy implications underscore the importance of this research in achieving sustainable development and combating climate change.
Author Contributions
Conceptualization, S.C. and A.Z.; methodology, S.C.; software, S.C.; validation, G.B. and T.P; formal analysis, S.C.; investigation, S.C.; resources, G.B.; data curation, S.C.; writing—original draft preparation, S.C.; writing—review and editing, S.A., G.B., Y.Z., T.P. and A.Z.; visualization, G.B.; supervision, S.A. All authors have read and agreed to the published version of the manuscript.
Funding
This research is funded by the Science Committee of the Ministry of Science and Higher Education of the Republic of Kazakhstan (Grant No. АР19175311 “Improving energy efficiency and reliability of district heating based on optimization of thermal insulation parameters”).
Institutional Review Board Statement
Not applicable.
Informed Consent Statement
Not applicable.
Data Availability Statement
The data presented in this study are available on request from the corresponding author. The data are not publicly available due to confidentiality reasons.
Conflicts of Interest
The authors declare no conflicts of interest.
References
- Fournier, E.D.; Federico, F.; Cudd, R.; Pincetl, S. Building an interactive web mapping tool to support distributed energy resource planning using public participation GIS. Appl. Geogr. 2023, 152, 102877. [Google Scholar] [CrossRef]
- Honic, M.; Ferschin, P.; Breitfuss, D.; Cencic, O.; Gourlis, G.; Kovacic, I.; De Wolf, C. Framework for the assessment of the existing building stock through BIM and GIS. Dev. Built Environ. 2023, 13, 100110. [Google Scholar] [CrossRef]
- Nuño-Villanueva, N.; Maté-González, M.; Nieto, I.M.; Blázquez, C.S.; Martín, A.F.; González-Aguilera, D. GIS-based selection methodology for viable District Heating areas in Castilla y León, Spain. Geothermics 2023, 113, 102767. [Google Scholar] [CrossRef]
- Chicherin, S.; Volkova, A.; Latõšov, E. GIS-based optimisation for district heating network planning. Energy Procedia 2018, 149, 635–641. [Google Scholar] [CrossRef]
- Gjoka, K.; Rismanchi, B.; Crawford, R.H. Fifth-generation district heating and cooling systems: A review of recent advancements and implementation barriers. Renew. Sustain. Energy Rev. 2023, 171, 112997. [Google Scholar] [CrossRef]
- Buffa, S.; Cozzini, M.; D’antoni, M.; Baratieri, M.; Fedrizzi, R. 5th generation district heating and cooling systems: A review of existing cases in Europe. Renew. Sustain. Energy Rev. 2019, 104, 504–522. [Google Scholar] [CrossRef]
- Edtmayer, H.; Nageler, P.; Heimrath, R.; Mach, T.; Hochenauer, C. Investigation on sector coupling potentials of a 5th generation district heating and cooling network. Energy 2021, 230, 120836. [Google Scholar] [CrossRef]
- Millar, M.-A.; Yu, Z.; Burnside, N.; Jones, G.; Elrick, B. Identification of key performance indicators and complimentary load profiles for 5th generation district energy networks. Appl. Energy 2021, 291, 116672. [Google Scholar] [CrossRef]
- Gudmundsson, O.; Schmidt, R.-R.; Dyrelund, A.; Thorsen, J.E. Economic comparison of 4GDH and 5GDH systems – Using a case study. Energy 2022, 238, 121613. [Google Scholar] [CrossRef]
- Munćan, V.; Mujan, I.; Macura, D.; Anđelković, A.S. The state of district heating and cooling in Europe - A literature-based assessment. Energy 2024, 304, 132191. [Google Scholar] [CrossRef]
- Blanco, L.; Alhamwi, A.; Schiricke, B.; Hoffschmidt, B. Data-driven classification of Urban Energy Units for district-level heating and electricity demand analysis. Sustain. Cities Soc. 2024, 101, 105075. [Google Scholar] [CrossRef]
- Vad, B.; Alberg, P.; Jørgen, H. Book of Abstracts 9th International Conference on Smart Energy Systems. in.
- Kuntuarova, S.; Licklederer, T.; Huynh, T.; Zinsmeister, D.; Hamacher, T.; Perić, V. Design and simulation of district heating networks: A review of modeling approaches and tools. Energy 2024, 305, 132189. [Google Scholar] [CrossRef]
- Boghetti, R.; Kämpf, J.H. Verification of an open-source Python library for the simulation of district heating networks with complex topologies. Energy 2024, 290, 130169. [Google Scholar] [CrossRef]
- Lagoeiro, H.; Maidment, G.; Ziemele, J. Potential of treated wastewater as an energy source for district heating: Incorporating social elements into a multi-factorial comparative assessment for cities. Energy 2024, 304, 132190. [Google Scholar] [CrossRef]
- Zouloumis, L.; Ploskas, N.; Panaras, G. Quantifying flexibility potential on district heating local thermal substations. Sustain. Energy, Grids Networks 2023, 35, 101135. [Google Scholar] [CrossRef]
- Terry, N.; Galvin, R. How do heat demand and energy consumption change when households transition from gas boilers to heat pumps in the UK. Energy Build. 2023, 292, 113183. [Google Scholar] [CrossRef]
- Chicherin, S.; Anvari-Moghaddam, A. Adjusting heat demands using the operational data of district heating systems. Energy 2021, 235, 121368. [Google Scholar] [CrossRef]
- Sánchez-García, L.; Averfalk, H.; Möllerström, E.; Persson, U. Understanding effective width for district heating. Energy 2023, 277, 127427. [Google Scholar] [CrossRef]
- Moreno, D.; Nielsen, S.; Persson, U. The European Waste Heat Map. Preprint at http://urn.kb.se/resolve?urn=urn:nbn:se:hh:diva-48180 (2022).
Figure 1.
The location overview: the Northern Industrial Zone business park is outlined in green. Source: Google Maps.
Figure 1.
The location overview: the Northern Industrial Zone business park is outlined in green. Source: Google Maps.
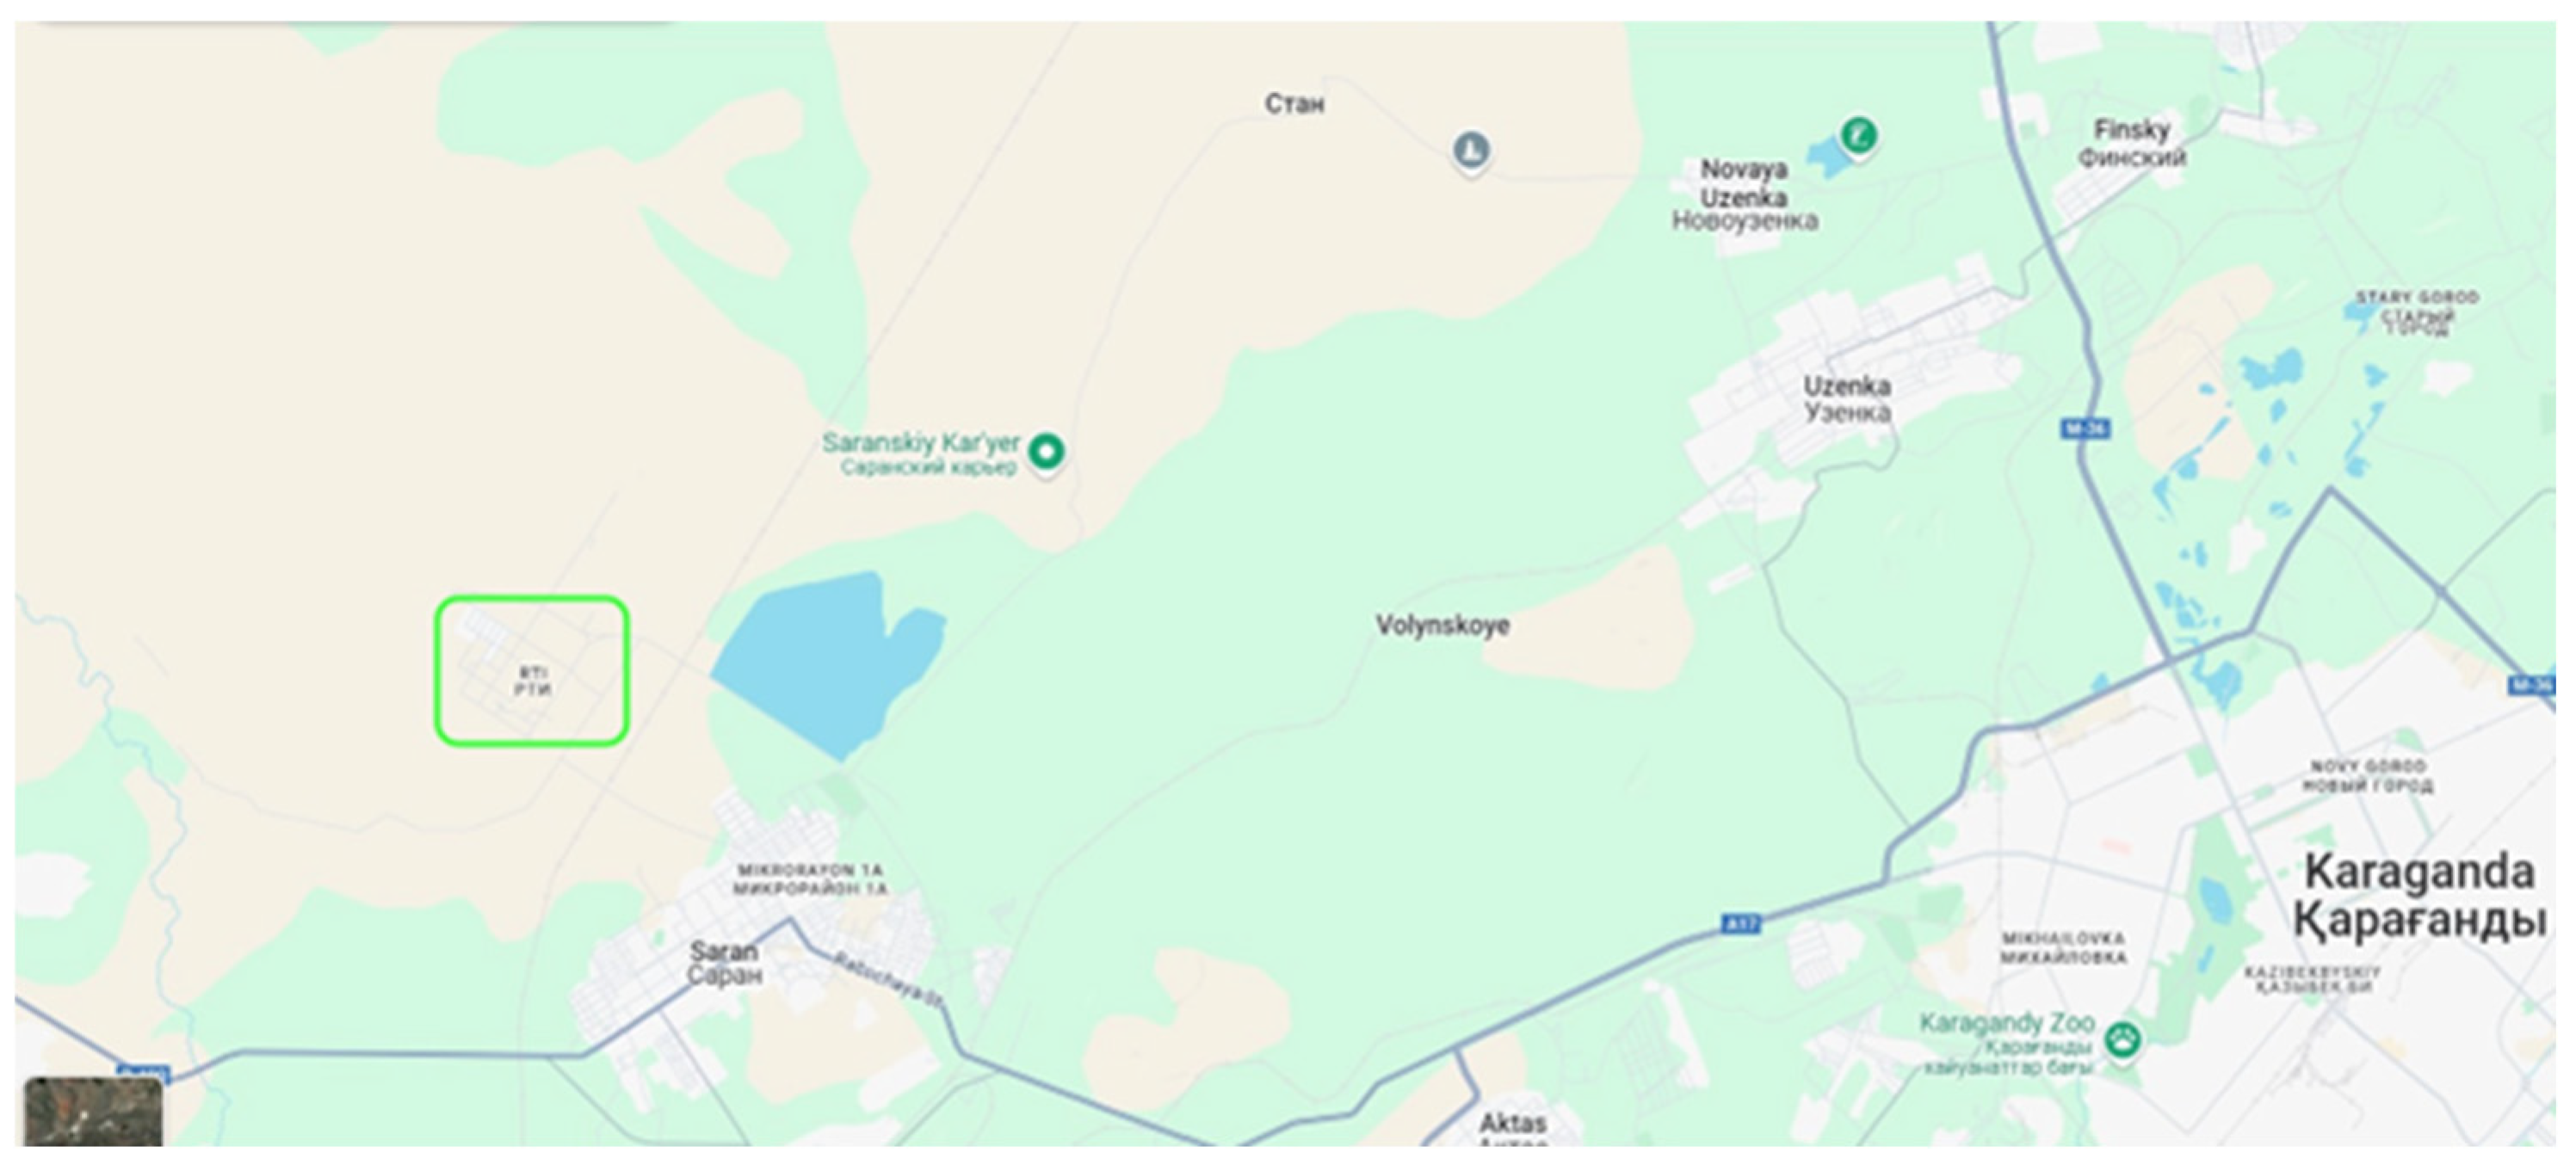
Figure 2.
EPC labels according to the national regulation of the Republic of Kazakstan.
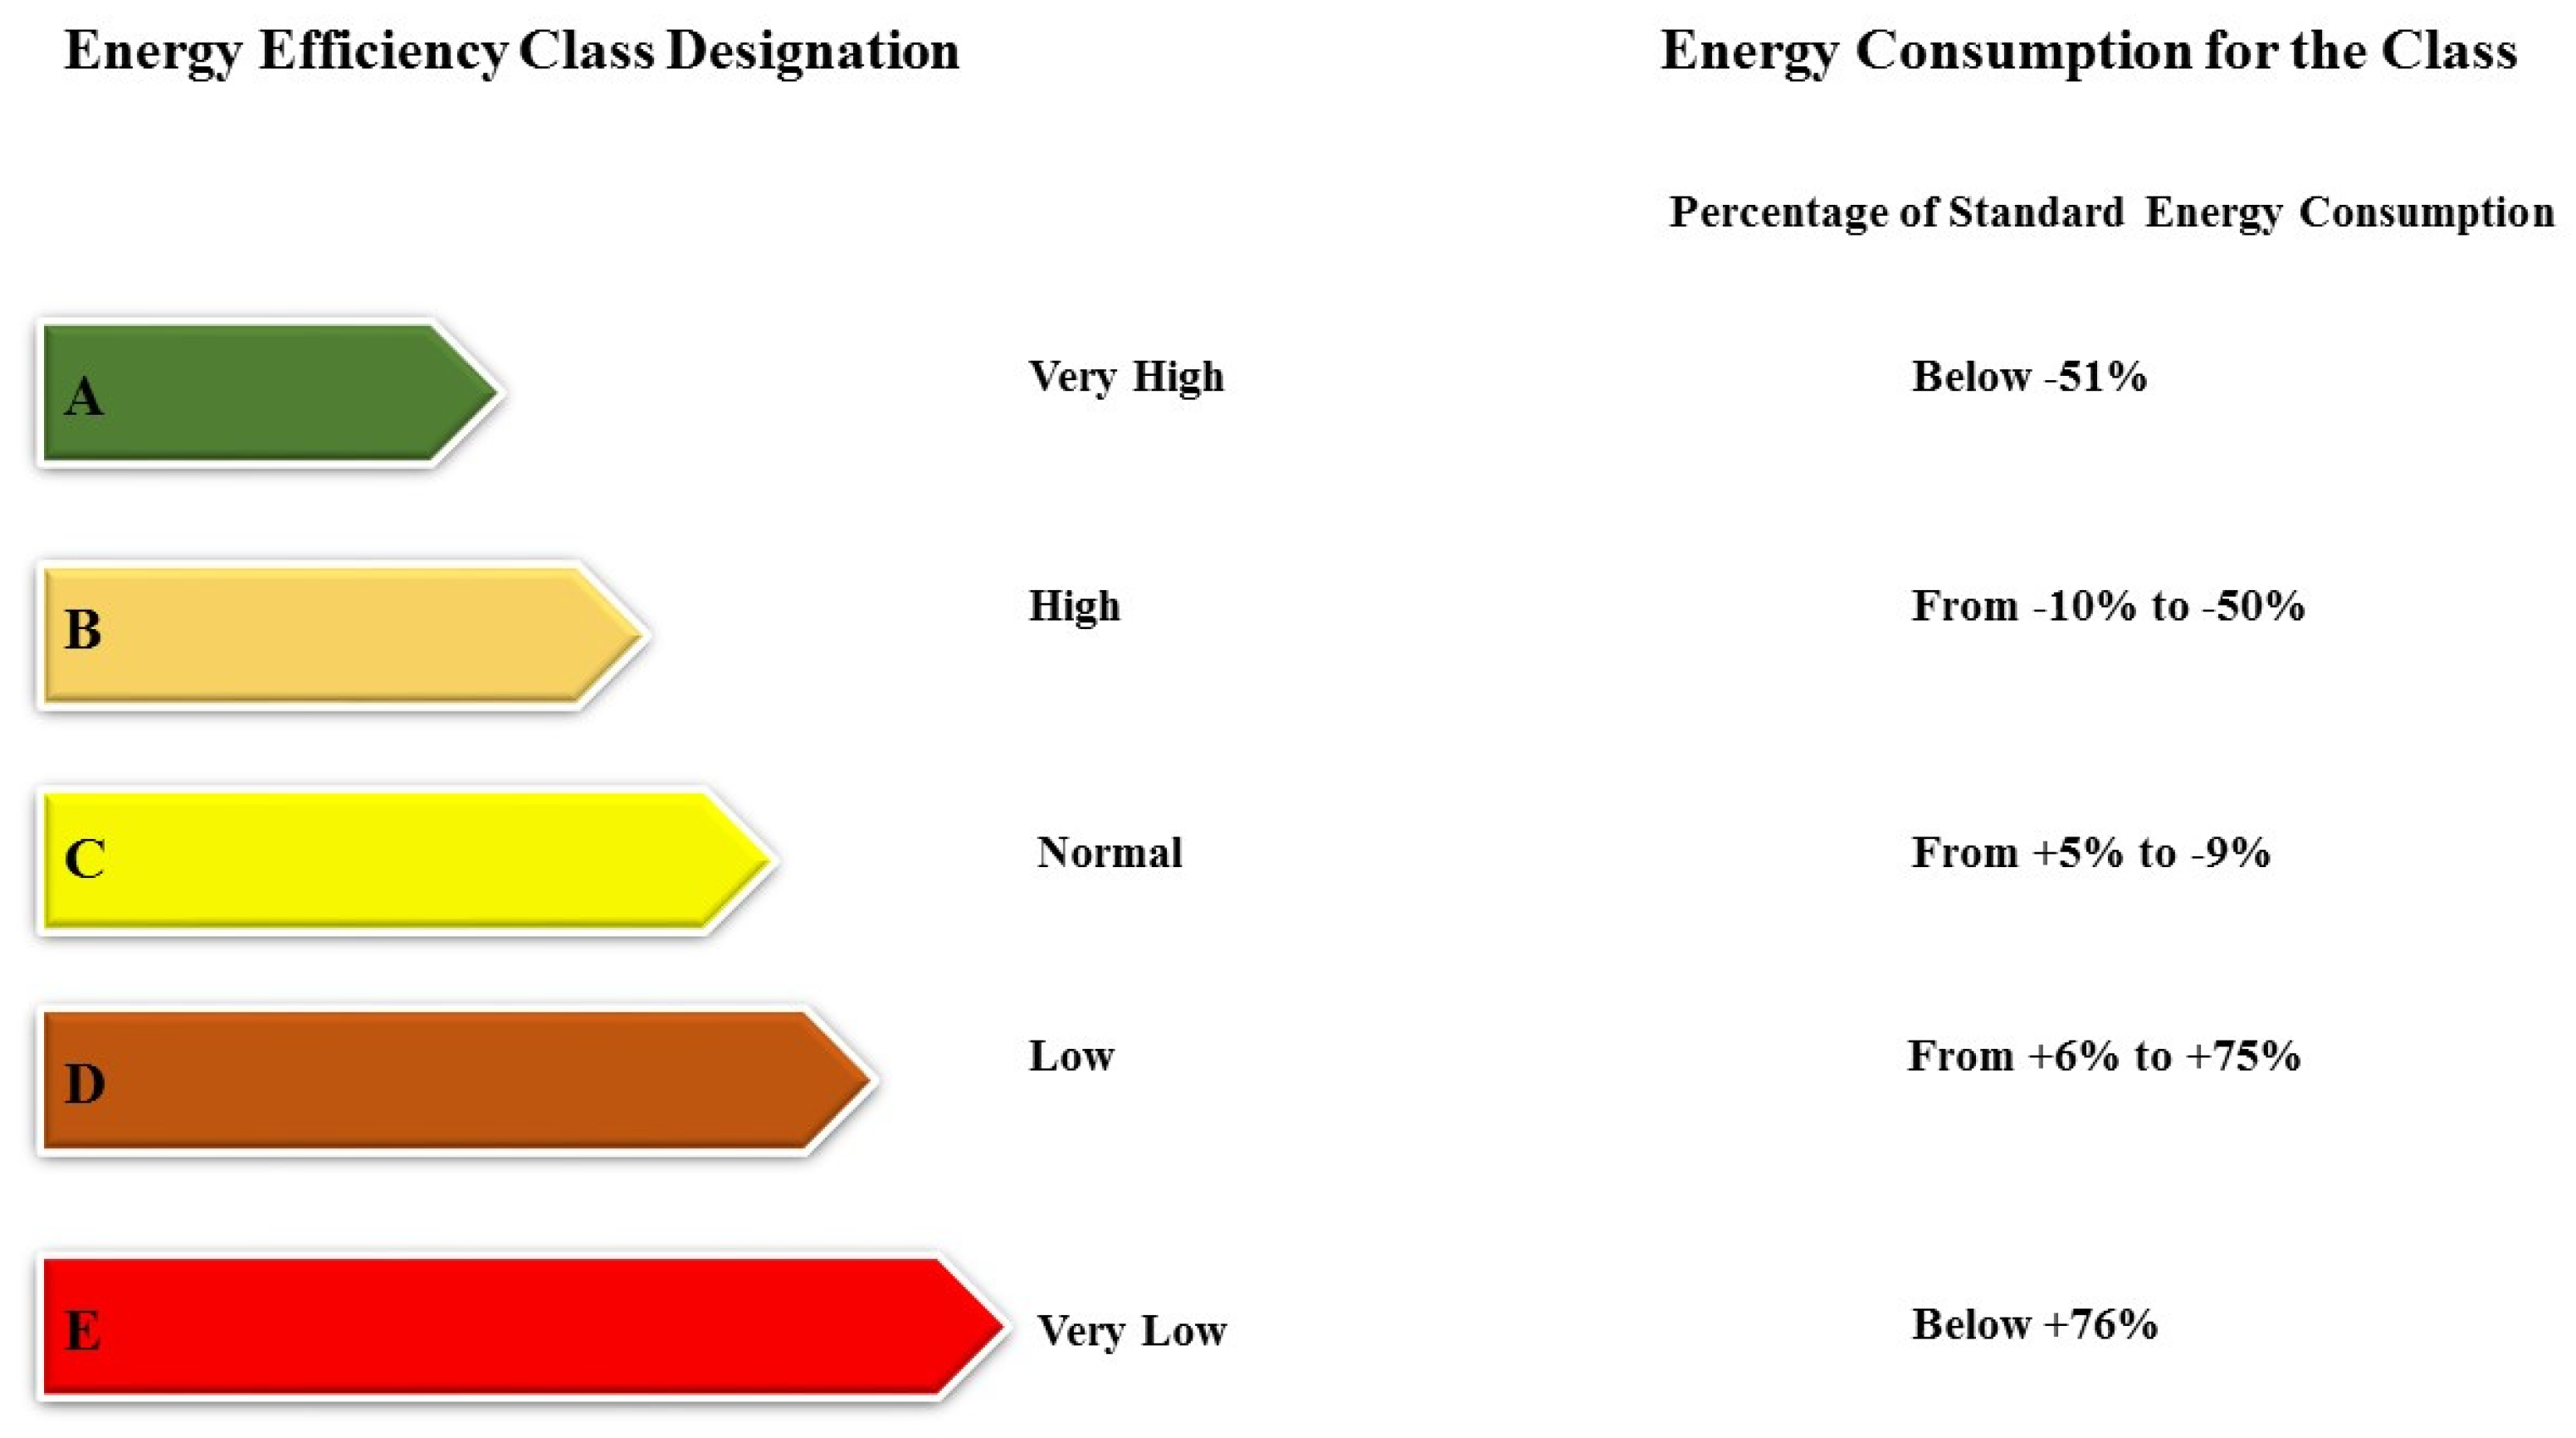
Figure 3.
Configuration of a 5GDHC system in the GIS software.
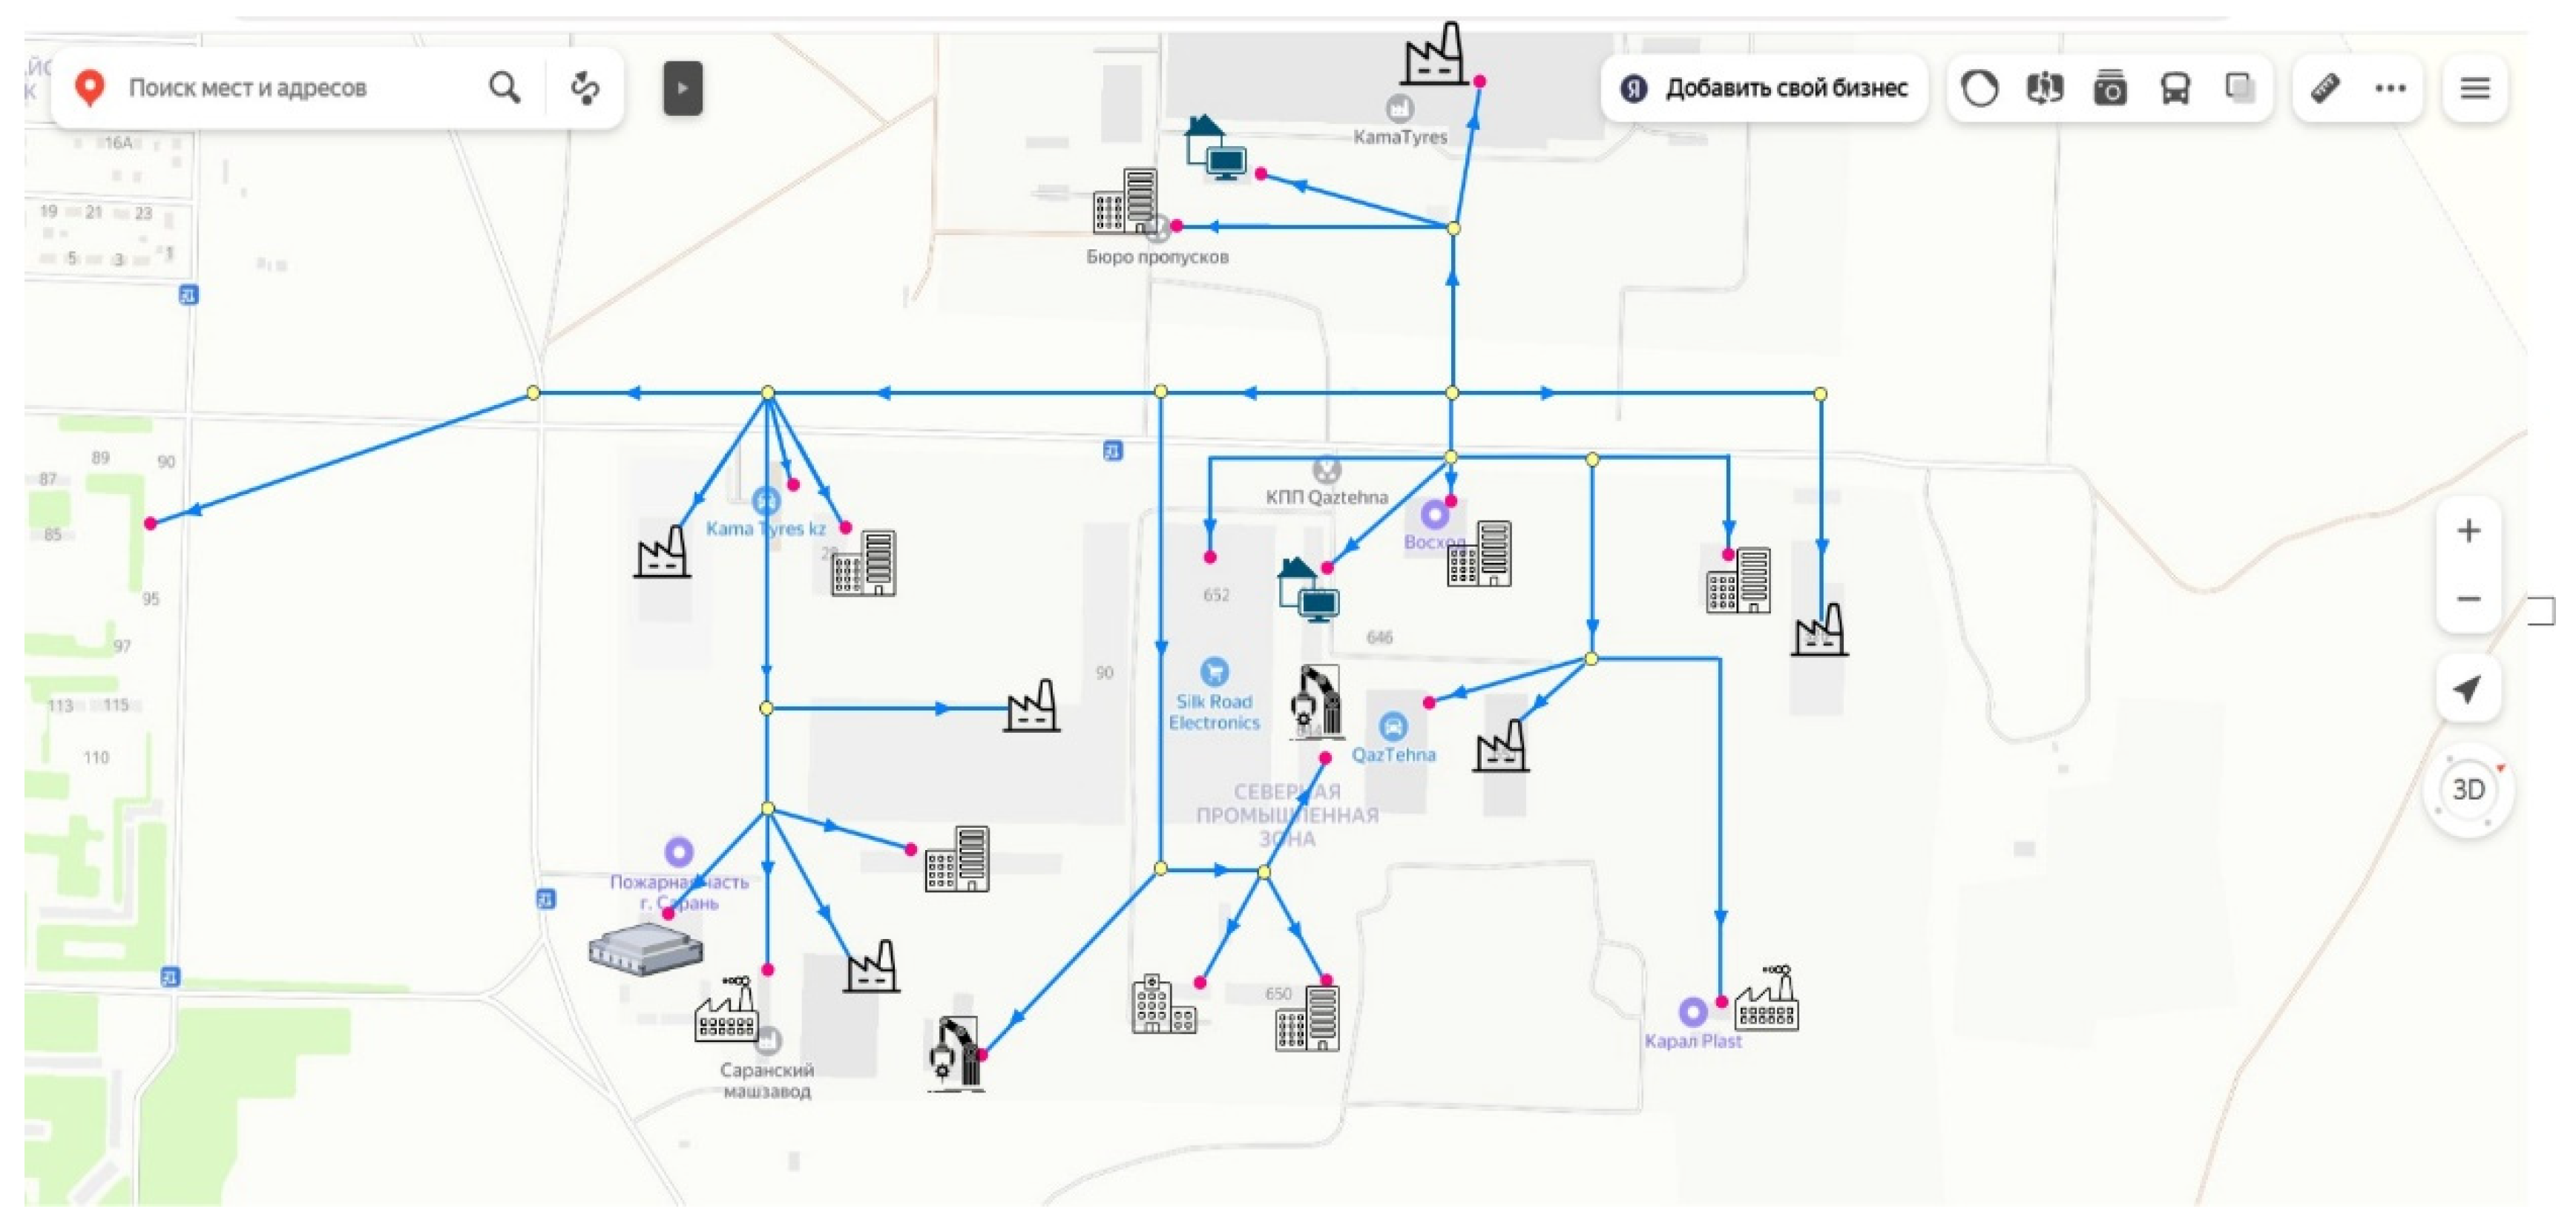

Table 1.
Sources of waste heat in Karaganda, Kazakhstan.
| # | Title | Type/name | waste heat [GWh/yr] |
|---|---|---|---|
| 1 | KamaTyresKZ | Tyre production | 10.0 |
| 2 | Silk road electronics | Supermarket | 5.0 |
| 3 | Karal Plast | Factory | 5.0 |
| 4 | Saran Machine Plant | Factory | 15.0 |
| 5 | «Voshod» | Industrial printing | 5.0 |
| 6 | QazTehna | Material production | 10.0 |
| 7 | Kazcentreleсtroprovod | Cable production | 5.0 |
| 8 | SaranRezinaTechnic | Rubber production | 10.0 |
| 9 | Olympus | Food production | 2.0 |
Table 2.
Main features of the model to be developed for the 5GDHC system in Northern Industrial Zone.
Table 2.
Main features of the model to be developed for the 5GDHC system in Northern Industrial Zone.
| eligible criteria/application | new DH systems (5GDHC) |
existing DH systems (3GDH + 4GDH) |
future DH systems (6GDH) |
| open-source | yes | some | yes |
| bidirectional DHC networks | yes | no | yes |
| quasi-dynamic | no | yes | no |
| compact | yes | no | yes |
| new numerical approaches | no | no | no |
| large-scale | yes | yes | yes |
Disclaimer/Publisher’s Note: The statements, opinions and data contained in all publications are solely those of the individual author(s) and contributor(s) and not of MDPI and/or the editor(s). MDPI and/or the editor(s) disclaim responsibility for any injury to people or property resulting from any ideas, methods, instructions or products referred to in the content. |
© 2024 by the authors. Licensee MDPI, Basel, Switzerland. This article is an open access article distributed under the terms and conditions of the Creative Commons Attribution (CC BY) license (http://creativecommons.org/licenses/by/4.0/).
Copyright: This open access article is published under a Creative Commons CC BY 4.0 license, which permit the free download, distribution, and reuse, provided that the author and preprint are cited in any reuse.


