
Submitted:
11 February 2026
Posted:
12 February 2026
You are already at the latest version
Abstract
Lime and gypsum are widely used to correct soil acidity and improve grain yields in Bra-zilian agricultural systems. However, limited information is available on their effective-ness and application methods in degraded sandy soils typical of older agricultural fron-tiers, such as those in Rio de Janeiro State. This study evaluated the effects of surface ver-sus incorporated application of lime and gypsum on soil chemical properties, nodulation, nitrogen fixation, and grain yield of soybean cultivars grown in low-fertility Fluvisols. The experiment was conducted during the 2021/2022 growing season in Campos dos Goytacazes, Rio de Janeiro, using a strip-plot design with four soybean cultivars and two application methods (surface and incorporated). Soil chemical attributes, nodulation, nu-trient uptake, and yield components were assessed. Incorporated application significantly increased soil pH, reduced Al³⁺ toxicity, and enhanced Ca²⁺, Mg²⁺, P, and K⁺ availability compared to surface application. Nodulation responses varied among cultivars, with in-corporated treatments promoting up to 40% greater nodule biomass. Although primary root length was not affected, incorporation stimulated secondary root development and nutrient uptake, leading to approximately 50% higher pod number and grain yield. Over-all, incorporating lime and gypsum was more effective than surface application in im-proving soil fertility, enhancing nodulation, and increasing soybean productivity. These findings highlight the importance of lime and gypsum incorporation as a key manage-ment practice for sustainable soybean production in degraded sandy soils.
Keywords:
soil fertility
; soybean productivity
; lime and gypsum incorporation
; biological nitrogen fixation
; soil recovery
1. Introduction
Historically, sugarcane (Saccharum spp.) cultivation in Brazil was concentrated in regions near ports, serving as one of the country’s first globally traded commodities. Major production hubs included Rio de Janeiro, São Paulo, and northeastern states such as Alagoas and Pernambuco. Over time, sugarcane expansion shifted to coastal regions of other Brazilian states due to agronomic, economic, and environmental drivers [1]. In areas such as northern Rio de Janeiro, former sugarcane fields were frequently converted to pasture, altering regional land use dynamics [2].
Currently, Brazil ranks as the world’s leading producer of soybean (Glycine max L. Merrill), with more than 40 million hectares under cultivation and an estimated production of 124 million tons in the 2023/2024 growing season [3]. Soybean is cultivated across diverse agroecosystems, from the southernmost state under subtropical conditions to the northernmost under a tropical climate and has increasingly been adopted as a strategy for rehabilitating degraded pasturelands. This transition enhances soil fertility and provides a market-viable alternative to traditional agricultural systems. In this context, soybean cultivation has recently emerged as a promising land-use strategy in Rio de Janeiro, particularly in areas historically dominated by sugarcane and pasture [4].
Soil, topographic, and land use assessments have identified approximately 320,000 hectares with potential for grain production in northern Rio de Janeiro. Approximately 70% of this area comprises Ferralsols (FR) and Acrisols/Alisols (AC/AL) (locally referred to as “tabuleiro” soils), while the remaining 30% consists of Cambisols (CM), Fluvisols (FL), and Gleysols (GL) (“baixada” soils) [4]. Local studies indicate that soil degradation in this region is largely associated with historical land use practices, including inadequate tillage, unsustainable pasture management, and limited soil conservation measures [2]. These factors have contributed to soil acidification, nutrient depletion, and structural deterioration, particularly in sloping landscapes [5].
The conversion of pasture to cropland presents significant agronomic challenges, particularly with respect to soil acidity, nutrient dynamics, and physical properties. Soil amendment strategies, including the application of lime and gypsum, have demonstrated potential for improving soil chemical and physical conditions, enhancing microbial activity, and optimizing crop performance [6,7]. Liming effectively neutralizes soil acidity by raising pH and reducing aluminum (Al3+) toxicity, while gypsum enhances calcium availability in subsurface layers and promotes leaching of toxic Al deeper into the profile, collectively improving root growth in acidic soils [8].
Furthermore, recent studies show that the use of gypsum has extended to other soil regions in Brazil to restore subsoil fertility [9]. However, despite this background, there is still a lack of site-specific data on how different lime and gypsum strategies affect soil chemical conditions and soybean performance in degraded sandy soils that face subsoil acidity, low fertility, and climatic constraints such as irregular rainfall and high temperatures. This knowledge gap is particularly relevant for these regions, where farmers are transitioning from historically degraded pastures to soybean cultivation.
Soybean cultivation relies heavily on biological nitrogen fixation (BNF) when inoculated with efficient Bradyrhizobium spp. strains, meeting up to 90% of the plant’s nitrogen demand through symbiosis [10]. The critical role of BNF in Brazilian soybean production has been extensively documented [11,12,13].
Correction of soil acidity through liming is essential for optimizing soybean productivity. High soil acidity (low pH) restricts plant growth by increasing aluminum solubility and reducing the availability of essential nutrients [14]. Liming neutralizes these effects by raising soil pH and supplying calcium and magnesium, which enhances root development and nutrient uptake efficiency [15]. Traditionally, lime is incorporated into the soil via plowing and harrowing [16]; however, these practices can disrupt soil aggregates, reduce porosity, and exacerbate erosion risks.
With the widespread adoption of no-tillage systems in Brazil, surface liming has gained popularity as a strategy for preserving soil structure while minimizing labor costs [17]. However, its effectiveness remains debated due to the slow vertical movement of lime within the soil profile, potentially limiting its impact on subsurface acidity [18,19]. In water-scarce regions, deeper incorporation of lime may provide more rapid and uniform soil amelioration. Additionally, co-application of gypsum has been recommended to enhance calcium and sulfur availability in deeper soil layers, promote root elongation, and improve overall plant performance under acidic conditions [20].
The integration of novel soil management technologies alongside conventional soil amendments has the potential to mitigate constraints related to chemical and physical soil properties, facilitating optimal crop development and maximizing agronomic input efficiency [21,22]. Within this framework, key research questions arise regarding the agronomic viability of transitioning pasturelands to soybean cultivation in low-fertility soils: (i) How do soybean plants respond to surface-applied versus incorporated lime and gypsum? (ii) Do different soybean cultivars exhibit distinct nodulation and nitrogen accumulation responses under such conditions?
This study aimed to address these questions by evaluating the agronomic performance and biological nitrogen fixation capacity of modern soybean cultivars grown in acidic soils with a historical land use trajectory involving sugarcane followed by pasture. Lime and gypsum were always applied together in this study; therefore, the effects discussed refer exclusively to the application method (surface versus incorporation), rather than to the isolated effects of each amendment.
2. Results
2.1. Soil Fertility
The soil chemical analysis revealed no significant interaction between lime and gypsum application methods and soil sampling depths for pH and Al3+ concentrations (Table 1). The incorporation of lime and gypsum was more effective than surface application, resulting in an average increase of 0.5 units in soil pH compared to surface treatment (Table 1). Al3+ concentrations were consistently higher at all depths under surface application than with incorporation (Table 1).
There was no significant interaction between lime and gypsum application methods and sampling depths for Ca2+ and Mg2+ levels (Table 1). The highest levels were observed in the top 10 cm, which gradually decreased to lower depths. High levels of Ca2+ and Mg2+ were observed in the area with incorporated lime than in the area with surface application (Table 1).
There was a significant interaction between the liming method and depth of the sampled soil regarding available P (Table 1). The area with incorporated lime and gypsum consistently presented higher values than those with surface application at all evaluated depths (Table 1). Overall, P levels were significantly higher in the top 10 cm than at other depths, regardless of the method of lime and gypsum application, (Table 1). Notably, exchangeable P values (Mehlich 1) were approximately 15, 60 and 330% higher for all sampled soil layers (0–10; 10–20 and 20–40 cm, respectively) in the incorporation treatments compared to that in the surface application.
The overall trend for K+ was similar to that observed for P (Table 1). Higher average values of K+ were recorded at all depths in the area with incorporation of lime and gypsum than in the area with surface application. K+ levels decreased with increasing depth in the area with surface application. However, there was no difference in K+ levels between the 10–20 cm and 20–40 cm layers in the area with incorporation, although they were lower than that of the surface layer (Table 5).
The area with incorporated lime and gypsum exhibited lower average soil organic matter (SOM) values at all depths, with a significant interaction between lime and gypsum application methods and soil depth, decreasing the SOM content (Table 1). There was no significant difference in the SOM percentage between the 0–10 cm and 10–20 cm layers in this area; however, a significant lower value was found in the 20–40 cm depth (Table 1). In the area with surface application, the highest SOM content was observed in the 0–10 cm layer, which differed significantly from other depths and, no significant differences were found between 10–20 and 20-40 cm layers (Table 1). The overall trend was a gradient of SOM with increasing depth (Table 1).
There was no significant interaction between the lime and gypsum application methods and sampling depth for the exchangeable bases (S) and base saturation (V%) (Table 1). The highest S and V% values were observed in the first 10 cm depth. The area with incorporation showed higher average values of S and V% at all depths compared to the surface application, with a decreasing gradient of S and V% with depth.
A significant interaction between the liming and gypsum methods and sampling depths was also identified for Al3+ saturation (m%) (Table 1). The average m% values were lower in the areas with incorporation at all depths. In this area, the m% values were similar between the 0–10 cm and 10–20 cm layers and between the 10–20 cm and 20–40 cm layers. A gradual increase in m% with depth was observed for the surface application, which was higher below the first 10 cm.
The cation exchange capacity (CEC) of the soil showed no significant interaction between the application method and sampling depth (Table 1). However, the incorporation of lime and gypsum resulted in lower average CEC values at all depths, which were significantly different from the surface application. No significant differences in CEC were observed between the depths for either application method (Table 1).
2.2. Nodulation, Root Development, and Shoot Dry Matter of Soybean Plants
No interactions between the soybean cultivars and liming and gypsum application methods were observed for plant nodulation. However, significant differences in nodulation were observed between the application methods and soybean cultivars (Table 2). Cultivar M 5917 IPRO had the highest average values for both nodule number and mass, which differed significantly from those of the other cultivars (Table 2). The nodule mass was higher when incorporation was carried out compared to the surface application, although there was no significant difference in the nodule number. No interaction between factors was observed for primary root length, and there were no significant differences between the cultivars or application methods (Table 2). However, a significant interaction was observed for the number of secondary roots, with the highest average values observed in areas where lime and gypsum were incorporated (Table 2).
Regarding root dry mass, cultivar M 5917 IPRO had the highest average value, followed by BRS 5980 IPRO and 95R95 IPRO, which did not differ significantly from each other or from cultivar BRS 7981 IPRO. Additionally, no significant difference in root dry mass was observed between the lime and gypsum application methods, and there was no interaction between the liming application method and cultivars (Table 2).
The highest values of shoot dry matter at the R1 stage were recorded for the M 5917 IPRO, BRS 5980 IPRO, 95R95 IPRO, and BRS 7981 IPRO cultivars. Overall, M 5917 IPRO produced the largest amount of dry matter, followed by BRS 5980 IPRO, BRS 7981 IPRO, and 95R95 IPRO (Table 2). However, the incorporation of lime and gypsum resulted in the highest shoot dry matter, independent of the soybean cultivar.
2.2. Nutrient Accumulation in the Aerial Parts of Soybean
Soybean shoot dry matter analyses at the R6 stage showed no interaction between liming and gypsum methods or cultivars (Table 3), indicating similar behavior across soybean cultivars under both application methods. Consistent with the shoot biomass trend, the cultivar M 5917 IPRO generally accumulated more Ca2+, Mg2+, K+, and N than the other cultivars. Cultivars BRS 5980 IPRO and 95R95 IPRO displayed intermediate nutrient accumulation, whereas BRS 7981 IPRO accumulated the least nutrients, except for P (Table 3). N accumulation in M 5917 IPRO was nearly 50% higher than that in BRS 7981 IPRO (Table 3). Regarding the comparison of liming and gypsum application methods, significantly higher values were observed in the incorporation area, with increases of 38%, 28%, 24%, 19%, and 33% for Ca2+, Mg2+, K+, P, and N, respectively.
2.3. Production Components and Grain Productivity of Soybeans
The M 5917 IPRO and BRS 5980 IPRO cultivars had the highest number of pods per plant, followed by BRS 7981 IPRO, which outperformed 95R95 IPRO (Figure 1). The M 5917 IPRO cultivar had fewer pods than the BRS 5980 IPRO in the treatment with surface-applied lime and gypsum (Figure 1). In fact, there was an interaction between lime and gypsum application methods and cultivars, with the area where the incorporation was carried out showing approximately 50% more pods per plant than the surface-applied lime (Figure 1).
There was no interaction between cultivar and liming and gypsum application methods for the 100-grain weight (Figure 2), and the highest weight was recorded in the area where lime and gypsum were incorporated into the soil (Figure 2). In contrast, the M 5917 IPRO cultivar had the highest grain weight, followed by BRS 7981 and 95R95 IPRO, which also differed from BRS 5980 IPRO (Figure 2). The method of lime and gypsum application also influenced the components weight of 100 grains and soybean grain yield (Figure 2).
The evaluation of soybean grain yield indicated that the M 5917 IPRO and BRS 5981 IPRO cultivars achieved yields exceeding 3,200 kg ha−1, outperforming the BRS 7981 IPRO cultivar, while the 95R95 IPRO cultivar had intermediate yields. The highest productivity was obtained in the treatment incorporating lime and gypsum, with a difference greater than 50%. There was no interaction between the liming and gypsum application methods or cultivar (Figure 2).
3. Discussion
In this study, soil tillage for soybean crops was compared in two adjacent areas where lime and gypsum were applied either by incorporation of it to a depth of approximately 20 cm or through surface application. The soil was tillage during the 2020/2021 growing season following the cultivation of different soybean cultivars. However, the evaluations for this study were only started from the following season, with the establishment of a new experiment. In the first year, crop grain yields were much lower than expected due to drought conditions, averaging around 1,000 kg ha−1 in the area where lime and gypsum were surface-applied, and below 1,500 kg ha−1 in the plots where these amendments were incorporated into the soil.
The soil was acidic, presenting high Al3+ content, and had a sandy texture. Evaluations were conducted following the conversion of the pasture to soybean crops, focusing on the effects of lime and gypsum application on the chemical characteristics of the soil and the development of different soybean cultivars.
The pH, Al3+, Ca2+, and Mg2+ analyses indicated that the amount of lime and gypsum applied in the previous crop (2020/2021) was insufficient to ensure high soybean yields, regardless of the application method. The pH remained below the ideal level for plant development recommended for Brazilian soils, which is 6.0-6.8 in water [23]. The neutralization of Al3+, which is critical, was incomplete as levels of Al3+ ≥0.3 cmolc dm-3 require the sum of Ca2+ and Mg2+ to reach at least 3 cmolc dm-3 [24,25]. This value was not achieved, suggesting the need to revise the recommended lime and gypsum doses for the region, especially considering the diversity of the soil classes [4]. However, significant differences were observed between the two application methods.
When assessing the impact of surface soil amendment on soil fertility, soybean root development, and grain yield in a tropical region prone to drought, Bossolani et al. [26] concluded that lime, especially when combined with gypsum, improved soil fertility, as evidenced by increases in pH and levels of P, Ca2+ and Mg2+ throughout the soil profile. Carmeis Filho et al. [27] found that the classical liming recommendation based on the 0–20 cm layer is an underestimated approach for stable systems under no-tillage, with crop rotation and high input of crop residues throughout the agricultural year. This approach leads to an increased rate of lime application to increase the base saturation to 70%, as recommended for soybeans.
There was no significant interaction between lime and gypsum application methods and sampling depth for pH, Al3+, Ca2+, and Mg2+, indicating that both methods performed similarly. However, incorporating lime and gypsum yielded more pronounced results, increasing pH, Ca2+, and Mg2+ levels while reducing Al3+ across the soil profile. Thus, surface application was less effective at improving the chemical attributes of the soil during the study period. These results corroborated the findings reported by Rheinheimer et al. [28,29], highlighting the importance of incorporating lime to improve soil chemical conditions. The improvement in chemical attributes promoted by the incorporation of lime favored the deepening of the soybean root system, providing better conditions for deep root growth. This is crucial, especially during periods of water stress such as dry spells [30,31,32]. In fact, soil amendments can considerably increase drought tolerance by correcting soil acidity, increasing root growth, and improving nutrient availability [27,33].
In general, both P and K+ reached the 20–40 cm layer when lime and gypsum were incorporated, which did not occur with surface application (Table 1). The dynamics of P were influenced by precipitation with Al3+ in the soil, especially in the area with surface liming, and precipitation with Ca2+ in the top layer where lime and gypsum were concentrated [34]. Additionally, for both elements, it is possible that the greater growth of the root system, both from soybean in the first crop and Brachiaria used as a cover crop, contributed to transferring these elements to deeper soil layers.
Another important aspect to consider is the reduction in organic matter levels in all layers of the soil profile in the area using the incorporation method. This effect can be attributed to aggregate disruption by tillage, which exposes organic carbon and accelerates its decomposition [30] and also contributes to a decrease in CEC. This is more commonly observed in sandy soils, whose CEC strongly depends on organic matter [35].
In summary, the evaluation of soil chemical attributes showed that incorporated lime and gypsum promoted an increase in pH and a reduction in exchangeable Al3+ and increased the availability of Ca2+, Mg2+, P, and K+. There was also a reduction in Al3+saturation, an increase in the sum of bases, and an increase in base saturation, while organic matter slightly decreased. These results demonstrated that converting areas with high acidity and Al3+ toxicity requires the incorporation of lime principally. They also underscored the importance of implementing management practices that increase organic matter levels over time, such as adopting no-tillage with year-round soil cover.
All cultivars showed adequate numbers of nodules, with cultivar M 5917 IPRO exhibiting the highest nodulation. This result was corroborated by [36], who reported that a soybean plant with at least 15 nodules and 100 mg of dry nodule mass at the early flowering stage met the conditions necessary to satisfy its nitrogen requirements. Although BNF was not quantified, adequate nodulation of plants, greater nitrogen accumulation in the aerial parts of the plants (approximately 30% higher in the area with incorporated lime and gypsum), and good grain yield indicated that BNF was efficient, even in soils with low organic matter [10]. Lime and gypsum application, alone or in combination, improved soil fertility and enhanced nitrogen fixation in a tropical no-tillage intercropping system, thereby increasing the maize yield and plant nitrogen uptake [37].
The higher emission of secondary roots from soybean plants in the area by incorporating lime and gypsum indicated better soil chemical conditions, facilitating root exploration [15,38]. This condition was crucial for the absorption of water and nutrients, considering that the surface application of lime and gypsum did not neutralize the high Al3+ content, hindering root growth and aerial biomass (Joris et al. 2013). The improvement of plant root development led to better overall plant growth, with a higher accumulation of Ca2+, Mg2+, K+, P, and N in the aerial parts. This effect has also been reported for soil amendments using lime and gypsum [37,38,39].
The lime and gypsum application methods also influenced soybean production components such as the number of pods per plant and average grain weight. The incorporation method resulted in nearly twice the number of pods per plant with a higher grain yield by improving soil conditions, corroborating previous results [40].
Furthermore, it is important to note that the low rainfall recorded in January 2022 may have contributed to the reduction in grain yield [41], especially in the area with the surface application, where the number of secondary roots was the lowest. The observed difference in grain yield among soybean cultivars may be attributed to better adaptation to soil and climate conditions and interactions between liming and gypsum methods application and local characteristics, such as latitude and altitude.
4. Materials and Methods
4.4. Local Area and Pre-Planting Procedures
This study was conducted during the 2021/2022 growing season (October to February) in an area that had been established for the 2020/2021 season, located at the private farm called Abadia in the municipality of Campos dos Goytacazes, Rio de Janeiro State (21°43’84’’S, 41°12’63’’W, 11 m a.s.l.). The area that had been cultivated with sugarcane in the past has been covered with pasture, primarily Brachiaria spp., over the last 10–15 years. The soil was classified as a typical dystrophic Fluvisol with a medium-sandy texture and the arable soil layer has a sandy texture (Santos et al. 2018). The chemical and granulometric analyses [42] conducted before the experiment (Table 4) revealed strong acidity and extremely low levels of nutrients and organic matter.
The experiment utilized a strip-plot design with two main strips of approximately 70 × 70 m, in 2020. In May, the first plot was plowed to a depth of approximately 20 cm, followed by broadcasting 1 t ha-1 of dolomitic lime and 0.5 t ha−1 of gypsum, with a subsequent plowing to the same depth. In the second plot, the same amounts of lime and gypsum were applied without incorporation into the soil.
Lime and gypsum application rates were calculated according to the soil’s exchangeable Al3+ levels and the crop’s calcium and magnesium needs, based on regional recommendations in the Lime and Fertilization Manual for Rio de Janeiro State [25]. The lime was composed of 30% calcium oxide (CaO) and 10% magnesium oxide (MgO) with an effective neutralizing value of 76%.
One month later, Brachiaria ruziziensis was sown in both the plots, followed by light disking to cover the seeds. At the beginning of October 2020, the grasses in both plots were desiccated with glyphosate at a rate of 2 L ha-1 (product basis). After 10 days, different soybean genotypes were sown in both plots to identify the crop adaptation to the region. The soybean seeds were inoculated with the recommended strains of Bradyrhizobium in a dose of approximately 1.2–1.5 million colony-forming units (CFU) per seed. Planting fertilization was a mixture of 100 kg ha−1 of P2O5 and 80 kg ha−1 of K2O, using single superphosphate and potassium chloride as sources, along with 50 kg ha−1 of FTE BR-12 (containing approx. 3.0% S, 1.8% B, 0.8% Cu, 3.0% Fe, 2.0% Mn, 0.1% Mo, and 9.0% Zn). Soybeans were harvested in March 2021, leaving residues on the soil.
4.2. Experiment Set Up
For the evaluation in this study, an experiment was conducted during the 2021/2022 growing season, considering soil management in the previous season. This involved comparing two liming and gypsum applying methods, surface application and soil incorporation, which were carried out in 2020.
In May 2021, Brachiaria ruziziensis was sown again in both main plot areas, followed by light disking to cover the seeds with the soil. At the beginning of October 2021, the grass was desiccated with glyphosate at a rate of 2 L ha−1. Subsequently, within each of these main strips, which received distinct lime and gypsum management treatments, four different soybean cultivars were arranged in subplots for evaluation, with 3 m in width. The row spacing was set at 0.50 m, with six rows per soybean cultivar. Before planting, the soybean seeds were inoculated with inoculants containing the two recommended Bradyrhizobium strains (a mix of strains SEMIA 5079 and BR 29). Approximately 6–7 doses of inoculants per hectare were used, providing a cell concentration of about 1.5 to 2 million CFU per soybean seed. Additionally, 100 mL ha−1 at concentration 108 of Azospirillum brasilense inoculant (strains AbV-5 and AbV-6) was applied to the seeds, following the manufacturer’s recommendation. Fertilization was carried out by applying 500 kg ha−1 of single superphosphate, 130 kg ha−1 of potassium chloride, and 50 kg ha−1 of FTE BR-12 as a source of micronutrients. The transgenic soybean cultivars BRS 5980 IPRO, BRS 7981 IPRO, 95R95 IPRO, and M5917 IPRO were cultivated under field conditions. The sowing density (seeds per hectare) was 240,000 for BRS 7981 IPRO, and 320,000 for the others, in accordance with the agronomic guidelines specific to each genotype. These differences in population density were maintained to reflect optimal management practices for each cultivar, as commonly adopted in commercial production. Sowing was performed under rain-fed conditions, starting with the first rain on October 26, 2021. The crop management followed the recommendations of EMBRAPA [43].
According to data from the National Institute of Meteorology (https://bdmep.inmet.gov.br), the average maximum and minimum temperatures were 31.2 °C and 21.5 °C, resulting in a thermal amplitude of approximately 10 °C during the experimental period. The accumulated rainfall data, by 10-day periods throughout the experiment, are shown in Table 5.

Table 5.
Accumulated rainfall per decade (NATIONAL INSTITUTE OF METEOROLOGY (INMET), 2022) for the municipality of Campos dos Goytacazes-RJ.
Table 5.
Accumulated rainfall per decade (NATIONAL INSTITUTE OF METEOROLOGY (INMET), 2022) for the municipality of Campos dos Goytacazes-RJ.
| Month | Days | |||
| 1–10 | 11–20 | 21–30 | ||
| Precipitation (mm) | Total | |||
| Oct | 35 | 196 | 74 | 305 |
| Nov | 0 | 40 | 74 | 114 |
| Dec | 13 | 75 | 0 | 88 |
| Jan | 155 | 0 | 18 | 173 |
| Feb | 138 | 60 | 22 | 220 |
| Mar | 0 | 0 | 22 | 22 |
| Total | 341 | 371 | 210 | 922 |
4.3. Soil Samples and Chemical Analyses
Soil samples for chemical analyses were collected at depths of 0–10, 10–20 and 20–40 cm during the vegetative stage of the soybean crop and before the onset of flowering (approximately 40–45 days after sowing, R1). Soil samples were collected only from the plots cultivated with BRS 5980 IPRO, in both main plots with and without lime and gypsum application. Within each plot, sampling was performed at two positions: between plants in the second planting row and in the inter-row space between the second and third rows. Three sampling points were taken along the planting rows, spaced approximately 15–20 m apart linearly. The levels of Ca2+, Mg2+, K+, P, pH, Al3+, potential acidity (H + Al), organic carbon, the sum of exchangeable bases (S), base saturation (V%), and aluminum saturation (m%) were determined. The average values of row and inter-row samples were used for nutrient content calculations. The soil chemical analyses were performed following standard soil testing procedures, including: pH measured in water; Ca2+ and Mg2+ extracted using a saline solution and quantified by atomic absorption spectrophotometry; K+ extracted with Mehlich-1 solution and determined using a flame photometer; P extracted with Mehlich-1 solution and quantified by spectrophotometry; Al3+ extracted with a saline solution and determined by titration with NaOH; and soil organic matter (SOM) estimated using the Walkley–Black method (Silva et al. 2009).
4.4. Per-Plant Evaluation Performance and Cultivar Grain Yield
To evaluate per-plant performance, five consecutive plants were sampled from the second row of each plot, for each cultivar, on the same day as soil collection. Five sampling points were taken along the planting rows, spaced approximately 15–20 m apart linearly. Roots and shoots were separated and analyzed individually. By maintaining consistent sampling across cultivars (i.e., the same number of plants per plot), we ensured that comparisons were made at the individual plant level, to characterize cultivar-specific physiological responses under their respective recommended planting conditions. Nodules were detached from the roots, and the roots, nodules, and plant shoots were subsequently dried in a forced-air oven at 65 °C for 72 hours. Chemical analyses were performed to estimate the nutrient content of the shoots following the methodology of EMBRAPA [44]. The nitrogen content was determined using a Vario Macro Cube C and N autoanalyzer (Elementar, Langenselbold, Germany) in the laboratory of EMBRAPA Agrobiology.
Approximately 70 days after planting (early R6 reproductive soybean growth stage), root samples were collected to evaluate root dry mass, following the previous sampling strategy with five plants and five replicates. The collection was performed using a flat spade, by making cuts 15 cm away from each side of the plants and removing the entire soil layer from 0 to 20–25 cm depth, ensuring that all roots within this profile were collected. Later, at harvest (R8 stage), five plants from each cultivar were sampled to determine the number of pods and the weight of 100 grains, with five replicates. Four samples were taken from each of the central rows in each plot, representing 3 m a length and a usable area of 3.0 m2 per sample, to determine grain yield (13% moisture).
4.5. Statistical Analysis
Statistical analyses were performed using the R package (http://www.R project.org). The experiment followed a strip-plot design, with lime and gypsum management (two levels) as the main plot factor and cultivar (four levels) as the subplot factor. Data were subjected to analysis of variance (ANOVA) at the 5% probability level, assuming the assumptions of normality and homogeneity of variances. Data of pH, Ca+2, K+, P and S were transformed using the square root of (Y), nodule dry mass was transformed using the square root of (Y + 100), root dry mass using log(Y) and root dry matter and number of secondary roots using the Box–Cox method. Means were compared using Tukey’s test at the 5% probability level.
5. Conclusions
In summary, soybean performance improved more with the incorporation of lime and gypsum than with surface application. Incorporation led to higher soil pH, reduced Al3+ toxicity, and improved nutrient availability, which enhanced root development, especially secondary root growth, and increased nodule biomass, both critical for effective nitrogen fixation and accumulation. These benefits were consistent across cultivars, with differences observed among them in nodulation, root biomass, and shoot biomass; however, the incorporation of lime and gypsum improved results regardless of the cultivar, leading to better nodulation, enhanced nutrient uptake, a greater number of pods, higher grain weight, and ultimately increased yields. Thus, incorporating lime and gypsum is a valuable practice for boosting soybean growth and productivity, directly enhancing soil conditions, root development, and biological nitrogen fixation. These findings highlight the importance of soil amendment incorporation for improving crop performance in degraded or nutrient-limited soils beyond this regional context.
Author Contributions
Conceptualization, P.P.R., J.N.B., R.F.G. and J.E.Z.; methodology, P.P.R., J.N.B., R.F.G. C.P.J., B.J.R.A., and J.E.Z.; formal analysis, P.P.R., J.N.B., R.F.G., E.S.A.L., B.F.S.F., C.P.J., B.J.R.A., S.U., J.E.Z., data curation, P.P.R., E.S.A.L., C.P.J., and J.E.Z.; writing—original draft preparation, P.P.R., J.N.B., C.P.J., and J.E.Z.; writing—review and editing, all authors; funding acquisition, J.E.Z., C.P.J., B.J.R.A. and S.U. All authors have read and agreed to the published version of the manuscript.
Funding
This work was funded by the Brazilian Agricultural Research Corporation (Embrapa); the National Institute of Science and Technology—INCT: Biotechnological innovations with microorganisms for a productive and sustainable agriculture” (CNPq 408267/2024, Fundação Araucária); the Brazilian National Council for Scientific and Technological Development (CNPq), through Productivity Grants awarded to some of the researchers; the Carlos Chagas Filho Foundation for Research Support of the State of Rio de Janeiro (FAPERJ), through projects E-26/201.074/2022 and E-26/210.303/2021; and the FNDCT/CT-AGRO/FINEP, through Cooperation Agreement 01.22.0080.00 (Ref. 1219/21). Additional support was provided by CNPq (Process 405968/2022-1).
Data Availability Statement
Data are available from the corresponding author upon reasonable request.
Acknowledgments
The authors would like to thank the Federal Rural University of Rio de Janeiro (UFRRJ) and Embrapa Agrobiologia for institutional support. We also acknowledge the contributions of the INCT–INCT: Biotechnological innovations with microorganisms for a productive and sustainable agriculture” (CNPq 408267/2024, Fundação Araucária). The support from CNPq (Process 405968/2022-1) is also gratefully acknowledged. During the preparation of this manuscript/study, the authors used ChatGPT 5.0 and M365Copilot to review the writing.
Conflicts of Interest
The authors declare no conflicts of interest.
References
- Bordonal, R. de O.; Carvalho, J.L.N.; Lal, R.; de Figueiredo, E.B.; de Oliveira, B.G.; La Scala, N. Sustainability of Sugarcane Production in Brazil. A Review. Agron. Sustain. Dev. 2018, 38.
- Seliger, R.; Sattler, D.; Soares da Silva, A.; da Costa, G.C.P.; Heinrich, J. Rehabilitation of Degraded Sloped Pastures: Lessons Learned in Itaocara, Rio de Janeiro. In; 2019.
- CONAB - Companhia nacional de abastecimento Informações Agropecuárias., Série Histórica Das Safras. Soja. https://www.conab.gov.br/info-agro/safras/serie-historica-das-msafras/itemlist/category/911-soja. accessed on 19-01-2025 2024.
- Zilli, J.E.; Polidoro, J.C.; Alves, B.J.R.; Lumbreras, J.F. Produção Da Soja e Do Milho Como Um Caminho Para o Desenvolvimento Do Agronegócio Da Região Norte Fluminense. Embrapa Solos, RJ. Documentos 323. https://www.embrapa.br/busca-de-publicacoes/-/publicacao/1130852/a-producao-da-soja-e-do-milho-como-um-caminho-para-o-desenvolvimento-do-agronegocio-da-regiao-norte-fluminense. Accessed on 17-11-2025. 2021.
- Zilli J. E.; Batista J. N.; Guareschi, R.F.; Zito, R.K. Avaliação de Cultivos de Soja No Norte Fluminense. Embrapa Agrobiologia, RJ. Documento 323. https://ainfo.cnptia.embrapa.br/digital/bitstream/doc/1147196/1/Avaliacao-de-cultivos-de-soja-no-Norte-Fluminense.pdf. Accessed on 24-10-2025 2022.
- Tasistro, A.; Camas-Gómez, R.; Ortiz-Monasterio, I. Gypsum and Potassium Application to Acid Soils for Maize (Zea Mays L.) Production in La Frailesca, Chiapas, Mexico. Agronomia Mesoamericana 2022, 33. [CrossRef]
- McLay, C.D.A.; Ritchie, G.S.P.; Porter, W.M.; Cruse, A. Amelioration of Subsurface Acidity in Sandy Soils in Low Rainfall Regions. II.* Changes to Soil Solution Composition Following the Surface Application of Gypsum and Lime. Australian Journal of Soil Research 1994, 32. [CrossRef]
- Minato, E.A.; Brignoli, F.M.; Neto, M.E.; Besen, M.R.; Cassim, B.M.A.R.; Lima, R.S.; Tormena, C.A.; Inoue, T.T.; Batista, M.A. Lime and Gypsum Application to Low-Acidity Soils: Changes in Soil Chemical Properties, Residual Lime Content and Crop Agronomic Performance. Soil Tillage Res. 2023, 234. [CrossRef]
- Caires, E.F.; Joris, H.A.W.; Churka, S. Long-Term Effects of Lime and Gypsum Additions on No-till Corn and Soybean Yield and Soil Chemical Properties in Southern Brazil. Soil Use Manag. 2011, 27. [CrossRef]
- Zilli, J.É.; Pacheco, R.S.; Gianluppi, V.; Smiderle, O.J.; Urquiaga, S.; Hungria, M. Biological N2 Fixation and Yield Performance of Soybean Inoculated with Bradyrhizobium. Nutr. Cycl. Agroecosyst. 2021, 119. [CrossRef]
- Hungria, M.; Mendes, I.C. Nitrogen Fixation with Soybean: The Perfect Symbiosis? In Biological Nitrogen Fixation; 2015; Vol. 2–2.
- Telles, T.S.; Nogueira, M.A.; Hungria, M. Economic Value of Biological Nitrogen Fixation in Soybean Crops in Brazil. Environ. Technol. Innov. 2023, 31. [CrossRef]
- Alves, B.J.R.; Zotarelli, L.; Marques Fernandes, F.; Heckler, J.C.; Tavares De Macedo, R.A.; Boddey, R.M.; Jantalia, C.P.; Urquiaga, S. Biological Nitrogen Fixation and Nitrogen Fertilizer on the Nitrogen Balance of Soybean, Maize and Cotton. Pesqui. Agropecu. Bras. 2006, 41. [CrossRef]
- Ricardo Gomes Bezerra Alex Marcel Melotto Douglas de Castilho Gitti José Fernando Jurca Grigolli Diagramação, A.; Lombardi Wanser Damares Pereira dos Santos, K. Editores André Luis Faleiros Lourenção 2018.
- Li, Y.; Cui, S.; Chang, S.X.; Zhang, Q. Liming Effects on Soil PH and Crop Yield Depend on Lime Material Type, Application Method and Rate, and Crop Species: A Global Meta-Analysis. J. Soils Sediments 2019, 19. [CrossRef]
- Gatiboni, L.C.; Saggin, A.; Brunetto, G.; Horn, D.; Flores, J.P.C.; Rheinheimer, D. dos S.; Kaminski, J. Alterações Nos Atributos Químicos de Solo Arenoso Pela Calagem Superficial No Sistema Plantio Direto Consolidado. Ciência Rural 2003, 33. [CrossRef]
- Petrere, C.; Anghinoni, I. Alteração de Atributos Químicos No Perfil Do Solo Pela Calagem Superficial Em Campo Nativo. Rev. Bras. Cienc. Solo 2001, 25. [CrossRef]
- Kaminski, J.; Santos, D.R. dos; Gatiboni, L.C.; Brunetto, G.; Silva, L.S. da Eficiência Da Calagem Superficial e Incorporada Precedendo o Sistema Plantio Direto Em Um Argissolo Sob Pastagem Natural. Rev. Bras. Cienc. Solo 2005, 29. [CrossRef]
- Castro, G.S.A.; Crusciol, C.A.C. Effects of Surface Application of Dolomitic Limestone and Calcium-Magnesium Silicate on Soybean and Maize in Rotation with Green Manure in a Tropical Region. Bragantia 2015, 74. [CrossRef]
- Shruthi; Prakash, N.B.; Dhumgond, P.; Goiba, P.K.; Laxmanarayanan, M. The Benefits of Gypsum for Sustainable Management and Utilization of Acid Soils. Plant Soil 2024, 504.
- De Moraes, E.R.; Mageste, J.G.; Lana, R.M.Q.; Torres, J.L.R.; Domingues, L.A.D.S.; Lemes, E.M.; De Lima, L.C. Sugarcane Root Development and Yield under Different Soil Tillage Practices. Rev. Bras. Cienc. Solo 2019, 43. [CrossRef]
- de Campos, M.; Rossato, O.B.; Marasca, I.; Martello, J.M.; de Siqueira, G.F.; Garcia, C.P.; Rossetto, R.; Calonego, J.C.; Cantarella, H.; Crusciol, C.A.C. Deep Tilling and Localized Liming Improve Soil Chemical Fertility and Sugarcane Yield in Clayey Soils. Soil Tillage Res. 2022, 222. [CrossRef]
- Oliveira Junior, A.; Castro, C.; Oliveira, F.A.; Klepker, D. Fertilidade Do Solo e Avaliação Do Estado Nutricional Da Soja. In Tecnologias de produção de soja; Seixas, C.D.S., Neumaier, N., Balbinot Junior, A.A., Krzyzanowski, F.C., Leite, R.M.V.B.C., Eds.; Embrapa Soja: Londrina, PR, Brazil, 2020; pp. 347–379.
- Reis, A.R. dos; Lisboa, L.A.M.; Reis, H.P.G.; Barcelos, J.P. de Q.; Santos, E.F.; Santini, J.M.K.; Venâncio Meyer-Sand, B.R.; Putti, F.F.; Galindo, F.S.; Kaneko, F.H.; et al. Depicting the Physiological and Ultrastructural Responses of Soybean Plants to Al Stress Conditions. Plant Physiology and Biochemistry 2018, 130. [CrossRef]
- Freire, L.R.; Campos, D.V.B.; Lima, E.; Zonta, E.; Balieiro, F. de C.; Guerra, J.G.M.; Polidoro, J.C.; dos Anjos, L.H.C.; Leal, M.A. de A.; Pereira, M.G.; et al. Manual de Calagem e Adubação Do Estado Do Rio de Janeiro; Embrapa; Universidade Rural: Brasília, DF; Seropédica, RJ, Brazil, 2013; ISBN 9788570351821.
- Bossolani, J.W.; Crusciol, C.A.C.; Moretti, L.G.; Garcia, A.; Portugal, J.R.; Bernart, L.; Vilela, R.G.; Caires, E.F.; Amado, T.J.C.; Calonego, J.C.; et al. Improving Soil Fertility with Lime and Phosphogypsum Enhances Soybean Yield and Physiological Characteristics. Agron. Sustain. Dev. 2022, 42. [CrossRef]
- Carmeis Filho, A.C.A.; Crusciol, C.A.C.; Castilhos, A.M. Liming Demand and Plant Growth Improvements for an Oxisol under Long-Term No-till Cropping. Journal of Agricultural Science 2017, 155. [CrossRef]
- Rheinheimer, D. dos S.; Santos, E.J. da S.; Kaminski, J.; Xavier, F.M. Aplicação Superficial de Calcário No Sistema Plantio Direto Consolidado Em Solo Arenoso. Ciência Rural 2000, 30. [CrossRef]
- Rheinheimer, D.S.; Santos, E.J.S.; Kaminski, J.; Bortoluzzi, E.C.; Gatiboni, L.C. Alterações de Atributos Do Solo Pela Calagem Superficial e Incorporada a Partir de Pastagem Natural. Rev. Bras. Cienc. Solo 2000, 24. [CrossRef]
- Alleoni, L.R.F.; Cambri, M.A.; Caires, E.F. Chemical Attributes of a Cerrado Oxisol under No-Tillage as Affected by Lime Application Methods and Doses. Rev. Bras. Cienc. Solo 2005, 29. [CrossRef]
- Bortoluzzi, E.C.; Parize, G.L.; Korchagin, J.; Silva, V.R. da; Rheinheimer, D. dos S.; Kaminski, J. Soybean Root Growth and Crop Yield in Reponse to Liming at the Beginning of a No-Tillage System. Rev. Bras. Cienc. Solo 2014, 38. [CrossRef]
- Joris, H.A.W.; Caires, E.F.; Bini, A.R.; Scharr, D.A.; Haliski, A. Effects of Soil Acidity and Water Stress on Corn and Soybean Performance under a No-till System. Plant Soil 2013, 365. [CrossRef]
- Marschner, H. Mechanisms of Adaptation of Plants to Acid Soils. Plant Soil 1991, 134. [CrossRef]
- Meyer, G.; Bell, M.J.; Doolette, C.L.; Brunetti, G.; Zhang, Y.; Lombi, E.; Kopittke, P.M. Plant-Available Phosphorus in Highly Concentrated Fertilizer Bands: Effects of Soil Type, Phosphorus Form, and Coapplied Potassium. J. Agric. Food Chem. 2020, 68. [CrossRef]
- Santos, H.G.; Jacomine, P.K.T.; Anjos, L.H.C.; Oliveira, V.A.; Lumbreras, J.F.; Coelho, M.R.; Almeida, J.A.; Cunha, T.J.F.; Oliveira, J.B. Sistema Brasileiro de Classificação de Solos; 5, Ed.; Embrapa: Brasília, DF, Brazil, 2018;
- Hungria, M.; Franchini, J.C.; Campo, R.J.; Crispino, C.C.; Moraes, J.Z.; Sibaldelli, R.N.R.; Mendes, I.C.; Arihara, J. Nitrogen Nutrition of Soybean in Brazil: Contributions of Biological N 2 Fixation and N Fertilizer to Grain Yield. In Proceedings of the Canadian Journal of Plant Science; 2006; Vol. 86.
- Bossolani, J.W.; Crusciol, C.A.C.; Merloti, L.F.; Moretti, L.G.; Costa, N.R.; Tsai, S.M.; Kuramae, E.E. Long-Term Lime and Gypsum Amendment Increase Nitrogen Fixation and Decrease Nitrification and Denitrification Gene Abundances in the Rhizosphere and Soil in a Tropical No-till Intercropping System. Geoderma 2020, 375. [CrossRef]
- Bossolani, J.W.; Crusciol, C.A.C.; Portugal, J.R.; Moretti, L.G.; Garcia, A.; Rodrigues, V.A.; da Fonseca, M. de C.; Bernart, L.; Vilela, R.G.; Mendonça, L.P.; et al. Long-Term Liming Improves Soil Fertility and Soybean Root Growth, Reflecting Improvements in Leaf Gas Exchange and Grain Yield. European Journal of Agronomy 2021, 128. [CrossRef]
- Viviani, C.A.; Marchetti, M.E.; Vitorino, A.C.T.; Novelino, J.O.; Gonçalves, M.C. Phosphorus Availability in Two Clayey Oxisols and Its Accumulation in Soybean as a Function of the Increase in PH. Ciencia e Agrotecnologia 2010, 34. [CrossRef]
- Fageria, N.K.; Moreira, A.; Castro, C.; Moraes, M.F. Optimal Acidity Indices for Soybean Production in Brazilian Oxisols. Commun. Soil Sci. Plant Anal. 2013, 44. [CrossRef]
- Da Silva, F.C.; de Abreu, M.F.; Pérez, D. V; da Eira, P.A.; de Abreu, C.A.; van Raij, B.; Gianello, C.; Coelho, A.M.; Quaggio, J.A.; Tedesco, M.J.; et al. Métodos de Análises Químicas Para Avaliação Da Fertilidade Do Solo. In Manual de análises químicas de solos, plantas e fertilizantes; Da Silva, F.C., Ed.; Embrapa: Brasília, DF, Brazil, 2009.
- Seixas, C.D.S.; Neumaier, N.; Balbinot Junior, A.A.; Krzyzanowski, F.C.; Leite, R.M.V.B.C. Tecnologias de Produção de Soja; 17, Ed.; Embrapa Soja: Londrina, PR, Brazil, 2020;
- Da Silva F.C.; de Abreu M.F.; Pérez D.V.; da Eira P.A.; de Abreu C.A.; van Raij B.; Gianello C.; Coelho A.M.; Quaggio J.A.; Tedesco M.J.; et al. Métodos de Análises Químicas Para Avaliação Da Fertilidade Do Solo. In Métodos de análises químicas para avaliação da fertilidade do solo; Da SILVA, F.C., Ed.; Embrapa: Brasília, 2009; pp. 107–189.
Figure 1.
Number of pods per soybean plant in an experiment comparing lime and gypsum application methods in Campos dos Goytacazes-RJ, Brazil, during the 2021/2022 season. Identical uppercase letters indicate statistically similar means between cultivars, while lowercase letters denote similarities between lime and gypsum application methods according to the Tukey test at a 5% probability level. Data were log-transformed (log (y)). For the strip-plot design, after transformation, the coefficients of variation were CV1 = 3.8%, CV2 = 4.6%, and CV3 = 5.9%.
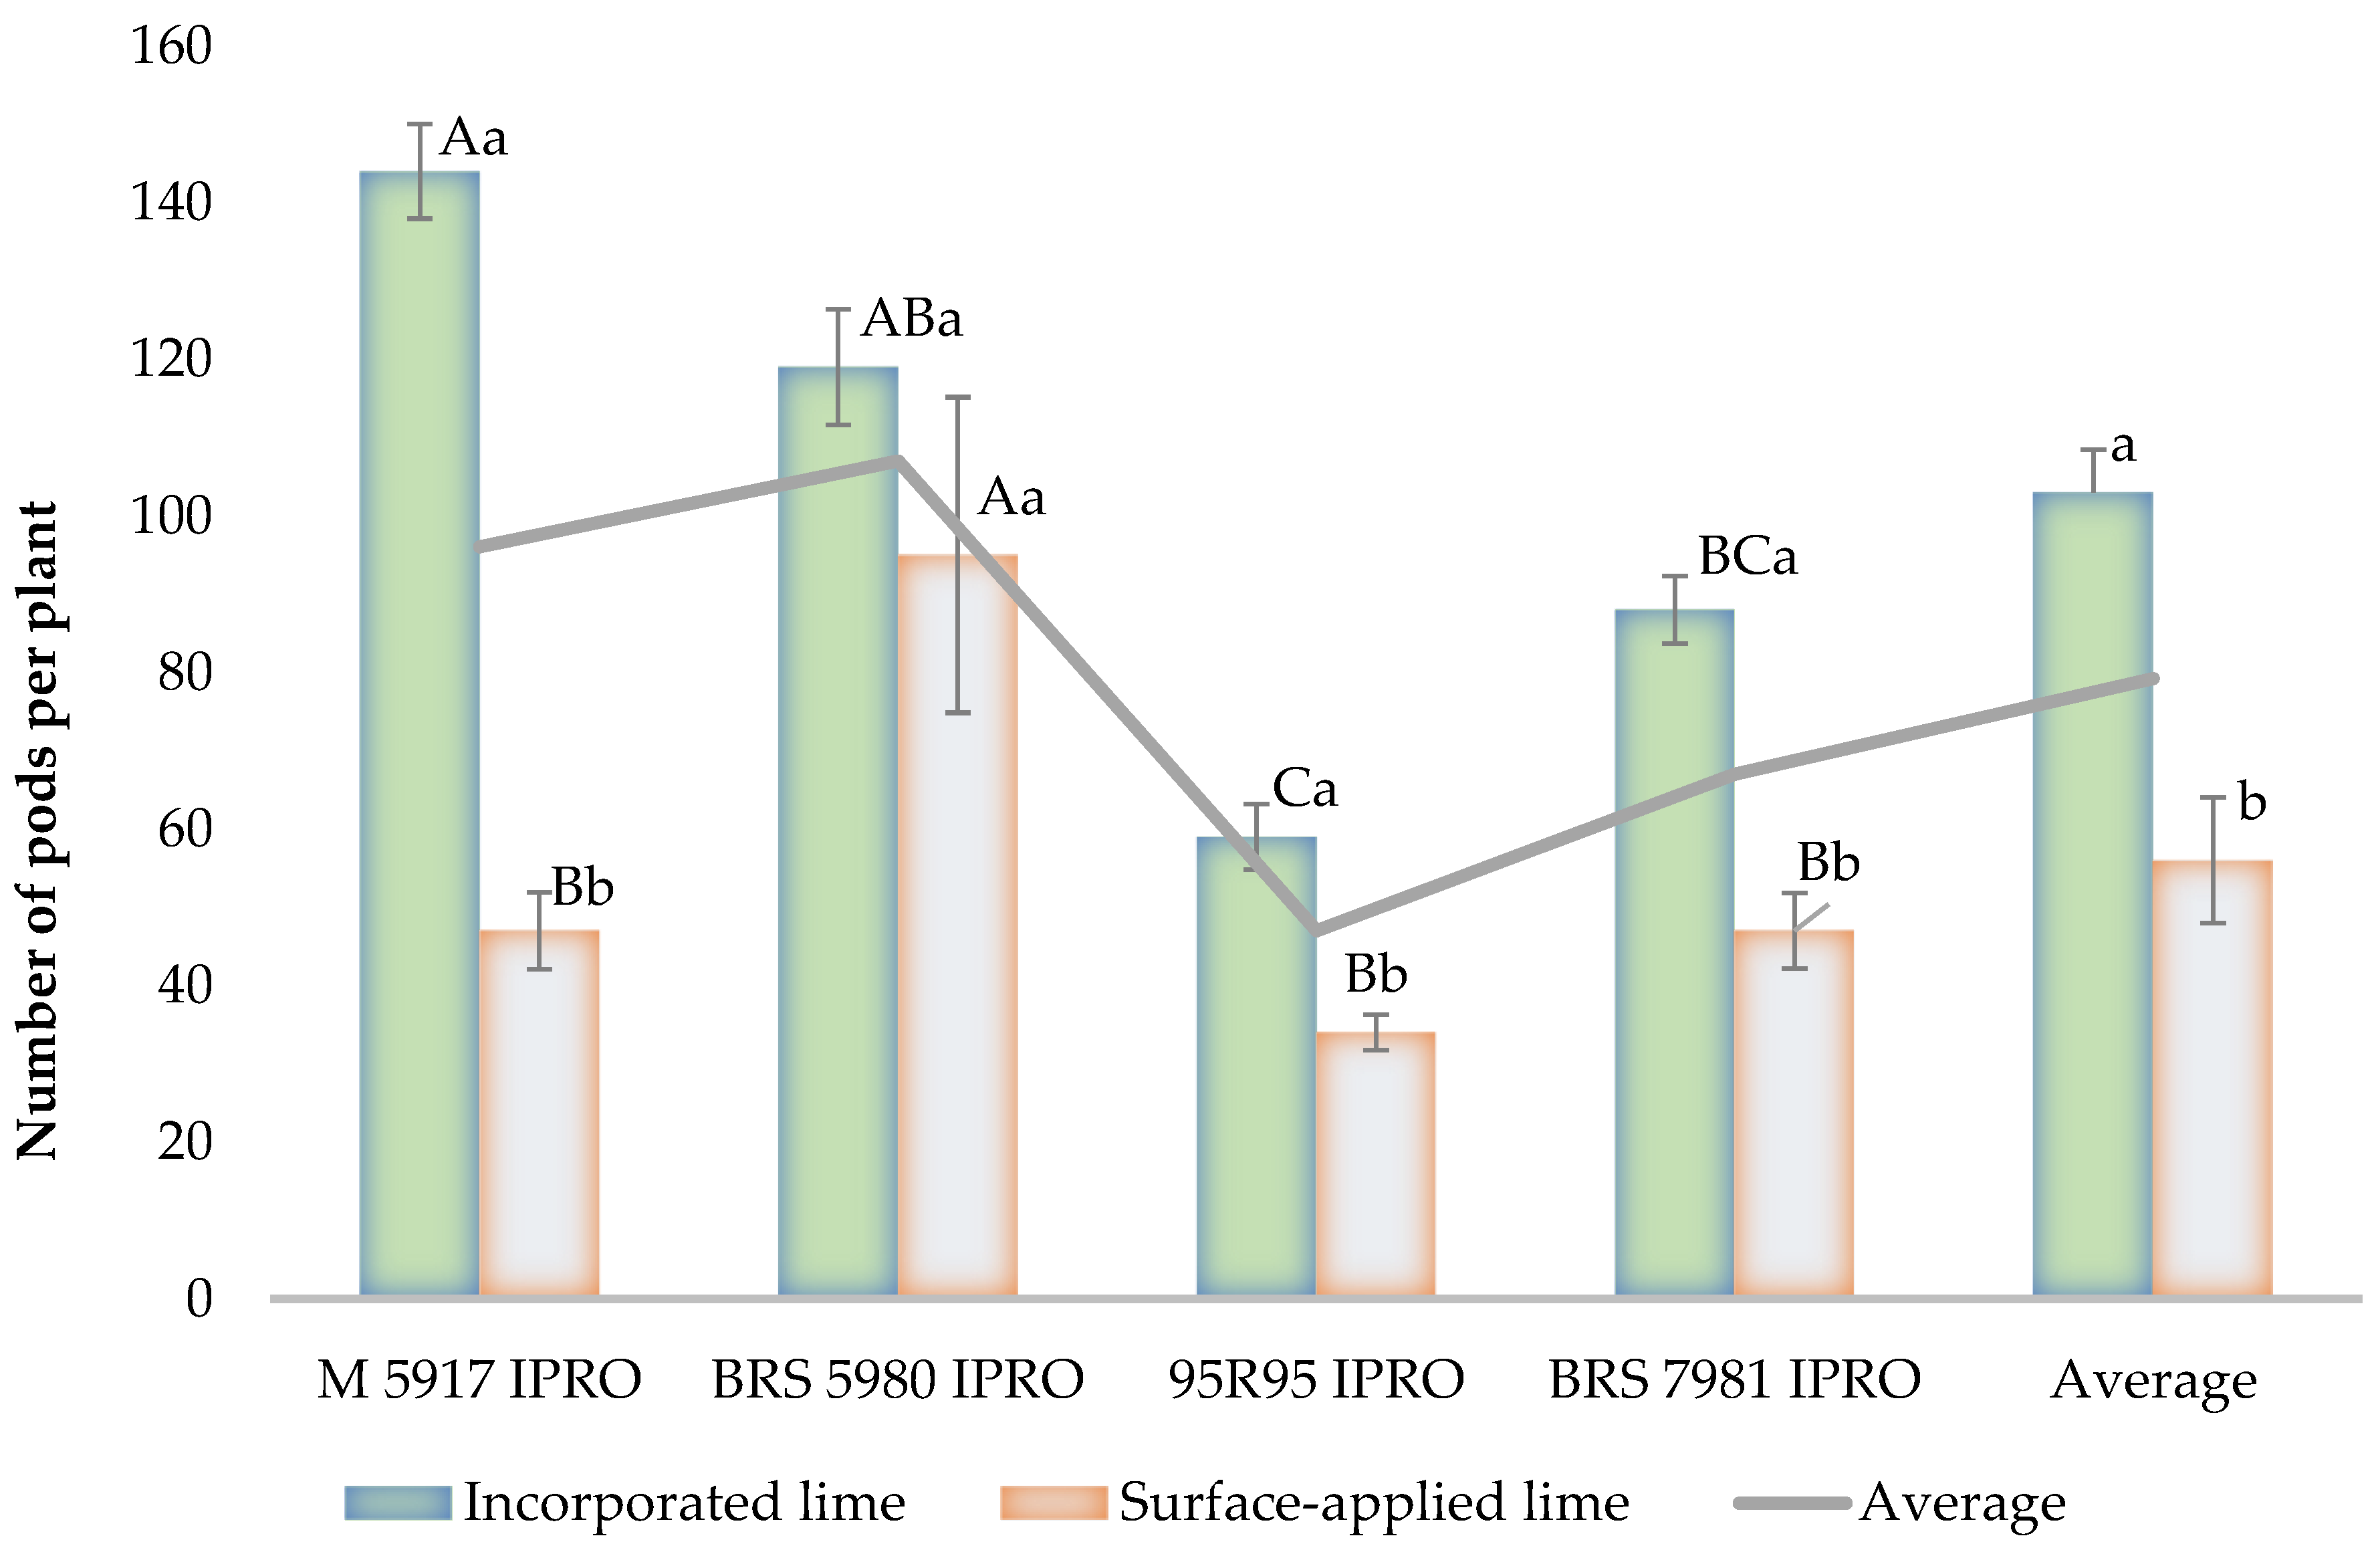
Figure 2.
Weight of 100 grains and grain yield in an experiment comparing liming + gypsum methods in Campos dos Goytacazes, RJ, Brazil, during the 2021/2022 Season. Identical uppercase letters indicate statistically similar means between cultivars for the same variable, while lowercase letters indicate similarities between liming + gypsum methods, as determined by the Tukey test at a 5% probability level. For the strip-plot design, the coefficients of variation were as follows: for the weight of 100 grains, CV1 = 7.4%, CV2 = 8.0%, and CV3 = 6.0%; and for grain yield, CV1 = 21.2%, CV2 = 26.3%, and CV3 = 11.1%.
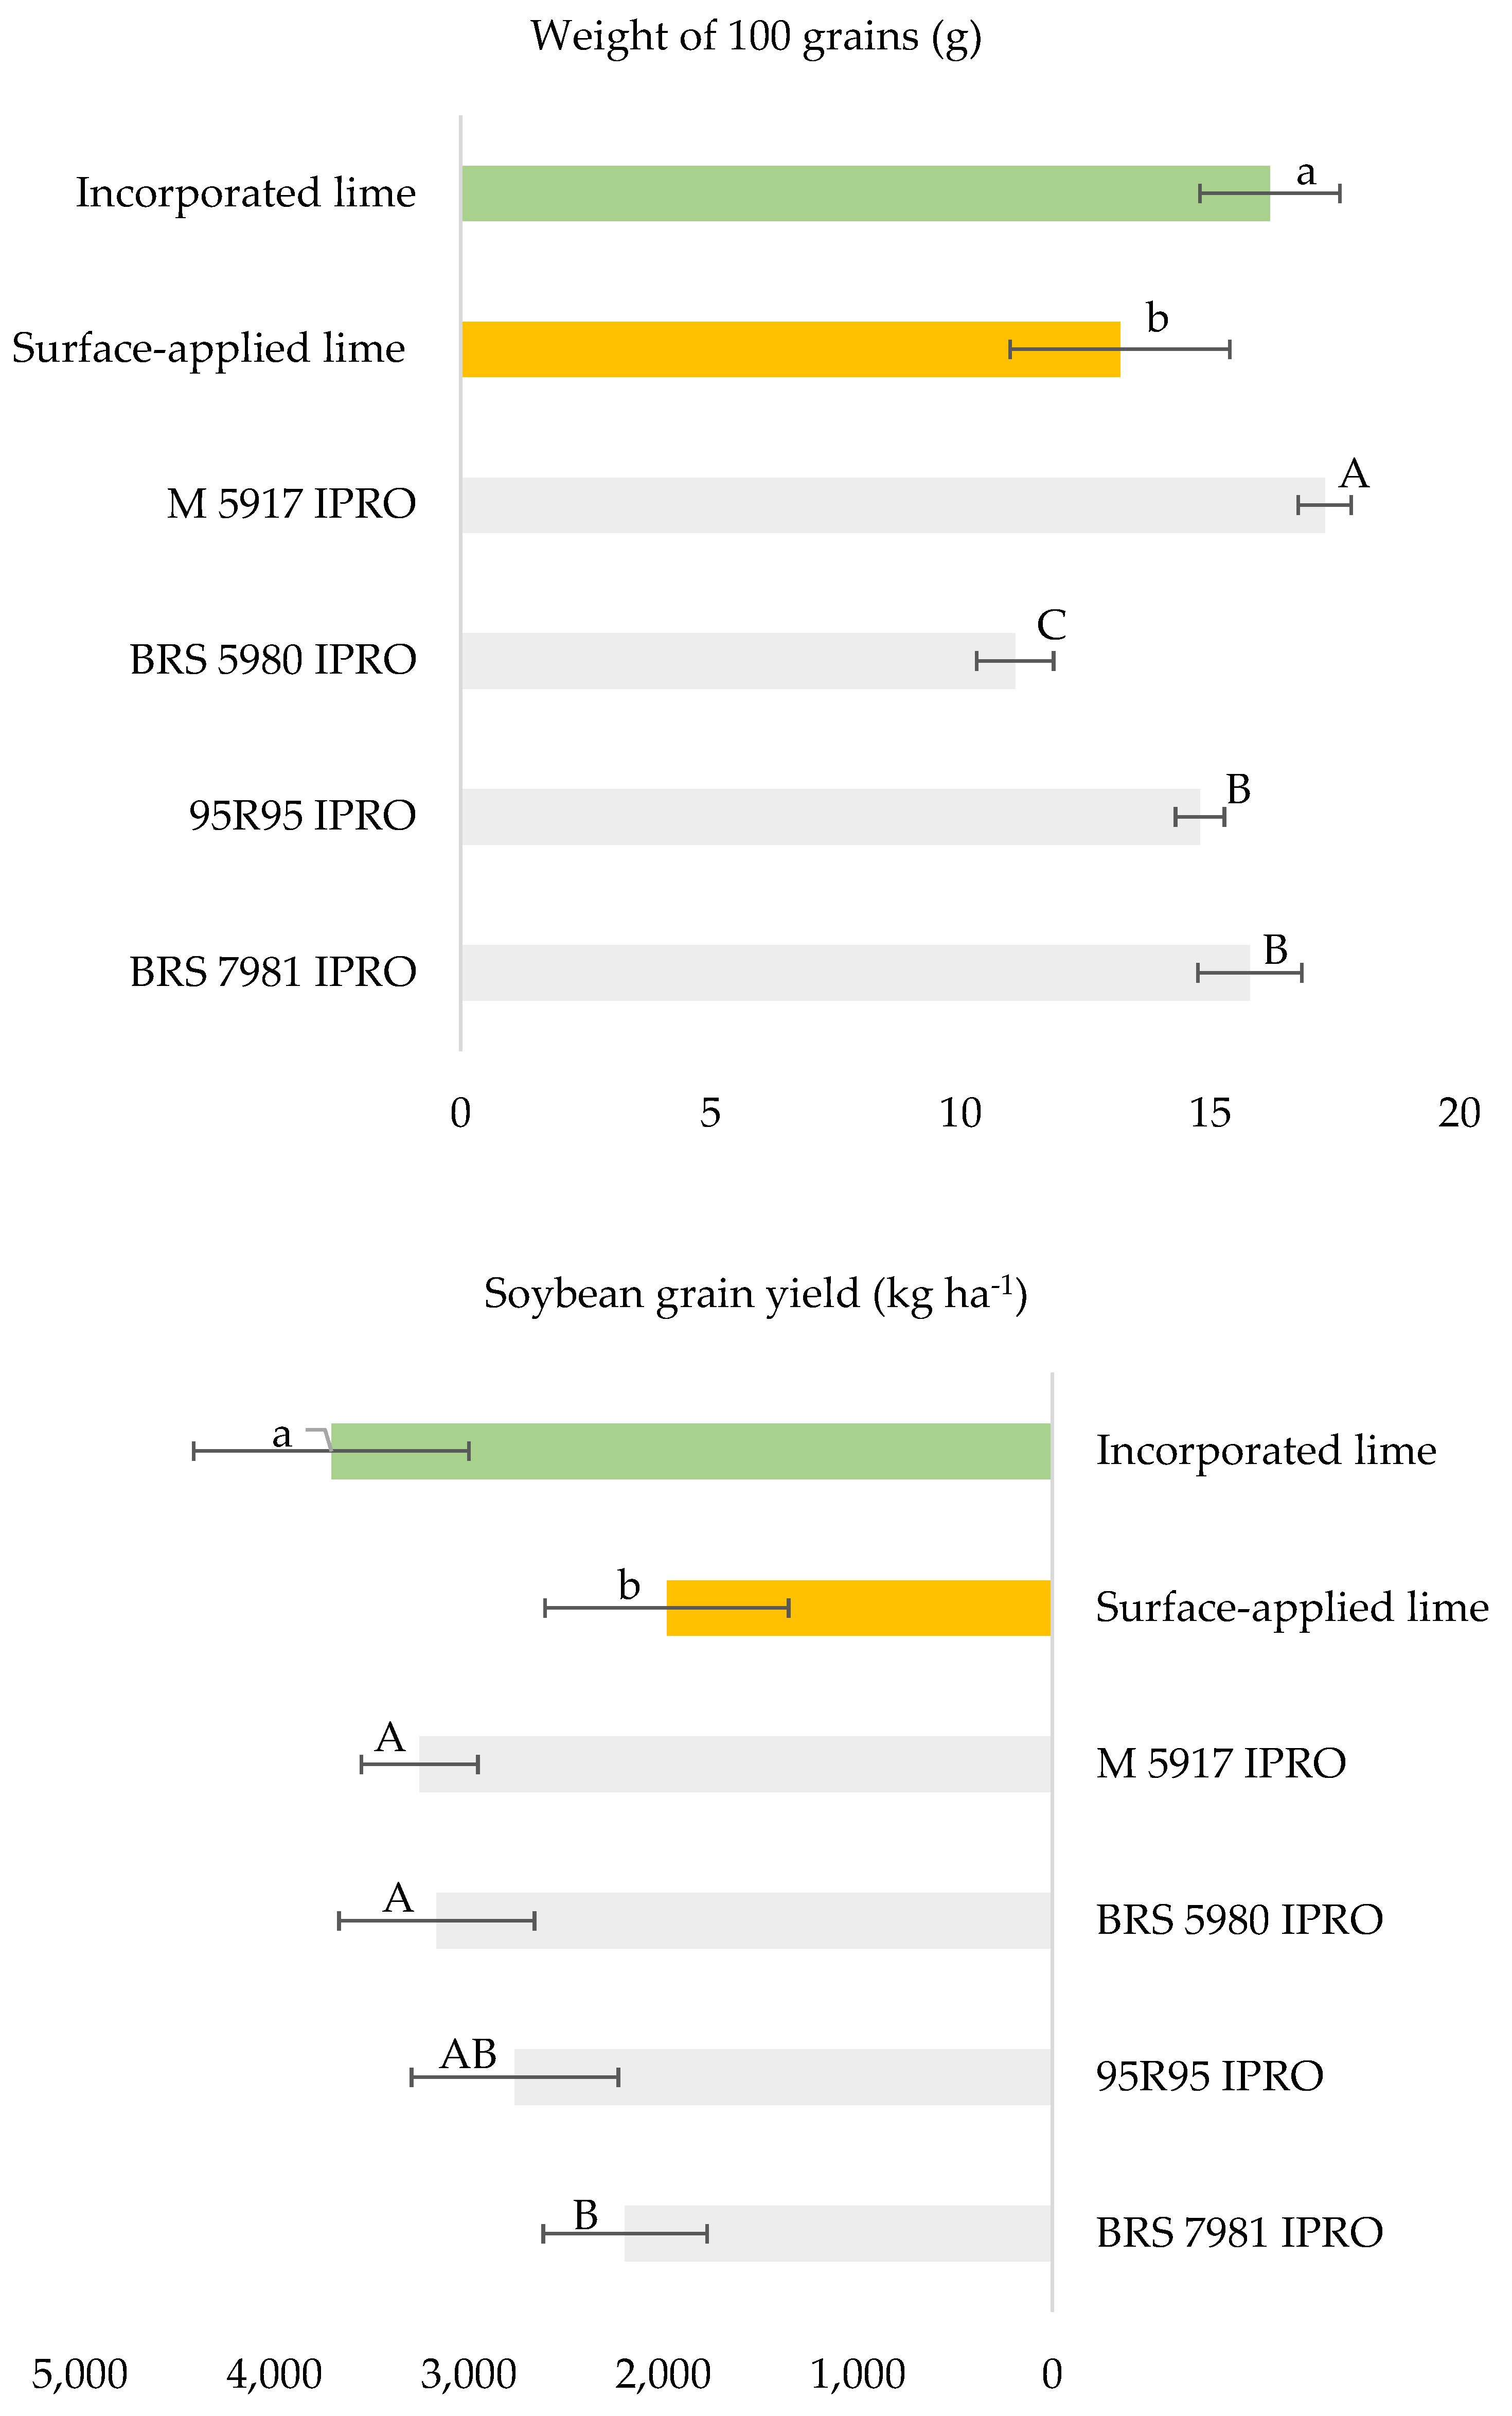
Table 1.
Soil chemical characterization in an experiment comparing lime and gypsum application methods in soil cultivated with soybeans in Campos dos Goytacazes-RJ, 2021/2022 crop season.
Table 1.
Soil chemical characterization in an experiment comparing lime and gypsum application methods in soil cultivated with soybeans in Campos dos Goytacazes-RJ, 2021/2022 crop season.
| Variable | Liming form | Depth (cm) | Average |
(CV) (%) |
|||
| 0-10 | 10-20 | 20-40 | |||||
| pH | Incorporated* | 4.85 | 4.85 | 4.78 | 4.83 a | 7.99 | |
| Surface | 4.27 | 4.38 | 4.26 | 4.30 a | 2.28 | ||
| Average | 4.56 A | 4.62 A | 4.52 A | 1.93 | |||
| Al3+ | cmolc dm-3 | Incorporated* | 0.49 | 0.44 | 0.53 | 0.49 a | 42.57 |
| Surface | 1.31 | 0.96 | 1.24 | 1.17 a | 18.94 | ||
| Average | 0.90 A | 0.70 A | 0.88 A | 17.23 | |||
| Ca2+ | Incorporated* | 2.13 | 0.84 | 0.68 | 1.22 a | 11.38 | |
| Surface | 1.57 | 0.59 | 0.35 | 0.84 b | 5.06 | ||
| Average | 1.85 A | 0.71 B | 0.52 C | 8.68 | |||
| Mg2+ | Incorporated* | 0.68 | 0.42 | 0.30 | 0.46 a | 14.86 | |
| Surface | 0.46 | 0.24 | 0.15 | 0.28 b | 7.15 | ||
| Average | 0.57 A | 0.33 B | 0.22 C | 17.53 | |||
| S | Incorporated* | 3.14 | 1.34 | 1.06 | 1.84 a | 3.09 | |
| Surface | 2.29 | 0.91 | 0.56 | 1.25 b | 2.03 | ||
| Average | 2.71 A | 1.12 B | 0.81 C | 1.35 | |||
| CEC | Incorporated* | 5.89 | 5.87 | 5.86 | 5.87 b | 13.75 | |
| Surface | 7.31 | 7.85 | 8.07 | 7.74 a | 8.98 | ||
| Average | 6.60 A | 6.86 A | 6.96 A | 3.79 | |||
| P | mg dm-3 | Incorporated | 23.39 Aa | 6.79 Ba | 7.23 Ba | 12.47 a | 5.83 |
| Surface | 20.16 Ab | 4.20 Bb | 1.67 Cb | 8.68 b | 8.72 | ||
| Average | 21.77 A | 5.50 B | 4.45 C | 4.87 | |||
| K+ | Incorporated | 128.19 Aa | 31.35 Ba | 30.85 Ba | 63.46 a | 7.19 | |
| Surface | 100.29 Ab | 34.41 Ba | 19.67 Cb | 51.46 b | 8.58 | ||
| Average | 114.24 A | 32.88 B | 25.26 C | 4.11 | |||
| SOM | % | Incorporated | 1.10 Ab | 1.06 Ab | 0.84 Bb | 1.00 b | 9.53 |
| Surface | 1.68 Aa | 1.38 Ba | 1.30 Ba | 1.4 a | 6.28 | ||
| Average | 1.39 A | 1.22 B | 1.07 C | 3.59 | |||
| V | Incorporated | 53.76 Aa | 23.11 Ba | 18.03 Ca | 31.63 a | 10.83 | |
| Surface | 31.83 Ab | 11.90 Bb | 6.99 Cb | 16.91 b | 8.50 | ||
| Average | 42.80 A | 17.50 B | 12.51 C | 5.62 | |||
| m | Incorporated* | 12.67 | 22.11 | 28.91 | 21.23 b | 4.14 | |
| Surface | 33.94 | 45.97 | 64.28 | 48.06 a | 14.51 | ||
| Average | 23.30 C | 34.04 B | 46.59 A | 12.31 | |||
Identical uppercase letters on the lines indicate statistically similar means between depth, while lowercase letters in the column indicate similarities between liming and gypsum application methods according to the Tukey test at a 5% probability level. Data of pH, Ca+2, K+, P and S were transformed using the square root of (Y). *Significant interaction was not observed.
Table 2.
Nodule dry mass, number of nodules, primary root length, number of secondary roots, root dry mass, and shoot dry matter of soybeans in an experiment comparing lime and gypsum application methods in Campos dos Goytaca-zes-RJ, 2021/2022 crop season.
Table 2.
Nodule dry mass, number of nodules, primary root length, number of secondary roots, root dry mass, and shoot dry matter of soybeans in an experiment comparing lime and gypsum application methods in Campos dos Goytaca-zes-RJ, 2021/2022 crop season.
| Cultivar |
Nódulos dry mass (mg plant-1) |
Number of nodules of (planta-1) | Primary root length (cm) | Root dry mass (g plant-1) | ||||
| BRS 5980 IPRO | 304.4 A | 45.0 A | 19.25 | 3.19 A | ||||
| BRS 7981 IPRO | 253.6 AB | 29.8 B | 18.40 | 1.60 B | ||||
| MS 5917 | 160.0 C | 33.5 B | 18.85 | 2.72 A | ||||
| 95R95 IPRO | 207.4 BC | 27.6 B | 17.40 | 1.70 B | ||||
| CV (%) | 10.3 | 24.7 | 10.4 | 16.0 | ||||
| Liming forms | ||||||||
| Incorporated | 264.4 A | 33 A | 18.4 | 2.34 A | ||||
| Surface | 198.2 B | 34 A | 18.5 | 2.26 A | ||||
| CV (%) | 15.1 | 19.9 | 9.9 | 14.7 | ||||
| Cultivar | Number of secondary roots | Shoot dry matter (g plant-1) | ||||||
| Incorporated lime | Surface lime | Average | Incorporated lime | Surface lime | Average | |||
| BRS 5980 IPRO | 61.2 | 41.2 | 51.2 B | 11.64 Ba | 10.24 ABb | 10.94 B | ||
| BRS 7981 IPRO | 68.0 | 63.0 | 65.5 A | 10.47 Ca | 10.71 Aa | 10.50 BC | ||
| M 5917 | 66.0 | 50.2 | 58.1 AB | 13.24 Aa | 10.50 Ab | 11.87 A | ||
| 95R95 IPRO | 66.0 | 54.2 | 60.1 AB | 10.72 BCa | 9.40 Bb | 10.06 C | ||
| Average | 65.3 a | 52.1 b | 11.51 a | 10.21 b | ||||
| CV (%) | 26.7 | 13.6 | 24.1 | 2.2 | 1.8 | 2.4 | ||
Identical uppercase letters on the columns in the same variable indicate statistically similar means between cultivars, while lowercase letters in the lines indicate similarities between lime and gypsum application methods according to the Tukey test at a 5% probability level. Data of nodules dry mass were transformed using the square root of (Y + 100), and root dry mass using the log(Y), root dry matter and number of secondary roots transformed using the Box-Cox. Numbers not followed by letters represent values for which the interaction was not statistically significant.
Table 3.
Calcium, magnesium, potassium, phosphorus, and nitrogen accumulation in the soybean shoot in an experiment comparing liming and gypsum application methods in Campos dos Goytacazes-RJ, 2021/2022 crop season.
Table 3.
Calcium, magnesium, potassium, phosphorus, and nitrogen accumulation in the soybean shoot in an experiment comparing liming and gypsum application methods in Campos dos Goytacazes-RJ, 2021/2022 crop season.
| Cultivar | Ca2+ (mg plant-1) | CV (%) | ||
| Incorporated | Surface | Average | ||
| M 5917 IPRO | 148.9A | 98.8A | 123.8 A | |
| BRS 5980 IPRO | 125.4B | 92.8AB | 109.1 B | |
| 95R95 IPRO | 114.2B | 82.4B | 98.3 C | |
| BRS 7981 IPRO | 93.9C | 81.9B | 87.9 D | |
| Average | 120.6 a | 88.9 b | 9.5 | |
| CV (%) | 6.7 | 9.9 | ||
| Cultivar | Mg2+ (mg plant-1) | CV (%) | ||
| Incorporated | Surface | Average | ||
| M 5917 IPRO | 49.1 A | 32.1 A | 40.6 A | |
| BRS 5980 IPRO | 38.7 B | 32.5 A | 35.6 A | |
| 95R95 IPRO | 33.7 B | 25.7 B | 27.9 B | |
| BRS 7981 IPRO | 28.0 C | 27.8 AB | 29.7 B | |
| Average | 37.4 a | 29.5 b | ||
| CV (%) | 8.4 | 5.0 | 9.5 | |
| Cultivar | K+ (mg plant-1) | CV (%) | ||
| Incorporated | Surface | Average | ||
| M 5917 IPRO | 353.9 A | 240.7 AB | 297.3 A | |
| BRS 5980 IPRO | 300.8 B | 255.3 A | 278.1 A | |
| 95R95 IPRO | 249.5 C | 201.2 B | 225.4 B | |
| BRS 7981 IPRO | 211.3 C | 197.5 B | 204.4 B | |
| Average | 278.9 a | 223.7 b | ||
| CV (%) | 10.6 | 8.82 | 10.7 | |
| Cultivar | P (mg plant-1) | CV (%) | ||
| Incorporated | Surface | Average | ||
| M 5917 IPRO | 46.6 A | 31.9 A | 39.25 A | |
| BRS 5980 IPRO | 36.7 AB | 33.2 A | 34.95 A | |
| 95R95 IPRO | 37.4 AB | 29.8 A | 33.6 A | |
| BRS 7981 IPRO | 29.2 B | 34.3 A | 31.5 A | |
| Average | 37.5 a | 32.3 b | ||
| CV (%) | 23.9 | 5.2 | 17.4 | |
| Cultivar | N (mg plant-1) | CV (%) | ||
| Incorporated | Surface | Average | ||
| M 5917 IPRO | 418 | 296 | 358.2 A | |
| BRS 5980 IPRO | 304 | 244 | 293.6 BC | |
| 95R95 IPRO | 350 | 242 | 273.7 B | |
| BRS 7981 IPRO | 264 | 222 | 243.4 C | |
| Average | 333.2 a | 251.3 b | ||
| CV (%) | 8.0 | 7.5 | 11.1 | |
Identical uppercase letters in the columns indicate statistically similar means between cultivars for each variable, whereas lowercase letters in the lines indicate similarities between lime and gypsum application methods according to Tukey’s test at a 5% probability level. Numbers not followed by letters represent values for which the interaction was not statistically significant.
Table 4.
Chemical and granulometric characterization and soil particle size distribution before the lime and gypsum application in the 2020/2021 season in Campos dos Goytacazes-RJ.
Table 4.
Chemical and granulometric characterization and soil particle size distribution before the lime and gypsum application in the 2020/2021 season in Campos dos Goytacazes-RJ.
| Depth (cm) | P | K | Ca | Mg | Na | Al | H+Al | pH | |
| ---mg dm-3--- | ----------cmolc dm-3--------- | ||||||||
| 0–20 | 5 | 43 | 1.5 | 0.6 | 0.08 | 0.5 | 3.1 | 4.6 | |
| 20–40 | 4 | 23.5 | 1.1 | 0.4 | 0.07 | 1 | 4.8 | 4.6 | |
| Depth (cm) | MO | SB | CTC | V | m | Cu | Fe | Mn | Zn |
| % | ---cmolc dm-3--- | -----%----- | ---------mg dm-3--------- | ||||||
| 0–20 | 1.74 | 2.3 | 5.47 | 43 | 18 | 1.01 | 189.5 | 1.39 | 14 |
| 20–40 | 1.17 | 1.65 | 6.6 | 26 | 37 | 1.02 | 194.8 | 051 | 5.22 |
| Depth (cm) | Particle size distribution (%) | ||||||||
| Sand | Silt | Clay | |||||||
| 0–20 | 75 | 13 | 12 | ||||||
| 20–40 | 73 | 8 | 19 | ||||||
Disclaimer/Publisher’s Note: The statements, opinions and data contained in all publications are solely those of the individual author(s) and contributor(s) and not of MDPI and/or the editor(s). MDPI and/or the editor(s) disclaim responsibility for any injury to people or property resulting from any ideas, methods, instructions or products referred to in the content. |
© 2026 by the authors. Licensee MDPI, Basel, Switzerland. This article is an open access article distributed under the terms and conditions of the Creative Commons Attribution (CC BY) license (http://creativecommons.org/licenses/by/4.0/).
Copyright: This open access article is published under a Creative Commons CC BY 4.0 license, which permit the free download, distribution, and reuse, provided that the author and preprint are cited in any reuse.


