
Submitted:
03 September 2025
Posted:
09 September 2025
You are already at the latest version
Abstract
Cultivated land quality is a critical factor influencing soil productivity and serving as the theoretical basis for scientific fertilization. This study systematically analyzed the evolution of cultivated land quality and its impact on soil productivity across three major ecological regions (northern Shanxi, central Shanxi, northern Shanxi) in Shanxi Province, China, over a 23-year period (1998-2021). This study was conducted using data from 8 long-term experimental sites (1998-2021) and 50 monitoring stations (2016-2021), employing random forest analysis to evaluate temporal trends in key soil productivity indicators. The results revealed that 1) Northern Shanxi showed the greatest improvement in soil fertility, with organic matter content increasing by 98.2%, total nitrogen by 57.2%, available phosphorus by 131.7%, and available potassium by 17.1%; 2) Nitrogen fertilizer application exhibited an increasing trend across all three ecological regions, with the highest growth rate of 29.5% in central Shanxi. While phosphorus and potassium fertilizer inputs generally declined; 3) Crop yields improved substantially, with southern Shanxi wheat and maize showing increases by 15.3% and 20.9%, respectively, while central and northern Shanxi maize yields rose by 30.9% and 75.4%, respectively. Regional characteristics (40%), nitrogen fertilization (20%), and available phosphorus (18%) were identified as the primary influencing factors through the random forest models. Although cultivated land quality has been effectively enhanced in all three ecological regions, overall fertility remains at a medium-to-low level. In particular, region-specific management strategies are recommended: Reasonable use of nitrogen fertilizer is required in all three regions, and then nitrogen control with phosphorus supplementation in southern Shanxi; focused improvement of available phosphorus and potassium in central Shanxi; and increased organic fertilizer application in northern Shanxi. These tailored measures will promote scientific nutrient management and sustainable agricultural production.
Keywords:
Northern China
; cultivated land quality
; soil productivity
; crop yield
1. Introduction
Shanxi Province is located in the semi-arid region of the Loess Plateau in China, with the features of complex topography, arid climate, large hilly and mountainous areas, severe soil erosion. These features contribute to unstable agricultural productivity and low-quality of cultivated land. There are currently 4.055 million hectares of cultivated land in the province, of which 2.908 million hectares are medium- and low-yield fields, accounting for 71.7% of the total cultivated area. In addition, the dryland agricultural areas of Shanxi Province have complex natural conditions, changeable terrain, and rich farming systems, such as a two-cropping system per year or a three-cropping system every two years in the southern region, and the planting mode is mainly wheat-maize rotation, which is also the main production area of apples and pears. By contrast, in the central and northern regions, a one-cropping system is practiced, mainly growing maize, potatoes, millet, oats, flax, and mixed beans. The ecological types are diverse, from south to north, they can be divided into warm and hot climate zones (southern Shanxi), warm and temperate climate zones (central Shanxi), and cold and cool climate zones (northern Shanxi). Therefore, it is of great significance to study the evolutionary law of cultivated land quality under different ecoclimatic regions and different use patterns in Shanxi Province to guide the scientific-based management and improvement of cultivated land quality.
Providing sufficient nutrients to crops through fertilization is one of the important ways to maintain high and stable crop yields [1,2,3,4,5]. Fertilization can significantly increase crop yield compared to no fertilization [6,7]. Nitrogen fertilizer and phosphorus fertilizer had a great influence on the change of rice fertilizer contribution rate [8,9,10]. Compared with other soil fertility indicators, soil organic matter is a key soil fertility factor affecting the change of rice fertilizer contribution rate [11]. In addition, studies have shown that basal soil fertility plays an important role in stabilizing and increasing yield [12,13,14,15,16], and the improvement of basal soil fertility significantly improves crop yield under fertilization conditions [17,18]. In a long-term positioning experiment in China, the soil productivity increased with the improvement of soil fertility with or without fertilization [19]. There was a positive correlation between soil fertility and crop yield; the crop yield showed a decreasing trend when the soil fertility was low. Also, one study showed that a significant positive correlation between soil fertility contribution rate and basic soil fertility level, and the demand for chemical fertilizers in wheat would also be reduced on the basis of ensuring high and stable wheat yield by improving basic soil fertility [20]. Most studies on cultivated land quality in Shanxi Province only analyze one or a few nutrient indicators, and the time span is small, most of them only analyze the nutrient changes within 10 years, and the single study of a certain type or a specific soil type in a province or city has a small coverage and a lack of long-term studies. The increase and decrease of soil fertility index at a specific time or point cannot scientifically explain the evolution of soil fertility, and thus cannot fully reveal the overall status of cultivated land quality in Shanxi Province and the evolution characteristics of fertility level in different regions.
This study leverages the monitoring data of 8 national long-term positioning experimental sites (1998~2021) and 50 provincial positioning monitoring sites (2016~2021) in Shanxi Province over 23 years to find out the evolution characteristics and trends of cultivated land fertility and productivity levels in different regions of Shanxi Province. The random forest model analysis is used to analyze the differences in the impacts of soil fertility and fertilization on the productivity of the three regions, so as to provide scientific basis and guidance for the rational use and management of sustainable agricultural development in Shanxi Province.
2. Materials and Methods
2.1. Overview of Monitoring Sites
The data were derived from 8 national long-term positioning experimental sites (1998~2021) and 50 provincial positioning monitoring sites (2016~2021) at Shanxi Province in China. The topography of Shanxi Province can be divided into three ecological regions. The distribution of monitoring points is as follows: southern Shanxi (19 in total, 4 at the national level); central Shanxi (21 in total, 2 national); northern Shanxi (18 in total, 2 national). The study was conducted over three periods: initial (1998~2005), middle (2006~2014), and recent (2015~2021). The basic information of monitoring points is shown in Table 1. The monitoring sites in southern Shanxi focus on wheat and maize in a two-crop annual system, while those in central and northern Shanxi focus on maize in a one-crop annual system. These ecological regions were chosen to reflect Shanxi Province's diverse ecological and agricultural conditions.
2.2. Experimental Design
The area of each monitoring point was greater than 334 m2, and there was no duplication of conventional fertilization area and blank area. Recorded data included crop types, fertilizer types, fertilizer amounts, fertilizer nutrient content. Blank areas received no fertilization (NF), while other management practices matched those of the conventional fertilization areas (CF). Fertilization in conventional fertilization area:
- −
- Southern Shanxi wheat: N (67.5-718 kg·hm⁻²), P₂O₅ (10.5-618 kg·hm⁻²), K₂O (24-744 kg·hm⁻²);
- −
- Southern Shanxi maize: N (12.9-561 kg·hm⁻²), P₂O₅ (7.5-414 kg·hm⁻²), K₂O (7.5-319 kg·hm⁻²);
- −
- Central Shanxi maize: N (75-624 kg·hm⁻²), P₂O₅ (2.3-568 kg·hm⁻²), K₂O (9.8-623 kg·hm⁻²);
- −
- Northern Shanxi maize: N (34.5-645 kg·hm⁻²), P₂O₅ (33-435 kg·hm⁻²), K₂O (21-607 kg·hm⁻²).
The yield of each plot was measured separately at the harvest period, and it was measured by actual harvest and random sampling threshing. After harvest in autumn every year, the fertilization treatment adopts the tillage layer (0~20 cm) soil, and the sampling is sent to the provincial soil testing center for determination by conventional methods [21]. The tested parameters are soil organic matter, total nitrogen, available phosphorus, available potassium content and pH value. The determination of fertility indicators adopts conventional methods: potassium dichromate titration method for organic matter, sulfuric acid-potassium sulfate-copper sulfate digestion-distillation titration method for total nitrogen, sodium bicarbonate extraction for effective phosphorus-molybdenum-antimony anticolorimetric method, Available potassium was extracted with ammonium acetate-flame photometer, pH potentiometric method (water-to-soil ratio 2.5:1).
2.3. Data Processing
In this study, inherent soil productivity was evaluated using no-fertilizer (NF) plots, which received neither organic fertilizers (i.e., crop straw and manure) nor chemical fertilizers. Conventional fertilization (CF) plots received mineral N, P, and K fertilizers at local farmer practice rates.
The contribution percentage of inherent soil productivity (CPISP) was calculated as:
CPISP (%) = (YieldNF /YieldCF) ×100 (1)
Where YieldNF and YieldCF represent crop yields from NF and CF plots, respectively [22].
Agronomic nitrogen use efficiency (ANUE) was determined by:
ANUE (kg/kg) = (YieldCF – YieldNF) / N application rate (2)[23]
Prior to conducting additional analyses, the normality distribution was verified using
the Kolmogorov–Smirnov test, and the homogeneity of variances was assessed using
Levene’s test across all raw datasets. One-way ANOVA was utilized to evaluate the
significance of treatment differences in wheat and maize yield, soil nutrition, fertilizer input, contribution index of inherent soil productivity and Nitrogen agronomic efficiency. Paired comparisons of treatment means were performed using Tukey’s HSD test at p < 0.05, utilizing SPSS 16.0 software (SPSS Inc., Chicago, IL, USA). Pearson correlation analysis was employed to examine the relationship between soil nutrition and yield. Microsoft Excel 2010 was used for data organizing and plotting. Origin 2019 was employed for box plots.
The RandomForest package in R (version 4.1.3) for random forest model analysis.
3. Results and Analysis
3.1. Evolution and Status of Soil Nutrients in the Three Ecoregions
During the 23 years of monitoring (1998~2021), the soil organic matter increased with time, showing an overall enriched trend in southern and northern Shanxi (Figure 1A), and depleted slightly in central Shanxi. In the recent period (2015-2021), the average values of organic matter in the monitoring sites in southern Shanxi, central Shanxi and northern Shanxi were 17.7, 15.5 and 13.7 g·kg-1, respectively. The majority of monitoring sites fell within the 10.0~20.0 g·kg-1 range, accounting for 68.1%, 62.9% and 62.0% of sites in southern Shanxi, central Shanxi and northern Shanxi, respectively. The secondary distribution peak occurred in the 20.0~30.0g·kg-1 range for Southern Shanxi and central Shanxi, representing 20.4% and 23.7% of sites, while in northern Shanxi, the secondary distribution was observed in the <10 g.kg-1range, comprising 27.8% of sites (Figure 1B). Compared with the initial period (1998-2004), northern Shanxi demonstrated the most significant in organic matter content, reaching remarkable 98.2% (Figure 1A).
The variation trend of soil total nitrogen content was consistent with that of organic matter. Recent monitoring data showed that the average total nitrogen contents in southern Shanxi, Central Shanxi, and Northern Shanxi were 1.0, 0.9, and 0.8 g·kg-1, respectively. Spatially, 46.4% of monitoring sites in southern Shanxi had total nitrogen concentrations within the 1.0-1.5 g·kg-1 range, while in central Shanxi and northern Shanxi, the majority of sites (37.9% and 42.3%, respectively) exhibited levels below 0.75 g·kg-1 (Figure 1D). Compared to the baseline period (1998-2004), Northern Shanxi demonstrated the most significant increase in total nitrogen content, reaching 57.2% (Figure 1C).
For available phosphorus, the recent mean values were 13.3, 11.8, and 16.5 mg·kg-1 in southern Shanxi, central Shanxi, and northern Shanxi, respectively. Across all regions, the <10.0 mg·kg-1 range predominated (southern Shanxi 46.8%, central Shanxi 47.4%, northern Shanxi 41.0%), followed by the 10.0-20.0 mg·kg-1 range (Figure 1F). Longitudinal comparison revealed decreasing trends in southern Shanxi (-6.5%) and central Shanxi (-30.3%), while northern Shanxi showed a remarkable 131.7% increase (Figure 1E).
Available potassium monitoring results exhibited distinct regional variations, with mean values of 188.2, 151.4, and 129.8 mg·kg-1 in southern Shanxi, central Shanxi, and northern Shanxi, respectively. The 100-150 mg·kg-1 range was most prevalent in central Shanxi (37.5%) and northern Shanxi (38.5%), whereas southern Shanxi showed the highest proportion (42.9%) in the >200 mg·kg-1 category (Figure 1H). Temporal analysis indicated sustained increases in available potassium for southern Shanxi and northern Shanxi, while central Shanxi displayed an initial rise followed by decline. Compared to the baseline period, the increases were 38.5%, 8.9%, and 17.1% for southern Shanxi, central Shanxi, and northern Shanxi, respectively (Figure 1G).
2.2. Evolution and Current Status of Fertilization Rates in the Three Ecological Regions
Monitoring data revealed that the application ratios of N: P2O5: K2O fertilizers in the three ecological regions fluctuated within the range of 1: 0.3-1.43: 0.41-1.71 (Figure 2). The specific patterns were as follows: nitrogen fertilizer application showed a consistent increasing trend across all regions, with the most pronounced growth rate of 29.5% observed in the maize area of central Shanxi (Figure 2A). Phosphate inputs demonstrated an overall decline, decreasing by 32.2%~57.0% in the final monitoring period (2015~2021) compared to the initial stage (1998~2005) (Figure 2C). Potassium application also exhibited a decreasing trend, with reductions of 43.3%~67.1% in the final period, where the wheat-growing area of southern Shanxi showed the most significant decline – the recent average of 140.9 kg·hm-2 represented only 32.9% of the initial value (Figure 2E).
Notable changes in fertilizer composition were observed: during the initial period, nitrogen accounted for a relatively low proportion, with the maize area of southern Shanxi showing nitrogen proportions merely 38.4% and 80.0% higher than phosphate and potassium, respectively (Figure 2B). From 2015~2021, the nitrogen proportion increased significantly by 27.5%~87.2%, peaking at 87.2% in central Shanxi’s maize area. The proportion of phosphate generally decreased except in northern Shanxi, with the maximum reduction (40.4%) occurring in central Shanxi’s maize area (Figure 2D). The proportion of potassium reached its peak during the initial period (24.4~38.8%), with northern Shanxi’s maize area showing the largest final-period decline of 39.2% (Figure 2F).
2.3. Evolution of Productivity in the Three Ecoregions
During the 23-year monitoring period (1998~2021), both wheat in southern Shanxi and maize in all three ecological regions showed a consistent upward trend in relative yield (Figure 3). In the initial monitoring phase (1998~2005), the relative yield of maize in northern Shanxi was the lowest, being 20.2% and 32.9% lower than in southern and central Shanxi respectively (Figure 3). By the final monitoring period (2015~2021), northern Shanxi’s maize relative yield became significantly higher than that in southern Shanxi, and there was a significant difference between the relative yield at the end of the monitoring period and the initial stage except for southern Shanxi (P<0.05) (Figure 3). The relative yields of wheat and maize across the three regions ranged from 2394~3795 kg·hm-2, showing increases of 15.3%, 20.9%, 30.9% and 75.4%, respectively compared to initial levels, with northern Shanxi maize demonstrating the most pronounced increase.
2.3.1. Relationship Between Yield and Soil Nutrients in Unfertilized and Conventional Plots Across Ecological Regions
Table 2 showed that for wheat in southern Shanxi: yield in unfertilized plots showed highly significant (P < 0.01) correlations with soil organic matter, total nitrogen, C: N ratio, and available phosphorus, while yield in conventional plots showed highly significantly (P < 0.01) correlations with soil organic matter, total nitrogen, and C:N ratio. For maize in southern Shanxi, yield in unfertilized plots was highly significantly (P < 0.01) correlated with C:N ratio, whereas yield in conventional plots was highly significantly (P < 0.01) correlated with soil organic matter.
For central Shanxi maize, only conventional plot yield showed highly significant (P<0.01) correlations with available phosphorus and available potassium. For northern Shanxi maize, unfertilized plot yield correlated highly significant (P<0.01) with soil organic matter, total nitrogen, C:N ratio, and available phosphorus; Conventional plot was yield correlated highly significantly with all this plus available potassium. Results indicate that available phosphorus significantly affected yield in all three ecological regions.
2.3.2. Nitrogen Fertilizer Agronomic Efficiency and Soil Productivity Contribution Coefficients Across Regions
Figure 4A shows that soil productivity contribution coefficient in central and northern Shanxi was significantly (P<0.05) lower than that for wheat and maize in southern Shanxi, indicating soil fertility contributed more to yield in southern Shanxi. Nitrogen agronomic efficiency followed the order: central Shanxi> northern Shanxi > southern Shanxi maize> southern Shanxi wheat (Figure 4B), demonstrating nitrogen fertilizer had the greatest yield effect in Southern maize.
Figure 5 further shows highly significant (P <0.01) negative correlations between agronomic efficiency and soil productivity contribution coefficients for southern Shanxi wheat, southern Shanxi maize and northern Shanxi maize, with a significant (P<0.05) correlation for central Shanxi maize, confirming that nitrogen fertilizer’s yield-increasing effect decreases significantly as native soil fertility improves.
2.3.3. Analysis of Influencing Factors of Productivity
Overall, region had the greatest influence on productivity (~40%), followed by nitrogen fertilizer (~20%), and soil available phosphorus (~18%) (Figure 6A). Specific regional patterns were: southern Shanxi wheat: N fertilizer (8.8%) *> total N (8.1%) *> K fertilizer (6.9%) * ≈ P fertilizer (6.9%) *(Figure 6B). The contribution rate of each factor to maize productivity in southern Shanxi was as follows: P fertilizer (18.8%) **> K fertilizer (15%) ** > N fertilizer (8.8%) ** > available K (8.7%) ** > organic matter (7.5%) * (Figure 6C). The contribution rate of each factor to maize productivity in central Shanxi was as follows: N fertilizer (10.6%) **> total N (5.8%) *> available P (4.6%) * (Figure 6D); The contribution rate of each factor to maize productivity in northern Shanxi was in the following order: Organic matter (9%) * > N fertilizer (7.6%) * (Figure 6E).
These results demonstrate that soil nutrients and fertilization factors contribute differently to soil productivity across regions. Nitrogen fertilizer had a primary effect on the yield of wheat and maize in all regions. The total soil nitrogen content substantially to productivity in southern and central Shanxi. Organic matter not only plays a leading role in the productivity of northern Shanxi with low fertility level, but also has a significant impact on maize yield in southern Shanxi. Additionally, phosphate and potassium fertilizers had significant effects on wheat and maize in southern Shanxi.
4. Discussion
4.1. Evolution and Current Status of Cultivated Land Quality in Three Ecological Regions
Long-term fertilization is one of the key strategies to improve soil quality [24,25]. Studies have demonstrated that sustained fertilization significantly improves soil organic matter, total nitrogen, and available phosphorus content [6,26], while also enhancing the comprehensive fertility of soils [26]. Our findings reveal that after 23 years of fertilization management, conventional fertility indicators across Shanxi’s three ecological regions showed measurable improvement, consistent with previous research [2,26]. Notably, northern Shanxi exhibited the most substantial increases in organic matter (+98.2%), total nitrogen (+57.2%), and available phosphorus (+131.7%) due to its initially lower fertility baseline. Southern Shanxi’s available potassium increased by 38.5%, attributable to its warmer climate and potassium-rich parent material. Overall, the improvement of fertility in the three ecological regions is related to the increase in nitrogen fertilizer application and its proportion in fertilizers, which is consistent with findings from cinnamon soil studies [27]. Despite reduced potassium fertilizer inputs, available potassium levels rose, likely due to long-term straw incorporation [28], which also enhances soil organic carbon (SOC) in 0-40 cm soil layer [28,29,30,31,32]. However, insufficient organic fertilizer inputs maintained overall fertility at a medium-to-low levels (Figure 1B).
4.2. Analysis of Yield Determinants Across Ecological Regions
Fertilization significantly impacts crop yields, with combined organic-inorganic applications demonstrating superior yield enhancement and stabilization effects [33,34,35,36,37,38]. Numerous studies confirm that organic-chemical fertilization maximizes land productivity and soil fertility [7,39,40]. The soil productivity contribution coefficient, reflecting land quality, depends on regional characteristics, inherent soil properties, and fertilization practices. Its negative correlation with yield variation coefficient indicates higher contribution coefficients with greater yield stability [41,42]. Enhanced native soil fertility increases crop yield response to fertilization while improving sustainability and reducing fertilizer dependence [9,16], consistent with our observed negative correlation between nitrogen agronomic efficiency and soil productivity contribution coefficients.
Our study revealed that regional differences contributed most significantly to productivity (40%), followed by nitrogen fertilizer (20%) and soil available phosphorus (18%). Crop yields in southern Shanxi and central Shanxi were more influenced by soil total nitrogen content, whereas northern Shanxi's productivity primarily depended on organic matter improvement. Notably, although northern Shanxi initially had lower soil fertility levels, it demonstrated the greatest improvement in all soil fertility indicators after long-term fertilization, resulting in the highest yield increase (maize +75.4%). Other studies have similarly confirmed that enhancing soil fertility can significantly boost crop yields [16].
Furthermore, maintaining current productivity levels in southern Shanxi requires not only guaranteed nitrogen supply but also phosphorus and potassium inputs, along with improvements in soil organic matter and total nitrogen content. This is because the same soil must support both wheat and maize in the double-cropping system. For the low-fertility northern Shanxi region, the priority task remains enhancing soil organic matter to achieve higher productivity. Previous research showed that the content of soil organic carbon (SOC) is a key indicator for soil productivity in North China Plain [18,43].
4.3. Scientific Fertilization Recommendations for Three Ecological Regions
Overall, regional factors had the greatest impact on productivity (approximately 40%). Therefore, customized fertilization strategies should be developed for each ecological region based on their specific factors influencing wheat and maize yields. In the high-fertility southern Shanxi region, nitrogen application should be controlled while increasing phosphorus input during the maize season, whereas nitrogen and phosphorus supplies should be ensured during the wheat season, along with improvements in soil organic matter and total nitrogen content. For maize cultivation in central Shanxi, rational nitrogen application is recommended, with a focus on enhancing soil available phosphorus and rapidly available potassium. In the low-fertility northern Shanxi region, appropriate nitrogen application should be maintained while improving overall soil fertility, particularly by optimizing organic matter content and the C:N ratio.
Higher soil fertility levels reduce the effect of nitrogen fertilizer on narrowing yield gaps; thus, nitrogen application should be moderately reduced in high-fertility soils. To sustain high yields in southern Shanxi, organic matter and nitrogen-phosphorus inputs should still be increased, especially during the maize season, but as a high-fertility region, nitrogen control and phosphorus supplementation are advisable. To ensure crop yield increases while avoiding nitrogen waste and environmental risks, nitrogen application rates should not exceed the balance point [44]. Combined application of organic and chemical fertilizers significantly improves soil organic matter content, whereas long-term exclusive use of chemical fertilizers leads to a notable decline in organic matter [7]. Therefore, increasing organic fertilizer inputs is essential for improving soil organic matter in low-fertility northern Shanxi. Wu et al. [45] reported that the agronomic thresholds of Olsen-P for maize and wheat in cinnamon soil were 14.2 mg·kg⁻¹ and 14.4 mg·kg⁻¹, respectively. In this study, the average available phosphorus levels in southern Shanxi, central Shanxi, and northern Shanxi were 13.3, 11.8, and 16.5 mg·kg⁻¹, respectively. Thus, phosphorus control should be implemented in northern Shanxi monitoring sites exceeding the threshold, while scientific phosphorus application is recommended for southern and central Shanxi, where levels remain below the threshold.
5. Conclusions
This study systematically investigated the impact of long-term fertilization on cultivated land quality across three ecological regions in Shanxi Province using rare longitudinal data, and it was found that conventional fertility indicators improved to varying degrees, though most areas remained at medium- to low-fertility levels. In the recent period (2015~2021), compared with the initial period (1998~2004), the fertility indexes of organic matter, total nitrogen and available phosphorus increased the most, which were 98.2%, 57.2% and 131.7%, respectively, and the increase of available potassium was 17.1%. As a pronounced improvement of various soil fertility indexes in northern Shanxi over the monitoring period, the relative yield of maize in northern Shanxi increased by 75.4%.
Different fertilization strategies should be developed for wheat and maize crops in each of the three ecological regions. Suggestions for fertilization of maize in southern Shanxi should pay attention to the input of potassium fertilizer and phosphate fertilizer, and improve organic matter, total nitrogen and available phosphorus in soil nutrients. Nitrogen fertilizer and phosphorus fertilizer were recommended for fertilization of wheat in southern Shanxi, followed by the improvement of soil organic matter, total nitrogen, C: N and available phosphorus. Suggestions for maize fertilization in central Shanxi: Nitrogen fertilizer should be reasonably applied, focusing on improving available phosphorus and available potassium. Suggestions for fertilization of maize in northern Shanxi: Nitrogen fertilizer should be reasonably added, and care should be taken to improving the level of comprehensive fertility, especially to improve the ratio of organic matter and C: N to an appropriate level. Although the application of nitrogen fertilizer is effective to increase the yield in the three regions, in view of the effect of soil fertility level on the relative yield difference, nitrogen fertilizer should be appropriately reduced in the high fertility soil in southern Shanxi. For the low fertility soils in northern Shanxi Province, improving soil organic matter is the key to increasing yield.
Author Contributions
All authors have read and agreed to the published version of the manuscript.
Funding
This study was financially supported by the Key Research and Development Program Project of Shanxi Province (202102140601010-3); Horizontal Science and Technology Project of Shanxi Agricultural University (2023HX07); Shanxi Agricultural University "Science and Technology Innovation Enhancement Project" (CXGC2023029).
Data Availability Statement
The original contributions presented in the study are included in the article/Supplementary Materials, further inquiries can be directed to the corresponding author.
Conflicts of Interest
The authors declare that they have no competing interests.
References
- Mueller, N.D.; Gerber, J.S.; Johnston, M.; Ray, D.K.; Ramankutty, N.; Foley, J.A. Closing yield gaps through nutrient and water management. Nature. 2012, 490, 254–257. [Google Scholar] [CrossRef]
- Gai, X.P.; Liu, H.B.; Liu, J.; Zhai, L.M.; Yang, B.; Wu, S.X.; Ren, T.Z.; Lei, Q.L.; Wang, H.Y. Long-term benefits of combining chemical fertilizer and manure applications on crop yields and soil carbon and nitrogen stocks in North China Plain. Agric. Water Manag. 2018, 208, 384–392. [Google Scholar] [CrossRef]
- Wang, H.X.; Xu, J.L.; Liu, X.J.; Zhang, D.; Li, L.W.; Li, W.; Sheng, L.X. Effects of long-term application of organic fertilizer on improving organic matter content and retarding acidity in red soil from China. Soil Till Res. 2019, 195, 104382. [Google Scholar] [CrossRef]
- Takamitsu, K.; Motoki, K.; Masahiko, T. A study on rice growth and soil environments in paddy fields using different organic and chemical fertilizers. J. Agric Chem Environ. 2020, 9, 331–342. [Google Scholar]
- Liu, K.L.; Han, T.F.; Huang, J.; Zhang, S.Q.; Gao, H.J.; Zhang, L.; Shan, A.; Huang, S.M.; Zhu, P.; Gao, S.D.; Ma, C.B.; Xue, Y.D.; Zhang, H.M. Change of soil productivity in three different soils after long-term field fertilization treatments. J. Integr Agric. 2020, 19, 848–858. [Google Scholar] [CrossRef]
- Zha, Y.; Wu, X.P.; He, X.H.; Zhang, H.M.; Gong, F.F.; Cai, D.X.; Zhu, P.; Gao, H.J. Basic soil productivity of spring maize in black soil under long-term fertilization based on DSSAT model. J. Integr. Agric. 2014, 13, 577–587. [Google Scholar] [CrossRef]
- Wang, T.; Ding, N.P.; Li, L.L.; Lyu, X.D.; Chai, Q.; Dou, X.C. Simulating the Impact of Long-Term Fertilization on Basic Soil Productivity in a Rainfed Winter Wheat System. Agronomy. 2020, 10, 1544. [Google Scholar] [CrossRef]
- Bi, L.; Xia, J.; Liu, K.; Li, D.; Yu, X. Effects of long-term chemical fertilization on trends of rice yield and nutrient use efficiency under double rice cultivation in subtropical China. Plant Soil Environ. 2014, 60, 537–543. [Google Scholar]
- Liu, J.A.; Shu, A.P.; Song, W.F.; Shi, W.C.; Li, M.C.; Zhang, W.X.; Li, Z.Z.; Liu, G.R.; Yuan, F.S.; Zhang, S.X.; Liu, Z.B.; Gao, Z. Long-term organic fertilizer substitution increases rice yield by improving soil properties and regulating soil bacteria. Geoderma. 2021, 404, 115287. [Google Scholar] [CrossRef]
- Gao, P.; Zhang, T.; Lei, X.Y.; Cui, X.W.; Lu, Y.X.; Fan, P.F.; Long, S.P.; Huang, J.; Gao, J.S.; Zhang, Z.H.; Zhang, H.M. Improvement of soil fertility and rice yield after long-term application of cow manure combined with inorganic fertilizers. J. Integr. Agric. 2023, 22, 2221–2232. [Google Scholar] [CrossRef]
- Li, Y.Z.; Han, T.F.; Qu, X.L.; Ma, C.B.; Du, J.X.; Liu, K.L.; Huang, J.; Liu, S.J.; Liu, L.S.; Shen, Z.; Zhang, H.M. Spatio-Temporal Variations of Fertilizer Contribution Rate for Rice in China and Its Influencing Factors. Scientia Agricultura Sinica. 2023, 56, 674–685. (in Chinese). [Google Scholar]
- Kunzová, E.; Hejcman, M. Yield development of winter wheat over 50 years of FYM, N, P and K fertilizer application on black earth soil in the Czech Republic. Field Crop Res. 2009, 111, 226–234. [Google Scholar] [CrossRef]
- Kunzová, E.; Hejcman, M. Yield development of winter wheat over 50 years of nitrogen, phosphorus and potassium application on Greyic Phaeozem in the Czech Republic. Eur. J. Agron. 2010, 33, 166–174. [Google Scholar] [CrossRef]
- Hejcman, M.; Kunzová, E. Sustainability of winter wheat production on sandy-loamy Cambisol in the Czech Republic: Results from a long term fertilizer and crop rotation experiment. Field Crop Res. 2010, 115, 191–199. [Google Scholar] [CrossRef]
- Fan, M.S.; Lal, R.; Cao, J.; Qiao, L.; Su, Y.S.; Jiang, R.F.; Zhang, F.S. Plant-Based assessment of inherent soil productivity and contributions to China’s cereal crop yield increase since 1980. PLoS ONE 2013, 8, e74617. [Google Scholar] [CrossRef]
- Wang, Z.G.; Ma, B.L.; Li, Y.J.; Li, R.F.; Qi, J.; Yu, X.F.; Sun, J.Y.; Hu, S.P.; Gao, J.l. Concurrent Improvement in Maize Grain Yield and Nitrogen Use Efficiency by Enhancing Inherent Soil Productivity. Front Plant Sci. 2022, 13. [Google Scholar] [CrossRef]
- Hu, Y.T.; Hao, M.D.; Wang, Z.; Fu, W. Effect of long-term fertilization on winter wheat yield from the dry land under different precipitation patterns. Chinese Journal of Applied Ecology. 2017, 28, 135–141. (In Chinese) [Google Scholar] [PubMed]
- Wang, J.Y.; Yan, X.Y.; Gong, W. Effect of Long-Term Fertilization on Soil Productivity on the North China Plain. Pedosphere. 2015, 25, 450–458. [Google Scholar] [CrossRef]
- Lu, Y.H.; Liao, Y.L.; Zhou, X.; Nie, J.; Xie, J.; Yang, Z.P. Effects of long-term different fertilization on yield and basic soil fertility of red paddy soil. Acta Pedologica Sinica. 2015, 52, 597–606. (In Chinese) [Google Scholar]
- Wang, L.; Chen, Y.H.; Zhang, S.X.; Ma, C.B.; Sun, N.; Li, C.H. Evolution of Fluvo-Aquic Soil Productivity Under Long-Term Fertilization and Its Influencing Factors. Scientia Agricultura Sinica. 2020, 53, 2232–2240. (In Chinese) [Google Scholar]
- Lu, R.K. Analytical Methods for Soil and Agro-chemistry; (In Chinese). China Agricutural Science and Technology Press: Beijing, 1999. [Google Scholar]
- Chen, Y.H.; Wang, L.; Zhang, S.X.; Ren, Y.; Li, C.H.; Xu, M.G.; Zhao, T.K. Evolution of cinnamon soil productivity under long-term fertilization and its influencing factors. Plant Nutrition and Fertilizer Science. 2018, 24, 1445–1455. (In Chinese) [Google Scholar]
- Peng, X.l.; Liu, Y.Y.; Luo, S.G.; Fan, L.C.; Song, T.X.; Guo, Y.W. Effects of Site-Specific Nitrogen Management on Yield and Dry Matter Accumulation of Rice from Cold Areas of Northeastern China. Agr Sci China. 2007, 6, 715–723. [Google Scholar] [CrossRef]
- Chen, X.Y.; Li, Z.S.; Zhao, H.Y.; Li, Y.; Wei, J.L.; Ma, L.; Zheng, F.L.; Tan, D.S. Enhancing Maize Yield and Nutrient Utilization through Improved Soil Quality under Reduced Fertilizer Use: The Efficacy of Organic–Inorganic Compound Fertilizer. Agriculture. 2024, 14, 1482. [Google Scholar] [CrossRef]
- Li, K.L.; Wang, C.; Li, X.L.; Li, H.; Dong, M.M.; Jin, S.J.; Liu, L.; Zhu, C.; Xue, R. Long-term effect of integrated fertilization on maize yield and soil fertility in a calcaric fluvisol. Arch. Agron. Soil Sci. 2021, 67, 1400–1410. [Google Scholar] [CrossRef]
- Mao, H.R.; Leng, K.; Chen, X.Y.; Zhang, J.; Liu, K.L.; Lin, Y.X.; Xiang, X.J.; Liu, J. Changes in fertility and microbial communities of red soil and their contribution to crop yield following long-term different fertilization. J. Soil Sediment. 2025, 25, 1115–1133. [Google Scholar] [CrossRef]
- Chen, Y.H.; Wang, L.; Zhang, S.X.; Guo, N.; Ma, C.B.; Li, C.H.; Xu, M.G.; Zou, G.Y. Quality Change of Cinnamon Soil Cultivated Land and Its Effect on Soil Productivity. Scientia Agricultura Sinica. 2019, 52, 4540–4554. (In Chinese) [Google Scholar]
- Zhao, S.C.; He, P.; Qiu, S.J.; Jia, L.L.; Liu, M.C.; Jin, J.Y. Long-term effects of potassium fertilization and straw return on soil potassium levels and crop yields in north-central China. Field Crop Res 2014, 169, 116–122. [Google Scholar] [CrossRef]
- Chen, Q.Y.; Liu, Z.J.; Zhou, J.B.; Xu, X.P.; Zhu, Y.J. Long-term straw mulching with nitrogen fertilization increases nutrient and microbial determinants of soil quality in a maize–wheat rotation on China’s Loess Plateau. Sci Total Environ. 2021, 775, 145930. [Google Scholar] [CrossRef]
- Shinde, R.; Shahi, D.K.; Mahapatra, P.; Singh, C.S.; Naik, S.K.; Thombare, N.; Singh, A.K. Management of crop residues with special reference to the on-farm utilization methods: A review. Ind. Crop. Prod. 2022, 181, 114772. [Google Scholar] [CrossRef]
- Zhou, J.; Pan, W.K.; Tang, S.; Ma, Q.X.; Mi, W.H.; Wu, L.H.; Liu, X. Optimizing nitrogen fertilization rate to achieve high yield and high soil quality in paddy ecosystems with straw incorporation. J. Environ Manag, 2025, 375, 124158. [Google Scholar] [CrossRef] [PubMed]
- Zhou, J.; Tang, S.; Pan, W.; Liu, X.; Han, K.; Si, L.; Ma, Q.; Mao, X.; Fu, H.; Wu, L. Long-term non-flooded cultivation with straw return maintains rice yield by increasing soil pH and soil quality in acidic soil. Eur. J. Agron. 2024, 159, 127208. [Google Scholar] [CrossRef]
- Ma, X.Z.; Hao, X.Y.; Zhao, Y.; Peng, X.H.; Ji, J.H.; Liu, S.Q.; Zheng, Y.; Sun, L.; Zhou, B.K. Response of crop yield and productivity contribution rate to long-term different fertilization in northeast of China. Plants 2025, 14, 132. [Google Scholar] [CrossRef]
- Li, C.X.; Ma, S.C.; Shao, Y.; Ma, S.T.; Zhang, L.L. Effects of long-term organic fertilization on soil microbiologic characteristics, yield and sustainable production of winter wheat. J. Integr. Agric. 2018, 17, 210–219. [Google Scholar] [CrossRef]
- Singh, D.K.; Pandey, P.C.; Nanda, G.; Gupta, S. Long-term effects of inorganic fertilizer and farmyard manure application on productivity, sustainability and profitability of rice-wheat system in Mollisols. Arch. Agron. Soil Sci. 2019, 65, 139–151. [Google Scholar] [CrossRef]
- Han, X.M.; Hu, C.; Chen, Y.F.; Qiao, Y.; Liu, D.H.; Fan, J.; Li, S.l.; Zhang, Z. Crop yield stability and sustainability in a rice-wheat cropping system based on 34-year field experiment. Eur. J. Agron. 2020, 113, 125965. [Google Scholar] [CrossRef]
- Mi, W.; Sun, Y.; Xia, S.; Zhao, H.; Mi, W.; Brookes, P.C.; Liu, Y.; Wu, L. Effect of inorganic fertilizers with organic amendments on soil chemical properties and rice yield in a low-productivity paddy. Geoderma. 2018, 320, 23–29. [Google Scholar] [CrossRef]
- Choudhary, M.; Panday, S.C.; Meena, V.S.; Singh, S.; Yadav, R.P.; Mahanta, D.; Mondal, T.; Mishra, P.K.; Bisht, J.K.; Pattanayak, A. Long-term effects of organic manure and inorganic fertilization on sustainability and chemical soil quality indicators of soybean-wheat cropping system in the Indian mid-Himalayas. Agric Ecosyst Environ. 2018, 257, 38–46. [Google Scholar] [CrossRef]
- Manna, M.C.; Swarup, A.; Wanjari, P.H.; Ravankar, H.N.; Mishra, B.; Saha, M.N.; Singh, Y.V.; Sahi, D.K.; Sarap, P.A. Long-term effect of fertilizer and manure application on soil organic carbon storage, soil quality and yield sustainability under sub-humid and semi-arid tropical. India Field Crops Research, 2005, 93, 264–280. [Google Scholar] [CrossRef]
- Wu, M.; Li, G.L.; Wei, S.P.; Li, P.F.; Liu, M.; Liu, J.; Li, Z.P. Discrimination of soil productivity and fertilizer-nitrogen use efficiency in the paddy field of subtropical China after 27 years different fertilizations. Arch Agron Soil Sci. 2021, 67, 166–178. [Google Scholar] [CrossRef]
- Li, Z.F.; Zhang, S.Q.; Li, H.; Sun, N.; Pang, H.C.; Lou, Y.L.; Xu, M.G. Trends of basic soil productivity in paddy soil under long-term fertilization in China. J. Plant Nutrition and Fertilizer, 2015, 21, 1394–1402. (In Chinese) [Google Scholar]
- Wang, S.; Wang, J.; Zhao, Y.; Ren, Y.; Xu, M.; Zhang, S.; Lu, C. Assessment of the Contribution Percentage of Inherent Soil Productivity of Cultivated Land in China. J. Integr. Agric. 2019, 18, 2619–2627. [Google Scholar] [CrossRef]
- Zha, Y.; Wu, X.P.; Gong, F.F.; Xu, M.G.; Zhang, H.M.; Chen, L.M.; Huang, S.M.; Cai, D.X. Long-term organic and inorganic fertilizations enhanced basic soil productivity in a fluvo-aquic soil. J. Integr Agric. 2015, 14, 2477–2489. [Google Scholar] [CrossRef]
- Shen, Z.; Han, T.F.; Qu, X.L.; Ma, C.B.; Wang, H.Y.; Liu, K.L.; Huang, J.; Du, J.X.; Zhang, L.; Liu, L.S.; Li, J.W.; Zhang, H.M. Spatial-Temporal Variation of Relative Yield Gap of Wheat and Maize and Its Response to Nitrogen Fertilizer in China. Scientia Agricultura Sinica. 2023, 56, 2724–2737. (In Chinese) [Google Scholar]
- Wu, Q.H.; Zhang, S.X.; Ren, Y.; Zhan, X.Y.; Xu, M.G.; Feng, G. Soil phosphorus management based on the agronomic critical value of Olsen P. Commun Soil Sci Plan. 2018, 49, 934–944. [Google Scholar] [CrossRef]
Figure 1.
Current status and temporal changes of conventional soil fertility indicators. Panels A, C, E, and G display the temporal trends of soil organic matter (OM), total nitrogen, available phosphorus (AP), and available potassium (AK), respectively, across three ecological regions. Panels B, D, F, and H present the current status (2015-2021) of each fertility indicator, showing the proportional distribution of monitoring sites across different concentration ranges within each region. Different lowercase letters within the same ecological region indicate statistically significant differences at the 0.05 probability level.
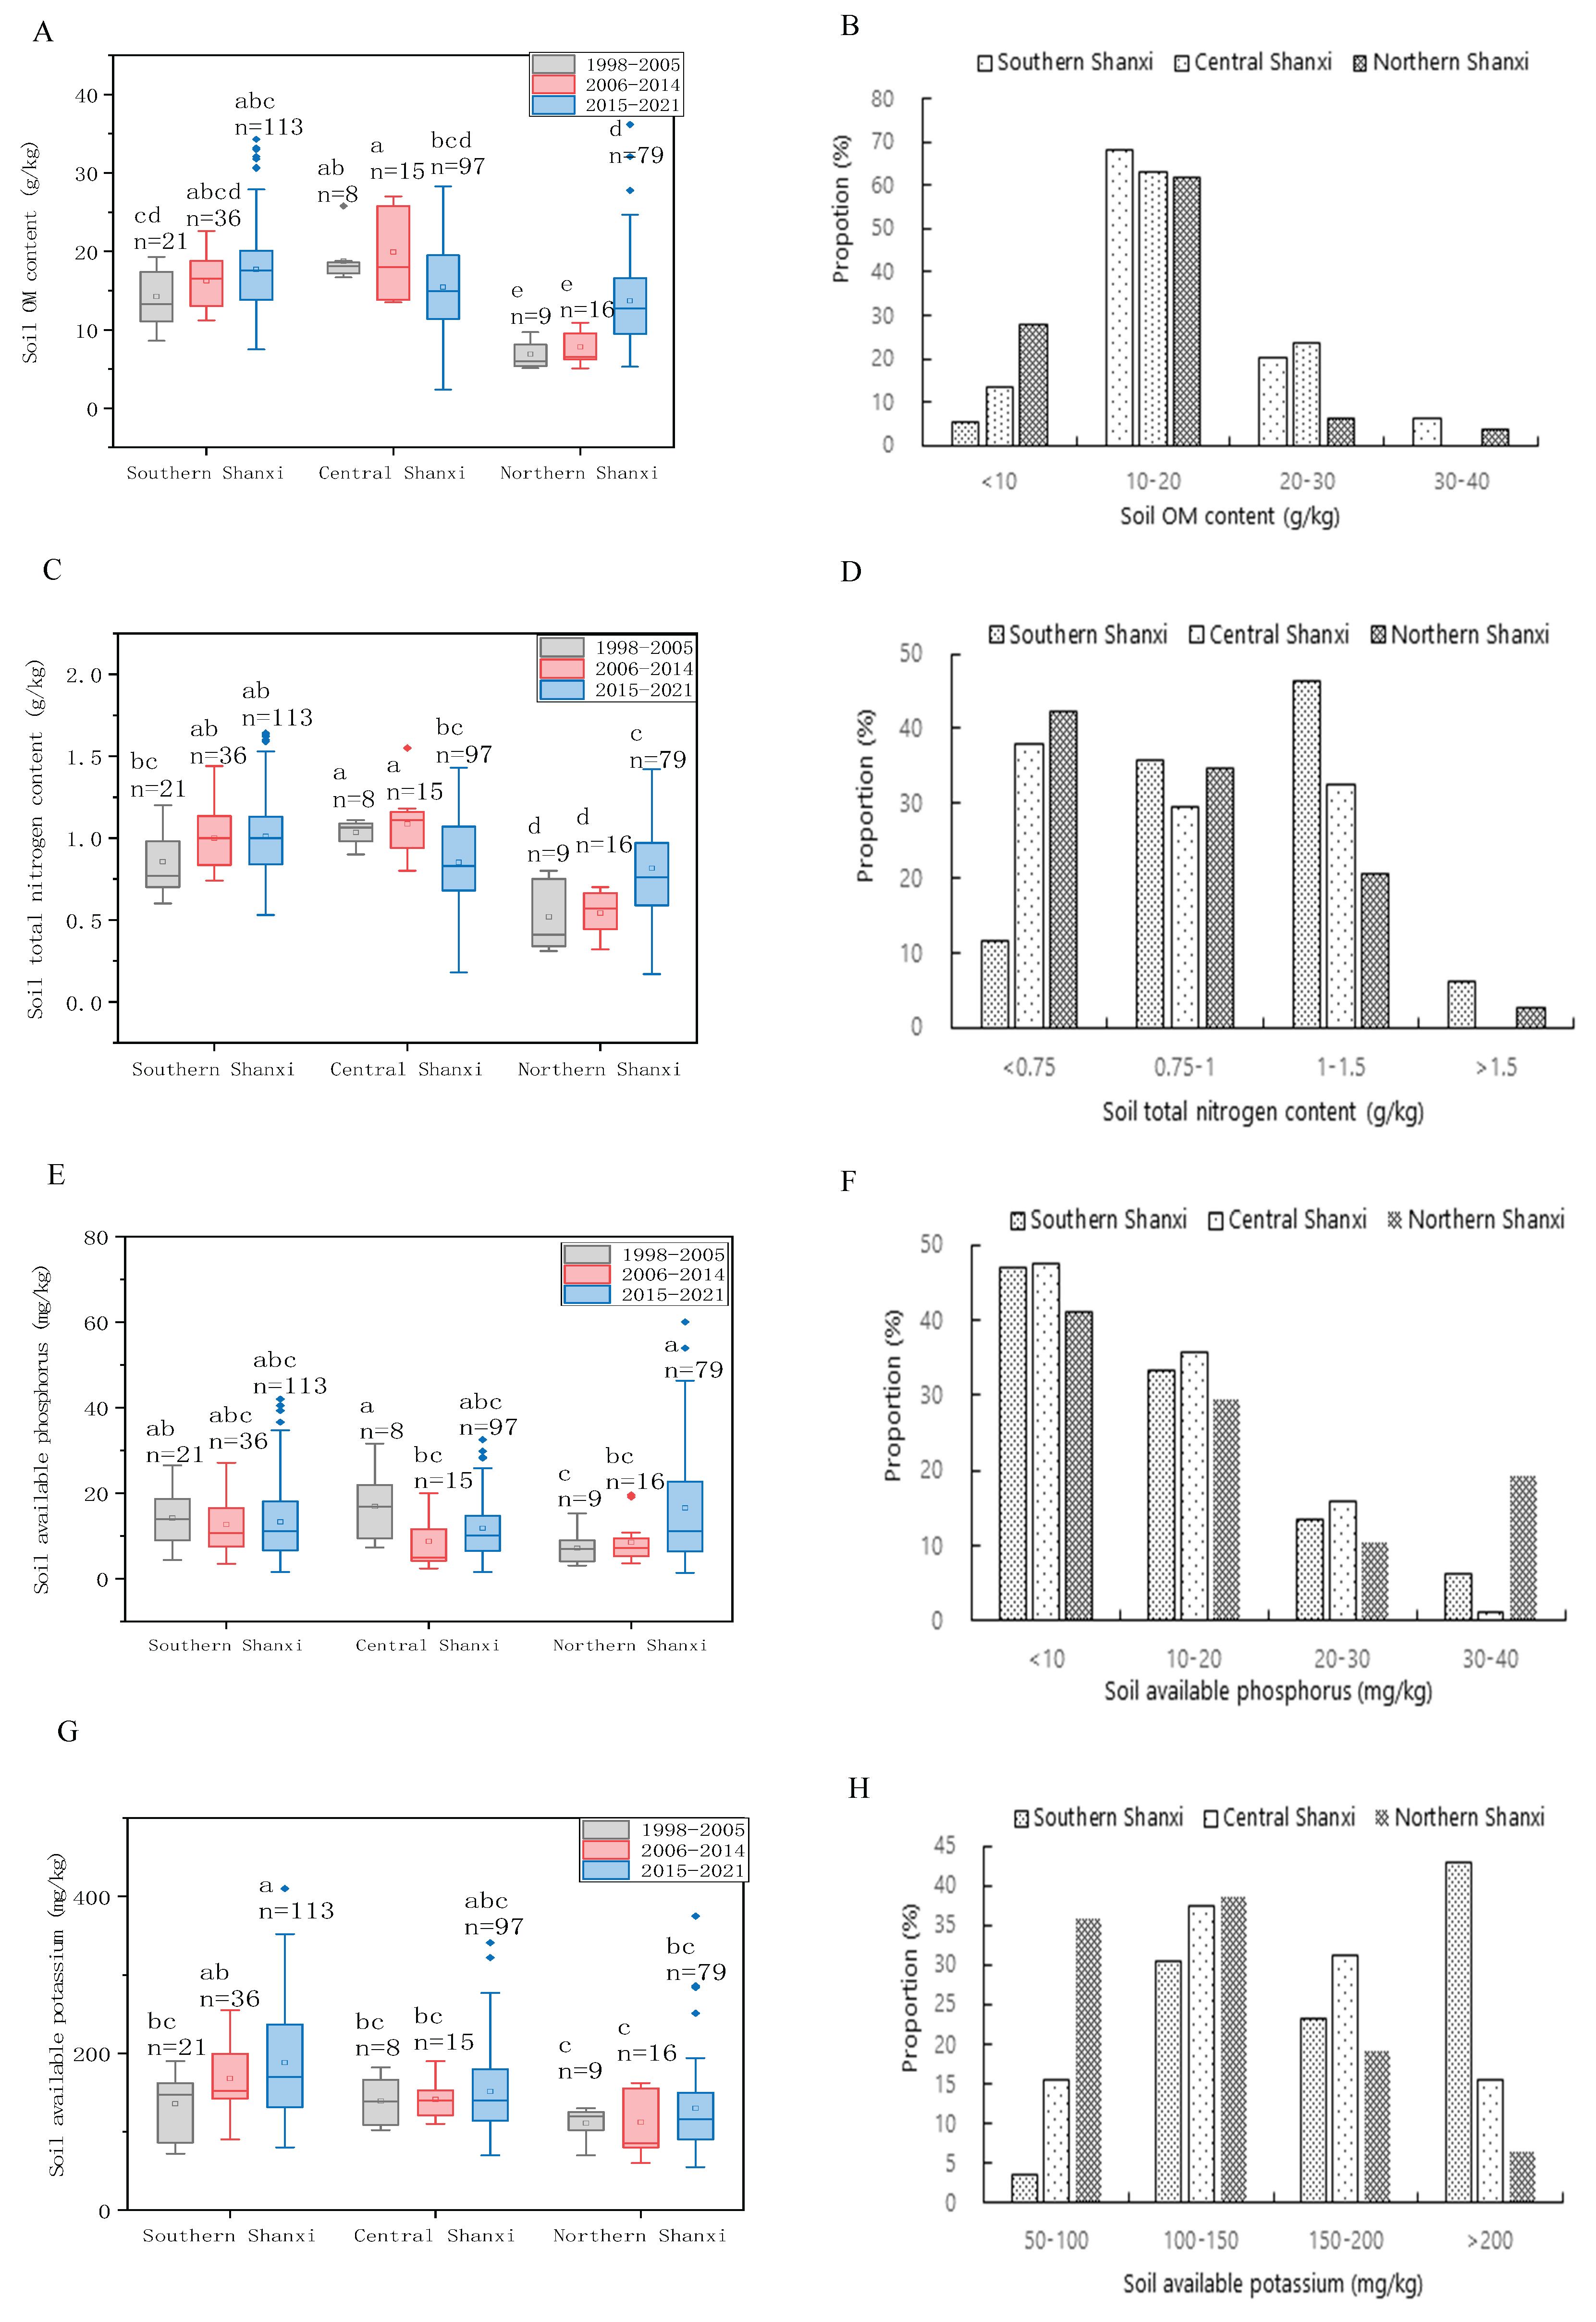
Figure 2.
The input (A, B, C) and proportion (D, E, F) of total nitrogen, available phosphorus, and available potassium fertilizers in three ecological regions at different stages, with significant differences at the 0.05 level indicated by different lowercase letters in the same ecological regions.
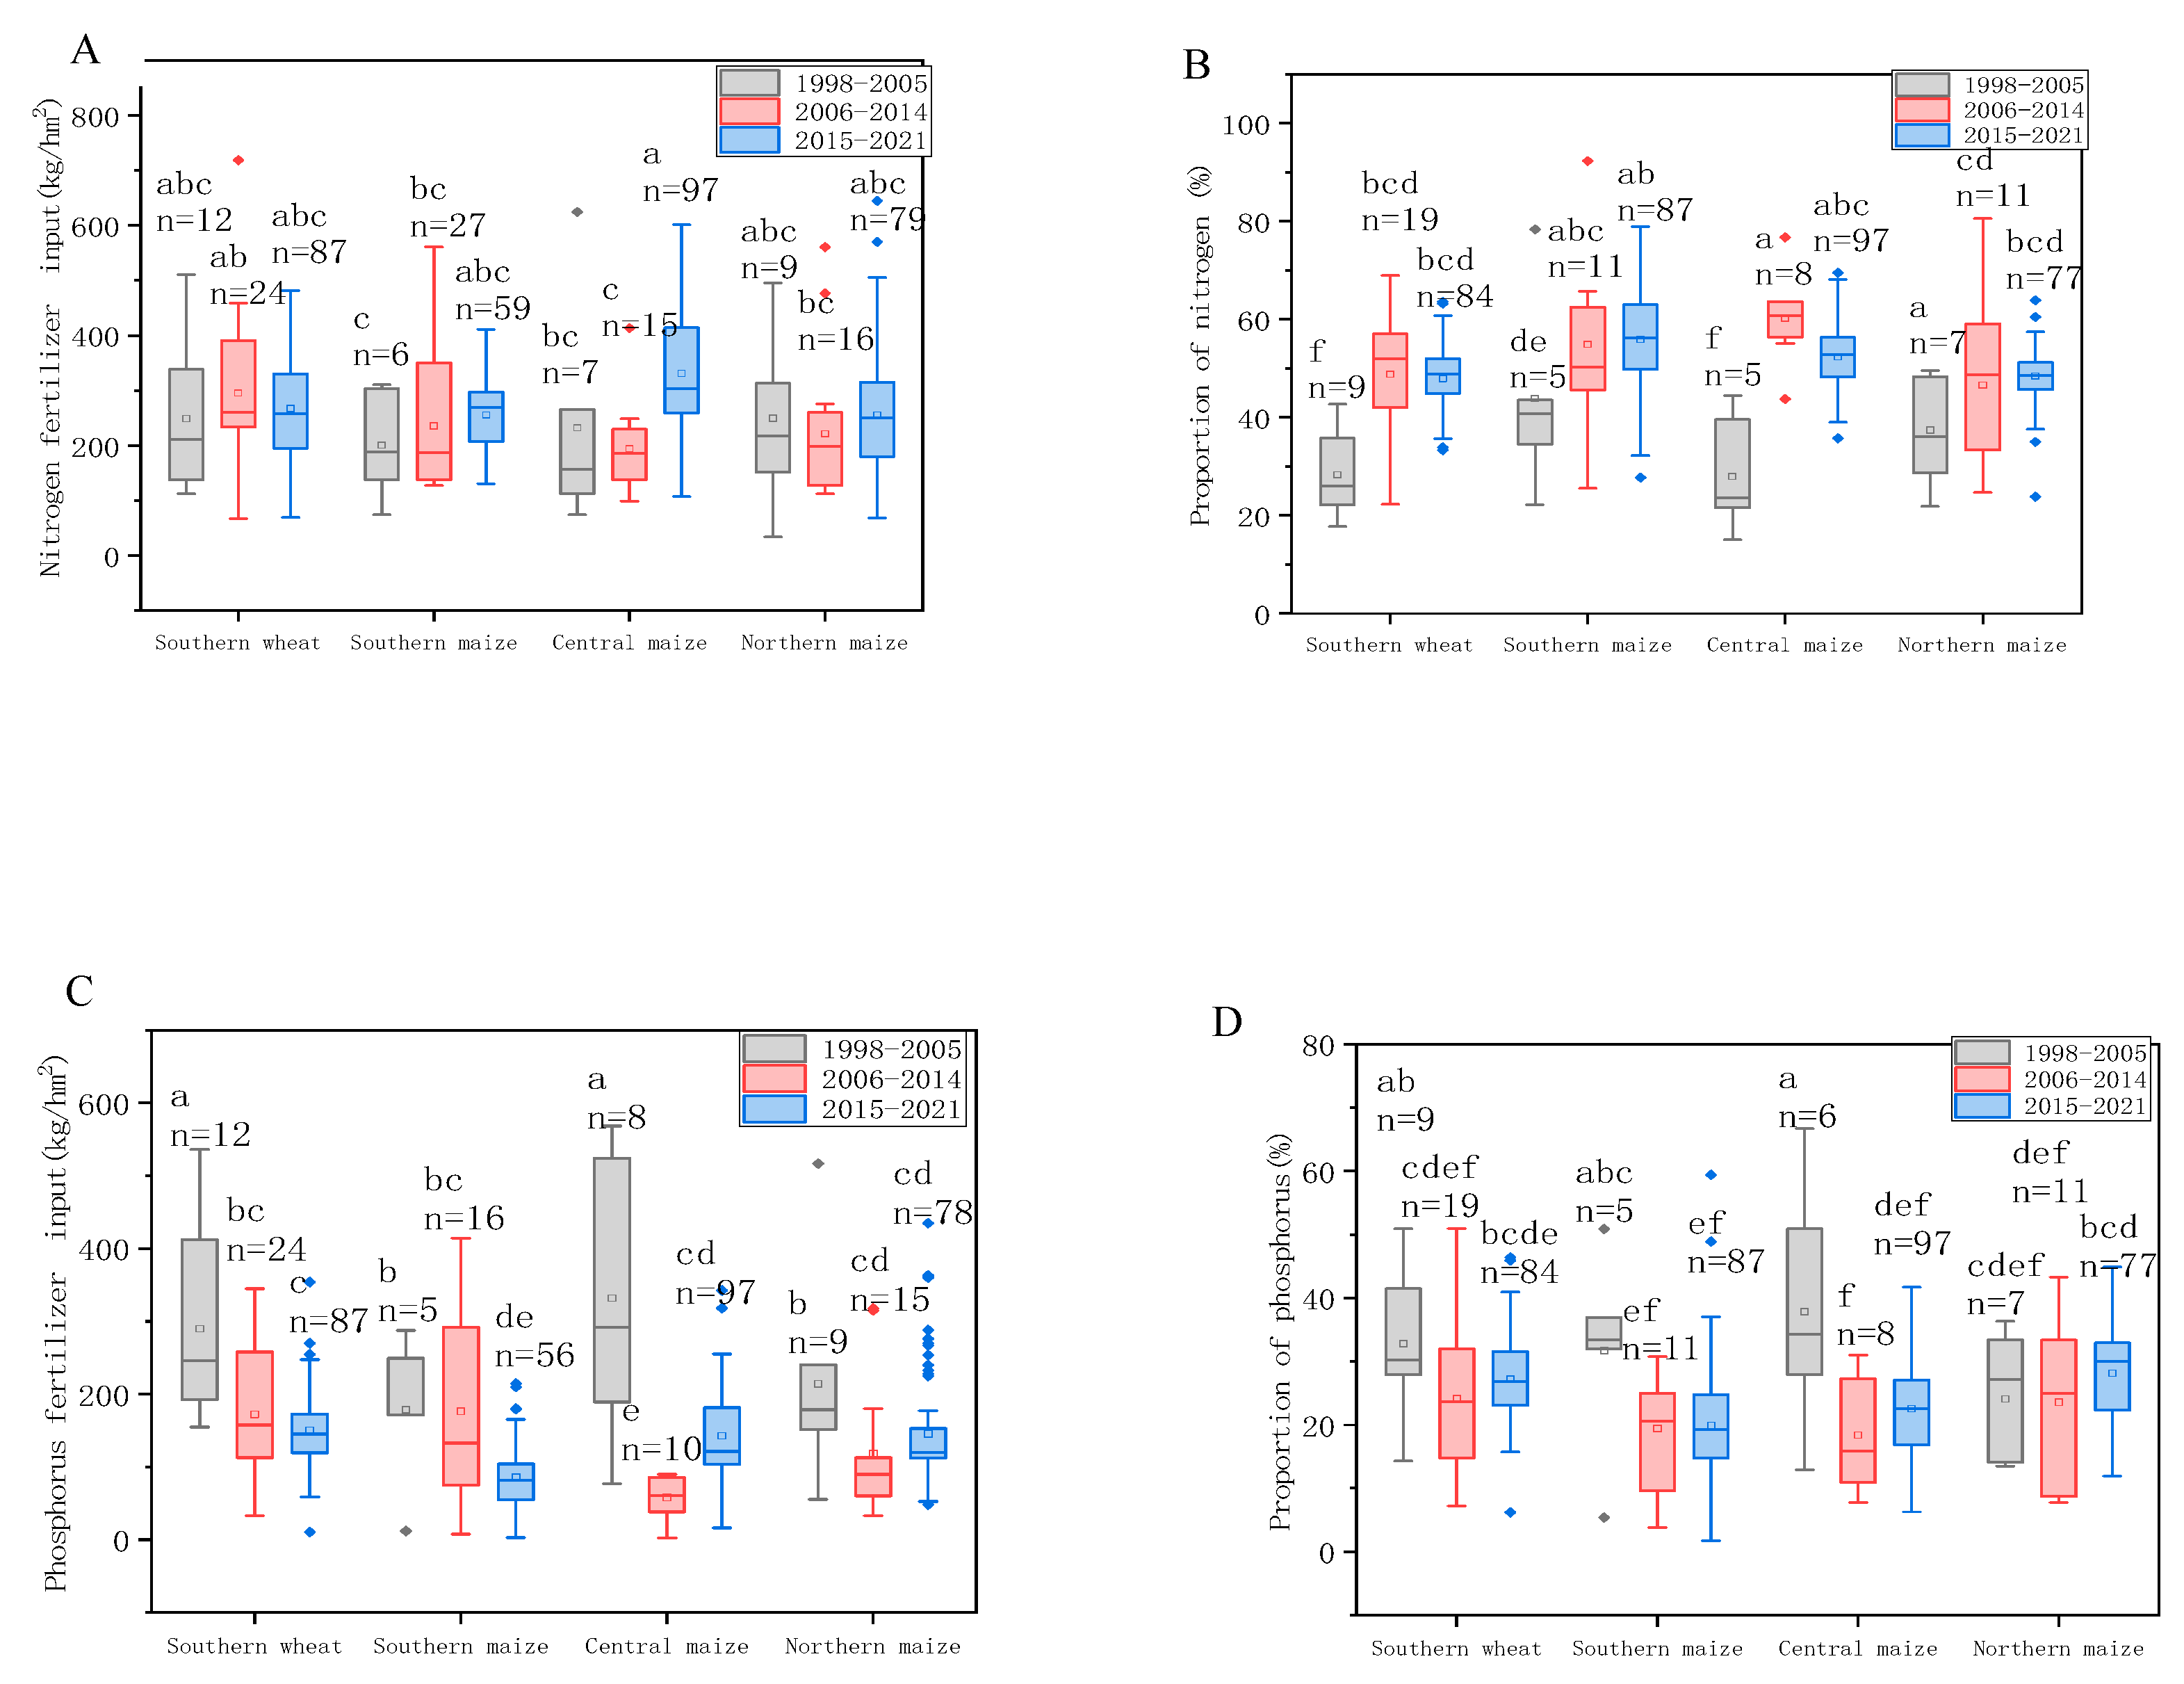
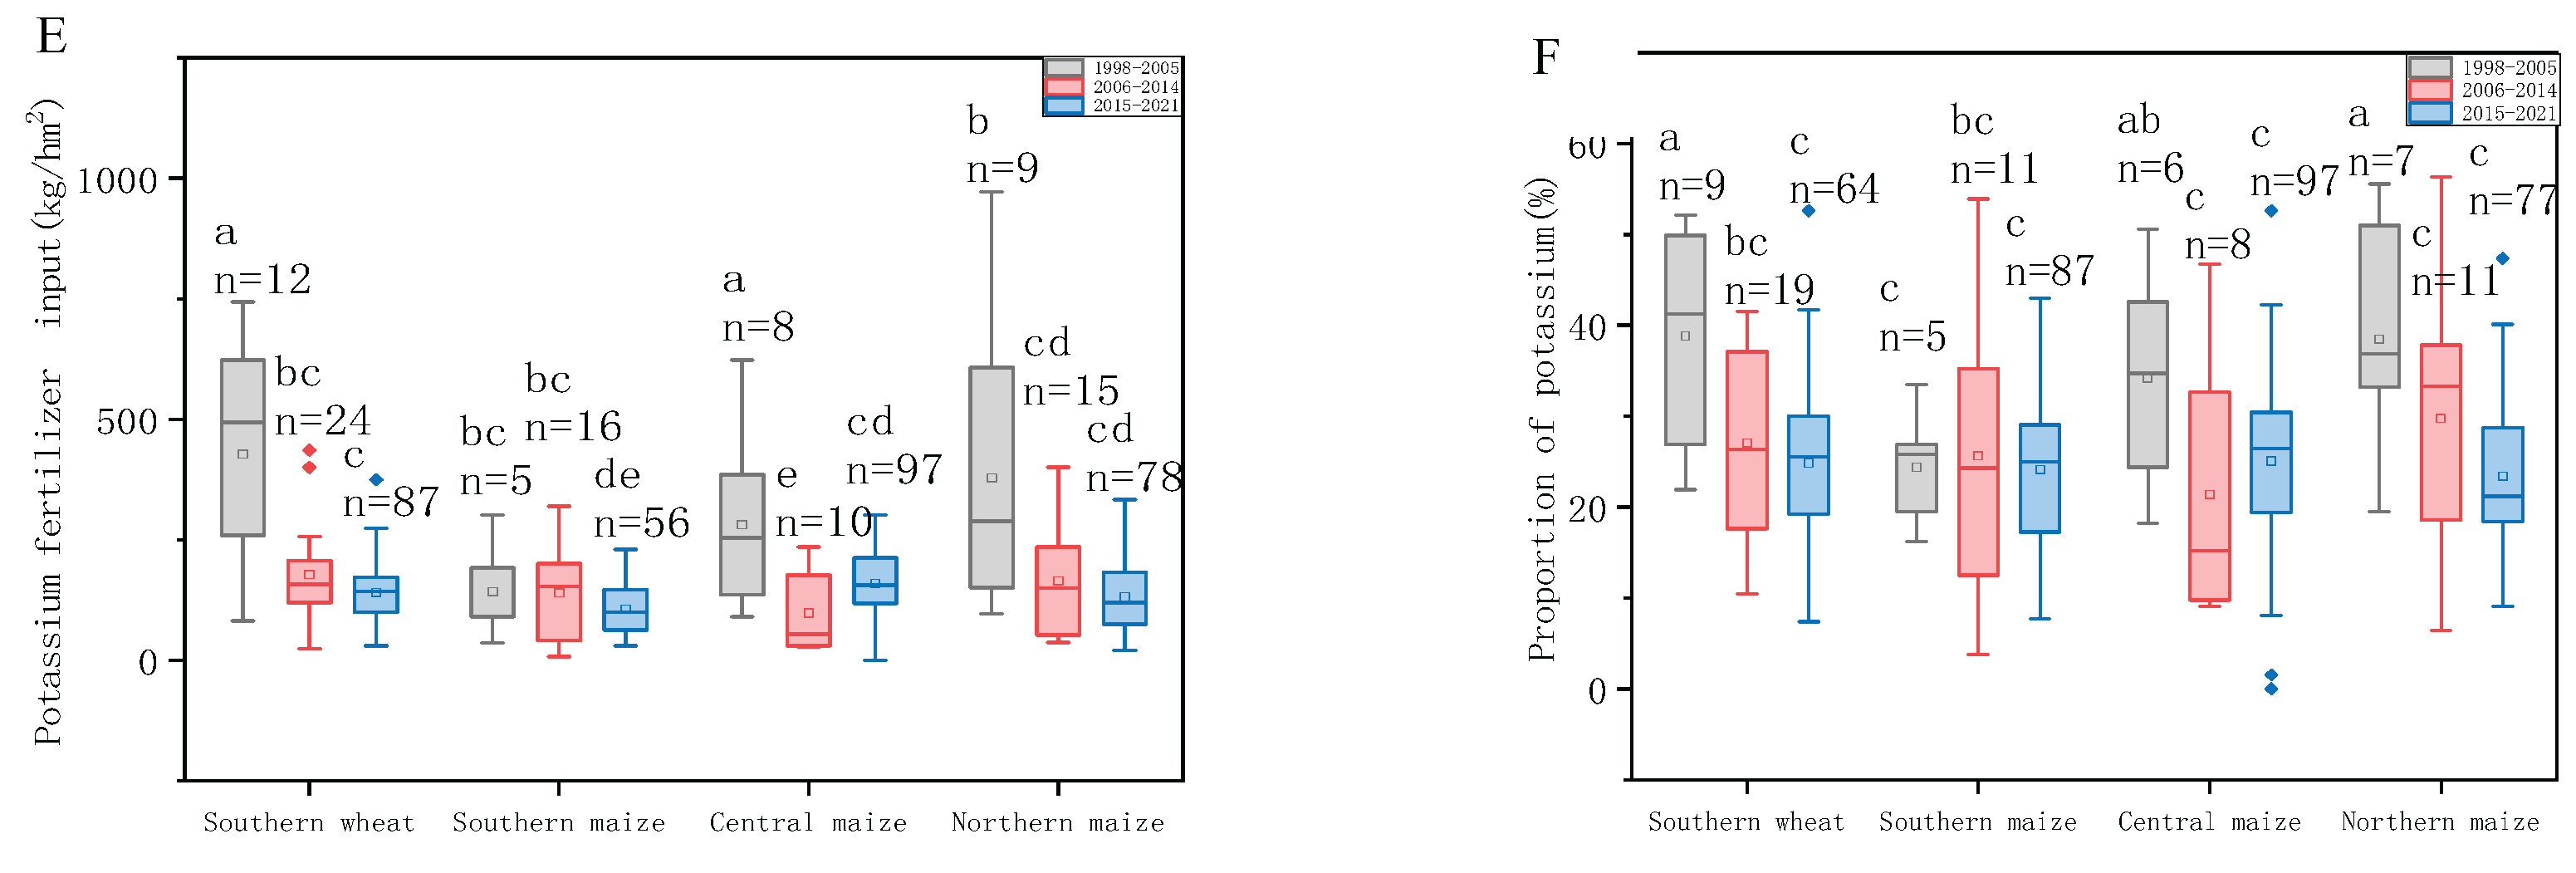
Figure 3.
Relative yield change of wheat and maize under long-term fertilizer application in three regions, with significant differences at the 0.05 level indicated by different lowercase letters in the same ecological region.
Figure 3.
Relative yield change of wheat and maize under long-term fertilizer application in three regions, with significant differences at the 0.05 level indicated by different lowercase letters in the same ecological region.
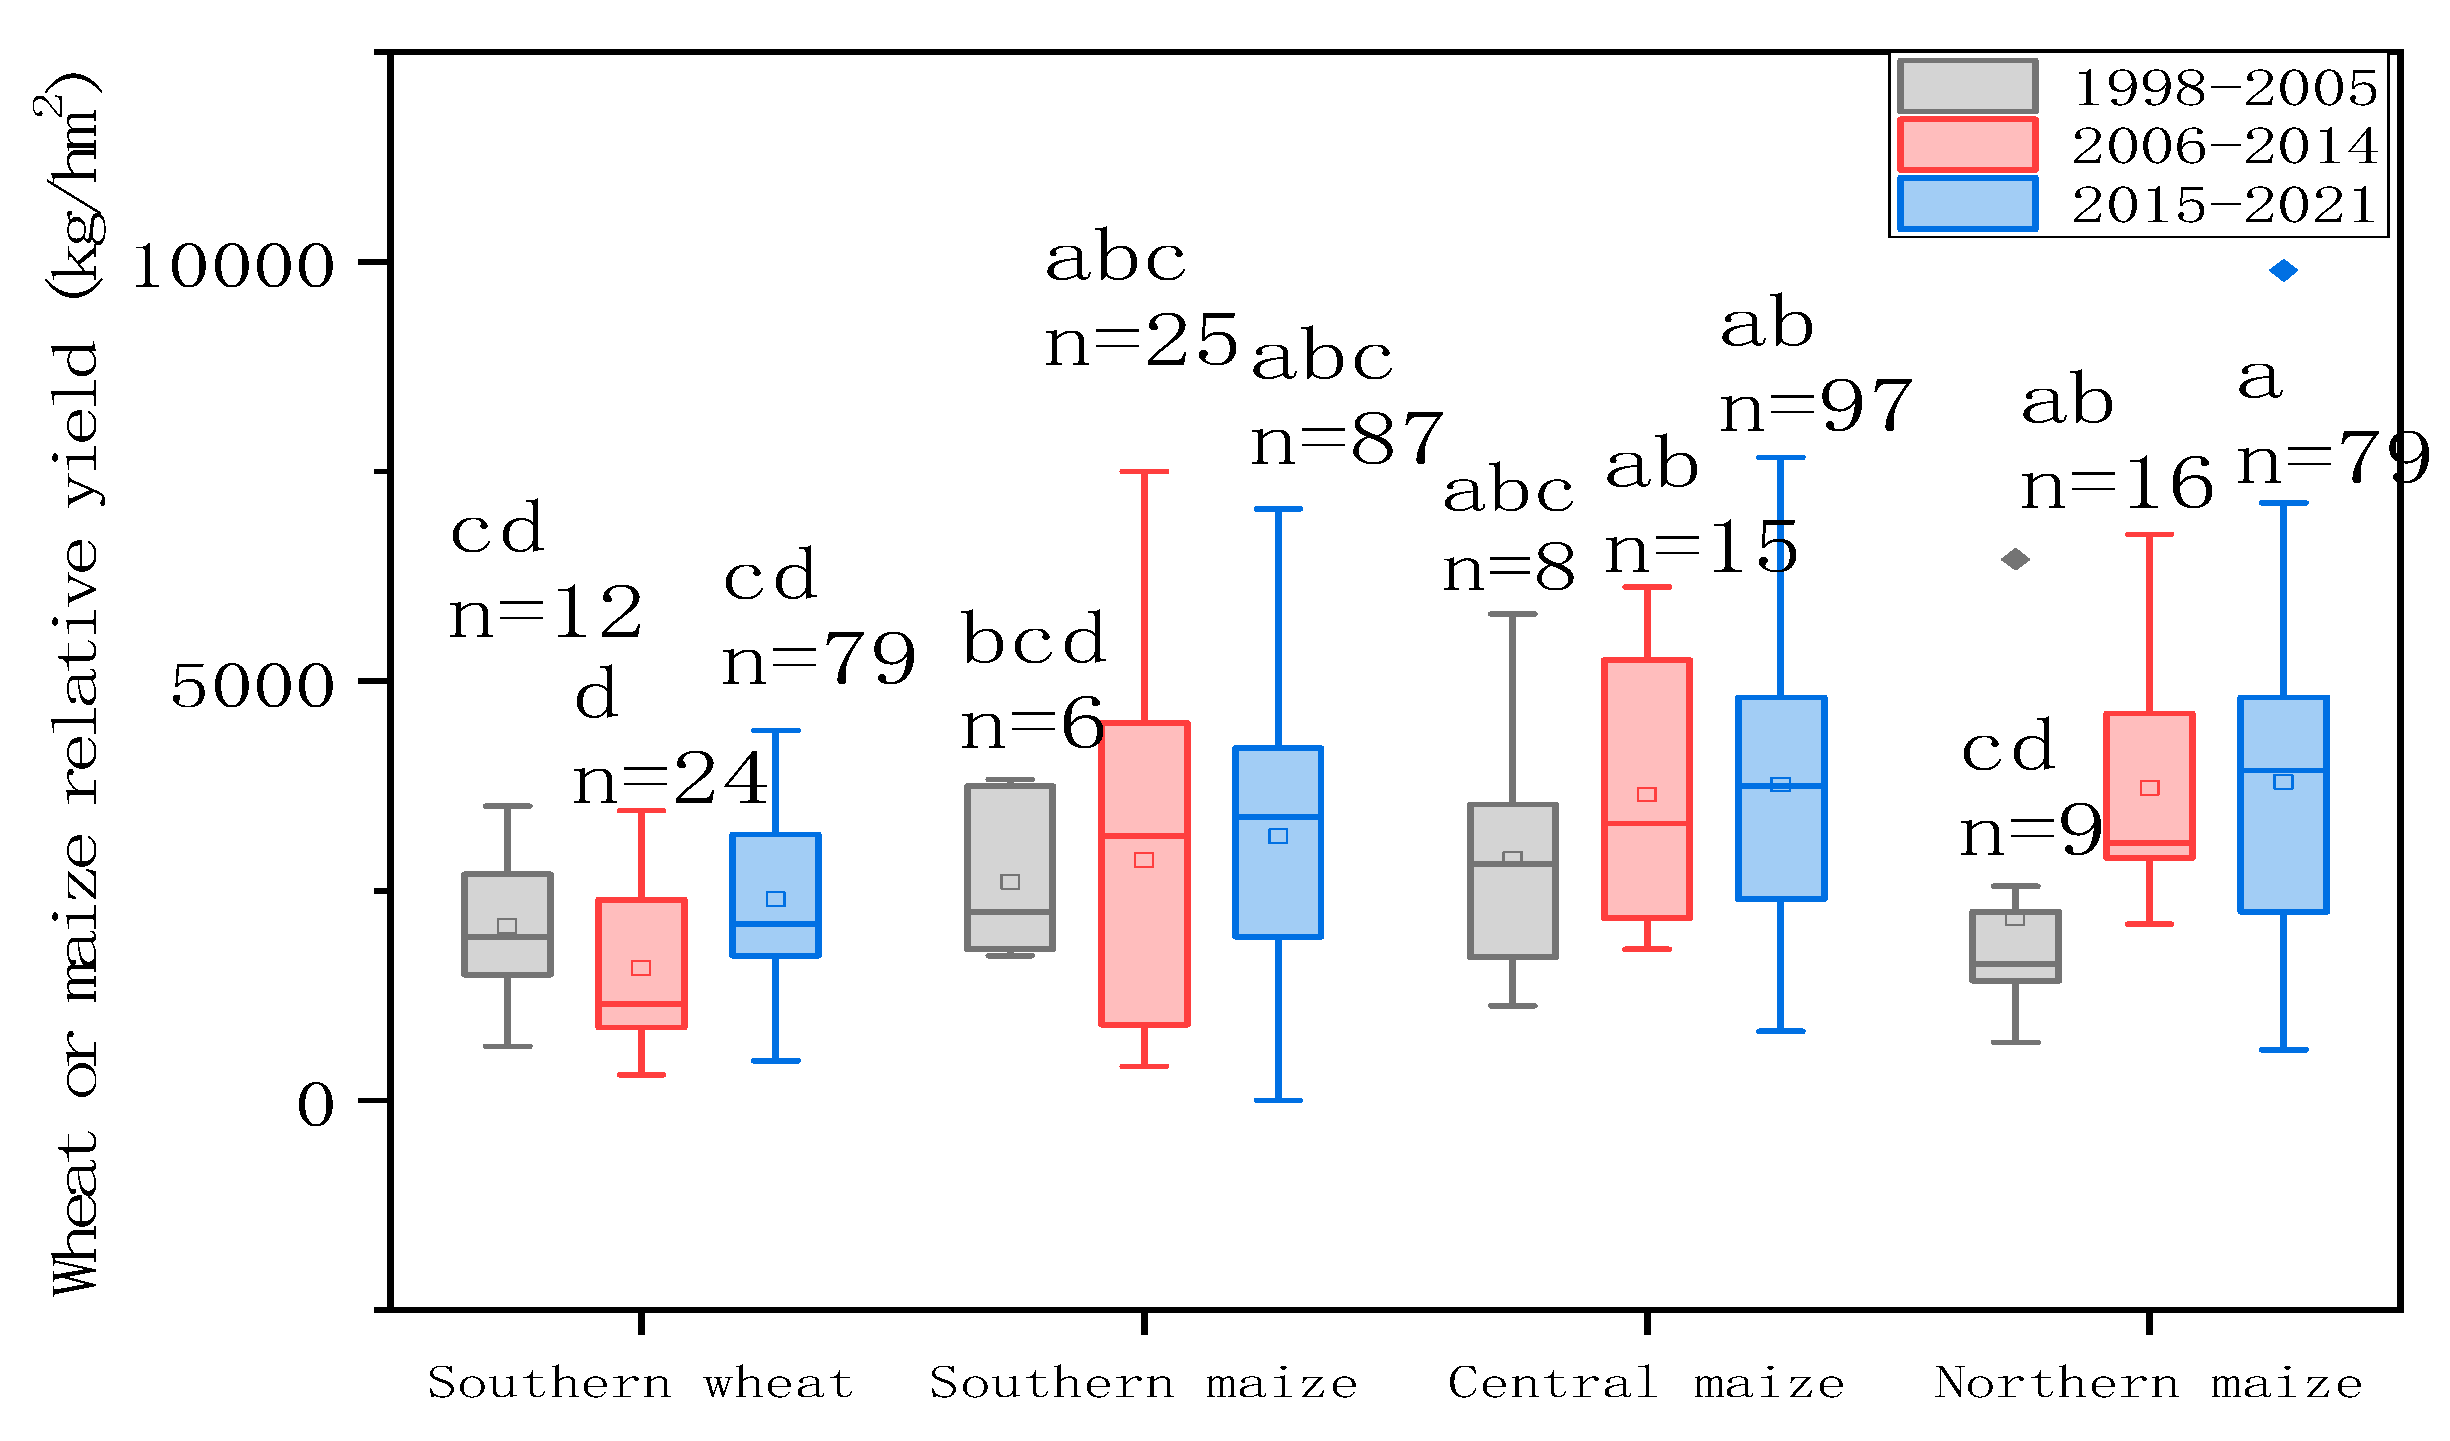
Figure 4.
Contribution index of inherent soil productivity(A) and nitrogen agronomic efficiency (B) under long-term fertilizer application in three areas, with significant differences at the 0.05 level indicated by different lowercase letters in the same ecological region.
Figure 4.
Contribution index of inherent soil productivity(A) and nitrogen agronomic efficiency (B) under long-term fertilizer application in three areas, with significant differences at the 0.05 level indicated by different lowercase letters in the same ecological region.
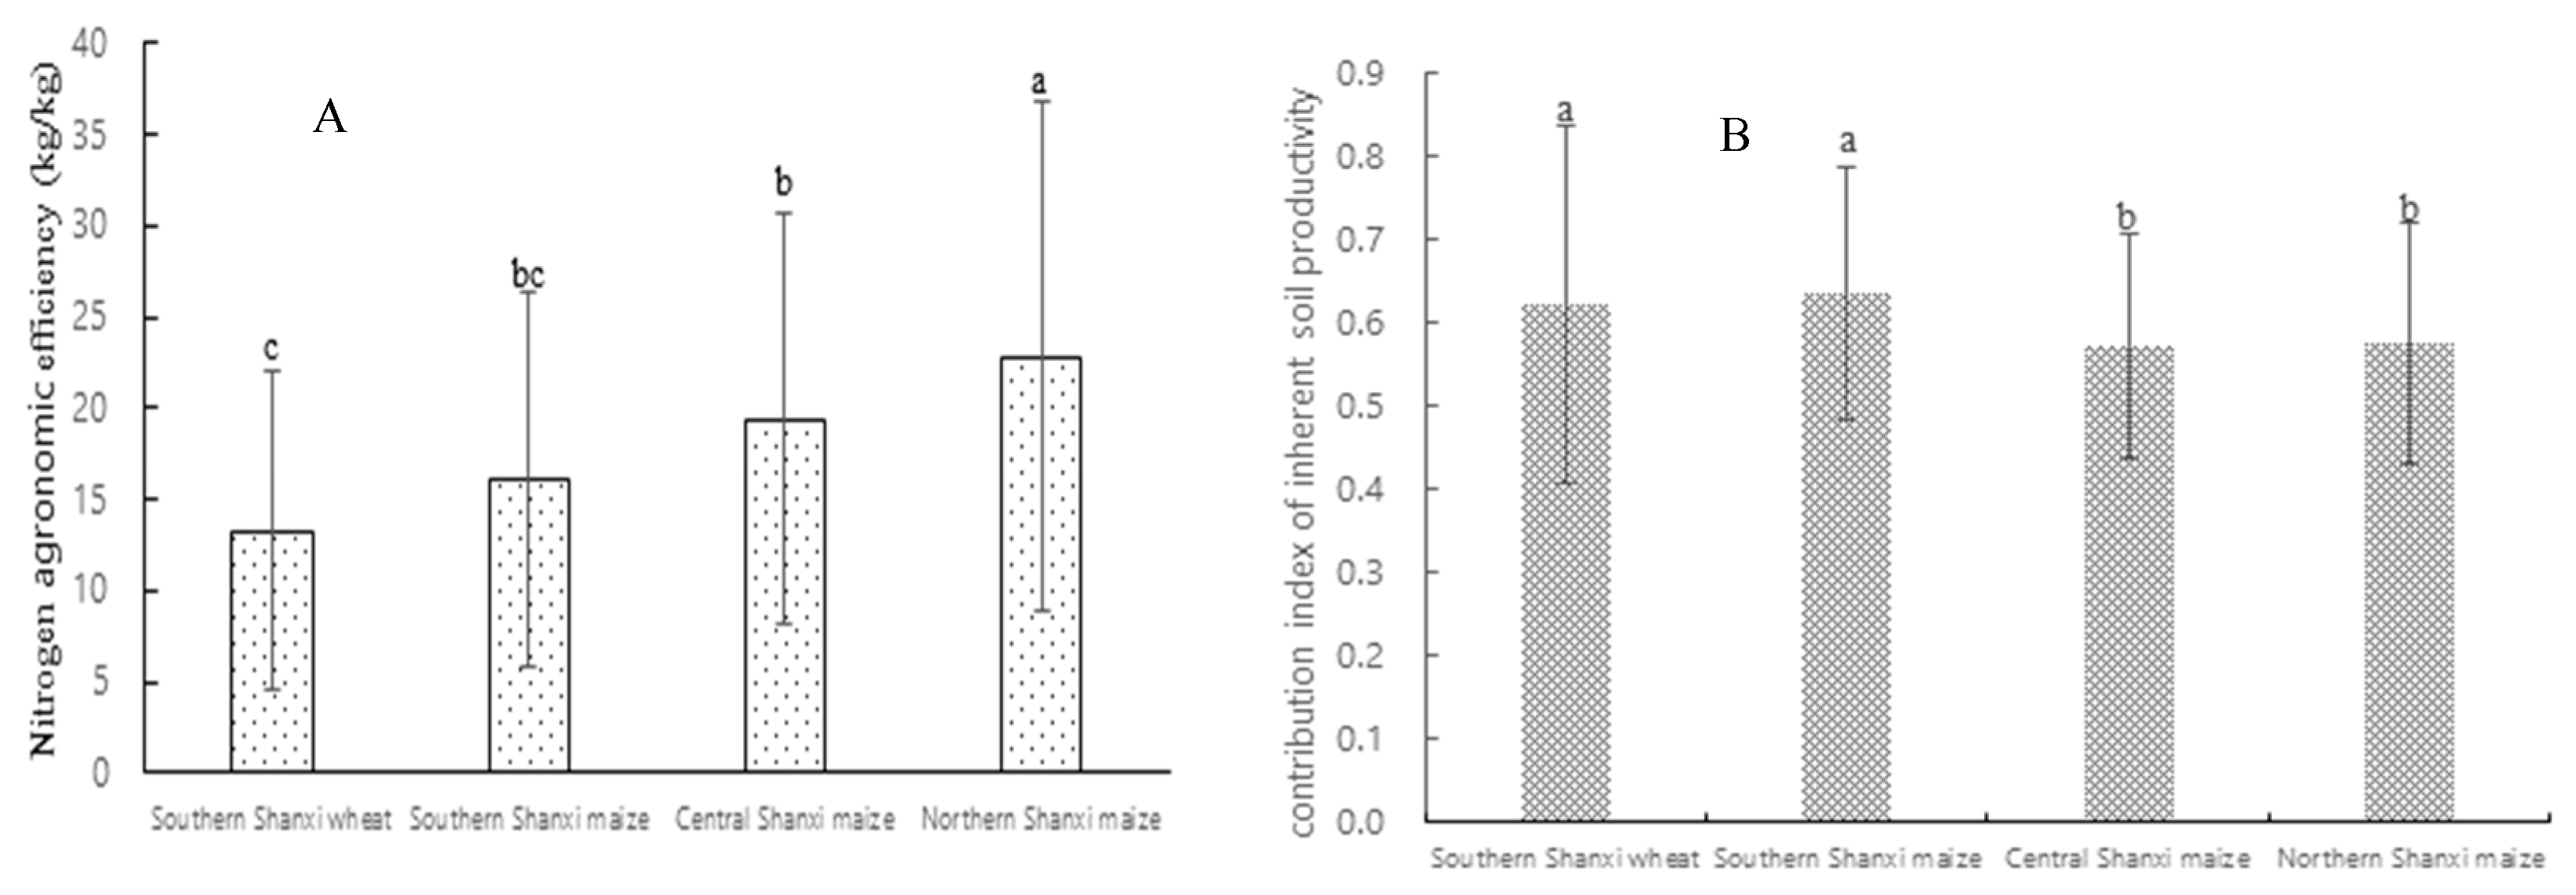
Figure 5.
Relationship between nitrogen agronomic efficiency and contribution percentage of inherent soil productivity under long-term fertilizer application in three areas.
Figure 5.
Relationship between nitrogen agronomic efficiency and contribution percentage of inherent soil productivity under long-term fertilizer application in three areas.
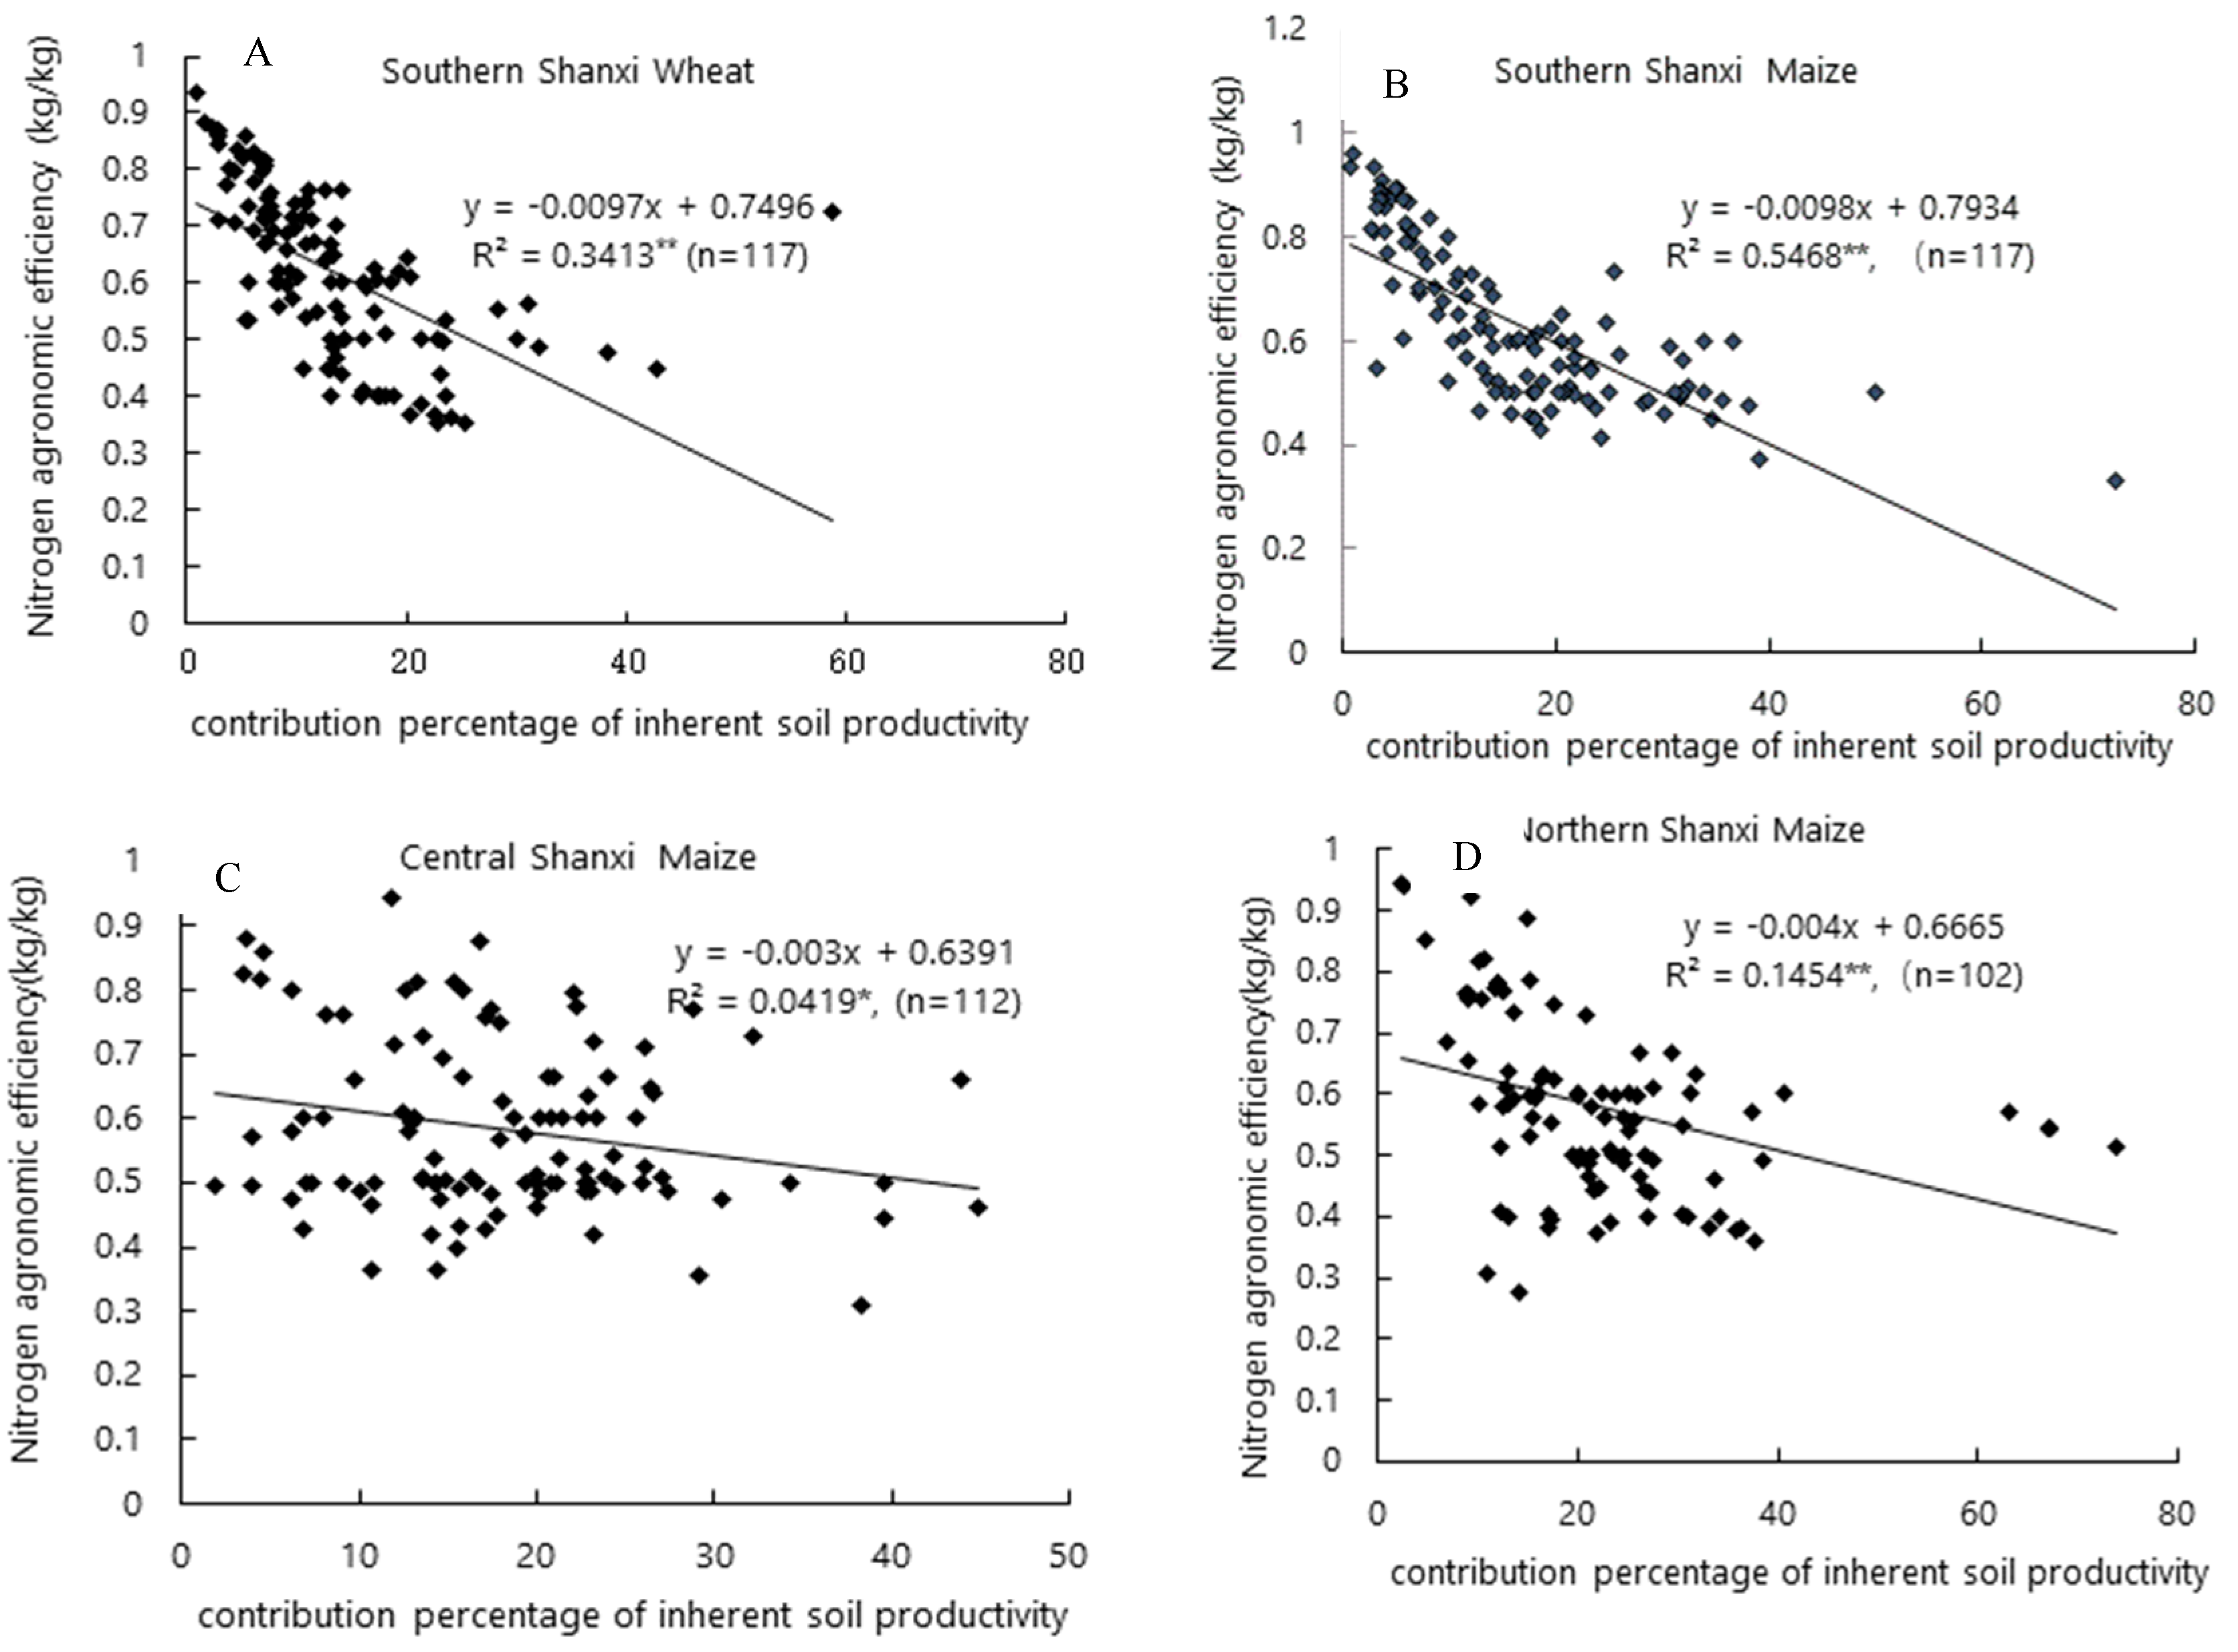
Figure 6.
Effects of regional factors and fertilization on productivity.
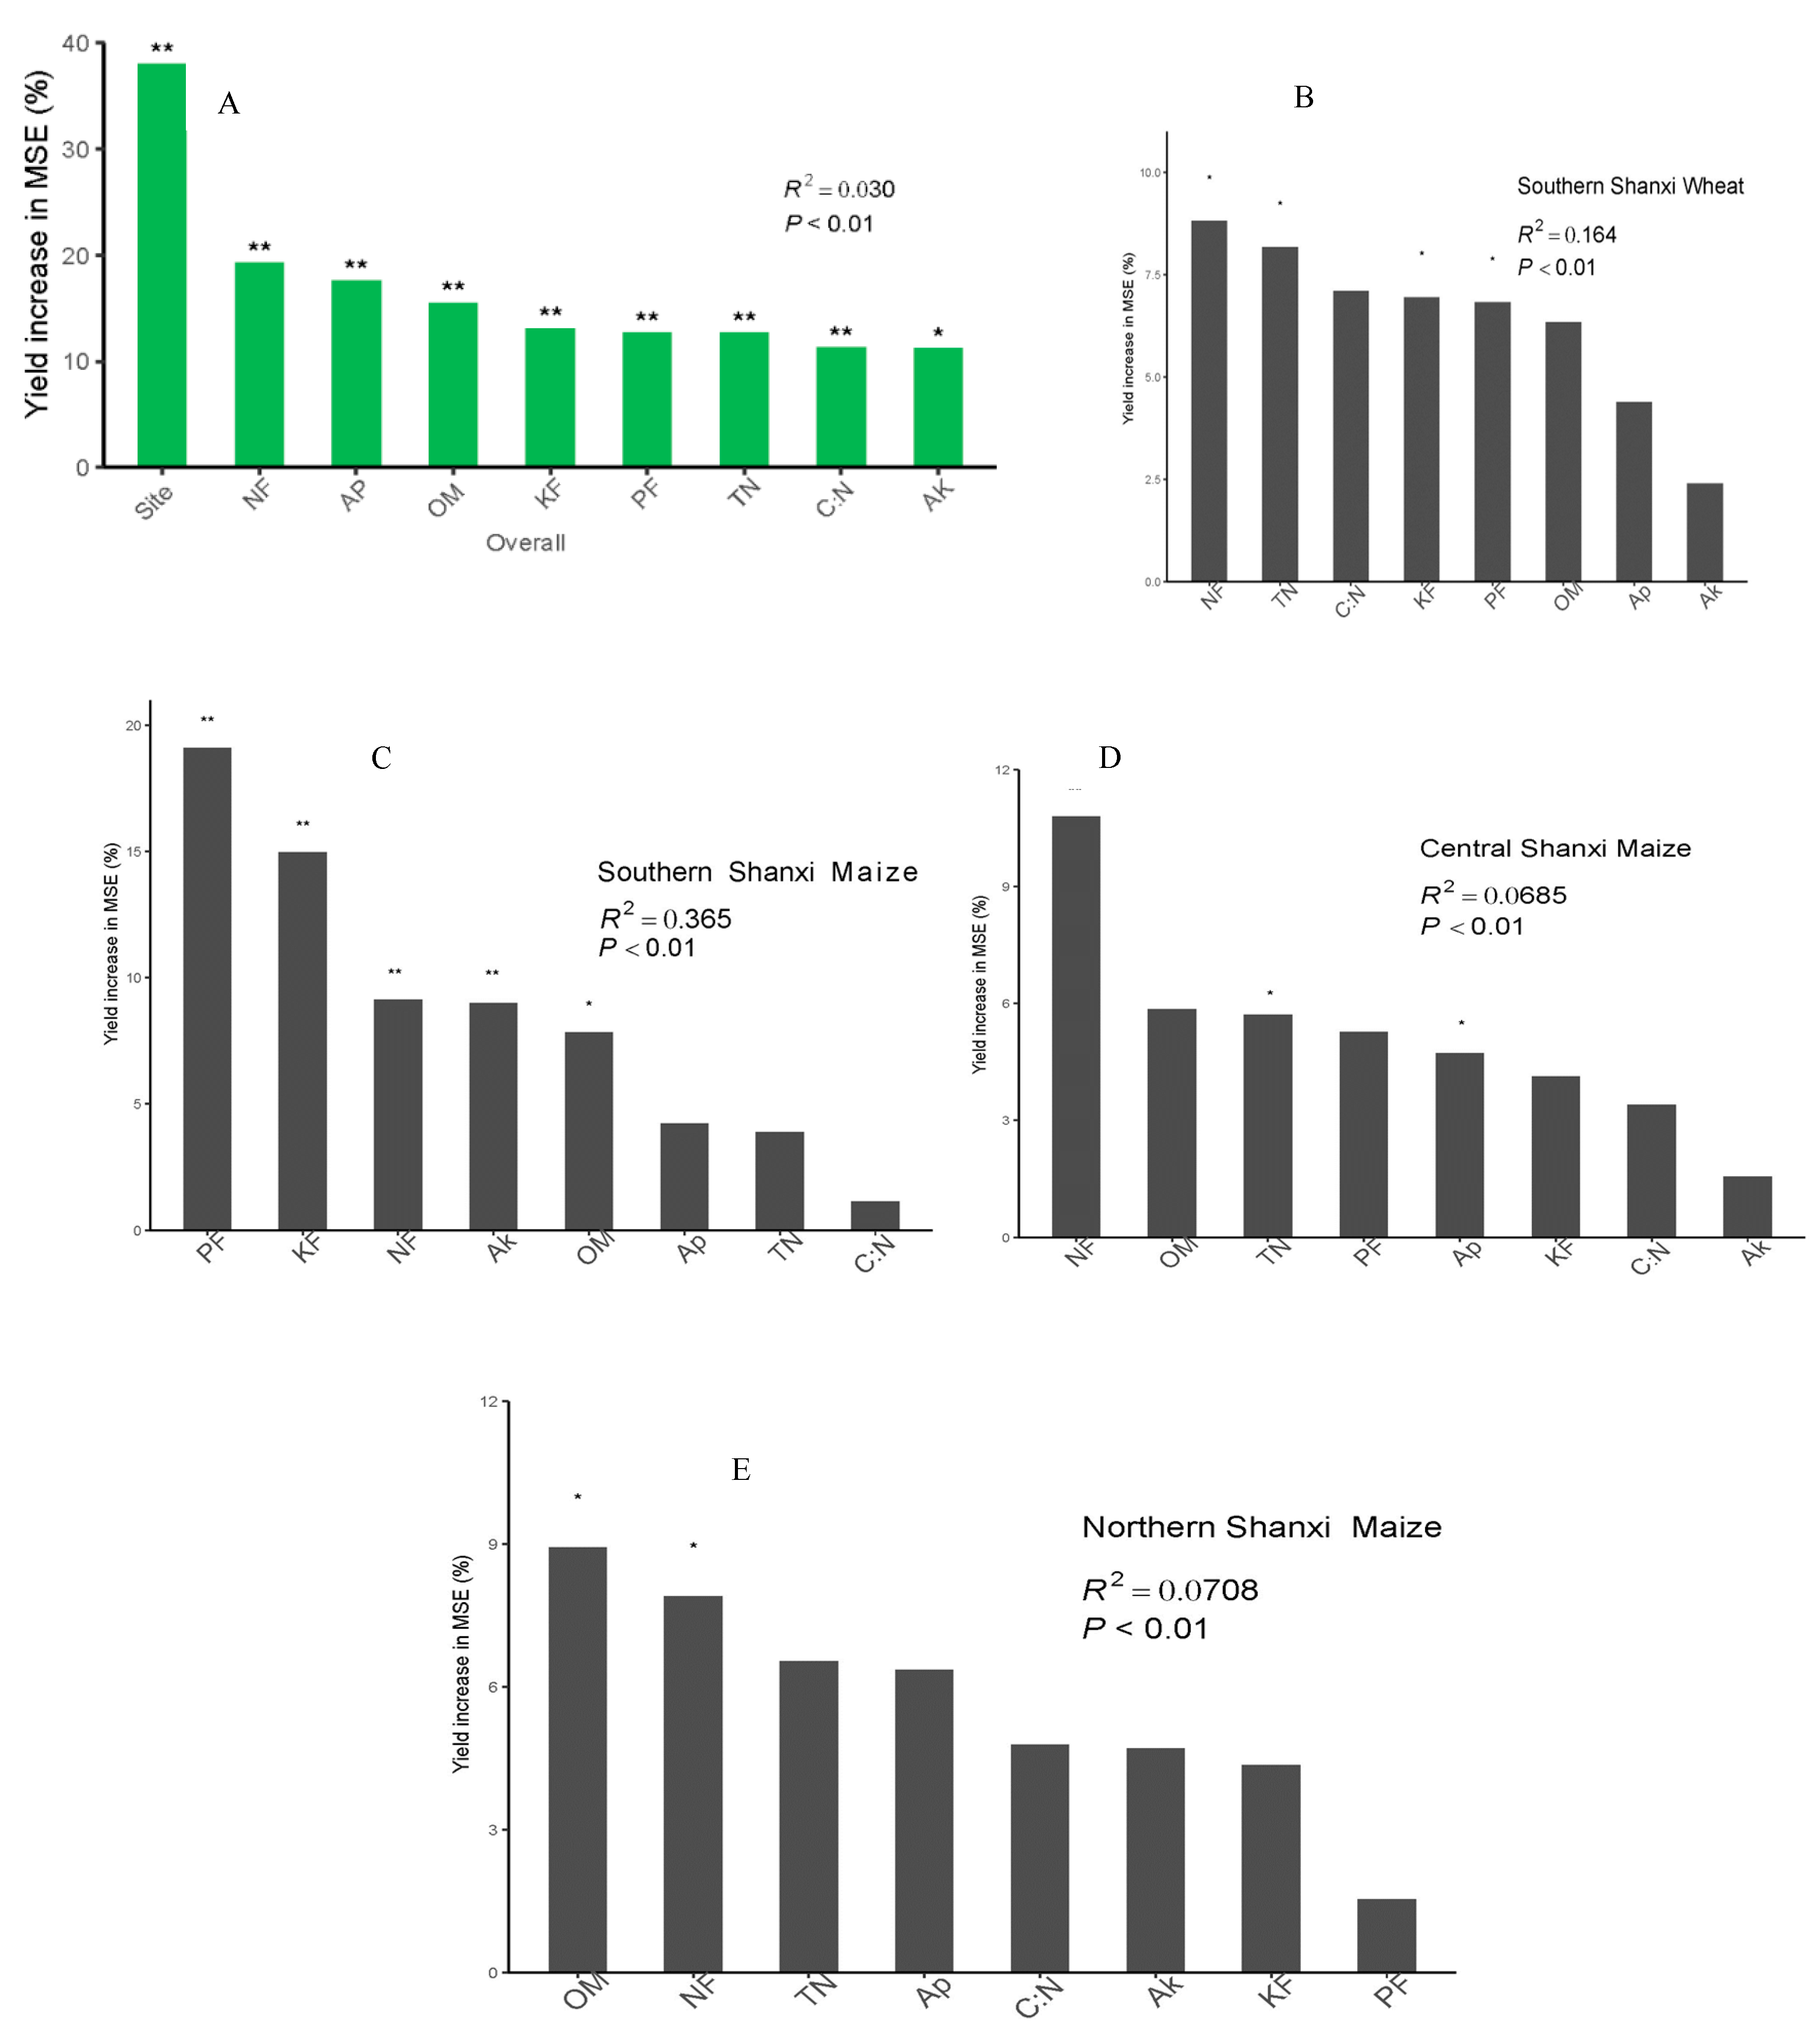

Table 1.
Properties of field soils in the tillage layer (0~20 cm) of every monitored site at different time periods.
Table 1.
Properties of field soils in the tillage layer (0~20 cm) of every monitored site at different time periods.
| Area-Number | Crop Rotation | Crop Type | pH | Organic Matter (g·kg-1) | Total Nitrogen (g·kg-1) | Available Phosphorus (mg·kg-1) | Available Potassium (mg·kg-1) |
|---|---|---|---|---|---|---|---|
| Southern Shanxi-4 | Two crops a year | Wheat, Maize | 7.9-9.4 | 8.6-23.6 | 0.53-1.64 | 1.6-27.1 | 72-329 |
| Southern Shanxi -15 | Two crops a year | Wheat, Maize | 7.7-9.1 | 7.5-34.3 | 0.54-1.63 | 2.1-40 | 80-410 |
| Central Shanxi-2 | One crop a year | Maize | 7.8-8.9 | 13.5-28.3 | 0.71-1.55 | 2.4-31.6 | 90-236 |
| Central Shanxi-19 | One crop a year | Maize | 7.7-9.0 | 2.4-27.6 | 0.18-1.34 | 1.6-32.5 | 80-341 |
| Northern Shanxi-2 | One crop a year | Maize | 7.8-8.7 | 4.3-13.3 | 0.31-1.22 | 2.0-26.0 | 60-241 |
| Northern Shanxi-16 | One crop a year | Maize | 7.6-9.1 | 5.3-39.6 | 0.31-1.93 | 1.4-46 | 55-375 |
Table 2.
Relationships between yield and soil nutrition in unfertilized and conventional plots across ecological regions.
Table 2.
Relationships between yield and soil nutrition in unfertilized and conventional plots across ecological regions.
| Crop | Yield | Soil Nutrition | ||||
|---|---|---|---|---|---|---|
| OM | TN | C: N | AP | AK | ||
| Southern Shanxi wheat | Unfertilized plots | 0.322** | 0.205** | 0.261** | 0.270** | - |
| Conventional plots | 0.327** | 0.187* | 0.255** | - | - | |
| Southern Shanxi maize | Unfertilized plots | - | - | 0.206** | - | - |
| Conventional plots | 0.199* | - | - | - | - | |
| Central Shanxi maize | Unfertilized plots | - | - | - | - | - |
| Conventional plots | - | - | - | 0.229** | 0.174* | |
| Northern Shanxi maize | Unfertilized plots | 0.474** | 0.430** | 0.217* | 0.316** | - |
| Conventional plots | 0.486** | 0.418** | 0.261* | 0.360** | 0.247* |
Note: * Significant correlations are marked with one (P<0.05) and two (P<0.01) asterisks. OM: organic matter; TN: total nitrogen; AP: available phosphorus; AK: available potassium.
Disclaimer/Publisher’s Note: The statements, opinions and data contained in all publications are solely those of the individual author(s) and contributor(s) and not of MDPI and/or the editor(s). MDPI and/or the editor(s) disclaim responsibility for any injury to people or property resulting from any ideas, methods, instructions or products referred to in the content. |
© 2025 by the authors. Licensee MDPI, Basel, Switzerland. This article is an open access article distributed under the terms and conditions of the Creative Commons Attribution (CC BY) license (http://creativecommons.org/licenses/by/4.0/).
Copyright: This open access article is published under a Creative Commons CC BY 4.0 license, which permit the free download, distribution, and reuse, provided that the author and preprint are cited in any reuse.


