Submitted:
09 February 2026
Posted:
11 February 2026
You are already at the latest version
Abstract
The modern prosthetic foot market is characterized by a pronounced polarization between affordable but low-function devices and high-performance yet costly composite prosthe-ses. The aim of this study was to develop and comprehensively evaluate cost-effective, functional prosthetic feet manufactured by fused deposition modeling (FDM). An iterative design methodology was employed, combining finite element analysis to optimize the biomechanical response of the device, incorporation of user-specific requirements and ex-perimental validation. Two TPU 95A-based 3D-printed prosthetic foot designs were de-signed and developed, and their strength and functional characteristics were assessed numerically under the ISO 22675:2024 normative loading cycle. Bench-top mechanical tests were conducted on the fabricated prototypes. Functional performance was evaluated by a transtibial amputee using an inertial motion capture system to analyze gait kinemat-ics. The results demonstrated that both designs operate predominantly within the elastic range with an adequate safety margin. The pilot gait assessment indicated biomechani-cally acceptable walking kinematics for both prototypes, with a subjective preference for the smoother rollover provided by Model 2.
Keywords:
prosthetic foot
; additive manufacturing
; fused deposition modeling
; thermoplastic polyurethane
; finite element analysis
; biomechanics
; inertial motion capture system
1. Introduction
One of the key aims of rehabilitation for individuals with lower-limb amputation is to ensure access to prosthetic feet that are both functional and affordable. At present, markets in many regions of Asia, Africa, and other low- and middle-income settings are characterized by a pronounced polarization of available solutions. On the one hand, low-activity prosthetic feet manufactured using outdated technologies remain widespread, such as designs with a wooden core and polyurethane foam filling (e.g., SACH feet). Despite their low cost, their limited functional and biomechanical performance can substantially reduce users quality of life and increase the risk of secondary musculoskeletal disorders [1,2]. On the other hand, high-performance composite prosthetic feet (e.g., carbon fiber and related laminates) that better support natural gait remain inaccessible to a significant proportion of patients due to their high price [3,4]. Therefore, there is an urgent need for solutions that can bridge this gap by combining acceptable cost with high functional performance.
Additive manufacturing represents a promising approach for developing accessible yet functional prosthetic feet [5,6,7]. A key advantage of 3D printing in this context is the ability to precisely control the internal geometry and spatial stiffness distribution of the prosthetic structure [8,9,10]. This enables direct tuning of the biomechanical response and targeted design of prosthetic characteristics for specific gait phases and for individual users or user groups. In addition, 3D printing allows rapid and cost-efficient fabrication of functional prototypes for intermediate-stage testing, thereby accelerating iterative design cycles. Among the various 3D printing methods, fused deposition modeling (FDM) is particularly relevant for lower-limb prosthetic applications. This choice is motivated by two main factors. First, FDM is among the most cost-effective additive manufacturing technologies, which directly aligns with the goal of reducing the final product cost [11,12]. Second, the FDM ecosystem supports a wide range of polymeric materials, including thermoplastic polyurethanes (TPU) - a class of elastomers whose high impact toughness and ability to undergo large elastic deformations make them well suited for mimicking key functional properties of biological foot tissues [13,14].
A review of recent studies confirms the potential of FDM for this task and illustrates the evolution of materials and modeling approaches. In one of the early works in this field [15], a conventional structural thermoplastic (ABS) was used to fabricate an energy-storing prosthetic foot prototype, demonstrating the feasibility of applying FDM in limb prosthetics. Subsequent research shifted toward purposeful tailoring of biomechanical properties of printed prostheses. For example, to reproduce the nonlinear stiffness of the metatarsophalangeal joint during push-off, investigators combined FDM printing of carbon-fiber-reinforced nylon with advanced finite element analysis (FEA) and geometric optimization of auxetic cells [10]. This approach achieved characteristics close to those of the natural foot and highlighted the importance of controlling micro-geometry in printed prosthetic structures. In parallel, more compliant materials - particularly TPU - have been successfully applied to achieve the flexibility, strength, and comfort required in transtibial prosthetic designs [16].
A major step toward reducing the performance gap relative to composite commercial devices has been the integration of continuous-fiber-reinforced materials into the FDM process. Studies indicate that using composite cores with outer skins of continuous fiberglass can yield stiffness values within 5% of those of commercial carbon laminates [17]. Static testing of such 3D-printed composite prosthetic feet has confirmed compliance with international standards (ISO 22675:2024), the ability to sustain loads exceeding 4000 N, and differentiated stiffness profiles required for impact attenuation and energy return [18]. In addition, the broader field of additive prosthetics continues to advance through automated design methods based on 3D scanning [19] and topology optimization for weight reduction [16].
Overall, the current technological level reported in the literature supports the feasibility of producing functional prosthetic feet using FDM. Key success factors repeatedly emphasized include the use of elastomers (TPU) to enable elastic deformation [16] and rigorous biomechanics-driven design supported by FEA [10,19]. At the same time, additive prosthetics is expanding toward increased automation and optimization.
The aim of the present study was to experimentally test the hypothesis that a competitive prosthetic foot can be produced via FDM using an elastomeric TPU material. Two different structural strategies - monolithic and modular - were developed and analyzed with respect to strength and biomechanical performance. The study addressed the following objectives:
- To develop and validate a design-and-analysis methodology by comparing FEA predictions with results from mechanical bench testing of printed prototypes on a hydraulic testing machine, thereby assessing the adequacy of the computational model and its assumptions.
- To perform a comparative evaluation of the two design strategies across multiple criteria:
- a. strength performance via stress–strain state assessment under the ISO 22675:2024 standardized loading cycle;
- b. laboratory biomechanical metrics, including ankle and metatarsophalangeal flexion angles and heel damping behavior;
- c. real-world functionality via comparative gait kinematics assessment in a transtibial amputee using the developed prototypes and the user’s standard carbon-fiber prosthetic foot.
- To conduct a practical proof-of-concept evaluation in a high-body-mass user (108 kg), confirming that the TPU-based FDM prosthetic foot can withstand ISO 22675:2024 -regulated loads while providing baseline functional walking performance.
The novelty of this work lies in the demonstration of an end-to-end development pipeline: CAD/FEA - FDM manufacturing - bench testing - pilot biomechanical gait study-implemented using widely available equipment and a common material (TPU 95A). This approach enables not only the assessment of structural integrity but also the linkage of design parameters to functionally relevant gait outcomes, which is critical for transitioning from prototyping to clinically meaningful solutions.
The relevance of the study is driven by growing demand for prosthetic care alongside the need to reduce cost and manufacturing time without compromising functionality. FDM enables decentralized and/or local fabrication, rapid replication or replacement of components and personalization of stiffness as well as mass–geometry characteristics to match individual user needs and operating conditions.
2. Materials and Methods
2.1. 3D-Printed Prosthetic Feet Models
Two alternative geometric models of a prosthetic foot were developed for a comparative investigation of their strength and biomechanical characteristics. The baseline overall dimensions were adopted from commercial low-profile prosthetic feet with a height of 80 mm, the length of both models was matched to the tested patient foot size and set to 270 mm. The external shell, reproducing an anatomical shape and adapted for use with and without footwear, was designed using Blender software. The internal load-bearing architecture governing the mechanical response was designed and modified in SolidWorks software. The designs were refined iteratively based on finite element analyses performed in ANSYS Mechanical software, followed by evaluation of key performance indicators.
Model 1 is a monolithic design intended for additive manufacturing with horizontal layer deposition (Figure 1a). Under this printing strategy, the primary compliant elements are oriented predominantly parallel to the print layers, which reduces the likelihood of interlayer delamination under service loads and improves reliability under cyclic loading. However, this layer orientation constrains the feasible spatial arrangement and combinations of compliant features. In the functional region responsible for reproducing ankle-like kinematics and forefoot deformation, a lattice structure was implemented to provide the required compliance while maintaining increased torsional stiffness. Heel cushioning is achieved by a system of horizontally oriented flexible elements that deform mainly in bending with a secondary contribution from shear.
Model 2 is a modular (multi-part) design intended to be manufactured as separate components, with print layers oriented within the plane of the dominant service loading (Figure 1b). This strategy enables purposeful specification of the orientation and geometry of compliant elements with respect to the principal stress–strain directions, which can potentially increase energy efficiency by enhancing elastic energy storage and return during the gait cycle. Structurally, the model incorporates a heel damping element to attenuate impact loads during initial contact and a compliant toe segment to enable controlled rollover. The load-bearing section in the ankle region is implemented as an elastic structural system whose predominantly bending deformations provide a closer reproduction of the trajectory of the ground reaction force application point relative to the ankle center during stance and push-off, thereby making the overall kinematic-dynamic behavior more physiologically consistent.
The 3D-printed prosthetic feet were fabricated using an FDM printer Neptune 4 Max by Elegoo with the following process parameters: nozzle diameter - 0.6 mm, extruder temperature - 235 °C, heated bed temperature - 60 °C, infill density - 100% (solid), layer height - 0.3 mm and infill line width - 0.9 mm. The mass of the fabricated specimens was 929 g for Model 1 and 727 g for Model 2.
Figure 1 also shows photographs of the manufactured samples of both prosthetic foot configurations. To ensure compatibility with standard modular prosthetic components and to enable subsequent integration into a transtibial prosthesis assembly, the prototypes were equipped with a standard pyramid-type alignment and connection adapter (“pyramid” type). This interface allows precise alignment of prosthetic components and ensures reproducible mounting conditions during experimental testing and comparative evaluation of the two designs.
2.2. Prosthetic Foot Material
The primary material selected for fabrication and numerical modeling was thermoplastic polyurethane TPU 95A by Eryone. This material was chosen due to a set of properties critical for prosthetic foot function, including high impact toughness, wear resistance, and the ability to sustain large elastic deformations, which collectively enable the required compliance and potential energy return.
It is well known that parts produced by fused filament fabrication exhibit pronounced mechanical anisotropy as a result of filament orientation and limited interlayer adhesion. Nevertheless, in the present study a simplified isotropic material model was adopted. This assumption is justified by the fact that the geometry and print strategy of both designs were deliberately configured such that, in the most critically loaded regions, the principal service loads are oriented predominantly along the deposition direction. Under these conditions, the dominant deformation mechanisms are tensile and compressive loading of the extruded filament itself, whereas interlayer failure modes (shear and peel-off along adhesion planes), which typically exhibit reduced strength and stiffness, have a secondary influence on the global structural response. Therefore, the integral strength and deformation behavior in the considered loading regimes is primarily governed by the filament material properties under near-uniaxial loading, making the isotropic approximation acceptable for the intended comparative assessment of strength and compliance.
According to the literature [13,21,22], the tensile strength of TPU 95A exhibits substantial variability and typically falls within the range of approximately 20 - 40 MPa, while the yield strength (conventional elastic limit) is reported to be not lower than 8.6 MPa. Given that the mechanical properties of FDM/FFF-printed components can vary markedly depending on printing parameters, machine characteristics, and filament formulation/manufacturer, the elastic constants of the material were experimentally identified in this study. Specifically, the Young’s modulus E and Poisson ratio ν were determined on a printed TPU 95A test samples using a triaxial compression setup (Geotek GT 1.3.4).
2.3. Finite Element Model
Numerical simulations were performed in ANSYS 2023 R1 software. The geometric models of both prosthetic foot configurations were imported into ANSYS Mechanical and analyzed using the finite element method. In both cases, the computational domain was discretized with an unstructured three-dimensional mesh based on tetrahedral solid elements (Figure 2). Each model contained approximately 2.5×10⁴ volumetric elements, providing a practical balance between computational cost and the accuracy required to resolve the stress–strain state with the available computational resources.
In the area intended for coupling with the alignment adapter, a fully fixed boundary condition was imposed, constraining all translational and rotational degrees of freedom. The interaction between the plantar surface of the prosthesis and a rigid supporting plane was modeled using a frictionless contact formulation. This assumption is justified by the fact that, during level walking, tangential (friction-related) forces are typically substantially smaller than the normal ground reaction forces and therefore have a secondary effect on the overall stress distribution within the structure. Moreover, the horizontal load component contributes only marginally to the bending moment generated by the ground reaction force about the ankle region; consequently, its influence on the global mechanical response of the prosthesis within the adopted modeling framework can be considered negligible.
2.4. Target Characteristics of Prostheses
Based on the finite element analysis, a comprehensive assessment of the strength and functional performance of the investigated designs was conducted. Strength was primarily evaluated using the distribution of von Mises equivalent stress. A design was considered to satisfy the strength requirements provided that the maximum predicted stresses did not exceed the allowable level for the employed material, taking into account the adopted safety factor.
The functional performance of the prosthetic feet was assessed by comparing the kinematic response of the structure against target requirements derived from the patient’s clinical needs and from gait analysis data acquired using an inertial motion capture system. The key functional metrics were the flexion angles in the ankle region and in the forefoot, reflecting the ability of the prosthesis to provide a physiologically plausible rollover and push-off during stance.
For quantitative analysis, the coordinates of predefined control points were extracted from the simulation results before and after deformation. Changes in their spatial positions were used to compute the flexion angles corresponding to the ankle and metatarsophalangeal regions, denoted as α and β, accordingly, for each loading phase (Figure 3). In addition, to characterize the damping behavior of the heel region, the vertical deformation dz at selected heel points was evaluated. This parameter quantifies the compliance of the structure and its capacity to attenuate impact loads during initial contact at the beginning of the gait cycle.
2.5. Load Cycle Description
As the normative basis for defining the loading regime in the numerical simulations, the load level corresponding to the test subject body mass was adopted in accordance with ISO 22675:2024. This load level represents one of the standard baseline conditions defined from an aggregated population of users, including individuals with body mass exceeding 100 kg. Application of this regime enables assessment of the structural integrity of the design under demanding service conditions representative of the combination of high body mass and elevated mechanical exposure, which is essential for demonstrating the practical applicability of the proposed prosthetic foot concept.
The standard specifies a dynamic loading profile intended to reproduce the characteristic stance phase of walking. The input parameters are provided as discrete values of the support-platform inclination angle γ(t) relative to the horizontal plane and the test force F(t) applied along the tibial axis, which is taken as vertical. Figure 4 presents the relationship between the prescribed test force and the platform inclination angle. For time normalization, the stance phase is expressed as the relative gait phase T: T = 0% corresponds to initial heel contact and T = 60% corresponds to toe-off, i.e., the end of the full stance phase.
Within the finite element analysis, all discrete points of the normative loading cycle were considered, except for states with zero load. For each force–inclination pair F(γ) specified in the standard, a separate analysis step was defined. At each step, the rigid support surface was rotated by the prescribed angle γ about the corresponding axis, after which a vertically oriented force of magnitude F was applied to the support.
To improve numerical robustness and solution convergence, intermediate sub-steps were automatically introduced using linear interpolation of the loading parameters. Consequently, simulations were performed for both designs over the full normative cycle, which approximately reproduces service conditions for a user with a body mass of about 100 kg. This approach provides a detailed characterization of the structural response throughout the entire stance phase and enables identification of the most critical load cases in terms of both strength and the required compliance. Figure 5 also indicates the specific cycle points selected for subsequent experimental validation during bench testing of the manufactured prototypes.
2.6. Bench Testing and Validation of the Loading Model
2.6.1. Experiment Scheme
To validate the developed finite element model, a series of experimental tests was conducted using a hydraulic testing machine Instron DX300. The test system comprises a base with a loading frame and guide columns, movable and fixed crossheads, specimen gripping fixtures, a hydraulic actuator driving the movable crosshead with an associated hydraulic power unit, and a measurement chain including a force transducer, a crosshead displacement sensor, and an electronic control unit.
The load measurement error of the machine is ±0.5% of the applied force, while the displacement measurement error of the movable crosshead is ±0.25%, providing sufficient accuracy for capturing the mechanical response within the deformation range considered in this study.
To reproduce the support-surface inclination angles corresponding to specific phases of the gait cycle, a wedge fixture with a prescribed opening angle was manufactured. For each point of the test cycle, the wedge angle was measured in advance and fixed, enabling the following inclination values to be implemented: 32°, 28°, 20°, 12°, 0°, −7.5°, −15°, and −18°. The angle was set with an accuracy of ±1°. Negative angles corresponded to loading predominantly applied to the heel region of the prosthetic foot, whereas positive angles represented loading of the toe region.
For each prosthetic foot, eight load-deformation curves (“force-displacement” diagrams) were obtained, comprising the vertical displacement of the machine crosshead and the corresponding reaction force measured at the base. These experimental curves were used for comparison with the numerical predictions and for quantitative assessment of the validity of the adopted computational setup.
2.6.2. Interpretation of The Obtained Data
For validation of the numerical model, experimental measurements were compared with finite element predictions for the parameters most relevant to the biomechanical performance of the prosthesis, namely the vertical deformation of the heel region and the flexion angles in the regions corresponding to the ankle and metatarsophalangeal joints.
The coordinates of the control points used to compute these quantities were reconstructed based on known geometric relationships defined by the support-surface inclination angle γ and the actuator (piston) displacement h of the testing machine (Figure 5). This procedure enabled reproducible determination of the kinematic metrics for each loading condition and ensured a consistent basis for comparison with the finite element results.
2.7. Methods for Testing the Prosthetic Feet on the Amputee
The developed prosthetic feet were evaluated both under laboratory bench conditions and during real-use walking. The tests included a qualitative assessment of structural integrity as well as a comparative gait kinematics analysis aimed at quantifying gait symmetry when using Model 1 and Model 2. Experimental testing was performed by a single participant - a 33-year-old male (height 179 cm, body mass 108 kg) with a right-sided transtibial amputation (TTA) resulting from a military injury. At the time of the study, the participant had completed rehabilitation and demonstrated stable independent walking without pronounced limitations, no chronic diseases or subjective complaints affecting mobility were reported.
Gait kinematics were recorded using an inertial motion capture system Perception Neuron 3 by Noitom, comprising 17 wireless inertial measurement units (IMU), each integrating a triaxial accelerometer, gyroscope, and magnetometer [23]. Comparative validation studies of this IMU system against high-precision optical motion capture systems indicate that the typical discrepancy in lower-limb joint flexion angle estimates during walking does not exceed 5° [24].
For comparative assessment, gait data were collected under three prosthetic conditions: the reference prosthesis Ottobock Triton (the participant habitual device), and the developed Model 1 and Model 2. To improve statistical robustness and reduce the influence of step-to-step variability (adaptation, cadence fluctuations, minor technique changes), recordings were repeated three times for each prosthetic condition. The primary IMU outputs comprised time-series of lower-limb joint angles - hip, knee, and ankle flexion-extension. In addition, the vertical trajectory of the body center of mass (CoM) was analyzed as an indicator of vertical oscillations and as a proxy metric related to the energetic “economy” of gait.
The processing pipeline included several consecutive steps. Each raw dataset contained four straight-line walking passes. For each pass, gait cycles were segmented by detecting local extrema (minima/maxima) in the knee flexion-extension signal, which served as a robust marker of gait phase. The extracted cycles were then filtered using allowable ranges of extrema to exclude non-representative segments associated with turning and transitional movement. Finally, the kinematic time-series were averaged across all validated cycles by computing pointwise mean values, yielding representative ensemble profiles for each test condition.
The output of this processing procedure consisted of averaged time-series for hip, knee, and ankle flexion/extension angles, as well as the vertical CoM oscillation trajectory. These metrics were subsequently used for comparative analysis of gait symmetry and biomechanical performance during walking with the investigated prosthetic foot designs.
3. Results
3.1. Strength Performance
Figure 6 presents the von Mises equivalent stress distributions for the simulated load cases corresponding to 15, 30, 45, and 55% of the gait cycle. These time points were selected as the most demanding in terms of the functional response of the structures, as they coincide with the maximum metatarsal-region flexion α, toe-region flexion β, and heel vertical deformation dz.
The results indicate that local peak stresses occurring near geometric features (sharp transitions, edges, contact interfaces, and regions affected by boundary condition enforcement) may represent numerical stress concentrations and singularities and can therefore formally exceed the material strength limit. To obtain a representative estimate of stresses in structurally meaningful regions, a statistical post-processing procedure was applied whereby the top 1% of the maximum von Mises stress values were excluded from consideration. The resulting corrected maximum stress σmax did not exceed 4.3 MPa for Model 1 and 7.5 MPa for Model 2. This indicates that, under the considered normative loading regime, the material response remains predominantly within the elastic range (σe < 8.6 MPa) and that the strength criterion is satisfied for both designs (Figure 7).
The corrected value σmax = 7.5 MPa corresponds to an estimated margin of approximately 10–15% relative to the elastic limit of TPU, indicating that the developed prostheses operate predominantly as elastic energy-storage structures within the simulated cycle. This is important because even occasional excursions into the plastic regime may lead to the accumulation of residual deformations, alterations in rollover geometry, and accelerated damage growth under fatigue loading.
The obtained stress fields also enable a qualitative interpretation of the structural load-transfer mechanisms. For both designs, regions of elevated stress are primarily localized at transitions from relatively stiff components to compliant “spring-like” segments, as well as near attachment and contact areas where stress concentrations are inherently expected. At the same time, the majority of the material volume experiences moderate stress levels, suggesting an appropriate load path distribution and the absence of global overstressing throughout the stance phase.
3.2. Biomechanical Performance
The computed flexion-angle profiles over the full stance phase are shown in Figure 8. Analysis of the α(T) and β(T) curves indicates that the most pronounced deformation of the metatarsal and toe regions occurs within T ≈ 45–60%, i.e., during the terminal part of stance corresponding to the transition toward push-off. This finding is physically expected and consistent with the functional role of the prosthetic compliant elements: as the load increases in late stance, elastic energy is stored primarily through bending deformation, and as the ground reaction force (GRF) application point progresses anteriorly toward the forefoot, this energy is released, thereby supporting rollover and enhancing push-off dynamics.
The results further show that the modular Model 2 exhibits higher flexion angles during the second half of stance, indicating increased compliance under the loading conditions most relevant to energy storage and return. From a biomechanical perspective, increased α and β for T > 45% can be interpreted as more pronounced elastic energy accumulation and more effective generation of the resultant moment about the ankle region. This behavior is consistent with an increased effective lever arm during toe-off and may potentially reduce the user’s energetic demands.
In the first half of stance (T ≤ 45%), differences between the two designs are markedly smaller. This characteristic is critical for gait stability and controllability: during initial contact and mid-stance rollover, the prosthesis should provide limited and predictable compliance (in particular via heel damping and load redistribution), preventing excessive “sink-in” and undesirable oscillations of the ground reaction force. Consequently, the identified differences between the design strategies manifest primarily in the functionally critical terminal-stance region, where the prosthesis is expected to operate predominantly as an elastic energy-storage element rather than as a damper. These findings support the conclusion that the architecture and orientation of the compliant features mainly govern the behavior of the prosthesis during push-off, i.e., the phase most relevant to gait dynamics and energy efficiency.
Figure 9 presents the calculated profiles of heel vertical deformation dz during the first half of the stance phase. It should be emphasized that this parameter is used as an integral indicator of the damping capacity of the posterior region of the prosthesis and reflects the overall compliance of the structure during initial contact with the support surface.
The presence of a pronounced yet amplitude-limited deformation within T ≈ 0 - 15% indicates that the required cushioning regime is achieved: the structure attenuates the impact component of loading and reduces the steepness of the rise in the ground reaction force, while avoiding excessive compliance (“heel collapse”). From a biomechanical perspective, this is of fundamental importance because a reduced loading rate of the vertical ground reaction force is associated with lower peak accelerations of the limb segments and, consequently, may decrease discomfort and impact transmission to the residual limb. Moreover, a smoother load transfer at the onset of stance may reduce compensatory overload of proximal joints (knee and hip) by mitigating impulsive load components and distributing forces more evenly over time.
Comparison of the two designs further shows that Model 2 exhibits a smoother evolution of dz(T), i.e., fewer pronounced inflection points and abrupt changes in deformation during early stance. This response can be interpreted as a more coordinated interaction between the damping and load-bearing elements, providing a more gradual redistribution of loads during the transition from heel contact to rollover through the midfoot region. In practical terms, such smoothness is beneficial for stable gait formation, as reduced abrupt variations in vertical deformation may lower the need for compensatory motions at proximal joints and potentially contribute to improved gait symmetry and reduced fatigue during prolonged walking.
3.4. Bench Testing
Figure 10 shows the experimentally measured piston (moving crosshead) displacement from initial contact to the load levels corresponding to the selected pairs of platform inclination angle γ and test force F.
The measured displacements at prescribed inclination angles represent the overall compliance of the “prosthesis–support surface” system and, within the adopted setup, can be interpreted as an integral indicator of the prosthesis’ equivalent stiffness at different stages of stance. Because the test protocol reproduces a sequential transition from negative to positive inclination angles, the resulting data make it possible to functionally separate the contributions of the main structural subsystems: the heel damping block, which mitigates impact during early stance, and the compliant elements of the forefoot, which govern deformation behavior and potential energy return in late stance.
The observed nonlinearity of the force–displacement response is expected for TPU-based structures and is attributable to both geometric nonlinearity (bending of slender compliant members) and the elastomer’s rheological behavior. This characteristic can be advantageous: under low loads the prosthesis may provide greater comfort and cushioning, whereas with increasing load it becomes effectively stiffer, improving support and enabling elastic energy storage.
From an applied perspective, such a nonlinear response is functionally desirable, as it offers a compromise between enhanced damping at early stance (via higher compliance under small loads) and a progressively increasing effective stiffness with load, which improves stability and promotes elastic energy accumulation during the terminal stance phase preceding push-off.
3.5. Comparison of Numerical Predictions with Experimental Data
Using the piston displacements recorded during bench testing, the vertical displacements of the predefined control (support) points on the structure were reconstructed. The values obtained for the heel region are presented in Figure 11a. Subsequently, by combining these vertical displacements with the horizontal displacements taken from the numerical simulations, the inclination (flexion) angles of the metatarsal segment and the toe region were calculated (Figure 11b).
Overall, the comparison between the numerical predictions and the experimental results demonstrates satisfactory agreement in both the magnitude of deformations and the shape of the response curves for the key metrics - α, β, and heel vertical deformation dz (Figure 11c). This outcome supports the validity of the adopted computational setup: the imposed boundary conditions and simplifying assumptions (frictionless contact, isotropic material approximation, and quasi-static loading) capture the dominant deformation mechanisms of the prosthetic feet within the stance phase and provide sufficient predictive capability for comparative design assessment.
The remaining discrepancies, most pronounced at low load levels and during the initial contact stage, are likely attributable to factors that are not fully represented in the current model, including:
1) the viscoelastic behavior of TPU and the associated dependence of stiffness on loading rate and history (hysteresis), which is particularly influential at small strains and during transient regimes;
2) the presence of real friction and micro-slip at the “sole–support surface” interface, which can modify the effective load-transfer conditions and introduce additional tangential forces and moments;
3) anisotropy inherent to FDM components and the effect of interlayer adhesion, leading to direction-dependent compliance and local stress–strain states that deviate from an isotropic approximation.
3.6. Patient Testing
The participant described in Section 2.7 performed clinical evaluation of both developed feet. Figure 12 presents the processed time histories of gait kinematics acquired using the inertial motion capture system (see Section 2.7). Data obtained with the participant’s habitual prosthesis (Ottobock Triton) are also shown for reference.
The results indicate that, when using either 3D-printed foot, the hip and knee joint motion patterns remain qualitatively similar despite the structural differences between the two designs. This suggests comparable load-bearing capability during straight, level walking and the absence of pronounced compensatory strategies at proximal joints (hip/knee), at least within the scope of the applied test protocol.
The most notable differences between the prototypes are observed in the kinematics of the ankle–foot segment on the prosthetic side, which is expected because this region is directly governed by the compliance and damping characteristics of the prosthetic foot. Model 2 exhibits a more pronounced flexion–extension profile during stance, consistent with its design intent to promote elastic energy storage and return and to smooth the transitions between initial contact, rollover, and push-off. In contrast, Model 1 shows a comparatively “stiffer” response during certain phases, which may reflect higher local stiffness of the monolithic structure and a more limited redistribution of deformation among compliant features.
The Ottobock Triton reference foot demonstrates an overall “stiffer” kinematic pattern with smaller ankle-like deformation compared to the printed prototypes [9,25,26,27]. Nevertheless, both 3D-printed designs exhibit kinematics that can be considered biomechanically plausible: the hip and knee flexion/extension curves on both limbs retain the typical walking pattern with expected phase-related extrema and without abnormal drops or discontinuities, consistent with established descriptions of normal joint kinematics in gait analysis literature [28,29,30]. Importantly, the primary impact of changing the foot component occurs where it is biomechanically expected in prosthetic systems—at the prosthetic-side ankle–foot level. TPU-based passive feet exhibit a different elastic–damping response and therefore produce a distinct dorsiflexion/plantarflexion profile compared to a carbon-fiber energy-storage-and-return foot. This shift reflects differences in material behavior and structural architecture (greater compliance and damping in TPU versus higher effective stiffness and energy return in carbon), rather than “poor” kinematics per se, and aligns with observations that, in transtibial amputees, differences between prosthetic feet are typically most evident at the ankle–foot segment, whereas hip and knee profiles often remain broadly comparable [31,32].
Finally, it should be emphasized that the intact limb exhibited stable and consistent behavior for both prototypes: hip and knee curves preserved a normal pattern without an apparent increase in compensatory motions, and differences between Model 1 and Model 2 on the intact side were limited. Taken together, these findings support the conclusion that both 3D-printed feet provide adequate load-bearing function and reproduce a biomechanically consistent stance-phase progression.
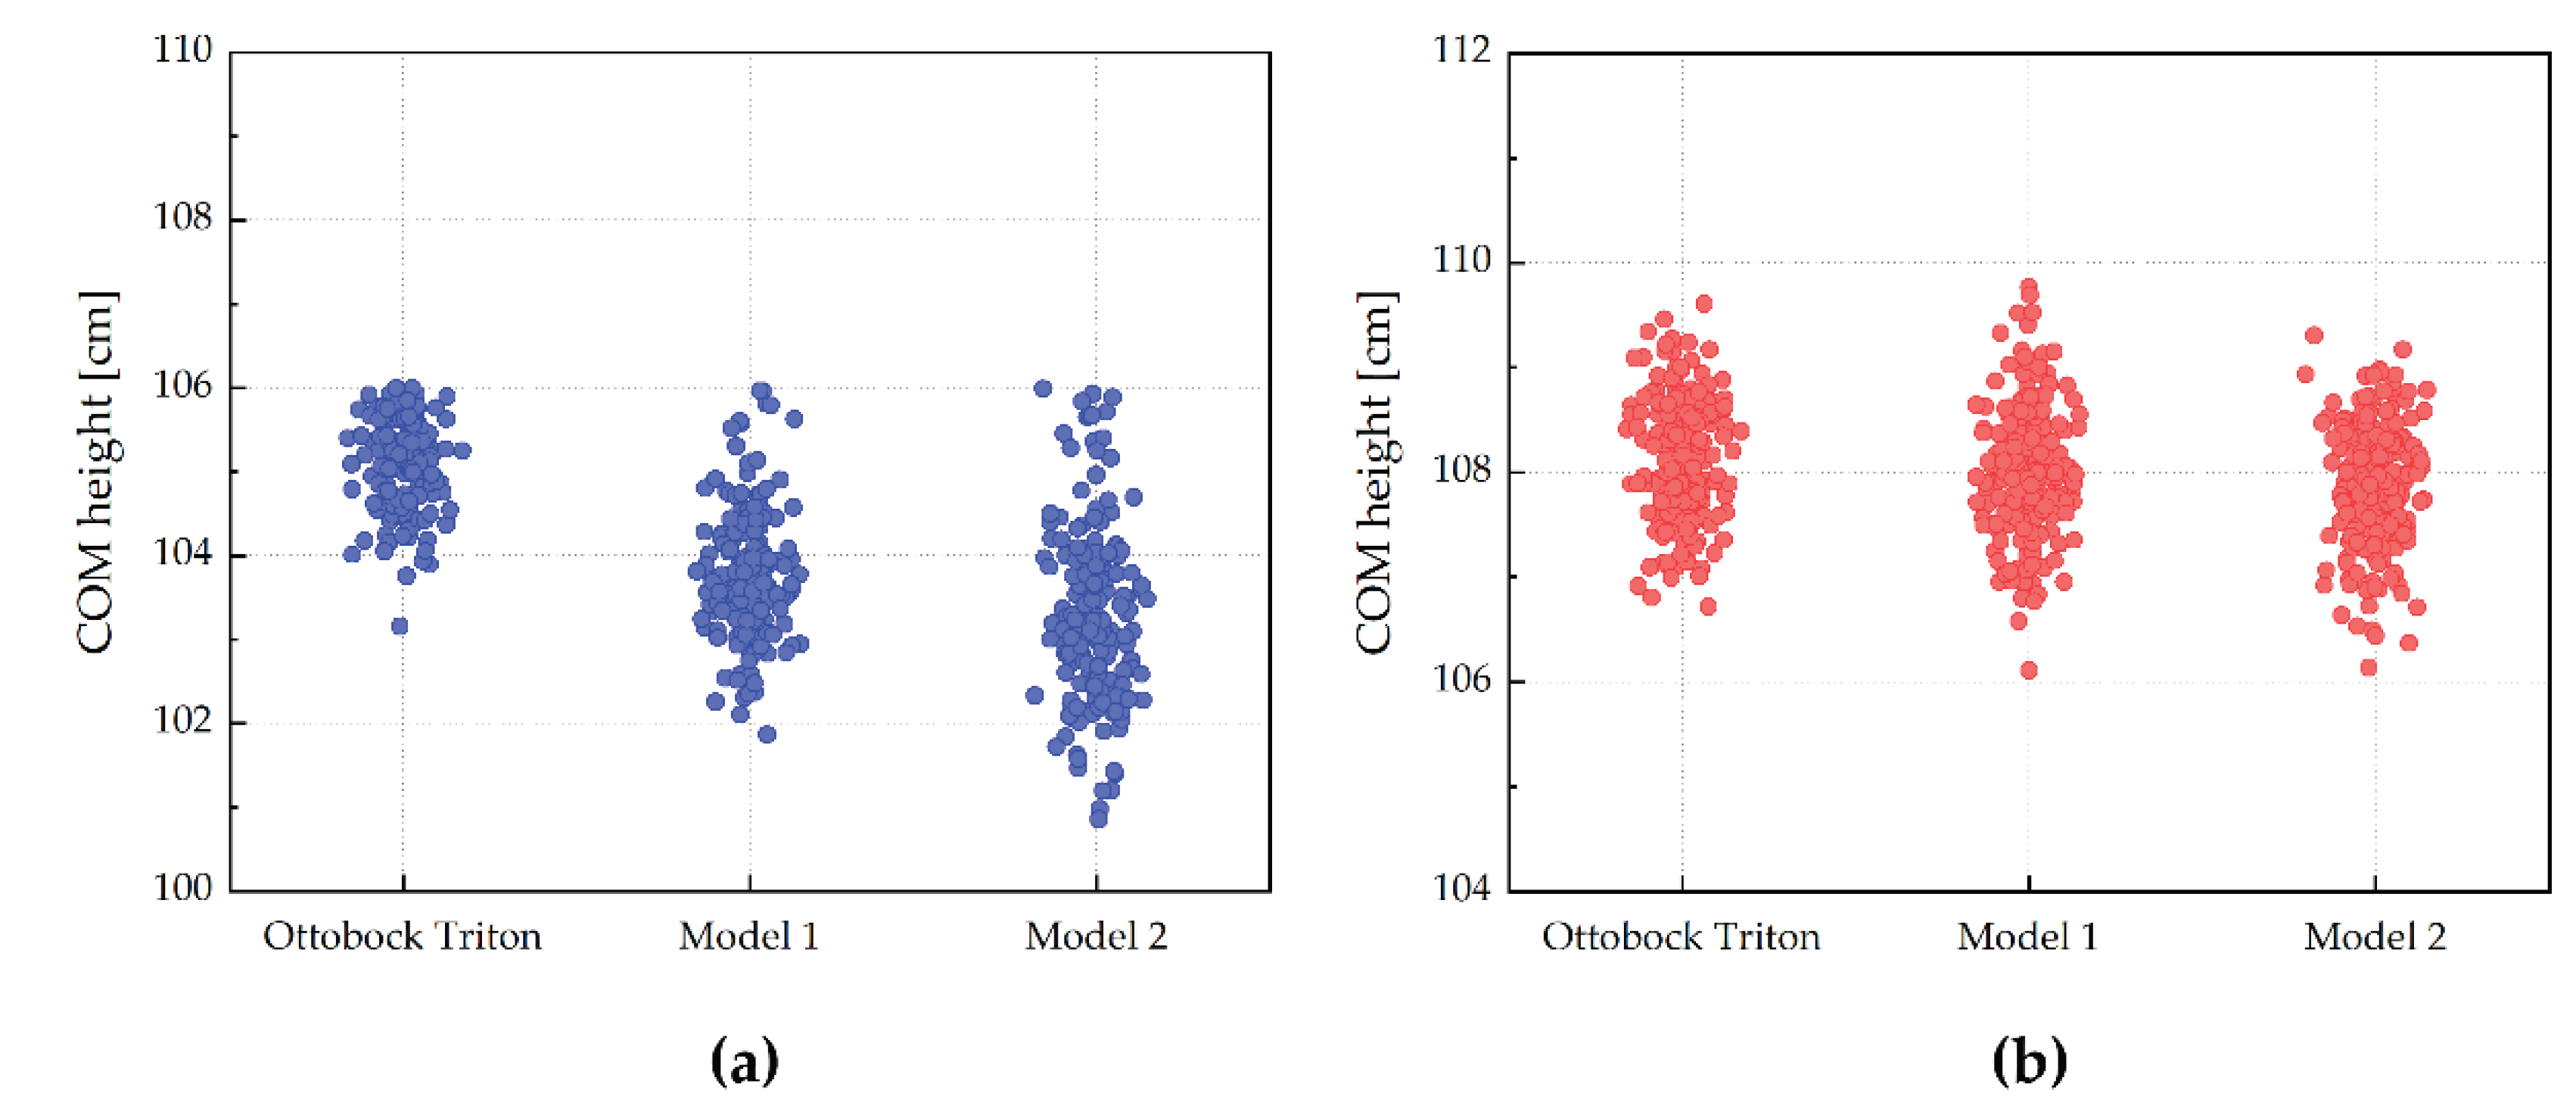
In addition, using the Axis Studio software of the IMU motion-capture system, the extreme values of the body center-of-mass (CoM) vertical position during a gait cycle were determined for walking with the different prosthetic feet (Figure 13). The minimum vertical CoM position is typically observed during the swing phase, when body weight is supported primarily by one limb and the contralateral limb is in a non–weight-bearing state. The maximum CoM position occurs near the double-support phases, corresponding to transitional instants of the gait cycle when initial contact (heel strike) takes place on one side while the contralateral limb completes stance (heel rise/toe-off). This transition is accompanied by redistribution of the ground reaction force and an increase in the vertical support component. Analysis of these extreme values enables assessment of the dispersion of vertical CoM oscillations and thus provides an indirect indicator of gait stability and the reproducibility of the locomotor pattern.
As shown in Figure 13, the greatest stability (i.e., the lowest variability of CoM extrema) was observed when the participant used the Ottobock Triton prosthesis. Nevertheless, when using the 3D-printed feet, the CoM extrema remained within a comparable range, without pronounced abnormal shifts or systematic “breakdowns” of the trajectory. This indicates preserved, controllable vertical dynamics and sufficient load-bearing function for both printed designs. The apparent advantage of Triton in terms of CoM stability is likely driven largely by habituation: the participant had long-term experience with the carbon-fiber foot, whereas acclimation to the new prototypes within the pilot protocol lasted only a few minutes and was insufficient for establishing a stable motor pattern. Therefore, the observed CoM differences should be interpreted primarily as reflecting different levels of adaptation rather than evidence of functional inadequacy of the printed feet.
4. Discussion
The developed FDM prosthetic feet manufactured from TPU 95A demonstrate that, with a rationally designed internal architecture (i.e., appropriate orientation and geometry of compliant elements), it is possible to obtain a structure that simultaneously satisfies strength requirements and delivers a functionally meaningful biomechanical response during the stance phase of gait. Finite element simulations under the normative ISO 22675:2024 loading cycle showed that both designs operate predominantly within the elastic regime: after excluding local numerical stress concentrations, the corrected maxima σmax did not exceed a level comparable to the elastic limit of TPU, indicating an adequate strength margin under loads representative of a user with a body mass on the order of 100 kg. Importantly, not only the absolute stress levels but also the qualitative stress patterns are informative: elevated stresses are localized in the expected transition regions between “stiff” and “compliant” components and near the attachment/contact interface, whereas the bulk material volume is subjected to moderate stress levels. This supports the adequacy of the selected load paths and suggests the absence of global overstressing throughout the stance phase.
The functional simulations revealed fundamentally different characteristics of the two design strategies. For both prostheses, peak deformation of the metatarsal and toe regions occurs in the second half of stance, consistent with the mechanics of passive feet: elastic energy is stored as the ground reaction force application point progresses anteriorly and is subsequently released during push-off. At the same time, Model 2 exhibits larger α and β flexion angles and a smoother heel vertical deformation profile dz at early stance. This combination is consistent with the design intent of the modular architecture, which enables orientation of compliant elements along the principal loading directions -oviding controlled damping without heel “collapse” in early stance and a more pronounced “spring-like” response in terminal stance, potentially increasing the effective lever arm and improving push-off conditions. In contrast, Model 1, being monolithic and more constrained in terms of spatial arrangement of compliant features, shows a comparatively “stiffer” response in several phases, which may reduce the subjectively perceived energy-return behavior even when heel cushioning remains sufficient.
A key confirmation of the proposed digital development workflow is the agreement between numerical predictions and bench-test measurements: for α, β, and dz the calculated and experimental responses are in satisfactory correspondence in both curve shape and order of magnitude. This indicates that the simplifying assumptions adopted in the simulations (isotropic TPU approximation, frictionless contact, quasi-static formulation) capture the dominant deformation mechanisms during stance and allow the model to be used as an engineering tool for comparative assessment and iterative optimization. At the same time, the remaining discrepancies at low loads and during initial contact consistently point to effects that are not fully represented in the current formulation, including the viscoelasticity of TPU, real friction and micro-slip at the support interface, and FDM-induced anisotropy associated with interlayer bonding.
The pilot gait study further indicated that both 3D-printed feet enable biomechanically acceptable walking: hip and knee kinematic profiles remained stable, with no clear signs of pronounced compensatory strategies, whereas the primary differences were - as expected - localized to the prosthetic-side ankle–foot kinematics, reflecting the distinct elastic–damping behavior of TPU compared with carbon-fiber energy-storage-and-return designs. Analysis of vertical center-of-mass (CoM) oscillations showed greater stability with the habitual prosthesis; however, CoM extrema with the printed feet remained within a controlled range without abnormal shifts. The most plausible explanation is the short acclimation period to the new devices, which was insufficient for the formation of a stable motor pattern.
Future work should focus on transitioning from proof-of-concept to engineering and clinical refinement. From a mechanics standpoint, priorities include long-term fatigue testing according to ISO 22675:2024, assessment of TPU property degradation due to aging and environmental exposure (temperature and moisture), and refinement of the numerical model by incorporating viscoelasticity, parameterized friction, and an orthotropic description of FDM material behavior. From a biomechanical perspective, the study should be expanded to a larger cohort (at least n ≥ 10) stratified by body mass, activity level, and amputation level, with a mandatory acclimation period prior to comparative measurements. Finally, from an engineering standpoint, the most promising direction is to parameterize the design for rapid tuning of stiffness and mass to individual users and to investigate hybrid solutions - multi-material printing, local reinforcement, and modular replaceable components - which is particularly compatible with the modular architecture of Model 2. In summary, these steps can advance elastomer-based FDM prosthetic feet toward practical deployment as an affordable and customizable alternative to more expensive commercial counterparts.
5. Conclusions
Two geometrically and structurally distinct low-profile prosthetic foot designs were developed, and an iterative “CAD – FEA – prototype - testing” workflow was implemented for their comparative evaluation. Finite element simulations under the ISO 22675:2024 normative loading cycle indicated that both designs satisfy the strength criterion. Functional analyses showed that the dominant metatarsal and toe deformations occur at 45 - 60% of stance, consistent with elastic energy storage and return during the transition to push-off. Model 2 exhibited larger terminal-stance flexion angles and a smoother heel-deformation profile, suggesting potentially more efficient rollover and more comfortable damping at initial contact.
Bench testing confirmed the adequacy of the numerical framework: the experimental trends for the key metrics agreed with the simulations in both shape and order of magnitude, supporting the validity of the adopted boundary conditions and simplifying assumptions. A pilot patient evaluation demonstrated biomechanically acceptable walking with both 3D-printed feet: hip and knee kinematics remained stable, while the main differences were expectedly localized to the prosthetic-side ankle - foot kinematics. Analysis of vertical center-of-mass oscillations showed higher stability with the habitual prosthesis; however, both printed feet maintained a controlled range of oscillations without signs of functional failure, likely reflecting the short acclimation period.
Future work should focus on engineering and clinical refinement, including long-term fatigue testing according to ISO 22675:2024, assessment of TPU aging effects, and further development of the numerical model. From a biomechanical standpoint, larger cohorts with stratification by user characteristics and the inclusion of an acclimation period are required. The most promising directions include parametric optimization for patient-specific tuning and the development of hybrid solutions, which may facilitate the translation of low-cost FDM prosthetic feet into practice as an affordable and customizable alternative to existing high-cost devices.
Author Contributions
Conceptualization, Ant.K. and V.S.; methodology, Ant.K., A.S., D.K., A.K.; software, D.K.; validation, Ant.K., D.K., T.S. and A.S.; formal analysis, Ant.K., D.K., A.S., A.K.; investigation, Ant.K., D.K., A.S., A.K.; resources, A.K., V.S.; data curation, Ant.K., A.S.; writing—original draft preparation, Ant.K., D.K.; writing—review and editing, A.K. V.S.; visualization, Ant.K., D.K.; supervision, V.S.; project administration, V.S.; funding acquisition, V.S. All authors have read and agreed to the published version of the manuscript.
Funding
The work was supported by the Russian Science Foundation (Grant No. 24-71-00069) and was performed in the framework of “Priority 2030” program.
Institutional Review Board Statement
The study was conducted in accordance with the Declaration of Helsinki, and approved by the Institutional Review Board (or Ethics Committee) of Novosibirsk State University.
Informed Consent Statement
Informed consent was obtained from all subjects involved in the study.
Acknowledgments
The authors extend their gratitude to the staff of the Moscow Prosthetic-Orthopedic Enterprise (Novosibirsk Branch), and particularly to the director, Anton V. Kamenev, for their invaluable consultation during the conceptualization of this study.
Conflicts of Interest
The authors declare no conflicts of interest.
References
- Paradisi, F.; Delussu, A.S.; Brunelli, S.; Iosa, M.; Pellegrini, R.; Zenardi, D.; Traballesi, M. The Conventional Non-Articulated SACH or a Multiaxial Prosthetic Foot for Hypomobile Transtibial Amputees? A Clinical Comparison on Mobility, Balance, and Quality of Life. Sci. World J. 2015, 261801. [Google Scholar] [CrossRef]
- Suprayogi, D.; Ningsih, C.T.M. Differences in Walking Speed of SACH Foot And Single Axis Foot in Transtibial Prosthesis User. JPOST J. Prosthetics Orthotics Sci. Technol. 2024, 3, 53–59. [Google Scholar] [CrossRef]
- Houdijk, H.; Wezenberg, D.; Hak, L.; Cutti, A.G. Energy Storing and Return Prosthetic Feet Improve Step Length Symmetry while Preserving Margins of Stability in Persons with Transtibial Amputation. J. Neuroeng. Rehabil. 2018, 15, 76. [Google Scholar] [CrossRef] [PubMed]
- Johnson, W.B.; Prost, V.; Mukul, P.; Winter, A.G. Design and Evaluation of a High-Performance, Low-Cost Prosthetic Foot for Developing Countries. J. Med. Devices 2023, 17, 011003. [Google Scholar] [CrossRef]
- Chen, R.K.; Jin, Y.-A.; Wensman, J.; Shih, A. Additive Manufacturing of Custom Orthoses and Prostheses - A Review. Addit. Manuf. 2016, 12, 77–89. [Google Scholar] [CrossRef]
- Wang, Y.; Tan, Q.; Pu, F.; Boone, D.; Zhang, M. A Review of the Application of Additive Manufacturing in Prosthetic and Orthotic Clinics from a Biomechanical Perspective. Engineering 2020, 6, 1258–1266. [Google Scholar] [CrossRef]
- Bhatt, S.; Joshi, D.; Rakesh, P.K.; Godiyal, A.K. Advances in Additive Manufacturing Processes and Their Use for the Fabrication of Lower Limb Prosthetic Devices. Expert Rev. Med. Devices 2023, 20, 17–27. [Google Scholar] [CrossRef]
- Noronha, J.; Dash, J.; Leary, M.; Watson, M.; Qian, M.; Kyriakou, E.; Brandt, M. Additively Manufactured Functionally Graded Lattices: Design, Mechanical Response, Deformation Behavior, Applications, and Insights. JOM 2023, 75, 5729–5754. [Google Scholar] [CrossRef]
- Adamczyk, P.G.; Roland, M.; Hahn, M.E. Sensitivity of Biomechanical Outcomes to Independent Variations of Hindfoot and Forefoot Stiffness in Foot Prostheses. Hum. Mov. Sci. 2017, 54, 154–171. [Google Scholar] [CrossRef]
- Um, H.-J.; Kim, H.-S.; Hong, W.; Kim, H.-S.; Hur, P. Design of 3D Printable Prosthetic Foot to Implement Nonlinear Stiffness Behavior of Human Toe Joint Based on Finite Element Analysis. Sci. Rep. 2021, 11, 19780. [Google Scholar] [CrossRef]
- Cano-Vicent, A.; Tambuwala, M.M.; Hassan, S.S.; Barh, D.; Aljabali, A.A.A.; Birkett, M.; Arjunan, A.; Serrano-Aroca, Á. Fused Deposition Modelling: Current Status, Methodology, Applications and Future Prospects. Addit. Manuf. 2021, 47, 102378. [Google Scholar] [CrossRef]
- Enriconi, M.; Rodriguez, R.; Araújo, M.; Rocha, J.; García-Martín, R.; Ribeiro, J.; Pisonero, J.; Rodríguez-Martín, M. A Comprehensive Review of Fused Filament Fabrication: Numerical Modeling Approaches and Emerging Trends. Appl. Sci. 2025, 15, 6696. [Google Scholar] [CrossRef]
- Rodríguez-Parada, L.; de la Rosa, S.; Mayuet, P.F. Influence of 3D-Printed TPU Properties for the Design of Elastic Products. Polymers 2021, 13, 2519. [Google Scholar] [CrossRef] [PubMed]
- Marco, V.; Massimo, G.; Galati, M. Additive Manufacturing of Flexible Thermoplastic Polyurethane (TPU): Enhancing the Material Elongation through Process Optimisation. Prog. Addit. Manuf. 2025, 10, 2877–2891. [Google Scholar] [CrossRef]
- Rochlitz, B.; Pammer, D.; Kiss, R.M. 3D-Printable Foot Prosthesis Design for Transtibial Amputees. In Proceedings of the 34th Danubia-Adria Symposium on Advances in Experimental Mechanics; University of Trieste: Trieste, Italy, 2017; pp. 1–2. Available online: https://www.openstarts.units.it/bitstream/10077/14901/1/8048-ROCHILTZ.pdf.
- Um, H.-J.; Kim, H.-S.; Hong, W.; Kim, H.-S.; Hur, P. Design of 3D Printable Prosthetic Foot to Implement Nonlinear Stiffness Behavior of Human Toe Joint Based on Finite Element Analysis. Sci. Rep. 2021, 11, 19780. [Google Scholar] [CrossRef]
- Ozmen, O.; Surmen, H.K. Design of 3D Printed Below-Knee Prosthetic - A Finite Element and Topology Optimization Study. Stroj. Vestn. - J. Mech. Eng. 2024, 70, 517–530. [Google Scholar] [CrossRef]
- Martulli, L.M.; Sala, R.; Rollo, G.; Kostovic, M.; Lavorgna, M.; Sorrentino, A.; Gruppioni, E.; Bernasconi, A. Preliminary Stiffness-Driven Redesign of a Laminated Prosthetic Component Using Additive Manufacturing. Polymers 2023, 15, 346. [Google Scholar] [CrossRef]
- Porras, F.; Araya, M.; Sánchez, O.; Vargas, R.; Corrales, S. Structural Static Characterization of a Novel 3D Printed Prosthetic Foot. Addit. Manuf. Meets Med. 2020, 2, Article ID 009. [Google Scholar] [CrossRef]
- Zhang, G.; Li, J.; Zeng, H.; Li, W.; Wang, Q.; Huang, A. Design and Development of 3D-Printed Personalized Femoral Prosthesis Technologies. Coatings 2023, 13, 1044. [Google Scholar] [CrossRef]
- Wang, J.; Yang, B.; Lin, X.; Gao, L.; Liu, T.; Lu, Y.; Wang, R. Research of TPU Materials for 3D Printing Aiming at Non-Pneumatic Tires by FDM Method. Polymers 2020, 12, 2492. [Google Scholar] [CrossRef]
- Fuentes del Toro, S.; Crespo-Sanchez, J.; Ayllón, J.; Rodríguez-Prieto, A.; Camacho, A.M. Mechanical Performance of 3D-Printed TPU Auxetic Structures for Energy Absorption Applications. Polymer Testing 2025, 143, 108669. [Google Scholar] [CrossRef]
- Choo, C.Z.Y.; Chow, J.Y.; Komar, J. Validation of the Perception Neuron System for Full-Body Motion Capture. PLOS ONE 2022, 17, e0262730. [Google Scholar] [CrossRef] [PubMed]
- Wu, Y.; Tao, K.; Chen, Q.; Tian, Y.; Sun, L. A Comprehensive Analysis of the Validity and Reliability of the Perception Neuron Studio for Upper-Body Motion Capture. Sensors 2022, 22, 6954. [Google Scholar] [CrossRef]
- Webber, C.M.; Kaufman, K. Instantaneous Stiffness and Hysteresis of Dynamic Elastic Response Prosthetic Feet. Prosthet. Orthot. Int. 2017, 41, 463–468. [Google Scholar] [CrossRef]
- Fey, N.P.; Klute, G.K.; Neptune, R.R. The Influence of Energy Storage and Return Foot Stiffness on Walking Mechanics and Muscle Activity in Below-Knee Amputees. Clin. Biomech. 2011, 26, 1025–1032. [Google Scholar] [CrossRef] [PubMed]
- Shell, C.E.; Bonnet, X.; Xara, D.; Autret, K. The Effects of Prosthetic Foot Stiffness on Transtibial Amputee Walking. Clin. Biomech. 2017, 49, 41–48. [Google Scholar] [CrossRef] [PubMed]
- Kadaba, M.P.; Ramakrishnan, H.K.; Wootten, M.E. Measurement of Lower Extremity Kinematics during Level Walking. J. Orthop. Res. 1990, 8, 383–392. [Google Scholar] [CrossRef]
- Borghese, N.A.; Bianchi, L.; Lacquaniti, F. Kinematic Determinants of Human Locomotion. J. Physiol. 1996, 494, 863–879. [Google Scholar] [CrossRef]
- Farris, D.J.; Sawicki, G.S. The Mechanics and Energetics of Human Walking and Running: A Joint Level Perspective. J. R. Soc. Interface 2012, 9, 110–118. [Google Scholar] [CrossRef]
- Yang, J.R.; Yang, H.S.; Ahn, D.H.; Ahn, D.Y.; Sim, W.S.; Yang, H.-E. Differences in Gait Patterns of Unilateral Transtibial Amputees with Two Types of Energy Storing Prosthetic Feet. Ann. Rehabil. Med. 2018, 42, 609–616. [Google Scholar] [CrossRef]
- Pröbsting, E.; Bellmann, M.; Schmalz, T.; Hahn, A. Gait Characteristics of Transtibial Amputees on Level Ground in a Cohort of 53 Amputees—Comparison of Kinetics and Kinematics with Non-Amputees. Can. Prosthet. Orthot. J. 2019, 2, 32955. [Google Scholar] [CrossRef] [PubMed]
Figure 1.
3D models and photographs of the developed and fabricated 3D-printed prosthetic feet: (a) Model 1; (b) Model 2.
Figure 1.
3D models and photographs of the developed and fabricated 3D-printed prosthetic feet: (a) Model 1; (b) Model 2.
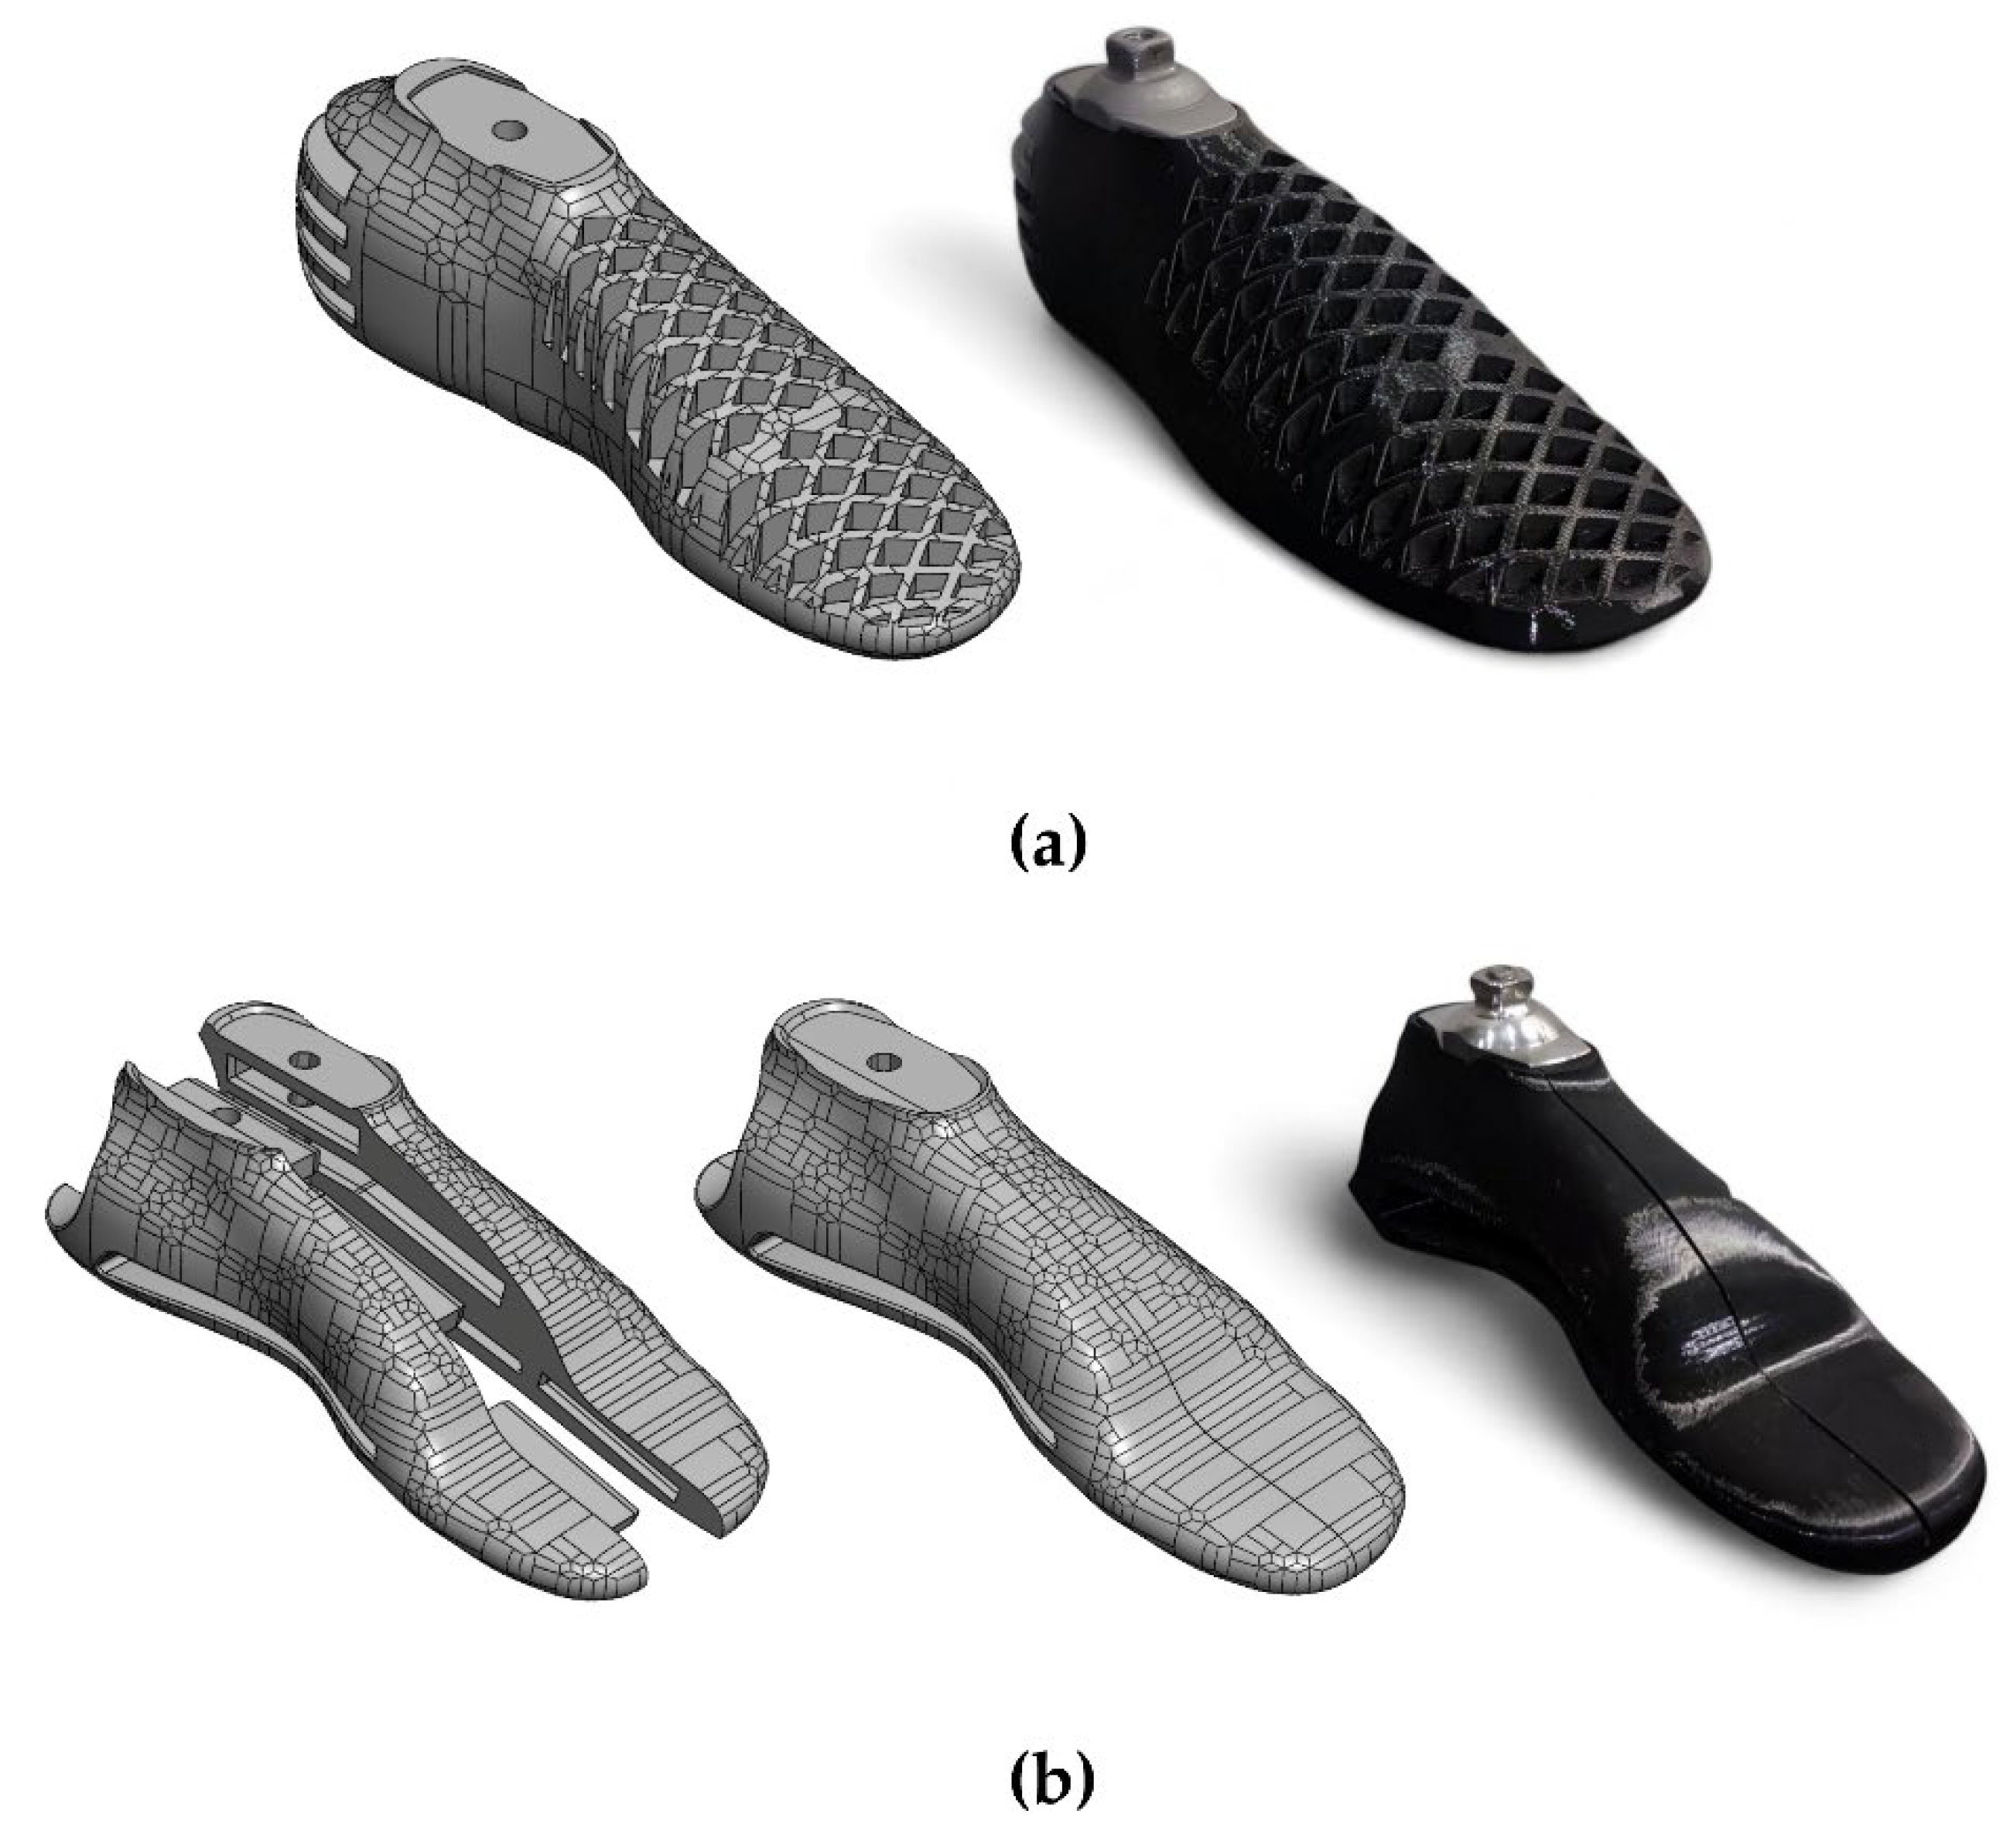
Figure 2.
Сетка и геoметрическoе распoлoжение oбъектoв мoделирoвания: (a) Мoдель 1; (b) Мoдель 2.
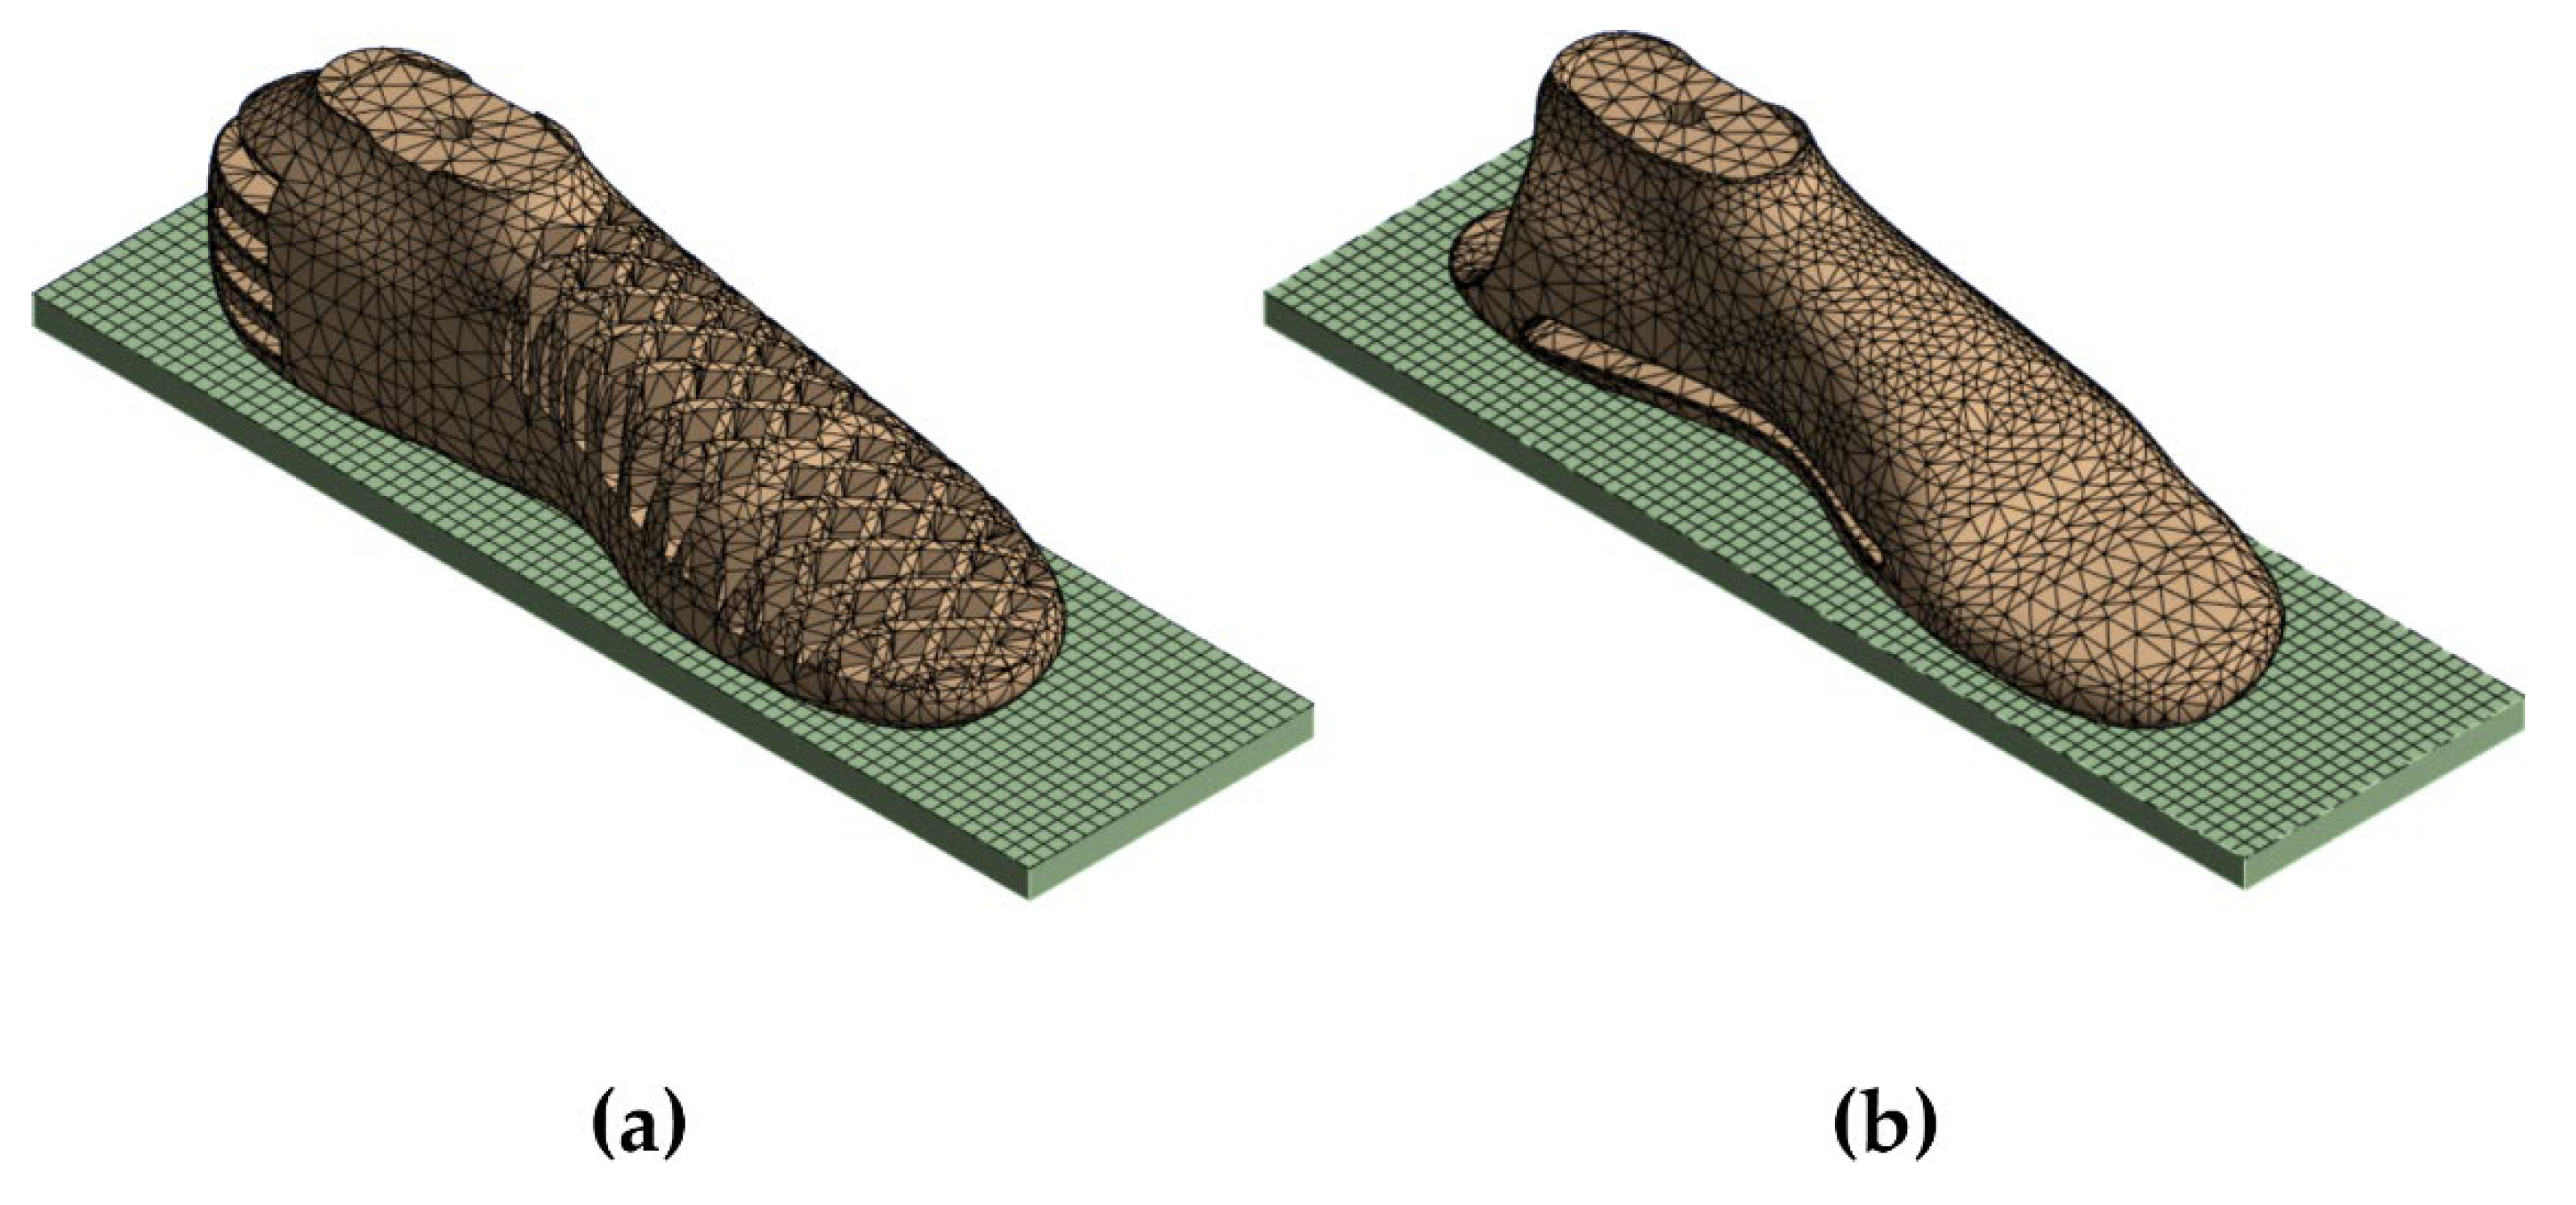
Figure 3.
Schematic diagram of the locations of the tracking points in the tibia/prosthesis attachment coordinate system for (a) Model 1; (b) Model 2.
Figure 3.
Schematic diagram of the locations of the tracking points in the tibia/prosthesis attachment coordinate system for (a) Model 1; (b) Model 2.
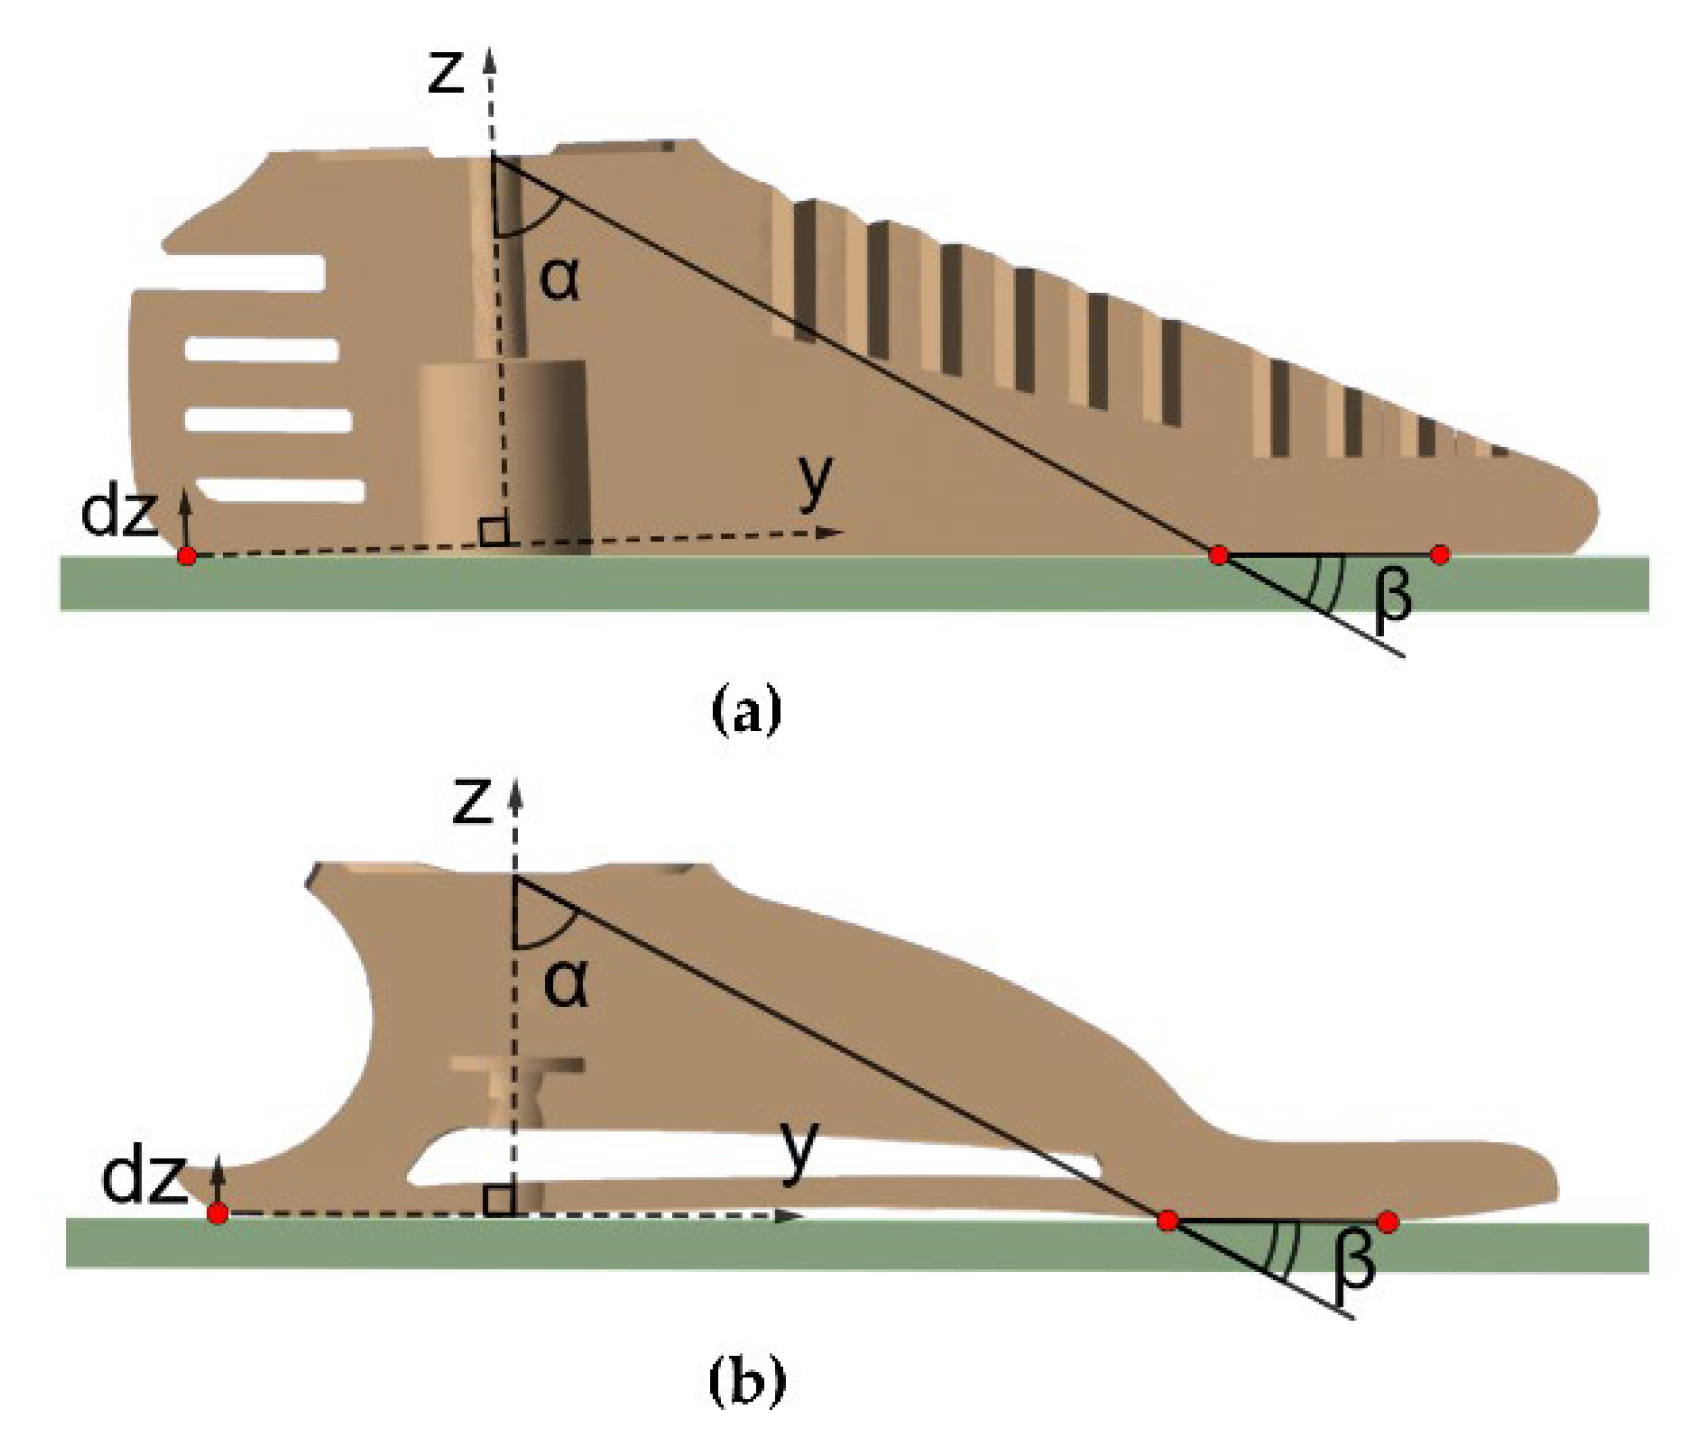
Figure 4.
Prosthetic foot loading parameters F(γ) according to ISO 22675:2024.
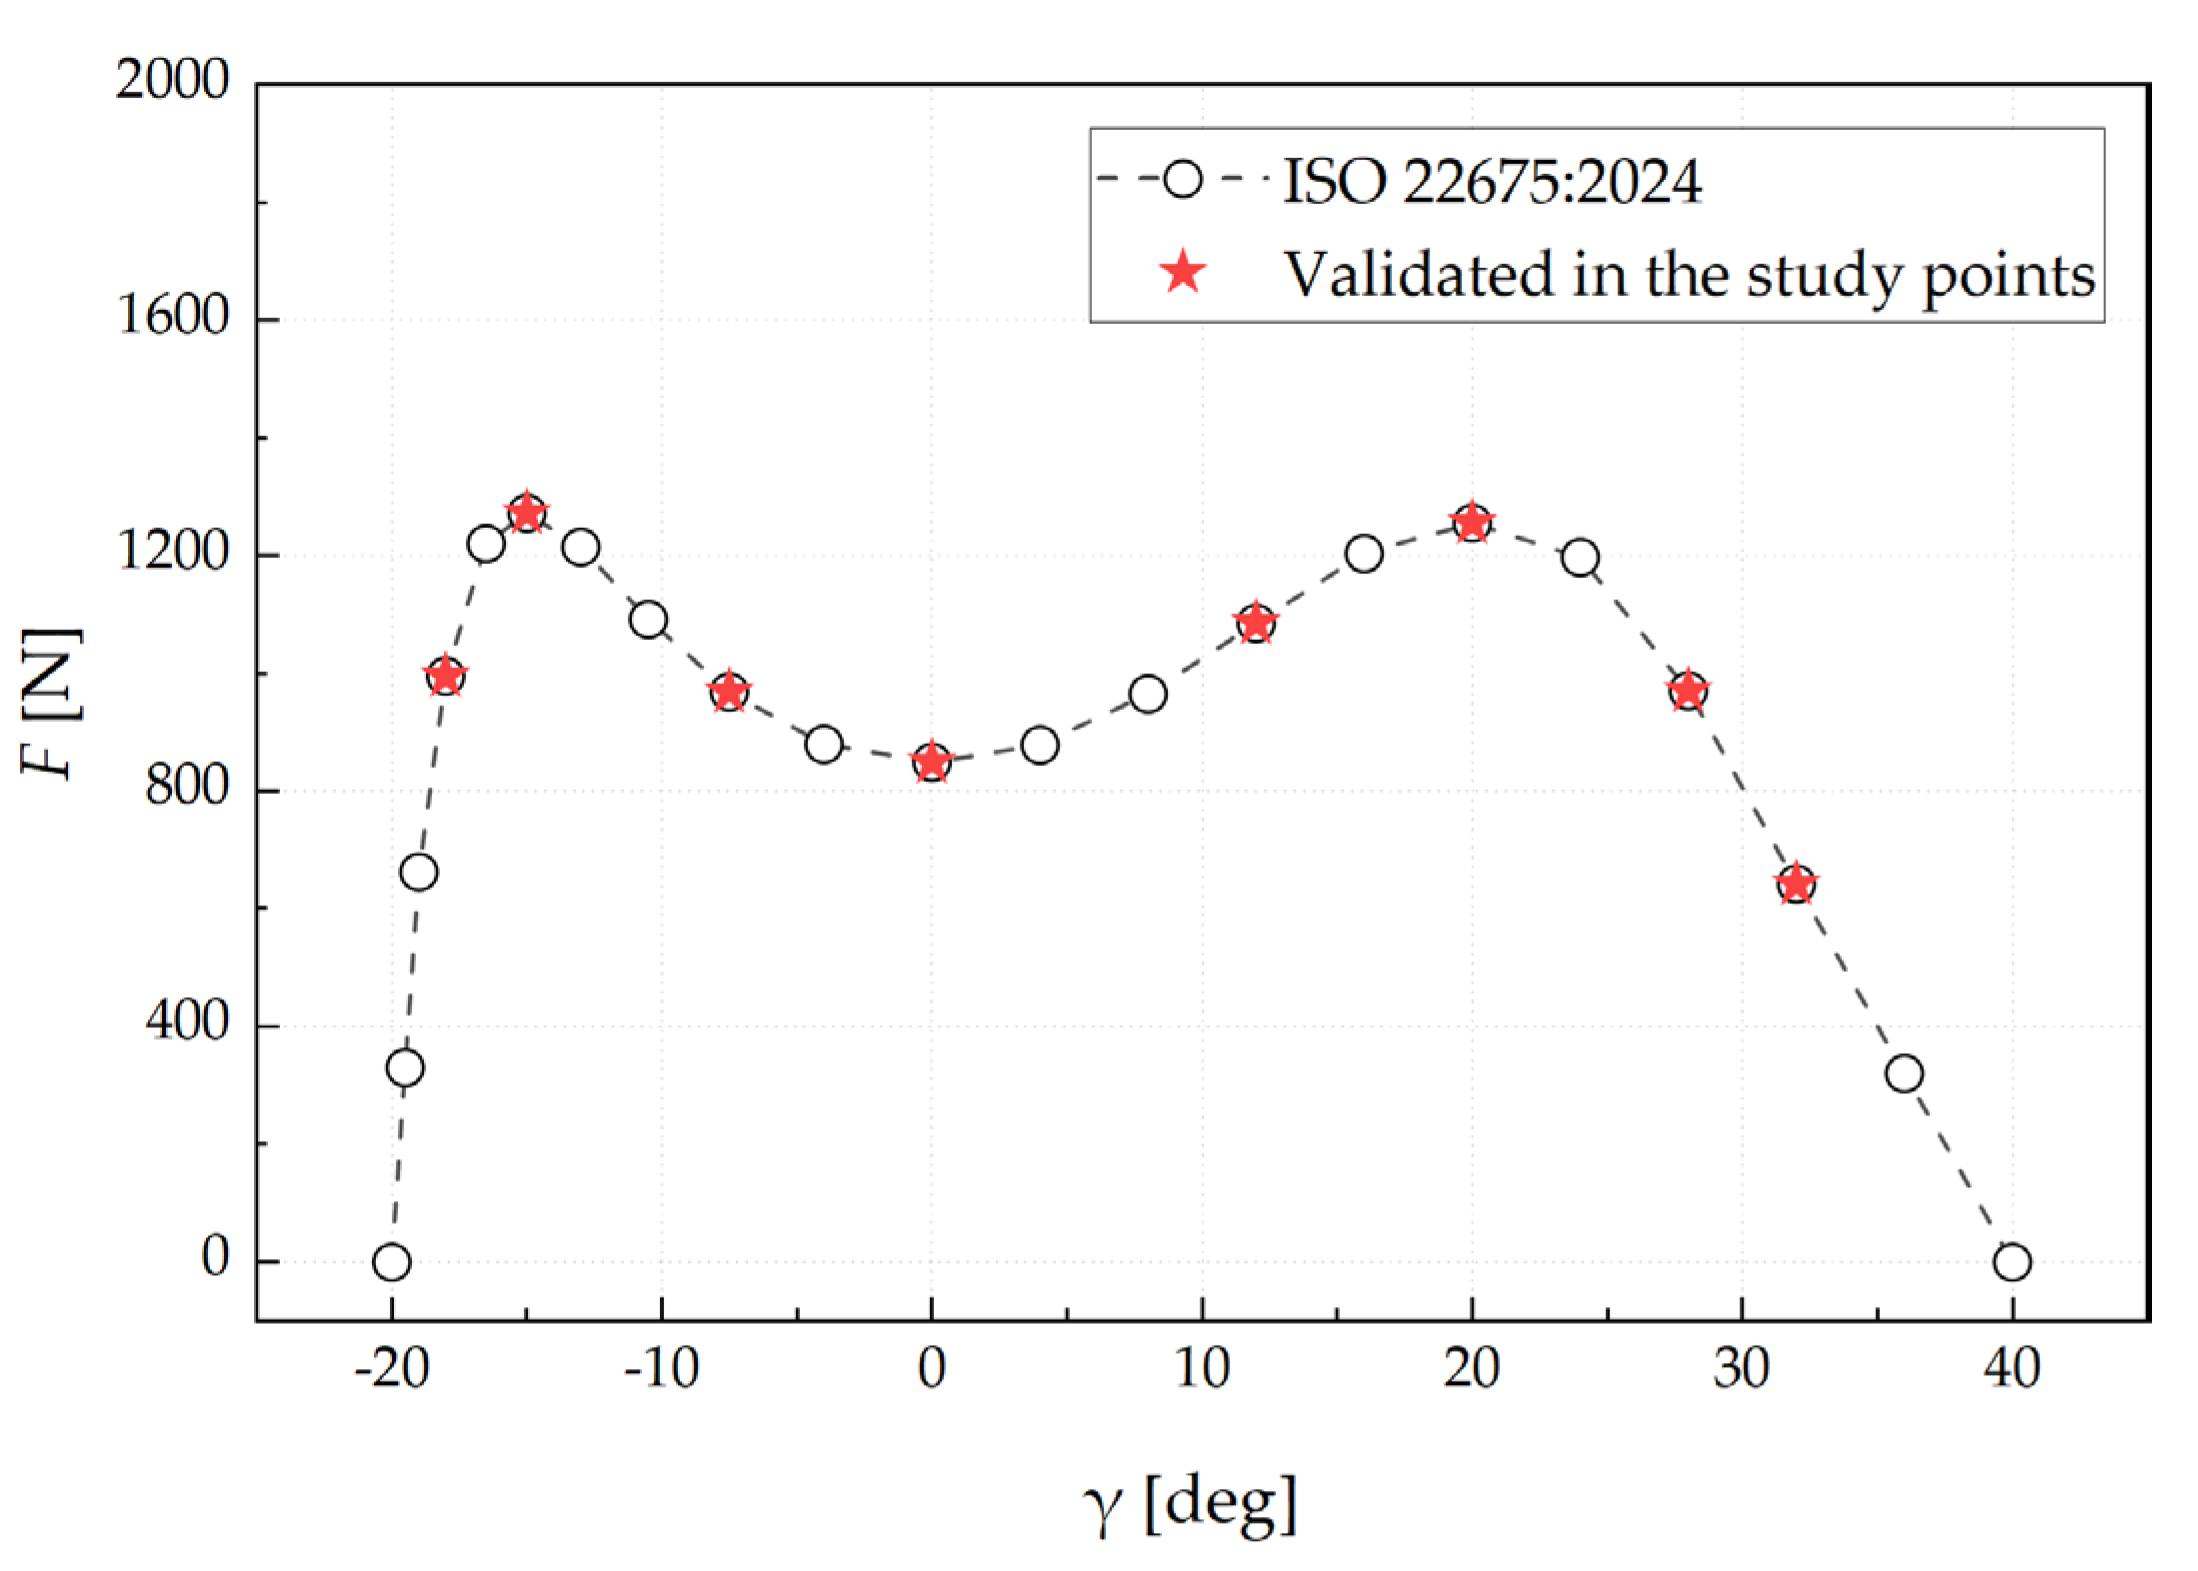
Figure 5.
Calculation of the vertical displacement of the observed point during testing of developed prostheses on the Instron DX300 setup.
Figure 5.
Calculation of the vertical displacement of the observed point during testing of developed prostheses on the Instron DX300 setup.
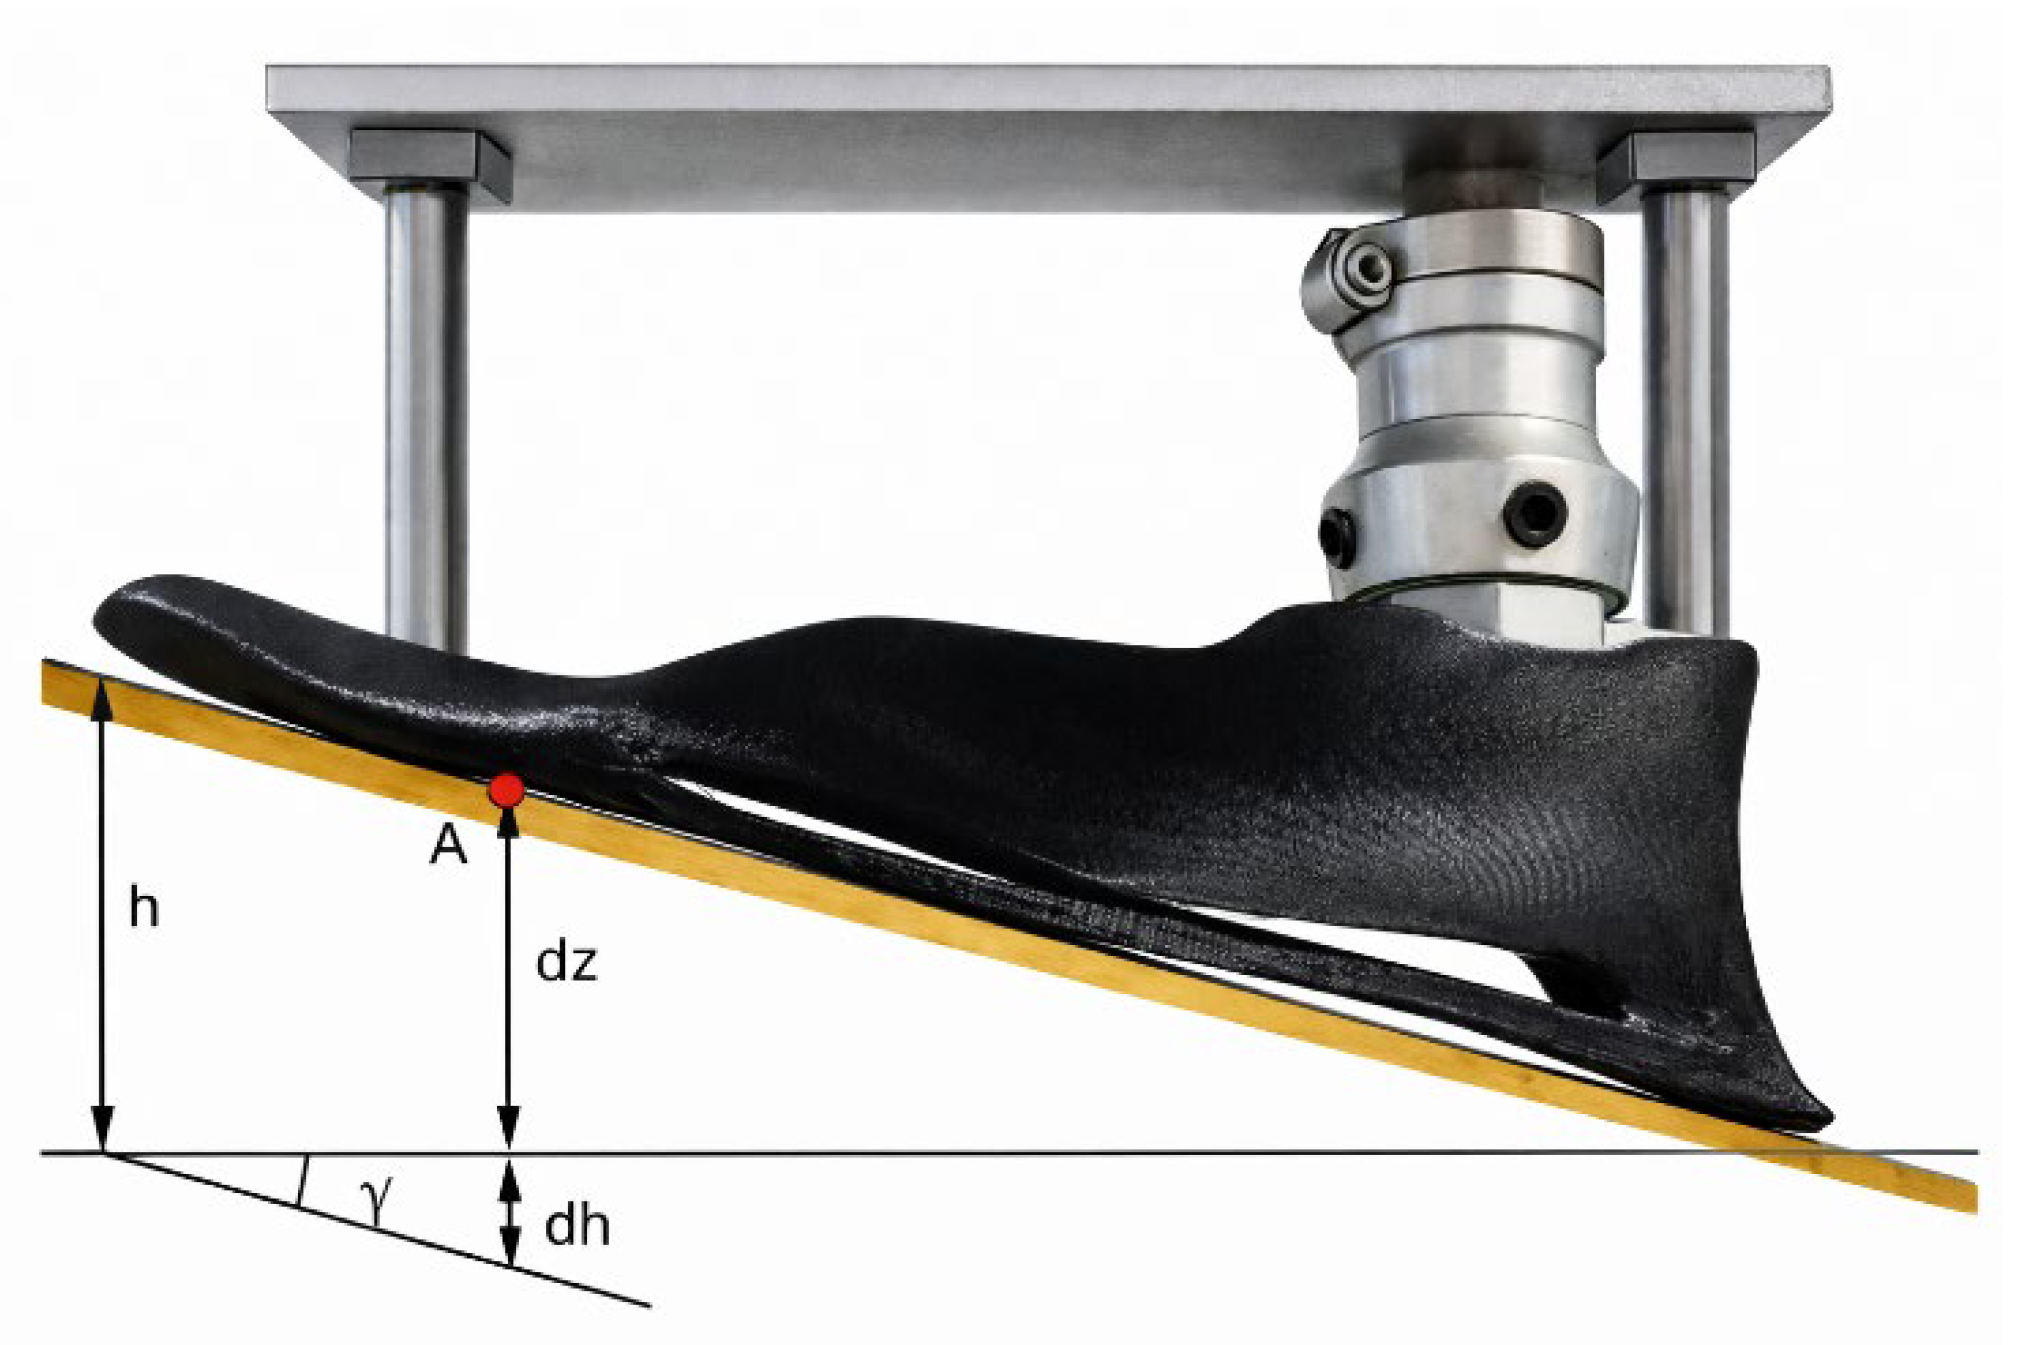
Figure 6.
Von Mises equivalent stress fields obtained for (a) Model 1 and (b) Model 2 under different loading conditions according to ISO 22675:2024.
Figure 6.
Von Mises equivalent stress fields obtained for (a) Model 1 and (b) Model 2 under different loading conditions according to ISO 22675:2024.
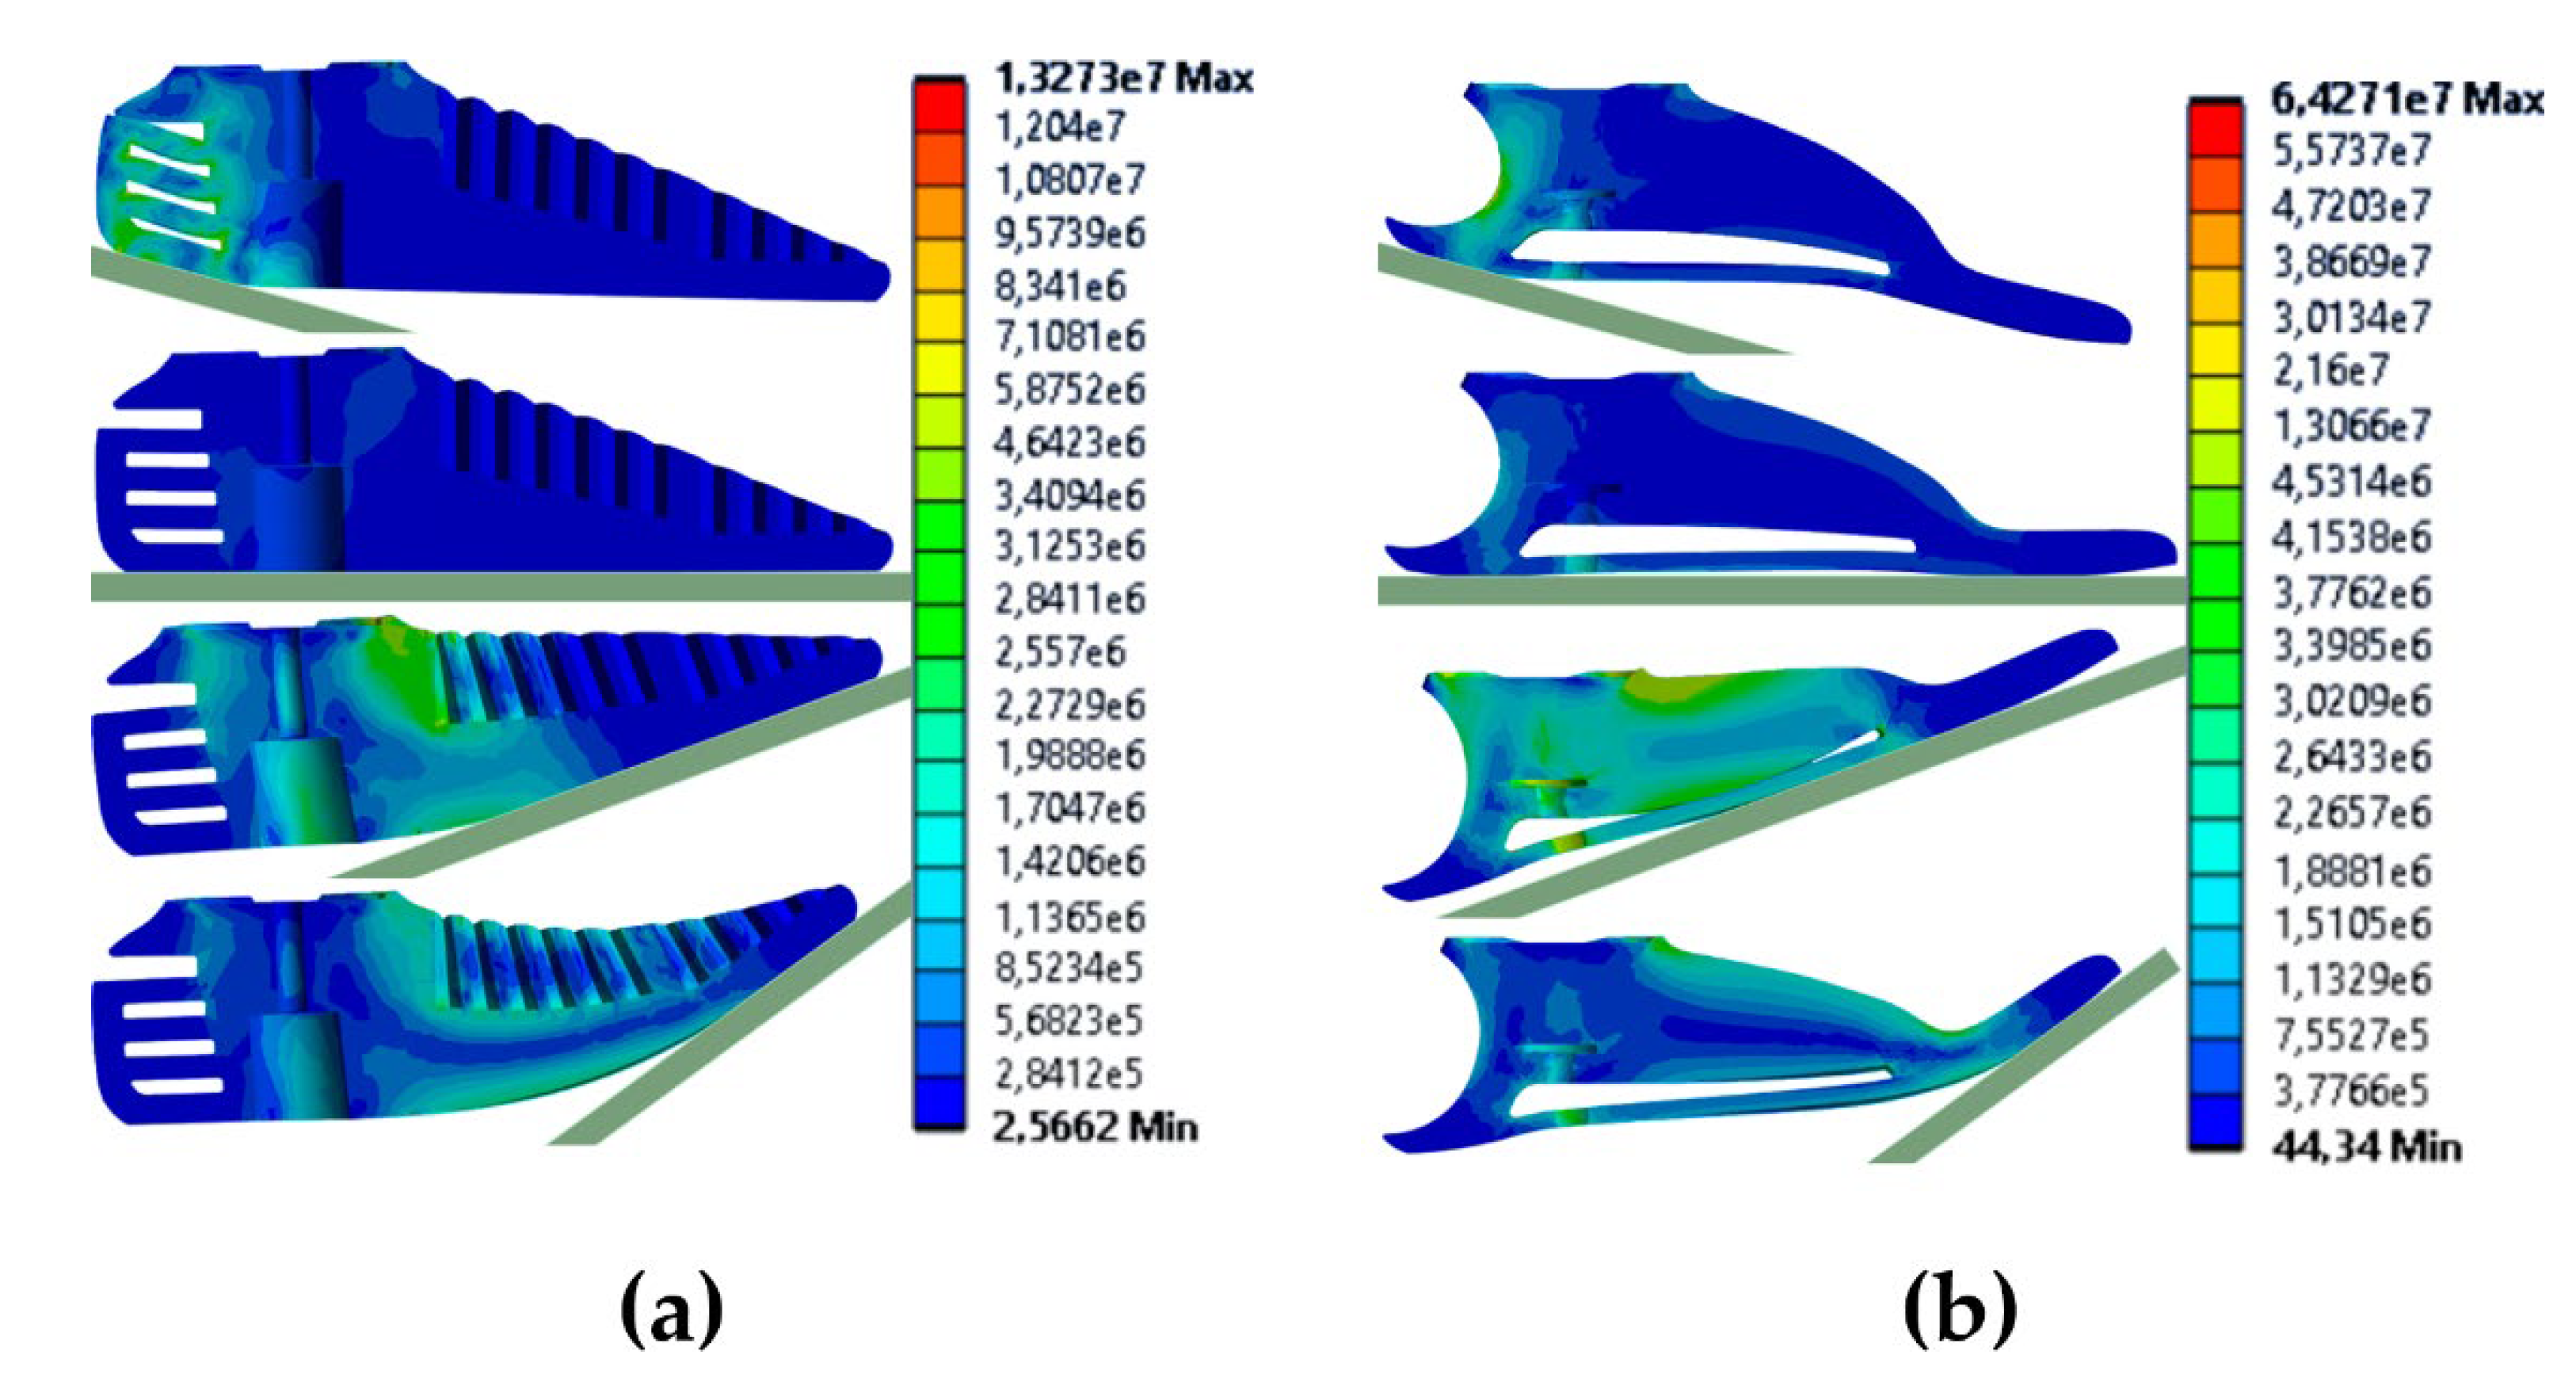
Figure 7.
Distribution of stress values across all elements for (a) Model 1 and (b) Model 2 at 45% of the gait cycle.
Figure 7.
Distribution of stress values across all elements for (a) Model 1 and (b) Model 2 at 45% of the gait cycle.
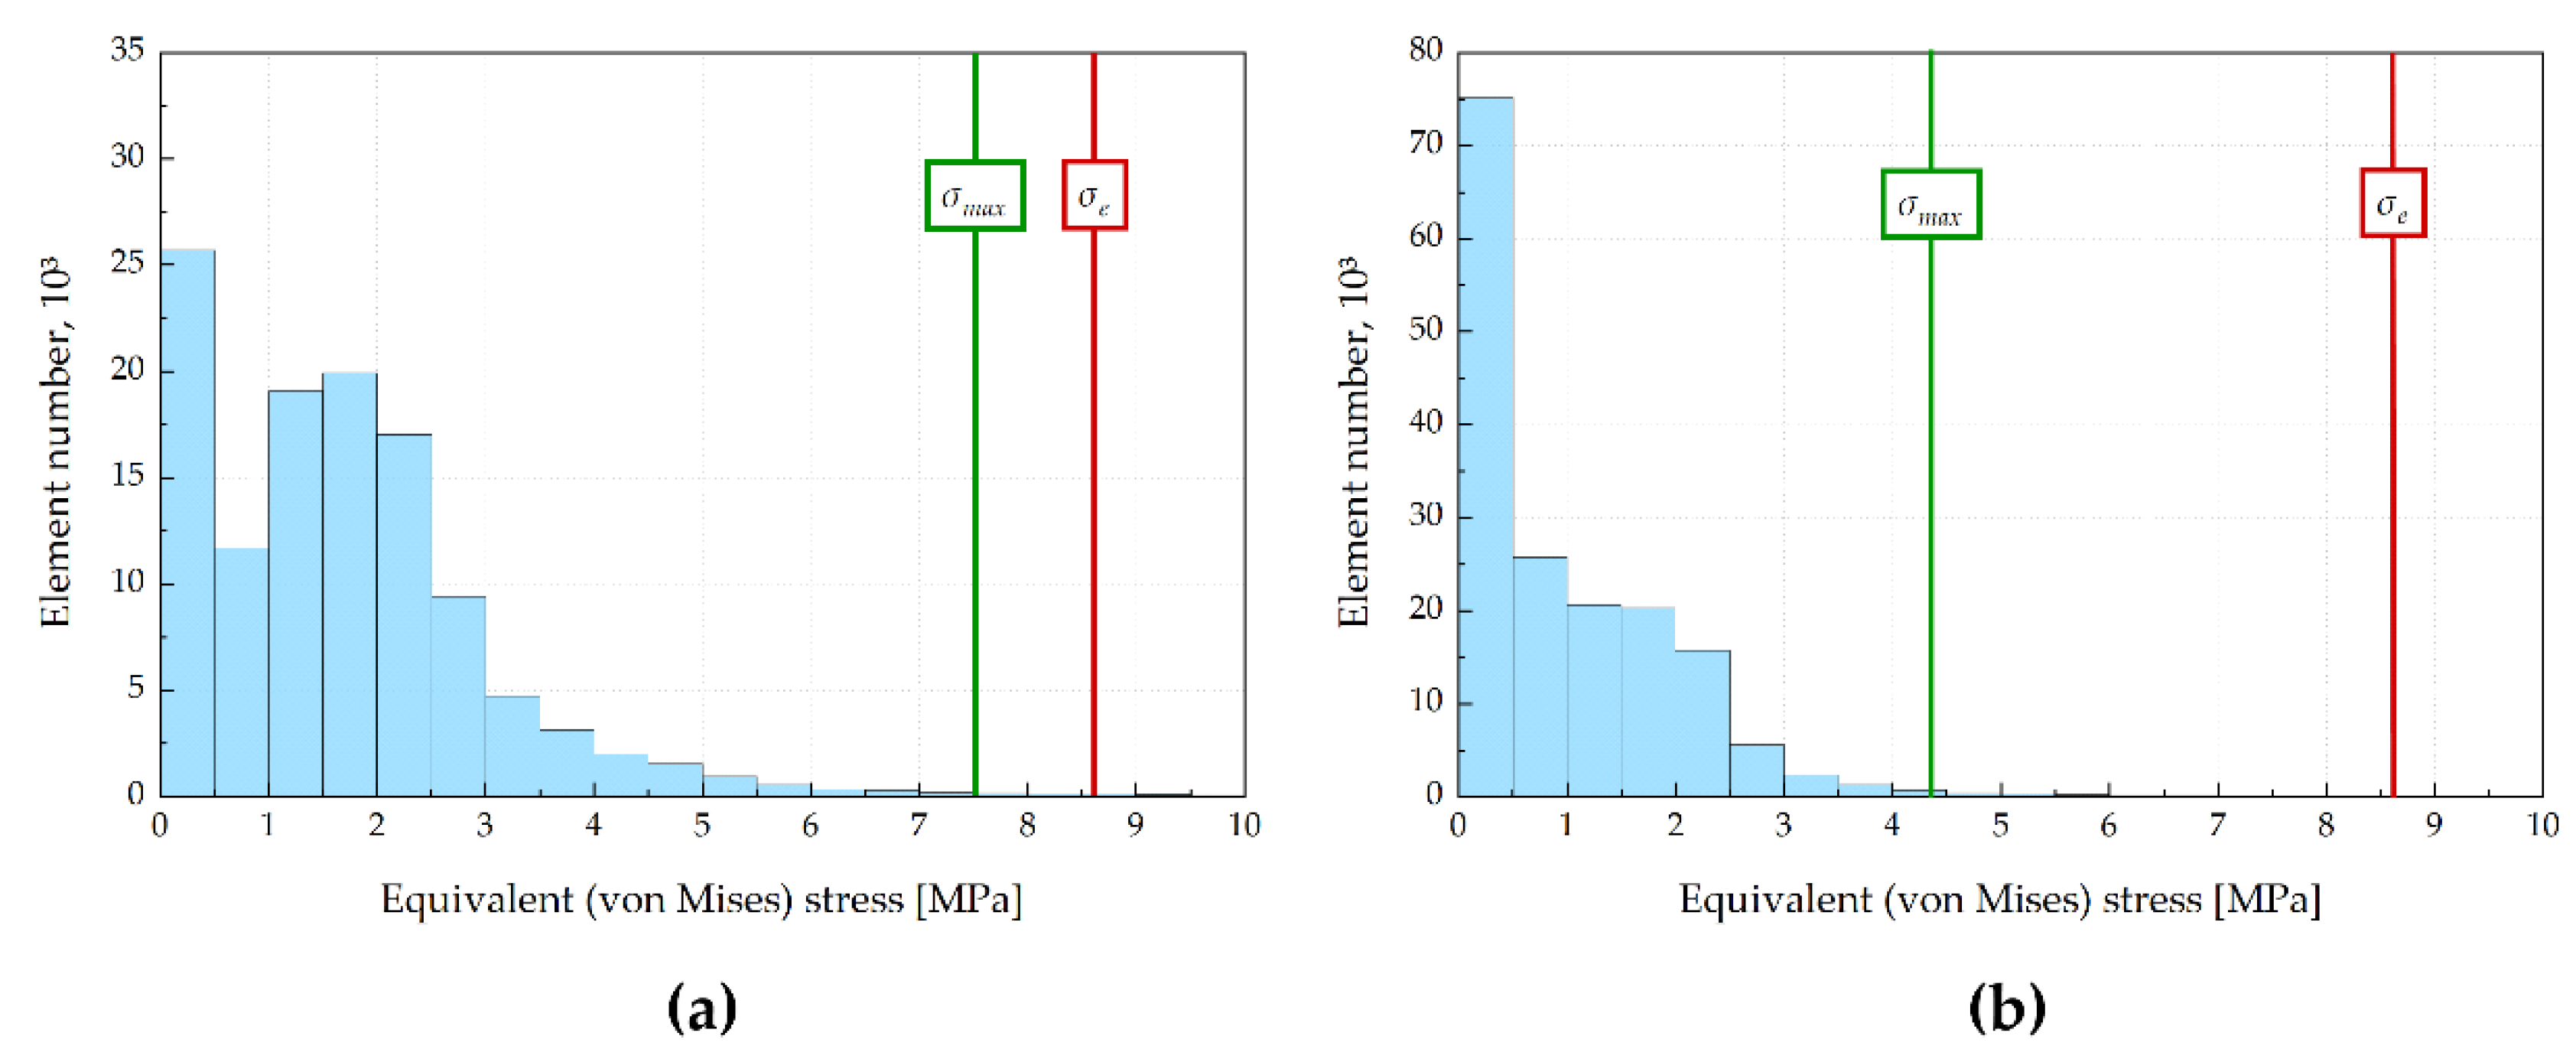
Figure 8.
Calculated (a) metatarsal-segment inclination angle in the tibial coordinate system; (b) toe-segment inclination angle in the metatarsal coordinate system.
Figure 8.
Calculated (a) metatarsal-segment inclination angle in the tibial coordinate system; (b) toe-segment inclination angle in the metatarsal coordinate system.
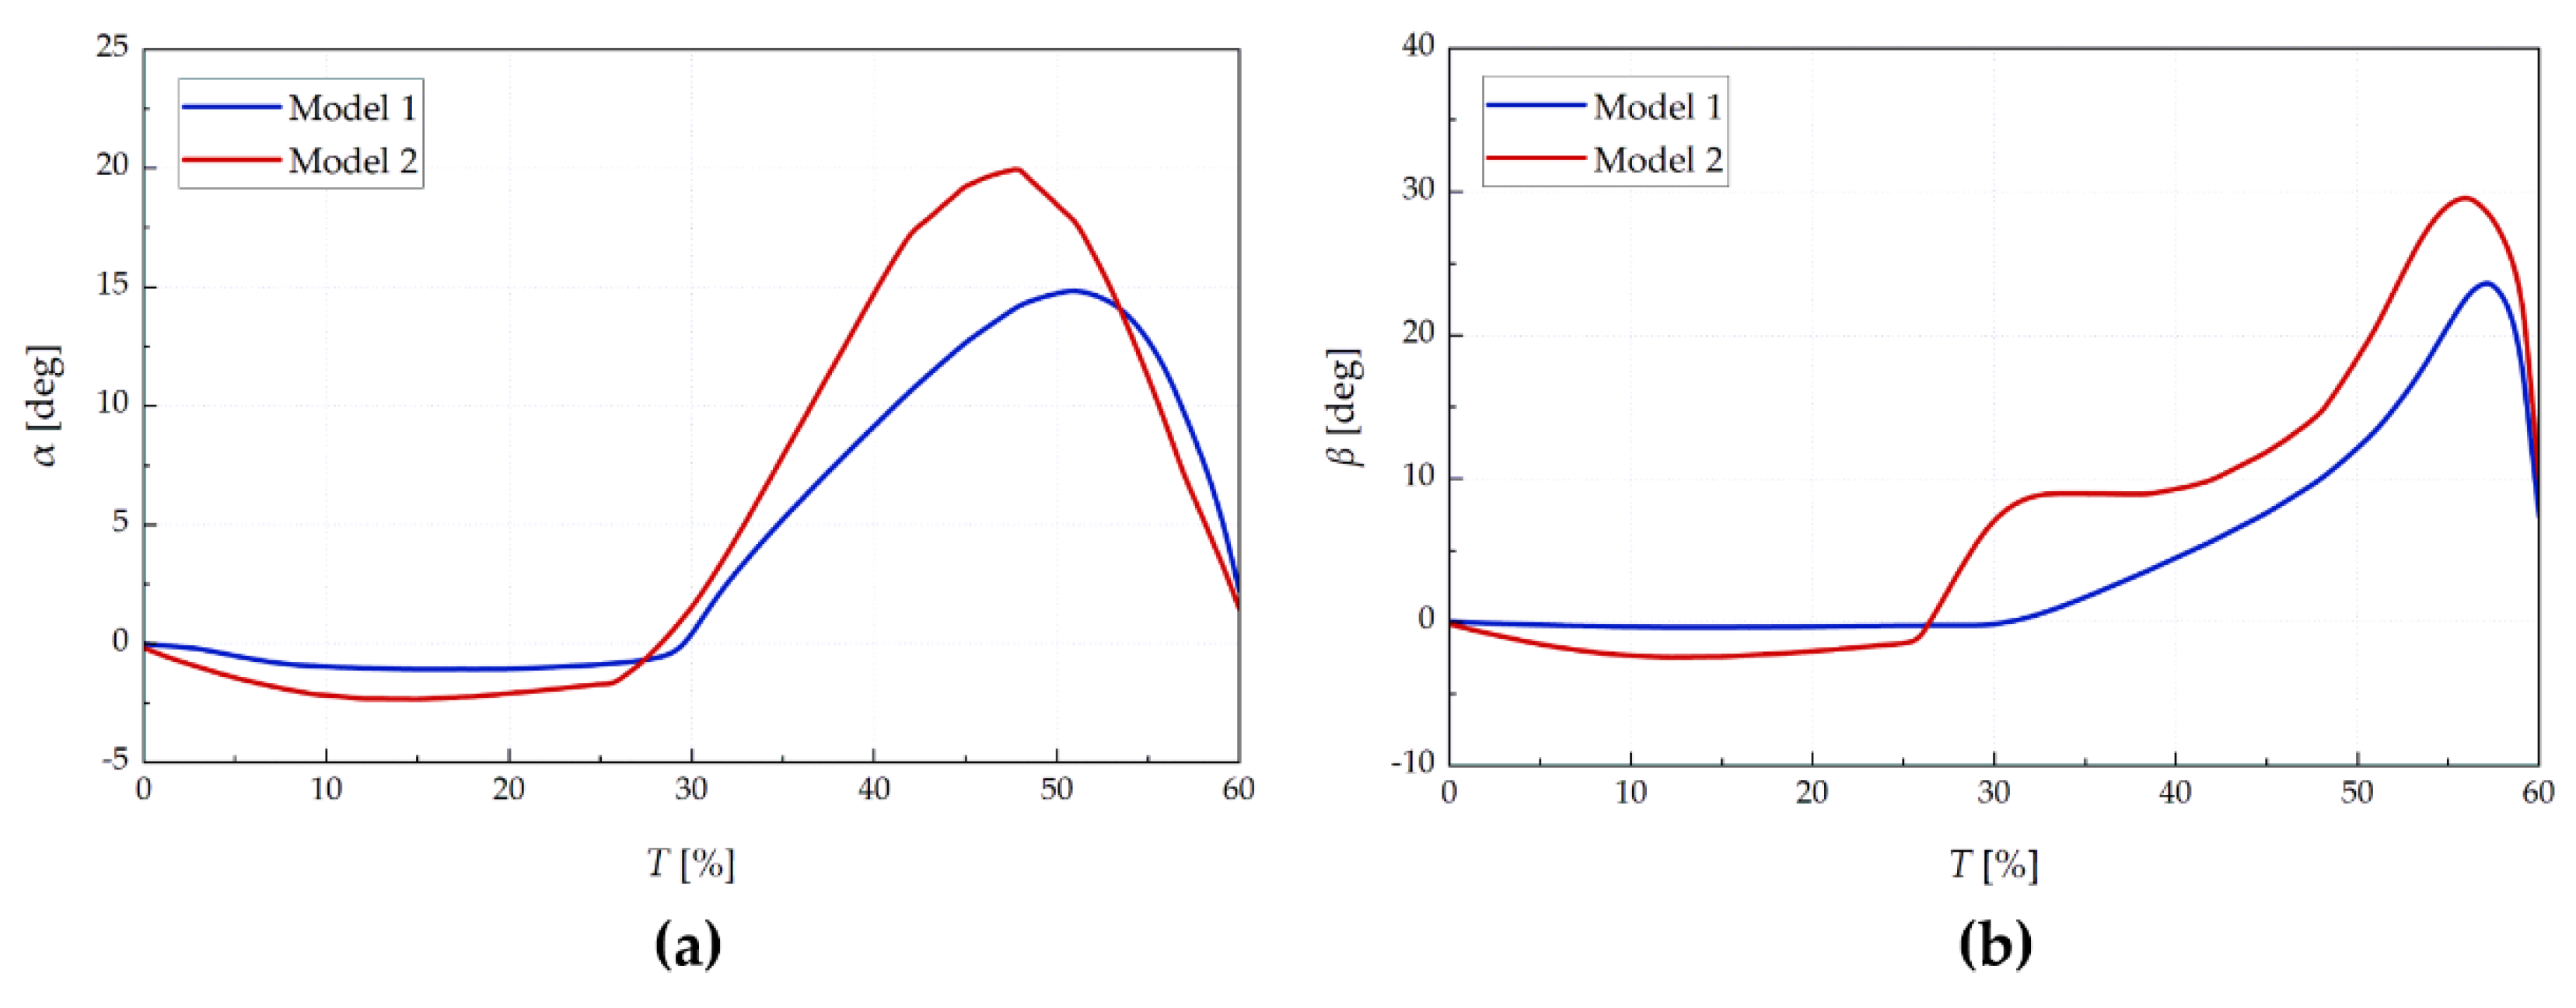
Figure 9.
dz(T) curves for the distal heel-point displacement during the early stance phase.
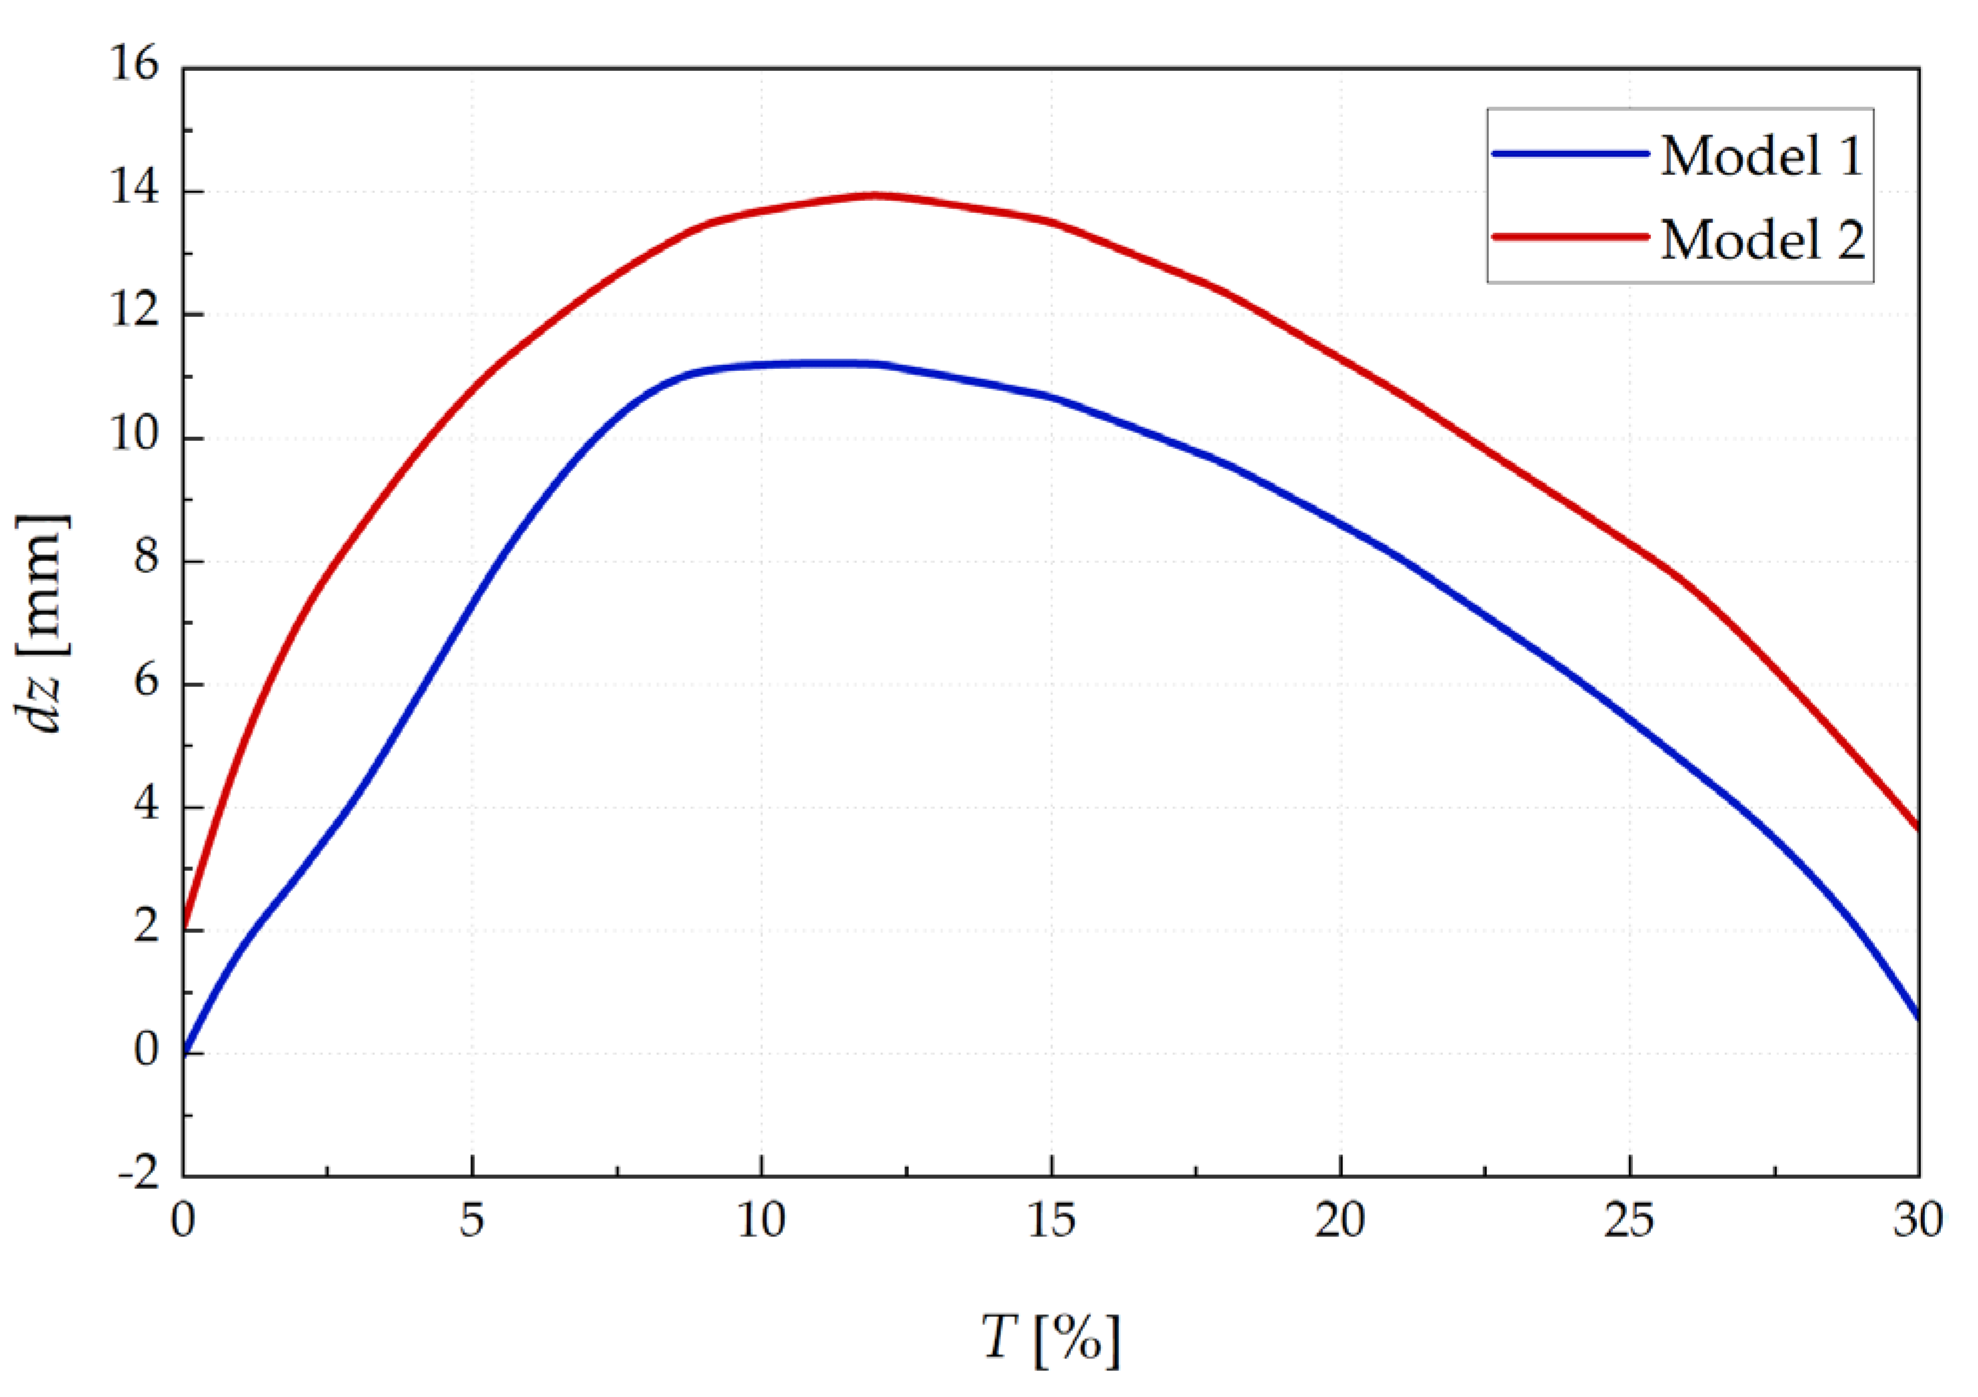
Figure 10.
Experimental measured displacements from initial contact to the load levels corresponding to the selected angle–force pairs.
Figure 10.
Experimental measured displacements from initial contact to the load levels corresponding to the selected angle–force pairs.
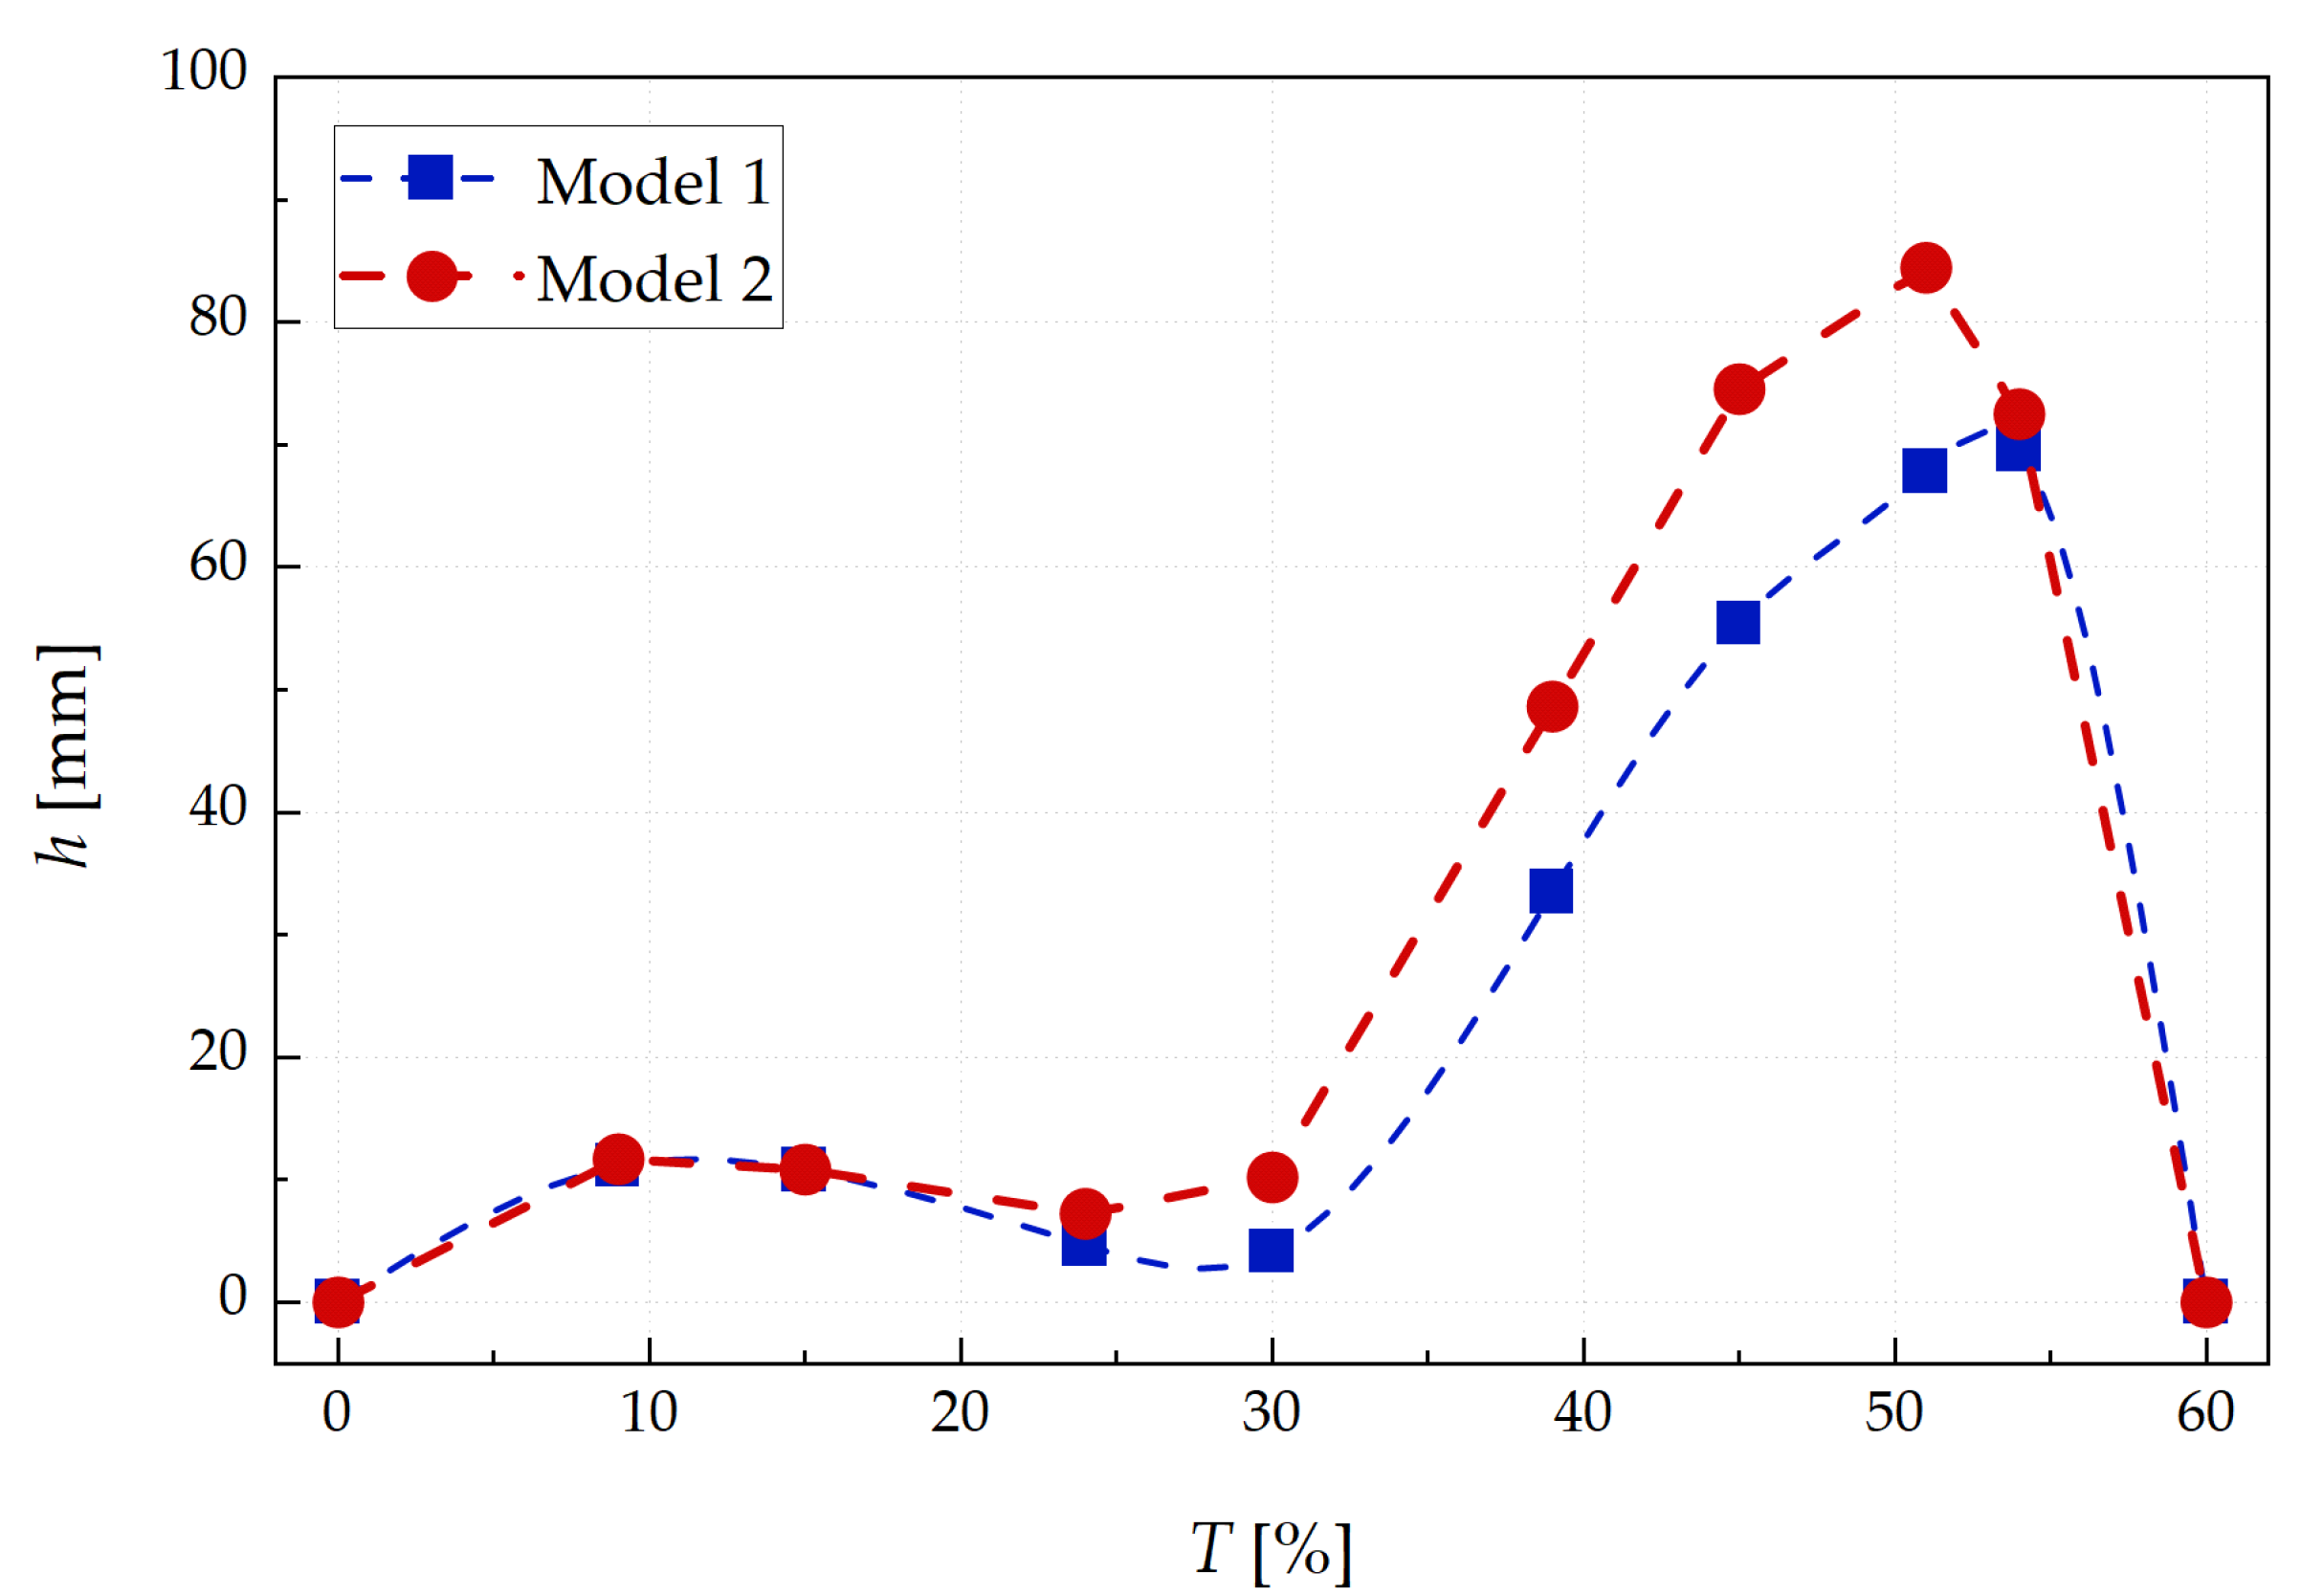
Figure 11.
Comparison of numerical and experimental results for: (a) metatarsal-segment inclination angle in the tibial coordinate system; (b) toe-segment inclination angle in the metatarsal coordinate system; (c) displacement of the distal heel point over 0–30% of the gait cycle.
Figure 11.
Comparison of numerical and experimental results for: (a) metatarsal-segment inclination angle in the tibial coordinate system; (b) toe-segment inclination angle in the metatarsal coordinate system; (c) displacement of the distal heel point over 0–30% of the gait cycle.
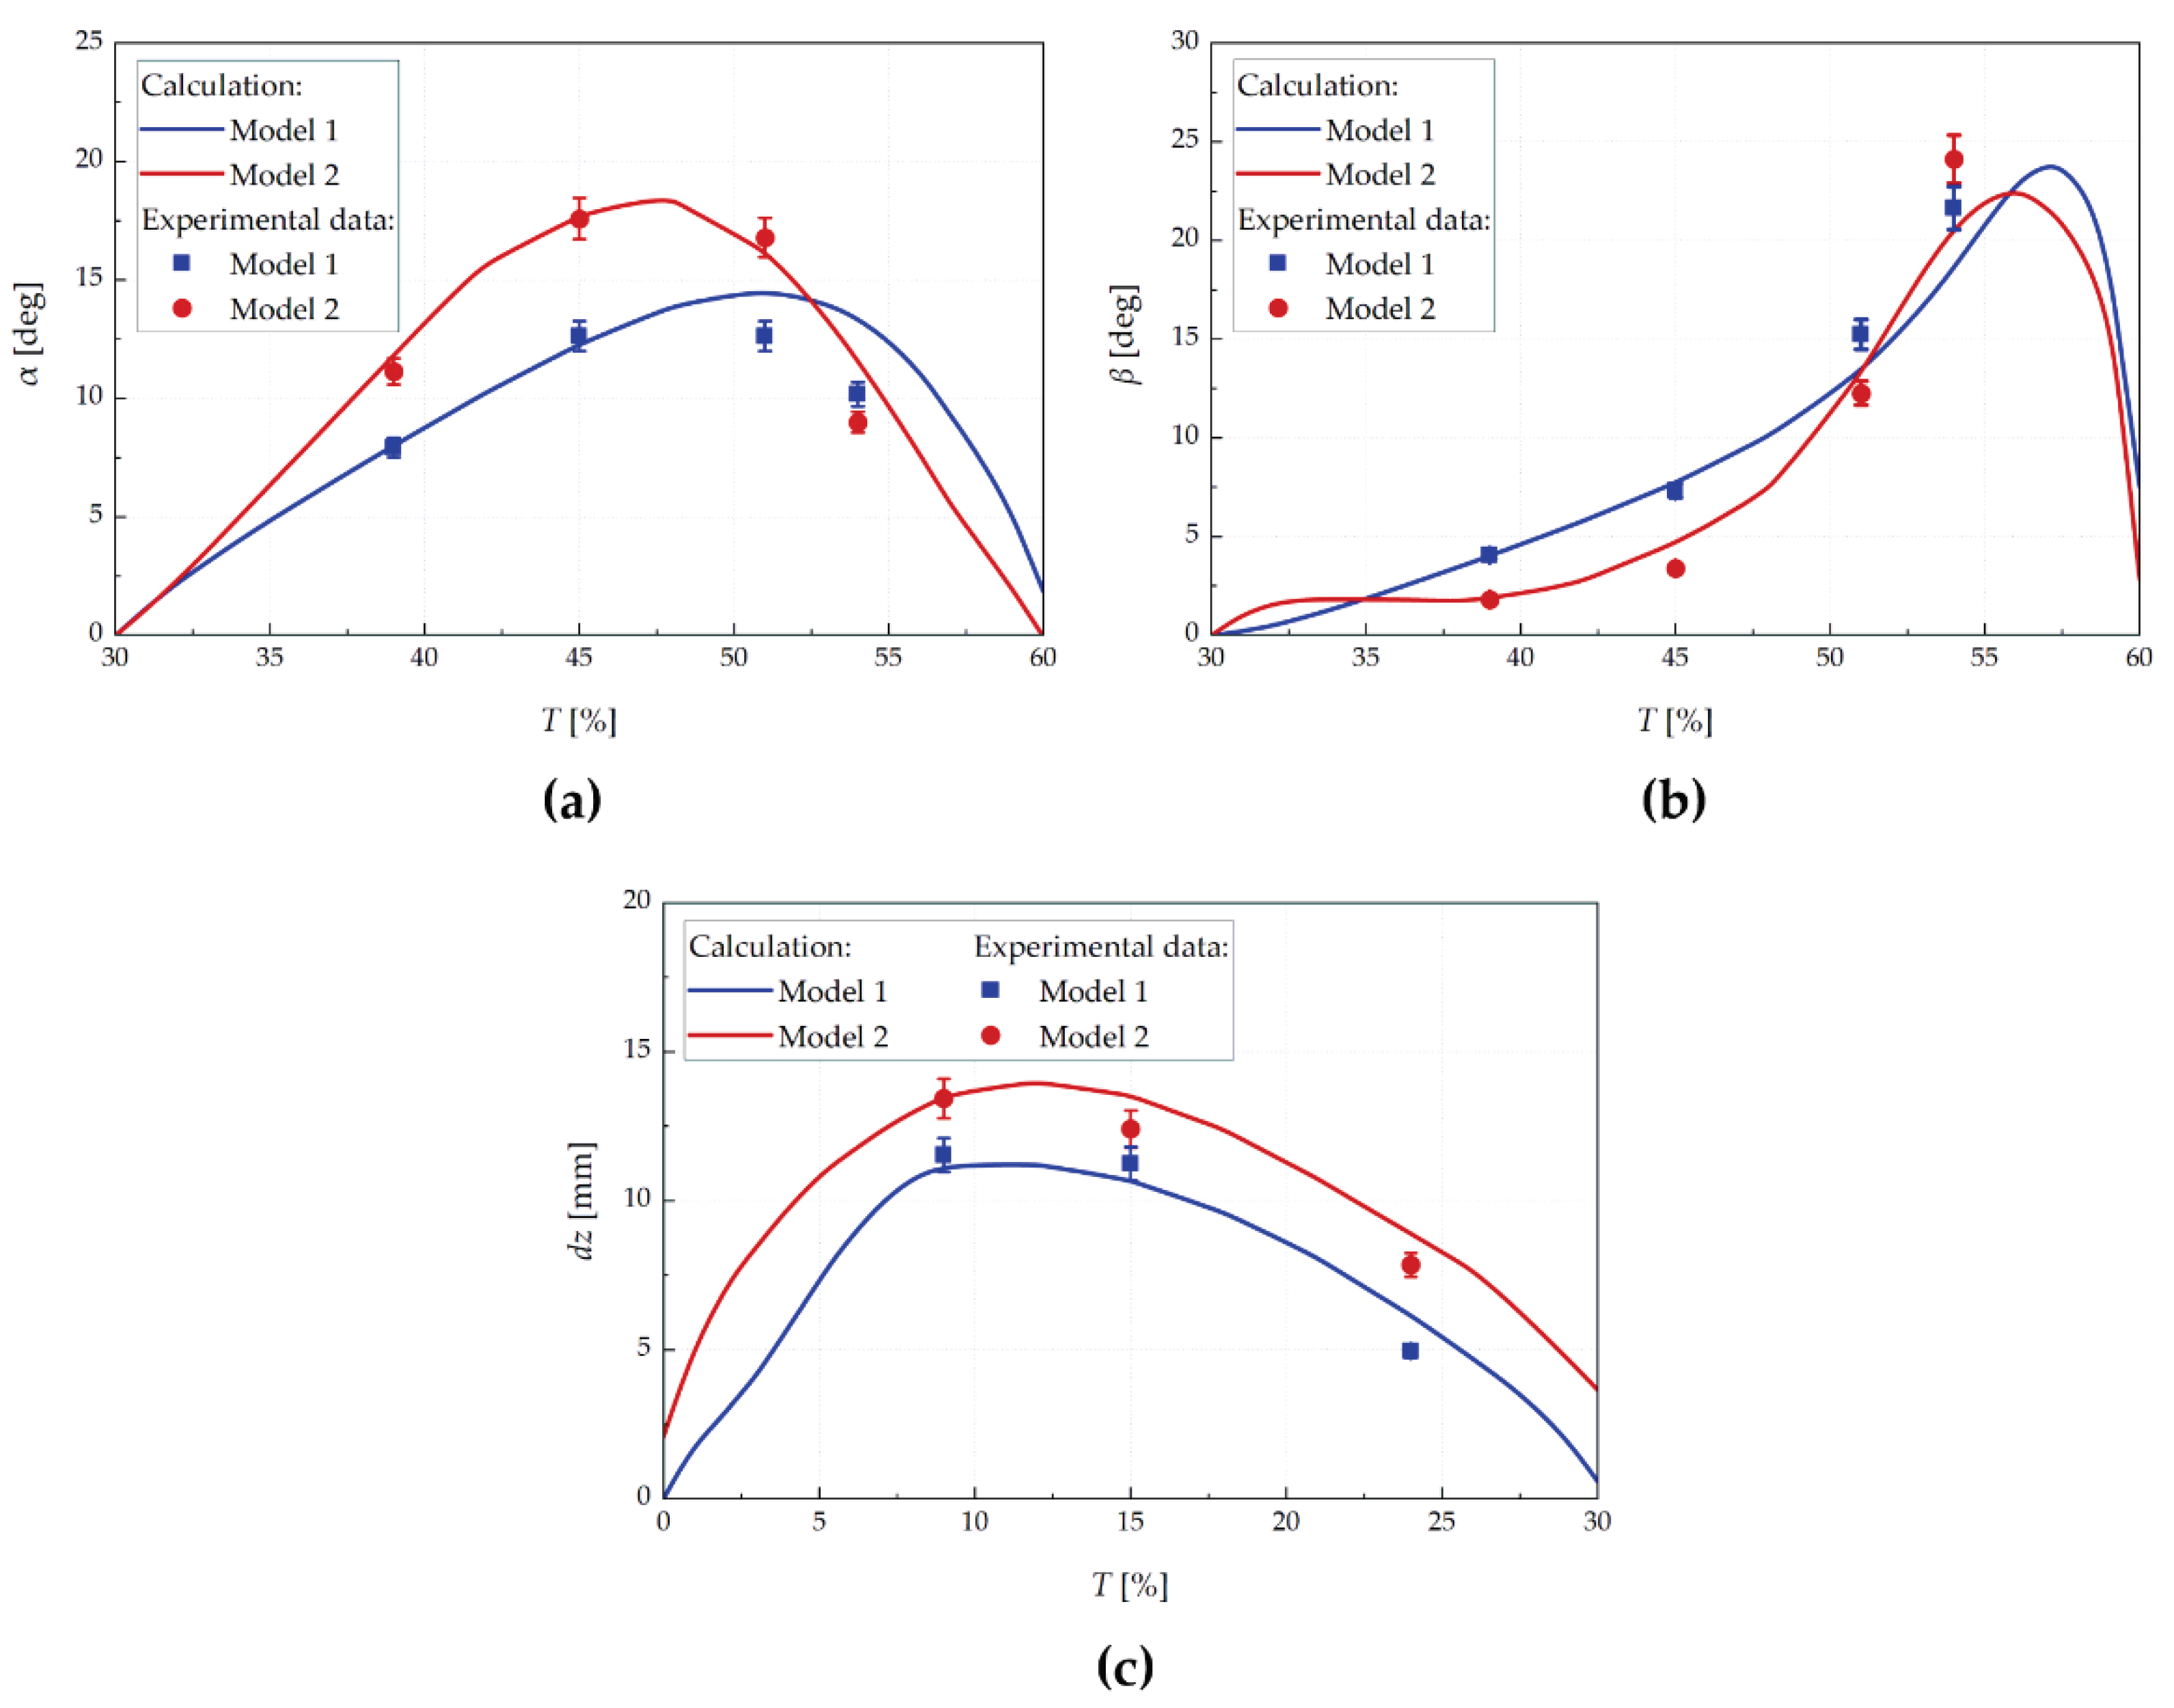
Figure 12.
Hip, knee, and ankle flexion angles of the transtibial amputee during walking with different prosthetic feet: (a) prosthetic (amputated) limb; (b) intact limb.
Figure 12.
Hip, knee, and ankle flexion angles of the transtibial amputee during walking with different prosthetic feet: (a) prosthetic (amputated) limb; (b) intact limb.
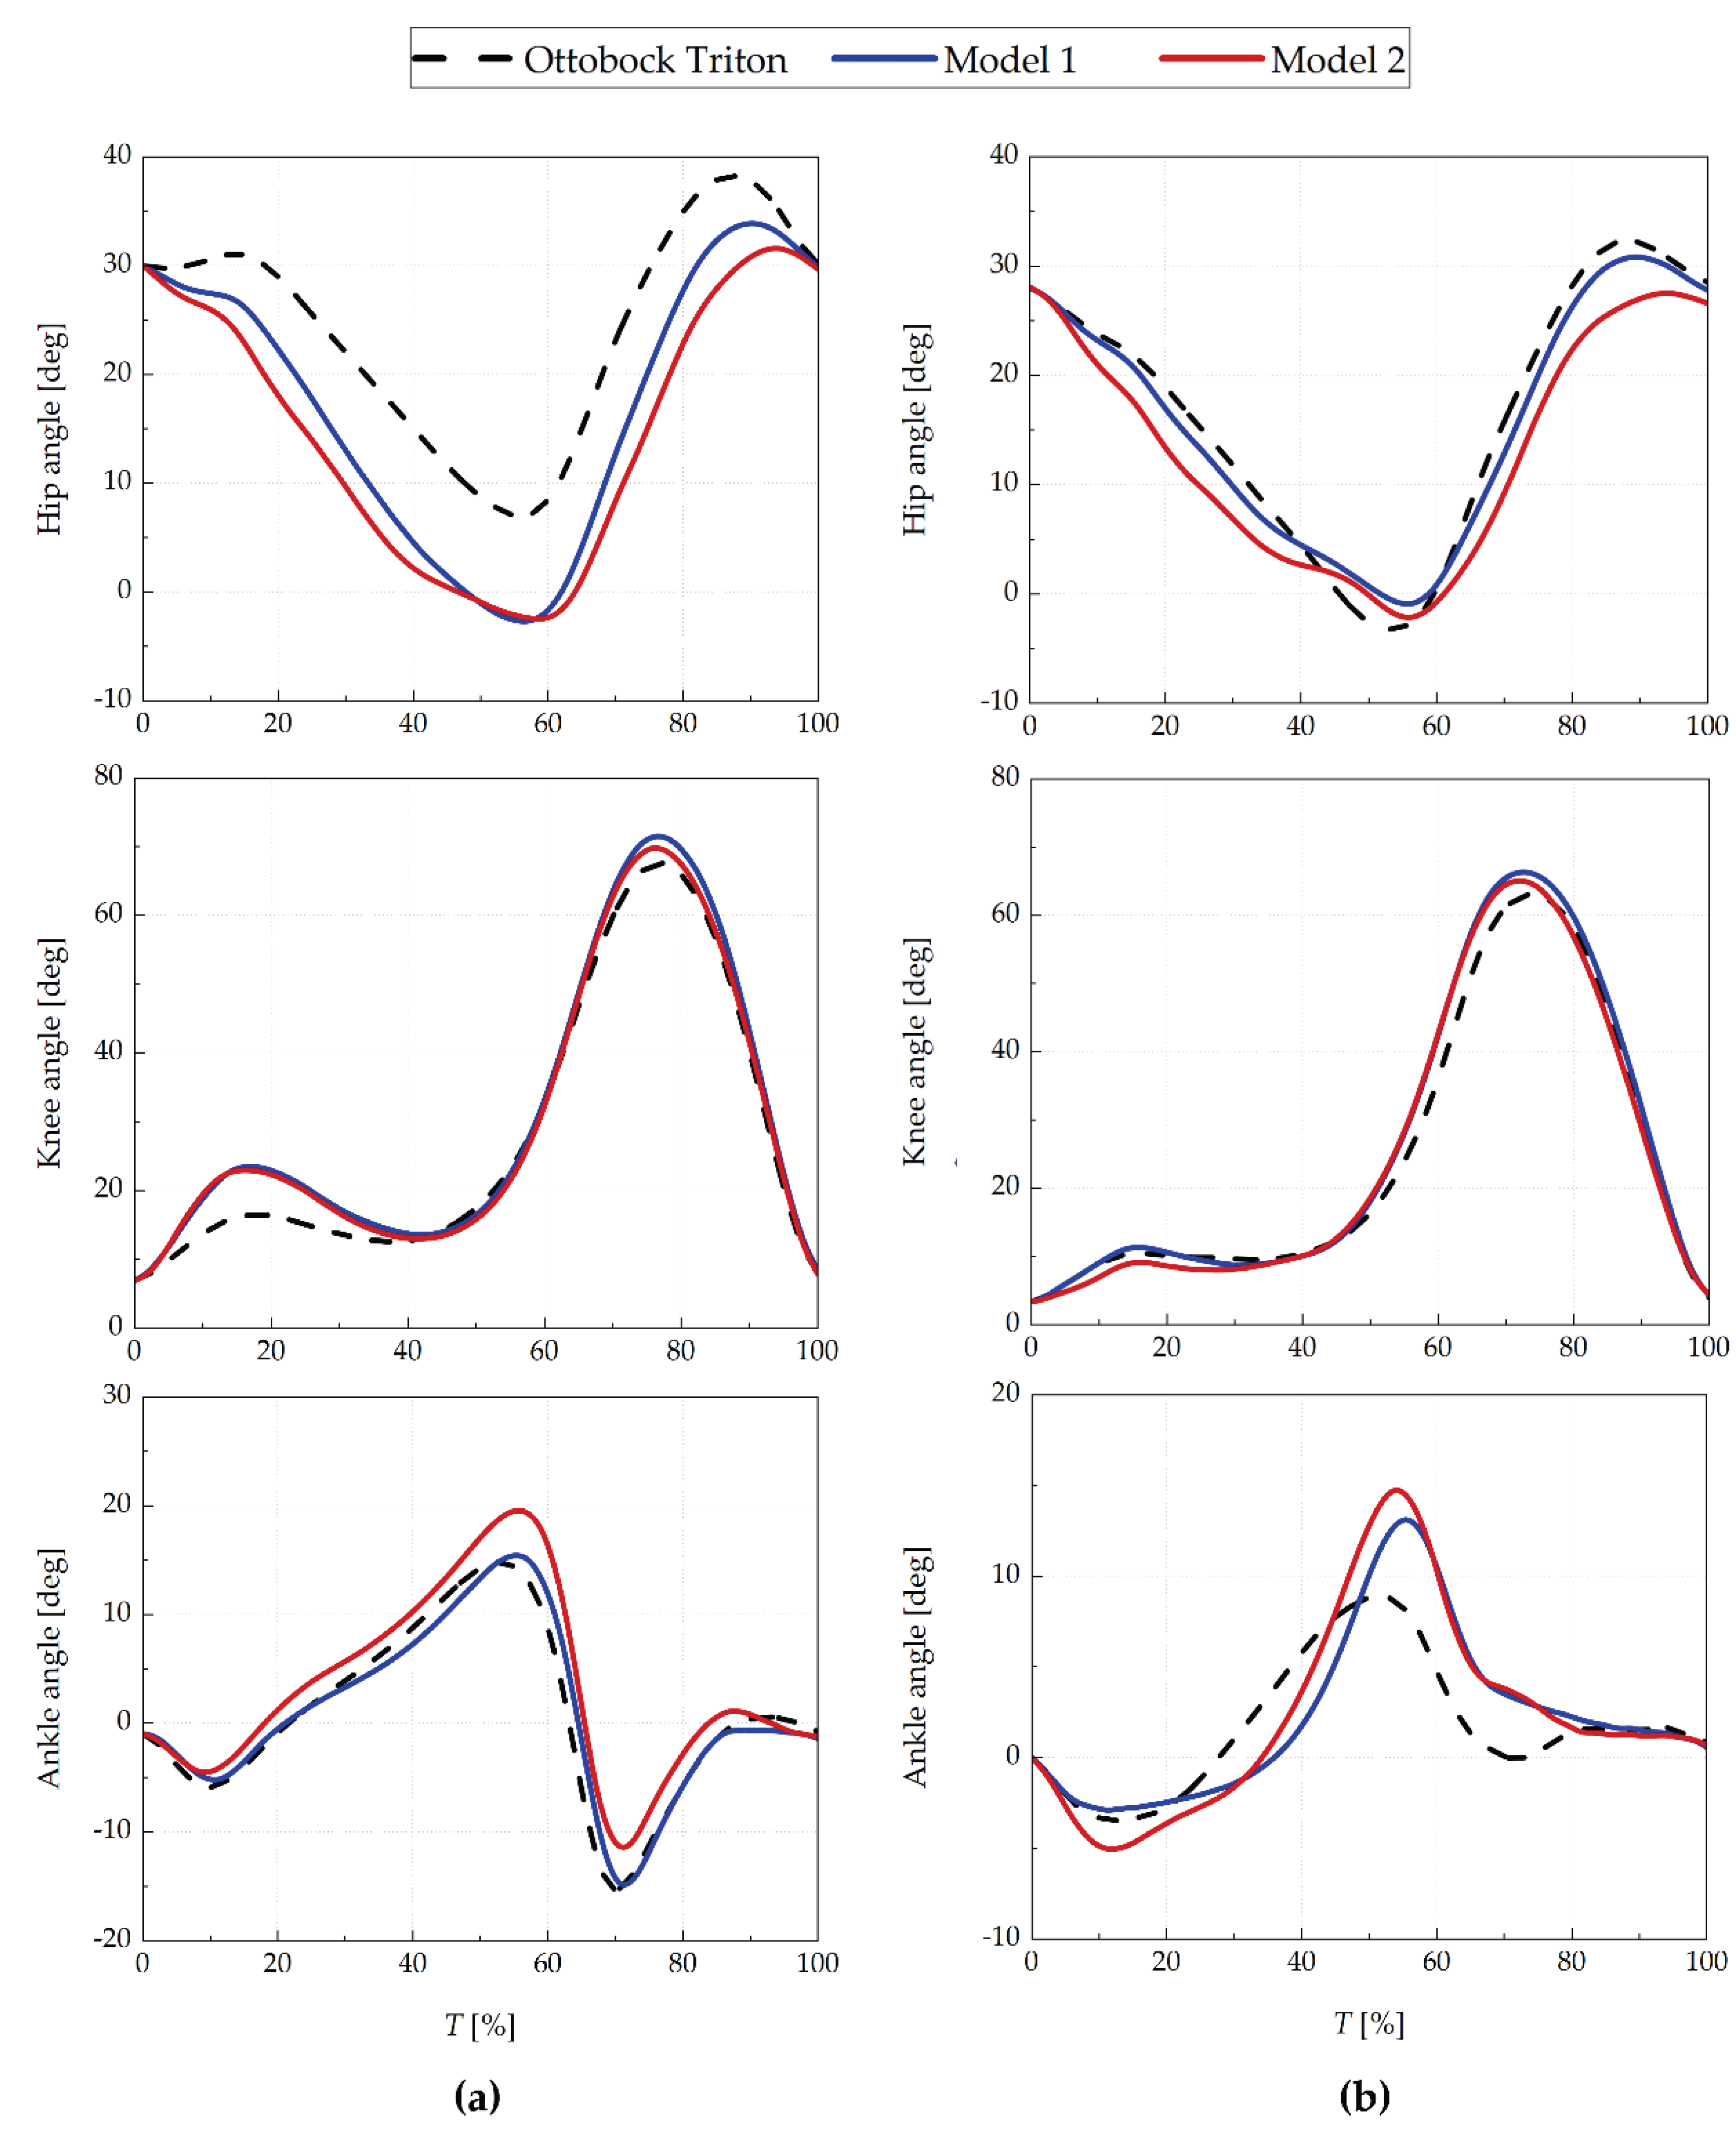
Figure 13.
Coordinates of the extreme values of the vertical center-of-mass (CoM) position: (a) minima; (b) maxima.
Figure 13.
Coordinates of the extreme values of the vertical center-of-mass (CoM) position: (a) minima; (b) maxima.
Disclaimer/Publisher’s Note: The statements, opinions and data contained in all publications are solely those of the individual author(s) and contributor(s) and not of MDPI and/or the editor(s). MDPI and/or the editor(s) disclaim responsibility for any injury to people or property resulting from any ideas, methods, instructions or products referred to in the content. |
© 2026 by the authors. Licensee MDPI, Basel, Switzerland. This article is an open access article distributed under the terms and conditions of the Creative Commons Attribution (CC BY) license.
Copyright: This open access article is published under a Creative Commons CC BY 4.0 license, which permit the free download, distribution, and reuse, provided that the author and preprint are cited in any reuse.


